Reading view

Why is WLFI Price Down Today: $75M Move Sparks Sell-Off Fears

WLFI Price In Trouble as Whale Activity Spikes Is More Downside Ahead

The post Why is WLFI Price Down Today: $75M Move Sparks Sell-Off Fears appeared first on Coinpedia Fintech News

World Liberty Financial (WLFI) token is under intense selling pressure, dropping over 12% in the past 24 hours and triggering panic across the market. The decline comes despite a relatively stable broader crypto environment, pointing to project-specific risks driving the move.

The sell-off accelerated after revelations that the project used its own token as collateral to secure a $75 million stablecoin position, raising immediate concerns over liquidation risk, liquidity strain, and structural stability. With WLFI price breaking below key levels and sentiment deteriorating rapidly, traders are now shifting into defensive mode, questioning the sustainability of the current setup.

What’s Driving WLFI Price Sell-Off?

WLFI’s sharp decline is being driven by a combination of leveraged positioning and weakening market confidence. The key trigger is the project’s move to borrow around $75 million using its own token as collateral, a structure that exposes the market to liquidation risks if price continues to fall. This has been perceived as an aggressive strategy, particularly in a low-liquidity environment.

🚨 CRYPTO: WORLD LIBERTY FINANCIAL BORROWED $75M AGAINST ITS OWN TOKEN ON INSIDER-ADVISED PROTOCOL

On-chain data reviewed by CoinDesk shows World Liberty Financial deposited 5 billion $WLFI tokens as collateral on DeFi lending protocol Dolomite to borrow $75 million in… pic.twitter.com/wr9HJPHVRi

— BSCN (@BSCNews) April 9, 2026

The borrowing activity, linked to an internal ecosystem protocol, has also raised transparency concerns, adding further pressure on sentiment. At the same time, tight liquidity conditions mean the market cannot efficiently absorb large sell orders, amplifying downside moves. Adding to this, token unlock expectations are creating a potential supply overhang, prompting traders to exit early. While the team has pushed back against liquidation concerns, the market response suggests confidence has weakened, leading to a clear risk-off reaction.

Derivatives Signal Volume-Led Sell-Off And Long Unwinding

Derivatives data confirms that the current decline is being driven by active position unwinding rather than passive weakness. Trading volume surged nearly 79% to over $517 million, indicating a volume-led sell-off, where participants are aggressively closing positions. Meanwhile, open interest declined by around 3%, signaling that traders are exiting the market rather than opening new positions.

WLFI on-chain

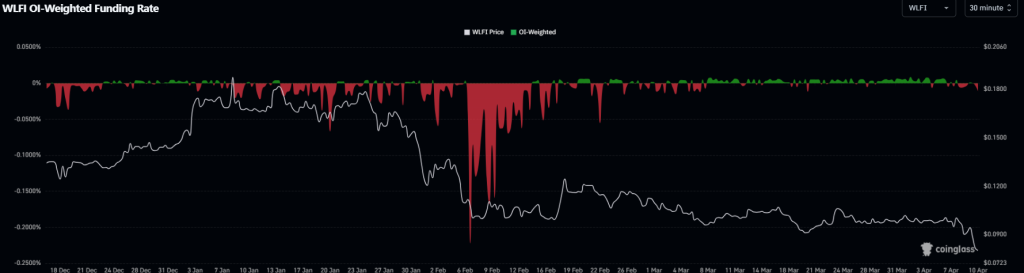
This combination points to long unwinding, where bullish traders are forced to close positions amid falling prices, further accelerating the downside. Funding conditions remain weak, reinforcing the view that bullish conviction is fading in the short term.

WLFI Price Analysis: Range Breakdown Triggers Fresh Downside Risk

WLFI’s price action has shifted decisively bearish after a clean breakdown below its multi-week consolidation range, confirming a continuation move rather than a temporary dip. The token had been trading within a tight range between $0.10 and $0.13, where repeated rejection at the upper boundary signaled weakening bullish momentum. This consolidation eventually resolved to the downside, with WLFI price losing the $0.10 support zone, a key demand level.

WLFI price chart

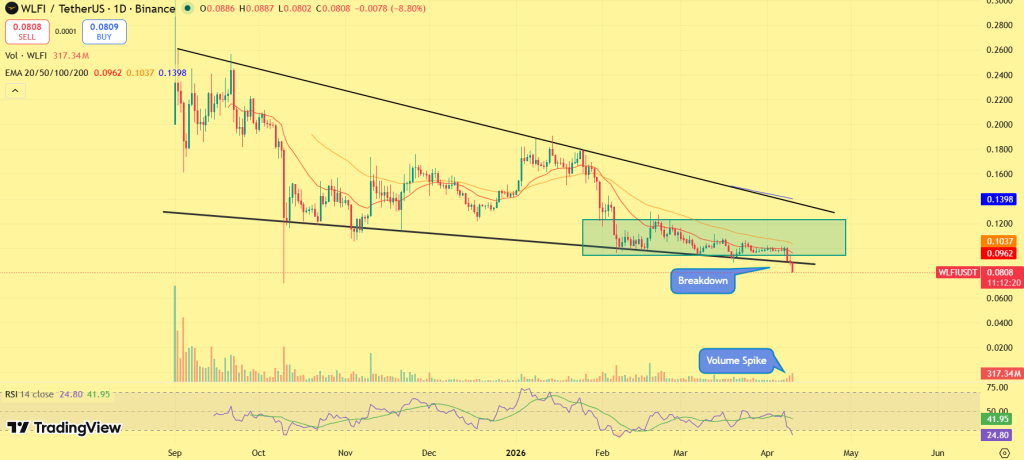
The breakdown follows a structure of lower highs, indicating sustained selling pressure and lack of strong buyer interest. Currently, WLFI is trading near the $0.08–$0.085 region, which is acting as immediate support. However, this level appears fragile given the ongoing sell pressure.

If downside momentum continues, the next key level lies near $0.07, which aligns with a historical demand zone and could act as the next liquidity target.

On the upside, any relief bounce is likely to face resistance at: $0.10 followed by  $0.12–$0.13 range high (major supply zone). The broader structure remains bearish, with price continuing to respect a descending trend, suggesting that rallies may be short-lived unless key resistance levels are reclaimed.

WLFI Price Outlook: Confidence Shock Keeps WLFI Under Pressure

WLFI’s decline reflects a broader confidence-driven sell-off, triggered by internal financial decisions rather than external market conditions. The combination of leveraged exposure, liquidity constraints, and supply concerns has created a fragile setup where downside risks remain elevated. With derivatives data pointing to continued long unwinding, the market remains defensive. Unless WLFI reclaims key levels and sentiment stabilizes, the token is likely to remain under pressure in the near term.

SUI Price About to Rip: Why Traders Are Turning Bullish Fast?

Why SUI Price is Up Today? 

The post SUI Price About to Rip: Why Traders Are Turning Bullish Fast? appeared first on Coinpedia Fintech News

SUI is beginning to show signs of a potential breakout as price stabilizes near key support, with market behavior shifting from passive consolidation to early momentum build-up. After weeks of range-bound movement, the token is no longer reacting sharply to downside pressure. Instead, it is holding structure, a signal that selling pressure is being absorbed while demand gradually returns. At the same time, rising ecosystem activity and improving sentiment are reinforcing the bullish case.

With compression tightening and positioning underway, the focus now shifts to one key question: Is SUI price about to break out of its range and trigger a larger expansion move?

On-Chain and Derivatives Data Signal Rising Demand Momentum

SUI’s on-chain data is increasingly aligning with the bullish narrative, pointing to a demand-driven setup rather than speculative price action.

The network’s Total Value Locked (TVL) has climbed above $570 million, reflecting a steady influx of capital into its DeFi ecosystem. This rise indicates growing user participation and liquidity expansion, key components that often support sustained upside moves.

SUI TVL Data

At the same time, stablecoin liquidity and bridged capital remain elevated, suggesting that fresh capital is entering the ecosystem rather than rotating out. Decentralized exchange volumes and application-level revenues also show consistent activity, reinforcing the idea that usage is not slowing.

On the derivatives side, positioning appears balanced but gradually shifting. The absence of extreme leverage suggests that the market is not overheated, while early signs of long positioning indicate that traders are beginning to anticipate a directional move.

Together, these metrics point to one conclusion: demand is building beneath the surface, supporting the case for a breakout rather than a breakdown.

SUI Price Outlook: Structure Tightens As Breakout Zone Comes Into Focus

SUI price is trading within a tightening structure, where volatility compression is becoming increasingly evident. The token has formed a stable base near $0.9200 level, with higher lows beginning to emerge, indicating that buyers are stepping in earlier on each dip. This shift suggests strengthening support and weakening bearish control.

SUI price prediction

The immediate resistance zone of $1.00 now acts as the critical breakout trigger. A decisive move above this level would confirm a structural shift and likely initiate a momentum-driven rally. On the downside, the support zone of $0.9000 remains firmly intact. As long as this level holds, the bullish structure stays valid, and the current consolidation continues to resemble accumulation rather than distribution.

The broader structure also supports a potential expansion phase. SUI appears to be repeating its historical pattern of liquidity sweeps followed by sharp upside moves, where previous cycles delivered multi-fold rallies. With price recently reclaiming support after a liquidity grab near the $0.80–$1 zone, a confirmed breakout above the key resistance band could trigger a similar expansion. If momentum sustains, this opens the door for an extended move toward the $10–$20 range, aligning with past cycle behavior rather than speculative projections.

SUI price chart

Such setups typically resolve with expansion. The longer price remains compressed within this range, the stronger the eventual move tends to be.

Outlook: Breakout Setup Builds As Pressure Reaches Tipping Point

SUI is approaching a key inflection point where structure, sentiment, and on-chain growth are beginning to align. With selling pressure absorbed, demand increasing, and traders positioning ahead of a move, the setup is leaning toward a breakout scenario. However, confirmation remains essential. A successful breakout above the resistance zone of $1 could trigger a strong expansion phase, while failure to hold support would extend consolidation ahead.

Monero Price Outlook: XMR Tests Key Zone as Breakout Setup Strengthens

Monero Price Rebounds at Channel Support Is XMR Headed Back Toward $500

The post Monero Price Outlook: XMR Tests Key Zone as Breakout Setup Strengthens appeared first on Coinpedia Fintech News

Monero (XMR) is approaching a critical breakout moment as months of tight consolidation begin to show signs of exhaustion, with the price holding firm despite repeated downside pressure.

While the broader market remains stable, the token price structure tells a different story, selling pressure has been absorbed, and accumulation is building beneath the range, setting up a potential expansion move. The key question now is clear: Is Monero price about to break out of its range, or will this compression lead to another failed move?

Wyckoff Structure Signals Accumulation Phase Nearing Completion

The current price structure closely aligns with a Wyckoff accumulation model, where the market transitions from a downtrend into a base-building phase before expansion. After a sharp correction, XMR entered a prolonged range where repeated tests of support failed to produce breakdowns. This behavior reflects absorption of supply, where sellers are gradually exhausted while buyers accumulate positions.

Monero price chart

More importantly, price is no longer reacting aggressively to downside attempts, indicating a shift in market control. The structure now suggests that XMR is moving toward the later stages of accumulation, where a breakout attempt typically follows. Such setups rarely resolve sideways for long, once the range is broken, the move is often impulsive and momentum-driven.

On-Chain And Derivatives Data Show Early Demand Shift

On-chain data supports the accumulation narrative, with development activity remaining stable despite prolonged price consolidation. This indicates that network fundamentals remain intact, even as price action appears muted.

Monero on-chain

At the same time, derivatives positioning reflects a shift in sentiment. The long/short ratio is stabilizing near neutral levels, suggesting that excessive bearish positioning has been flushed out. Gradually, sentiment is beginning to tilt toward the long side, indicating early bullish positioning by market participants.

XMR on-chain

This combination, steady fundamentals and improving derivatives sentiment, signals that XMR is transitioning from a passive range into a pre-expansion phase.

Key Levels To Watch: Breakout zone and downside risk defined

XMR price has confirmed a trendline breakout and displayed signs of accumulation. XMR price has started to form higher high swings and has stabilized above the key EMAs. Alongside the broader market recovery, Monero coin has gained significant bullish momentum and jumped over 10% this week.

Monero Price prediction

In case of further upward momentum, XMR price may retest the supply zone of $380-$400 in the near sessions. While, if breakout setup fails, the coin may retest the support zone of $330-$300 zone ahead.

Outlook: Breakout Pressure Builds As Structure Matures

XMR is now approaching a point where time and structure converge. With selling pressure absorbed, accumulation structure maturing, and early signs of demand returning, the setup is increasingly leaning toward a breakout scenario. However, confirmation remains essential. A successful breakout would likely trigger a momentum-driven expansion phase, while failure to hold support would extend the consolidation.

PancakeSwap (CAKE) Price Prediction 2026, 2027-2030: Long-Term Forecast and Market Analysis

PancakeSwap (CAKE) Price Prediction

The post PancakeSwap (CAKE) Price Prediction 2026, 2027-2030: Long-Term Forecast and Market Analysis appeared first on Coinpedia Fintech News

Story Highlights

  • The live price of CAKE token is  $ 1.49019323.
  • Price predictions for 2026 range from $1.00 to $15.00.
  • PancakeSwap (CAKE) could extend toward $80.00 by 2030, if bullish structure is maintained.

PancakeSwap (CAKE), one of the most active decentralized exchange tokens on the BNB Chain, continues to play a central role in DeFi liquidity and on-chain trading activity. With consistent protocol upgrades and sustained ecosystem usage, the project remains fundamentally relevant despite increased competition across the DEX landscape. However, price action has yet to fully reflect this strength. After a prolonged downtrend, CAKE is now showing early signs of stabilization, with selling pressure easing and price beginning to consolidate within a tight range. 

This shift suggests that the market may be transitioning from capitulation into a potential base-building phase. The key question now is whether this stabilization can translate into a breakout. If momentum builds from current levels, CAKE could be setting up for a broader recovery cycle. With 2026 underway, can PancakeSwap reclaim higher levels and push toward its next major targets? Here’s a closer look at its April outlook and full-year trajectory.

PancakeSwap Price Today

Cryptocurrency PancakeSwap
Token CAKE
Price $1.4902 up 1.37%
Market Cap$ 489,652,788.26
24h Volume$ 27,561,360.9810
Circulating Supply328,583,420.9180
Total Supply341,097,948.4718
All-Time High$ 44.1823 on 30 April 2021
All-Time Low$ 0.0002 on 29 September 2020

PancakeSwap (CAKE) Price Prediction for April 2026 

CAKE begins April within a compressed range, where volatility has declined and price is holding steady above its recent lows. This type of structure often precedes a directional move, as liquidity builds on both sides.

The current range is defined by support near $1.30–$1.40, while upside remains capped near the $1.80–$2.00 zone. This creates a tightening band, indicating that the market is preparing for expansion. A breakout above $2.00 would be the first sign of strength returning, allowing price to move into a higher range. If this breakout confirms, CAKE in April could advance toward the $2.80–$4.00 range, driven by renewed momentum and short-term positioning. However, if price fails to break above resistance, CAKE may continue to trade sideways, extending its consolidation phase.

CoinPedia’s PancakeSwap  Price Prediction 2026

Looking ahead, CAKE’s 2026 outlook depends on whether the current consolidation evolves into a sustained recovery trend. The coin has already completed a significant correction phase, and is now attempting to stabilize near its lower range. This stage typically represents accumulation, where market participants begin rebuilding positions ahead of a potential breakout.

CAKE price prediction

For a broader recovery to unfold, CAKE must reclaim key levels in sequence. The first shift occurs above $2.00–$3.00, followed by stronger expansion zones near $4 and beyond. These levels act as structural checkpoints for momentum to build. Once these zones are cleared, price behavior typically transitions into a higher trend environment, where upside accelerates.

Under a confirmed recovery scenario, CAKE could move toward the $4–$15 range in 2026, reflecting a full transition from consolidation into expansion. However, until this shift is confirmed, CAKE may continue to move within its base, delaying the breakout timeline.

PancakeSwap Crypto Price Prediction 2026 – 2030

YearPotential Low ($)Potential Average ($Potential High ($)
20264.0012.0018.00
202711.0020.0030.00
202822.0038.0052.00
202945.0065.0075.00
203058.0070.0085.00

PancakeSwap (CAKE) Price Prediction 2026

In 2026, PancakeSwap price could project a low price of $4.00, an average price of $12.00, and a high of $18.00

PancakeSwap Price Prediction 2027

As per the PancakeSwap price Prediction 2027, PancakeSwap  may see a potential low price of $11.00, The potential high for PancakeSwap  price in 2027 is estimated to reach $30.00

CAKE Price Prediction 2028

In 2028, PancakeSwap price is forecasted to potentially reach a low price of $22.00 and a high price of $52.00

PancakeSwap (CAKE) Price Forecast 2026

Thereafter, the PancakeSwap (CAKE) price for the year 2029 could range between $45.00, and $75.00

PancakeSwap (CAKE) Price Prediction 2030

Finally, in 2030, the price of PancakeSwap is predicted to maintain a steady positive. It may trade between $58.00 and $85.00

PancakeSwap Price Prediction 2031, 2032, 2033, 2040, 2050

The long-term projection assumes PancakeSwap sustains relevance in enterprise blockchain use cases, with growth moderating over time as the asset matures.

YearPotential Low ($)Potential Average ($)Potential High ($)
203170.0095.00120.00
203292.00130.00180.00
2033130.00180.00240.00
2040520.00650.00880.00
2050800.001500.002800.00

PancakeSwap (CAKE) Price Prediction: Market Analysis?

Year202620272030
Changelly$15.00$22.00$48.00
CoinCodex$18.00$28.00$45.00
WalletInvestor$11.00$30.00$55.00
Never Miss a Beat in the Crypto World!

Stay ahead with breaking news, expert analysis, and real-time updates on the latest trends in Bitcoin, altcoins, DeFi, NFTs, and more.

FAQs

What is PancakeSwap (CAKE) price prediction for 2026?

CAKE could trade between $4 and $18 in 2026 if DeFi activity strengthens and PancakeSwap continues attracting liquidity and trading volume.

What is PancakeSwap price prediction 2030?

A move toward $85 by 2030 is possible if decentralized trading grows, DeFi adoption expands, and PancakeSwap maintains its role in the BNB Chain ecosystem.

How high can PancakeSwap price go by 2040?

Long-term projections suggest CAKE could potentially reach around $650 on average and up to $880 by 2040 if DeFi adoption expands and market conditions remain favorable.

Is PancakeSwap (CAKE) a good long-term investment?

CAKE shows structural rebuilding and active usage, making it a viable long-term DeFi play if support levels hold and adoption grows.

How does DeFi growth affect CAKE price?

Rising DeFi adoption increases CAKE usage, liquidity, and fees, potentially driving higher prices over time.

Should investors buy PancakeSwap (CAKE) now?

CAKE shows structural recovery and multi-chain usage, making it a potential long-term investment if key supports hold.

JasmyCoin Price Prediction 2026, 2027 – 2030: Is JASMY a Good Long-Term Investment?

JasmyCoin Price Prediction

The post JasmyCoin Price Prediction 2026, 2027 – 2030: Is JASMY a Good Long-Term Investment? appeared first on Coinpedia Fintech News

Story Highlights

  • The live price of the Jasmy token is  $ 0.00533152.
  • If the descending structure breaks, JASMY could gradually climb toward the $0.0500 region by the end of 2026.
  • In a stronger adoption cycle, JasmyCoin could extend its rally toward $0.26

JasmyCoin (JASMY), a key player in the decentralized data and IoT infrastructure space, is currently navigating a phase where strong long-term utility contrasts with persistent price weakness. While the project continues to build within the data sovereignty narrative, its market structure remains under pressure following an extended downtrend.

JASMY is now hovering near a critical demand zone, indicating that selling pressure may be approaching exhaustion. However, the absence of strong upside continuation suggests that the market is still in a transitional phase rather than a confirmed recovery.

This raises a key question: is JASMY forming a base for the next cycle, or is the downtrend still structurally intact? With 2026 already underway, focus now shifts to whether price can reclaim key resistance levels and initiate a recovery phase. So, let’s dive into Coinpedia’s JasmyCoin (JASMY) Price Prediction 2026, 2027 – 2030.

JasmyCoin Price Today

Cryptocurrency JasmyCoin
Token JASMY
Price $0.0053 up 2.19%
Market Cap$ 263,617,144.45
24h Volume$ 9,240,302.5112
Circulating Supply49,444,999,677.17
Total Supply50,000,000,000.00
All-Time High$ 4.9943 on 16 February 2021
All-Time Low$ 0.0027 on 29 December 2022

JasmyCoin (JASMY) Price Prediction For April 2026 

JASMY enters April trading near a historically significant support zone, with price action compressing after a prolonged decline. The chart reflects a clear descending structure, where lower highs have consistently capped upside attempts. However, recent price behavior suggests that volatility is tightening near the base, often a precursor to a breakout move.

The immediate resistance is aligned with the descending trendline near the $0.0060–$0.0075 range. A breakout above this zone would indicate early strength returning to the market. If this breakout materializes, JASMY in April could move toward the $0.010–$0.015 range, driven by short-term momentum expansion. On the downside, failure to break resistance may keep price range-bound, with $0.0045–$0.0050 acting as the primary support zone.

CoinPedia’s JasmyCoin Price Prediction 2026

JASMY’s 2026 outlook is shaped by a transition from prolonged downside structure into early-stage base formation, where price is attempting to stabilize after an extended period of lower highs.

JASMY price prediction

The current structure suggests that downside momentum is gradually fading, with price holding near a historically significant demand zone. This phase typically precedes a shift in trend, provided key resistance levels are reclaimed. The first confirmation level lies near $0.0075, followed by a stronger structural barrier around $0.010–$0.012. A sustained move above this region would signal that the market has absorbed prior selling pressure and is transitioning into a recovery phase.

Once this shift is confirmed, the market is likely to enter an expansion cycle, where price begins forming higher highs and higher lows. Under this progression, JASMY could trade within the $0.012 to $0.050 range in 2026, reflecting a gradual recovery supported by structural breakout rather than speculative spikes. Failure to reclaim the $0.010–$0.012 zone, however, would keep the asset in consolidation and delay the broader recovery timeline.

JasmyCoin (JASMY) Price Prediction 2026 – 2030

YearPotential Low ($)Potential Average ($Potential High ($)
20260.0120.0300.050
20270.0180.0450.070
20280.0350.0800.120
20290.0700.1500.200
20300.1200.2000.260

JasmyCoin Price Prediction 2026

In 2026, JasmyCoin price could project a low price of $0.012, an average price of $0.030, and a high of $0.050.

JasmyCoin (JASMY) Price Prediction 2027

As per the JasmyCoin price Prediction 2027, JasmyCoin  may see a potential low price of $0.018, The potential high for JasmyCoin price in 2027 is estimated to reach $0.070

JasmyCoin Price Forecast 2028

In 2028, JasmyCoin price is forecasted to potentially reach a low price of $0.035, and a high price of $0.120

JasmyCoin Price Target For 2029

Thereafter, the JasmyCoin (JASMY) price for the year 2029 could range between $0.070, and $0.200

JasmyCoin (JASMY) Price Prediction 2030

Finally, in 2030, the price of JasmyCoin is predicted to maintain a steady positive. It may trade between $0.120 and $0.260.

JasmyCoin Price Prediction 2031, 2032, 2033, 2040, 2050

JasmyCoin’s long-term outlook largely depends on the growth of the decentralized data economy and IoT adoption. As industries explore secure data sharing and user-owned data models, platforms like Jasmy that focus on data sovereignty could gradually gain relevance. If the broader crypto market continues expanding alongside real-world blockchain use cases, JASMY could benefit from renewed ecosystem development and sustained market participation.

YearPotential Low ($)Potential Average ($)Potential High ($)
20310.150.250.38
20320.200.400.55
20330.250.500.70
20401.402.203.00
205014.0022.0028.00

What Does The Market Say?

Year202620272030
Changelly$0.028$0.080$0.090
CoinCodex$0.040$0.084$0.120
WalletInvestor$0.060$0.090$0.150
Never Miss a Beat in the Crypto World!

Stay ahead with breaking news, expert analysis, and real-time updates on the latest trends in Bitcoin, altcoins, DeFi, NFTs, and more.

FAQs

What is JasmyCoin (JASMY) and what does it do?

JasmyCoin is a Japan-based crypto focused on data democracy, letting users control, share, and monetize personal data from IoT devices.

Why is JasmyCoin called the “Bitcoin of Japan”?

Jasmy is called the Bitcoin of Japan due to its local roots, regulatory focus, and mission to give users ownership over digital data.

Where can I buy JasmyCoin (JASMY)?

JasmyCoin is available on major crypto exchanges like Binance, Coinbase, and KuCoin, where users can buy JASMY using USDT or fiat.

What will be the maximum trading price of JASMY by the end of 2026?

If ecosystem growth continues, JASMY’s maximum price in 2026 could reach around $0.04 under favorable market conditions.

How high may JasmyCoin (JASMY) price hit by the end of 2030?

Based on long-term projections, JasmyCoin could trade between $0.120 and $0.260 by 2030 if crypto adoption and IoT data networks continue expanding.

What is the price of JasmyCoin (JASMY) in 2040?

Some long-term models suggest JASMY could trade around $3.5–$4.7 by 2040 if blockchain data infrastructure and IoT ecosystems grow significantly.

What is JasmyCoin price prediction for 2050?

In a strong long-term adoption scenario, analysts estimate JASMY could reach roughly $4–$6 by 2050, though such forecasts remain highly speculative.

Bitcoin and XRP Price Outlook: Market Tension Builds – What’s Next for BTC and XRP?

Can XRP overtake Bitcoin

The post Bitcoin and XRP Price Outlook: Market Tension Builds – What’s Next for BTC and XRP? appeared first on Coinpedia Fintech News

Bitcoin and XRP price traded slightly lower today as rising geopolitical tension triggered a fresh wave of caution across crypto markets, with BTC price holding just above $70,000 and XRP price consolidating near $1.30. The pullback follows renewed uncertainty around the Strait of Hormuz, dragging total crypto market value closer to $2.41 trillion as risk sentiment weakens. 

Despite the pressure, both coins continue to defend key support levels, setting up a critical moment where the next move could define short-term direction.

Read the full Bitcoin and XRP price outlook below to understand what’s driving the market and where prices could head next.

Hormuz Tensions Resurface, Triggering Profit Booking

Iran’s decision to reclose the Strait of Hormuz shortly after agreeing to reopen it under a ceasefire framework has reintroduced uncertainty into global markets. The move follows continued military activity in the region, which Iran has positioned as a breach of the agreement, escalating tensions once again.

🚨Breaking …
IRAN CLOSE STRAIT OF HORMUZ AGAIN AFTER ISRAEL BREAK CEASEFIRE pic.twitter.com/ZAO8lBxHJZ

— Iran Updates🚨 (@IranUpdatesNow) April 8, 2026

This development is significant because the Strait of Hormuz is a critical global oil transit route, and any disruption raises concerns over energy supply shocks and rising inflation pressures. Such macro risks tend to weigh on risk assets, including cryptocurrencies. In response, crypto markets saw a measured pullback rather than a sharp sell-off. Traders opted to lock in recent gains, leading to profit booking across major assets like Bitcoin and XRP.

Importantly, the move does not indicate structural weakness in the market. Instead, it highlights how external macro triggers can temporarily pause bullish momentum, as participants reassess risk before committing to the next directional move.

Bitcoin Price Outlook: Structure Holds As On-Chain Signals Accumulation

Bitcoin price is currently trading within the $70,000–$71,000 range, holding firmly above a key demand zone despite recent volatility. The rejection near $72,000 has pushed price into consolidation, but the broader structure remains intact. Technically, BTC is compressing below resistance, forming a range-bound setup. A breakout above $72K could drive the next leg toward $74K–$75K, while a breakdown below $70K may expose $67K support.

BTC price outlook

Beyond price action, on-chain data provides a stronger signal. Short-term Sharpe Ratio has dropped into deeply negative territory, historically associated with high-probability accumulation zones across previous cycles. 

Bitcoin on-chain

At the same time, Buy/Sell Pressure Delta suggests that peak sell pressure has already been absorbed, with early signs of demand returning. This combination indicates that while Bitcoin is consolidating, the underlying structure is shifting toward accumulation rather than distribution, strengthening the case for a potential breakout once resistance clears.

XRP Price Outlook: Accumulation Builds As Breakout Zone Approaches

XRP is holding steady near the $1.30–$1.33 range, maintaining its structure despite broader market hesitation. Price continues to compress below the $1.40 resistance level, forming a tight range that typically precedes expansion. 

XRP price outlook

Holding above $1.30 keeps the bullish structure intact. A breakout above $1.40 could open the path toward $1.45–$1.50, while a breakdown below support would weaken the current setup.

XRP on chain data

Moreover, on-chain data reinforces the technical outlook. Recent accumulation vs distribution metrics on Binance indicate that prolonged selling pressure has eased, with net accumulation gradually turning positive. This shift suggests that market participants are beginning to build positions at current levels. The convergence of price compression and rising accumulation signals that XRP is transitioning into a base-building phase, often seen before breakout moves.

Market Outlook: Key Levels Now Decide The Next Move

The crypto market is now at a critical inflection point, shaped by the interaction between macro uncertainty and strong technical support. Bitcoin holding above $70K preserves its bullish structure, while XRP maintaining $1.30 reinforces its accumulation phase. However, both assets remain below key resistance levels, leaving the next move unresolved. If macro pressure stabilizes, the current setup favors upside continuation. If tensions escalate, consolidation may extend before a breakout attempt.

Can PEPE Price Rally on ETF Hype: Price Sits at Critical Breakout Zone

Can PEPE Price Rally on ETF Hype Price Sits at Critical Breakout Zone

The post Can PEPE Price Rally on ETF Hype: Price Sits at Critical Breakout Zone appeared first on Coinpedia Fintech News

Pepe is back on traders’ radar after Canary Capital’s ETF filing triggered a fresh wave of speculation. The development has pushed sentiment sharply higher, but price action remains locked at a critical breakout zone, where the next move could define the short-term trend.

The key question now dominating the market is clear, Can Pepe price rally on ETF hype, or is this another narrative-led spike facing resistance?

ETF Filing Expands Narrative Beyond Retail-Driven Hype

Canary Capital’s S-1 filing introduces a new dimension to Pepe’s market positioning. While approval remains uncertain, the move signals that institutional frameworks are beginning to extend beyond major assets into speculative segments like meme coins.

PEPE ETF

This shift matters because ETF narratives historically act as liquidity catalysts, often triggering early positioning ahead of actual approvals. In Pepe’s case, the filing has already translated into rising attention and increased trading activity. However, the market reaction remains forward-looking rather than confirmed. Without regulatory clearance or structural breakout, the ETF narrative continues to function as a sentiment driver, not a trend confirmation.

Pepe Price Compresses As Breakout Structure Takes Shape

On the technical front, Pepe continues to trade within a broader downtrend, but recent price behavior suggests a transition into a compression phase near key support around 0.0000031. PEPE price action has tightened, with volatility declining and candles forming within a narrow range. This type of structure typically signals imminent expansion, as liquidity builds before a decisive move.

PEPE price chart

The immediate resistance stands near 0.0000053, a level that has repeatedly capped upside attempts. A break above this zone would mark the first structural shift in favor of buyers. However, the broader trend reversal remains contingent on a move beyond 0.0000089, where higher-timeframe supply is concentrated. Until then, the structure remains neutral-to-bearish, with the market awaiting confirmation.

Outlook: Breakout Confirmation Will Decide Pepe’s Next Leg

Pepe now sits at a pivotal intersection between narrative momentum and technical resistance. The ETF filing has introduced a bullish catalyst, but price must validate that optimism. A confirmed breakout could unlock a momentum-driven rally, supported by renewed participation and liquidity inflows. Conversely, failure to reclaim resistance would reinforce the existing trend, turning the current move into another short-lived reaction. For now, Pepe remains at a critical breakout zone, where the narrative is strong, but confirmation is still pending.

Ethereum Price Action Just Flipped Bullish: Why $2400 Is Now In Play?

Ethereum Rolls Out Post-Quantum Security Plan After Years of Research

The post Ethereum Price Action Just Flipped Bullish: Why $2400 Is Now In Play? appeared first on Coinpedia Fintech News

Ethereum has decisively reclaimed the $2,200 level, marking a clear shift in structure, and that’s exactly why $2,400 is now back in play. The recent move is not just a relief bounce. It comes after a complete leverage reset near $1,800, followed by steady accumulation and now a push into higher levels. With buyers stepping in aggressively and price building higher lows, Ethereum is transitioning into a fresh bullish phase.

Now, with resistance being tested and positioning rebuilding, the market is aligning toward a key question: If this momentum sustains, can Ethereum price extend recovery toward $2,400?

How Deleveraging Built Ethereum’s Recovery Base

Ethereum’s recent move above $2,200 is rooted in a deep deleveraging phase that occurred earlier near the $1,800 level. During that phase, open interest dropped sharply (over $2B decline), signaling that a large amount of leveraged positions were flushed out of the market. 

ETH open interest

Typically, such a drop reflects forced liquidations and traders exiting high-risk positions. However, the key detail is this: price did not collapse alongside leverage. Instead, Ethereum stabilized around $1,800, forming a strong demand base. This divergence is critical, it indicates that while speculative leverage was being removed, spot demand was absorbing the selling pressure. 

As a result, when leverage started returning, it entered a cleaner and more stable market environment, allowing price to move higher with less downside pressure. In simple terms: the deleveraging phase acted as a reset, and that reset is what enabled Ethereum’s current recovery toward $2,200+.

Ethereum Price Analysis: Breakout Structure Aligns With $2,400 Target

Ethereum is now trading within a recovery-to-breakout structure, with price forming higher lows and pushing into resistance near $2,200–$2,300. The reclaim of key moving averages confirms improving momentum, while the structure shows consistent demand absorption.

Ethereum price chart

A confirmed breakout above this resistance zone would trigger a continuation move toward $2,400, which stands as the next major supply level. On the downside, $2,100 remains immediate support, while the broader bullish structure holds as long as ETH stays above $1,800.

Outlook

Ethereum has flipped bullish, and the setup now justifies why $2,400 is back in focus. With leverage reset, fresh positioning building, and price reclaiming key levels, the market is entering a controlled expansion phase. If resistance breaks, the move toward $2,400 becomes a continuation, not a stretch. The shift is already happening, the next move depends on confirmation.

Stellar (XLM) Price Prediction for 2026, 2030: Is a Structural Breakout Ahead?

Stellar Price Prediction

The post Stellar (XLM) Price Prediction for 2026, 2030: Is a Structural Breakout Ahead? appeared first on Coinpedia Fintech News

Story Highlights

  • The live price of the Stellar crypto is  $ 0.15595230
  • XLM is holding its $0.13–$0.16 demand zone, with a breakout above $0.30 and $0.50 needed to confirm a structural trend reversal toward 2026 targets.
  • If payment adoption and tokenization expand, Stellar could trend toward $2.50 by 2026 and potentially $5–$7 by 2030 in a strong cycle.

Stellar is entering 2026 at a critical inflection point, with price stabilizing after a prolonged downtrend while attempting to build a base near key demand levels.  As a core player in cross-border payments, Stellar continues to expand its role in low-cost, high-speed financial infrastructure, supporting real-world transaction flows across global markets. With market structure tightening and downside pressure easing, the next phase will be defined by whether demand can translate into a sustained breakout.

In this Stellar (XLM) price prediction 2026, we examine key levels, structural shifts, and potential catalysts shaping its trajectory ahead.

Stellar Price Today

Cryptocurrency Stellar
Token XLM
Price $0.1560 down -4.41%
Market Cap$ 5,160,871,353.88
24h Volume$ 102,164,382.3412
Circulating Supply33,092,626,770.7145
Total Supply50,001,786,883.6590
All-Time High$ 0.9381 on 04 January 2018
All-Time Low$ 0.0012 on 18 November 2014

Stellar (XLM) Price Prediction For April 2026 

Stellar’s price action is transitioning from decline into consolidation, with early signs of compression forming near the $0.15–$0.17 range. After an extended downtrend, XLM has begun holding above its immediate support zone, while a descending resistance trendline continues to limit upside. 

This setup reflects a market preparing for a directional move. The immediate resistance lies near $0.20–$0.22. A breakout above this zone could shift short-term structure and open the path higher. In this context, Stellar in April may reach the $0.30–$0.50 range, provided resistance is reclaimed and momentum expands. However, failure to break higher may keep price range-bound, with support expected near the $0.14 level.

Coinpedia’s Stellar (XLM) Price Prediction 2026

The broader structure for Stellar in 2026 reflects a market attempting to transition out of a prolonged downtrend, with early signs of base formation but no confirmed reversal yet. After a sustained decline marked by lower highs and persistent selling pressure, XLM has moved into a compression phase near its lower demand zone. This shift indicates that downside momentum is weakening while price stabilizes within a tighter range.

Stellar price prediction

The next phase depends on reclaiming key resistance levels. The immediate barrier lies near $0.22, followed by stronger zones at $0.30 and $0.50. These levels act as structural checkpoints for recovery. A sustained move above $0.50 would signal a clear shift in market structure, opening the path for a broader expansion phase.

In this scenario, Stellar could advance toward the $1.20–$2.50 range over the course of 2026, supported by a step-by-step recovery across resistance zones. However, until these levels are reclaimed, the market remains in a rebuilding phase. A breakdown below $0.14 would invalidate the current base and delay recovery.

Recent Catalysts For Stellar (XLM)

Growing focus on cross-border payment solutions, reinforcing Stellar’s relevance in global financial infrastructure.

Increased institutional exploration of blockchain-based settlements, supporting networks like Stellar.

Ongoing ecosystem development and partnerships, strengthening long-term network positioning.

Stellar Crypto Price Prediction 2026 – 2030

YearPotential Low ($)Potential Average ($Potential High ($)
20261.201.802.50
20271.802.403.20
20282.803.804.80
20294.205.306.20
20305.506.207.00

Stellar (XLM) Price Forecast 2026

In 2026, Stellar price could project a low price of $1.20, an average price of $1.80, and a high of $2.50.

Stellar Price Prediction 2027

As per the Stellar Price Prediction 2027, Stellar may see a potential low price of $1.80 The potential high for the Stellar price in 2027 is estimated to reach $3.20.

XLM Price Prediction 2028

In 2028, the Stellar  price is forecasted to potentially reach a low price of $2.80, and a high price of $4.80

Stellar Price Targets 2029

Thereafter, the Stellar price for the year 2029 could range between $4.20 and $6.20.

Stellar (XLM) Price Prediction 2030

Finally, in 2030, the price of Stellar is predicted to remain steady and positive. It may trade between $5.50 and $7.00.

Stellar Price Prediction 2031, 2032, 2033, 2040, 2050

The long-term projection assumes Stellar sustains relevance in enterprise blockchain use cases, with growth moderating over time as the asset matures.

YearPotential Low ($)Potential Average ($)Potential High ($)
20316.207.509.00
20328.0010.0012.00
20339.1013.0016.00
204025.0050.0080.00
2050100.00140.00200.00

Stellar (XLM) Price Prediction: Market Analysis?

Year202620272030
Changelly$1.90$2.50$3.40
CoinCodex$1.40$2.70$4.00
WalletInvestor$2.00$3.40$4.40
Never Miss a Beat in the Crypto World!

Stay ahead with breaking news, expert analysis, and real-time updates on the latest trends in Bitcoin, altcoins, DeFi, NFTs, and more.

FAQs

What is Stellar (XLM) price prediction for 2026?

Stellar could trade between $1.20 and $2.50 in 2026 if it reclaims key resistance and adoption in payments and tokenization accelerates.

What is XLM price prediction for 2027?

XLM could trade between $1.80 and $3.20 in 2027 if adoption expands and broader crypto liquidity supports payment-focused blockchains.

How high will XLM go in 2030?

Under strong market conditions, XLM may reach $5.50 to $7.00 by 2030, driven by enterprise settlement growth and stablecoin usage.

How much will XLM be worth in 10 years?

Long-term projections suggest XLM could exceed $10 if institutional adoption scales, though outcomes depend on regulation and market cycles.

What is the XLM price prediction for the next bull run?

In the next crypto bull run, XLM could target the $0.80–$1.50 range initially. A sustained breakout above $1.00 may open upside toward $2.00+, depending on market liquidity and adoption momentum.

Internet Computer (ICP) Price Prediction 2026, 2027 – 2030: Is ICP Preparing a Move Toward $25?

Internet Computer Price Prediction

The post Internet Computer (ICP) Price Prediction 2026, 2027 – 2030: Is ICP Preparing a Move Toward $25? appeared first on Coinpedia Fintech News

Story Highlights

  • The live price of the ICP crypto is  $ 2.50261278.
  • If the recovery structure develops, ICP could gradually climb toward the $27 region by the end of 2026.
  • With stronger Web3 infrastructure adoption, ICP price could potentially expand toward $70 by 2030.

Internet Computer (ICP), one of the leading decentralized compute platforms, is currently navigating a phase where strong technological relevance contrasts with prolonged price weakness. While the protocol continues to expand its role in decentralized web infrastructure, its price action has remained under sustained pressure.

After an extended downtrend, ICP is now stabilizing near lower demand zones, suggesting that selling momentum may be gradually easing. However, the lack of strong upside continuation indicates that the token remains in a transitional phase rather than a confirmed recovery.

This sets up a key question: Is ICP forming a base after prolonged weakness, or does the structure still reflect insufficient demand? With 2026 already underway, attention now shifts to whether ICP can reclaim key resistance levels and transition into a recovery phase. So, let’s dive into Coinpedia’s Internet Computer (ICP) Price Prediction 2026, 2027 – 2030.

Internet Computer Price Today

Cryptocurrency Internet Computer
Token ICP
Price $2.5026 down -3.30%
Market Cap$ 1,378,417,177.08
24h Volume$ 106,992,115.8161
Circulating Supply550,791,232.4363
Total Supply550,791,232.4363
All-Time High$ 750.7305 on 10 May 2021
All-Time Low$ 1.9773 on 10 October 2025

Internet Computer (ICP) Price Prediction for April 2026 

ICP is entering April from a position of compression, where price is no longer trending lower but has yet to transition into expansion. After a prolonged decline, the asset has begun to stabilize within a tight range around the $2.20–$2.60 region. This behavior typically reflects a shift in market dynamics, where aggressive selling fades and price starts to balance between buyers and sellers.

The key trigger now sits above the current range. A move through the $3.20–$3.50 zone would indicate that demand is returning, potentially initiating a recovery phase. Under this scenario, ICP in April could move toward the $5–$8 range, driven by a breakout from its current consolidation structure. If this breakout fails to materialize, ICP price is likely to remain contained, with the $2.00 area continuing to act as a base.

Coinpedia’s Internet Computer (ICP) Price Prediction 2026

ICP’s broader trajectory in 2026 is centered around whether the current stabilization phase evolves into a sustained recovery structure. The token has spent an extended period in decline, forming a series of lower highs that defined its previous market cycle. That phase now appears to be slowing, with price beginning to compress near its lower range, often a precursor to structural transition.

ICP price prediction

The recovery path, however, is not immediate. It requires a sequential reclaim of key zones, starting with $3.50, followed by $5 and $8. These levels represent the points where previous selling pressure emerged and must now be absorbed. Once these zones are cleared, the market typically shifts into a higher trading regime, where upside momentum begins to build more aggressively.

In such a progression, ICP could gradually expand toward the $10–$27 range during 2026, reflecting a full-cycle recovery rather than a short-term bounce. Until that transition is confirmed, the asset remains in a rebuilding phase. Loss of the $2.00 level would weaken this structure and extend the consolidation period.

Recent Catalysts

Major exchange listing expanded access, improving liquidity and global participation.

AI narrative gaining traction, positioning ICP within the decentralized compute and infrastructure segment.

Strong developer activity continues, reflecting sustained ecosystem growth and ongoing network development.

Internet Computer Crypto Price Prediction 2026 – 2030

YearPotential Low ($)Potential Average ($Potential High ($)
2026101827
2027142434
2028183045
2029254055
2030355070

Internet Computer Price Projection 2026

In 2026, Internet Computer  price could project a low price of $10, an average price of $18, and a high of $27

ICP Crypto Price Action 2027

As per the Internet Computer price Prediction 2027, Internet Computer   may see a potential low price of $14, The potential high for Internet Computer  price in 2027 is estimated to reach $34

Internet Computer Price Target 2028

In 2028, Internet Computer price is forecasted to potentially reach a low price of $18, and a high price of $45.

ICP Token Price Forecast 2029

Thereafter, the Internet Computer (ICP) price for the year 2029 could range between $25 and $55.

Internet Computer Price Prediction 2030

Finally, in 2030, the price of Internet Computer (ICP) is predicted to maintain a steady positive. It may trade between $35 and $70

Internet Computer Price Prediction 2031, 2032, 2033, 2040, 2050

Over the long term, the value of Internet Computer (ICP) will depend on Web3 adoption and the expansion of decentralized cloud services, which could support gradual growth across future market cycles.

YearPotential Low ($)Potential Average ($)Potential High ($)
2031406085
20324570100
20335085120
2040120185250
2050350520700

Internet Computer (ICP) Price Prediction: Market Analysis?

Year202620272030
Changelly$15$35$35
CoinCodex$18$42$50
WalletInvestor$20$38$45
Never Miss a Beat in the Crypto World!

Stay ahead with breaking news, expert analysis, and real-time updates on the latest trends in Bitcoin, altcoins, DeFi, NFTs, and more.

FAQs

What is Internet Computer (ICP) and what is it used for?

Internet Computer (ICP) is a layer-1 blockchain that lets developers build fully on-chain apps without traditional cloud servers.

What is the Internet Computer (ICP) price prediction for 2026?

ICP is projected to trade between $6 and $25 in 2026, depending on market momentum, support levels, and broader crypto sentiment.

How high can ICP price go by 2030?

If adoption of decentralized cloud platforms expands and crypto markets strengthen, ICP could potentially reach around $70 by 2030 in a strong growth cycle.

How much will ICP cost in 2035

Long-term models suggest ICP could trade between about $80 and $150 by 2035 if decentralized computing platforms gain wider adoption.

What will ICP be worth in 2040?

Long-term projections estimate ICP could range between roughly $120 and $250 by 2040, depending on Web3 adoption, developer activity, and broader crypto market growth.

What factors influence ICP price movements?

ICP’s price is influenced by market trends, developer adoption, token supply dynamics, network upgrades, and overall crypto sentiment.

Is ICP a good long-term investment?

ICP may suit long-term investors who believe in decentralized cloud computing, but price volatility means risk management is essential.

❌