Reading view

Crypto Markets Lost $6M in 12 Exploits This Month — Is Another Attack Coming?

Crypto Trader Loses $24M in Violent Attack

The post Crypto Markets Lost $6M in 12 Exploits This Month — Is Another Attack Coming? appeared first on Coinpedia Fintech News

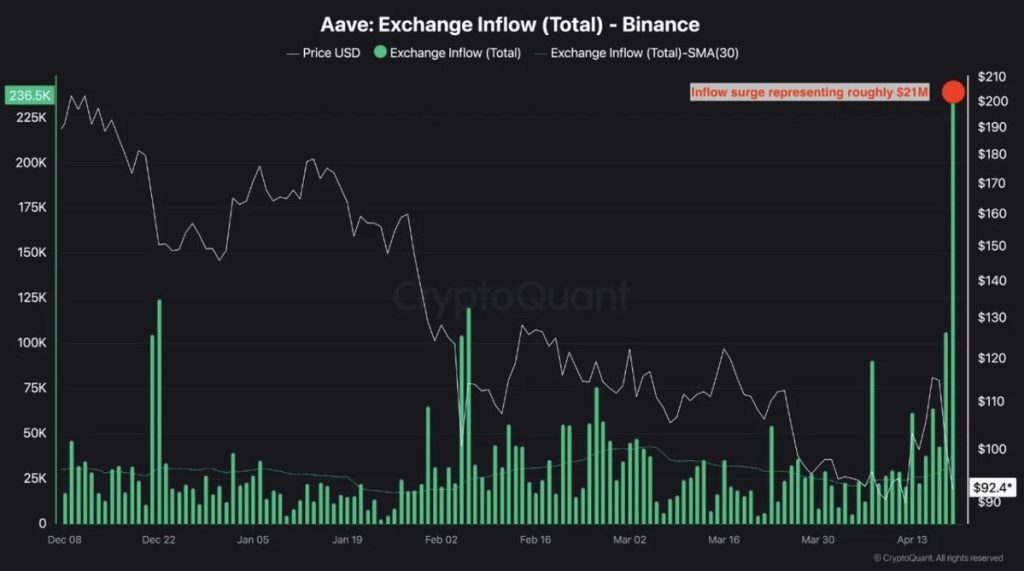
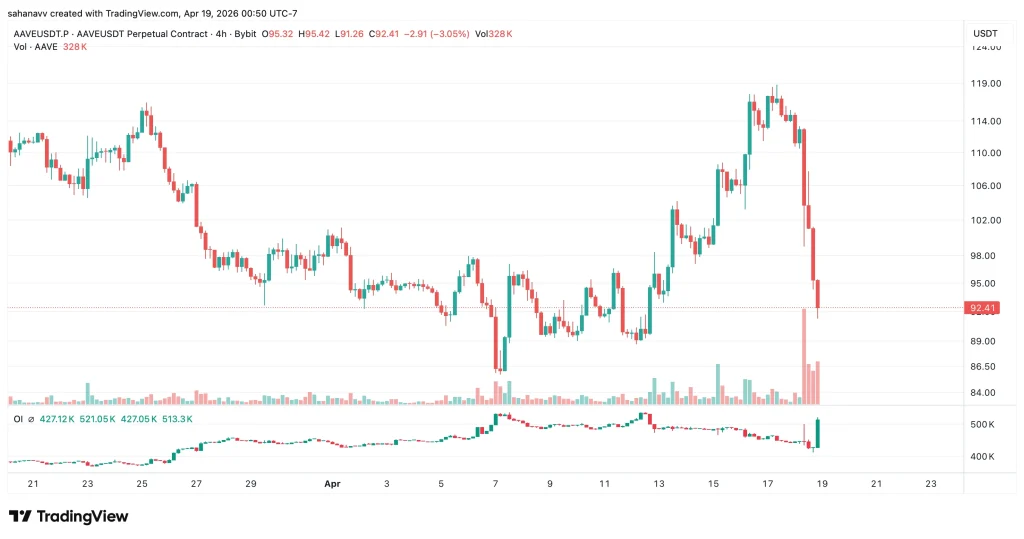
April has been one of the most turbulent months for the crypto markets, with over $600M lost across 12 exploits, exposing repeated failures in bridges, access controls, and governance—including the recent AAVE-linked disruption. But beyond these technical breakdowns, a different kind of risk is now coming into focus. Memecore (M), with its concentrated supply and low float, is raising structural concerns that feel familiar.

If exploits show how systems fail, what happens when the structure itself becomes the risk, and could this begin to resemble the path RAVE DAO took?

$6M+ Lost Across 12 Exploits—But Two Incidents Dominated the Damage

Crypto markets saw a wave of exploits this month, with 12 separate incidents exposing persistent weaknesses across DeFi, wallets, and infrastructure. However, the distribution of losses wasn’t even — two exploits alone accounted for nearly 95% of the total damage, highlighting how a single vulnerability at scale can outweigh multiple smaller failures combined.

The 12 Exploits This Month

  • Kelp DAO — $293M (Apr 18)
  • Drift Protocol — $285M (Apr 1)
  • Fake Ledger App — $9.5M+
  • Grinex Exchange — $13–15M (Apr 16)
  • Rhea Finance — $7.6M (Apr 16)
  • Hyperbridge — $2.5M (Apr 12)
  • BSC TMM — $1.67M (Apr 4)
  • Silo V2 — $392K (Apr 3)
  • Aethir — $423K (Apr 9)
  • Dango — $410K (Apr 13)
  • MONA — $61K (Apr 13)
  • SubQuery — $60K (Apr 12)
  • Zerion Wallet — $100K (Apr 14)

What stands out isn’t just the scale — it’s the repetition. Every single exploit this month falls into well-known attack categories, not unknown vulnerabilities. This suggests the issue isn’t innovation from attackers but persistent gaps in execution and security practices.

  • Access control failures: Drift, Aethir, SubQuery
  • Bridge/oracle exploits: Kelp DAO, Hyperbridge, Silo V2
  • Social engineering: Fake Ledger app, Zerion
  • Smart contract bugs: Dango, MONA, BSC TMM

The main takeaway is clear: these were not unpredictable attacks, but they were preventable failures. 

Crash Alert: Is Memecore the Next RAVE of the Crypto Market?

While exploits continue to expose technical weaknesses, another risk is quietly building on the market structure side. Memecore (M) price is now under scrutiny after on-chain investigator ZachXBT raised concerns over its high insider concentration, with reports suggesting more than 90% of the supply may be controlled by a small group.

FactorsMemecore (M) Rave DAO (RAVE) 
Supply ConcentrationReportedly, more than 90% held by insidersReportedly, more than 98% held by a few wallets
Float vs FDVLow float, FDV (~$17B to $30B) Low float, inflated valuation before the crash
Liquidity DepthThin relative to valuationThin liquidity before collapse
Price Support MechanismInsider control can defend the price in the short termPrice held artificially before breakdown
Market BehaviourProne to sharp moves on either sideSaw extreme volatility before the collapse

This creates a familiar setup. A low circulating float combined with a high fully diluted valuation ($17B–$30B) introduces structural inefficiencies, where price discovery becomes distorted. Similar conditions were seen in tokens like RAVE, which experienced a 95–99% drawdown after scrutiny increased and liquidity failed to support the valuation.

However, this isn’t a straightforward bearish case. Markets with tight supply and high insider control often behave differently. Limited float can artificially support price in the short term while also creating conditions for sharp short squeezes when liquidity is thin. At current levels, with the Memecore price at $3.3 to $3.4 and volume around $25 to $27 million, the gap between the circulating and total supply is pretty wide. 

Hence, this suggests Memecore is a controlled environment where the price can move aggressively in either direction. 

Key Signals to Watch Next!

After experiencing massive losses this month, here are the signals that matter next as the M price set-up is structure-driven and if a breakdown triggers, it would be a massive one. 

  • Exchange inflow spikes → Large transfers (especially from insider wallets) signal potential distribution and incoming sell pressure
  • Price drop with rising volume → Indicates real selling, not just volatility; demand failing to absorb supply
  • Failure at key psychological levels (e.g., $3) → Loss of confidence triggers stops and accelerates downside
  • Thin liquidity vs high valuation → Weak order books + high market cap create unstable price conditions
  • Shift in narrative/sentiment → From “strong treasury” → “sustainability concerns” signals confidence breakdown
  • Insider wallet movements → Early holders reducing exposure can trigger broader market exits

Wrapping it Up: Is Memecore the next Rave Dao?

Memecore (M) price is showing structural similarities that can’t be ignored—concentrated supply, thin liquidity, and narrative-driven support. But it hasn’t reached the breakdown phase yet. For now, the setup remains stable on the surface, fragile underneath.

So the real question is: is Memecore the next RAVE DAO — or just another controlled market that hasn’t cracked yet?

AAVE After the Crash: $21M Exchange Inflows Raise Doubts Over Recovery

Aave liquidation event

The post AAVE After the Crash: $21M Exchange Inflows Raise Doubts Over Recovery appeared first on Coinpedia Fintech News

Aave price has stabilized after its recent shock, but the real problem may still be unresolved. While price has attempted a recovery, deeper signals suggest the market is still dealing with the aftermath, not moving past it. The key question now isn’t just whether AAVE can bounce but who ultimately bears the brunt of the damage and whether this recovery can hold.

Exchange Inflows Spike — Are Holders Preparing to Exit?

AAVE is seeing a sharp surge in exchange inflows, with data showing nearly $21 million in tokens moving to Binance. This shift is significant, especially coming right after a period of heightened volatility. Exchange inflows typically rise when holders prepare to sell, and the timing suggests that participants may be positioning for exits rather than accumulation.

aave price
Souce: Cryptoquant

What makes this more notable is the behavior change. Earlier phases of the decline saw relatively muted inflows, indicating a willingness to hold through uncertainty. Now, that pattern appears to be shifting. While inflows alone don’t confirm immediate selling, they often act as a leading signal — particularly when they appear during weak recovery attempts. This raises a key risk: the recent bounce could be facing overhead supply waiting to be offloaded.

Weak Reclaim Raises Bull Trap Risk

AAVE’s recent price action adds to this concern. The bounce attempted to reclaim the $100 level but failed to hold, with the price quickly rejecting back below the resistance. This zone, which previously acted as support, is now functioning as supply—a classic role reversal that typically signals continued weakness.

aave pice

The rejection was accompanied by a spike in volume, suggesting the move higher was met with active selling rather than sustained buying. Price is now hovering near the $90–$92 region, with $85.80 acting as the next key support. Momentum indicators reinforce this view. RSI remains below neutral, and MACD is already flattening after a brief bullish crossover, indicating that upside momentum is fading. 

Key Levels to Watch

$100 — Immediate Resistance / Invalidation Level

$95 — First Reaction Zone

$88–$92 — Critical Support Zone

$85.8 — Breakdown Trigger

$80 — Next Downside Target

The Bottom Line: What Comes Next

AAVE is now at a decisive point. The $88–$92 range remains the immediate zone to watch. A break below this level could expose the $85 region, with further downside toward $80 if selling accelerates. On the upside, bulls need a strong reclaim of $100, followed by sustained acceptance above that level, to shift momentum and invalidate the current bearish structure.

Until then, the trend remains fragile. The bounce has not confirmed strength — it has only tested resistance. The initial shock may be over, but the market is still adjusting to its consequences. Exchange inflows suggest potential sell pressure, while price action shows that buyers have yet to regain control. This leaves AAVE in a transition phase — caught between recovery and continuation.

Why Is Hyperliquid (HYPE) Price Crashing Today: Data, Liquidity Shifts, and Market Signals

HYPE Hits 2026 High After February Lows and HIP 4 Buzz

The post Why Is Hyperliquid (HYPE) Price Crashing Today: Data, Liquidity Shifts, and Market Signals appeared first on Coinpedia Fintech News

Hyperliquid (HYPE) price came under pressure as the broader crypto market turned bearish, dragging the price down to a critical support zone just above $40. The level held—for now, triggering a short-term bounce and raising the possibility of a relief move toward $45. However, the bigger picture remains conflicted. While buyers are attempting to regain control, the underlying price structure still leans bullish, hinting that this pullback could be a consolidation phase rather than a full trend reversal.

The price is at a critical turning point after a sharp pullback dragged the price back toward the lower boundary of its rising channel. Despite the recent 6% drop, the broader structure remains intact, with the price continuing to respect a series of higher lows. However, weakening momentum and rising sell-side pressure suggest that bulls are losing short-term control, putting the $40–$41 zone into focus as a key defense level.

hype price

Hyperliquid (HYPE) is currently trading at a crucial support zone near $40–$41, a level that aligns with the lower boundary of its rising channel and has historically acted as a strong demand area. Holding above this zone is critical for maintaining the broader bullish structure, with an immediate upside target at $43, followed by a key resistance band between $49 and $50 where the price recently faced rejection. 

On the downside, a confirmed breakdown below $40 could invalidate the short-term uptrend and expose the price to deeper support levels around $35–$36, with an extended correction potentially reaching the $33 region. With price compressed between support and resistance, HYPE is approaching a decisive move, making these levels essential for traders to watch in the coming sessions.

While the broader structure still leans bullish, fading momentum and rising sell pressure suggest caution. Hyperliquid (HYPE) price is approaching a make-or-break zone near $40, where the next move will likely define short-term direction. 

Bitcoin Rejected Again — Is BTC Setting Up for a Sharp Drop Below $70K?

Bitcoin Bear Market In Its Final Stage 2 On-Chain Signals to Know Before Your Next Trade

The post Bitcoin Rejected Again — Is BTC Setting Up for a Sharp Drop Below $70K? appeared first on Coinpedia Fintech News

Bitcoin price faced a rejection near the crucial resistance, plunging by 2.62% to reach close to $75,000. The rally seems to be driven by geopolitical news, as the recent gains have completely faded. The IRGC fully blocked the Strait of Hormuz again, which has intensified the selling pressure on the token. 

After another rejection near the $75K–$78K zone, price action is starting to show signs of exhaustion, not continuation. What makes this setup more concerning is what’s happening beneath the surface. Profit-taking is rising, positioning remains fragile, and the structure continues to print lower highs. This is not a confirmed breakdown yet—but it is no longer a healthy uptrend either.

The current setup increasingly resembles early-stage distribution, where upside attempts weaken, and downside risk quietly builds.

Profit-Taking Rises as Short-Term Holders Turn Active

Short-Term Holder SOPR is now consistently hovering around and above the 1 mark, signaling that recent buyers are actively realizing profits. When SOPR stays above 1, it typically reflects selling into strength rather than holding for higher prices, a behavior often seen during early distribution phases.

btc price

However, the data also shows that SOPR is not breaking down below 1 in a sustained way, meaning the market hasn’t entered capitulation yet. Instead, this points to a more controlled environment where participants are gradually offloading positions without panic. In other words, selling pressure is building, but not at a level that confirms a full trend reversal just yet.

Market Remains Indecisive as Long/Short Positioning Stays Mixed

The BTC long/short ratio reflects a market that lacks clear directional conviction. Buy and sell pressure continues to alternate, with no sustained dominance from either side. This kind of imbalance typically signals indecision rather than trend strength, especially when it appears near key resistance levels.

btc price

However, occasional spikes in long positioning suggest that traders are still attempting to bet on upside continuation. The problem is timing. When long exposure builds without a confirmed breakout, it often creates a vulnerable setup where even a small downside move can trigger liquidations. For now, the data doesn’t show extreme crowding, but it does highlight a market that is fragile, reactive, and prone to sudden volatility rather than stable continuation.

BTC Faces Rejection as Downtrend Structure Holds

Bitcoin’s price action continues to respect a clear descending trendline, with the latest move once again rejecting near the $75K–$78K resistance zone. This marks another lower high, reinforcing the broader downtrend that has been in place since the previous peak.

btc price

While the recent bounce from the $60K–$65K region shows buyers are still active at lower levels, the inability to break above resistance keeps the structure weak. As long as Bitcoin price remains below this trendline, the path of least resistance leans downward.

From here, the key level to watch sits near the $70K zone. A sustained move below this area could expose BTC to a deeper correction toward the $60K–$55K range. On the upside, bulls need a decisive breakout above $78K to invalidate the current structure and shift momentum back in their favor.

What’s Next for the BTC Price Rally?

The Bitcoin price is not breaking down yet, but the structure is no longer supportive of upside continuation. With repeated rejections at resistance, rising profit-taking, and fragile positioning, the market is starting to tilt toward a liquidity-driven move rather than a sustained rally. This is the kind of setup where late longs get trapped, and volatility expands quickly.

Unless the BTC price reclaims the $78K zone with strong confirmation, the current structure favors a move lower, with $70K acting as the first key test. A breakdown below this level could accelerate downside toward the $60K–$55K region.

AAVE Price Drops After DeFi Exploit Triggers Liquidation Cascade — Is $85 Next?

Aave Liquidation Shock $27M Wiped Out After wstETH Oracle Glitch

The post AAVE Price Drops After DeFi Exploit Triggers Liquidation Cascade — Is $85 Next? appeared first on Coinpedia Fintech News

Aave is dealing with the aftermath of a DeFi exploit, but the real damage came after. The event sparked a liquidation cascade that wiped out leveraged positions and pushed the price into a weak demand zone. Now, with support under pressure and traders reloading positions, the market looks far from stable. Is this where the AAVE price finds a floor—or is another move lower already in motion?

Exploit Triggered the Drop — Aave Moves to Contain Risk

The trigger came from an exploit tied to rsETH collateral (linked to KelpDAO), which exposed a structural weakness rather than a direct flaw in Aave itself. Attackers used rsETH within Aave’s lending markets to borrow large amounts of ETH, and when those positions turned unstable, it left the protocol with bad debt exposure. This wasn’t a smart contract hack on Aave — it was a case of collateral risk spilling into the lending layer.

The rsETH markets on Aave V3 and Aave V4 have been frozen. Aave's contracts have not been exploited and this is an exploit related to rsETH.

The freeze follows an exploit of the Kelp DAO rsETH bridge. Freezing the rsETH markets prevents new deposits and borrowing against rsETH…

— Aave (@aave) April 18, 2026

Aave responded quickly to contain the damage. The protocol froze rsETH markets across Aave V3 (and related deployments, including upcoming V4 considerations) to prevent further borrowing and limit risk propagation. At the same time, liquidity stress intensified as users rushed to withdraw funds, pushing utilization rates higher and triggering forced liquidations. That combination — exploit-driven stress + defensive protocol action + user-driven exits — is what ultimately accelerated the downside move in AAVE.

Liquidations Accelerated the Downside

The exploit didn’t just trigger selling — it forced it. As liquidity tightened and prices started slipping, leveraged positions were pushed into liquidation. That created a cascade effect, where each forced exit added more pressure to the downside.

aave price

This type of move is typically fast and aggressive, and that’s exactly what played out. The sell-off wasn’t gradual — it was driven by forced unwinds rather than organic selling, which explains the sharp breakdown in price and the speed of the move.

AAVE at a Critical Level — Breakdown or Bounce Ahead?

AAVE is now testing a key demand zone near the $88–$92 range, a level that has already seen multiple reactions. Price also failed to reclaim the $95–$100 range, suggesting buyers are not in control yet. From here, the next move depends on how the price reacts at this level. A clean break below $88 could open the door toward the $85 region, with a deeper move toward $80 if selling pressure continues. 

On the other hand, any recovery would first need a strong reclaim of $95, followed by acceptance above $100.

aave price

With the initial drop complete, the focus has now shifted to positioning. Open Interest (OI), which declined during the liquidation phase, has started to rise again, but the price has not shown a strong recovery. This matters. When OI builds while the price remains weak, it often signals new positions entering without clear directional control. 

In many cases, this leans bearish, as markets tend to continue lower when fresh positions build into weakness. At the same time, it also increases the risk of sudden volatility if those positions get squeezed.

What Happens Next for the AAVE Price Rally?

The initial trigger is known. The liquidation phase has played out. Now, the AAVE price is entering a more uncertain phase where positioning and reaction at key levels will decide direction. Whether this turns into stabilization or another leg lower will depend on how the market responds here, but for now, the pressure hasn’t fully eased.

Ethereum Price Prediction 2026: Can ETH Hit $5,000 This Year?

Ethereum Queue Hits 3.4M ETH, 60-Day Wait

The post Ethereum Price Prediction 2026: Can ETH Hit $5,000 This Year? appeared first on Coinpedia Fintech News

Ethereum price has been one of the stronger performers among the top 10, holding above the $2,000 level since March. However, the price has slipped nearly 3.5% in the past 24 hours, underperforming the broader market amid macro-driven selling pressure. Despite this short-term weakness, the larger structure remains intact, with three key indicators signaling a potential bullish shift that could drive the ETH price toward new highs.

Ethereum On-Chain Activity Surges to Multi-Year Highs

After a prolonged period of decline, chain transactions have rebounded sharply, reaching over 200 million in Q1 2026. This marks one of the strongest recoveries in network activity in recent years, breaking the previous downtrend that persisted through 2022–2024. This isn’t just a small uptick—it’s a structural reversal in usage.

eth price
Source: X

Rising transaction count typically signals increasing demand for the network, whether through DeFi activity, user growth, or broader ecosystem participation. More importantly, it suggests that fundamental usage is catching up with price, rather than price moving purely on speculation.

10% Volatility Haunts the Ethereum Price Rally

Ethereum’s liquidation map is starting to show a clear imbalance, and it’s not subtle. A large cluster of short liquidations is building above the current price, while long-side liquidity below has already been cleared to a large extent. This shift suggests that the market has already flushed weaker longs, leaving short positions exposed on the upside.

eth price

With price hovering near $2,350, the path of least resistance appears tilted upward. If ETH begins to push higher, it could trigger a cascade of short liquidations, effectively fueling the move toward higher levels. If ETH price surges by 10%, the token may face $800M in short liquidation, while a 10% pullback could trigger $2.3B in long liquidations. 

Ethereum Price Prediction: Can ETH Price Hit $5000?

Ethereum’s higher timeframe structure is starting to mirror a familiar cycle, and that’s where things get interesting. Each major rally has followed the same pattern: impulse → consolidation → expansion. Right now, ETH appears to be sitting in that consolidation phase again, holding within a defined range after its last move higher.

eth price

The current structure between roughly $2,000–$4,000 looks similar to previous accumulation zones that eventually led to strong upside expansions. Price is compressing, volatility is cooling, and the market is building a base rather than trending aggressively. If this pattern continues, the next phase would be a breakout from this range, potentially leading to a new expansion leg. The projected move, based on previous cycles, points toward a gradual climb rather than a straight rally, likely forming higher highs along the way.

Ethereum isn’t trending; it’s preparing. And historically, this kind of consolidation has preceded some of the strongest moves, not the weakest. As long as the ETH price holds above the lower range (~$2,000), the structure remains intact. A breakdown below this level would invalidate the pattern and shift the outlook.

XRP Price Shows First Bullish Signal in 3 Months—Is a $1.55 Breakout Next?

XRP Price Shows First Bullish Signal in 3 Months—Is a $1.55 Breakout Next

The post XRP Price Shows First Bullish Signal in 3 Months—Is a $1.55 Breakout Next? appeared first on Coinpedia Fintech News

XRP price is down 1.09% over the past 24 hours, trading near $1.43 and lagging behind Bitcoin’s strength. The move appears to be a technical pullback after recent overbought conditions—but the broader setup is starting to shift. Notably, one of the key indicators has just flipped bullish for the first time in months, hinting that underlying momentum may be changing.

At the same time, positioning data tells a different story. Open interest continues to climb, showing traders are stepping in aggressively, while funding keeps flipping—pointing to unstable conviction on both sides. This creates a clear tension: is XRP building strength for a breakout above $1.55, or setting up liquidity for another rejection?

Derivatives Signal: Positioning Builds, But Conviction Remains Split

The derivative data does not appear to point towards a clean trade setup, as Open interest climbs and funding rates continue to flip. XRP is down 1.09% over the past 24 hours, trading near $1.43 and lagging behind Bitcoin’s strength. The move appears to be a technical pullback after recent overbought conditions—but the broader setup is starting to shift.

xrp price

Notably, one of the key indicators has just flipped bullish for the first time in months, hinting that underlying momentum may be changing. At the same time, positioning data tells a different story. Open interest continues to climb, showing traders are stepping in aggressively, while funding keeps flipping—pointing to unstable conviction on both sides.

xrp price

This creates a clear tension: is XRP building strength for a breakout above $1.55, or setting up liquidity for another rejection?

XRP Supertrend Flips, But Resistance Still in Play

XRP is still range-bound—but one important shift just happened. The supertrend has flipped bullish for the first time since January, signaling a change in short-term momentum. This isn’t noise. It tells you the trend pressure that kept pushing the price lower for months is starting to ease. But here’s the catch—the price hasn’t been confirmed.

xrp price

XRP continues to trade inside the $1.27–$1.55 range, with multiple rejections near the upper boundary. The current move is pushing into resistance again, but until $1.55 is taken out decisively, the structure remains unchanged. This is a clear divergence, as the indicator is turning bullish while the price is still stuck below key resistance. At the same time, RSI is climbing, showing improving momentum—but again, momentum without a breakout doesn’t change structure.

Therefore, a breakout above $1.55 may confirm the supertrend shift, which may open doors towards $1.70 and $1.80. Besides, a rejection may turn into another failed breakout, dragging the price back to the $1.30 zone. The supertrend flip is the first real bullish signal in months—but until price follows through, it’s just potential, not confirmation.

XRP at a Decision Zone: Breakout or Another Rejection?

The XRP price is approaching a decisive point where both price structure and positioning are about to resolve. The supertrend flip signals improving momentum, but the price still sits below a well-defined resistance. At the same time, rising open interest shows traders are heavily positioned, increasing the probability of a sharp move once direction is confirmed. 

Momentum is building, but confirmation is missing. The next move isn’t about direction—it’s about whether $1.55 finally breaks or rejects again.

Bitcoin Slips Below $76.5K as Miner Selling Picks Up — More Downside Ahead?

Bitcoin Exchange Reserves Drop to 2019 Levels Is a BTC Supply Shock Coming

The post Bitcoin Slips Below $76.5K as Miner Selling Picks Up — More Downside Ahead? appeared first on Coinpedia Fintech News

The Bitcoin (BTC) price has been displaying significant strength in the past few days and marked monthly highs above $78,000. Currently, the price is experiencing significant upward pressure as it plunges below $76,500. The underlying data presents a more complex picture than the price action suggests, as the on-chain and derivatives signals reveal the token being in a transition phase. 

This raises a key question for traders: is Bitcoin preparing for a breakout toward new highs or setting up for another rejection at resistance?

Bitcoin Price Tests Key Support Near $76.5K

Bitcoin has rebounded from the $65,000 region and is now testing the $76,000–$78,000 resistance zone, a level that has repeatedly capped upside in recent weeks. Despite the recovery, the broader structure still lacks a confirmed breakout, with price yet to establish a clear higher high above this range.

btc price

Derivatives data shows rising open interest, indicating fresh positioning, while funding rates remain slightly negative—suggesting that short positions are still dominant. This combination increases the likelihood of a short squeeze if resistance is broken. However, the absence of strong volume confirmation keeps the breakout scenario uncertain.

A sustained move above $78,000 could open the path toward $82,000–$84,000, while rejection at this level may push Bitcoin back toward the $72,000–$74,000 support zone.

Miner Selling Pressure Begins to Rise

The Miners’ Position Index (MPI) has recently turned positive after an extended period in negative territory, signaling that miners are beginning to sell again. While the current levels do not indicate aggressive distribution, the shift itself is important.

btc price

This suggests that miners are likely taking advantage of higher prices to realize profits, particularly as Bitcoin approaches resistance. Historically, such behavior tends to introduce supply pressure during rallies, especially when the price is testing key levels. In the current context, rising MPI adds a layer of caution, as it indicates that selling activity may increase if Bitcoin fails to break above resistance.

Low Miner Pressure Limits Downside Risk

The Puell Multiple remains in a relatively low range, reflecting that miner revenues are not elevated compared to historical averages. This indicates that miners are not under strong financial pressure to sell aggressively, which helps limit downside risk.

btc price

However, the metric is not in a deep undervaluation zone either, meaning it does not signal a strong accumulation phase or cycle bottom. Instead, it points to a neutral market condition where selling is opportunistic rather than forced. When combined with the rising MPI, the data suggest that miners are strategically distributing strength, rather than capitulating and potentially capping upside momentum in the near term.

Conclusion

Bitcoin is currently at a decisive level, with the price testing the $78,000 resistance amid conflicting signals from market data. While rising open interest and negative funding rates create conditions for a potential breakout and short squeeze toward $82,000–$84,000, increasing miner distribution introduces supply that could limit upside.

Unless the BTC price secures a strong breakout above resistance with volume confirmation, the current move risks turning into another rejection, with downside targets around $72,000–$74,000. For now, the setup remains balanced—but the next move will likely be decisive.

Worldcoin Drops 10% Despite Easing Market Pressure — Can WLD Reclaim $0.30?

Why-Worldcoin-WLD-Price-is-Surging-Will-it-Achieve-a-30-Rise-This-Week.

The post Worldcoin Drops 10% Despite Easing Market Pressure — Can WLD Reclaim $0.30? appeared first on Coinpedia Fintech News

Worldcoin price has been on a consistent downtrend since the beginning, while the bulls have been exerting pressure at regular intervals. In times when the selling pressure is reducing, the price is down by 11% to $0.282. The token is underperforming a broader market rally and is primarily driven by a ‘sell-the-news’ reaction to its major protocol and high-profile partnerships with Tinder, Zoom, and DocuSign on April 17. 

The WLD price is attempting a recovery after a sharp decline, but the bigger question remains—can this bounce actually hold, or is it just another trap for late buyers? While broader market sentiment shows signs of easing selling pressure, WLD continues to trade below key resistance levels. With price now approaching a crucial zone, traders are watching closely: is a breakout toward $0.30 possible, or will sellers regain control once again?

Worldcoin Stuck in a Strong Descending Trend

Ever since the start of the year, the WLD price has been trading within a descending parallel channel, forming consecutive lower highs and lows. It is following a pattern wherein the recovery is restricted below the previous resistance, and the latest push was also restricted at $0.32. Currently, the price is trying to defend the local support at $0.28, and if it manages to reclaim $0.29, a rise above $0.31 could be imminent. 

wld price

After facing multiple supply zones, the buyers entered at $0.25 and pushed the price beyond $0.3. This suggests the presence of a support zone around this price range that may hold the rally in case of an extended pullback. Open interest is rising, hinting new positions are entering, while the funding rate is turning negative, indicating shorts are gaining control. Therefore, this suggests that the positions are building, but not the strength. 

wld price

Meanwhile, RSI has bounced from the oversold range but is still below the strong bullish momentum zone. Besides, the MACD shows a drop in the buying pressure and hence is pointing towards recovery, but without strength. Hence, it may be said that traders are still bearish on the WLD price as new positions entering may not be long. 

Will Worldcoin (WLD) Price Reclaim $0.32?

Worldcoin’s current bounce remains a reaction within a broader downtrend, and the next move will likely be decided around the $0.30–$0.33 resistance zone. A clean breakout and daily close above this range could shift short-term momentum, opening the door toward $0.38 and potentially $0.43. 

However, failure to reclaim this level would reinforce the lower high structure, increasing the probability of a pullback toward $0.25, with a breakdown exposing $0.22 as the next downside target. For now, the bias remains cautious—strength needs confirmation, while rejection favours continuation lower.

❌