Reading view

Solana Price Near $90 Again: Will the 8th Attempt Finally Break Resistance?

Solana Price Near $90 Again Will the 8th Attempt Finally Break Resistance

The post Solana Price Near $90 Again: Will the 8th Attempt Finally Break Resistance? appeared first on Coinpedia Fintech News

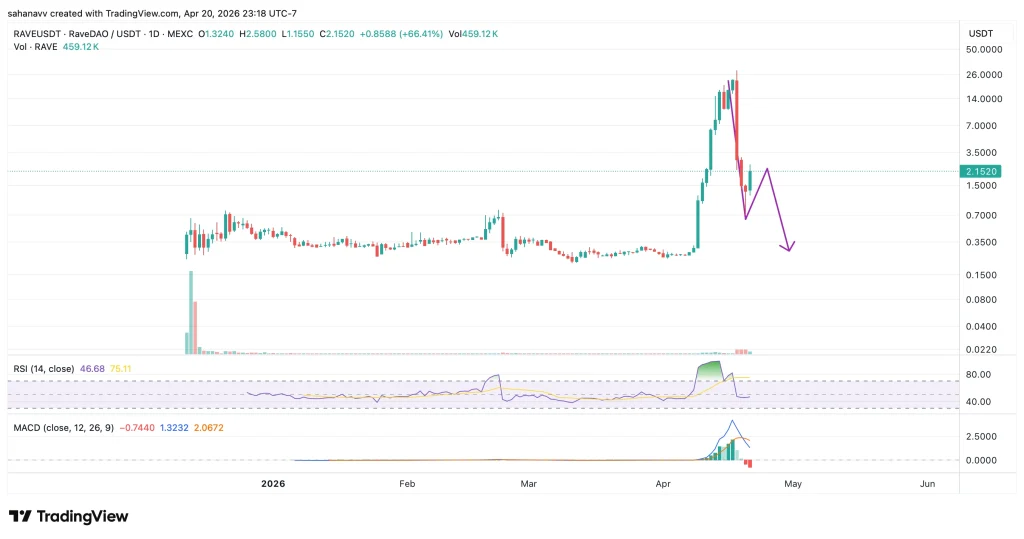
The crypto market has turned highly volatile after a series of exploits this month, with nearly a dozen incidents shaking confidence across DeFi. The KelpDAO exploit and the sharp RAVE price crash have only deepened the uncertainty, leaving traders cautious. Amid this backdrop, Solana price saw a brief pullback but quickly bounced from local support, showing relative resilience.

However, the bigger test lies ahead. SOL is once again approaching the same resistance that has capped its upside for weeks, bringing it back to a familiar battleground. The question now is, can Solana finally break above $90, or will this become the 8th failed attempt at reclaiming the range?

Solana (SOL) Price Analysis

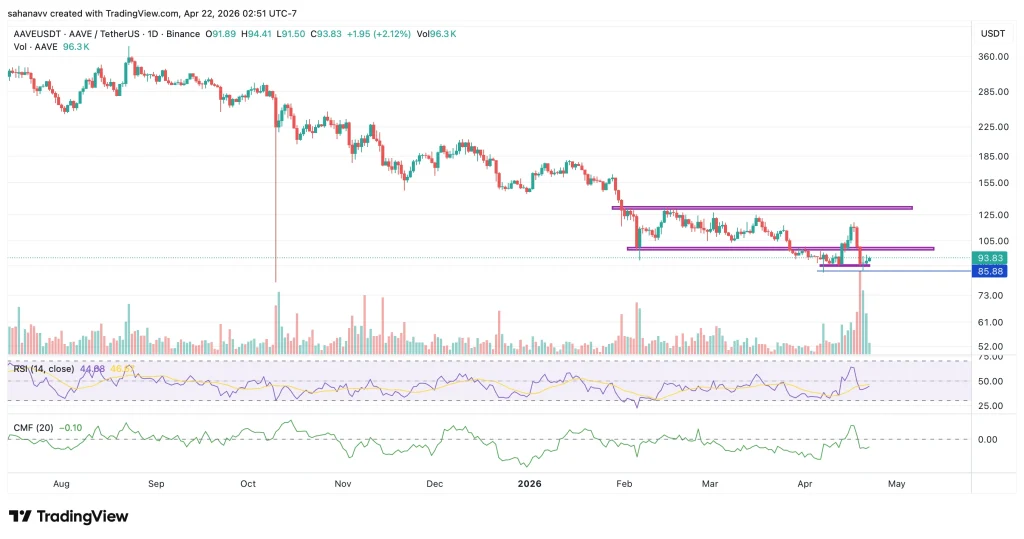
Solana has been locked in a well-defined range since February, with $89 acting as immediate resistance and $75–$78 as key support. While bulls have repeatedly pushed above $89, they have consistently failed to hold above the $92–$95 supply zone, where sell-side pressure quickly absorbs the move. This repeated rejection confirms that the area remains a strong distribution zone rather than a breakout level—at least for now.

sol price

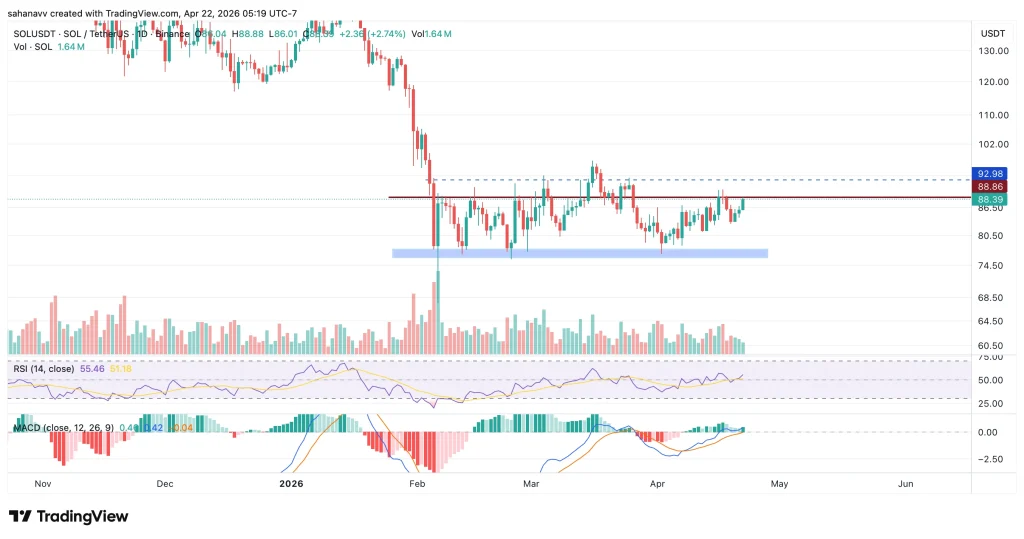
Currently, SOL is once again approaching this resistance, but this attempt shows slightly improved strength. Volume has picked up compared to recent sessions, indicating rising participation. At the same time, RSI is trending upward toward the mid-50s, suggesting building momentum without being overbought, while MACD is turning positive, signaling a gradual shift in buying pressure.

However, the key issue remains a lack of conviction. Despite improving indicators, the price is still trading below the critical breakout zone, and previous attempts have failed at similar setups. This keeps the probability of another rejection very much alive.

Key levels to watch:

  • Resistance: $92 → $95 → $98 (breakout confirmation zone)
  • Support: $82 → $75 (range low liquidity zone)

A clean breakout and hold above $95–$98 is required to confirm strength. Without that, this remains a range-bound market with repeated sell-offs at resistance.

Wrapping it Up!

Solana is at a decision point, but not a confirmed breakout. If bulls manage to flip $95–$98 into support, the next move could extend toward $105–$115 this month. However, failure to break this zone may lead to another rejection, with the SOL price likely rotating back toward $82 and potentially $75 before any sustainable trend emerges.

Is Aave Price About to Break Down? On-Chain Data Flashes Bearish Signs

Is Aave Price About to Break Down On-Chain Data Flashes Bearish Signs

The post Is Aave Price About to Break Down? On-Chain Data Flashes Bearish Signs appeared first on Coinpedia Fintech News

Aave has been under intense pressure following the recent KelpDAO exploit, which exposed vulnerabilities across the broader DeFi ecosystem. The attacker reportedly used a bridge-related flaw to mint fake collateral, borrow real ETH from Aave, and leave behind bad debt estimated at nearly $280 million. The impact was immediate—AAVE price, which was struggling to hold above $115, dropped sharply toward the $85 zone.

Now, even as price attempts a recovery above $93, the underlying signals tell a different story. Capital flows, exchange reserves, and protocol-level activity are no longer aligning with a typical recovery phase, raising concerns about the strength of this bounce.

So the question is, is Aave price simply reacting to short-term fear after the exploit, or is the data pointing to something deeper—like distribution and rising sell pressure?

On-Chain and DeFi Data Reveal Weak Recovery Structure

After the initial price shock, a closer look at both on-chain and protocol-level data reveals that Aave’s recovery may not be as strong as it appears. Exchange flows and DeFi activity are beginning to diverge from what is typically seen during a healthy rebound, raising concerns about whether this move has real strength or is simply a temporary reaction.

Exchange Inflows Spike as Sell-Side Pressure Builds

aave price

The exchange reserve chart shows a sharp spike in AAVE balances, climbing to nearly 2.39 million tokens in a short span. This kind of inflow usually indicates that holders are moving assets onto exchanges, often with the intent to sell. Historically, such spikes tend to precede increased volatility or downside moves, especially when not accompanied by strong demand. 

Capital Outflows Point to Fading Demand Strength

aave price

The DeFiLlama chart doesn’t just show TVL declining—it reflects a broader contraction across the protocol. Alongside TVL dropping, active loans are flattening/declining, indicating reduced borrowing demand. Treasury growth appears stagnant, suggesting limited value accrual, while USD inflows have weakened, pointing to lower fresh capital entering the ecosystem. 

The combination of rising exchange reserves and falling TVL creates a clear imbalance—supply is increasing while demand is weakening. This is not a typical recovery setup. While short-term bounces can occur, the current structure leans toward distribution and cautious sentiment rather than strong accumulation. Unless exchange reserves begin to decline and protocol activity stabilizes, any upside move risks being temporary, with downside pressure still firmly in play.

Aave Price Analysis: Structure Shows Weak Recovery 

Aave’s price action continues to reflect a weak and reactive structure rather than a strong reversal. After the sharp drop from above $115, the price attempted multiple recoveries but consistently faced rejection near the $100–$105 zone, which now acts as immediate resistance. The broader structure still shows lower highs and sustained selling pressure, indicating that buyers have not regained control.

aave price

On the downside, the $85–$90 range remains a critical support zone. Price recently swept liquidity below this level before bouncing back toward $93, but the recovery lacks conviction. Momentum indicators support this view—RSI is hovering around mid-levels (~45–50), showing no strong bullish momentum, while CMF remains negative, signaling that capital inflows are still weak.

The Bottom Line

Aave’s current setup reflects a clear mismatch between price attempts and underlying strength. While short-term bounces are occurring, rising exchange reserves, declining protocol activity, and weak price structure all point toward distribution rather than accumulation.

Unless AAVE price can reclaim and hold above the $100–$105 resistance with strong volume and improving on-chain signals, the path of least resistance remains uncertain, with downside risks still in play. For now, the data suggests that this is not a confirmed recovery, but a fragile consolidation phase where any breakdown could trigger another leg lower.

3 Altcoins That Are Showing Insane Performance This Week

This Altcoin Is Rebounding After Months of Compression—Are These Early Signs of a Bigger Move

The post 3 Altcoins That Are Showing Insane Performance This Week appeared first on Coinpedia Fintech News

The start of the week had been pretty volatile for the crypto markets, with the Rave DAO price losing over 98% of its value and a KelpDAO exploit that impacted the AAVE price. Regardless of this, the top tokens, Bitcoin and Ethereum, held their gains and have begun to rise. On the other hand, some of the altcoins have been performing exceptionally well, printing massive bullish candles in the past few days. Memecore, Binance Life & edgeX are among these altcoins, which are surging regardless of the market turmoil. 

Memecore (M) 

The Memecore price has been rising since the start of the month and has surged over 100% till now, with over a 22% jump in the past 24 hours. The rise seems to be driven by sustained momentum from recent network upgrades, the hard fork that slashed gas fees and improved transaction speeds. On the other hand, the main trigger for volume expansion was the overcrowded long positions in futures, with funding rates spiking by nearly 70%. 

memecore price

Memecore is currently in a strong breakout phase, but it’s approaching a decision point. Price has impulsively moved above the 0.5 Fib and even tapped into the 0.786–1.0 zone ($3.98–$4.73), followed by a rejection. The trend structure is bullish, and CMF staying positive confirms real inflows. As long as price holds above the $3.0–$3.2 zone (previous resistance turned support + trendline), continuation toward $4.7+ is possible. Lose that level, and this likely turns into a fake breakout with a pullback toward $2.5–$2.9 liquidity.

Binance Life (BINANCELIFE) 

Binance Life price has plunged by nearly 7% in the past 24 hours, while in the past seven days, the token has attracted over 56% gains. The surge is primarily driven by mentions of exchange listings like Binance, KuCoin or others. There has been no fundamental catalyst, and it is heavily relying on narrative, listings and hype. The rapid vertical moves do not appear to be stable, as these types of rallies usually end up in a liquidity grab, a sharp correction, or a long squeeze. 

binancelife price

Price has cleanly reclaimed the $0.30–$0.35 resistance as support and impulsively pushed into the $0.45–$0.50 zone, which previously acted as a rejection area. The structure is bullish with a clear higher-high expansion, and CMF rising sharply confirms real inflows. However, the move is overextended, with RSI in the 80–90 zone signaling exhaustion risk. As long as the price holds above the $0.40–$0.42 support band, continuation toward and beyond $0.50 remains possible. Lose that level, and this likely turns into a bull trap with a pullback toward $0.30–$0.35 liquidity.

edgeX (EDGEX) 

edgeX price is up by 4.88% to $1.45 in the past 24 hours, outperforming a broadly positive market, primarily driven by the recent token burn. Nearly 2.5 million tokens were burnt, and nearly 14% of the supply was locked, which has directly reduced the selling pressure and circulating supply. Besides, the token was recently launched, and these phases are known for violent moves, price discovery and thin liquidity effects. Recent trading sessions show massive volume spikes and price swings, which show slow accumulation. 

edgex price

EdgeX is currently trading inside a rising wedge structure, pushing toward a key resistance zone near $1.45–$1.50, where multiple rejections have previously occurred. The overall structure remains bullish with higher lows holding along the ascending trendline. Momentum is steady but not explosive—RSI around 60–62 shows strength without being overbought, while MACD signals the possibility of a bearish crossover. As long as the price holds above the $1.17–$1.18 support zone, continuation toward $1.65+ remains possible on a breakout. However, rejection from this resistance or a breakdown below the wedge increases the probability of a pullback toward $1.05–$0.95 liquidity zones.

Wrapping it Up

Across Memecore, Binance Life, and EdgeX, the common theme is liquidity-driven momentum, not stable accumulation. All three altcoins this week are pushing into key resistance after sharp moves, with RSI signaling late-stage strength. While triggers differ—leverage (Memecore), hype (Binance Life), and tokenomics (EdgeX)—the structure is the same: fast expansion and rising exhaustion risk. Continuation is possible if supports hold, but chasing here is risky, as any failure can lead to sharp pullbacks.

Ethereum Price Rises, But On-Chain Data Signals Weak Demand —What’s Next for ETH?

Glamsterdam and Hegota Upgrades

The post Ethereum Price Rises, But On-Chain Data Signals Weak Demand —What’s Next for ETH? appeared first on Coinpedia Fintech News

Ethereum price is trading at $2,307 with a modest rise of only 0.17% in the past 24 hours, while the volume decreases by nearly 19.5%, dropping below $16 billion. The second-largest token is showing some signs of recovery, but the underlying data raises caution. While price has rebounded from recent lows and is attempting to push higher, on-chain activity remains inconsistent, raising questions about the strength of the current move. 

This creates a divergence between ETH price action and network demand, often a key signal of a fragile trend.

Ethereum Active Addresses Show No Real Growth

Active addresses are one of the important indicators that measure the growth of the platform. On-chain data from Cryptoquant reveals that Ethereum’s active addresses remain volatile without a clear upward trend. While there are periodic spikes in activity, these surges fail to sustain, indicating that user engagement is not expanding meaningfully.

eth price

This divergence is pretty vital, as strong upswings are usually backed by consistent growth in network activity, but not isolated spikes. The current data suggests that while the network is stable, it is not attracting enough new demand to justify a sustained uptrend. In simple terms, usage is holding—but not growing.

ETH Price Faces Resistance Within Rising Channel

From a technical perspective, Ethereum is trading within an ascending channel, forming higher lows but struggling near key resistance. The price has repeatedly tested the upper boundary around the $2,400 region, where selling pressure continues to emerge.

The recent push higher lacks follow-through, suggesting that buyers are not aggressively stepping in at higher levels. This keeps the move in the category of a relief rally rather than a confirmed breakout, with the broader structure still in a corrective phase.

eth price

Momentum indicators also hint at slowing strength, with MACD heading for a bearish crossover, while the Gaussian channel remains bullish. This is a key divergence signal where the price is attempting to move higher without on-chain demand or technical confirmation. Therefore, the Ethereum price rally appears to be driven by liquidity rather than real accumulation, where the breakouts are not considered sustainable. 

Key Price Levels That May Define the Next Move

Ethereum price is sitting at a critical turning point where structure, momentum, and demand are all misaligned, making the next move highly reactive to key levels. If ETH manages to reclaim and hold above the $2,400–$2,450 resistance zone with strong follow-through, it opens the path toward $2,750 and potentially a retest of $3,000, where broader trend continuation can take shape. 

However, failure to break this region keeps the move corrective, and a rejection here increases the probability of a pullback toward $2,100, with a deeper sweep into the $1,900–$2,000 demand zone if selling pressure accelerates. Until resistance is flipped into support with conviction, the structure favors a fragile upside with downside risk still firmly in play.

XRP Price Struggles at a Key Resistance—Is a Breakdown Now More Likely?

Why XRP Price Is Falling Today—Can Bulls Defend $1 Support

The post XRP Price Struggles at a Key Resistance—Is a Breakdown Now More Likely? appeared first on Coinpedia Fintech News

XRP price is up 1.33% over the past 24 hours, trading near $1.44, largely tracking the broader market move and showing strong positive beta with Bitcoin. However, this upside remains reactive rather than structural, with price continuing to respect key resistance levels. Since the start of the month, XRP has largely moved sideways, failing to establish higher highs despite multiple attempts to break out.

This lack of follow-through highlights a market driven by external momentum rather than internal strength. Buyers are active, but not aggressive enough to reclaim supply zones, keeping the price capped below resistance. As a result, XRP remains in a range-bound structure with a bearish tilt, where rallies are being sold into rather than sustained.

Is XRP Price Losing the Momentum?

The daily chart highlights a clear range-bound structure, with XRP price trading between a well-defined resistance near $1.45 and support around $1.05. Price action has repeatedly tested the upper boundary but failed to sustain a breakout, reinforcing this zone as a strong supply area where sellers continue to dominate. The price continues to respect the descending trendline near the $1.48–$1.50 region, while the lower boundary is gradually rising from the $1.12 lows, creating a squeeze in price action.

xrp price

From a structural standpoint, the XRP price is trading below the 0.236 Fibonacci level around $1.42, which is acting as immediate resistance. The inability to reclaim this level keeps the upside capped, while repeated rejections from the descending trendline reinforce seller dominance. Momentum indicators remain neutral to slightly weak, with RSI hovering near mid-levels and CMF showing limited inflows, indicating a lack of strong buying pressure.

This type of compression typically leads to expansion. However, given the prevailing trend and repeated resistance rejections, the probability currently leans toward a downside break. A loss of the rising support could accelerate the move toward the $1.12 region, while only a clean breakout above the descending resistance would invalidate the bearish bias and shift momentum in favor of the bulls.

Wrapping it Up—XRP at a Key Turning Point

XRP’s recent strength lacks conviction, with upside moves appearing reactive rather than driven by sustained demand. Until buyers show clear follow-through, the market remains vulnerable to another downside rotation. Hence, keeping the path below $1.20 active while a rise above $1.50 could push the price above $1.61. 

Is Altcoin Momentum Fading: Why LINK, SOL, ALGO, SEI, and TAO Can’t Break Out Above Consolidation?

Is Altcoin Momentum Fading Why LINK, SOL, ALGO, SEI, and TAO Can’t Break Out Above Consolidation

The post Is Altcoin Momentum Fading: Why LINK, SOL, ALGO, SEI, and TAO Can’t Break Out Above Consolidation? appeared first on Coinpedia Fintech News

Altcoins have largely underperformed since the start of the year, failing to match the relative strength seen in Bitcoin and Ethereum. While BTC and ETH prices have managed to hold key levels and attract steady capital inflows, most altcoins remain stuck in range-bound structures, showing little follow-through on upside attempts.

This divergence highlights a market tilted toward majors, where liquidity continues to favor Bitcoin and Ethereum, leaving altcoins like LINK, SOL, ALGO, SEI, and TAO struggling to break past critical resistance levels.

Bitcoin at a Decision Point: Breakdown or Invalidation

The Bitcoin price is compressing within a bear flag, and the next move decides everything for altcoins. The structure shows repeated failures near $92K and $78K, keeping the trend tilted to the downside. This is not neutral—this is a setup waiting for resolution.

btc price

Scenario 1 (Bearish Continuation):

If Bitcoin breaks below the flag support, the structure confirms a continuation. This is where the real risk lies—historically, such breakdowns trigger 50% to 60% drawdowns across altcoins, as liquidity exits and risk collapses. In this case, LINK, SOL, ALGO, SEI, and TAO won’t just stay range-bound—they will likely see sharp downside expansion.

Scenario 2 (Bullish Invalidation):

The only shift comes if Bitcoin breaks out of the flag and reclaims the lost levels. A move above the range highs would invalidate the bearish setup and open the door for a broader market recovery. This is the trigger altcoins need—without it, they remain suppressed.

Altcoin Market Structure Hints at a Breakout

The broader altcoin market cap is compressing within a descending broadening wedge, a structure that typically precedes a bullish reversal. Currently, ETH/BTC is consolidating along the resistance of the wedge, hence indicating a critical shift where the price is no longer in a passive phase. 

ethbtc

A clean breakout above the resistance triggers expansion across altcoins, while a failure here leads to rejection and likely another move toward the lows. This is not accumulation at the bottom but building pressure at the resistance. Therefore, a breakout from here may initiate a strong altcoin run that may probably transform into an AltSeason. 

Conclusion: Altcoins at Resistance — Breakout or Another Leg Down

Altcoins are not recovering yet, but they are testing resistance. The broader structure remains fragile, and until a confirmed breakout occurs, the market stays tilted to the downside. Bitcoin’s bear flag adds to the risk, where a breakdown could trigger 50–60% declines across altcoins, reinforcing the current weakness.

At the same time, underlying data show early signs of accumulation, with rising user activity and institutional exposure building quietly. This creates a split market: weak price action vs. strengthening fundamentals.

The trigger is clear: if Bitcoin breaks down, altcoins likely follow with sharp losses, or if it invalidates the structure, altcoins can expand rapidly. Until that confirmation comes, this is not a recovery phase—it’s a decision zone.

Dogecoin Price Analysis: Is DOGE Primed for More Downside Risk This Month?

Dogecoin Price Today Jumps After Elon Musk Comment

The post Dogecoin Price Analysis: Is DOGE Primed for More Downside Risk This Month? appeared first on Coinpedia Fintech News

The Dogecoin price has been tightly consolidating below a pivotal resistance level since the start of the year, after breaking down from a structure. This could signal a potential bearish set-up, promoting more downside action, but in the long-term, potential remains bullish. New wallet addresses are still emerging, and institutional exposure, reflected in rising ETF balances, continues to build steadily.

This divergence suggests that while the short-term trend remains bearish, accumulation may be quietly taking place beneath the surface, setting up a potential shift in market dynamics if supported by stronger price confirmation.

Dogecoin Price Analysis: Bearish Structure Deepens Below Key Resistance

Dogecoin price continues to trade under pressure as the weekly chart confirms a clear shift from bullish momentum to a sustained downtrend.  The price broke the head and shoulder pattern and is yet to mark a bottom, which is somewhere around $0.4. Momentum indicators add to the downside bias. The Chaikin Money Flow (CMF) remains in negative territory, pointing to persistent capital outflows, while the RSI hovers below the neutral zone, reflecting weak buying strength.

doge price

Historically, similar breakdowns have resulted in sharp corrections of over 70%, and the current setup appears to mirror that pattern. If selling pressure continues, Dogecoin price could revisit the $0.07 level, with a deeper decline toward the $0.03–$0.04 range, levels last seen in early 2021, remaining a realistic scenario.

From a trader’s perspective, the structure remains bearish unless a clear shift occurs. A sustained reclaim above the $0.18 resistance zone, supported by rising volume and a move in RSI above 50, would be required to invalidate the current downtrend. Until then, rallies are likely to face selling pressure, keeping the broader outlook tilted toward further downside.

Top 2 Reasons Why Dogecoin Price Could Turn Bullish Despite Weak Structure

Dogecoin may be showing weakness on the charts, but the underlying data suggests a different story. Despite the downtrend, on-chain activity and institutional flows point toward quiet accumulation. This divergence raises the possibility that a bullish shift could emerge once the price structure begins to align.

Rising New Addresses Signal Fresh Demand Building

doge price

On-chain data shows periodic spikes in new Dogecoin addresses, indicating that new users continue to enter the network even during a downtrend. This is a critical early signal. Historically, phases where user growth persists despite falling prices often point to silent accumulation cycles, where smart money positions ahead of a trend reversal. While the price has yet to respond, sustained growth in new addresses suggests that underlying demand is not fading—and could eventually translate into upward momentum once selling pressure weakens.

Institutional Accumulation Through ETF Balances Is Increasing

doge price

Another strong bullish signal comes from the steady rise in Dogecoin holdings within US spot ETF structures. Despite the prolonged price decline, ETF balances continue to climb, reflecting consistent institutional accumulation. This divergence between price and accumulation is important: institutions typically build positions during weakness, not strength. If this trend continues, it could create a supply squeeze over time, supporting a stronger recovery once market sentiment shifts.

What This Means for DOGE Price

While the current price action remains bearish, these two factors highlight a growing underlying bid for Dogecoin. The market is showing early signs of accumulation beneath the surface, even as the chart structure lags. A shift in momentum, such as a breakout above key resistance, could quickly align DOGE price with these bullish on-chain signals, potentially triggering a stronger recovery phase.

Rave DAO (RAVE) Price Rebounds After Brutal Crash — Dead Cat Bounce or Real Recovery?

RAVE Token Crashes 95%

The post Rave DAO (RAVE) Price Rebounds After Brutal Crash — Dead Cat Bounce or Real Recovery? appeared first on Coinpedia Fintech News

Rave DAO’s collapse from around $28 to nearly $0.50 sent shockwaves across the crypto market. Concerns intensified after ZachXBT flagged extreme token concentration, likely fueling the token’s explosive 11,000% rally in under two weeks. The surge quickly unravelled, with RAVE plunging over 98% and erasing nearly $6 billion in market value as whales exited, triggering heavy selling pressure.

However, the price has since staged a sharp rebound. After closing above $1.20, RAVE price surged nearly 130% to an intraday high of $2.58, before settling around $1.65 at the time of writing.

Social Metrics Signal Speculative Activity

RAVE price action reflects a classic hype-driven cycle, in which a sharp surge toward the $28 level coincided with a spike in social mentions and engagement. Data from Lunar Crush shows mentions climbing above 422K, while sentiment remains relatively elevated at around 58%, even after the crash. This divergence suggests that while the price collapsed rapidly, market attention has not faded at the same pace. Such conditions typically indicate retail-driven momentum rather than strong fundamental backing, increasing the likelihood of volatile price swings.

rave price

Despite the steep decline, continued social activity is fueling short-term rebounds in RAVE price. Elevated engagement and persistent chatter often act as a catalyst for short squeezes and relief rallies, rather than sustainable uptrends. The current structure points to speculative participation dominating the market, with traders reacting to volatility instead of long-term conviction. 

Unless supported by stronger demand and improved market structure, the ongoing rebound risks losing momentum, reinforcing concerns of a potential dead cat bounce.

RAVE Price Analysis: Relief Bounce Faces Key Resistance as Momentum Weakens

The daily chart shows RAVE attempting a recovery after a near-vertical breakdown, but the structure remains fragile. The price has rebounded toward the $2–$2.50 zone, which now acts as immediate resistance after the sharp rejection from higher levels. This area aligns with the post-crash consolidation range, making it a critical supply zone. A failure to reclaim and hold above this region suggests the current move is more of a relief rally than a confirmed trend reversal.

rave price

Momentum indicators also signal weakening strength. The RSI has cooled off from overbought conditions and is now hovering below the bullish threshold, indicating fading buying pressure. Meanwhile, the MACD shows a bearish crossover with declining histogram bars, reflecting a slowdown in upward momentum. If RAVE fails to sustain above $1.20, the downside could extend toward the $0.70–$0.50 support zone. On the flip side, a strong reclaim above $2.50 with volume could invalidate the bearish outlook and open the door for a short-term push higher.

Conclusion: Dead Cat Bounce Likely—But Key Levels Decide What Comes Next

The current RAVE price action still leans toward a dead cat bounce rather than a true recovery. The rebound has been sharp, but it lacks structural strength and clear accumulation. The rejection near the $2.50 zone and weakening momentum indicators suggest the move is being driven by short-term liquidity rather than sustained demand. 

However, the bearish setup is not absolute. It will be invalidated if Rave DAO reclaims and sustains above $2.50 with strong volume, signaling genuine buying interest rather than a short squeeze. A higher high formation above this level could shift the structure toward a short-term bullish reversal, opening the path toward the $3.50–$5 range. Until that confirmation appears, the current bounce remains fragile and vulnerable to another leg down.

Bitcoin Holds Double-Digit Gains This Month Despite Volatility  — What’s Next for BTC Price?

Bitcoin Struggles at $70K

The post Bitcoin Holds Double-Digit Gains This Month Despite Volatility  — What’s Next for BTC Price? appeared first on Coinpedia Fintech News

While April has been one of the turbulent months for the crypto markets, it has been one of the stronger months for Bitcoin. The monthly returns of the star crypto have exceeded 10% for the first time in the past 10 months, mainly after undergoing 5 straight bearish months followed by a rebound in March. This time is no different. Despite a turbulent backdrop marked by DeFi exploits, including disruptions across AAVE, RAVE, and other protocols, the BTC price has continued to move higher. 

Price has rebounded sharply from recent lows near $65,000, climbing back toward the $75,000–$78,000 range, signaling underlying strength even as broader market sentiment remains fragile. What stands out is not just the recovery but the timing. Bitcoin often sees stabilization after a weak Q1, with momentum building into April and beyond. 

The key question now isn’t whether Bitcoin has recovered but whether this strength can extend into the coming weeks or if the current move is simply another phase within a broader volatile cycle.

Bullish Scenario for the Bitcoin Price Rally

Bitcoin is beginning to show signs of structural recovery after weeks of volatility. Following a sharp decline toward the $65,000 region, the price has steadily rebounded, now consolidating near the $75,000 zone. The chart highlights a clear shift from downside pressure to early recovery, but not a confirmed uptrend yet.

btc price

Bitcoin has printed a rounded base near the $63K–$65K region, followed by another higher low, indicating buyers are stepping in earlier on each dip. The price is holding above the range between $74,000 and $75,000 that has previously acted as support and resistance at different intervals. Besides, the rally has risen above the Gaussian channel, which is believed to flip bullish if it holds above the range. Moreover, the RSI remains incremental, which backs the bullish claim with an aim to reach $85,000 in the coming weeks. 

Bearish Scenario for the Bitcoin Price Rally

The Bitcoin price is moving within a rising channel, yet the recent rejection near the upper boundary signals exhaustion rather than strength, especially as momentum begins to fade. The MACD is curling toward a bearish crossover, suggesting that buying pressure is weakening, while the inability to decisively break above the $78,000 resistance reinforces the risk of a lower high forming within a broader downtrend. 

Besides, the Chaikin Money Flow (CMF) remains only marginally positive and lacks strong expansion, indicating that capital inflows are weak and not convincingly supporting the rally.

btc price

If this channel breaks to the downside, particularly with a move below the $72,000–$70,000 region, it would invalidate the recovery structure and likely trigger a deeper correction back toward the $65,000 zone. The current setup, therefore, leans less toward continuation and more toward a potential breakdown scenario, where the rising channel acts as a temporary relief rally rather than the start of a sustained uptrend.

What’s Next for the Bitcoin (BTC) Price Rally?

Bitcoin’s performance this month reflects a market that has absorbed significant stress yet continues to hold strength, with April’s historical trend still playing out. The rebound from $65,000 to the $75,000–$78,000 range highlights resilience, but the price structure suggests the move is still being tested rather than confirmed. The recovery has pushed BTC back into a key range, where upside attempts are now meeting visible resistance.

At the same time, the rising channel structure indicates that the current move could still be corrective rather than impulsive. Repeated hesitation near the upper boundary shows that buyers are not yet in full control, keeping the risk of a pullback intact. If the BTC price fails to sustain above the $75,000 region, the structure could weaken quickly, opening the door for a move back toward lower support levels near $70,000 and even $65,000.

❌