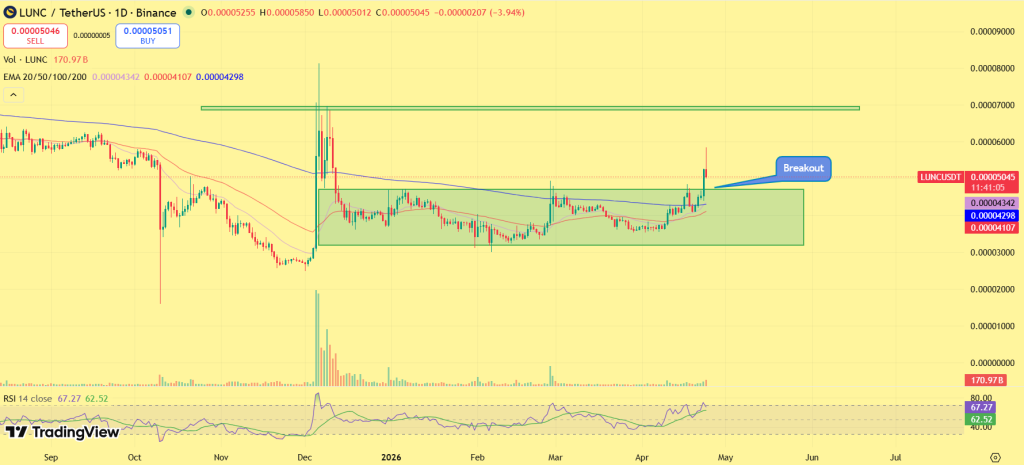
Terra Classic price is moving higher, with LUNC token clearing resistance and holding above its consolidation range for the first time in months. While previous attempts failed to sustain, the current move is showing early signs of acceptance, with price maintaining strength above the breakout zone.
Meanwhile, rising participation is beginning to support the shift. As the structure transitions into expansion, the window for confirmation is narrowing. With momentum building and resistance now behind, the focus shifts to whether this LUNC price breakout can extend into a larger move higher.
Breakout Holds as Terra Classic Price Transitions Into Expansion
While previous price action remained confined within a horizontal range, the current move has shifted Terra Classic price into a higher trading zone. As LUNC price cleared resistance, the former ceiling is now acting as support, with repeated holds confirming structural strength. Meanwhile, the absence of immediate rejection reinforces that the breakout is being accepted by the market. With higher lows beginning to form above the breakout level, the structure reflects controlled continuation rather than exhaustion.
As long as Terra Classic price holds above the $0.000045–$0.000048 region, the breakout remains valid, keeping the path open toward $0.000060 and potentially higher levels. However, a failure to maintain this zone would weaken the structure and pull LUNC price back into consolidation.
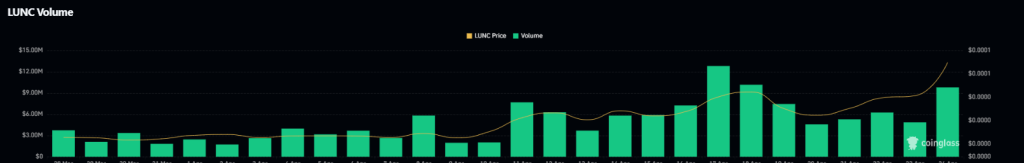
Participation Expands as Volume and Open Interest Surge
While price structure strengthens, derivatives data confirms that participation is returning to the market. As futures volume has surged significantly, rising over 500%, and open interest climbs above $12 million, activity is expanding rapidly. Meanwhile, this increase reflects traders positioning around the breakout rather than fading it.
With both volume and open interest rising together, the move is supported by engagement rather than isolated price action. However, sharp increases in participation can also introduce volatility if positioning becomes crowded, making stability above the breakout zone critical.
Narrative Momentum Returns as Market Attention Builds
While structure leads the move, broader narrative elements are beginning to support Terra Classic price. As discussions around token burns, exchange activity, and ecosystem upgrades regain traction, sentiment is gradually improving. Meanwhile, increased social engagement reflects renewed interest from market participants.
With narrative momentum aligning alongside technical strength, LUNC price is attracting attention beyond short-term trading flows. However, sustained continuation will depend on whether this attention translates into consistent demand rather than temporary spikes.
Final Words
As Terra Classic price continues to hold above its breakout zone, the structure remains aligned with continuation rather than reversal. While LUNC price maintains stability above reclaimed resistance, higher lows reinforce demand across the current range. Meanwhile, rising participation adds depth to the move, supporting further expansion.
With breakout confirmation in place and structure holding, the market is transitioning into a phase where continuation becomes the primary focus. With the foundation now established, the next move will be defined not by breakout, but by how effectively price builds on it.
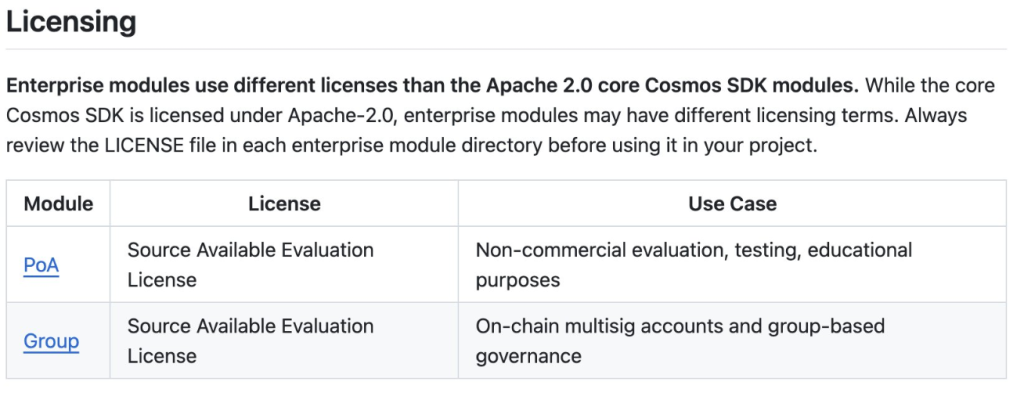
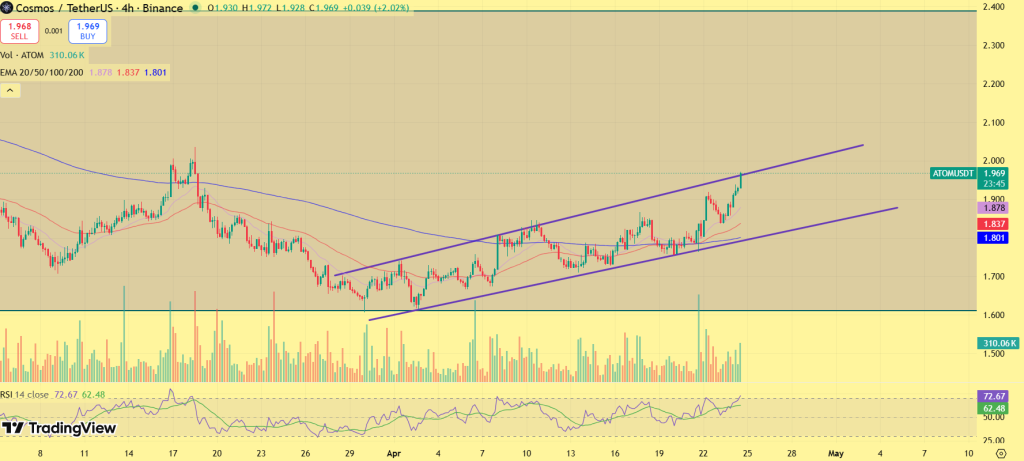
Cosmos price is stabilizing as it continues to hold within a rising structure, keeping the broader setup aligned with continuation. While recent ecosystem developments around Cosmos licensing signal a shift toward stronger internal value capture, ATOM price remains near $1.94, maintaining higher lows within an ascending channel. Meanwhile, price stability persists despite broader market noise, reflecting sustained demand.
As structure and narrative begin to align, the setup is moving beyond passive consolidation. With accumulation holding and trend support intact, the market is positioning for a directional move. With pressure building beneath resistance and higher lows continuing to form, the focus now shifts to whether ATOM price can break above $2 resistance, opening the path toward higher levels.
Ecosystem Shift Reframes Cosmos Price Positioning
While price action remains controlled, the underlying shift within Cosmos is beginning to reshape its positioning. As updated licensing terms restrict external commercial usage of key modules, the ecosystem becomes more internally aligned. Meanwhile, reduced value leakage strengthens the role of Cosmos-native assets.
With tighter control over value flow, Cosmos price begins to reflect a more structured foundation. As this dynamic continues to evolve, long-term positioning increasingly favors ATOM as a core asset within the ecosystem.
ATOM Price Outlook: Can Cosmos Price Surpass $2 Hurdle?
While fundamentals provide context, ATOM price is developing a technically consistent continuation structure. As price continues to respect the ascending channel, higher lows are forming across successive swings, signaling steady demand at elevated levels. Meanwhile, resistance is being tested gradually, without sharp rejection.
With price holding above short-term moving averages and trend support intact, the structure remains constructive. As long as the channel holds, continuation remains the dominant scenario. As a move above resistance confirms breakout acceptance, ATOM price could extend toward the $2.20–$2.50 range, where broader supply begins to emerge. However, a loss of channel support would weaken the structure and shift Cosmos price back into consolidation.
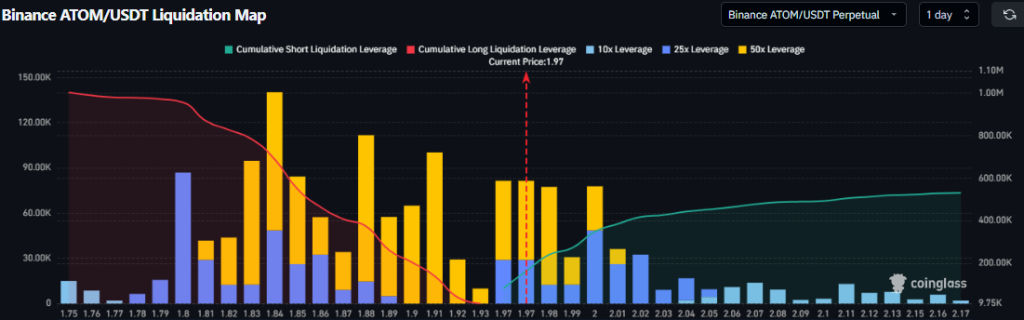
Liquidation Clusters Build Above as ATOM Price Pressures Resistance
While ATOM price continues to compress beneath resistance, liquidation data highlights where the next move could accelerate. As Binance liquidation maps show, dense clusters of short-side liquidity are building in the $2.00–$2.10 region, just above current price levels. Meanwhile, long liquidation exposure below the $1.80–$1.85 zone remains comparatively thinner, indicating limited downside pressure unless structure breaks.
With price holding near $1.95–$1.97 and gradually approaching resistance, this positioning creates a clear imbalance. As shorts continue to stack above current levels, any breakout into this zone could trigger a cascade of liquidations. As a result, upward movement is not solely dependent on spot demand, it is structurally supported by liquidity positioning. Once resistance begins to give way, these clusters can act as fuel, accelerating price toward higher levels. However, failure to sustain above the current range would shift attention back toward lower liquidity zones, delaying the breakout phase.
Final Words
As Cosmos price continues to align with evolving ecosystem dynamics, the broader structure remains constructive. While ATOM price holds within its ascending channel, consistent higher lows reinforce demand across the current range. Meanwhile, the convergence of structural strength and narrative support strengthens the case for continuation.
With resistance now in focus and pressure building within the trend, the next move is poised to define direction, alignment across structure and narrative, the next move is less about possibility and more about timing.
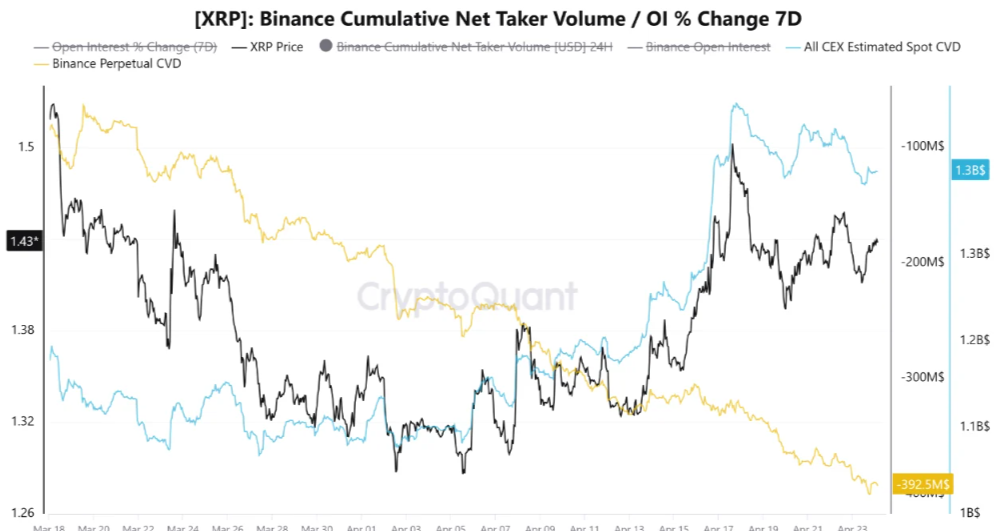
XRP price outlook is turning bullish as spot demand continues to expand, with price holding firmly above its demand zone, reinforcing a structure that is now tilting toward bullish continuation. While cumulative spot CVD has climbed to $1.39 billion, Binance perpetual CVD has dropped near -$392 million, reflecting growing short exposure across derivatives. Meanwhile, the coin price is holding steady near $1.43, with no signs of structural weakness.
As demand continues to absorb supply and short positioning builds, the divergence is no longer passive, it is shaping into a directional imbalance. With pressure building beneath resistance and support holding firm, the XRP price setup now hinges on a break higher, bringing $2 into focus.
Spot Demand Climbs While Shorts Lean In: Imbalance Starts to Build
While spot buyers continue to accumulate, derivatives traders are increasingly positioning against the move. As spot CVD has added over $300 million in recent weeks, real demand remains consistent across exchanges. Meanwhile, Binance perpetual CVD continues to trend deeper into negative territory, reflecting growing short exposure.
With long liquidations already clearing excess leverage earlier in the cycle, the market is no longer crowded on the bullish side. As funding conditions stabilize, positioning is shifting toward a healthier balance. This divergence is constructive. With demand strengthening and shorts building exposure, the market is forming conditions that typically support continuation rather than rejection.
From Demand Base to Breakout Pressure: XRP Price Structure Starts to Turn
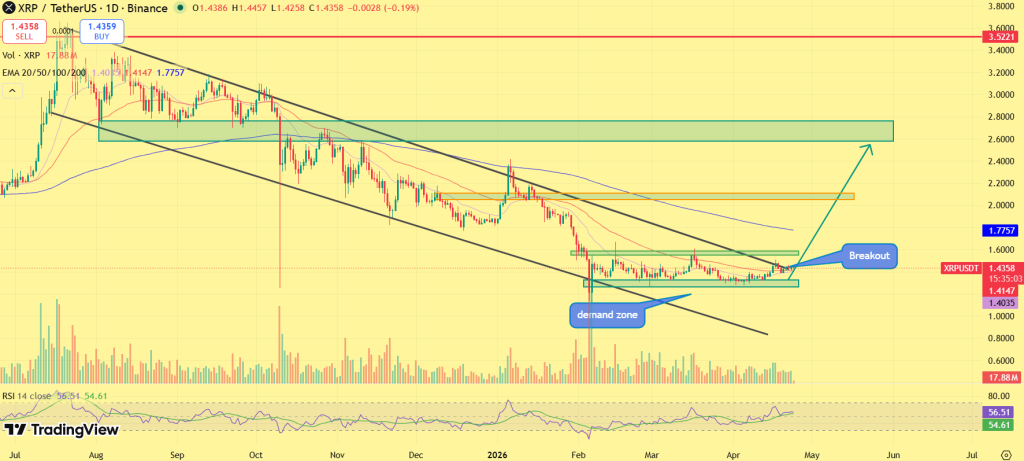
Following the extended decline within the descending channel, XRP established a base near the $1.30–$1.35 demand zone, where accumulation began to take shape. While the channel structure initially dictated direction, repeated support holds within this region confirmed that selling pressure was being absorbed. Meanwhile, price compression near the lower range signaled a gradual shift away from continuation lower.
As accumulation progressed, XRP transitioned into a tightening range beneath resistance, steadily building pressure toward breakout. With the latest move, XRP price is attempting to hold above this zone while aligning with short-term moving averages.
Currently, XRP is stabilizing near the 20-day EMA, which is beginning to flatten, reflecting a shift from downtrend to early expansion. While price continues to hold above $1.30 and maintain higher lows, the structure remains constructive. As a move above the $1.50–$1.60 region confirms breakout acceptance, continuation toward $1.80 becomes likely, with the $2.00 level emerging as the next major upside target. However, a loss of the $1.30–$1.25 region would weaken the structure and shift price back into consolidation.
Open Interest Picks Up Without Overheating: Positioning Turns Constructive
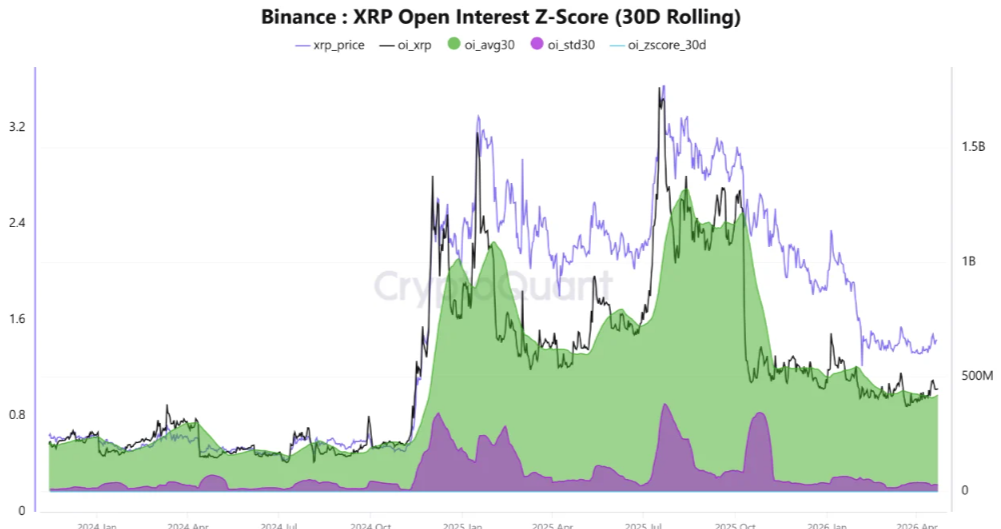
While the XRP price structure remains stable, derivatives participation is beginning to rebuild. As Binance open interest rises toward $449 million, now above its 30-day average near $420 million, positioning is gradually expanding. Meanwhile, the Z-score near 0.96 suggests that participation is increasing without reaching excessive levels.
With open interest building in a controlled manner, the market is reflecting gradual positioning rather than speculative excess. Meanwhile, the absence of extreme leverage reduces the likelihood of forced volatility disrupting structure. As participation continues to recover alongside price stability, the setup supports a constructive phase where positions are being built for continuation rather than short-term speculation.
All Eyes on Resistance as XRP Builds Toward Its Next Move
As XRP continues to hold above its demand zone, the broader structure remains aligned with accumulation rather than breakdown. While spot demand continues to expand and derivatives positioning remains skewed, the divergence is reinforcing a setup that typically resolves through expansion. Meanwhile, the lack of downside continuation strengthens the case for sustained support.
With structure stabilizing and pressure building beneath resistance, the path toward a higher move remains open. However, once resistance begins to give way, the move is unlikely to remain contained, bringing the $2 level into focus as the next major upside target.
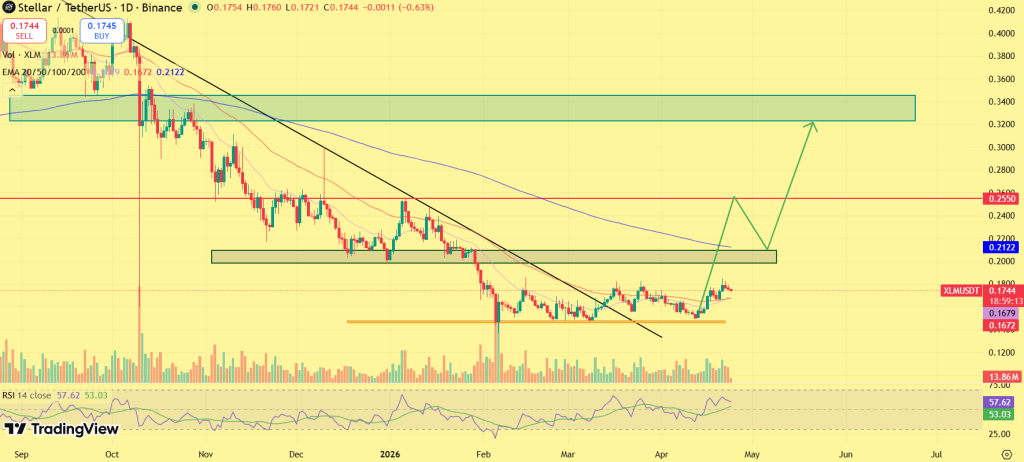
The live price of the Stellar crypto is $ 0.17552458
XLM is holding its $0.13–$0.16 demand zone, with a breakout above $0.30 and $0.50 needed to confirm a structural trend reversal toward 2026 targets.
If payment adoption and tokenization expand, Stellar could trend toward $2.50 by 2026 and potentially $5–$7 by 2030 in a strong cycle.
Stellar has entered 2026 at a critical inflection point, with price stabilizing after a prolonged downtrend while attempting to build a base near key demand levels. As a core player in cross-border payments, Stellar continues to expand its role in low-cost, high-speed financial infrastructure, supporting real-world transaction flows across global markets. With market structure tightening and downside pressure easing, the next phase will be defined by whether demand can translate into a sustained breakout.
In this Stellar (XLM) price prediction 2026, we examine key levels, structural shifts, and potential catalysts shaping its trajectory ahead.
Stellar is holding near the $0.17–$0.18 range after a prolonged corrective phase, but the recent price behavior suggests the market is beginning to stabilize rather than extend lower. The repeated defense of the $0.16 support zone indicates that selling pressure is no longer dominant, with buyers gradually stepping in to absorb downside moves.
At the same time, the structure is starting to shift. XLM has moved out of its extended descending pattern and is now trading in a tighter range, with price compressing just below the $0.18–$0.20 resistance zone. This type of consolidation typically reflects a transition phase, where the market builds momentum before attempting a breakout.
The next move now depends on confirmation. A sustained push above $0.20 would signal strengthening momentum, opening the path toward the $0.22–$0.25 range as the next phase of recovery. However, until this level is reclaimed, upside attempts are likely to face supply, keeping the price within a controlled range. On the downside, the structure remains relatively stable. As long as the $0.16 level continues to hold, the broader setup remains constructive. A breakdown below this zone would weaken the recovery outlook, potentially pushing price back toward lower support levels.
For April–May 2026, Stellar is expected to trade between $0.16 and $0.25, with a breakout above $0.20 acting as the key trigger for further upside.
Coinpedia’s Stellar (XLM) Price Prediction 2026
The broader structure for Stellar in 2026 reflects a market attempting to transition out of a prolonged downtrend, with early signs of base formation but no confirmed reversal yet. After a sustained decline marked by lower highs and persistent selling pressure, XLM has moved into a compression phase near its lower demand zone. This shift indicates that downside momentum is weakening while price stabilizes within a tighter range.
The next phase depends on reclaiming key resistance levels. The immediate barrier lies near $0.22, followed by stronger zones at $0.30 and $0.50. These levels act as structural checkpoints for recovery. A sustained move above $0.50 would signal a clear shift in market structure, opening the path for a broader expansion phase.
In this scenario, Stellar could advance toward the $1.20–$2.50 range over the course of 2026, supported by a step-by-step recovery across resistance zones. However, until these levels are reclaimed, the market remains in a rebuilding phase. A breakdown below $0.14 would invalidate the current base and delay recovery.
Stellar Crypto Price Prediction 2026 – 2030
Year
Potential Low ($)
Potential Average ($
Potential High ($)
2026
1.20
1.80
2.50
2027
1.80
2.40
3.20
2028
2.80
3.80
4.80
2029
4.20
5.30
6.20
2030
5.50
6.20
7.00
Stellar (XLM) Price Forecast 2026
In 2026, Stellar price could project a low price of $1.20, an average price of $1.80, and a high of $2.50.
Stellar Price Prediction 2027
As per the Stellar Price Prediction 2027, Stellar may see a potential low price of $1.80 The potential high for the Stellar price in 2027 is estimated to reach $3.20.
XLM Price Prediction 2028
In 2028, the Stellar price is forecasted to potentially reach a low price of $2.80, and a high price of $4.80
Stellar Price Targets 2029
Thereafter, the Stellar price for the year 2029 could range between $4.20 and $6.20.
Stellar (XLM) Price Prediction 2030
Finally, in 2030, the price of Stellar is predicted to remain steady and positive. It may trade between $5.50 and $7.00.
The long-term projection assumes Stellar sustains relevance in enterprise blockchain use cases, with growth moderating over time as the asset matures.
Year
Potential Low ($)
Potential Average ($)
Potential High ($)
2031
6.20
7.50
9.00
2032
8.00
10.00
12.00
2033
9.10
13.00
16.00
2040
25.00
50.00
80.00
2050
100.00
140.00
200.00
Stellar (XLM) Price Prediction: Market Analysis?
Year
2026
2027
2030
Changelly
$1.90
$2.50
$3.40
CoinCodex
$1.40
$2.70
$4.00
WalletInvestor
$2.00
$3.40
$4.40
Never Miss a Beat in the Crypto World!
Stay ahead with breaking news, expert analysis, and real-time updates on the latest trends in Bitcoin, altcoins, DeFi, NFTs, and more.
FAQs
What is Stellar (XLM) price prediction for 2026?
Stellar could trade between $1.20 and $2.50 in 2026 if it reclaims key resistance and adoption in payments and tokenization accelerates.
What is XLM price prediction for 2027?
XLM could trade between $1.80 and $3.20 in 2027 if adoption expands and broader crypto liquidity supports payment-focused blockchains.
How high will XLM go in 2030?
Under strong market conditions, XLM may reach $5.50 to $7.00 by 2030, driven by enterprise settlement growth and stablecoin usage.
How much will XLM be worth in 10 years?
Long-term projections suggest XLM could exceed $10 if institutional adoption scales, though outcomes depend on regulation and market cycles.
What is the XLM price prediction for the next bull run?
In the next crypto bull run, XLM could target the $0.80–$1.50 range initially. A sustained breakout above $1.00 may open upside toward $2.00+, depending on market liquidity and adoption momentum.
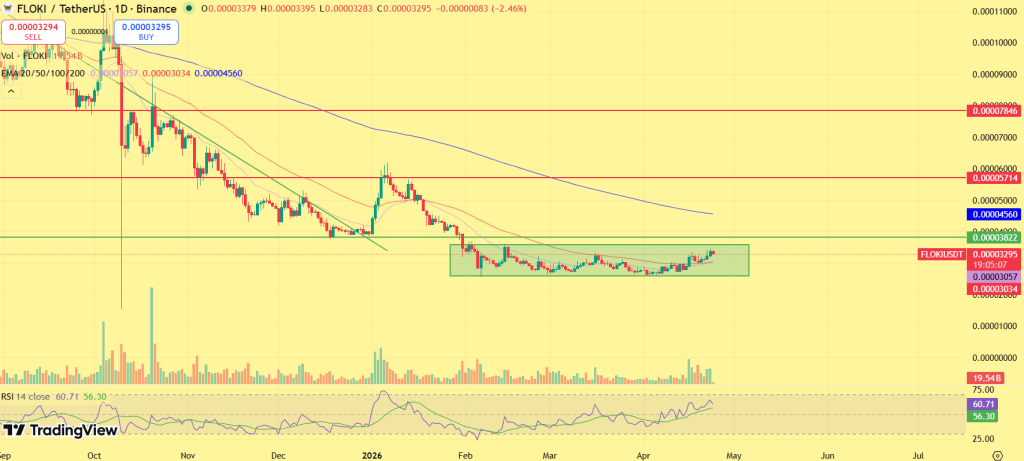
The live price of the Floki memecoin is $ 0.00003354.
FLOKI is stabilizing near key support after a prolonged downtrend, with consolidation signaling possible accumulation and a potential breakout into 2026.
Long-term projections suggest FLOKI could reach $0.00082 by 2026 and up to $0.0026 by 2030, driven by adoption, ecosystem growth, and market cycles.
Floki Inu has evolved from a purely meme-driven token into a broader ecosystem project, with growing focus on DeFi utilities, NFT integration, and metaverse development through initiatives like FlokiFi and Valhalla. While its core strength still lies in strong community backing and social traction, the project is gradually building additional layers of utility that aim to support long-term relevance.
The FLOKI token plays a central role within this ecosystem, facilitating transactions, governance participation, and access to various platform features. As ecosystem development continues and engagement remains strong, the project is attempting to transition from sentiment-driven spikes toward more structured growth. At the same time, price action is beginning to stabilize after a recent corrective phase, with early signs of consolidation emerging near current levels.
This shift has brought renewed attention to FLOKI’s potential for recovery, as the market looks for confirmation of a sustained move higher. For a deeper outlook, read Coinpedia’s Floki Inu price prediction 2026–2030.
In the near term, FLOKI is trading around $0.00003354, holding within a consolidation range after a recent pullback. The $0.000030 region continues to act as a short-term demand zone, where buyers are stepping in to absorb selling pressure.
Rather than extending lower, price is compressing beneath immediate resistance near the $0.000038–$0.000040 range. This behavior typically reflects a market preparing for a directional move, particularly in meme coins where momentum tends to accelerate once key levels are reclaimed.
The next move depends on breakout confirmation. A sustained move above $0.000040 would signal renewed strength, allowing FLOKI to push toward the $0.000055–$0.000065 region during April–May, where previous supply zones may come into play. However, without this breakout, the market is likely to remain range-bound as accumulation continues.
At the same time, downside remains defined. A breakdown below the $0.000030 support could weaken the structure, potentially pushing the price toward the $0.000025 zone before stabilization resumes.
Looking ahead to 2026, FLOKI’s trajectory will largely depend on market sentiment, meme coin cycles, and ecosystem development. Unlike purely speculative tokens, Floki has been working on expanding its ecosystem through utility-based initiatives, which could support long-term relevance.
From a technical standpoint, the first major recovery signal would be reclaiming the $0.00007–$0.00010 range, which marks a key historical resistance zone.
Once this level is secured, the token could move toward $0.00020, where stronger selling pressure may appear. If broader market conditions turn bullish and meme coins regain strong retail participation, FLOKI could build sustained momentum. In a favorable scenario, FLOKI could potentially reach around $0.00035 by 2026.
FLOKI Crypto Price Prediction 2026 – 2030
Year
Potential Low ($)
Potential Average ($
Potential High ($)
2026
0.000250
0.000535
0.000820
2027
0.000600
0.000800
0.00100
2028
0.000999
0.00124
0.00150
2029
0.00120
0.00159
0.00199
2030
0.00153
0.00203
0.00263
Floki Inu (FLOKI) Price Prediction 2026
Moving forward to 2026, the FLOKI price may record a maximum price of $0.000820. With a potential low of $0.000250, the average price could settle at around $0.000535
FLOKI Inu Coin Price Projection 2027
Looking ahead to 2027, the FLOKI crypto token may range between $0.000600 and $0.00100. With this, the average trading price could settle at around $0.000800 for the year.
FLOKI Inu Crypto Price Action 2028
In 2028, the FLOKI coin with a potential surge could reach a high of $0.00150, a low of $0.000999, and an average of $0.00124.
FLOKI Token Price Analysis 2029
Moving into 2029, the FLOKI coin could range between $0.00120 and $0.00199. Considering the buying and selling pressure, the average price could settle at around $0.00159.
Floki Inu (FLOKI) Price Prediction 2030
By 2030, the value of a single FLOKI token could reach a high of $0.00263, a low of $0.00153, and an average of $0.00203.
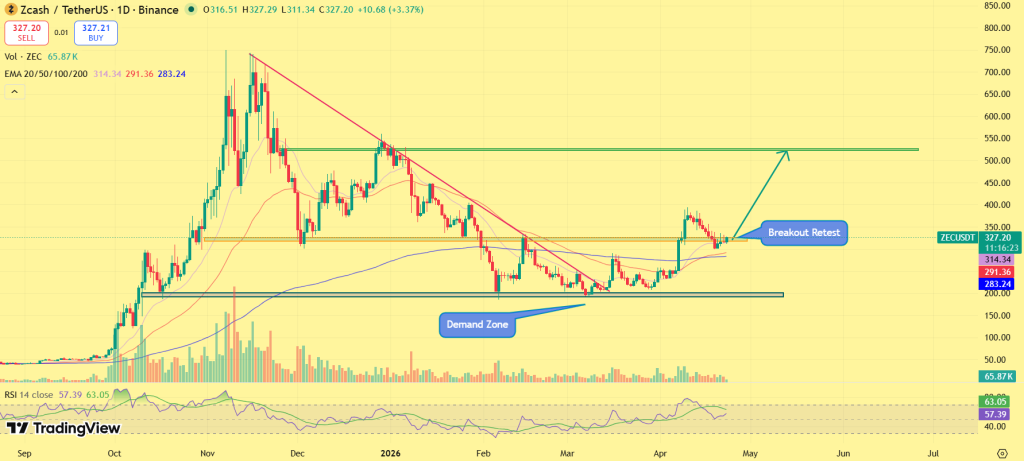
ZEC price is holding above the $300–$320 breakout zone, placing the market at a point where this structure now needs to confirm itself. While the retest continues near $322, higher lows are forming above the reclaimed range, keeping the structure intact. Meanwhile, downside follow-through remains limited, with no return into prior consolidation.
As positioning stays elevated above support, the absence of rejection keeps pressure tilted toward continuation rather than failure. However, this phase does not remain neutral for long, as breakout retests typically resolve into expansion or breakdown. With structure holding and demand building above the breakout zone, the setup is now shifting toward expansion, bringing the $450–$500 range into focus.
ZEC Price Structure Shifts from Trend Break to Expansion Setup
Following the break above the descending trendline, ZEC marked the first shift away from its prior downtrend, establishing a structural change in direction. While the initial breakout removed broader trend pressure, the formation of a double bottom near the $260–$280 zone confirmed a base where accumulation developed.
As accumulation progressed, ZEC moved into a range phase below $300, where price consolidated before expansion. With sustained buying pressure, the breakout above the $300–$320 range confirmed continuation, shifting the market into a higher timeframe bullish structure. Currently, ZEC is retesting the breakout zone while aligning with the 20-day EMA, which is now acting as dynamic support. While price remains above this level, the structure continues to hold, with higher lows forming into the retest.
As long as the 20-day EMA and the $300 zone remain intact, the breakout structure stays valid. Meanwhile, continued compression above this level keeps the setup aligned for expansion, with a move above $350 opening the path toward $420–$450, while the broader structure keeps $500 as the next major upside objective. However, a loss of the $300–$280 region would weaken the structure and shift price back into consolidation, delaying the higher high formation.
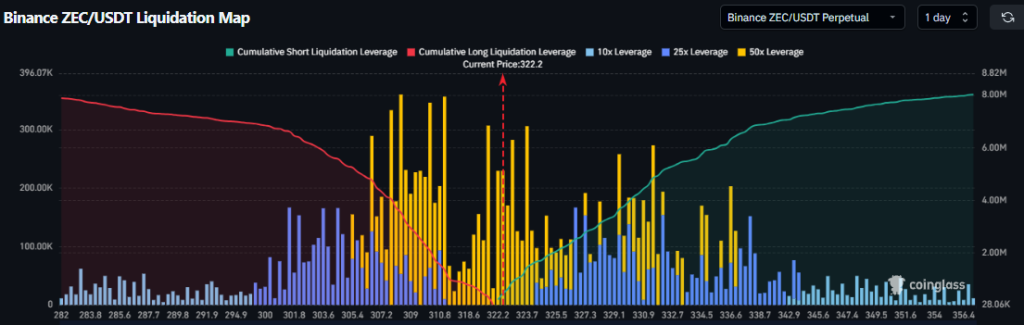
Liquidity Positioning Builds Above Current Range
While the Zcash price structure continues to hold, derivatives positioning is also aligning with the current setup. As liquidity clusters build above the $330–$360 region, potential trigger zones for upward movement are forming. Meanwhile, downside liquidity remains relatively thin below $300, reducing immediate pressure unless the structure breaks.
With short-side liquidity positioned above price, upward movement can accelerate once resistance is cleared, as liquidations begin to trigger. However, this dynamic remains dependent on price maintaining its current structure above support. As long as the breakout zone holds and liquidity remains stacked above, the setup continues to favor upside resolution.
Final Outlook
As ZEC continues to hold above the breakout zone, the structure remains aligned with continuation rather than failure. While support at $300 remains intact, repeated compression beneath resistance keeps pressure building toward expansion. Meanwhile, the absence of downside follow-through reinforces the strength of the current setup.
With structure, positioning, and momentum aligned, the path toward a higher high remains open. However, the next move now depends on whether the ZEC coin can convert this structure into expansion, bringing the $450–$500 range into play.
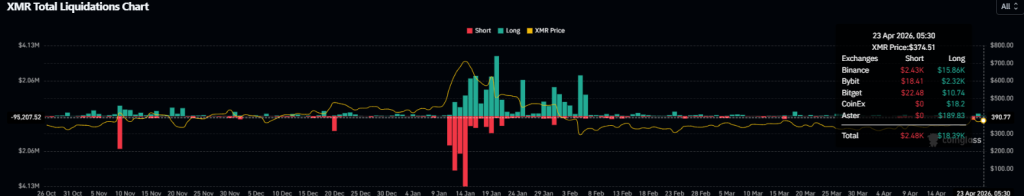
Monero price has returned to the $370–$400 zone that previously triggered a breakdown, but the reaction this time is not the same. XMR is trading near $370 and holding just below resistance without slipping back into the range. At the same time, more than $18 million in long liquidations have already cleared excess leverage from the market, removing the forced selling pressure that typically drives continuation lower.
The sequence stands out. The flush has already played out, yet price is stabilizing near resistance, with each pullback getting absorbed at higher levels. Everything now converges on this zone, where price behavior and positioning are aligned for a decisive move.
$18M Liquidation Flush Sets Up the XMR Retest
Monero’s move back toward $400 is coming after a full leverage reset in the market, not during it. Long liquidations exceeding $18M forced out overleveraged positions during the previous decline, removing the instability that often drives extended downside. Since that reset, liquidation activity has normalized, and XMR price action has shifted from reactive to controlled.
Open interest remains steady, indicating that positions are being rebuilt gradually rather than aggressively expanded. Participation is returning without imbalance, reducing the risk of forced moves and sudden reversals. XMR price is now testing resistance after the cleanup phase, which typically supports continuation rather than rejection.
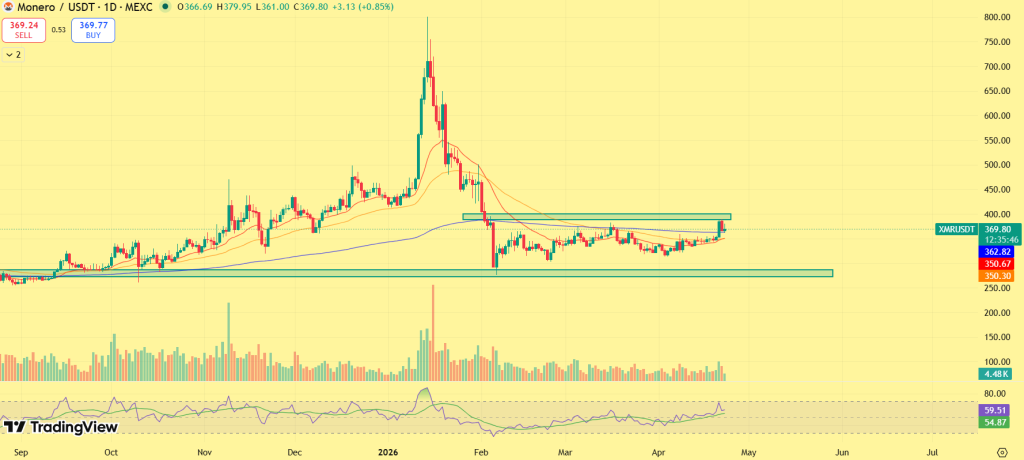
XMR Price Holds Below $400 as Breakout Pressure Builds
XMR price is trading directly beneath the $380–$400 resistance band while maintaining support above the $350–$360 range. The structure shows a sequence of higher lows, with each retracement getting absorbed earlier. This keeps price anchored near resistance instead of rotating lower, reflecting sustained demand at higher levels.
While, short-term moving averages are flattening and beginning to turn upward, supporting price without signaling exhaustion. Momentum is improving, but remains controlled, allowing the structure to tighten rather than overextend. There is no rejection at the level, as XMR price is holding where it previously failed, indicating that supply is being tested rather than defended.
As long as XMR price holds above $350, the structure remains constructive. A sustained move above $400 would confirm breakout acceptance and open the path toward $450–$480, while a breakdown below $350 would weaken the setup and expose $320.
$400 Now Defines the Next Move for Monero Price
Monero price is now positioned directly under resistance with a stable structure and reduced leverage risk. Support continues to hold at $350, while repeated tests of the $400 zone are increasing pressure on supply.
The market has not broken out yet, but it is no longer reacting with rejection. The setup is clear, the structure is intact, and price is holding at the level that matters. The next move now depends on whether $400 holds, or finally gives way.
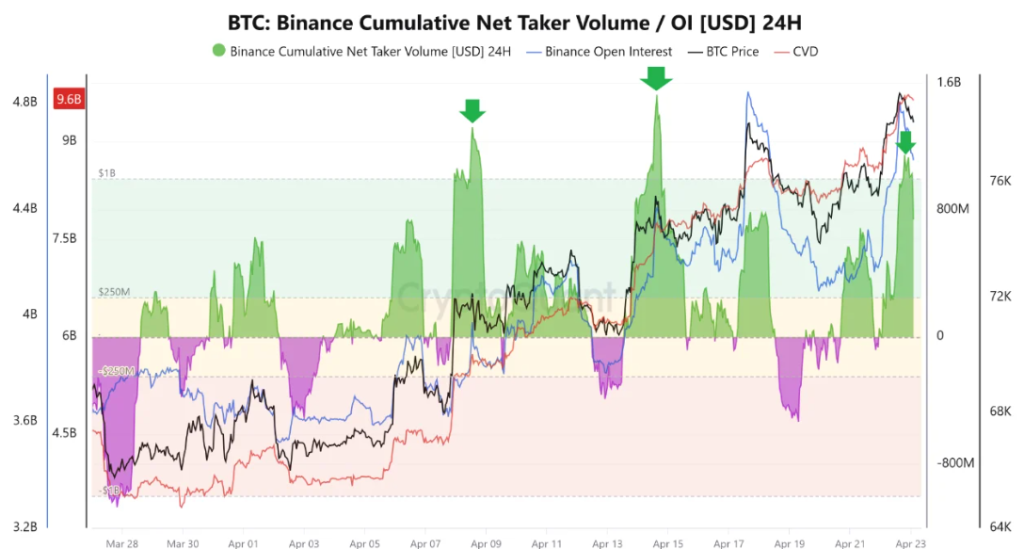
Bitcoin price has moved back above $78,000, with momentum supported by a clear return of aggressive buying activity. Binance net taker volume has crossed $1 billion for the third time this month, signaling that demand is coming from active market participants rather than passive positioning.
BTC price move is developing just below the $80,000–$82,000 resistance zone, where price is beginning to compress instead of pulling back. This behavior reflects strength at higher levels, as buyers continue to absorb supply near resistance. With demand building and structure tightening, Bitcoin is now positioned at a point where the next move is likely to be decisive rather than gradual.
$1B Buying Pressure Signals Strong Demand Return
Order flow data is providing a clearer picture of current market behavior. Binance net taker volume exceeding $1 billion on multiple occasions indicates that buyers are executing at market rather than waiting for retracements. This type of activity is typically associated with conviction-driven participation.
The repetition of these spikes is the key factor. Single instances can reflect short-term reactions, but sustained occurrences suggest that demand is consistently entering the market. Each surge aligns with Bitcoin holding or reclaiming higher levels, reinforcing the idea that buyers are supporting price strength rather than chasing extended moves. This shift reduces the likelihood of sharp downside continuation, as supply is gradually being absorbed instead of overwhelming demand.
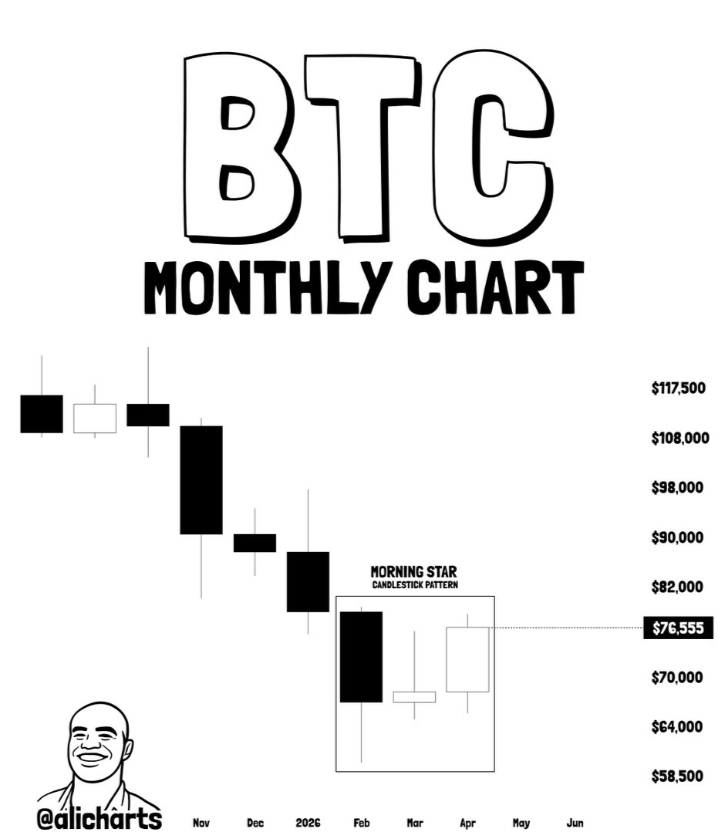
BTC Monthly Chart Shows Early Reversal Structure
On the monthly timeframe, Bitcoin is forming a Morning Star pattern, a structure that historically appears near the end of corrective phases. The pattern reflects three stages: sustained selling pressure, stabilization, and a recovery attempt.
The significance lies in the transition. The market is moving from a phase dominated by distribution into one where accumulation begins to form. This does not imply immediate upside continuation, but it signals that downside momentum is weakening. Previous cycles have shown that this phase often precedes broader expansion, though it typically involves consolidation before a sustained move develops.
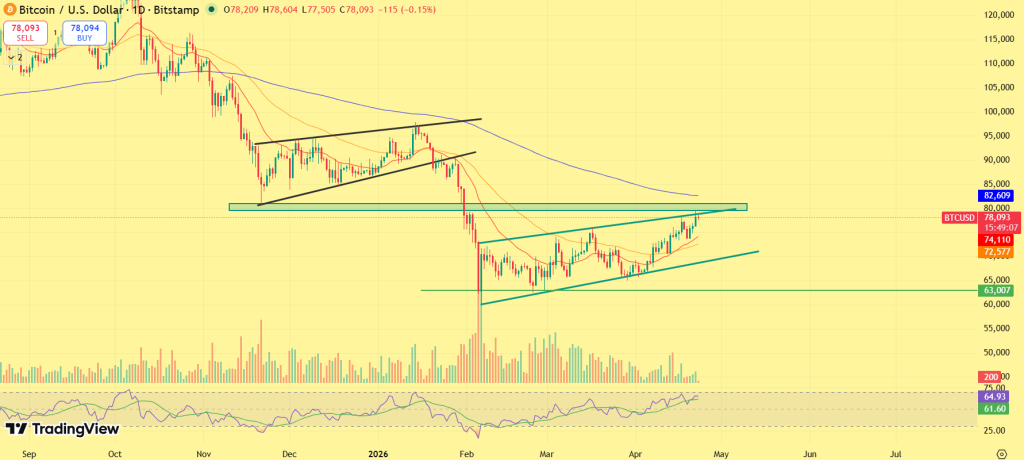
Bitcoin’s current structure is defined by compression below a key resistance band. After establishing a base near $63,000, price has formed a sequence of higher lows, gradually pushing toward the $80,000–$82,000 zone. This behavior reflects controlled strength. Instead of sharp upward moves followed by rejection, price is advancing steadily while holding gains. The absence of aggressive selling near resistance suggests that supply in this region is being tested and partially absorbed.
Moreover, the short-term moving averages are trending upward and supporting price action, reinforcing the shift in momentum. The structure indicates that buyers are maintaining control in the short term, even as the market approaches a critical level. A decisive move above $82,000 would confirm a breakout and shift the structure into a continuation phase, with higher targets coming into play.
Key Levels to Watch
The $75,000 level remains the immediate support, maintaining the current higher-low structure. The $80,000–$82,000 range acts as the primary resistance zone controlling short-term direction.
A breakout above $82,000 opens the path toward $88,000–$92,000, while a drop below $75,000 may extend consolidation toward $70,000.
Final Take
Bitcoin is transitioning into a phase where structure and demand are beginning to align. The coin is no longer reacting to downside pressure but is gradually stabilizing and building upward momentum. The key development is not the reclaim of $78,000 alone, but the behavior around resistance. Now, the BTC price is holding near highs, demand is consistent, and supply is being tested rather than dominating.
If this structure sustains, the probability shifts toward continuation. The next move depends on whether Bitcoin can convert this compression into a confirmed breakout above resistance.
The live price of the Near Protocol token is $ 1.42116228.
Price predictions for 2026 range from $3.70 to $11.80.
NEAR price may reach a high of $71.78 by 2030.
NEAR Protocol is a high-performance blockchain built to support scalable decentralized applications, with a strong emphasis on speed, low transaction costs, and developer-friendly infrastructure. Its growing presence in sectors like DeFi, gaming, and AI-integrated applications is steadily strengthening its position within the broader Web3 ecosystem.
The NEAR token plays a key role in this growth, powering transactions, staking, and overall network operations. As ecosystem activity and developer engagement continue to expand, the network is gradually building a more solid foundation for long-term adoption. At the same time, price action is beginning to stabilize after a prolonged period of downside pressure, with early signs of base formation emerging near current levels.
This shift has brought renewed focus on NEAR’s recovery potential, as the market looks for confirmation of a sustained move higher. For a deeper outlook, read Coinpedia’s NEAR Protocol price prediction 2026–2030.
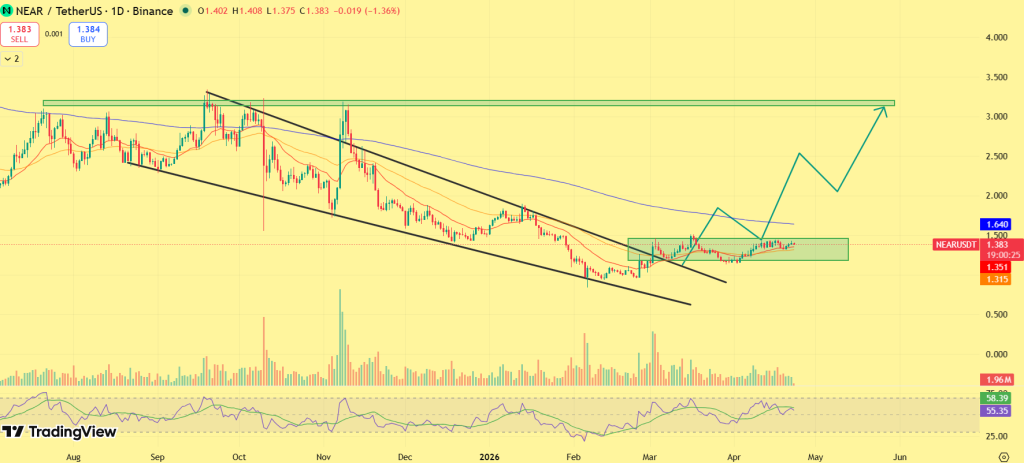
Building on its recent stabilization phase, NEAR is now approaching a decisive point where consolidation could transition into expansion. After holding firm within the $1.30–$1.50 demand zone, price action is beginning to show early signs of strength, with higher lows forming and volatility gradually compressing.
This structure typically precedes a directional move. The immediate resistance lies around the $1.60–$1.80 region, which has repeatedly capped upside attempts. A sustained breakout above this zone would confirm a shift in momentum, allowing NEAR to move toward higher liquidity areas around $2.40, followed by a potential extension into the $3.00–$3.20 range.
The move, however, is expected to unfold in phases rather than a straight rally. Initial breakout strength may be followed by short consolidation before continuation, as the market absorbs supply at each level. This aligns with the broader structure, where the asset is transitioning from accumulation into early recovery.
At the same time, confirmation remains critical. Failure to reclaim resistance could keep NEAR range-bound within the current structure, while a breakdown below $1.30 would weaken the setup and delay upside momentum. For April–May 2026, NEAR is expected to trade between $1.30 and $3.20, with a breakout above $1.60 acting as the key trigger for expansion toward the upper range.
Coinpedia’s NEAR Price Prediction 2026
NEAR’s broader trajectory in 2026 is shaping around a transition from accumulation into expansion, with both structural recovery and improving network activity beginning to align. After an extended corrective cycle, the market is now attempting to establish a long-term base, with price stabilizing and gradually shifting away from persistent downside pressure.
Historically, prolonged accumulation near lower levels often precedes stronger upside cycles, particularly when supported by growing ecosystem activity and improving sentiment. In NEAR’s case, continued development around AI-integrated applications, along with steady developer participation, is reinforcing its long-term positioning within the Web3 landscape.
The first confirmation of a broader trend reversal would come from reclaiming the $3.00–$3.50 region, which previously acted as a major breakdown zone. A sustained move above this level would indicate that the market is transitioning from recovery into expansion, opening the path toward higher supply zones.
As momentum builds, the focus shifts to higher targets. If NEAR successfully maintains higher lows and attracts consistent capital inflows, the price could gradually advance through key resistance levels, with intermediate phases of consolidation before continuation.
Under a sustained growth scenario, NEAR could reach the $8.00–$11.80 range by the end of 2026, driven by continued ecosystem expansion, improving market conditions, and confirmation of a long-term trend reversal.
Recent Developments / Catalysts for Near Protocol
Growing traction around AI-integrated blockchain use cases is strengthening NEAR’s narrative as an infrastructure layer for next-generation applications.
Continued developer activity and ecosystem expansion, particularly across DeFi and consumer-facing applications, is supporting long-term adoption signals.
Improving broader market sentiment and capital rotation into fundamentally strong mid-cap altcoins are creating a favorable backdrop for recovery-driven price action.
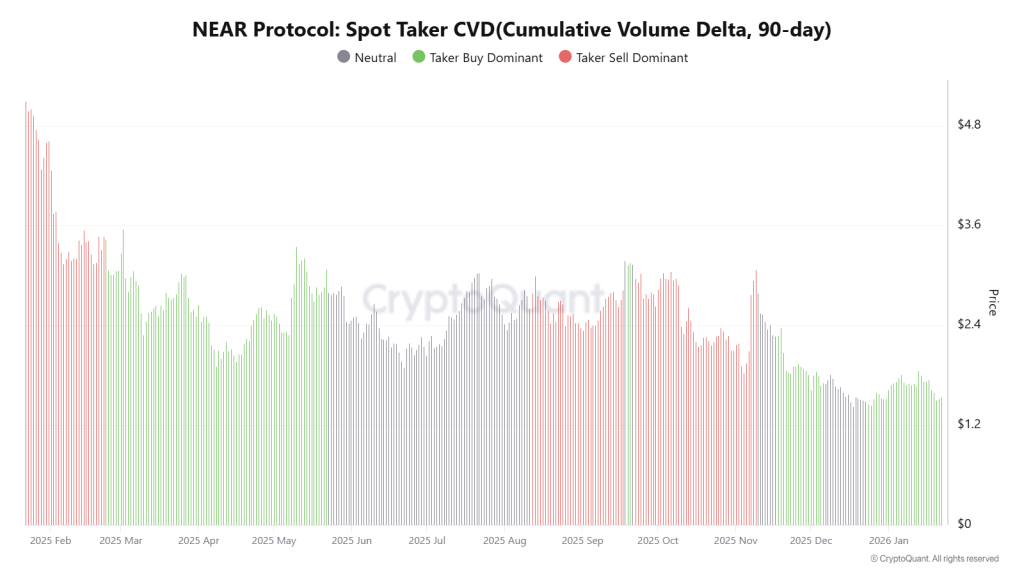
NEAR On-Chain Analysis
NEAR has officially entered a high-conviction Taker Buy Dominant Phase as of January 2026. The 90-day Spot Taker CVD flipping from neutral to green confirms that aggressive market buyers are now absorbing liquidity faster than sellers, signaling a major return of organic demand.
This bullish on-chain shift, bolstered by Grayscale’s recent spot ETF filing and a supply-tightening inflation cut, highlights growing institutional confidence. NEAR is currently building the structural momentum necessary to challenge key recovery targets near $2.00-$2.10.
Near Protocol Price Prediction 2026 – 2030
Year
Potential Low ($)
Potential Average ($)
Potential High ($)
2026
3.70
7.75
11.80
2027
5.32
11.80
18.28
2028
7.91
18.28
28.65
2029
12.06
28.65
45.24
2030
18.70
45.24
71.78
NEAR Crypto Price Prediction 2026
According to our analysts, Near Protocol’s price projection, the price could range between $3.70 and $11.80, with an average trading price of around $7.75.
Near Protocol (NEAR) Price Prediction 2027
Looking forward to 2027, NEAR’s price could range between $5.32 and $18.28, and an average forecast price of $11.80.
Near Protocol Crypto Price Prediction 2028
In 2028, the price of a single Near Protocol token could range between $7.91 and $28.65, with an average price of $18.28.
NEAR Price Prediction 2029
By the end of 2029, NEAR’s price could range between $12.06 as its low and $45.24 as its high, with an average trading price of $28.65.
Near Protocol Price Prediction 2030
In 2030, Near Protocol price may touch its lowest price at $18.70, hitting a high of $71.78 and an average price of $45.24.
What Does The Market Say?
Firm Name
2025
2026
2030
Wallet Investor
$3.19
$4.40
$22.30
priceprediction.net
$3.98
$5.92
$28.62
DigitalCoinPrice
$5.95
$6.93
$14.80
*The targets mentioned above are the average targets set by the respective firms.
Never Miss a Beat in the Crypto World!
Stay ahead with breaking news, expert analysis, and real-time updates on the latest trends in Bitcoin, altcoins, DeFi, NFTs, and more.
FAQs
What Is Near Protocol?
The protocol promotes the network of computers running a platform for developers to create and launch dApps.
How much is 1 Near Protocol Coin worth?
At the time of writing, the price of 1 NEAR was $ 1.42116228.
What is the NEAR price prediction for 2026?
NEAR price forecasts for 2026 suggest a range between $3.70 and $11.80, depending on adoption growth and market momentum.
What is the NEAR Protocol price prediction for 2030?
NEAR Protocol price prediction for 2030 points to a potential high near $71.78 if long-term adoption and ecosystem growth continue.
Is NEAR Protocol a good long-term investment?
NEAR offers long-term potential due to its scalable design, developer adoption, and cross-chain expansion, but price volatility remains.
What factors influence NEAR price the most?
NEAR price is driven by ecosystem growth, network activity, market liquidity, investor sentiment, and overall crypto market trends.
The live price of the AAVE token is $ 91.73164970.
Coinpedia’s forecast suggests AAVE may reach around $650 by 2026 if liquidity flows back into DeFi and adoption continues to expand.
Long-term projections indicate AAVE could potentially climb toward $2,500 by 2040 as decentralized finance infrastructure grows.
Aave (AAVE), a leading decentralized lending protocol, is currently trading within a defined range as both network fundamentals and price structure move into a stabilization phase. With consistent liquidity demand across DeFi markets and ongoing multi-chain expansion, the protocol continues to maintain its position as a core infrastructure layer within on-chain finance.
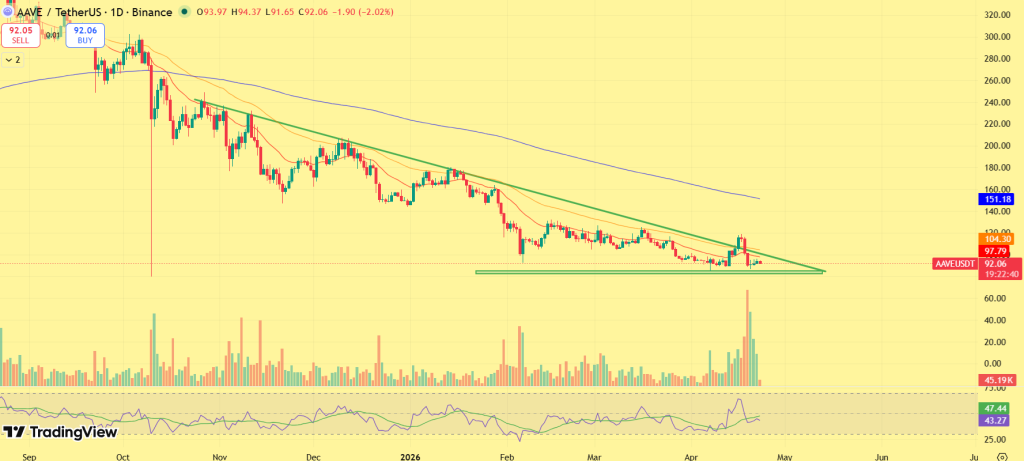
At the same time, Aave price action remains compressed around the $100 level, with AAVE consolidating for nearly two months while facing resistance near the $110–$120 range. This alignment of steady fundamentals and muted price movement suggests the market may be in a positioning phase rather than a confirmed trend. However, this raises a key question: is this prolonged consolidation signaling accumulation ahead of a breakout, or a lack of momentum to drive the next leg higher?
As 2026 approaches, the answer may depend on whether Aave can translate stable usage into renewed capital inflows and reclaim higher resistance levels. Read on as we break down Aave’s price prediction for April and the broader 2026 outlook.
AAVE’s structure has shifted meaningfully over the past sessions, with price action now reacting to a major DeFi shock rather than following a clean technical trajectory. After attempting to stabilize near higher levels, the asset faced a sharp breakdown as external protocol risk triggered a sudden loss of confidence across the market.
The impact was immediate. A liquidity disruption tied to an exploit-driven event created significant bad debt exposure within the Aave ecosystem, leading to aggressive withdrawals and a rapid decline in total value locked. This translated directly into price pressure, pushing AAVE back toward key support zones and invalidating its short-term bullish structure.
AAVE is now attempting to stabilize after the sell-off. AAVE price is consolidating near lower levels, indicating that the initial wave of panic selling is easing, but the recovery remains fragile. Unlike a standard accumulation phase, this setup is still reactive, meaning upside attempts require strong confirmation before continuation can be sustained.
The immediate focus now shifts to reclaiming lost resistance. A move back above the $110–$115 region would signal that the market is regaining confidence, potentially opening the path toward $125–$130. However, failure to reclaim this zone is likely to keep the asset range-bound, with recovery attempts facing consistent supply pressure.
For April–May 2026, AAVE is expected to trade between $90 and $130, with upside dependent on stabilization above $110. A breakdown below support could extend downside toward the $80–$85 region if risk sentiment weakens again.
CoinPedia’s Aave (AAVE) Price Prediction 2026
Looking ahead, Aave’s 2026 trajectory will be closely tied to the broader evolution of DeFi lending and liquidity conditions across the market.
From a macro standpoint, AAVE appears to be in a reaccumulation phase, with price consolidating despite steady protocol usage. This divergence suggests that while fundamentals remain intact, capital inflows have yet to fully return.
In a bullish scenario, where DeFi activity accelerates and borrowing demand increases, AAVE could move toward the $280 to $650 range, supported by renewed liquidity and ecosystem expansion. A base-case outlook assumes a gradual recovery in DeFi participation, positioning AAVE within the $230 to $450 range over the year. In a more conservative scenario, where market conditions remain subdued, AAVE may continue trading below $130, delaying a breakout despite stable fundamentals.
Recent News/Catalysts For AAVE
Negative Trigger
A major exploit-linked liquidity event created significant bad debt within the Aave ecosystem, triggering large-scale withdrawals and a sharp drop in confidence.
Total value locked declined rapidly as capital exited the protocol, reflecting short-term risk aversion across DeFi markets.
Recovery Drivers
Growing anticipation around Aave V4 is supporting long-term sentiment, with focus on improved liquidity efficiency and institutional readiness.
Selective accumulation at lower levels suggests that larger players are beginning to position after the sell-off.
Ongoing governance improvements aimed at strengthening protocol revenue distribution are reinforcing long-term value accrual.
Aave Crypto Price Prediction 2026 – 2040
Year
Potential Low ($)
Potential Average ($
Potential High ($)
2026
250
420
650
2027
320
550
780
2028
420
700
950
2029
520
900
1100
2030
650
1000
1300
2035
1250
1580
1800
2040
1920
2200
2500
Aave (AAVE) Price Forecast 2026
In 2026, the Aave price could project a low price of $250, an average price of $420, and a high of $650.
Aave Price Prediction 2027
As per the Aave Price Prediction 2027, Aave may see a potential low price of $320. The potential high for the Aave price in 2027 is estimated to reach $780.
Aave (AAVE) Price Prediction 2028
In 2028, the Aave price is forecasted to potentially reach a low price of $420 and a high price of $950.
Aave Crypto Price Prediction 2029
Thereafter, the Aave (Aave) price for the year 2029 could range between $520 and $1100.
Aave (AAVE) Price Prediction 2030
Finally, in 2030, the price of Aave is predicted to remain steady and positive. It may trade between $650 and $1300.
AAVE/USD Price Prediction 2035
In 2035, Aave’s price is projected to reach a low of $1,250 and could potentially climb as high as $1,800.
AAVE Price Forecast 2040
According to the Aave price forecast for 2040, the cryptocurrency could reach a low of $1,920, while its potential high is projected to be around $2,500.
Aave (AAVE) Price Prediction: Market Analysis?
Year
2026
2027
2030
Changelly
$620
$750
$1220
CoinCodex
$600
$720
$1320
WalletInvestor
$680
$800
$1400
Never Miss a Beat in the Crypto World!
Stay ahead with breaking news, expert analysis, and real-time updates on the latest trends in Bitcoin, altcoins, DeFi, NFTs, and more.
FAQs
What is Aave and how does it work in DeFi?
Aave is a decentralized lending protocol that lets users lend crypto to earn interest or borrow assets using collateral, all without banks or intermediaries.
Is Aave a good long-term investment?
Aave is considered a strong long-term DeFi project due to its large liquidity pools, multi-chain support, and continued protocol development.
What is Aave crypto price prediction 2026?
Aave could trade between $250 and $650 in 2026, depending on DeFi growth and liquidity returning to the market.
What is Aave price prediction 2030?
By 2030, Aave may range from $650 to $1,300 as decentralized finance adoption and multi-chain expansion continue.
How high can Aave coin go by 2040?
Aave’s price could potentially reach $2,500 by 2040 if DeFi infrastructure grows and user adoption strengthens.
What is Aave price prediction 2050?
While long-term forecasts are speculative, Aave could exceed $3,000 by 2050 if decentralized finance sees widespread global adoption.
THORChain is showing a clear shift in momentum as RUNE price pushes higher with a near 10% gain, backed by a sharp rise in network activity. The move follows a prolonged consolidation phase, where price remained capped despite repeated attempts to break higher.
Now, with volume rising across both on-chain and derivatives markets, the breakout is not just a price move, it reflects growing participation and positioning. The current setup places RUNE in a phase where continuation becomes the focus, as structure and activity begin to align.
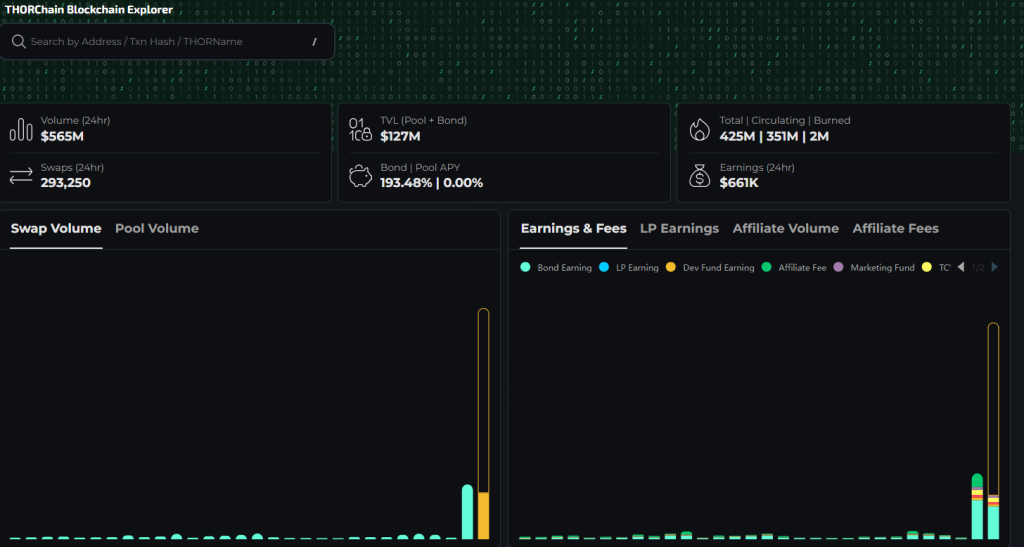
THORChain’s network data is reinforcing the recent move, with a noticeable increase in activity across key metrics. Daily swap volume surged to approximately $564.2 million, contributing to a broader $427 million in 24-hour volume, marking one of the strongest sessions in recent weeks.
Transaction count also picked up, reaching nearly 285,000 swaps, which signals a clear rise in user participation rather than isolated large trades. Protocol earnings climbed to around $653,000, reflecting strong fee generation and active liquidity usage across the network.
Despite the surge in activity, total value locked remains stable near $127 million, indicating that liquidity conditions have held steady while usage increased. This combination of rising volume and stable TVL suggests that the move is supported by genuine demand rather than short-term volatility.
THORChain (RUNE) Range Breakout Signals Transition Into Expansion
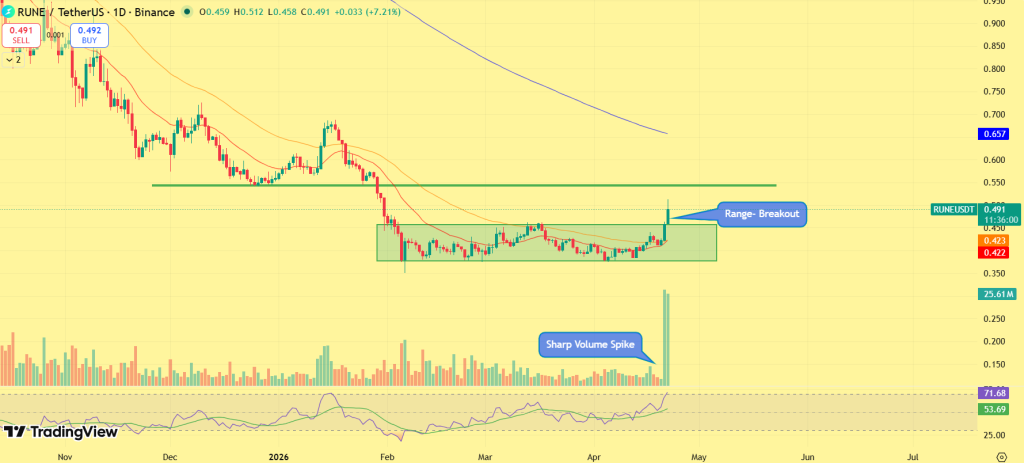
RUNE price has broken above the $0.42–$0.48 consolidation range that capped price for weeks, where repeated rejections confirmed strong supply. The current move shifts that structure, with price now trading near $0.49–$0.50 and holding above the range high, indicating that selling pressure in that zone has been absorbed.
The breakout is backed by a clear increase in volume, which adds strength to the move and reduces the chances of a false breakout. This kind of participation usually reflects active buying at resistance, rather than a slow drift higher.
A key technical shift is now visible, as the 20-day EMA has crossed above the 50-day EMA, confirming a short-term bullish crossover. This signal has been followed by a two-day rally surge, reinforcing that momentum is building rather than fading.
Now, RUNE is approaching the immediate resistance zone around $0.50–$0.52, which acts as the next decision area following the breakout. A sustained move above this region could open the path toward $0.60–$0.65, where previous supply zones exist.
On the downside, the breakout level between $0.46 and $0.48 becomes the key support range. Holding this zone is critical to maintain the current structure and confirm that the breakout remains valid.
Derivatives Data Confirms Fresh Positioning
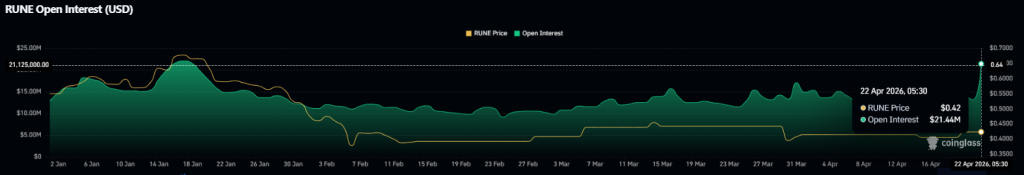
Derivatives data is aligning with the price structure, showing a clear increase in participation. Trading volume has climbed approximately 45.38% to $132.32 million, while open interest has increased by 17.02% to $22.27 million.
This rise in both metrics indicates that new positions are being built alongside the breakout, rather than the move being driven by short covering alone. The token is seeing fresh capital entering, which typically supports continuation if price holds its structure. Funding rates remain relatively balanced, suggesting that positioning is not yet crowded on one side. This keeps the setup stable and reduces the risk of immediate liquidation-driven reversals.
Final Words
RUNE is now at a continuation point where structure and momentum are aligned. Holding above the $0.48 support keeps the breakout intact, while a push above $0.52 can open the path toward the $0.60–$0.65 zone. As long as price sustains above the reclaimed range, the bias remains tilted toward further upside rather than a return to consolidation.
SEI has delivered a decisive move, rallying over 10% after breaking out of a prolonged downtrend. The shift comes after weeks of compressed price action where sellers maintained control through a series of lower highs. Momentum is now rotating as price structure, network activity, and derivatives data begin aligning. With the breakout confirmed and key resistance levels approaching, SEI price is entering a critical phase that could define its next directional move.
Network Activity Strengthens the Setup
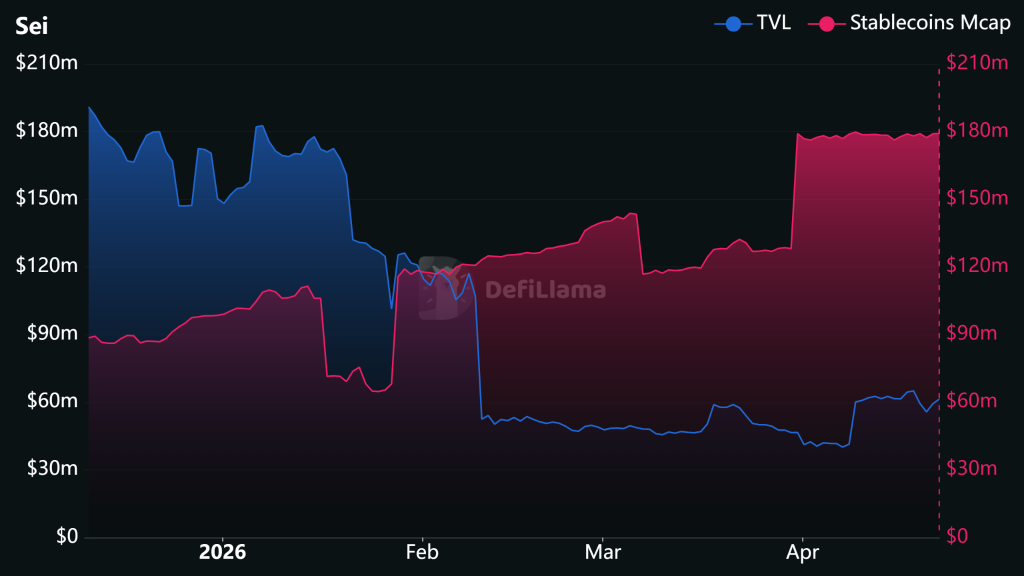
SEI’s network activity shows steady improvement, reinforcing the recent price action. Total Value Locked (TVL) has climbed to $61.44 million, reflecting consistent capital inflows into the ecosystem. Stablecoin market cap on the network stands near $180.11 million, with a 0.94% weekly increase, indicating stable liquidity conditions. USDY dominance remains elevated at 59.43%, highlighting concentrated liquidity within the system.
Daily inflows are approaching $922,835, while decentralized exchange volume is around $6.29 million, supported by perpetual volume of $22.68 million. The data suggests sustained activity rather than a short-lived spike.
SEI Price Structure Signals Early Trend Reversal
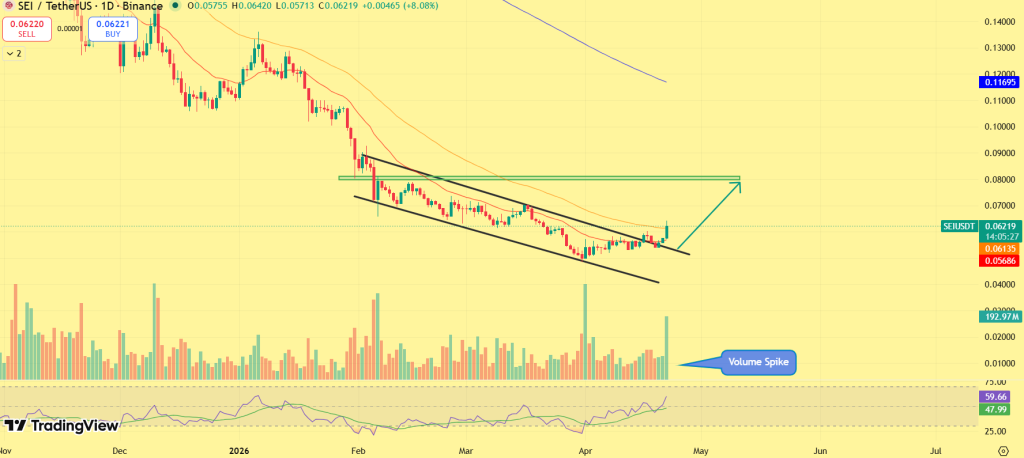
SEI has broken out of its falling channel, ending a multi-week downtrend that kept price locked in a sequence of lower highs. SEI price is currently trading near $0.061–$0.062, rebounding from recent lows around $0.055. The breakout confirms a structural shift as price moves above the descending resistance, signaling that bearish control is weakening. The 20 EMA has flipped below price, indicating that short-term momentum is now favoring buyers.
With a clear volume spike visible during the breakout, it confirms a strong participation and reduces the probability of a false breakout. RSI has recovered toward the 58–60 range, showing improving strength while still leaving room for continuation. The structure now suggests the formation of a higher low, replacing the previous downtrend behavior and signaling the early phase of a potential trend reversal.
Key Levels to Watch
SEI is now testing a key resistance band between $0.065 and $0.070, a zone that previously acted as supply and capped upside attempts. A sustained move above this range could open the path toward $0.085–$0.090, aligning with prior breakdown levels.
On the downside, the breakout zone between $0.055 and $0.058 becomes the critical support area. Holding this range is essential to maintain bullish structure and confirm continuation.
Derivatives Data Signals Growing Participation
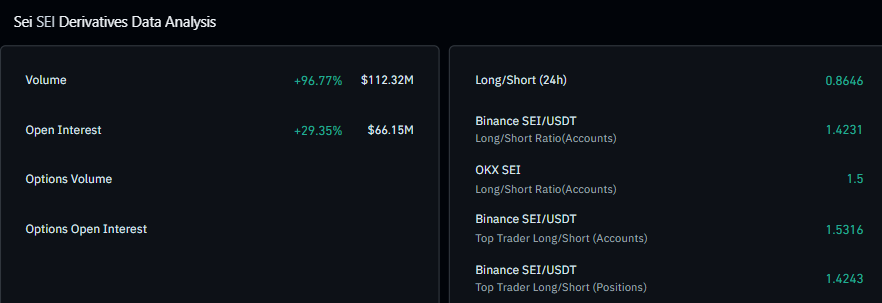
Derivatives data is reinforcing the strength of the move. Trading volume has surged to approximately $112.32 million, marking a 96.77% increase, while open interest has climbed to around $66.15 million, up 29.35%.
This rise in both volume and open interest indicates that new positions are entering the market, supporting the breakout rather than reflecting short-term covering. Funding rates remain relatively balanced, suggesting the rally is not overcrowded and still has room to expand. The current setup places SEI at a key inflection point where continuation could evolve into a broader recovery trend.
Solana’s price may appear stagnant, but the $85 zone is now turning into one of the most critical levels on the chart. After weeks of sideways movement, Solana price is holding firm near a key demand region while underlying developments continue to build. From shifting staking dynamics to expanding real-world use cases, the network is evolving even as price remains compressed.
This creates a growing divergence between price action and fundamentals, raising a key question: Is Solana (SOL) preparing for a breakout, or losing strength at a decisive level?
Staking Model Overhaul Reshapes Market Participation
One of the most important yet underpriced developments is Solana’s staking system upgrade. Previously, reward distribution heavily favored large holders. A wallet staking 5,000 SOL had nearly 5,000x advantage over a 1 SOL staker in reward probabilities. This created a system dominated by whales.
New: @Tramplin_io, a Solana staking app built around random reward distributions, has changed its rewards system to improve chances for smaller stakers. Under the old system, a wallet staking 5,000 $SOL had 5,000x the odds of a 1 $SOL staker in some draws. Under the new setup,… pic.twitter.com/4drxojFR6F
The new mechanism significantly reduces this imbalance. The advantage in large reward pools (Big Draw) has now been compressed to roughly ~70x, while smaller participants gain relatively higher chances. Additionally, the system introduces structural changes such as reduced draw frequency and more balanced reward allocation.
This is a critical shift. By lowering whale dominance and improving fairness, Solana is increasing participation at the retail level, an essential factor for long-term network strength and liquidity distribution. Such structural upgrades often precede accumulation phases, where fundamentals improve before price expansion follows.
$85 Becomes the Line That Defines Trend
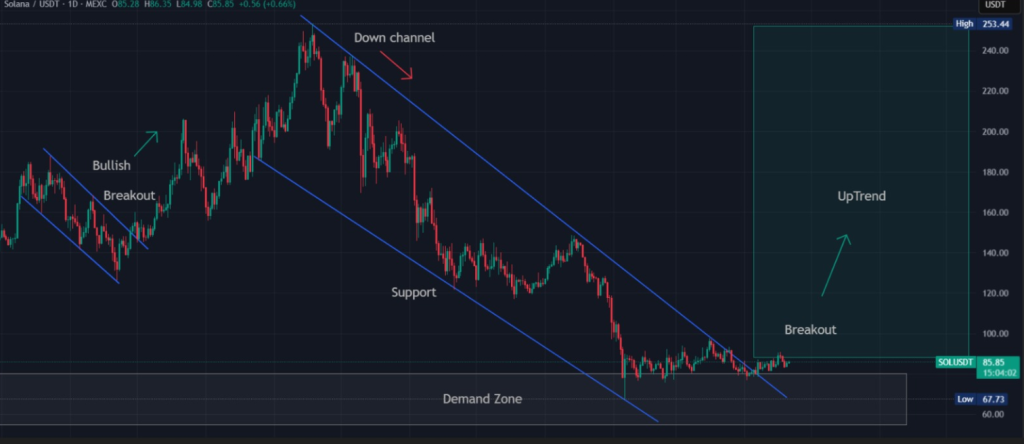
Technically, Solana has been trading within a descending channel, consistently printing lower highs and lower lows. However, the recent price action shows a shift. After tapping the lower boundary of the channel, SOL has stabilized inside a defined demand zone between $80 and $85, where buyers are actively defending downside. This behavior signals absorption of selling pressure rather than continuation of weakness.
The current structure suggests early signs of a potential base formation. A breakout above the channel resistance would confirm a trend reversal, opening the path toward higher levels. On the flip side, losing this zone would invalidate the setup and expose SOL to deeper corrections. At this stage, $85 is not just support, it is the pivot controlling the next directional move.
XRP Integration Signals Real Utility Expansion
Beyond internal improvements, Solana is rapidly expanding its external utility footprint. A recent demonstration showed XRP trading directly via WhatsApp, where a user swapped 0.1 SOL for 5.99 wXRP using a simple chat command. The transaction was executed through an AI-powered interface connected to a non-custodial wallet, routing trades via Solana’s DEX aggregators.
XRP TRADES ON WHATSAPP VIA SOLANA AS YAKOVENKO BOOSTS VIRAL DEMO
XRP is now tradeable through WhatsApp, with a viral demo today showing a user swap 0.1 $SOL for 5.99 wXRP through a chat command. The trade ran through solanaclawagent, an AI bot connected to a non-custodial wallet… pic.twitter.com/pLkg4WoHMK
By enabling trading through messaging platforms, Solana is moving toward seamless, real-world usability. The integration builds on the recent launch of wrapped XRP (wXRP) on Solana via LayerZero, expanding its accessibility across platforms like Raydium, Orca, Kamino, and MarginFi. With ecosystem leaders amplifying this narrative, the focus is shifting from speculation to utility, a key driver for sustained growth.
Key Levels to Watch
The $80–$85 zone remains the critical support, and as long as Solana holds above this range, the current accumulation structure stays intact. A sustained move above $95–$100 is needed to confirm strength, as this level acts as the breakout trigger that could shift momentum in favor of buyers.
If that breakout unfolds, the next area of interest comes in around $110–$120, where the first meaningful resistance and expansion phase is likely to emerge. However, a breakdown below $80 would weaken the structure and expose Solana to further downside, with $70–$75 becoming the next key support zone.
APT price prediction for 2026 suggests potential highs of $30.00
Long term forecasts indicate APT could reach $70 by 2030.
Aptos (APT) is a layer-one blockchain network developed to support high-throughput decentralized applications, focusing on scalability, security, and developer efficiency. Since its launch, Aptos has gained attention for its advanced architecture and Move-based smart contract environment. However, despite strong technological foundations, APT’s market performance has remained largely subdued following its initial speculative phase.
Throughout 2024 and 2025, APT experienced persistent price compression, with the token gradually stabilizing near multi-year support levels. While broader market sentiment remained cautious, recent technical structure suggests that APT may now be entering a prolonged accumulation phase. If historical cycle behavior repeats, 2026 could serve as the inflection point where long-term consolidation transitions into a renewed growth phase.
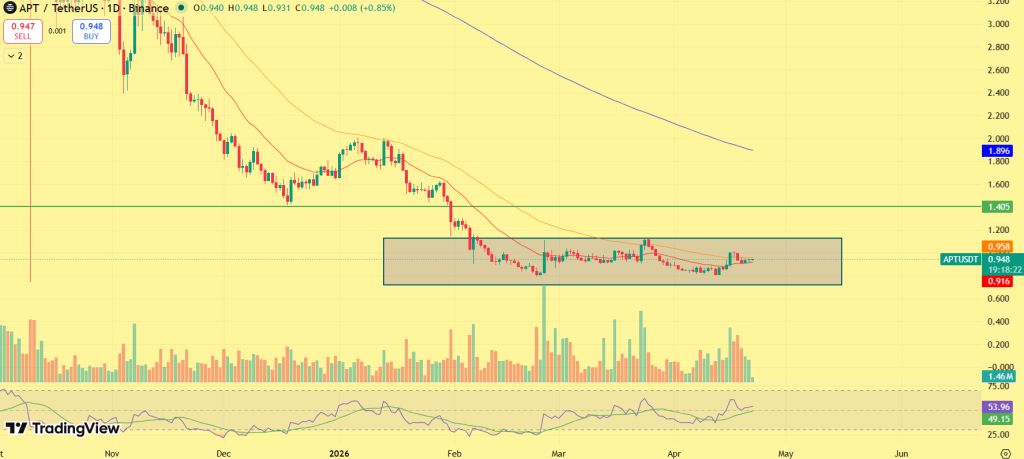
Aptos is currently trading around the $1.00 mark, but the structure tells a very different story beneath the surface. After a prolonged downtrend through late 2025 and early 2026, price has now shifted into a clear accumulation phase, holding within a tight $0.90–$1.10 range while volatility continues to compress.
This kind of price behavior is not random. It typically reflects a market where selling pressure has largely been absorbed, but conviction from buyers is still building. The repeated defense of the $0.90 zone suggests that demand is gradually stabilizing, while the inability to reclaim higher resistance levels indicates that momentum is still in its early stage.
Technically, APT remains capped below the broader descending structure, with the $1.10–$1.20 zone acting as the immediate breakout trigger. A decisive move above this region is required to confirm that accumulation is transitioning into expansion.
For April 2026, APT is likely to trade between $0.90 and $1.30, with upside potential toward $1.40 if breakout strength sustains above $1.20. Failure to hold the range, however, could push the price back toward the $0.80 support zone.
Coinpedia’s Aptos (APT) Price Prediction 2026
As 2026 progresses, Aptos is not in a momentum phase yet, it is in a rebuilding phase, where the market is slowly trying to shift from weakness into stability. After months of decline, APT is now holding near the $0.90–$1.00 region, which is acting as a base. This zone matters because it is where selling pressure has started to fade, and buyers are quietly absorbing supply. These phases usually don’t look exciting, but they often set the foundation for the next big move.
For the structure to improve, the first real signal would be a move back above $1.30–$1.50. That’s the area where the last breakdown happened, so reclaiming it would indicate that the market is no longer in a purely bearish phase. If that happens, the next stretch comes around $2.20–$2.80, where price previously struggled to hold. This zone will likely act as the first real test, whether the move is just a bounce or the start of something bigger.
A stronger shift only comes into play if APT starts holding above $3–$5. That’s where the structure begins to look healthier, with higher lows forming and confidence returning gradually. Once this phase is established, the market typically moves faster, as sidelined buyers start stepping back in. In a broader bullish setup, especially if the overall crypto market supports risk assets, Aptos could extend its recovery toward the $10–$18 range by late 2026. This wouldn’t be a straight move, but rather a step-by-step reclaim of lost levels. On the flip side, if APT fails to hold the $0.90 zone, the recovery narrative weakens. In that case, the price could slip back toward $0.70–$0.80, delaying the entire rebuilding process.
Overall, 2026 for Aptos looks less like a breakout year and more like a year of structure repair, and how well it reclaims key levels will decide how far it can actually go.
Recent Developments / Catalysts For Aptos
Introduction of tokenomics adjustments, including fee burn mechanisms, aimed at improving long-term supply dynamics.
Expansion of institutional-grade trading access, increasing liquidity and broader market participation.
Continued ecosystem growth across DeFi and applications, supporting real network usage and on-chain activity.
Aptos Crypto Price Prediction 2026 – 2030
Year
Potential Low ($)
Potential Average ($
Potential High ($)
2026
10.00
18.00
30.00
2027
13.00
25.00
40.00
2028
20.00
35.00
50.00
2029
24.00
40.00
58.00
2030
36.00
50.00
60.00
Aptos (APT) Price Prediction 2026
The Aptos price range in 2026 is expected to be between $10.00 and $30.00.
Aptos Coin Price Prediction 2027
Aptos could trade between $13.00 and $40.00 in 2027
Aptos (APT) Price Prediction 2028
In 2028, Aptos is forecasted to potentially reach a low price of $20.00. and a high price of $50.00.
APT Price Prediction 2029
Thereafter, the Aptos price for the year 2029 could range between $24.00 and $58.00.
Aptos Price Prediction 2030
Finally, in 2030, the price of Aptos is predicted to maintain a steady positive. It may trade between $36.00 and $60.00.
Based on the historic data and trend analysis of the cryptocurrency along with the market sentiments, here are the possible Aptos price targets for the longer time frames.
Year
Potential Low ($)
Potential Average ($)
Potential High ($)
2031
40.00
60.00
80.00
2032
45.00
78.00
97.00
2033
52.00
88.00
120.00
2040
80.00
120.00
200.00
2050
150.00
250.00
400.00
Aptos Price Prediction: Market Analysis?
Year
2026
2027
2030
Changelly
$26.80
$44.00
$55.00
DigitalCoinPrice
$33.00
$56.00
$68.00
WalletInvestor
$30.00
$45.00
$50.00
Never Miss a Beat in the Crypto World!
Stay ahead with breaking news, expert analysis, and real-time updates on the latest trends in Bitcoin, altcoins, DeFi, NFTs, and more.
FAQs
What is Aptos (APT) and what makes it different from other blockchains?
Aptos is a Layer-1 blockchain built for speed and security, using the Move language to support scalable, low-latency decentralized applications.
What is the Aptos price prediction for 2026?
APT price forecasts for 2026 range between $10 and $30, depending on market conditions, adoption growth, and overall crypto cycle momentum.
Can Aptos (APT) reach $65 by 2030?
APT could approach $70 by 2030 if network usage grows steadily, developers continue building, and broader crypto markets remain supportive.
Is Aptos a good long-term investment?
Aptos shows long-term potential due to strong technology and scalability, but like all crypto assets, it carries risk and requires careful evaluation.
Why has Aptos price remained under pressure in recent years?
APT faced price pressure from early speculation cooling, token unlocks, and weak market sentiment, leading to prolonged consolidation phases.