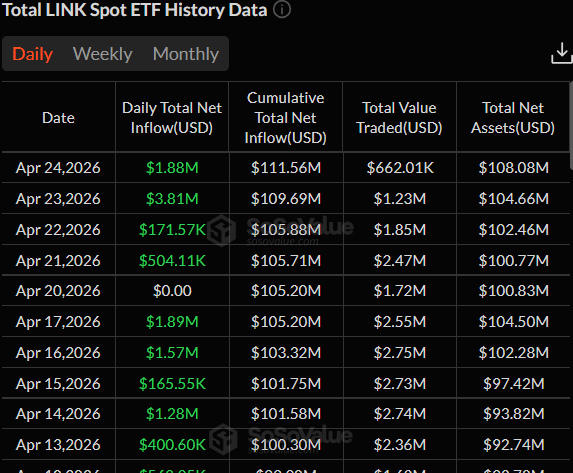
Chainlink is quietly attracting steady capital, with ETF inflows now crossing $111 million while price continues to hold firm near the $9.40 region.
Rather than a sharp breakout, the move is developing through consistent accumulation, with inflows building across multiple sessions. This type of steady demand tends to support structure over time rather than trigger short-lived spikes. With capital continuing to enter while LINK price stabilizes near highs, the current setup reflects underlying strength rather than exhaustion.
ETF Inflows Signal Sustained Institutional Demand
Recent data shows a clear trend in capital allocation toward Chainlink. Daily inflows have remained consistently positive, with $3.81M recorded on April 23 and $1.88M on April 24, pushing cumulative inflows to approximately $111.56M.
At the same time, total net assets have expanded beyond $108M, reflecting continued capital retention within the product. Instead of isolated inflow spikes, the data shows repeated accumulation over consecutive sessions. That suggests ongoing positioning rather than opportunistic entry. As inflows continue to build without sharp reversals, it reflects confidence in holding exposure rather than rotating out quickly. This type of behavior typically supports gradual price stability and longer-term structure development.
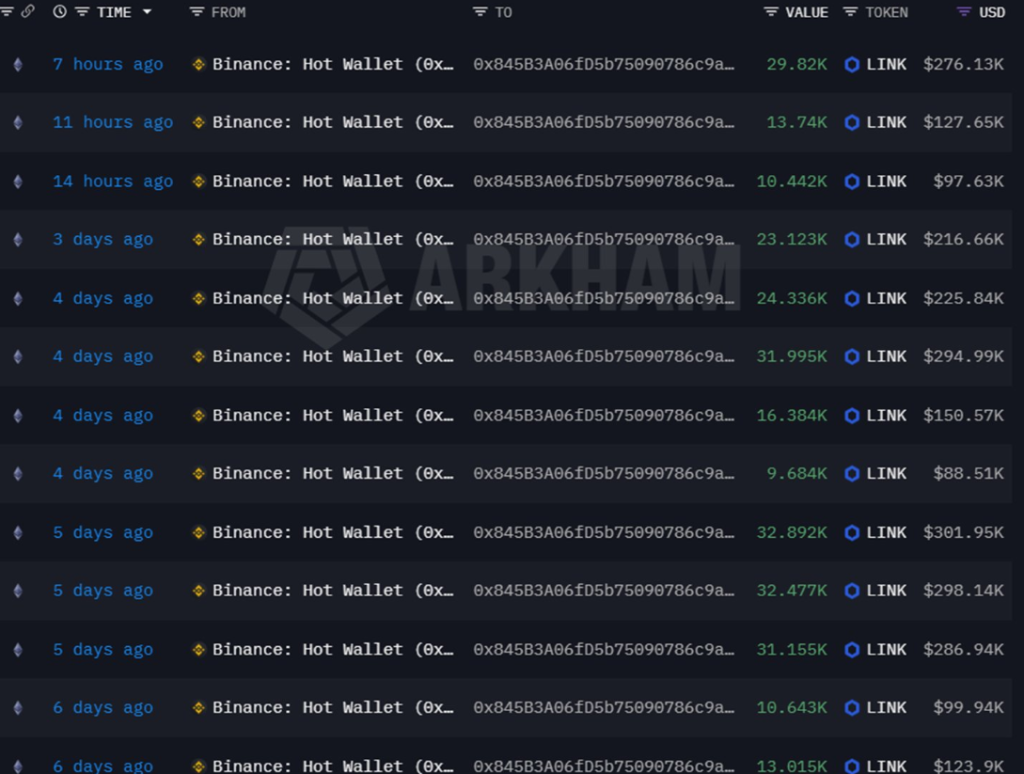
Whale Accumulation Builds as Supply Continues to Be Absorbed
Alongside ETF flows, accumulation from larger players continues to build beneath the surface. A long-term investor wallet has accumulated nearly 2.8 million LINK (≈$2.59M) over the past six days, with entries concentrated around the $9.25 region. The activity remains ongoing, indicating that positioning is still in progress rather than completed.
At the same time, the Chainlink Reserve has added over 123,000 LINK (~$1.1M), taking total holdings beyond 3.3 million LINK. This introduces protocol-level demand alongside external capital inflows. However, upside remains measured. The 19 million LINK unlock from early April continues to act as an overhead supply layer, with the market still working through that liquidity.
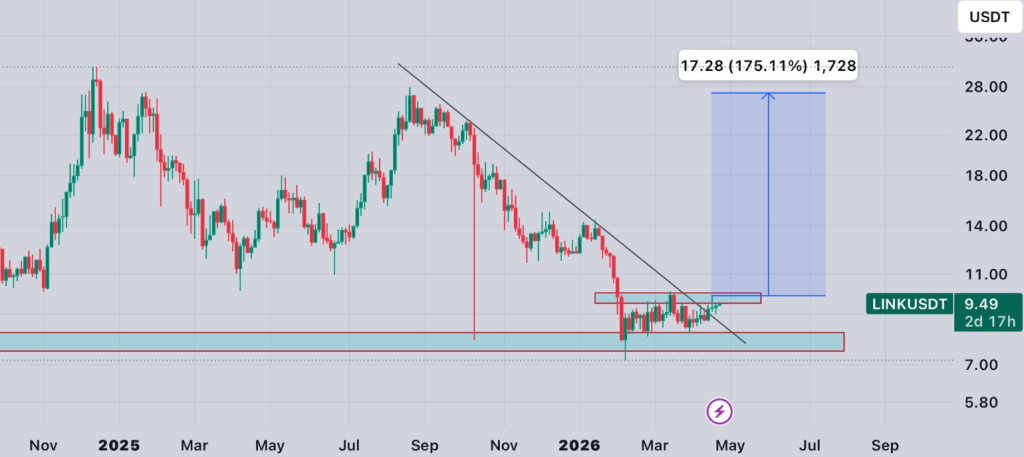
Chainlink Price Analysis: Structure Builds as LINK Holds Above Key Zone
After an extended period of consolidation, the structure around the $9.00 region has continued to hold without breakdown, establishing it as a stable base. From there, upside attempts have started to expand, with price pushing toward the $9.40 region while maintaining higher lows within the current range. Pullbacks have remained controlled, failing to break back into lower zones, which indicates that buyers are defending levels rather than reacting late.
Meanwhile, the range is tightening just below local highs, suggesting that the market is stabilizing rather than rejecting the current levels. There is no aggressive expansion or exhaustion behavior, keeping the move orderly. As long as the structure continues to hold above the $9.00–$9.20 region, the current flow remains intact. This keeps the path open toward the next resistance band near $10.20–$10.50, where the market is likely to test supply. A shift below this base would change the structure back into consolidation, but current behavior continues to favor stability with gradual upside pressure.
Final Outlook
With ETF inflows continuing to build and structure holding above key support, Chainlink remains positioned for gradual upside as long as current levels are maintained. While immediate expansion may remain measured, sustained inflows and stable positioning keep the path open toward higher resistance zones, with continuation dependent on holding the established base.
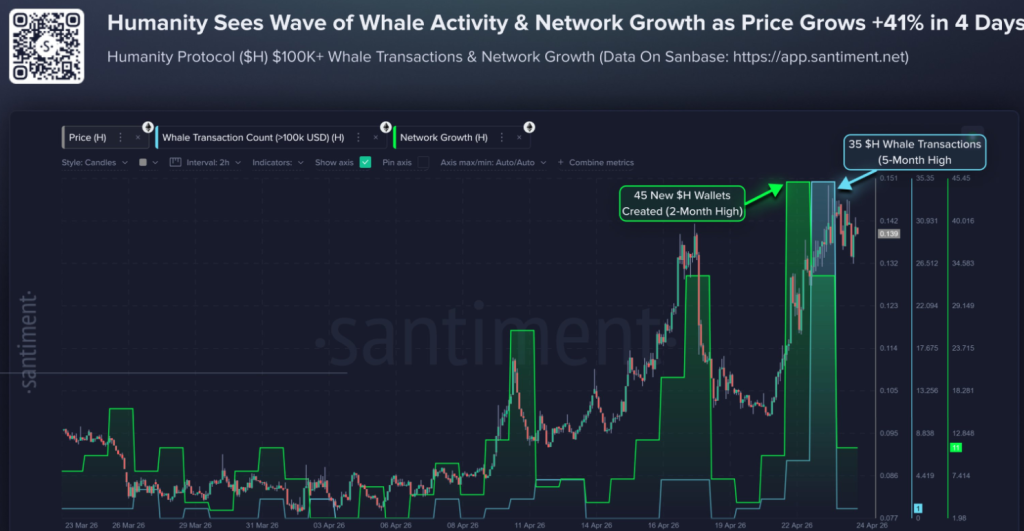
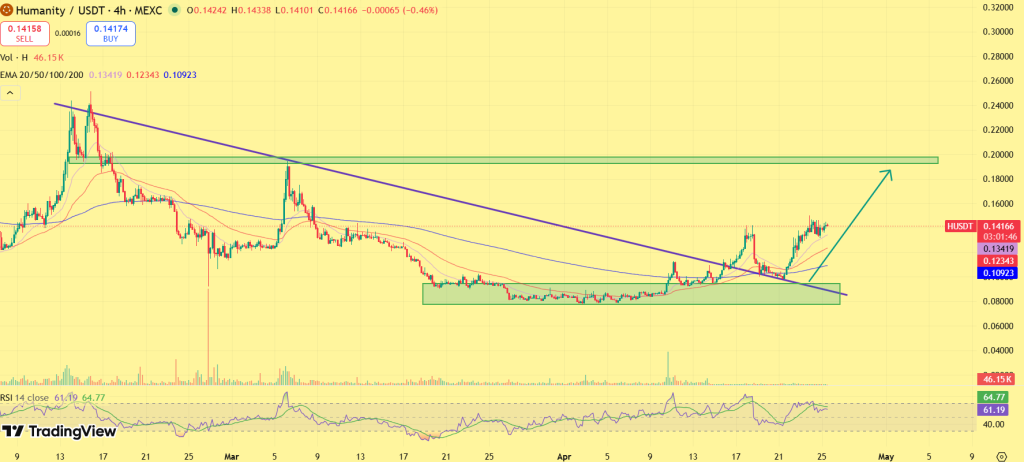
Humanity Protocol (H) price has surged nearly 40% and is holding firm above the $0.120 level, with price consolidating near highs instead of reverting to the prior range, an early indication of strength following the breakout. The level, which capped upside through the previous phase, is now acting as support, and the absence of immediate selling pressure keeps the structure tilted higher.
At the same time, participation is expanding alongside price, reinforcing the move rather than fading into it. With gains being retained and activity building in parallel, the setup shifts from a breakout event toward a continuation structure.
On-Chain Data Signals Rising Participation
On-chain metrics are moving in line with the price shift. Whale transactions have climbed to their highest level in five months, indicating that larger holders are actively positioning during the early phase of the move rather than distributing into strength.
At the same time, network growth has accelerated to a two-month peak, reflecting increasing user activity and fresh participation entering the ecosystem. When both large-holder activity and network expansion move together, the structure tends to strengthen. It suggests that demand is not isolated but distributed, supporting stability at higher levels and reducing the likelihood of a short-lived move.
After multiple sessions of compression around the $0.09–$0.10 zone, downside attempts continued to stall, with selling pressure getting absorbed rather than extended lower. That phase established the base from where the move developed.
As the structure tightened, the descending trendline that capped prior rallies came back into focus. Once that barrier gave way, expansion followed quickly, carrying the move through $0.120 and into a higher range. From there, the key signal was not the breakout itself but the reaction that followed. Instead of rotating back into the prior range, the market held above $0.120 and began forming higher lows just above that level. This shift indicates that the breakout zone is being defended rather than retested as resistance.
Meanwhile, pullbacks have remained shallow, with each dip finding support sooner than the previous one. That behavior keeps the range compressed near highs and limits the ability for supply to re-enter the market. As this structure continues to hold, the breakout remains valid, with $0.120 acting as the base for the current move. A sustained hold above this level keeps the path open toward the next resistance band near $0.16–$0.18, where the market is likely to encounter the next supply.
However, a move back below the breakout zone would shift the structure back into its previous range. Until then, the current flow remains aligned toward continuation.
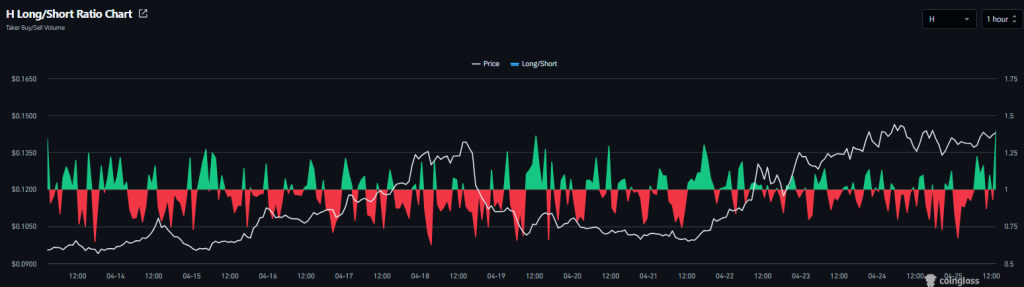
Long/Short Ratio Reflects Strength Without Overcrowding
Positioning data continues to support the broader structure. The long/short ratio holding near 1.39 reflects a bullish bias, but without the imbalance typically seen in overcrowded trades. At the same time, leverage remains contained, reducing the risk of sharp liquidation-driven volatility.
As positioning builds gradually rather than aggressively, the environment remains supportive of continuation, allowing the structure to develop without destabilizing pressure.
Final Take
With the breakout holding and structure stabilizing above $0.120, the current setup continues to lean higher as long as acceptance at this level persists. While upside remains open toward the $0.16–$0.18 zone, the move now depends less on expansion and more on whether the market continues to hold above its base without slipping back into the prior range. A sustained hold keeps continuation in play; a loss of structure would shift the focus back to consolidation.
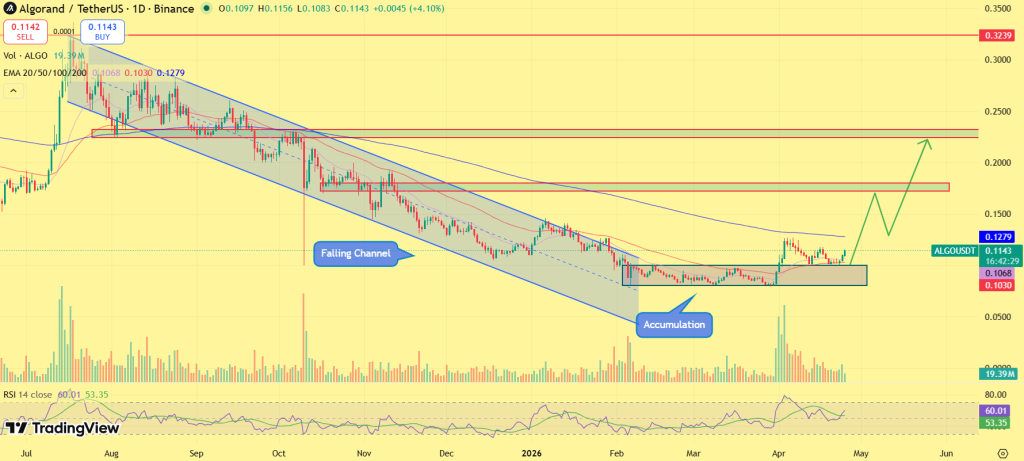
Algorand price is starting to shift after months of pressure, with ALGO price pushing higher and holding gains, an early sign that the structure may be turning.
While previous rallies failed to sustain, the current move is showing a different behavior, as price holds near $0.1149 instead of fading. Meanwhile, rising participation and fresh catalysts are beginning to align. As this setup develops, the question is no longer about a short-term bounce, but whether ALGO price is positioning for a broader move toward $0.1700.
ALGO Price Structure Begins to Shift as Downtrend Weakens
While the broader trend has remained under pressure, recent price action suggests the structure is beginning to transition. As ALGO price approaches the upper boundary of its descending channel, repeated tests are gradually weakening resistance. Meanwhile, higher lows forming near the demand zone indicate that buyers are stepping in earlier, reducing downside momentum.
As Algorand price stabilizes above short-term moving averages, the trend is shifting from passive decline toward early reversal conditions. With resistance thinning near the upper channel boundary, a decisive breakout could trigger a fast move toward the $0.1500–$0.1700 range as overhead liquidity begins to get cleared. However, failure to hold current levels would delay the reversal and keep Algorand price within its broader corrective structure.
Participation Expands as Derivatives Activity Builds
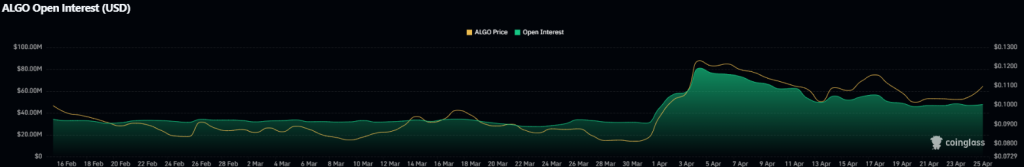
While price begins to stabilize, derivatives data confirms that market participation is returning. As futures volume rises to $72.48 million and open interest climbs to $51.44 million, activity is expanding alongside price. Meanwhile, this increase suggests traders are positioning around the current setup rather than exiting.
With both volume and open interest trending higher, the move is supported by engagement rather than isolated price action. However, rising participation also introduces the potential for volatility if positioning becomes crowded, making sustained stability above current levels critical.
Regulatory Catalyst Adds Institutional Weight
While technical structure improves, a key regulatory development is strengthening Algorand’s broader positioning. As ALGO secures inclusion in Japan’s JVCEA Green List, the asset gains a regulated pathway for listings across Japanese exchanges. Meanwhile, oversight by Japan’s Financial Services Agency adds a layer of institutional credibility that extends beyond short-term market sentiment.
Big news for Algorand in Japan.$ALGO has been added to the JVCEA Green List, a register of cryptos approved for fast-tracked listings across Japanese exchanges.
The JVCEA is overseen by Japan's FSA, the same regulator that governs banks, insurers, and stock exchanges.
With regulatory clarity often acting as a long-term driver, this development reinforces confidence in the ecosystem. As market attention begins to align with both structure and narrative, Algorand price is gradually transitioning into a more constructive phase.
Outlook
As Algorand price builds strength above recent levels, the structure is shifting from recovery toward early trend development. While ALGO price continues to test resistance within its broader trend, sustained stability reinforces the potential for continuation.
Meanwhile, rising participation and regulatory catalysts provide a stronger foundation for the move. With momentum building and resistance nearing exhaustion, the next phase will depend on whether price can break through and hold higher ground. With early signs of strength now visible, the next move will reveal whether this is just a recovery, or the beginning of a broader trend shift.
Price predictions for 2026 range from $100 to $150.00.
Long-term outlook suggests gradual growth potential toward $1000+ by 2030.
Litecoin remains one of the most reliable payment-focused cryptocurrencies, known for fast transactions and low fees. As the market shifts toward practical use cases, LTC continues to hold relevance, especially in stable, utility-driven environments. At the same time, price action is starting to stabilize.
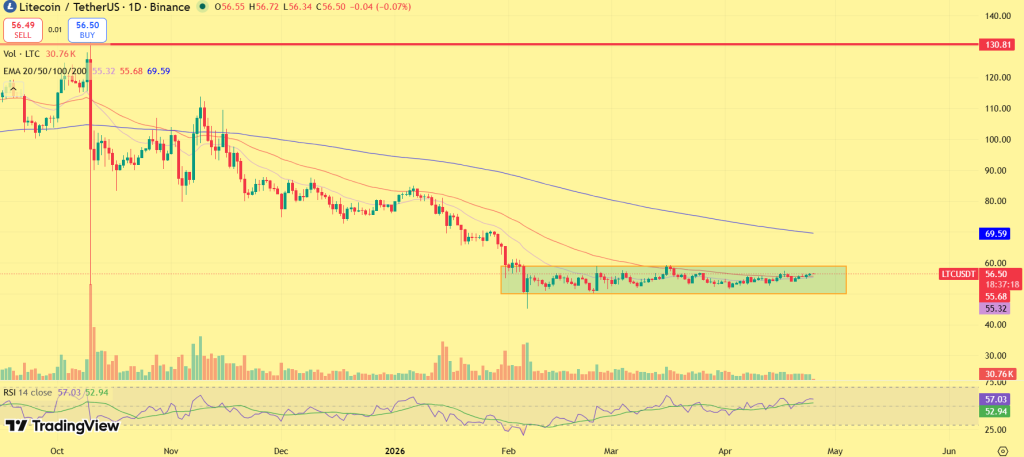
Currently trading near $56, Litecoin is holding its ground after a prolonged consolidation phase. The $50–$55 zone has acted as a consistent support, with buyers stepping in on dips and preventing further downside.
Instead of trending lower, LTC is now forming a base, with volatility tightening and selling pressure fading. Such phases often precede stronger moves once momentum returns. In this Litecoin price prediction, we examine whether this stability can translate into a breakout phase in 2026.
Litecoin is currently trading within a tight $50–$60 range, and this range has held for several weeks without a breakout. The $50–$52 zone is acting as a strong demand area. Each dip into this region is being bought quickly, indicating that sellers are losing control at lower levels. However, the $58–$60 resistance continues to cap upside, with repeated rejections showing that buyers are not strong enough to push through.
This creates a clear compression setup, where volatility is shrinking and price is getting squeezed. If LTC breaks above $60, the next move is likely toward $65–$70, as this would break the lower high structure If LTC loses $50, price could drop toward $44–$46, which is the next demand zone.
Coinpedia’s Litecoin Price Prediction 2026
Litecoin’s price prediction for 2026 points to a measured recovery phase rather than an aggressive breakout cycle, with price action largely dependent on its ability to reclaim key resistance levels. At present, LTC continues to trade within a well-defined range, with $50 acting as a strong demand floor and repeated rejections near the $60–$65 zone highlighting persistent supply. This structure indicates that while downside pressure has eased, bullish momentum remains constrained.
A sustained move above $60–$65 would be the first indication of structural improvement, as it would break the sequence of lower highs and allow Litecoin to advance toward the $80–$100 range. If this zone is reclaimed and held, the market could gradually expand toward $100–$125, aligning with previous distribution levels. However, failure to overcome this resistance band is likely to keep LTC in a range-bound environment, with intermittent rallies being capped and price rotating between established levels.
On the downside, a loss of the $60 support zone would expose Litecoin to a deeper pullback toward $44–$46, which represents the next significant demand area. That said, current price behavior suggests that buyers are actively defending this region, limiting the probability of extended downside unless broader market conditions weaken.
Overall, 2026 is expected to act as a rebuilding year for Litecoin, where the asset stabilizes, absorbs overhead supply, and gradually attempts to transition into a stronger trend.
LTC Crypto Price Prediction 2026 – 2030
Year
Potential Low ($)
Potential Average ($
Potential High ($)
2026
100.00
125.00
150.00
2027
150.00
200.00
280.00
2028
220.00
290.00
380.00
2029
290.00
370.00
530.00
2030
430.00
650.00
1000.00
Litcoin (LTC) Price Prediction 2026
Litecoin’s price may range between $100 and $150 in 2026.
LTC Price Forecast 2027
Litecoin (LTC) price range can be between $150.00 to $280.00 during the year 2027.
LTC Prediction 2028
In 2028, Litecoin could reach a low of $220, an average of $220, and a high of $380.
LTC Price Targets 2029
Thereafter, the LTC price for the year 2029 could range between $290.00 and $530.00.
Litecoin (LTC) Price Prediction 2030
Finally, in 2030, the price of LTC is predicted to maintain a steady and positive. It may trade between $430.00 and $1000.00.
LTC Price Prediction 2031, 2032, 2033, 2040, 2050
Based on the historic market sentiments and trend analysis of the largest cryptocurrency by market capitalization, here are the possible LTC price targets for the longer time frames.
Year
Potential Low ($)
Potential Average ($)
Potential High ($)
2031
570.00
750.00
900.00
2032
720.00
840.00
1200.00
2033
800.00
920.00
1300.00
2040
1000.00
1200.00
1800.00
2050
1200.00
1500.00
2200.00
LTC Price Prediction: Market Analysis?
Year
2026
2027
2030
Changelly
$165
$245.00
$420.00
CoinCodex
$130.00
$220.00
$280.00
Binance
$150.00
$250.00
$310.00
Never Miss a Beat in the Crypto World!
Stay ahead with breaking news, expert analysis, and real-time updates on the latest trends in Bitcoin, altcoins, DeFi, NFTs, and more.
FAQs
What is Litecoin (LTC) and how does it work?
Litecoin is a fast, low-fee digital currency designed for payments, using a secure blockchain similar to Bitcoin for peer-to-peer transfers.
When is the next Litecoin halving event?
Litecoin will likely undergo its next halving in July 2027, cutting block rewards in half and potentially influencing supply and price over time.
Can Litecoin be a long-term investment?
Litecoin offers stable growth potential as a payment-focused blockchain, making it a strong option for diversified crypto portfolios over time.
What is the Litecoin (LTC) price prediction for 2026?
Litecoin may trade between $100 and $150 in 2026, with a gradual recovery likely as it reclaims key resistance levels above $60–$70.
How high can Litecoin (LTC) price go by 2030?
Litecoin could reach between $430 and $1000 by 2030, depending on adoption, market cycles, and its ability to sustain long-term bullish momentum.
What will Litecoin (LTC) price be in 2040?
Litecoin could trade between $1000 and $1800 by 2040, driven by long-term adoption and its role as a reliable payment network.
Bitcoin is currently trading at: $ 77,428.65391738
Bitcoin holds strong near $75K in 2026, signaling accumulation. A breakout above $80K could drive BTC toward $120K–$150K this cycle.
BTC remains range-bound between $70K–$80K, with strong demand below. Analysts predict a bullish expansion toward $150K+ before 2026 ends.
Bitcoin’s consolidation phase in 2026 reflects accumulation, not weakness, with long-term forecasts targeting $250K+ and up to $900K by 2030.
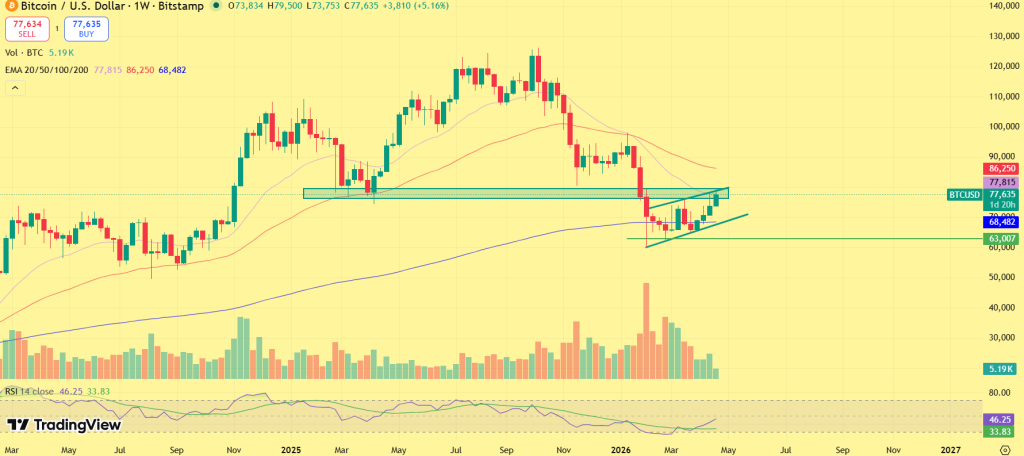
As April 2026 approaches its final phase, Bitcoin price continues to hover within the $70K–$80K zone, now stabilizing near the upper end around $76K–$78K, and the market is increasingly recognizing that this isn’t weakness, it’s a phase of positioning. Earlier, BTC struggled to sustain moves above the $72K–$76K resistance, but recent price action shows clear acceptance at higher levels, with dips toward the $70K–$72K range being absorbed quickly. This behaviour reflects a shift where selling pressure has faded, while buyers are gradually gaining control through consistent accumulation rather than aggressive chasing.
Large-cap stability continues to define the current phase. Bitcoin is holding firm while broader market participation remains selective, a pattern typically seen when capital is rotating into strength rather than expanding across the board. Each pullback is being met with steady buying interest, suggesting that stronger hands are building exposure, while the lack of sharp rejection near current levels indicates that overhead supply is thinning.
This push-and-pull dynamic has resulted in a tight compression structure, where volatility continues to contract and price action becomes increasingly controlled. Such phases are not a sign of exhaustion, they reflect preparation. With Bitcoin now holding closer to the upper range, the structure suggests that the market is building pressure near a key inflection zone, where the next move could define the broader trend into May.
With that in focus, let’s move into Bitcoin’s price prediction for 2026 and understand what lies ahead.
Bitcoin (BTC) Price Prediction for April – May 2026
Bitcoin is now holding firm near the $76K–$78K region, and the structure has evolved beyond simple consolidation into a phase where continuation is becoming increasingly probable. After reclaiming the $72K–$74K zone earlier in April, price has managed to sustain above it, reinforcing that demand is stepping in early on dips rather than reacting after moves. This shift remains significant, as it reflects accumulation at higher levels rather than distribution.
At the same time, the broader backdrop remains mixed. Global macro conditions continue to present headwinds, with uncertainty around rate direction, liquidity conditions, and overall risk appetite keeping the market cautious. These factors are not reversing Bitcoin’s trend, but they are slowing the pace of expansion, keeping price action controlled rather than impulsive.
Within this environment, Bitcoin is now pressing against a critical resistance band. The $78K–$85K zone continues to act as the immediate ceiling, where price is encountering supply. However, the nature of pullbacks remains constructive. Dips are shallow, quickly absorbed, and lacking follow-through to the downside, suggesting that buyers remain active and confident near current levels.
This is where the setup strengthens into May. If Bitcoin continues to hold above the $74K–$75K base while gradually absorbing supply near resistance, the probability of a breakout increases in the near term. In that case, a move toward the $80K–$85K range becomes a realistic extension, supported by steady accumulation and improving market confidence.
However, confirmation is still required. If resistance continues to hold or macro pressure intensifies, Bitcoin may extend its consolidation within a tighter range before expansion. Even in that scenario, the structure does not signal weakness, but rather a controlled buildup beneath resistance.
Overall, Bitcoin is not stalling, it is compressing near highs, and once the $80K level is decisively reclaimed, the move toward $82K–$85K is likely to unfold with stronger momentum into May.
Coinpedia’s Bitcoin (BTC) Price Prediction 2026
Bitcoin’s price structure in 2026 points toward a transition year, where the market is gradually shifting from consolidation into expansion rather than entering a fresh bearish phase.
The first key trigger remains the $80K–$90K range. A sustained reclaim of this zone would indicate strengthening momentum, allowing BTC to move toward the $100K–$110K region, where the next resistance is likely to emerge. If price stabilizes above this level, it would confirm a shift out of the current range, opening the path toward the $120K–$130K zone in the later part of the year.
At the same time, external uncertainties continue to keep the upside controlled. Periodic spikes in geopolitical tensions, sudden liquidity shifts, and risk-off reactions across global markets are creating intermittent pressure, preventing immediate breakout continuation. This is one of the key reasons why Bitcoin, despite holding strong support, is still struggling to trend decisively.
However, what stands out is the consistency in demand. Every dip toward lower levels is being absorbed, suggesting that the market is building a base rather than weakening. This kind of structure typically forms before expansion, especially when downside follow-through remains limited. On the downside, failure to hold the $67K support zone could trigger a temporary correction toward the $60K–$62K region. But unless this level breaks decisively, the broader structure remains intact.
Overall, 2026 is shaping up as a rebuilding and controlled expansion phase, where Bitcoin is stabilizing under external pressure while gradually preparing for its next major move.
Bitcoin Price On-chain Outlook
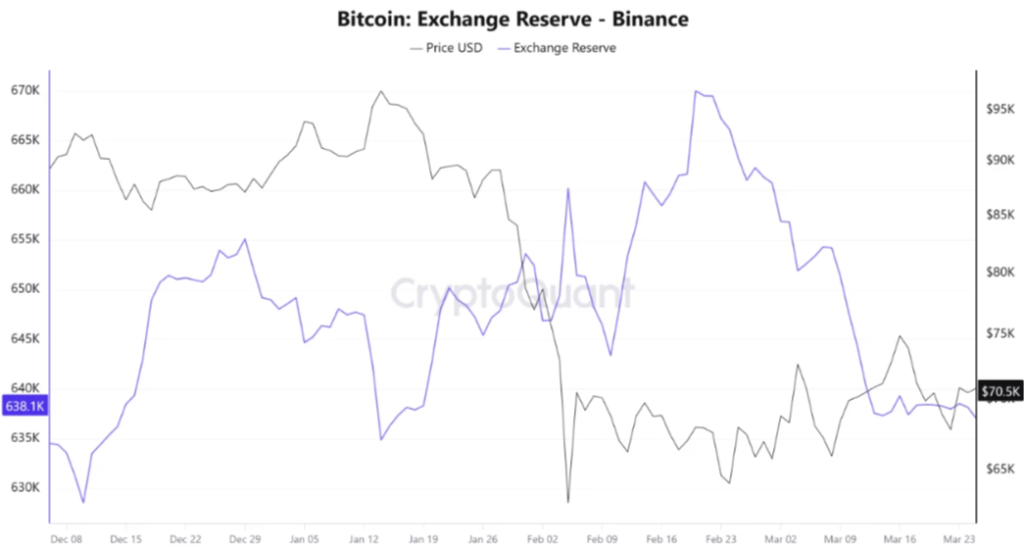
Bitcoin’s on-chain data is currently reflecting a strong shift in supply dynamics and holder behavior, aligning closely with the ongoing range-bound structure on the chart. One of the most notable developments is the decline in Bitcoin reserves on major exchanges like Binance, which have dropped to their lowest levels since the start of 2026. This reduction in available supply suggests that coins are increasingly being moved off exchanges into cold storage or long-term holdings, effectively reducing immediate selling pressure in the market.
At the same time, a contrasting trend is visible on platforms like Upbit, where reserves have climbed to their highest levels since 2024. This divergence highlights a shift in liquidity distribution, where global supply is tightening while regional trading activity, particularly in the Korean market, is increasing, often acting as an early signal of rising demand or short-term volatility.
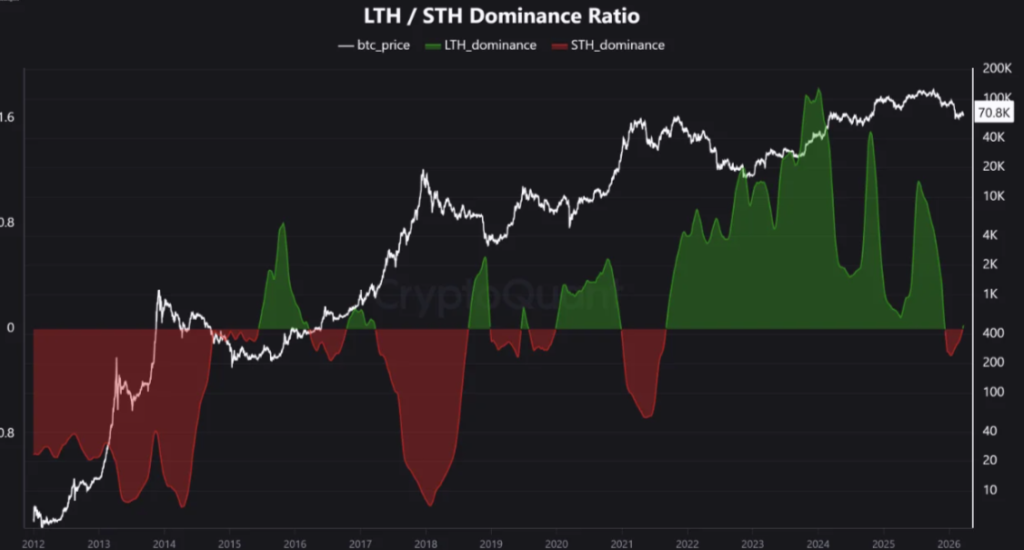
Alongside this, holder behavior is undergoing a significant transition. Data shows that Bitcoin accumulated during late 2025 has now crossed the 155-day threshold, moving into the long-term holder (LTH) category. This shift indicates that a large portion of previously active supply is no longer being traded, but instead held with conviction. Historically, the transition from short-term holder dominance to long-term holder dominance marks a move away from speculative trading toward accumulation-driven phases. The current environment reflects a similar pattern, where conviction-based holding is beginning to outweigh short-term market activity.
Taken together, these on-chain signals suggest that Bitcoin is in a phase where supply is tightening while holding behavior is strengthening, even as price remains range-bound. This kind of setup typically forms when the market is building a base, where reduced sell pressure and increasing long-term conviction gradually set the stage for a stronger directional move ahead.
Recent Events Affecting Bitcoin’s Price
The shift from late 2025 into 2026 has completely changed Bitcoin’s momentum. After hitting its peak near $120K+, the market entered a cooling phase as profit-taking kicked in and the price slipped into a prolonged consolidation. This marked the transition from a high-momentum rally into a structure-building phase, where volatility started to compress.
The biggest trigger in recent months has been the ongoing Iran conflict, which has injected uncertainty across global markets. Rising tensions, drone strikes, and threats around the Strait of Hormuz have disrupted energy markets and increased volatility, keeping risk assets like Bitcoin, capped despite strong support.
Institutional behavior has also influenced price direction. Earlier outflows and profit booking created downward pressure, but recent sessions have shown renewed positioning near lower levels, preventing deeper breakdowns and supporting the current range-bound structure.
Another layer of uncertainty comes from ongoing regulatory developments in the U.S., where delays and debates around crypto legislation continue to impact sentiment. Proposals affecting stablecoins and broader market rules have created hesitation among investors, limiting aggressive upside momentum.
Meanwhile, global markets themselves remain unstable. Fluctuations in oil prices, shifts in bond yields, and defensive positioning by investors have created a mixed environment, where Bitcoin is reacting to both risk-on and risk-off signals without a clear trend.
Bitcoin Crypto Price Prediction 2026 – 2030
Year
Potential Low ($)
Potential Average ($
Potential High ($)
2026
100k
150k
180k
2027
170K
250K
330K
2028
200K
350K
450K
2029
275K
500K
640K
2030
380K
750K
900K
Bitcoin Price Prediction 2026 Forecast
The BTC price range in 2026 is expected to be between $100K and $180K.
BTC Price Prediction 2027
Subsequently, the Bitcoin price range can be between $170K to $330K during the year 2027.
Bitcoin (BTC) Price Prediction 2028
With the next Bitcoin halving, the price will see another bullish spark in 2028. Specifically, as per our Bitcoin Price Prediction, the potential BTC price range in 2028 is $200K to $450K.
BTC Price Target For 2029
Thereafter, the BTC price for the year 2029 could range between $275K and $640K.
Bitcoin (BTC) Price Prediction 2030
Finally, in 2030, the price of Bitcoin is predicted to maintain a positive trend. Indeed, the BTC price is expected to reach a new all-time high, ranging between $380K and $900K.
The long-term projection assumes Bitcoin (BTC) sustains relevance in overall cryptocurrency adoption and the continued development of blockchain payment solutions, with growth moderating over time as the asset matures.
Year
Potential Low ($)
Potential Average ($)
Potential High ($)
2031
540,830
901,383
1,261,936
2032
757,162
1,261,936
1,766,711
2033
1,059,945
1,766,711
2,473,477
2040
5,799,454
9,665,757
13,532,059
2050
161,978,188
269,963,647
377,949,106
Bitcoin Prediction: Analysts and Influencers’ BTC Price Target
“Jack Dorsey, former Twitter CEO (now X), predicts Bitcoin could exceed $1 million by 2030 due to its ecosystem growth and increasing adoption.”
Cathie Wood, CEO of Ark Invest, projects Bitcoin to reach $1.5 million by 2030, driven by institutional adoption and its position as digital gold.”
“Wall Street broker Bernstein believes 2026 will mark the start of a tokenization “supercycle,” maintaining its $150,000 Bitcoin price target for this year and $200,000 for the 2027 cycle peak.”
“Brad Garlinghouse, the Ripple CEO, predicts Bitcoin will hit $180,000 in 2026, due to favorable market and regulatory conditions.”
Never Miss a Beat in the Crypto World!
Stay ahead with breaking news, expert analysis, and real-time updates on the latest trends in Bitcoin, altcoins, DeFi, NFTs, and more.
FAQs
What is the Bitcoin price prediction for 2026?
Bitcoin is expected to range between $100K and $180K in 2026, with bullish momentum building as consolidation near $70K shifts into expansion.
How much will 1 Bitcoin be worth in 2030?
Bitcoin could range between $380K and $900K by 2030, with an average target near $750K as adoption, scarcity, and institutional demand grow.
What will 1 BTC be worth in 2040?
By 2040, Bitcoin could range between $5,799,454 and $13,532,059, with an average estimate near $9,665,757 as adoption and scarcity increase.
How much will Bitcoin be in 2050?
Bitcoin in 2050 could range from $161M to $377M, with an average estimate near $269M, driven by long-term adoption, scarcity, and global demand.
Is it safe to invest in Bitcoin today for long-term?
Bitcoin can be a strong long-term asset, but it remains volatile. Investing gradually and holding long-term may reduce risk and improve potential returns.
Is it worth putting $100 into Bitcoin?
Yes, investing $100 in Bitcoin can be a good start. It allows beginners to gain exposure, learn the market, and benefit from potential long-term growth.
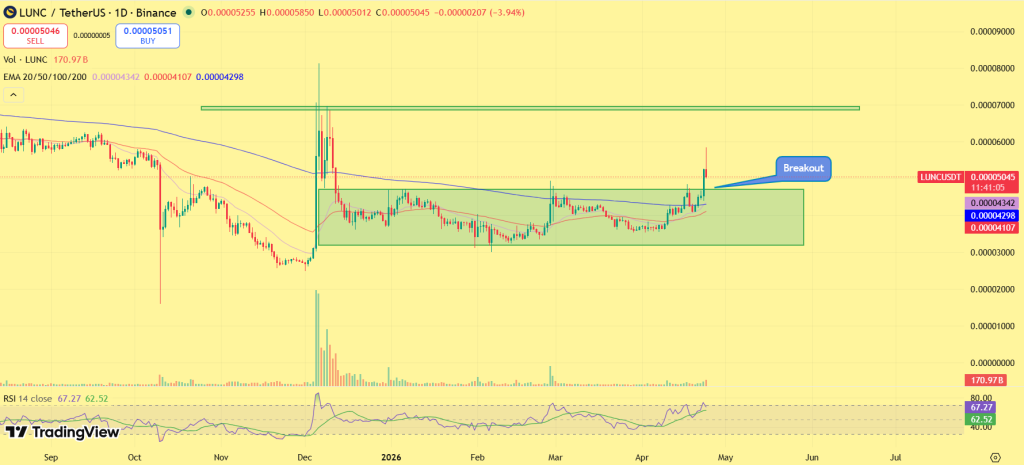
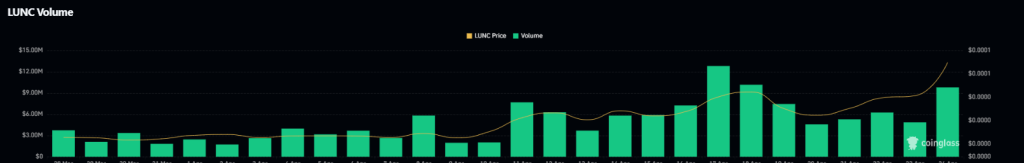
Terra Classic price is moving higher, with LUNC token clearing resistance and holding above its consolidation range for the first time in months. While previous attempts failed to sustain, the current move is showing early signs of acceptance, with price maintaining strength above the breakout zone.
Meanwhile, rising participation is beginning to support the shift. As the structure transitions into expansion, the window for confirmation is narrowing. With momentum building and resistance now behind, the focus shifts to whether this LUNC price breakout can extend into a larger move higher.
Breakout Holds as Terra Classic Price Transitions Into Expansion
While previous price action remained confined within a horizontal range, the current move has shifted Terra Classic price into a higher trading zone. As LUNC price cleared resistance, the former ceiling is now acting as support, with repeated holds confirming structural strength. Meanwhile, the absence of immediate rejection reinforces that the breakout is being accepted by the market. With higher lows beginning to form above the breakout level, the structure reflects controlled continuation rather than exhaustion.
As long as Terra Classic price holds above the $0.000045–$0.000048 region, the breakout remains valid, keeping the path open toward $0.000060 and potentially higher levels. However, a failure to maintain this zone would weaken the structure and pull LUNC price back into consolidation.
Participation Expands as Volume and Open Interest Surge
While price structure strengthens, derivatives data confirms that participation is returning to the market. As futures volume has surged significantly, rising over 500%, and open interest climbs above $12 million, activity is expanding rapidly. Meanwhile, this increase reflects traders positioning around the breakout rather than fading it.
With both volume and open interest rising together, the move is supported by engagement rather than isolated price action. However, sharp increases in participation can also introduce volatility if positioning becomes crowded, making stability above the breakout zone critical.
Narrative Momentum Returns as Market Attention Builds
While structure leads the move, broader narrative elements are beginning to support Terra Classic price. As discussions around token burns, exchange activity, and ecosystem upgrades regain traction, sentiment is gradually improving. Meanwhile, increased social engagement reflects renewed interest from market participants.
With narrative momentum aligning alongside technical strength, LUNC price is attracting attention beyond short-term trading flows. However, sustained continuation will depend on whether this attention translates into consistent demand rather than temporary spikes.
Final Words
As Terra Classic price continues to hold above its breakout zone, the structure remains aligned with continuation rather than reversal. While LUNC price maintains stability above reclaimed resistance, higher lows reinforce demand across the current range. Meanwhile, rising participation adds depth to the move, supporting further expansion.
With breakout confirmation in place and structure holding, the market is transitioning into a phase where continuation becomes the primary focus. With the foundation now established, the next move will be defined not by breakout, but by how effectively price builds on it.
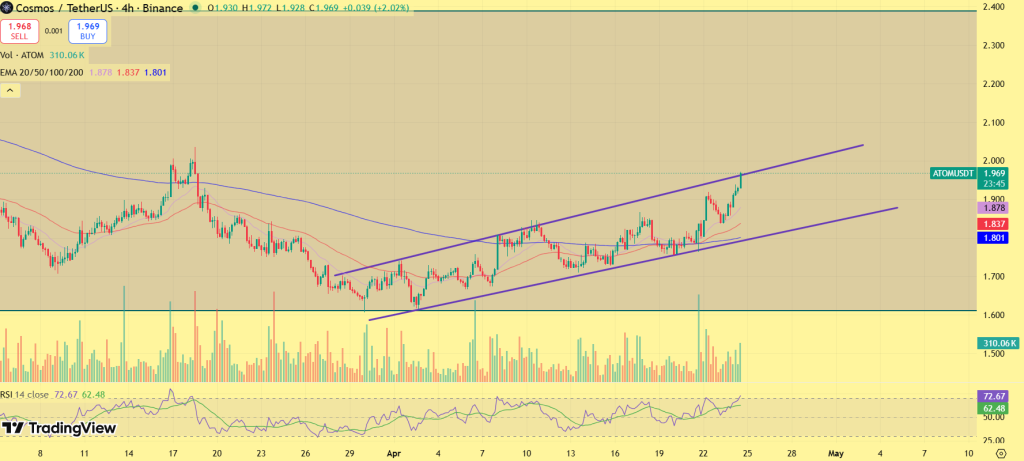
Cosmos price is stabilizing as it continues to hold within a rising structure, keeping the broader setup aligned with continuation. While recent ecosystem developments around Cosmos licensing signal a shift toward stronger internal value capture, ATOM price remains near $1.94, maintaining higher lows within an ascending channel. Meanwhile, price stability persists despite broader market noise, reflecting sustained demand.
As structure and narrative begin to align, the setup is moving beyond passive consolidation. With accumulation holding and trend support intact, the market is positioning for a directional move. With pressure building beneath resistance and higher lows continuing to form, the focus now shifts to whether ATOM price can break above $2 resistance, opening the path toward higher levels.
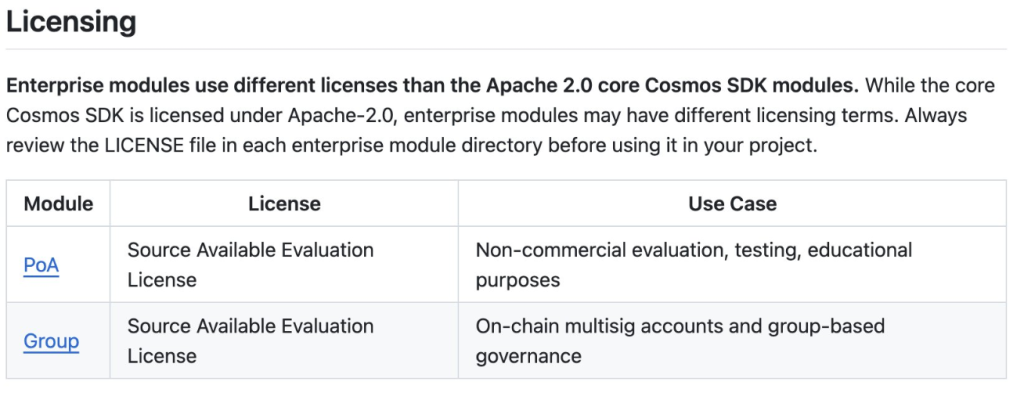
Ecosystem Shift Reframes Cosmos Price Positioning
While price action remains controlled, the underlying shift within Cosmos is beginning to reshape its positioning. As updated licensing terms restrict external commercial usage of key modules, the ecosystem becomes more internally aligned. Meanwhile, reduced value leakage strengthens the role of Cosmos-native assets.
With tighter control over value flow, Cosmos price begins to reflect a more structured foundation. As this dynamic continues to evolve, long-term positioning increasingly favors ATOM as a core asset within the ecosystem.
ATOM Price Outlook: Can Cosmos Price Surpass $2 Hurdle?
While fundamentals provide context, ATOM price is developing a technically consistent continuation structure. As price continues to respect the ascending channel, higher lows are forming across successive swings, signaling steady demand at elevated levels. Meanwhile, resistance is being tested gradually, without sharp rejection.
With price holding above short-term moving averages and trend support intact, the structure remains constructive. As long as the channel holds, continuation remains the dominant scenario. As a move above resistance confirms breakout acceptance, ATOM price could extend toward the $2.20–$2.50 range, where broader supply begins to emerge. However, a loss of channel support would weaken the structure and shift Cosmos price back into consolidation.
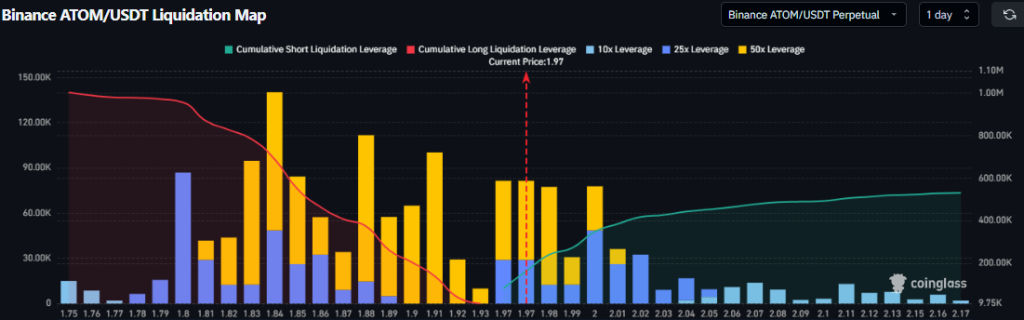
Liquidation Clusters Build Above as ATOM Price Pressures Resistance
While ATOM price continues to compress beneath resistance, liquidation data highlights where the next move could accelerate. As Binance liquidation maps show, dense clusters of short-side liquidity are building in the $2.00–$2.10 region, just above current price levels. Meanwhile, long liquidation exposure below the $1.80–$1.85 zone remains comparatively thinner, indicating limited downside pressure unless structure breaks.
With price holding near $1.95–$1.97 and gradually approaching resistance, this positioning creates a clear imbalance. As shorts continue to stack above current levels, any breakout into this zone could trigger a cascade of liquidations. As a result, upward movement is not solely dependent on spot demand, it is structurally supported by liquidity positioning. Once resistance begins to give way, these clusters can act as fuel, accelerating price toward higher levels. However, failure to sustain above the current range would shift attention back toward lower liquidity zones, delaying the breakout phase.
Final Words
As Cosmos price continues to align with evolving ecosystem dynamics, the broader structure remains constructive. While ATOM price holds within its ascending channel, consistent higher lows reinforce demand across the current range. Meanwhile, the convergence of structural strength and narrative support strengthens the case for continuation.
With resistance now in focus and pressure building within the trend, the next move is poised to define direction, alignment across structure and narrative, the next move is less about possibility and more about timing.
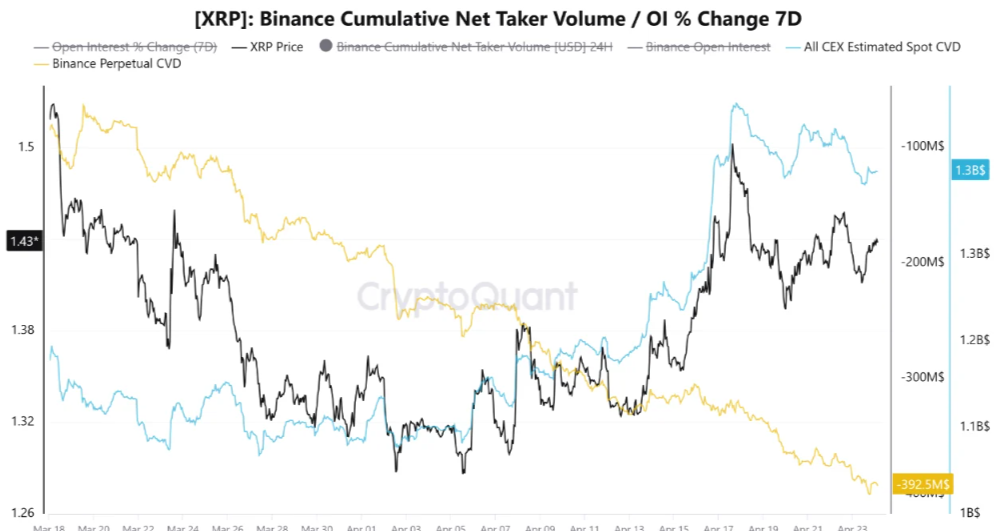
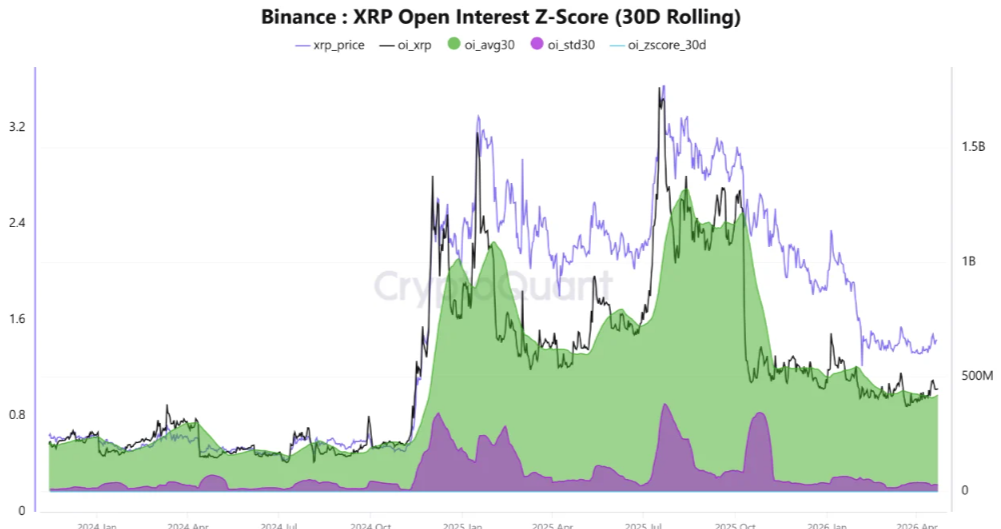
XRP price outlook is turning bullish as spot demand continues to expand, with price holding firmly above its demand zone, reinforcing a structure that is now tilting toward bullish continuation. While cumulative spot CVD has climbed to $1.39 billion, Binance perpetual CVD has dropped near -$392 million, reflecting growing short exposure across derivatives. Meanwhile, the coin price is holding steady near $1.43, with no signs of structural weakness.
As demand continues to absorb supply and short positioning builds, the divergence is no longer passive, it is shaping into a directional imbalance. With pressure building beneath resistance and support holding firm, the XRP price setup now hinges on a break higher, bringing $2 into focus.
Spot Demand Climbs While Shorts Lean In: Imbalance Starts to Build
While spot buyers continue to accumulate, derivatives traders are increasingly positioning against the move. As spot CVD has added over $300 million in recent weeks, real demand remains consistent across exchanges. Meanwhile, Binance perpetual CVD continues to trend deeper into negative territory, reflecting growing short exposure.
With long liquidations already clearing excess leverage earlier in the cycle, the market is no longer crowded on the bullish side. As funding conditions stabilize, positioning is shifting toward a healthier balance. This divergence is constructive. With demand strengthening and shorts building exposure, the market is forming conditions that typically support continuation rather than rejection.
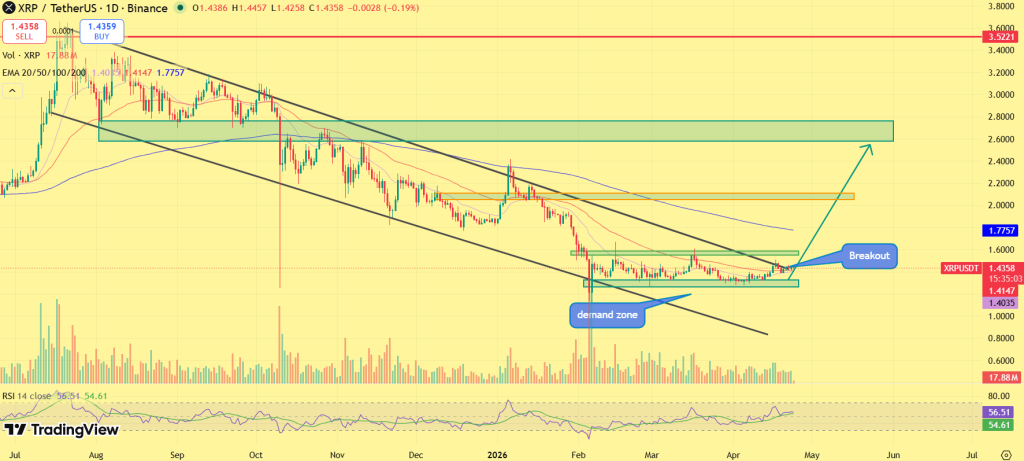
From Demand Base to Breakout Pressure: XRP Price Structure Starts to Turn
Following the extended decline within the descending channel, XRP established a base near the $1.30–$1.35 demand zone, where accumulation began to take shape. While the channel structure initially dictated direction, repeated support holds within this region confirmed that selling pressure was being absorbed. Meanwhile, price compression near the lower range signaled a gradual shift away from continuation lower.
As accumulation progressed, XRP transitioned into a tightening range beneath resistance, steadily building pressure toward breakout. With the latest move, XRP price is attempting to hold above this zone while aligning with short-term moving averages.
Currently, XRP is stabilizing near the 20-day EMA, which is beginning to flatten, reflecting a shift from downtrend to early expansion. While price continues to hold above $1.30 and maintain higher lows, the structure remains constructive. As a move above the $1.50–$1.60 region confirms breakout acceptance, continuation toward $1.80 becomes likely, with the $2.00 level emerging as the next major upside target. However, a loss of the $1.30–$1.25 region would weaken the structure and shift price back into consolidation.
Open Interest Picks Up Without Overheating: Positioning Turns Constructive
While the XRP price structure remains stable, derivatives participation is beginning to rebuild. As Binance open interest rises toward $449 million, now above its 30-day average near $420 million, positioning is gradually expanding. Meanwhile, the Z-score near 0.96 suggests that participation is increasing without reaching excessive levels.
With open interest building in a controlled manner, the market is reflecting gradual positioning rather than speculative excess. Meanwhile, the absence of extreme leverage reduces the likelihood of forced volatility disrupting structure. As participation continues to recover alongside price stability, the setup supports a constructive phase where positions are being built for continuation rather than short-term speculation.
All Eyes on Resistance as XRP Builds Toward Its Next Move
As XRP continues to hold above its demand zone, the broader structure remains aligned with accumulation rather than breakdown. While spot demand continues to expand and derivatives positioning remains skewed, the divergence is reinforcing a setup that typically resolves through expansion. Meanwhile, the lack of downside continuation strengthens the case for sustained support.
With structure stabilizing and pressure building beneath resistance, the path toward a higher move remains open. However, once resistance begins to give way, the move is unlikely to remain contained, bringing the $2 level into focus as the next major upside target.
The live price of the Stellar crypto is $ 0.17552458
XLM is holding its $0.13–$0.16 demand zone, with a breakout above $0.30 and $0.50 needed to confirm a structural trend reversal toward 2026 targets.
If payment adoption and tokenization expand, Stellar could trend toward $2.50 by 2026 and potentially $5–$7 by 2030 in a strong cycle.
Stellar has entered 2026 at a critical inflection point, with price stabilizing after a prolonged downtrend while attempting to build a base near key demand levels. As a core player in cross-border payments, Stellar continues to expand its role in low-cost, high-speed financial infrastructure, supporting real-world transaction flows across global markets. With market structure tightening and downside pressure easing, the next phase will be defined by whether demand can translate into a sustained breakout.
In this Stellar (XLM) price prediction 2026, we examine key levels, structural shifts, and potential catalysts shaping its trajectory ahead.
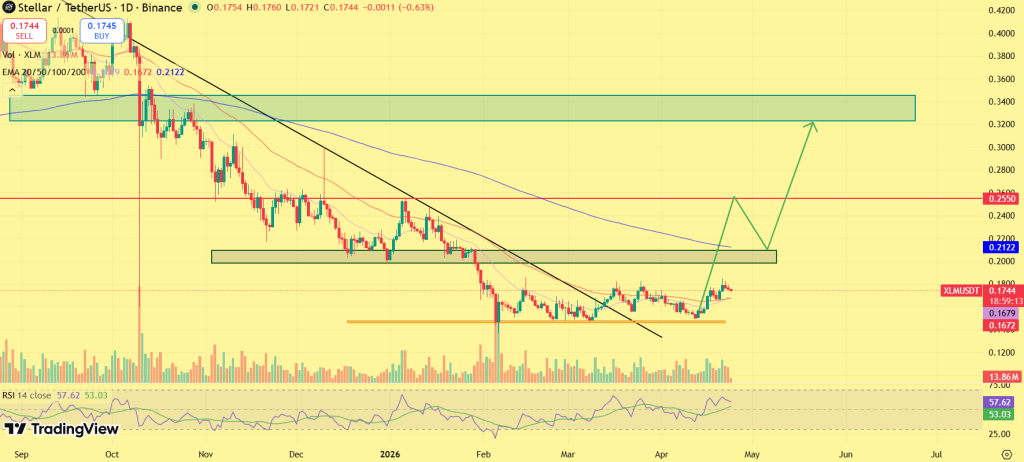
Stellar is holding near the $0.17–$0.18 range after a prolonged corrective phase, but the recent price behavior suggests the market is beginning to stabilize rather than extend lower. The repeated defense of the $0.16 support zone indicates that selling pressure is no longer dominant, with buyers gradually stepping in to absorb downside moves.
At the same time, the structure is starting to shift. XLM has moved out of its extended descending pattern and is now trading in a tighter range, with price compressing just below the $0.18–$0.20 resistance zone. This type of consolidation typically reflects a transition phase, where the market builds momentum before attempting a breakout.
The next move now depends on confirmation. A sustained push above $0.20 would signal strengthening momentum, opening the path toward the $0.22–$0.25 range as the next phase of recovery. However, until this level is reclaimed, upside attempts are likely to face supply, keeping the price within a controlled range. On the downside, the structure remains relatively stable. As long as the $0.16 level continues to hold, the broader setup remains constructive. A breakdown below this zone would weaken the recovery outlook, potentially pushing price back toward lower support levels.
For April–May 2026, Stellar is expected to trade between $0.16 and $0.25, with a breakout above $0.20 acting as the key trigger for further upside.
Coinpedia’s Stellar (XLM) Price Prediction 2026
The broader structure for Stellar in 2026 reflects a market attempting to transition out of a prolonged downtrend, with early signs of base formation but no confirmed reversal yet. After a sustained decline marked by lower highs and persistent selling pressure, XLM has moved into a compression phase near its lower demand zone. This shift indicates that downside momentum is weakening while price stabilizes within a tighter range.
The next phase depends on reclaiming key resistance levels. The immediate barrier lies near $0.22, followed by stronger zones at $0.30 and $0.50. These levels act as structural checkpoints for recovery. A sustained move above $0.50 would signal a clear shift in market structure, opening the path for a broader expansion phase.
In this scenario, Stellar could advance toward the $1.20–$2.50 range over the course of 2026, supported by a step-by-step recovery across resistance zones. However, until these levels are reclaimed, the market remains in a rebuilding phase. A breakdown below $0.14 would invalidate the current base and delay recovery.
Stellar Crypto Price Prediction 2026 – 2030
Year
Potential Low ($)
Potential Average ($
Potential High ($)
2026
1.20
1.80
2.50
2027
1.80
2.40
3.20
2028
2.80
3.80
4.80
2029
4.20
5.30
6.20
2030
5.50
6.20
7.00
Stellar (XLM) Price Forecast 2026
In 2026, Stellar price could project a low price of $1.20, an average price of $1.80, and a high of $2.50.
Stellar Price Prediction 2027
As per the Stellar Price Prediction 2027, Stellar may see a potential low price of $1.80 The potential high for the Stellar price in 2027 is estimated to reach $3.20.
XLM Price Prediction 2028
In 2028, the Stellar price is forecasted to potentially reach a low price of $2.80, and a high price of $4.80
Stellar Price Targets 2029
Thereafter, the Stellar price for the year 2029 could range between $4.20 and $6.20.
Stellar (XLM) Price Prediction 2030
Finally, in 2030, the price of Stellar is predicted to remain steady and positive. It may trade between $5.50 and $7.00.
The long-term projection assumes Stellar sustains relevance in enterprise blockchain use cases, with growth moderating over time as the asset matures.
Year
Potential Low ($)
Potential Average ($)
Potential High ($)
2031
6.20
7.50
9.00
2032
8.00
10.00
12.00
2033
9.10
13.00
16.00
2040
25.00
50.00
80.00
2050
100.00
140.00
200.00
Stellar (XLM) Price Prediction: Market Analysis?
Year
2026
2027
2030
Changelly
$1.90
$2.50
$3.40
CoinCodex
$1.40
$2.70
$4.00
WalletInvestor
$2.00
$3.40
$4.40
Never Miss a Beat in the Crypto World!
Stay ahead with breaking news, expert analysis, and real-time updates on the latest trends in Bitcoin, altcoins, DeFi, NFTs, and more.
FAQs
What is Stellar (XLM) price prediction for 2026?
Stellar could trade between $1.20 and $2.50 in 2026 if it reclaims key resistance and adoption in payments and tokenization accelerates.
What is XLM price prediction for 2027?
XLM could trade between $1.80 and $3.20 in 2027 if adoption expands and broader crypto liquidity supports payment-focused blockchains.
How high will XLM go in 2030?
Under strong market conditions, XLM may reach $5.50 to $7.00 by 2030, driven by enterprise settlement growth and stablecoin usage.
How much will XLM be worth in 10 years?
Long-term projections suggest XLM could exceed $10 if institutional adoption scales, though outcomes depend on regulation and market cycles.
What is the XLM price prediction for the next bull run?
In the next crypto bull run, XLM could target the $0.80–$1.50 range initially. A sustained breakout above $1.00 may open upside toward $2.00+, depending on market liquidity and adoption momentum.
The live price of the Floki memecoin is $ 0.00003354.
FLOKI is stabilizing near key support after a prolonged downtrend, with consolidation signaling possible accumulation and a potential breakout into 2026.
Long-term projections suggest FLOKI could reach $0.00082 by 2026 and up to $0.0026 by 2030, driven by adoption, ecosystem growth, and market cycles.
Floki Inu has evolved from a purely meme-driven token into a broader ecosystem project, with growing focus on DeFi utilities, NFT integration, and metaverse development through initiatives like FlokiFi and Valhalla. While its core strength still lies in strong community backing and social traction, the project is gradually building additional layers of utility that aim to support long-term relevance.
The FLOKI token plays a central role within this ecosystem, facilitating transactions, governance participation, and access to various platform features. As ecosystem development continues and engagement remains strong, the project is attempting to transition from sentiment-driven spikes toward more structured growth. At the same time, price action is beginning to stabilize after a recent corrective phase, with early signs of consolidation emerging near current levels.
This shift has brought renewed attention to FLOKI’s potential for recovery, as the market looks for confirmation of a sustained move higher. For a deeper outlook, read Coinpedia’s Floki Inu price prediction 2026–2030.
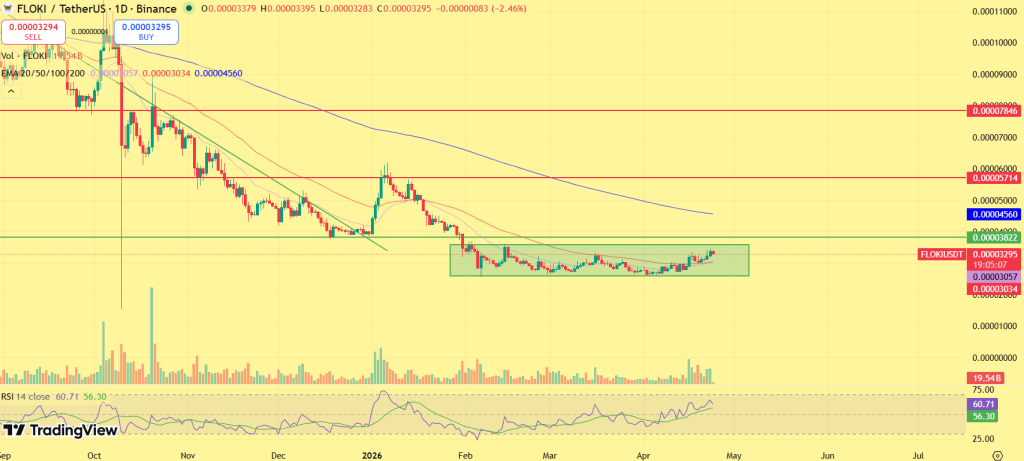
In the near term, FLOKI is trading around $0.00003354, holding within a consolidation range after a recent pullback. The $0.000030 region continues to act as a short-term demand zone, where buyers are stepping in to absorb selling pressure.
Rather than extending lower, price is compressing beneath immediate resistance near the $0.000038–$0.000040 range. This behavior typically reflects a market preparing for a directional move, particularly in meme coins where momentum tends to accelerate once key levels are reclaimed.
The next move depends on breakout confirmation. A sustained move above $0.000040 would signal renewed strength, allowing FLOKI to push toward the $0.000055–$0.000065 region during April–May, where previous supply zones may come into play. However, without this breakout, the market is likely to remain range-bound as accumulation continues.
At the same time, downside remains defined. A breakdown below the $0.000030 support could weaken the structure, potentially pushing the price toward the $0.000025 zone before stabilization resumes.
Looking ahead to 2026, FLOKI’s trajectory will largely depend on market sentiment, meme coin cycles, and ecosystem development. Unlike purely speculative tokens, Floki has been working on expanding its ecosystem through utility-based initiatives, which could support long-term relevance.
From a technical standpoint, the first major recovery signal would be reclaiming the $0.00007–$0.00010 range, which marks a key historical resistance zone.
Once this level is secured, the token could move toward $0.00020, where stronger selling pressure may appear. If broader market conditions turn bullish and meme coins regain strong retail participation, FLOKI could build sustained momentum. In a favorable scenario, FLOKI could potentially reach around $0.00035 by 2026.
FLOKI Crypto Price Prediction 2026 – 2030
Year
Potential Low ($)
Potential Average ($
Potential High ($)
2026
0.000250
0.000535
0.000820
2027
0.000600
0.000800
0.00100
2028
0.000999
0.00124
0.00150
2029
0.00120
0.00159
0.00199
2030
0.00153
0.00203
0.00263
Floki Inu (FLOKI) Price Prediction 2026
Moving forward to 2026, the FLOKI price may record a maximum price of $0.000820. With a potential low of $0.000250, the average price could settle at around $0.000535
FLOKI Inu Coin Price Projection 2027
Looking ahead to 2027, the FLOKI crypto token may range between $0.000600 and $0.00100. With this, the average trading price could settle at around $0.000800 for the year.
FLOKI Inu Crypto Price Action 2028
In 2028, the FLOKI coin with a potential surge could reach a high of $0.00150, a low of $0.000999, and an average of $0.00124.
FLOKI Token Price Analysis 2029
Moving into 2029, the FLOKI coin could range between $0.00120 and $0.00199. Considering the buying and selling pressure, the average price could settle at around $0.00159.
Floki Inu (FLOKI) Price Prediction 2030
By 2030, the value of a single FLOKI token could reach a high of $0.00263, a low of $0.00153, and an average of $0.00203.
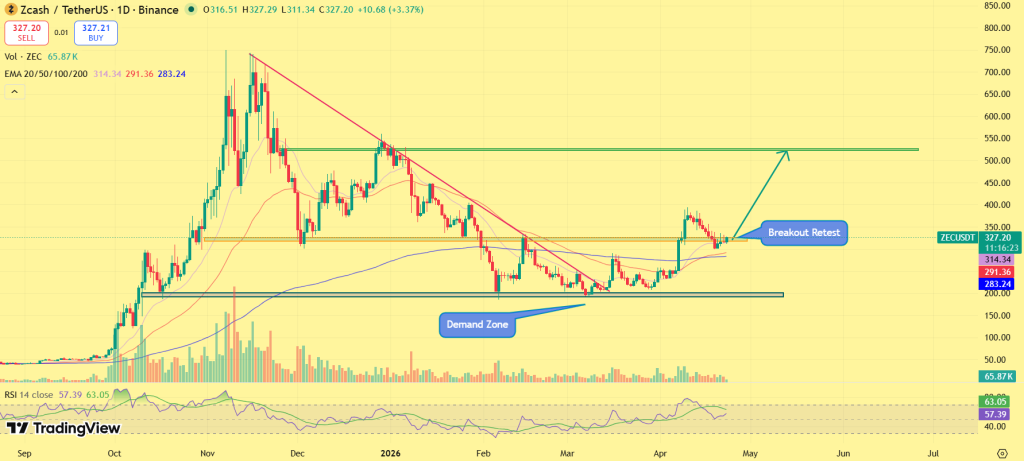
ZEC price is holding above the $300–$320 breakout zone, placing the market at a point where this structure now needs to confirm itself. While the retest continues near $322, higher lows are forming above the reclaimed range, keeping the structure intact. Meanwhile, downside follow-through remains limited, with no return into prior consolidation.
As positioning stays elevated above support, the absence of rejection keeps pressure tilted toward continuation rather than failure. However, this phase does not remain neutral for long, as breakout retests typically resolve into expansion or breakdown. With structure holding and demand building above the breakout zone, the setup is now shifting toward expansion, bringing the $450–$500 range into focus.
ZEC Price Structure Shifts from Trend Break to Expansion Setup
Following the break above the descending trendline, ZEC marked the first shift away from its prior downtrend, establishing a structural change in direction. While the initial breakout removed broader trend pressure, the formation of a double bottom near the $260–$280 zone confirmed a base where accumulation developed.
As accumulation progressed, ZEC moved into a range phase below $300, where price consolidated before expansion. With sustained buying pressure, the breakout above the $300–$320 range confirmed continuation, shifting the market into a higher timeframe bullish structure. Currently, ZEC is retesting the breakout zone while aligning with the 20-day EMA, which is now acting as dynamic support. While price remains above this level, the structure continues to hold, with higher lows forming into the retest.
As long as the 20-day EMA and the $300 zone remain intact, the breakout structure stays valid. Meanwhile, continued compression above this level keeps the setup aligned for expansion, with a move above $350 opening the path toward $420–$450, while the broader structure keeps $500 as the next major upside objective. However, a loss of the $300–$280 region would weaken the structure and shift price back into consolidation, delaying the higher high formation.
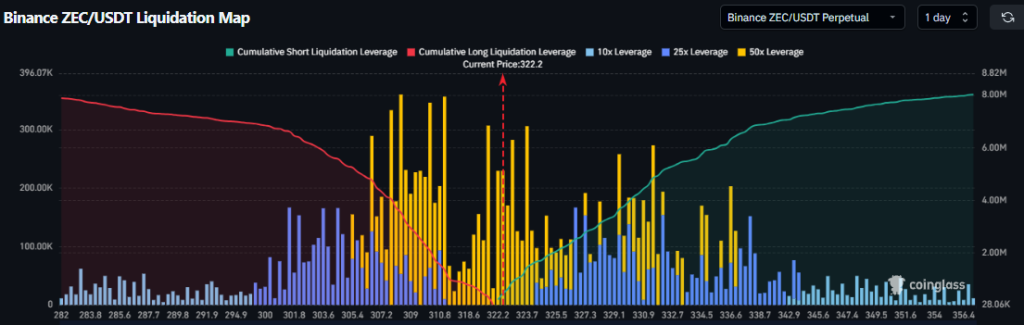
Liquidity Positioning Builds Above Current Range
While the Zcash price structure continues to hold, derivatives positioning is also aligning with the current setup. As liquidity clusters build above the $330–$360 region, potential trigger zones for upward movement are forming. Meanwhile, downside liquidity remains relatively thin below $300, reducing immediate pressure unless the structure breaks.
With short-side liquidity positioned above price, upward movement can accelerate once resistance is cleared, as liquidations begin to trigger. However, this dynamic remains dependent on price maintaining its current structure above support. As long as the breakout zone holds and liquidity remains stacked above, the setup continues to favor upside resolution.
Final Outlook
As ZEC continues to hold above the breakout zone, the structure remains aligned with continuation rather than failure. While support at $300 remains intact, repeated compression beneath resistance keeps pressure building toward expansion. Meanwhile, the absence of downside follow-through reinforces the strength of the current setup.
With structure, positioning, and momentum aligned, the path toward a higher high remains open. However, the next move now depends on whether the ZEC coin can convert this structure into expansion, bringing the $450–$500 range into play.