Reading view

Solana Adoption Jumps, Yet SOL Price Fails to Break Out—What’s Missing?

Solana Price Reclaims $85, but On-Chain Data Tells a More Cautious Story

The post Solana Adoption Jumps, Yet SOL Price Fails to Break Out—What’s Missing? appeared first on Coinpedia Fintech News

The entire crypto market declined over the past 24 hours, with the Solana price plunging over 2.1% to reach $83.23. The drop closely tracks this movement, indicating the move was largely driven by a macro risk-off sentiment rather than a coin-specific catalyst. On the other hand, Solana is seeing a fresh wave of attention after the latest integration with Meta to roll out USDC payouts on its network. 

Despite this, the SOL price has failed to breakout, raising a key question: is this the early stage of accumulation or a sign of a weakening demand? 

Solana’s Adoption Narrative Strengthens With Meta Integration

Solana is back in focus after a fresh wave of adoption-driven developments, led by Meta’s integration of USDC payouts on the network. The move allows creators to receive payments directly through Solana-based wallets, positioning the blockchain as a viable infrastructure layer for global digital payments.

BREAKING: @Meta adds support for USDC payments on Solana for creators in Colombia and the Philippines. pic.twitter.com/SNUMl5osdh

— Solana (@solana) April 29, 2026

This is not just another headline. It strengthens Solana’s long-standing narrative as a high-speed, low-cost settlement network capable of handling real-world financial flows. At the same time, broader developments around stablecoin infrastructure and cross-border payment use cases continue to build on this thesis. Capital is increasingly flowing into tools and services built on Solana, suggesting that the ecosystem is evolving beyond speculation into functional utility.

Price Reaction Remains Muted Despite Bullish Developments

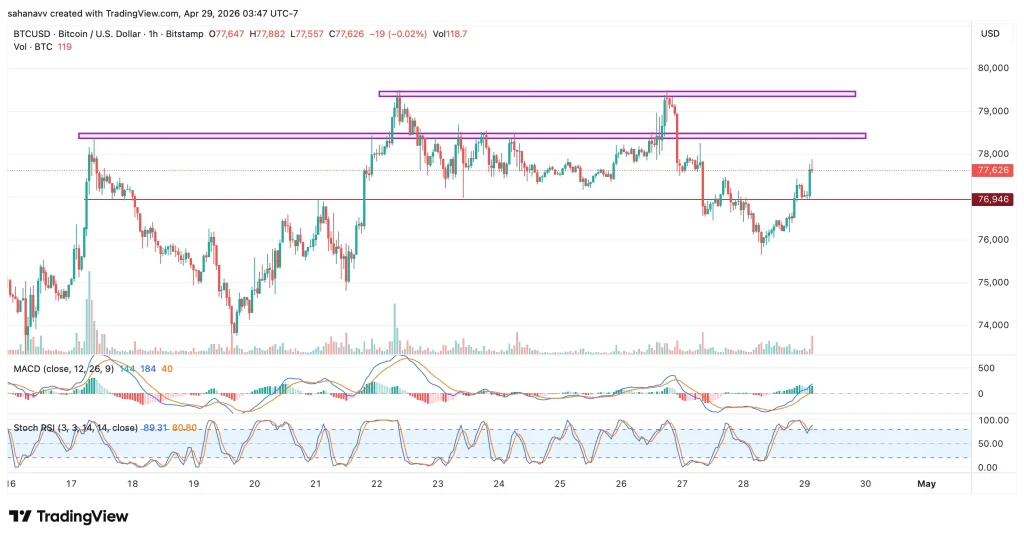
Despite the strength of this narrative, Solana’s price action has failed to show immediate follow-through. SOL price recently faced rejection near the $88 level and has since pulled back toward the $82–$85 range, indicating that the market is not aggressively chasing the news. This disconnect between adoption and price suggests that the current move is driven more by positioning than fresh demand.

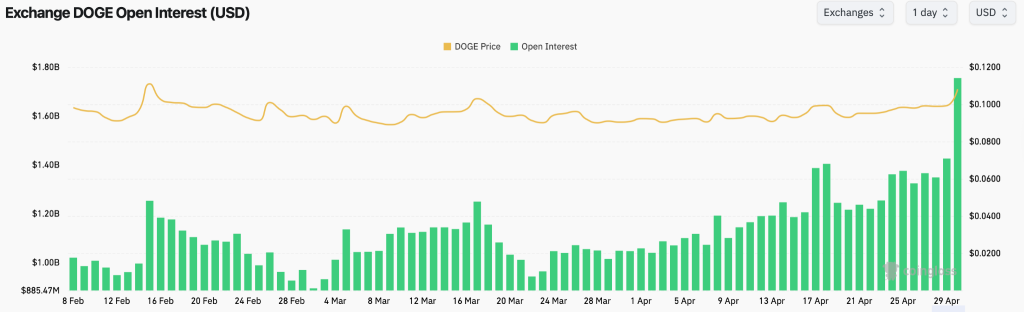
Volume has picked up during the pullback, but without a sustained push higher, this reflects activity rather than conviction.  

sol price

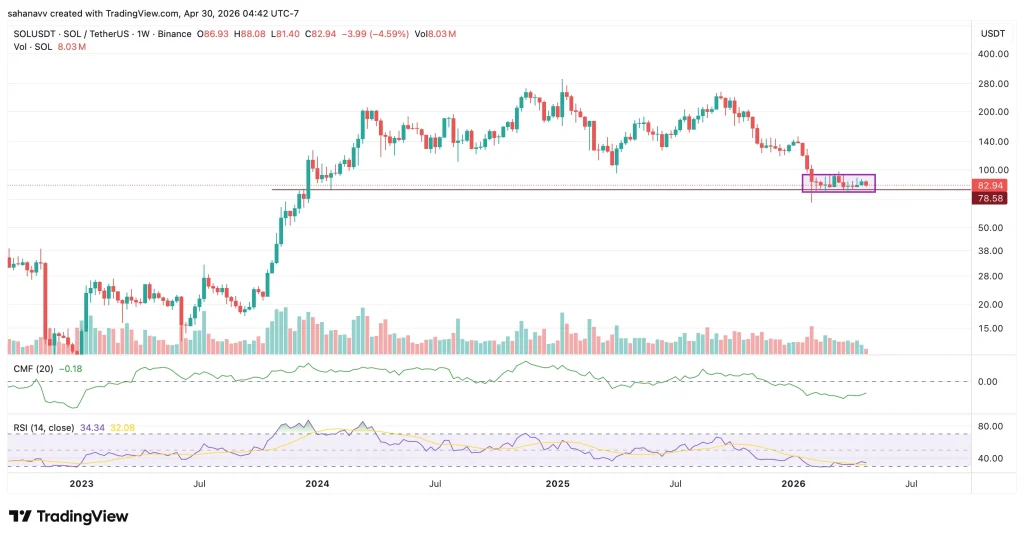
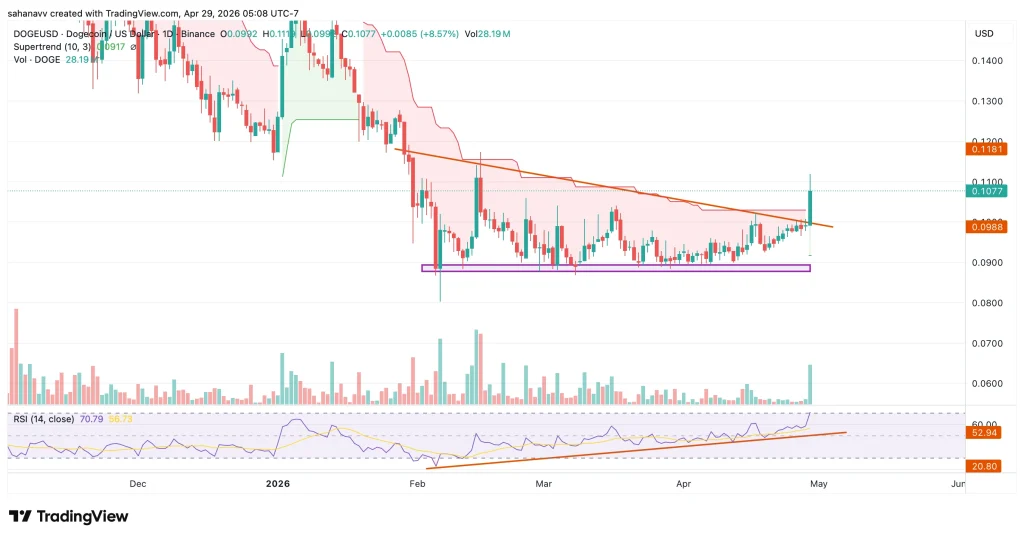
Solana’s price has not moved since the start of the year, consolidating within a narrow range between $94 and $78. The CMF in the long term has remained bearish, signalling the outflow of liquidity, while the RSI remained grounded. Price has been trending lower since its recent highs, forming a series of lower highs, indicating that selling pressure still dominates the structure. However, the current sideways movement suggests a temporary stabilization rather than a confirmed reversal.

What Comes Next for Solana Price

Solana now sits at a critical point. For a bullish continuation to develop, the SOL price needs to reclaim the $88 resistance level with strength, supported by rising open interest and spot-driven demand. Without this, the current structure remains vulnerable to further consolidation or downside pressure. A failure to hold the $80 support zone would weaken the broader setup, signaling that recent adoption news has not translated into sustained buying interest.

XRP Sentiment Spikes, But Leverage Flush Signals Caution, Not Breakout—What’s Next?

XRP Price About to Explode This Setup Says Yes

The post XRP Sentiment Spikes, But Leverage Flush Signals Caution, Not Breakout—What’s Next? appeared first on Coinpedia Fintech News

The XRP price has been under significant upward pressure over the past few days, particularly after hitting a local high of $1.44. On the other hand, XRP’s social sentiment has surged to one of its highest levels in two years following the Rakuten integration narrative. But beneath the optimism, market data tells a very different story. The spike in bullish commentary suggests growing retail excitement. Historically, however, these sentiment surges tend to coincide with FOMO zones rather than sustainable breakouts.

At the start of the trading session, the XRP price saw a sharp price drop accompanied by rising volume—a combination that signals aggressive activity, not controlled accumulation.

XRP Sentiment Jumps on Rakuten Integration, But Euphoria Signals Caution

XRP has seen a sharp rise in bullish sentiment following its integration with Rakuten, one of Japan’s largest digital ecosystems. The move allows users to convert Rakuten Points, a widely used loyalty rewards system, into XRP, expanding the asset’s real-world utility and retail accessibility. From an adoption standpoint, this is a meaningful development. 

Rakuten’s massive user base and established fintech infrastructure give XRP exposure to a broader audience, particularly in Japan, where the token has historically maintained strong traction.

xrp price

However, sentiment-driven optimism does not always translate into immediate price strength. Recent Santiment data shows XRP’s positive social sentiment entering historically elevated levels, often associated with short-term “FOMO zones.” In previous instances, similar spikes have aligned more closely with local tops or cooldown phases rather than sustained breakouts.

This suggests that while the Rakuten integration strengthens XRP’s long-term narrative, the current surge in sentiment may reflect late-stage positioning rather than fresh accumulation. As a result, the market may require a period of consolidation before any adoption-driven upside can fully materialise.

XRP Holds Key Support After Sentiment-Driven Flush

Following the sentiment surge and subsequent liquidation-driven drop, XRP’s price action is now showing signs of stabilization rather than continued weakness. The chart highlights a well-defined support zone near the $1.28–$1.30 range, which has repeatedly absorbed selling pressure since the sharp February decline. Despite the recent volatility, the price has continued to respect this level, suggesting that buyers are still defending the range.

xrp price

The drop in open interest alongside rising volume points to a leverage flush, not aggressive new short positioning. The RSI remains near the midzone, reflecting no strong bullish momentum and no oversold reversal signal. This further supports the idea that XRP is in a cooldown phase after the sentiment spike, not in an active expansion phase.

XRP is currently trading within a broader consolidation within the resistance zone between $1.45 and $1.50 and the support zone between $1.28 and $1.30.  Price continues to move between these levels without a confirmed breakout, indicating a neutral market phase rather than a directional trend.

What Comes Next: Confirmation or Breakdown

XRP price now sits at a critical turning point where the next move will depend on whether the market can transition from sentiment-driven volatility to sustained demand. After the recent leverage flush, the price continues to hold above the $1.28–$1.30 support zone, indicating that buyers are still active at lower levels. 

However, without a decisive push above the $1.45 resistance area, the broader structure remains range-bound. For a bullish continuation to take shape, XRP needs to attract fresh capital, reflected in rising open interest and stronger spot participation alongside price recovery. On the other hand, a breakdown below key support would signal that the recent sentiment surge failed to translate into accumulation, increasing the risk of further downside. 

In this context, the current phase is less about reacting to optimism and more about waiting for confirmation, as the market determines whether this is a reset before expansion or the early stages of a deeper correction.

Dogecoin (DOGE) Price Breaks Above $0.10 as Open Interest Rises—Can Bulls Sustain the Move?

Is Dogecoin (DOGE) About to Repeat History Third Base Structure Nears Completion

The post Dogecoin (DOGE) Price Breaks Above $0.10 as Open Interest Rises—Can Bulls Sustain the Move? appeared first on Coinpedia Fintech News

The Dogecoin price is moving again, and this time, it’s not subtle. After weeks of sideways movement and repeated rejections below key resistance, DOGE has surged past the $0.10 level with strong momentum, now trading around the $0.107–$0.109 range. The move comes with a noticeable spike in volume and renewed market interest, signaling a shift from passive consolidation to active participation.

But here’s the real question: is this the start of a sustained breakout, or just another short-lived spike in a volatile meme coin cycle?

DOGE Price Analysis: Can it Hold Above $0.1?

Dogecoin has broken out of a multi-week compression phase, pushing above the descending trendline that had capped its price since February. This breakout, combined with a reclaim of the psychological $0.10 level, marks a structural shift from a downtrend into a potential expansion phase. The move is supported by rising volume and a clear series of higher lows forming into the breakout, typically a sign of accumulating pressure before release.

doge price

However, the current price action also shows signs of short-term exhaustion. RSI is pushing into overbought territory near 70, suggesting momentum is stretched. The breakout candle itself is relatively sharp, meaning the price has left inefficiencies below. This creates a setup where DOGE may either consolidate above $0.10 to build continuation or retrace to test demand before deciding the next move. Meanwhile, the Supertrend has just flipped bullish after remaining bearish since January. This keeps the bullish hopes alive. 

Key Levels to Watch

  • Immediate Resistance: $0.110 – $0.118
  • Breakout Level / Support Flip: $0.100
  • Lower Support Zone: $0.090 – $0.095

DOGE Open Interest Surges Consistently 

Open interest in DOGE futures has surged alongside price, climbing toward the $1.7B–$1.8B range, marking one of the highest levels in recent weeks. This indicates that new positions are entering the market rather than just spot-driven movement. Rising open interest with rising price typically reflects trend confirmation, suggesting that traders are actively positioning for continuation.

doge price

But this is where the risk builds. A sharp increase in open interest during a vertical move often signals leveraged positioning, which can amplify both upside and downside volatility. If price stalls or reverses near resistance, these positions can unwind quickly, leading to cascading liquidations. In short, while the move is strong, it is also becoming increasingly crowded.

Conclusion: Here, What to Expect Next

The DOGE price is no longer in a passive range—it has shifted into a momentum phase. The breakout above $0.10, combined with rising open interest, signals real participation and growing interest from traders. However, the move is extended, and positioning is becoming aggressive, which increases the risk of volatility in either direction.

The key level now is clear: $0.10. If the Dogecoin price holds above this range, it strengthens the case for continuation toward higher resistance near $0.11–$0.118. But if this level fails, the move risks turning into a classic breakout trap, with price likely revisiting lower support zones.

For now, the market is leaning bullish—but the real test lies in whether bulls can defend the breakout.

Bitcoin (BTC) Price Compression Signals Imminent Move—Here are the Key Levels to Watch Next

Bitcoin Exchange Reserves Drop to 2019 Levels Is a BTC Supply Shock Coming

The post Bitcoin (BTC) Price Compression Signals Imminent Move—Here are the Key Levels to Watch Next appeared first on Coinpedia Fintech News

The Bitcoin price is struggling to maintain its bullish trend after a couple of bearish pullbacks. The rejection from $79,000 pushed the levels to $75,600, but the bull somehow bought the levels back to $77,700. On the other hand, the volume remains consistent during the decline and the current recovery, raising concerns about the sustainability of the rally. 

With a weak follow-through, resulting in the stacking of liquidity on both sides, it would be interesting to watch whether the BTC price breaks out above the consolidation or experiences a breakdown in the near term. 

Bitcoin Price Analysis: Here’s What’s Happening 

The BTC price has remained stuck within a rising parallel channel in the long term, keeping the bullish prospects alive. However, the consolidation may prevail for long as the short-term price action does not hint towards a strong breakout in the near term. The token is attempting a V-shaped recovery, but the upswing is expected to remain restricted below $78,500. 

btc price

The hourly chart of Bitcoin suggests that the price is recovering, while the volume is largely uneven. While the MACD suggests a rise in buying pressure, it remains within the negative range. This indicates the bears may soon absorb this pressure, as both the RSI and Stochastic RSI have reached the upper threshold, indicating the possibility of a brief correction. However, CMF is incremental, which suggests positive capital flow, which may help the bulls to defend the local support. This indicates a small period of consolidation until the BTC price either breaks above $80,000 or plunges below $75,000. 

Bitcoin Key Levels to Watch

Bitcoin is currently trading within a defined range, but recent price action shows growing pressure from sellers.

  • Major Resistance: $79,300 – $79,600
  • Range Resistance: $78,300 – $78,500
  • Immediate Support: $76,900
  • Lower Support Zone: $75,800 – $76,200

The $79K zone has already seen multiple rejections, confirming strong selling interest. Meanwhile, BTC is now testing the $76.9K level—a key pivot that could determine short-term direction.

What’s Next for the BTC Price?

Bitcoin price is not at a breakout; it’s at a trigger. Reclaim $78.3K–$78.5K, and this shifts fast. That opens a move toward $79.3K liquidity, with breakout continuation possible. Lose $76.9K, and the structure gives way. That exposes $76.2K–$75.8K, where liquidity sits. Until any of them break, the BTC is believed to remain within a consolidated range, setting up a trap for the traders. 

Why Are Bitcoin & Ethereum Prices Dropping? What’s Behind Today’s Crypto Market Correction?

Crypto Market

The post Why Are Bitcoin & Ethereum Prices Dropping? What’s Behind Today’s Crypto Market Correction? appeared first on Coinpedia Fintech News

Following a bullish weekly close, the crypto markets were believed to break above the bearish influence. Meanwhile, the fresh sell-offs restricted the rally, initiating a notable correction with the Bitcoin price struggling to hold above $75,000. Besides, Ethereum price slides below $2,300 and is currently trading around $2,270 vehicle XRP price plunges from $1.44 to $1.37. Moreover, the fear and greed index has slipped to 39, indicating the market sentiments have turned fearful. 

Why Crypto Market is Falling Today?

Crypto market cap is down by 2.53%, reaching $2.54 trillion with the volume rising close to $150 billion, hinting at excessive market participation. The markets are falling due to a combination of profit-taking and pre-FOMC meeting anxiety, causing a technical resistance rejection. Besides, deteriorating sentiment, ETF outflows, and increased selling volume are driving this downward movement, leading to over $281 million in long liquidations. 

On the other hand, hopes for a peace deal between the US and Iran have faded, which has driven crude oil prices. Therefore, stoking inflation fear could be pushing the investors away from the ‘risk assets’ like crypto. On the other hand, the crypto open interest has been consistently rising since March, reaching over $123 billion from the lows below $95 billion, out of which BTC OI accounts for $57 billion alone. 

This suggests the market volatility weighed on futures as the OI kept rising while demand relatively remained neutral. 

Bitcoin Price Slashes Below $76,000 Following Rejection 

Bitcoin price has been on a bullish track since the start of the month, with the prices rising from the support below $65,000 to marking local highs close to $79,500. The rejection that followed was not very likely, as the momentum was largely favoring the bulls. However, the technicals suggest a small correction, but if the BTC price fails to defend a local support, the correction may go deeper by 10% to 11%. 

btc price

As seen in the above chart, the Bitcoin price just faced a rejection from the resistance of the rising parallel channel. A breakout was believed to push the levels beyond the bearish influence, while the rising selling pressure could drag the rally to the support zone. The RSI is bearish, while the CMF is positive. This suggests the momentum may fade, but the bulls could save the rally from a strong bearish trend. Until the price sustains above the range between $71,600 and $72,300, the hopes of a rebound remain alive; otherwise, a drop to $67,000 is imminent. 

Ethereum Price Also Faces a Negative Impact

While Bitcoin displays strength, the Ethereum price rally hints at a lack of trader interest. The price has been rising since the start of the month and reached the resistance of the rising parallel channel, similar to BTC. However, the key difference here is the couple of fakeouts that occurred before, suggesting less conviction among the traders. Hence, the current pullback is expected to intensify, dragging the levels back within the consolidated range between $2,000 and $2100. 

eth price

Following the rejection from the resistance, the Bollinger bands have begun to squeeze, suggesting periods of low volatility. On the other hand, the OBV has been trading almost flat with minor variations, signalling a consolidation phase, low conviction and a ‘wait-and-see’ approach by market participants. The trade setup suggests a highly compressed market experiencing a potential fakeout or a weak breakout as price rise is not backed by volume. Therefore, the ETH price is likely to drop back to the consolidated zone around $2,100 if failed to defend the support at $2,200. 

❌