WLFI price is under sharp pressure today, with the token dropping over 16% in the last 24 hours as sentiment rapidly turns cautious. The decline followed a brief surge driven by new ecosystem developments, but momentum quickly faded as governance concerns triggered a broader market reaction.
Instead of attracting sustained demand, the latest updates have led to uncertainty, prompting traders to reduce exposure. With selling pressure accelerating and key levels breaking, the move signals a deeper shift in market confidence, positioning WLFI among the weakest performers in the current session.
Why WLFI Price Is Down Today
WLFI’s decline is being driven by a combination of fundamental uncertainty and negative market reaction to recent developments. On April 29, the project introduced a new consumer payment use case via a sports prediction platform, which initially sparked a short-term price spike.
However, sentiment quickly reversed following a controversial governance proposal that suggested delaying token unlocks and burning 10% of supply. While intended to reduce selling pressure, the proposal raised concerns around execution risk and long-term sustainability. This shift in perception triggered a rapid exit from positions, turning early optimism into caution. The current sell-off reflects a confidence breakdown, with traders choosing to reduce exposure rather than accumulate.
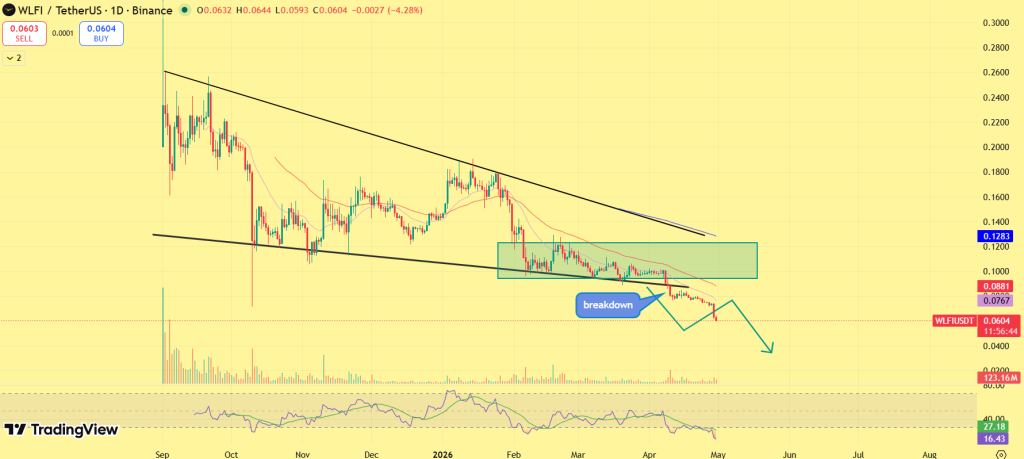
WLFI has decisively broken below its $0.076–$0.088 consolidation range, confirming a structural shift to the downside. This zone had acted as a short-term demand base, and its loss signals that buyers have stepped back while sellers retain control. The broader trend remains firmly bearish, with price continuing to print lower highs under descending resistance, keeping momentum tilted downward. While, rejection near the upper boundary of the range further reinforces weak buying strength, while price holding below key moving averages indicates sustained pressure.
With the breakdown now validated, the next immediate support is positioned around $0.055–$0.060, which aligns with prior liquidity zones. Until WLFI reclaims the lost range, any bounce is likely to be corrective rather than a trend reversal, keeping the market biased toward further downside in the near term.
Long Unwinding Drives the Sell-Off
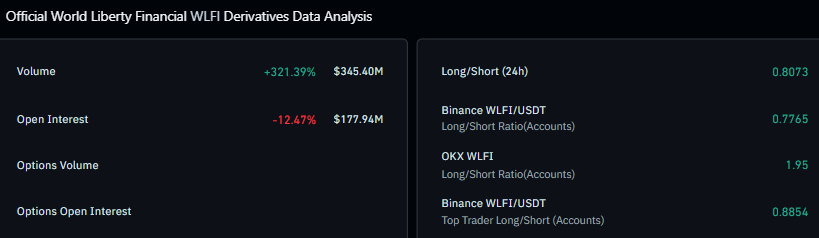
Derivatives data confirms that the move is being driven by position exits rather than fresh bearish positioning. Trading volume surged sharply to around $345 million, reflecting aggressive activity during the decline. At the same time, open interest dropped to approximately $177.9 million, indicating that traders are closing positions instead of opening new ones.
This divergence points to long unwinding, where leveraged bullish positions are being forced out of the market. The absence of open interest expansion suggests limited new conviction, leaving WLFI vulnerable to further downside if selling pressure continues.
Final Take
WLFI’s breakdown reflects a clear shift from optimism to caution, with both price structure and positioning turning weak. As long as key levels remain unclaimed, the trend favors continuation to the downside, with risk tilted toward further losses in the coming sessions.
Dogecoin is emerging as a rare outperformer in a weak crypto market today, holding firm while major assets struggle under macro pressure. The move is being driven by a sharp pickup in trading volume alongside a decline in open interest, an early signal of short covering rather than risky leverage buildup. This shift is giving DOGE price a cleaner structure compared to peers. As price stabilizes above key breakout levels, attention now turns to whether this momentum can extend further, with $0.110–$0.117 acting as the next critical test for a potential push toward $0.120.
Smart Money Rotation Signals Early Breakout Setup
A high-conviction move from large players is reinforcing the bullish setup. On-chain data shows a whale aggressively opening a 10x leveraged long position on 40 million DOGE (~$4.4M) within a short time frame, coinciding with a spike in volatility. This comes despite prior realized losses on the same wallet, signaling a deliberate re-entry rather than passive exposure.
Whale 0x8d0E is aggressively chasing the current price pump by opening a 10x leveraged long position on 40M $DOGE.
On-chain data from Hypurrscan confirms the $4.4M position was built over the last two hours as the asset experienced a sudden spike… pic.twitter.com/2znVyQOTo5
Derivative data further strengthens the narrative. Trading volume has surged over 104% to ~$6.29B, while open interest has declined around 3.16% to ~$1.68B. This divergence is critical, price strength is being driven by short covering rather than fresh leveraged longs, reducing liquidation risk and supporting a more sustainable upside structure.
Technically, the breakout above $0.1018 aligns with this positioning shift, suggesting the move is structurally supported rather than purely speculative.
Macro Pressure Builds, DOGE Stands Out
The broader crypto market remains under pressure, with Bitcoin price slipping nearly 2% intraday to $75K, reflecting cautious sentiment amid tight liquidity and macro uncertainty. Major altcoins continue to struggle, reinforcing a risk-off tone across the market.
In contrast, Dogecoin is up roughly 2%, clearly diverging from the broader trend. This relative outperformance highlights selective capital rotation into assets with stronger momentum and cleaner positioning. While the market weakens, DOGE is absorbing pressure and holding structure, an early sign of leadership in uncertain conditions.
Dogecoin Price Outlook: Can DOGE Break $0.1200?
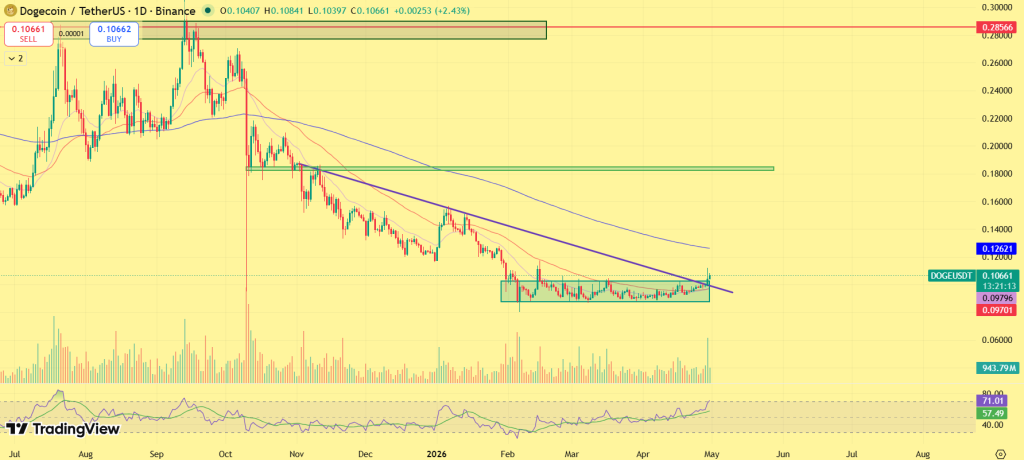
Dogecoin’s structure has flipped decisively bullish after reclaiming the $0.101–$0.102 zone, turning prior resistance into a firm demand base. DOGE price is now breaking out, forming higher lows, signaling controlled accumulation rather than impulsive buying.
The next critical barrier sits at $0.117, aligned with the upper channel range. A continuous upward move above $0.117 above this zone would open the path toward $0.120, where upside liquidity is clustered. On the downside, $0.100 remains the key support pivot. Holding this level keeps the bullish structure intact, while a breakdown would weaken momentum and shift focus back toward lower demand zones.
Final Take: Structural Strength Favors Continuation
Dogecoin’s outperformance is being driven by a rare alignment, rising volume, declining open interest, and clear relative strength against a falling market. This combination signals a cleaner, more sustainable move compared to peers weighed down by weak structure. As long as $0.100 holds, the bullish setup remains intact. A confirmed breakout above $0.110–$0.117 could accelerate momentum toward $0.120 in the upcoming sessions, positioning DOGE as a near-term leader if broader conditions stabilize.
Crypto market is down today as the Federal Reserve reinforces a “no rush to cut” stance, tightening expectations around liquidity. Despite holding rates steady, the central bank pointed to prolonged restrictive conditions, which historically weighs on high-risk assets like crypto.
Bitcoin, Ethereum, and XRP have all moved lower as liquidity expectations tightened and risk appetite faded. The market had entered this event on strong footing after April’s rally, but the tone from policymakers quickly reversed momentum, triggering broad-based selling pressure. Traders are now reassessing positioning as volatility returns and key support levels come into focus.
So, What’s driving this decline, and why crypto market is down today as macro conditions turn restrictive again?
The Federal Reserve kept interest rates unchanged at 3.50%–3.75% in its latest meeting, but the decision itself was not the market mover, the messaging was. Policymakers emphasized that inflation remains persistent and risks are still tilted to the upside, leaving little room for near-term rate cuts.
JUST IN: THE FED LEFT INTEREST RATES UNCHANGED AT 3.50% TO 3.75%, BUT THE VOTE WAS THE MOST DIVIDED FOMC DECISION SINCE OCTOBER 1992
The vote: 8-4 in favor of holding rates.
The dissents went in opposite directions: – Miran dissented in favor of a 0.25% rate cut – Hammack,… pic.twitter.com/shAPgoNFUf
The statement reinforced a “higher-for-longer” stance, with the Fed indicating that restrictive policy will remain in place until clearer progress on inflation is achieved. This directly impacts liquidity expectations, which are a key driver for risk assets like crypto.
Market reaction was immediate. Bitcoin and broader crypto assets saw selling pressure following the announcement, as traders adjusted positioning to reflect delayed easing. The tone from policymakers suggests that any pivot is likely to be gradual, not imminent, keeping financial conditions tight in the near term.
With rate cuts pushed further out and uncertainty around inflation still elevated, the Fed’s stance has shifted the market into a more cautious, defensive phase.
Bitcoin Price Analysis: Fed Aftershock Sparks Rejection – Is Another Leg Down Coming?
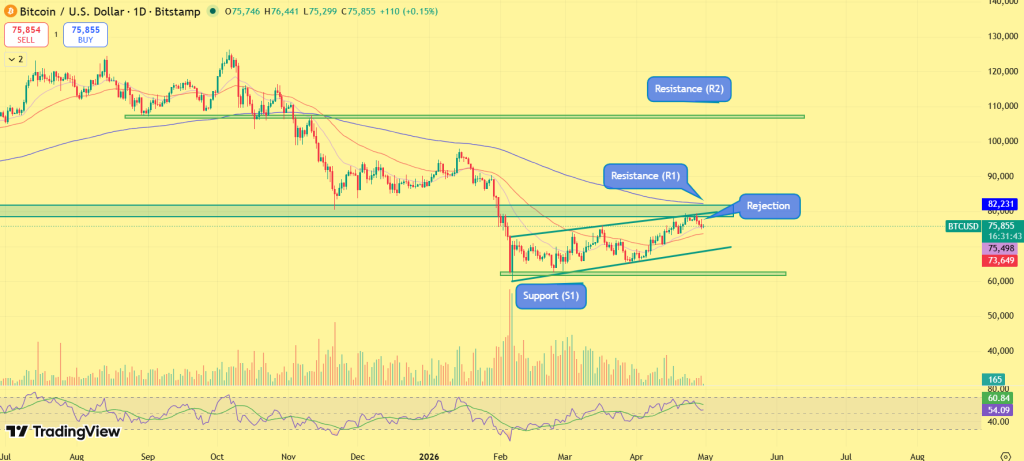
Following the FOMC decision, Bitcoin faced immediate selling pressure, with price rejecting sharply near the $82,000 resistance as liquidity expectations tightened. The move aligns with the broader risk-off shift, where upside momentum failed to sustain despite a strong April rally.
The Bitcoin value today is hovering around the $75,000–$76,000 range, reflecting fading strength within the rising structure. At the same time, the Bitcoin Fear & Greed Index has dropped to 29 (Fear), confirming a clear shift in sentiment as traders turn cautious after the Fed’s stance.
The higher low structure remains intact, but repeated failure at resistance is weakening bullish control. The $73,500 level now acts as immediate support; a break below this zone could accelerate downside toward $70,000.
On the upside, reclaiming $82,000 is required to restore momentum and shift the structure back in favor of buyers. For now, price action is beginning to reflect a more measured tone, where liquidity conditions and sentiment are taking precedence over trend strength. Until resistance is reclaimed with conviction, Bitcoin price remains positioned in a reactive phase, with downside risk gradually building beneath the surface.
Ethereum Price Outlook: Selling Pressure Builds as Range Top Rejects Bulls
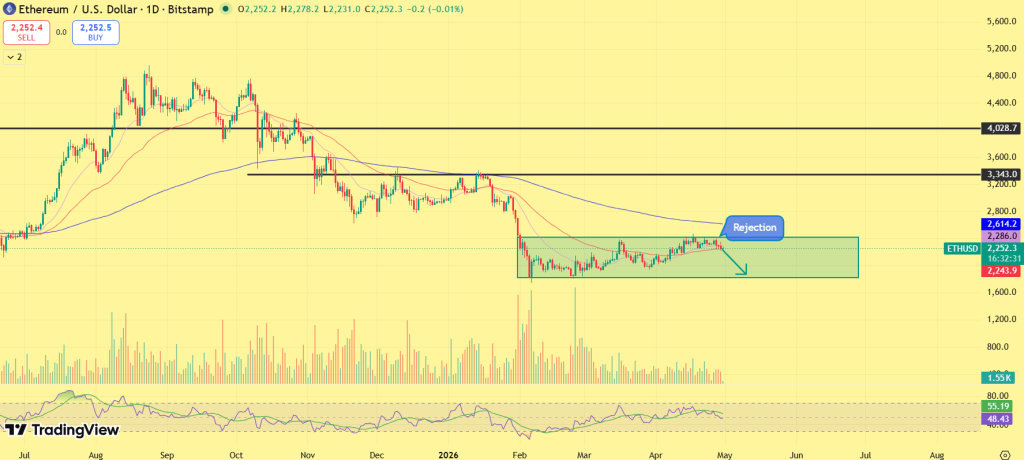
Ethereum is beginning to show signs of weakness after another rejection near the $2,500 resistance zone, indicating that buyers are struggling to maintain upward momentum. The coin has declined 3.60% overnight, underperforming Bitcoin and highlighting increased sensitivity to macro pressure.
ETH is currently trading near the $2,200–$2,250 range, holding within a broader consolidation structure. However, failure to reclaim higher levels suggests that the range could soon resolve to the downside. The $2,150–$2,200 zone acts as immediate support, with a breakdown potentially opening a move toward $1,900. Reclaiming $2,600 is essential to re-establish bullish momentum.
XRP Price Prediction: Range Compression Near Demand Signals Imminent Move
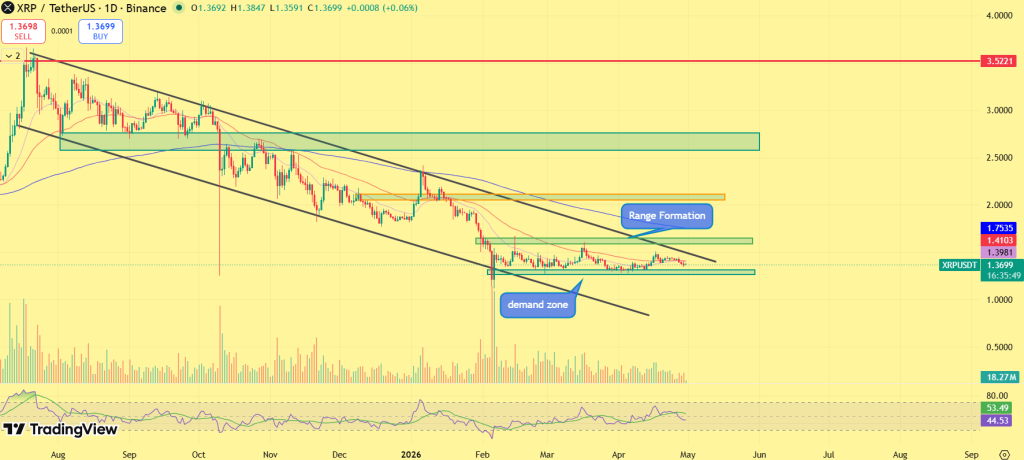
XRP price continues to trade in a compressed range near its demand zone, reflecting a market lacking strong directional conviction. Price has slipped 2.30% overnight, aligning with the broader market weakness and reinforcing the cautious tone. Currently trading around $1.35–$1.40, XRP remains within a narrowing channel following a prolonged downtrend. This structure typically precedes a decisive breakout or breakdown.
The $1.30–$1.35 zone serves as critical support. A breakdown below this level could accelerate downside toward $1.10. On the upside, resistance stands near $1.70, with a broader supply zone at $2.20–$2.40 acting as a key barrier for any sustained recovery. Until a breakout occurs, XRP remains in a consolidation phase, with volatility compressing and pressure building beneath the surface.
What’s Next for BTC, ETH and XRP
As May unfolds, price action is likely to remain range-bound with a bearish tilt unless key resistance levels are reclaimed. Bitcoin above $82,000, Ethereum above $2,600, and XRP above $1.70 are critical to shift momentum. Until then, rallies may continue to face selling pressure, with markets leaning cautious as participants await clearer signals on policy direction and liquidity conditions.
HBAR price prediction for 2026 suggests potential highs of $1.05
Long term forecasts indicate HBAR could reach $2.20 by 2030.
Hedera has been making waves in the cryptocurrency space, with a fast and secure blockchain that offers a distinct approach to transaction processing compared to Ethereum and other smart contract chains. It’s permission-only, meaning the blockchain is managed by private companies. Limiting what types of decentralised applications are allowed is what makes Hedera stand out from the rest.
Having entered the top 20 digital assets by market cap in 2024, it is now eyeing a potential leap into the top 10 by the end of 2025. Hedera has also recently ramped up its development activities for its ecosystem. Its ecosystem is strengthening, despite its capped price action. With increasing real-world use cases, institutional interest, and strategic partnerships, many are closely tracking HBAR price chart 2025 to gauge how high the token can rise.
With major companies like Google, IBM, and Chainlink Labs backing the project, and discussions about SEC approved HBAR ETF would flood string liquidity. Many are intrigued that: Will the HBAR Price Reach $1? Let’s discuss this in our Hedera price prediction 2025 article.
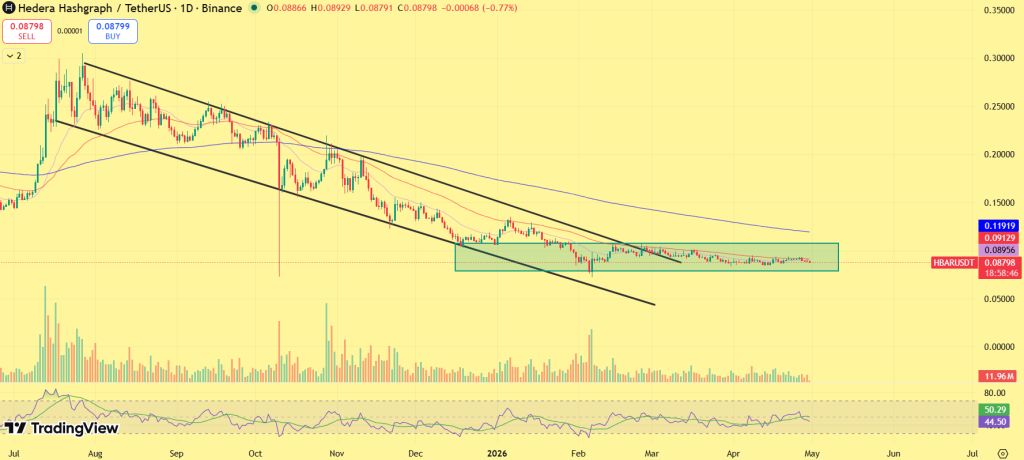
As May approaches, HBAR’s price action continues to reflect a market stabilizing after a prolonged corrective phase, with price holding around the $0.085–$0.09 support zone. Following months of consistent lower highs, the structure is now showing early signs of base formation, indicating that selling pressure has eased and the market is transitioning into consolidation.
HBAR is currently trading within a tight range, with price compressing just below short-term resistance while maintaining support. This narrowing structure suggests that volatility is declining and participation is gradually building, conditions that typically precede a directional move.
The immediate focus now shifts to the $0.10–$0.11 resistance zone. A sustained move above this band would confirm a breakout from the current consolidation, opening the path toward the $0.13–$0.15 range, where previous supply is likely to re-emerge. If momentum strengthens alongside broader market support, the move could extend further toward $0.18.
If HBAR fails to reclaim resistance and faces rejection, the price may continue to consolidate within the current range. A breakdown below the $0.085 support could weaken the setup, potentially pushing the asset toward the $0.075 region and delaying the recovery phase.
For May 2026, HBAR is expected to remain in a consolidation phase, with a move toward $0.13–$0.15 possible if resistance is reclaimed, while failure to break higher could keep the price range-bound as the market continues to build a base.
Recent Catalysts For HBAR
Strengthening enterprise narrative, with continued traction from global corporations and governing council expansion, reinforcing Hedera’s long-term institutional positioning.
Rising trading volume and steady price stability near key support suggest early accumulation, indicating that smart money may be positioning ahead of a potential move.
Improving broader market sentiment and capital rotation toward utility-driven altcoins are creating a supportive backdrop for HBAR’s recovery phase.
Coinpedia’s Hedera (HBAR) Price Prediction 2026
Heading deeper into 2026, Hedera is likely to move through a recovery cycle rather than an immediate breakout phase. The current structure suggests that the market is gradually shifting from accumulation toward early expansion.
The first important level to watch is the $0.20–$0.25 range, which previously acted as a major resistance zone. Reclaiming this level would signal that HBAR has moved beyond its base formation and entered a recovery phase. Once this level is secured, the price could move toward $0.40–$0.50, where stronger selling pressure may appear. This zone will act as a key test of whether the recovery has enough strength to continue.
If the broader market enters a bullish phase and enterprise adoption within the Hedera ecosystem continues to expand, HBAR could gradually build momentum. In a favorable scenario, HBAR could reach around $0.65 by 2026, reflecting a structured recovery rather than a sharp rally.
The long-term projection assumes Hedera sustains relevance in enterprise blockchain use cases, with growth moderating over time as the asset matures.
HBAR Price Prediction 2026 – 2030
Year
Potential Low ($)
Potential Average ($
Potential High ($)
2026
0.45
0.80
1.05
2027
0.65
1.00
1.20
2028
0.80
1.10
1.60
2029
0.90
1.60
2.20
2030
1.40
2.20
3.00
HBAR Price Prediction 2026
Moving forward to 2026, forecast prices and technical analysis project that Hedera’s price is expected to reach a minimum of $0.45. The price could escalate to $1.05 on the higher end, with an average trading price hovering around $0.80.
HBAR Price Forecast 2027
Looking ahead to 2027, the optimism around Hedera will lead to steady growth. Hence, the HBAR price is forecasted to reach a low of $0.65, with a potential high touching $1.20 and an average forecast price of $1.00.
Hedera Price Forecast 2028
As we advance to 2028, with moderate gains, the HBAR predictions indicate that the price of a single HBAR could reach a minimum of $0.80, with the ceiling potentially rising to $1.60. Within the range, the average price will be $1.10.
HBAR Price Target 2029
By the time 2029 rolls around, it’s predicted that Hedera’s price will maintain its upward trajectory, reaching a minimum of $0.90, with the maximum price possibly reaching $2.20 and an average of $1.60, reflecting cautious optimism.
Hedera Price Prediction 2030
By the end of this decade, HBAR is predicted to touch its lowest price at $1.40, aiming for a high of $3.00 and an average price of $2.20. Hence, the prediction suggests stable long-term growth for Hedera’s market value.
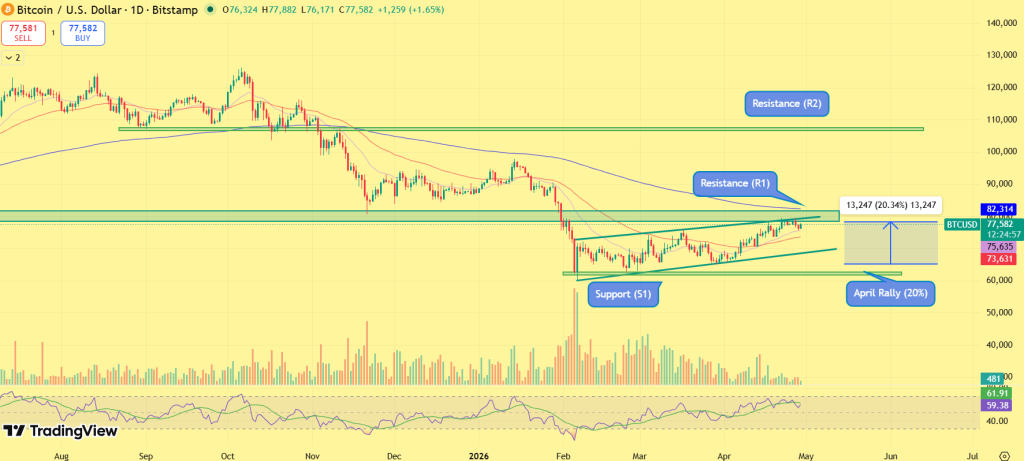
Bitcoin is heading into the Federal Reserve decision today with a stretched rally and weakening momentum, conditions that have historically triggered sharp post-FOMC sell-offs. After climbing more than 20% through April and reclaiming the $75,000–$79,000 range, BTC price action is now stalling just below key resistance near $80,000. This setup has played out repeatedly over the past year, where strong pre-event gains were followed by rapid declines within 48 hours.
With Jerome Powell set to deliver his final policy speech today, markets are entering a high-volatility window, what comes next in the next 24 hours could define Bitcoin’s immediate trend.
Macro Setup: Fed Decision Priced In, Tone Becomes the Trigger
Going into today’s FOMC meeting, the rate decision itself is largely a non-event, markets are already positioned for a pause, shifting all attention toward Powell’s forward guidance.
Today, Jerome Powell will deliver his last FOMC press conference as Federal Reserve Chair. pic.twitter.com/demmFPDfUg
April’s rally was driven by expectations of policy easing later in 2026. However, macro conditions remain mixed. Inflation continues to show persistence, while elevated energy prices are limiting the Fed’s flexibility. This reinforces a “higher for longer” rate backdrop, which typically constrains risk-asset upside in the near term.
Moreover, sentiment positioning further reflects this balance. The Fear & Greed Index around 40 signals cautious optimism, far from euphoric conditions, but also not at levels that typically support aggressive accumulation. This leaves Bitcoin highly sensitive to messaging. A hawkish tilt could trigger a rapid unwind, while even a neutral tone may struggle to extend gains meaningfully.
Bitcoin’s behavior around FOMC meetings has been consistent and data-backed. Strong rallies leading into the event are often followed by downside reactions shortly after. Recent outcomes reinforce this structure:
January 2026: ~7–8% decline within 48 hours
March 2026: ~4% drop post-meeting
December 2025: ~8% decline
September 2025: ~4–5% pullback
Across the last nine meetings, eight have resulted in downside within two days, despite largely expected rate outcomes. The underlying mechanism is positioning. Gains are typically front-loaded as expectations build, and once the event passes, profit-taking and leverage unwinds dominate price action. With Bitcoin entering today’s decision after a strong April advance, the same pattern risk is elevated.
Institutional Signals: Strong Inflows, Now Losing Acceleration
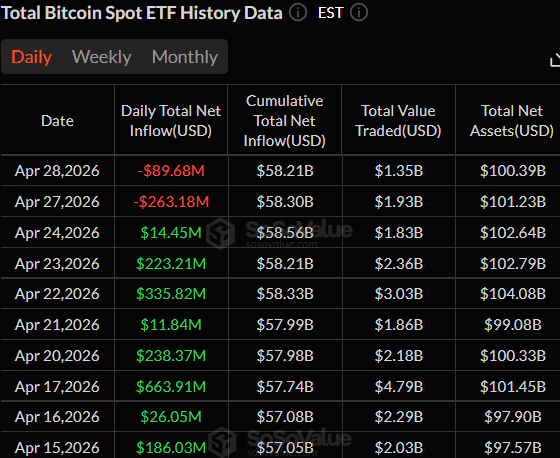
Institutional participation was a primary driver of April’s rally. Spot Bitcoin ETFs recorded over $2.1 billion in net inflows across 8–9 consecutive sessions, pushing price higher and reinforcing bullish conviction. This period marked one of the strongest short-term accumulation phases in recent months.
However, that momentum is now showing signs of fatigue. Inflows have slowed, and intermittent outflows have started to appear, indicating that large participants are no longer adding aggressively at elevated levels.
Derivatives data adds another layer. Open interest has expanded alongside price, but without corresponding breakout continuation. This divergence typically reflects hedging activity and crowded positioning, rather than fresh directional conviction.
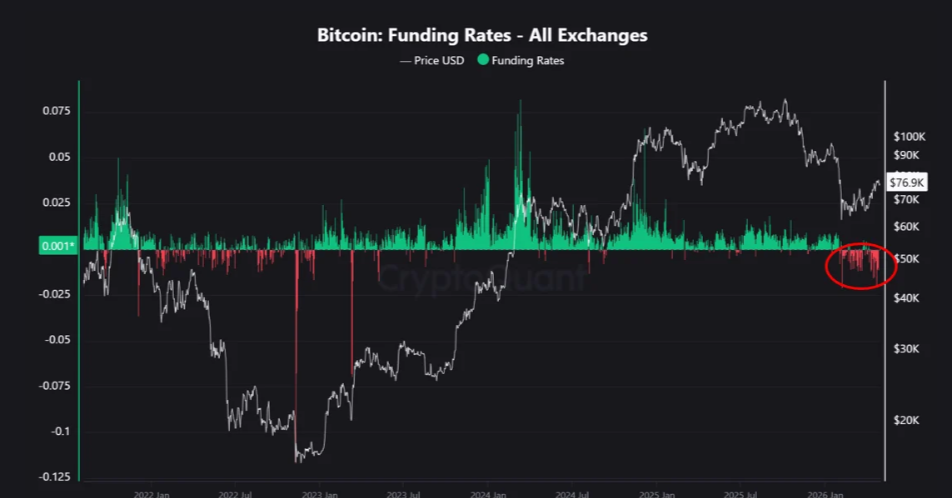
Funding rates remain mixed, oscillating between positive and neutral territory, further confirming a lack of clear institutional bias. The implication is structural: institutions helped fuel the upside, but are now managing risk ahead of the event, leaving the market more vulnerable to volatility.
Bitcoin Price Analysis: April Rally Meets Resistance Wall
Bitcoin (BTC) April’s move from the $65K region to nearly $79K established a clean bullish structure, supported by higher lows and consistent volume expansion. As Bitcoin rice remains above both the 20-day and 50-day EMAs, with the faster average maintaining a lead, confirming trend alignment. However, momentum is now compressing beneath a critical resistance band.
The $80K–$82K zone (R1) has capped multiple breakout attempts, with price repeatedly rejecting from this region. This behavior reflects supply absorption and short-term distribution, particularly ahead of a macro catalyst. On the downside, immediate support is located near $75K (S1), aligned with the rising trendline and recent consolidation base. A sustained break below this level would expose $72K–$70K, where the next significant demand cluster sits.
While the EMA structure remains bullish, slope momentum is flattening, indicating early-stage exhaustion rather than continuation strength. In current conditions, the structure favors a reaction-driven move, with downside risk increasing if support fails.
Next 24 Hours: Reaction Scenarios in Play
With positioning stretched and volatility compressed, the market is primed for a decisive move:
With resistance intact and institutional momentum slowing, the setup favors a reaction-driven move. If Powell leans hawkish, downside could unfold quickly, making the next 24 hours critical in deciding whether this rally continues or resets.
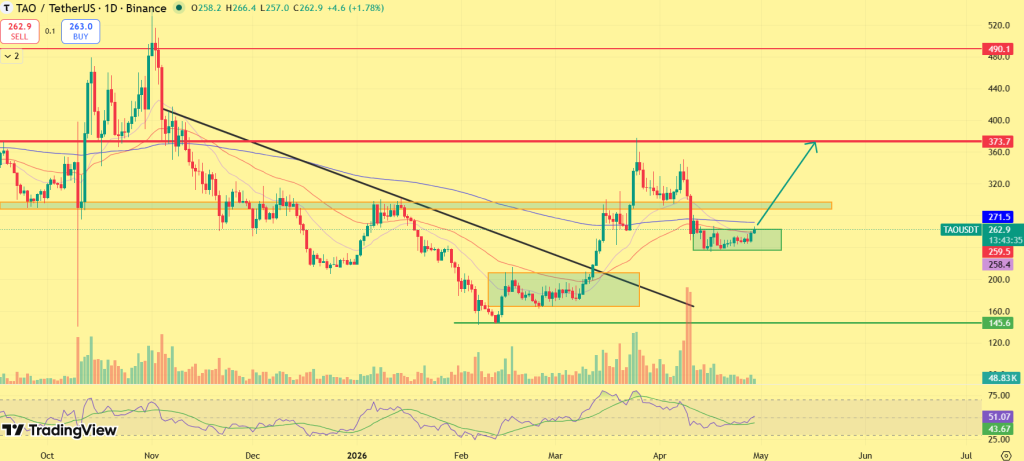
After weeks of consolidation, Bittensor (TAO) is beginning to flash early recovery signals as buyers step in near critical support levels. Bittensor price, currently hovering around $260, is attempting to build a base following its sharp decline from earlier highs, with price action now transitioning into a more structured accumulation phase.
At the same time, increasing open interest and renewed market participation point to growing trader engagement. Backed by a strengthening AI narrative and institutional inflows, TAO is now approaching a decisive phase, where a sustained push above resistance could trigger a broader move toward the $370 region.
Q1 Performance Reflects Reset Before Structural Recovery
The Q1 2026 marked a volatile but necessary reset phase for TAO. Bittensor price action opened near $300, dropped sharply to a low around $230, and eventually stabilized close to $251 by the end of the quarter, delivering a +21% recovery from the lows.
This movement highlights a classic cycle transition, where early euphoria was followed by distribution and correction, before finding a demand base. Importantly, the ability to recover into the quarter close suggests that selling pressure was absorbed rather than extended, laying the groundwork for the current consolidation phase. Alongside price action, ecosystem growth remained intact, indicating that the correction was largely technical rather than driven by weakening fundamentals.
AI Utility and Institutional Flows Strengthen TAO’s Positioning
Bittensor’s positioning as a decentralized AI infrastructure layer is gaining measurable traction. The network generated $43 million in Q1 revenue from real AI usage, supported by a growing ecosystem of over 70 active nodes, signaling that adoption is moving beyond narrative into execution.
Institutional alignment is also becoming more visible. The launch of a Grayscale TAO trust, along with reported allocations from major funds, reflects increasing confidence in AI-linked crypto infrastructure. This combination of real usage and capital inflows is gradually reinforcing TAO’s credibility within the broader market. The shift toward fundamentals-driven demand is now becoming a key factor behind the ongoing stabilization in price.
TAO Price Analysis: Accumulation Structure Builds Below Resistance
TAO price analysis hints at a clear transition from downtrend to accumulation. A strong demand base has formed in the $250–$258 range, where repeated downside moves have been absorbed, indicating sustained buyer interest. TAO price is now holding above short-term moving averages, with early signs of a bullish crossover developing. The formation of higher lows suggests that accumulation is underway, with volatility compressing ahead of a potential expansion.
The $300 level remains the immediate resistance and key breakout trigger. A confirmed move above this zone would likely open the path toward the $360–$370 supply region, where previous rejections occurred. On the downside, losing the current base would expose TAO to a deeper retest of the $230 support, invalidating the short-term recovery structure.
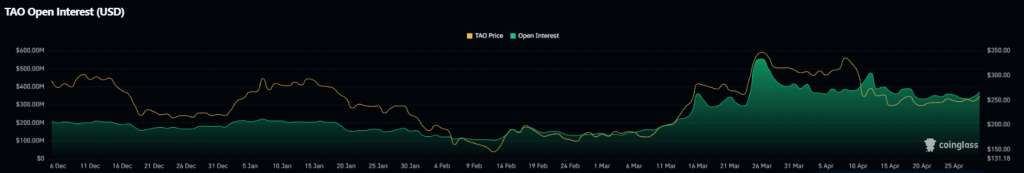
Derivatives Data Signals Growing Market Participation
Market participation is beginning to expand alongside the improving structure. Futures volume has increased significantly, while open interest has risen over 10%, indicating fresh capital entering positions rather than passive movement.
This rise in engagement suggests that traders are positioning for a potential breakout scenario. If supported by continued price stability, derivatives activity could act as a catalyst for the next directional move.
What’s Next for Bittensor (TAO)?
TAO is holding firm above its key base near $250, keeping the recovery structure intact. A breakout above $300 remains the immediate trigger, which could quickly drive momentum toward the $360–$370 zone as sentiment and participation improve. Failure to reclaim higher levels, however, may extend consolidation and delay the upside move. For now, TAO sits at a pivotal point, breakout or continued range.
The recent uptick in Pi Network price is gaining attention as the token rises over 6% today, extending its weekly gains to nearly 16%. After a prolonged consolidation near lower support levels, Pi Network is now seeing renewed participation, with the rally backed by catalysts such as the Protocol 22 upgrade and growing visibility ahead of major events.
At the same time, improving user metrics and tighter supply conditions are reinforcing the move, suggesting this is not a random spike but a narrative-driven shift. Here are the key developments explaining the current rally.
Protocol 22 Upgrade Shifts Focus Toward Utility
A key driver behind the current upside is the Protocol 22 upgrade, which is expected to improve network performance and move Pi Network closer to functional smart contract capability. This marks a transition in narrative, from a mining-focused ecosystem toward a utility-driven platform.
The Pi Mainnet is upgrading to Protocol 22 – Deadline: Apr 27.
All Mainnet nodes are required to complete this step before the deadline to remain connected to the network.
Markets typically begin pricing such structural changes ahead of execution, and the current move reflects early positioning rather than post-event reaction. As anticipation builds, demand is gradually strengthening, aligning price action with forward-looking expectations around ecosystem expansion.
Consensus 2026 Visibility Adds Momentum Layer
Another factor supporting Pi Network price is the growing attention around Consensus 2026 in Miami, where Pi Network’s founders are expected to appear. Events of this scale tend to amplify visibility and attract new participation, particularly for ecosystems still in their growth phase.
The impact is already visible in sentiment, with traders positioning ahead of increased exposure rather than reacting afterward. This layer of narrative is helping sustain momentum rather than create short-lived spikes.
User Growth and Supply Dynamics Support the Move
Beyond narrative, underlying data is reinforcing the rally. Pi Network has surpassed 18 million KYC-verified users, highlighting continued expansion of its active ecosystem. At the same time, exchange flow trends suggest outflows exceeding inflows, indicating reduced immediate sell pressure. When supply on exchanges tightens while demand increases, it creates a supportive environment for sustained upside. This combination of user growth and supply tightening adds structural strength to the ongoing move.
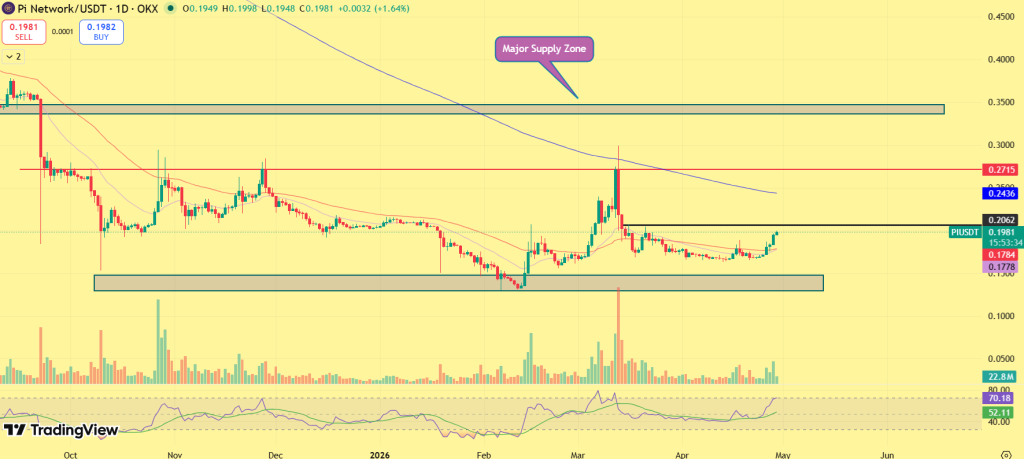
Pi Network Price Nears $0.20 Breakout as Bullish Structure Strengthens
A clear shift is now visible on the chart, with buyers steadily building control after weeks of muted price action. The recovery from lower levels has not been impulsive, it has been sustained, marked by seven consecutive green candles, reflecting consistent demand rather than short-term volatility.
The move is also gaining traction. Trading volume has increased alongside the rally, indicating that the upside is supported by active accumulation rather than thin liquidity.
Trend signals are turning favorable. The 20-day EMA has crossed above the 50-day EMA, forming a bullish crossover, while price continues to trade above both averages. This setup typically reflects strengthening momentum and early trend development.
Focus now shifts to the $0.20 resistance zone, which is being tested as the immediate barrier. A sustained move above this level would confirm a breakout structure and expose the next upside region near $0.27, where previous supply has been concentrated. Until then, the formation of higher lows and continued strength above moving averages keeps the near-term bias aligned with further upside.
What’s Next for Pi Network?
The current rally in Pi Network price reflects a shift from passive accumulation into early momentum. If participation continues and price holds strength above key levels, the move can extend toward higher resistance zones. If momentum fades, the market may return to consolidation, but for now, the structure favors continuation over reversal.
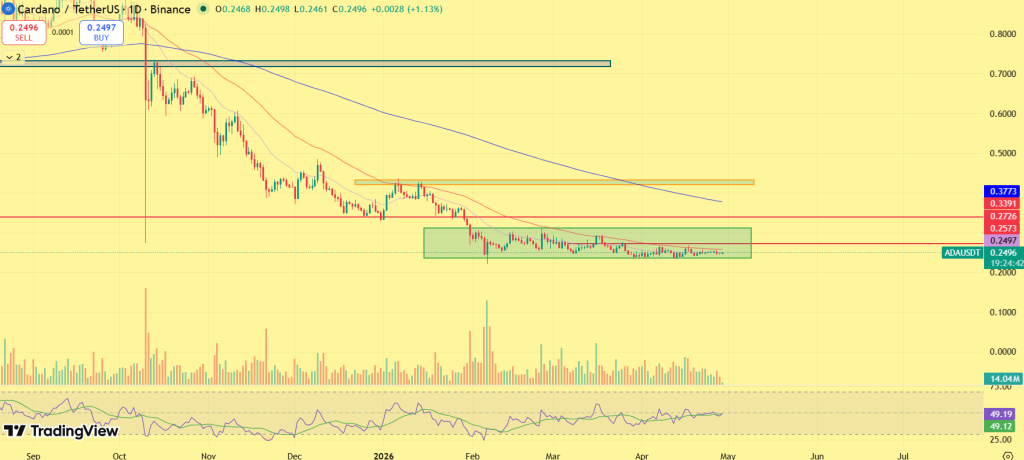
The live price of the Cardano token is $ 0.24951510.
Cardano price could see a potential upside toward $5.00 by the end of 2026.
ADA’s long-term expansion scenario points toward $350.00 by 2030.
Cardano (ADA), one of the most research-driven Layer-1 blockchains, is now entering a critical phase of execution after years of development-focused growth. While its earlier roadmap emphasized peer-reviewed innovation and network stability, the current cycle is increasingly centered around scalability, real-world utility, and ecosystem expansion.
The ongoing evolution of Cardano is being shaped by major upgrades, including the introduction of privacy-focused infrastructure through Midnight and scalability advancements targeting significantly higher throughput. These developments are positioning the network to compete more aggressively with leading smart contract platforms, particularly in areas such as DeFi, enterprise applications, and regulated use cases.
As the network transitions into this execution-driven phase, the key question for 2026 is whether these technological advancements can translate into sustained adoption and capital inflows. With fundamentals strengthening beneath the surface, Cardano’s next move may depend on how effectively it converts innovation into measurable network growth and price momentum.
This article delves into Cardano’s 2026 outlook and long-term price prediction, analyzing whether these catalysts can translate into a sustained breakout. Explore this Cardano price prediction 2026 and beyond, filled with expert insights and ambitious forecasts.
Cardano’s recent developments point to a shift from roadmap delivery to early-stage execution.
Protocol upgrade nearing: Cardano is preparing for a governance-focused hard fork, enabling full on-chain voting and treasury control.
Privacy + institutional angle: The Midnight sidechain is strengthening Cardano’s positioning for compliance-driven and enterprise use cases.
Whale accumulation continues: Large holders are building positions during consolidation, indicating demand beneath resistance.
Macro + weak momentum: ADA remains capped in a cautious market, with compression signaling a pending directional move.
Cardano April Price Prediction 2026
Cardano is holding near $0.248, with price action firmly in a consolidation phase after an extended period of decline. The $0.23–$0.24 zone has repeatedly acted as support, indicating that downside pressure has eased, while buyers continue to defend lower levels. At the same time, the market is not showing strong upside follow-through, keeping ADA confined within a defined range.
ADA price is trading just below the $0.28–$0.30 resistance band, where previous recovery attempts have stalled. However, the nature of price action has shifted, rejections are becoming less aggressive, and pullbacks are shallow. This suggests that supply at higher levels is gradually being absorbed, even though a breakout has not yet been confirmed.
Heading into May, the setup is approaching a decision point. A sustained move above $0.30 would signal a structural shift, opening the path toward $0.34–$0.38 as the next area of interest. Until that level is reclaimed, ADA is likely to remain range-bound, rotating between established support and resistance as the market builds momentum. On the downside, the $0.22 level remains critical. A break below this zone would weaken the structure and extend the consolidation phase.
For May 2026, Cardano is expected to trade between $0.22 and $0.38, with a breakout above $0.30 required to confirm further upside.
Coinpedia’s Cardano (ADA) Price Prediction 2026
Cardano’s price outlook for 2026 is increasingly shaped by a transition phase, where prolonged weakness is giving way to a more stable and controlled structure. After months of consistent lower highs, ADA has started to hold firm around the $0.24–$0.25 zone, suggesting that selling pressure is no longer as dominant as before, even as activity across the ecosystem continues to build gradually in the background.
The key challenge remains the $0.45–$0.60 range, which has repeatedly acted as a barrier during past recovery attempts. This zone now carries added significance, as it coincides with a phase where improving network activity, ongoing development upgrades, and a broader shift in market sentiment toward altcoins are beginning to align with price structure.
A sustained move above this range would signal a clear shift in trend, allowing ADA to move beyond consolidation and enter a more defined recovery phase. In such a scenario, the price could gradually expand toward the $1.20–$2.20 range through 2026, supported not only by structural improvement but also by increasing participation and capital rotation within the market.
At the same time, failure to reclaim this resistance may extend the current range-bound phase. Even then, the consistent defense of lower levels, combined with steady ecosystem progress, suggests that downside risk remains limited, with the market continuing to build a base over time.
Overall, Cardano is no longer in a declining phase, it is positioned just below a critical resistance zone, where both structure and underlying momentum are beginning to align, and how it reacts here will ultimately define its 2026 trajectory.
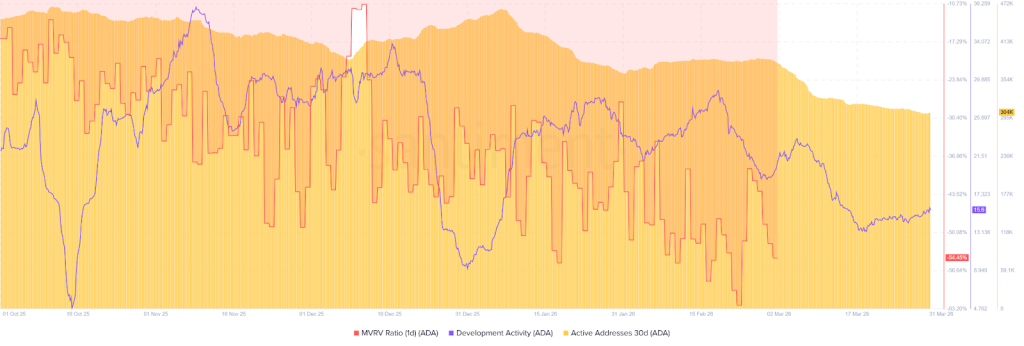
Cardano On-Chain Analysis
Cardano’s on-chain metrics are beginning to align toward a constructive setup, suggesting that underlying conditions may be improving ahead of a broader price expansion phase. The MVRV Ratio (30D) remains in negative territory, indicating that a large portion of holders are currently below their cost basis. From a market structure standpoint, this phase has historically coincided with accumulation zones, where downside risk tends to compress and long-term investors gradually increase exposure.
At the same time, development activity continues to hold steady, reflecting sustained builder engagement despite muted price performance. This consistency reinforces confidence in Cardano’s long-term roadmap, particularly as key upgrades move closer to implementation.
While active addresses (30D) have softened in recent weeks, this can be interpreted within the context of a consolidation phase rather than structural weakness. Periods of reduced activity often precede renewed participation, especially when supported by improving fundamentals and upcoming catalysts.
The combination of undervalued conditions (MVRV), consistent development momentum, and stabilizing network activity suggests that Cardano may be transitioning into an early-stage accumulation phase ahead of potential expansion.
Rather than signaling weakness, current on-chain conditions point toward quiet capital positioning and foundational strength, with the potential for demand to reaccelerate as catalysts begin to translate into real network activity.
Cardano (ADA) Price Prediction 2026 – 2030
Price Prediction
Potential Low ($)
Average Price ($)
Potential High ($)
2026
2.75
3.00
3.25
2027
4.50
4.75
5.00
2028
5.25
5.50
5.75
2029
6.75
7.25
7.75
2030
9.00
9.75
10.25
This table, based on historical movements, shows ADA prices to reach $10.25 by 2030 based on compounding market cap each year. This table provides a framework for understanding the potential Cardano price movements. Yet, the actual price will depend on a combination of market dynamics, investor behavior, and external factors influencing the cryptocurrency landscape.
Based on the historic market sentiments and trend analysis of the altcoin, here are the possible Cardano price targets for the longer time frames.
Never Miss a Beat in the Crypto World!
Stay ahead with breaking news, expert analysis, and real-time updates on the latest trends in Bitcoin, altcoins, DeFi, NFTs, and more.
FAQs
What is Cardano’s (ADA) price prediction for 2026?
Cardano could trade between $2.75 and $3.25 in 2026, with an average near $3. If bullish momentum strengthens, some forecasts see ADA potentially reaching $4.50.
How much will Cardano cost in 2030?
Cardano could trade between $9.00 and $10.25 by 2030, with an average near $9.75 if adoption grows and the broader crypto market continues expanding.
How high can Cardano go in 2040?
Long-term projections suggest Cardano could reach up to $70 by 2040 if blockchain adoption accelerates and ADA maintains strong ecosystem growth.
What will ADA be worth in 2050?
Some long-term models estimate ADA could reach around $200 on average and up to $350 by 2050, depending on global adoption and market maturity.
Is Cardano a good long-term investment?
Cardano is considered a long-term project due to its research-driven development, scalability upgrades, and focus on decentralization.
What factors could drive ADA’s price higher in the future?
ETF approval, institutional adoption, network upgrades, and improved macro conditions could all positively impact ADA’s price.