Just when Telegram-based Play-to-Earn (P2E) tokens looked completely written off, they’re suddenly back from the dead and moved fast. The trigger today? A sharp 6x drop in TON blockchain fees, now sitting near zero, per Pavel Durov CEO and founder of Telegram. That single shift flipped sentiment overnight, dragging the entire ecosystem along for the ride.
TON Fee Cuts Spark Sudden Ecosystem Revival
Well, on its ecosystem, lower fees didn’t just improve usability but even they reignited speculation. TON token price itself surged roughly 40% intraday, instantly pulling attention back to a chain many had quietly ignored or acted to forgot.
Now, this move shows that cheap transactions will mean more activity. More activity means more hype. And in crypto, that’s often enough.
P2E Tokens Ride TON’s Explosive Momentum Wave
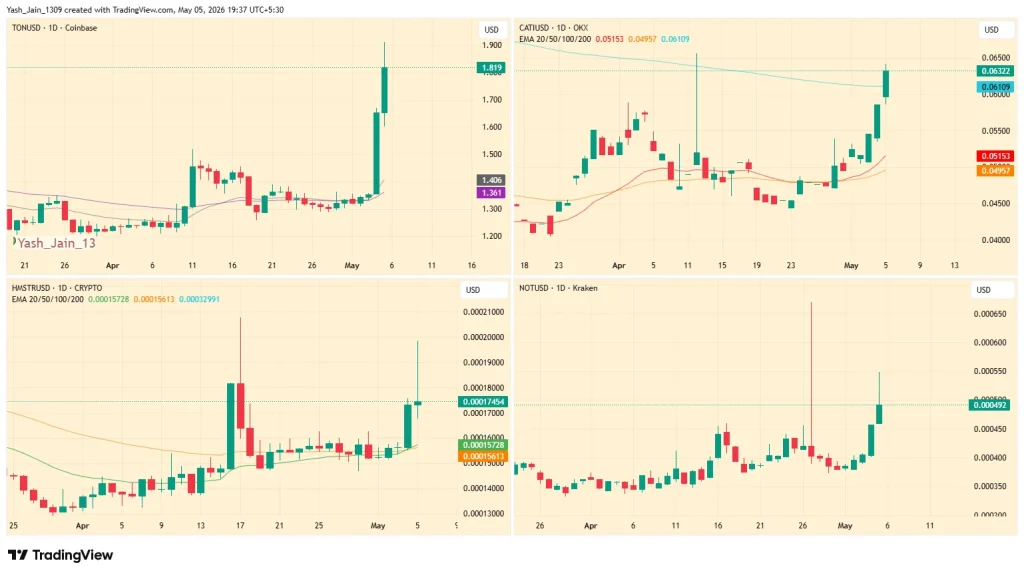
But, the real fireworks was not only in TON today but showed up in the mini-app tokens running on its blockchain. Catizen (CATI) jumped 27%, Hamster Kombat (HMSTR) climbed 24%, and Notcoin (NOT) ripped 35% higher.
These Telegram-based Play-to-Earn (P2E) tokens thrive on simplicity that’s tap, earn, repeat. Massive user bases were already there, but high friction and fading interest had nearly killed its growth. Now, with near-zero fees, that friction is basically gone. It’s not innovation driving this, it’s accessibility but now will demand follow that’s a question for future which has high odds at this point.
Can TON Break Resistance And Sustain Rally
So, what’s next in TON price action? That’s where things get tricky. TON is now hovering around $1.84, pushing toward a key $2.0 resistance level. Break that cleanly, and momentum could extend.
But fail? And it could unwind just as quickly. For now, Telegram-based Play-to-Earn (P2E) tokens are riding the wave which are proving once again that in this market, one update can turn a graveyard into a gold rush overnight.
The crypto layoffs wave isn’t slowing down it’s accelerating in 2026, and this time it’s not just about market cycles. It’s about survival in an AI-driven world. In early May 2026, major firms are cutting deep, trimming teams, and quietly admitting that fewer humans can now do a lot more work and Coinbase joined the list.
Coinbase Leads Crypto Layoffs With Major Workforce Cut
Let’s start with the headline move. Coinbase just slashed roughly about 14% of its workforce today. The message? Pretty blunt. The company wants to be “leaner, faster, and more efficient.”
But here’s the kicker: this isn’t just cost-cutting. Per Brian Armstrong it’s a structural rewrite. The company is flattening management layers, pushing leaders to act as individual contributors, and building “AI-native pods” where smaller teams that handle what used to require entire departments. In simple terms, AI isn’t assisting anymore. It’s replacing.
AI Shift Forces Industry-Wide Workforce Restructuring
Coinbase isn’t alone here, in simple not the only villain. Even not long back, Gemini also reportedly cut around 30% of its staff after posting a $582 million loss in 2025. Crypto.com followed with a 12% workforce reduction, explicitly pointing to AI-driven efficiency, as well.
Then there’s Algorand, which announced trimming 25% of its team while citing macro uncertainty. Messari platform posted to have downsized significantly, now sitting near 140 employees approx, far below its earlier ambitions.
Well, here’s the scary pattern: fewer people, more automation, tighter margins. Even firms like Block, OP Labs, and PIP Labs have were also on the list.
Market Pressure And Volatility Add Fuel
But let’s be real and practical, though the situation is concluded towards AI efficiency over humans hands. But supporting this trend is the declining overall crypto market conditions, which still matter. Weak token prices and inconsistent trading volumes are forcing companies to rethink spending.
Even Coinbase admitted its revenue remains volatile quarter to quarter. That’s a polite way of saying: when markets dip, things break.
This is an email I sent earlier today to all employees at Coinbase:
Team,
Today I’ve made the difficult decision to reduce the size of Coinbase by ~14%. I want to walk you through why we're doing this now, what it means for those affected, and how this positions us for the…
Meanwhile, restructuring itself isn’t cheap. Severance packages, equity vesting, and transition support all add up in the short term so even as firms chase long-term efficiency.
So, what’s next? More of the same. The crypto layoffs trend isn’t a phase but a clear shift. And right now, the industry is choosing machines over headcount.
LINK price rose nearly 6% after AWScloud partnership announcement, as this time it was an actual substance. The LINK price reacted quickly after AWScloud officials posted about this team up with Chainlink. Was it a hype, many curious? Sure it is one. But unlike most headlines, this one comes with real infrastructure behind it.
AWScloud Partnership Brings Real Utility To Blockchain
AWScloud is integrating Chainlink’s CRE by utilizing this effectively will be giving its massive developer base tools to connect cloud systems with smart contracts.
Not just theory but this have practical actual use cases. Think custom price feeds, stablecoin reserve verification, and off-chain computation running inside secure environments. It’s enterprise-grade stuff, the kind that institutions usually demand before even pretending to care about blockchain.
Well, Chainlink isn’t just chasing headlines but clearly it’s chasing developers and by locking this deal its after millions of them.
LINK Price Eyes Key Resistance After Recent Push
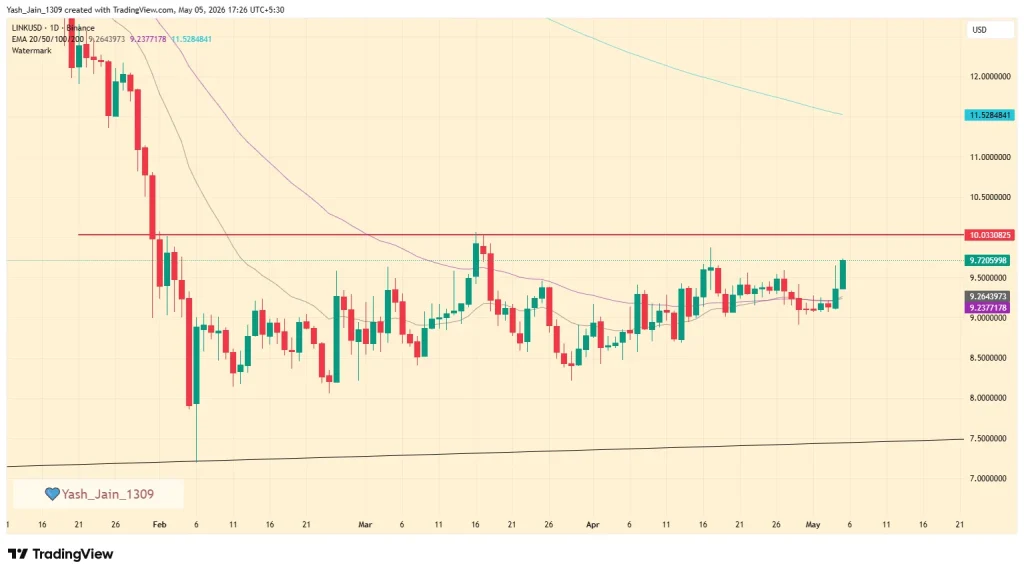
But, in crypto markets most investors eyes are still glued to charts. The LINK price bump comes alongside a broader tailwind from BTC and ETH, helping it grind higher since February.
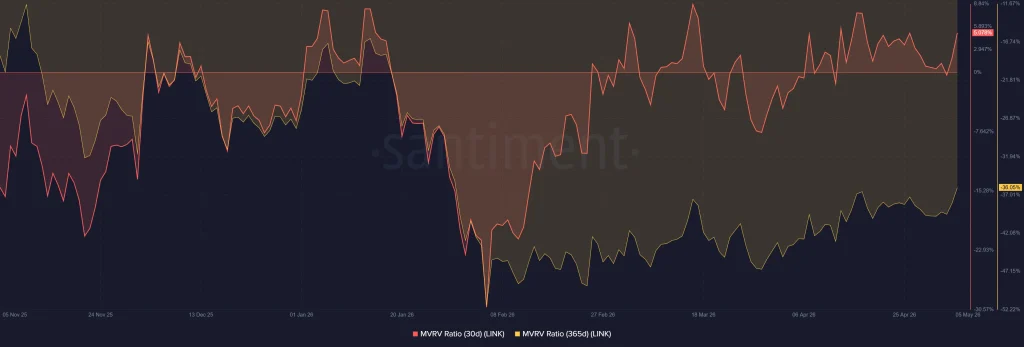
Now, it’s staring directly at the $10 resistance level. Crack that, and the next logical target sits near the 200-day EMA around $11.52. Momentum’s improving too and because of that the 30-day MVRV just flipped above zero, meaning short-term holders are finally seeing profits. Not euphoric. But definitely less painful.
Institutional Demand Builds While Holders Stay Patient
Meanwhile, the long-term crowd isn’t exactly celebrating. The 365-day MVRV still shows holders sitting in the red, even as recovery slowly creeps in.
On the institutional side, though, it’s oddly stable. US spot LINK ETF assets are holding at $107.86 million which is roughly 1.59% of market cap per sosovalues’s data and most importantly with no outflows reported since December 2025. That’s not explosive demand, but it’s consistent.
Add to that reserve activity climbing to 3.44 million LINK by April 30, and you start seeing the bigger picture. Infrastructure is being built. Slowly, deliberately.
So yeah, the LINK price might still be dragging its feet but the groundwork underneath? That’s moving a lot faster than it looks.
Price predictions for 2026 highlight a potential range of between $20-$80.
Long-term forecasts indicate AVAX could reach $518.50 by 2030.
Aave (AAVE) is a decentralized finance protocol built on Ethereum that facilitates permissionless lending and borrowing through smart contracts. After witnessing a strong expansion in the previous market cycle, AAVE entered a prolonged correction phase, with price gradually retracing from its earlier highs. Throughout 2025, AAVE remained in a consolidation structure, reflecting a period of market digestion rather than trend continuation. While short-term momentum has cooled, the broader technical structure suggests that AAVE may be transitioning into a new accumulation phase.
As volatility contracts and price holds above long-term demand levels, attention is now shifting toward whether 2026 can trigger the next major price discovery cycle.
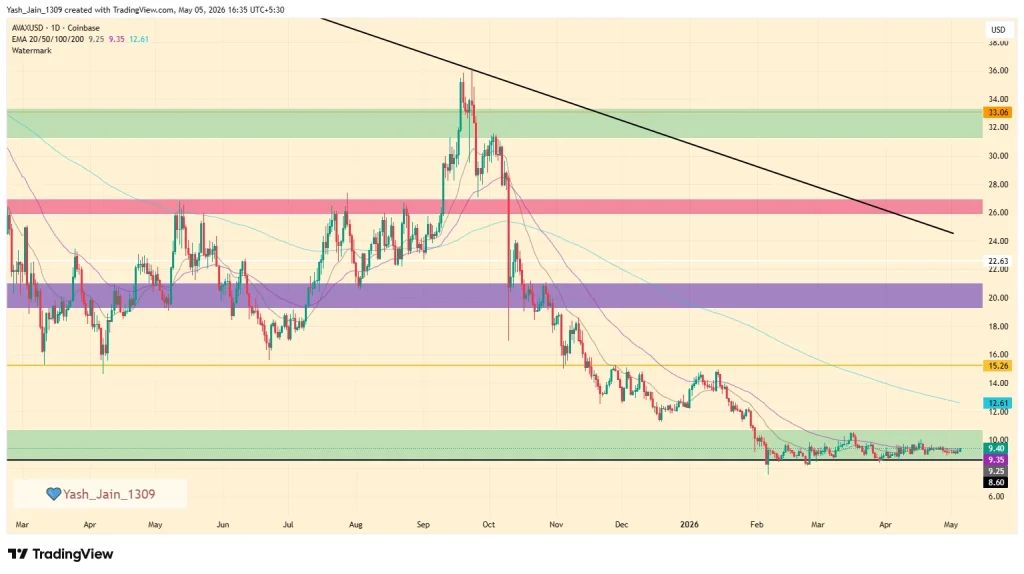
Avalanche price (AVAX) remains stuck within a long-standing rectangular consolidation range between $8.60 and $10.50 as it is in the second quarter of 2026. After experiencing rejection at the $15 resistance level in Q1’s January, the AVAX price has struggled to gain significant bullish momentum, oscillating within this tight demand zone throughout Q1 until March. While analysts initially anticipated a recovery earlier in the April, but the market has instead opted to continue to build a base at these lower levels.
As we approach May, AVAX’s price is currently hovering near the $8.60 lower boundary of this range. The immediate technical resistance for the month is at the $10.50 upper edge; a decisive breakout above this level is necessary to change the market bias and pave the way for a retest of the $15 psychological resistance.
However, given the persistently low trading volume and the current market indecision, failing to clear the $10.50 mark could result in continued sideways price action in May as the asset awaits a stronger catalyst.
Avalanche (AVAX) Price Prediction 2026
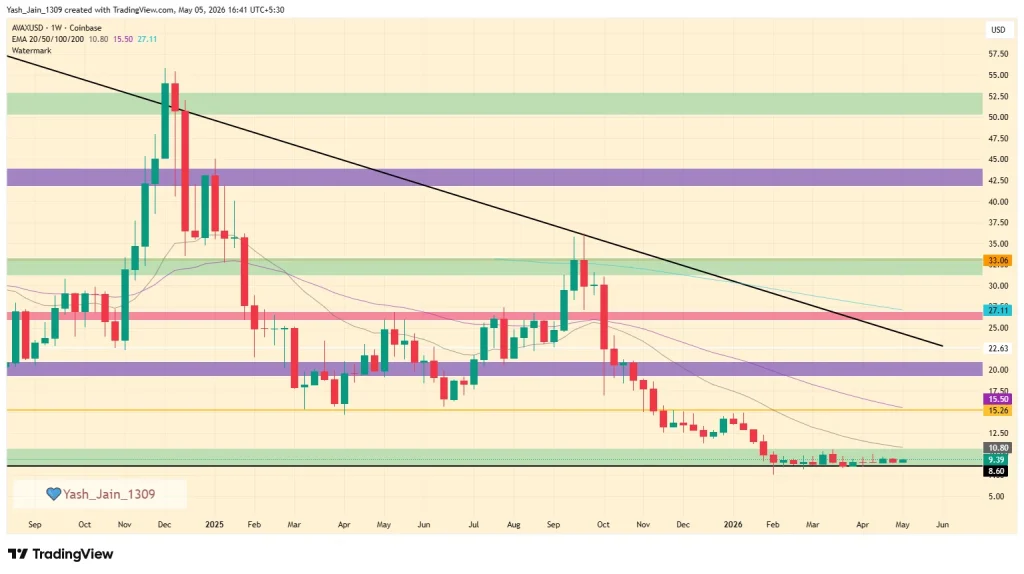
The weekly price action for Avalanche price (AVAX) has been defined by a multi-year structural decline following its Q1 2024 peak of $65. Throughout 2024 and 2025, the asset remained trapped under a descending resistance line, with bearish momentum intensifying in early 2026. This downward pressure drove AVAX price to a major horizontal support floor between $8.60 and $10.00, marking a critical “base-building” phase as Q1 concluded with a period of low-volatility consolidation.
As Q2 2026 begins, holding this demand zone is essential for any potential reversal. While the price has been stagnant for nearly two years, the prolonged accumulation at these lows suggests that a market bottom may finally be in place. If demand returns in April, the first half of the year could see a recovery rally toward $20, with an ambitious secondary target at the $28 level, which aligns with the 200-week EMA and the long-term descending trendline.
A decisive breakout above this $28 resistance would signal a major trend shift, potentially clearing the path for AVAX to reclaim $44 by the end of 2026. However, investors should remain cautious; if the $28 level repels the price, the recovery could stall, leading to extended consolidation within the lower ranges. The next few months are pivotal to determine whether AVAX/USD can finally emerge from the shadow of its multi-year bear market.
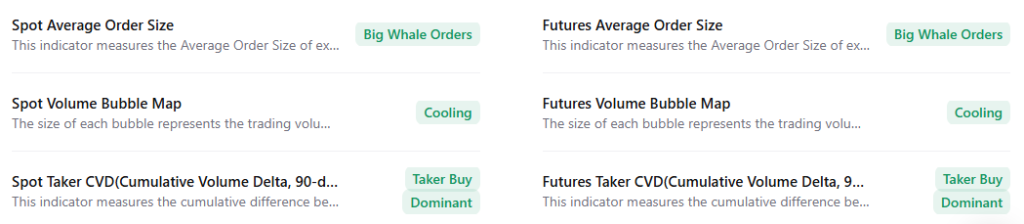
AVAX On-Chain Analysis
AVAX shows a highly bullish sentiment. Big Whale Orders in both spot and futures indicate strong institutional accumulation. With Taker Buy Dominance at 90 days, aggressive buyers are in control, while the Cooling volume bubble map suggests a healthy consolidation phase. Collectively, major metrics point to a bullish rally ahead.
Avalanche Price Prediction 2026 – 2030
Year
Potential Low ($)
Potential Average ($
Potential High ($)
2026
400
500
600
2027
550
690
820
2028
650
830
980
2029
740
950
1100
2030
820
1000
1200
AAVE Price Forecast 2026
Looking ahead to 2026, AVAX’s potential price is anticipated to rise even further, with a projected low of $20.00 and a high of $80.00. The average price for AVAX in 2026 will likely be $50.00.
AAVE Price Prediction 2027
In 2027, the analysis suggests a continued upward trend in AVAX’s value, with the price potentially ranging between $31.50 and $126.50. Based on the calculated figures, the average price is projected to be approximately $79.00 during this period.
AAVE Prediction 2028
By 2028, AVAX’s price could potentially experience further growth, falling within the range of $50.50 and $202.50. The average price during this period, calculated from the data, is expected to be around $126.50.
AAVE Price Prediction 2029
Moving forward to 2029, AVAX’s price is predicted to ascend between $81.00 and $324.00. The average price during this period is estimated at around $202.50 based on calculated figures.
AAVE Price Prediction 2030
By 2030, AVAX’s price is forecasted to soar between $129.50 and $518.50. Further, the average price during this period, calculated from the data, could stand at $324.00.
Based on the historic market sentiments and trend analysis of the largest cryptocurrency by market capitalization, here are the possible AAVE price targets for the longer time frames.
Year
Potential Low ($)
Potential Average ($)
Potential High ($)
2031
890
1100
1350
2032
920
1200
1500
2033
1100
1350
1780
2040
1600
2200
3000
2050
2600
3300
4500
AAVE Price Prediction: Market Outlook?
Year
2026
2027
2030
Changelly
$500
$750
$1100
DigitalCoinPrice
$480
$680
$1000
WalletInvestor
$520
$650
$1250
Never Miss a Beat in the Crypto World!
Stay ahead with breaking news, expert analysis, and real-time updates on the latest trends in Bitcoin, altcoins, DeFi, NFTs, and more.
FAQs
Is AAVE a good investment for 2026?
AAVE shows long-term growth potential if it breaks key resistance levels. However, price depends on market conditions and DeFi adoption.
What should investors watch before buying AAVE?
Watch support near $135–$150, resistance above $250, overall market trend, and activity within the Aave protocol.
What could drive Avalanche (AVAX) price growth in the coming years?
Key drivers include DeFi expansion, institutional adoption, subnet growth, and overall crypto market recovery cycles.
What is the AVAX price prediction for 2026?
The AVAX price prediction for 2026 suggests a potential range between $400 and $600 if market momentum and network growth remain strong.
What is the AVAX coin price prediction for 2030?
AVAX coin price prediction for 2030 points to a possible range of $820 to $1,200, assuming sustained adoption and favorable market conditions.
What is the Avalanche price prediction for 2040?
Avalanche price prediction for 2040 estimates a broad range between $1,600 and $3,000 if long-term blockchain adoption accelerates globally.
The live price of the Hyperliquid crypto is $ 43.70912672.
The 2025 HYPE price suggests it could hit $40-$105 in 2026.
Forecasts suggest that HYPE could reach a potential average price by 2030 of around $125, with highs up to $185.
Hyperliquid (HYPE) is gaining attention as a decentralized trading platform focused on perpetual futures. The protocol operates without traditional onboarding barriers and offers access to assets such as BTC, ETH, SOL, AVAX, and SUI without requiring ownership of the underlying tokens.
Its infrastructure includes the HyperBFT consensus mechanism, designed to support high-speed transactions. As platform activity grows, market participants are assessing the HYPE Price outlook for 2026 and beyond.
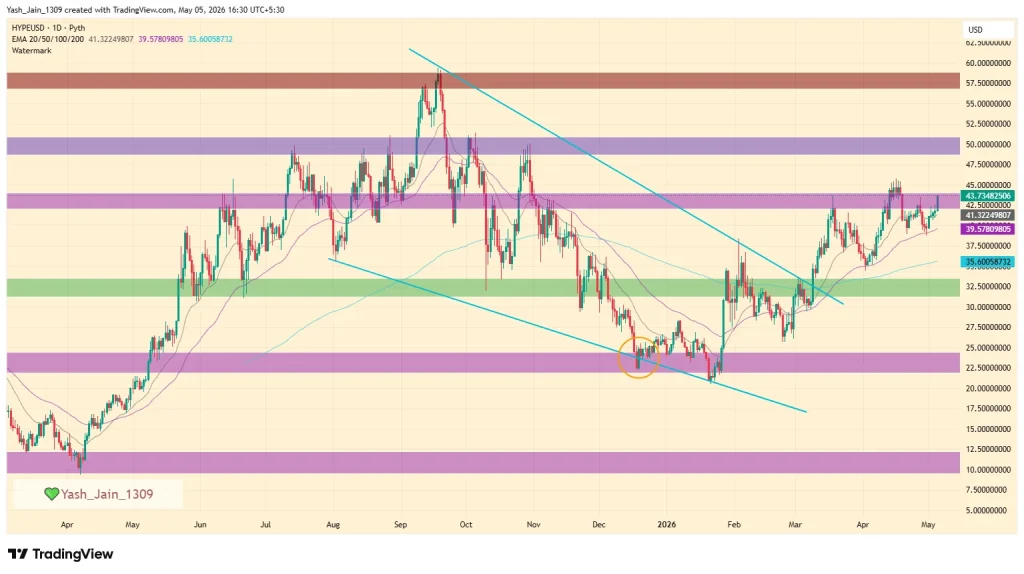
Following the conclusion of Q1 2026, Hyperliquid price (HYPE) has demonstrated significant market strength by maintaining a bullish trajectory. Even in April, the token successfully rebounded from $35.00 support.
The current price action shows HYPE price is consolidating just below the critical $44.00 resistance zone after having successfully broken out of a multi-month descending wedge pattern in March.
The technical structure remains robust as the price holds firmly above the 50-day EMA and the 200-day EMA, which have now transitioned into a formidable support floor. This alignment suggests that the broader uptrend is intact.
Now, if HYPE gives a decisive daily close above $44.00 would likely clear the path for a retest of $48.00, with the potential to extend toward the psychological $50.00 mark and eventually its ATH of $59.39.
But, traders should monitor the $38.00–$40.00 range; because a failure to hold this level could signal a short-term retracement back to the $35.00 swing low.
Recent News/ Opinions
Bitwise officially expanded its European suite on April 9th with the launch of the Bitwise Hyperliquid Staking ETP (BHYP), now trading on the Deutsche Börse Xetra. This seventh staking product highlights Hyperliquid’s emergence as a top-tier on-chain derivatives venue, offering institutional investors regulated exposure to its innovative, fully on-chain order book and execution model.
Hyperliquid Price Prediction 2026
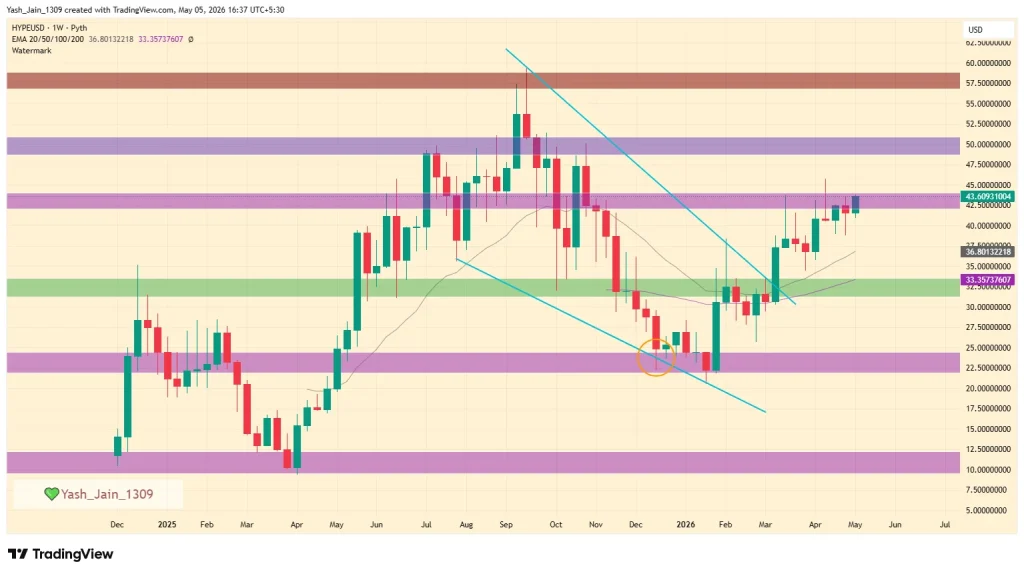
The weekly structure of HYPE shows that after topping near $60, the asset entered a prolonged downtrend that formed a clear falling wedge pattern, eventually bottoming in the $21–$24 demand zone. This region proved to be structurally significant, with strong buyer interest stepping in. The eventual breakout from this wedge triggered a sharp expansion move, pushing price toward $38 and then into the $44–$48 resistance band. However, this rally stalled at a major higher-timeframe supply zone, meaning the broader market structure is still in transition rather than fully bullish.
From an investor standpoint, the current phase calls for a measured and strategic approach rather than aggressive positioning. Accumulation is most favorable near support zones, particularly between $32 and $34, with additional opportunities closer to $28 or $24 if volatility increases.
However, aggressive buying is best reserved for confirmation, which in this case would be a decisive weekly breakout and hold above $44. Until that level is flipped into support, the market remains susceptible to rejection, and a range-bound environment between $32 and $44 is a realistic base case. In such a scenario, investors can consider a range-trading strategy as accumulating near support and trimming exposure near resistance.
Looking ahead to the remainder of H1 2026, the most constructive outcome would involve HYPE holding above $32 and building enough strength to reclaim $44. If this occurs, the price is likely to trend toward $52 and potentially test the $60 level, which represents the gateway to price discovery.
Conversely, if $32 fails, H1 could be dominated by consolidation or downside pressure, delaying any meaningful trend expansion and keeping the asset confined within a broader corrective phase.
For H2 2026, the outlook becomes significantly more directional depending on how price reacts at key levels. A confirmed breakout above $44, followed by sustained strength, would signal a true macro trend reversal, opening the door for a move beyond $60 and into the $70–$80 range, with the potential for further upside in a strong market environment.
If, however, HYPE price continues to reject from resistance and remains stuck between $30 and $45, the second half of the year may evolve into a prolonged accumulation phase before any major breakout. In a bearish scenario where $24 is lost, the bullish structure would be invalidated, and the asset could enter an extended period of re-accumulation, significantly delaying upside expectations.
HYPE On-Chain Outlook
The Dune analytics dashboard provided a quick on-chain overview of the utility metrics of the Hyperliquid token (HYPE), which appears to be improving significantly with each passing month.
HyperEVM total transaction fees have surpassed 235.57K and are at an ATH, and total trading volume has crossed $3.64 trillion and is at an ATH. Even its revenue has reached an ATH, crossing $993 million.
All the major metrics suggest that it is experiencing great adoption among peers, and its on-chain metrics are proof of that, suggesting that if the rally occurs, then 2026 might end on very good numbers.
Hyperliquid Coin Price Targets 2026 – 2030
Year
Potential Low ($)
Potential Average ($)
Potential High ($)
2026
25
50
90
2027
40
75
105
2028
55
95
130
2029
85
110
155
2030
105
125
185
Hyperliquid Coin Price Prediction 2027
During 2027, the HYPE could reach a maximum value of $105 with a potential low of $40. Considering this, the average price of this altcoin could settle at around $75.
HYPE Crypto Price Action 2028
The Hyperliquid price could achieve the $130 milestone by the year 2028. On the flip side, the altcoin could record a low of $55 and an average price of $95.
Hyperliquid Price Analysis 2029
The HYPE crypto prediction for the year 2029 could range between $85 to $155 and the average price could be around $110.
HYPE Price Prediction 2030
Looking forward to 2030, the Hyperliquid Price may range between $105 and $185, and a potential average value of around $125.
Market Analysis
Firm Name
2025
2026
2030
Binance
$37
$63
$164
DigitalCoinPrice
$76
$54
$97
*The aforementioned targets are the average targets set by the respective firms.
CoinPedia’s HYPE Price Projection
This Layer-1 project has taken the crypto market by storm within a short time frame. With a market cap of over $7 billion, this altcoin has successfully secured a position in the top 25. Moreover, with the mass adoption, this altcoin could claim a spot in the top 10 during the upcoming bull run.
If the bullish sentiment intensifies, the Hyperliquid price will reach a high of $41.39 this year. On the flip side, if the market experiences unfavorable events, this could result in this altcoin settling at a low of $14.65.
Year
Potential Low
Potential Average
Potential High
2025
$14.65
$28.02
$41.39
Never Miss a Beat in the Crypto World!
Stay ahead with breaking news, expert analysis, and real-time updates on the latest trends in Bitcoin, altcoins, DeFi, NFTs, and more.
FAQs
What is Hyperliquid (HYPE) and why is it gaining popularity?
Hyperliquid is a fast, decentralized trading platform with no KYC and low fees, making HYPE popular among traders seeking speed and independence.
What is the Hyperliquid (HYPE) price prediction for 2026?
HYPE price in 2026 is projected to range between $25 and $90, with an average near $60 if adoption and trading volumes keep rising.
What could HYPE be worth by 2030?
Long-term projections suggest HYPE might reach an average of $125 by 2030, with possible highs near $185 if platform usage keeps expanding.
Is Hyperliquid (HYPE) a good long-term investment?
HYPE may appeal to long-term investors due to strong platform growth, but like all crypto, it carries risk and requires careful research.
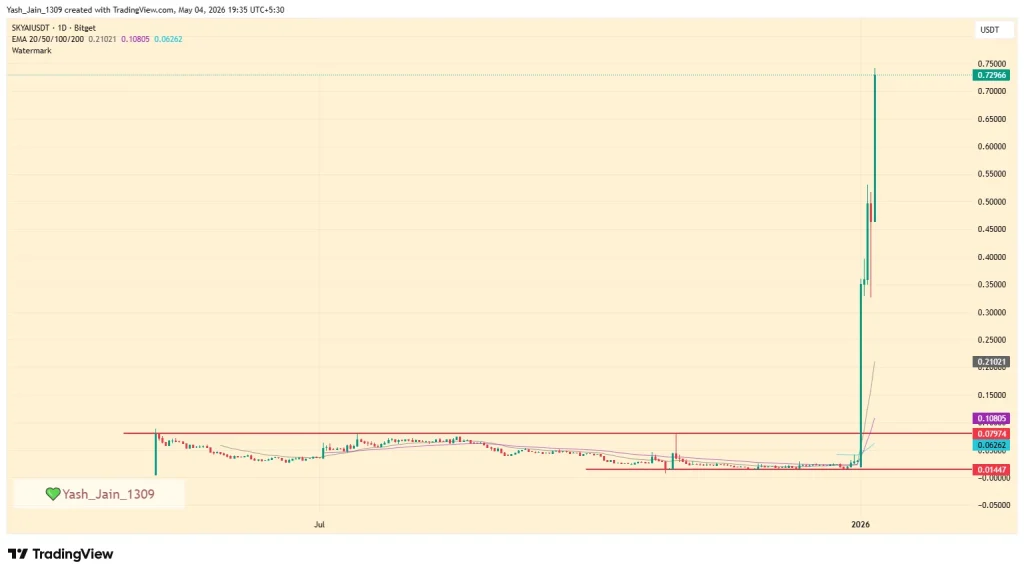
Investors and traders have been staring at the same boring sideways SKYAI chart, but this is bit different. Since May 2025, the SKYAI price was in a range but the recent price action probably gave you a mild heart attack, as it was a sniper rally.
The shock was that for a whole year, this thing was trapped in a depressing range between $0.01447 and $0.07974, basically doing a whole lot of nothing. Then May 2026 hits, and suddenly, we see a sniper parabolic jump that sends the token screaming to $0.72645. We’re talking about a 4100% rally that makes your average “to the moon” tweet look like a joke.
But before you scream “manipulation,” let’s look at the narrative, because this wasn’t just only a leveraged pump. It turns out, people actually care about the AI agent concept, and SKYAI is currently riding that wave like a pro surfer.
AI Agent Narrative Drives Parabolic Growth
Well, the demand is being fueled by actual infrastructure news, not just hot air. On April 30, Bitget listed the pair, which provided the initial spark, but the real gasoline came on May 3rd. The team announced final testing for the SKYAI MCP Hub. This isn’t just another protocol; it’s a routing layer for agents designed to handle multiple MCP servers, dynamic tool routing, and cross-agent sharing.
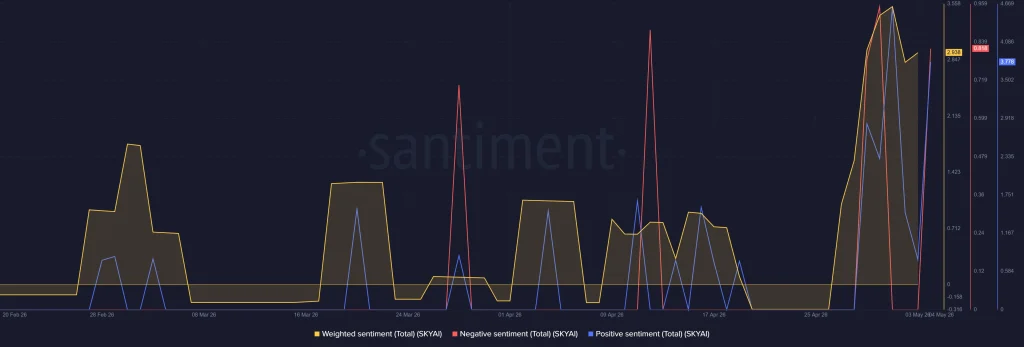
Basically, they’re building the “brain” for agentic orchestration. When you combine a trending narrative with a exchange listing, you get the kind of social sentiment spike that flips weighted sentiment aggressively to the positive side, per onchain data.
Presale Returns And The Long Game
But let’s be real, the “overnight” success of the SKYAI price was actually a year in the making. On May 4th, the team reminded everyone that presale participants who aligned early are now sitting on massive returns.
Now, while many are chasing the 4100% rally this week, the infrastructure has been quietly cooking in the background. So, what’s next? The devs claim returns are just a byproduct of development, but in this market, sentiment is king, and right now, the king is wearing an AI crown.
And about the price it’s at a cautionary stage if it breaks below $0.60034 a dump could be on its way, but holding $0.70380 could keep the trend intact and could stretch towards $1.0 ,if demand keeps up.
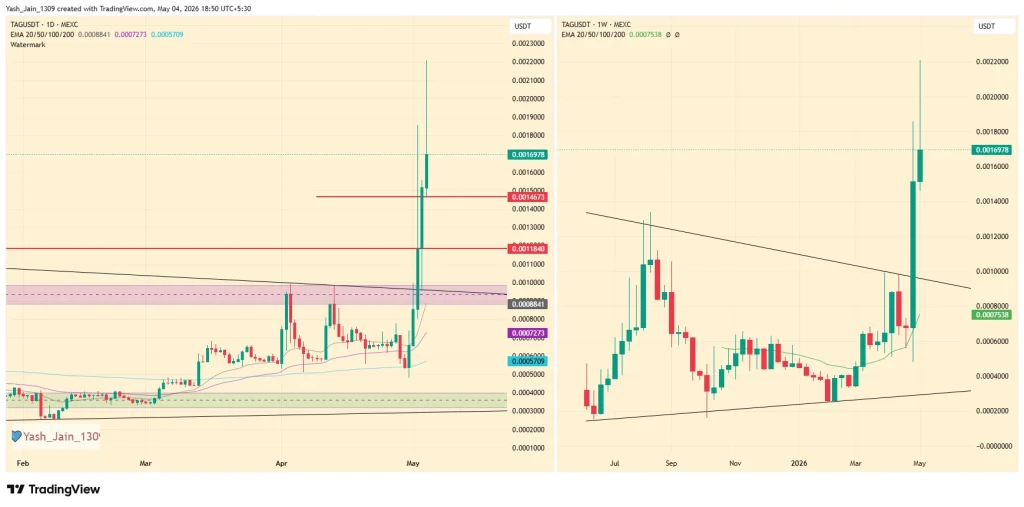
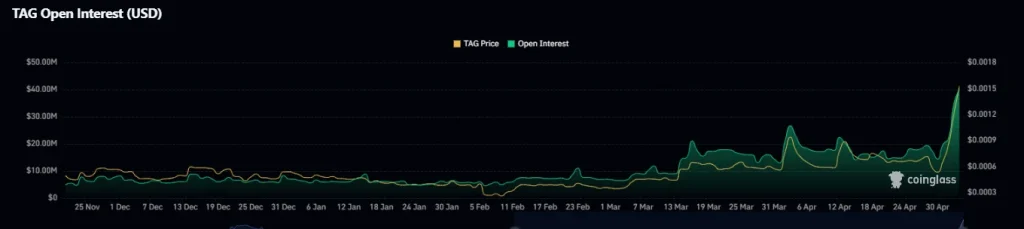
TAG price had a mesmerizing clean breakout rally this week. After months stuck in a tight $0.0003200 to $0.0009700 range, TAG finally snapped out of its cage, ripping all the way to $0.0022000. That’s not just any ordinary rally, it’s a full-blown demand based shift.
TAG Price Breakout Confirms Long-Term Compression Pattern
Here’s the setup. The weekly structure had been coiling inside a symmetrical triangle for months. Classic compression. The kind that doesn’t whisper but then it explodes big, that’s what occurred this time.
A breakout triggered from the 200-day EMA zone support around $0.0005721. Once that level flipped, momentum didn’t hesitate. Buyers piled in, resistance levels got steamrolled, and suddenly TAG price wasn’t range-bound anymore but it was vertical.
Derivatives Frenzy Fuels Aggressive Short Squeeze Move
But let’s not pretend this was all spot-driven enthusiasm. Futures data tells the real story. Open Interest jumped from roughly $14 million to $40 million. That’s not casual participation that’s leverage entering the chat.
And where there’s leverage, there’s pain. Shorts got squeezed hard. Liquidations stacked up, pushing TAG price even higher as positions were forcibly closed. It’s the loop where price rises parabolically when shorts panics
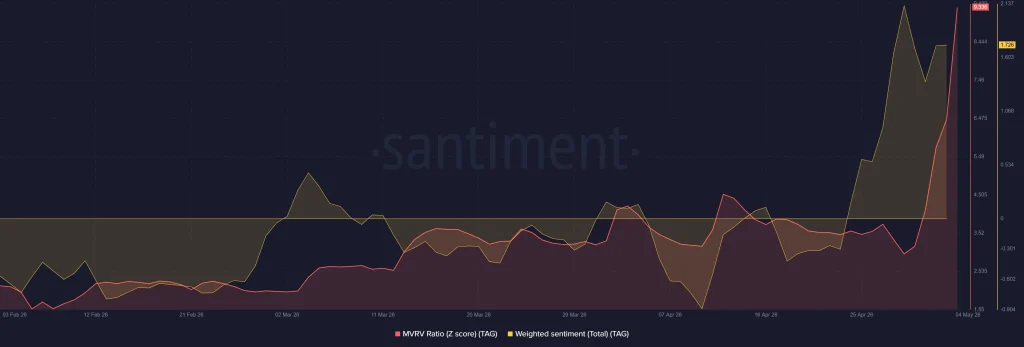
Sentiment Spike And MVRV Flash Warning Signals
Now comes the uncomfortable part. The onchain data like MVRV Z-score has touched ceiling above the zero line, and weighted sentiment has clearly spiked, too. Translation? The market is getting crowded on the optimistic side. That’s usually great until it feels extremely overheated.
Well, when everyone agrees it’s bullish, and optimism breaks the meter then risk quietly builds underneath.
Key Levels That Could Make Or Break Rally
So, what’s next? If this rally is real and not just a hype-driven spike then in that case the TAG price needs to hold above $0.0014673 and $0.0011840. Those are the battlegrounds. Lose them, and things could unwind fast.
And not gently. A breakdown could erase a large chunk of gains just as quickly as they appeared. For now, TAG price is riding momentum. But momentum, as always, has an expiration date.
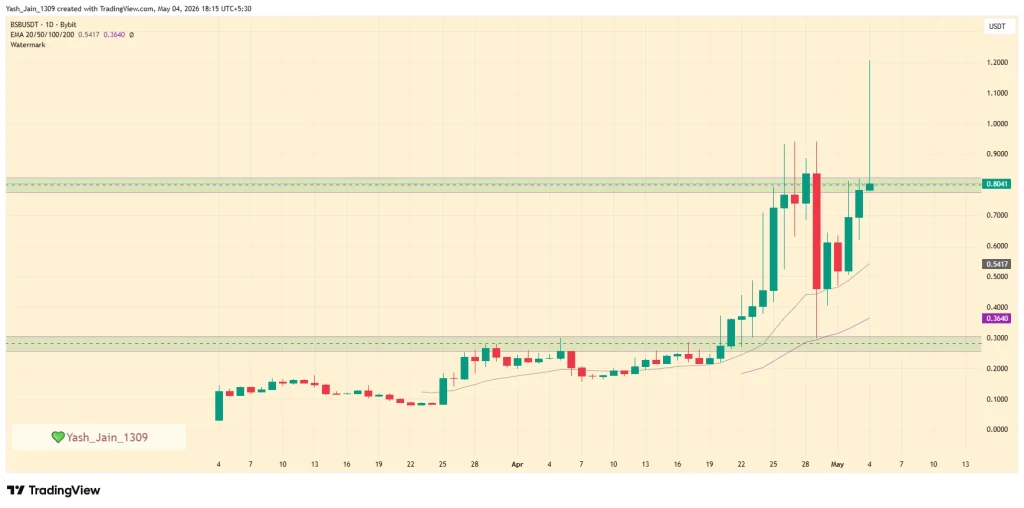
BSB price erupting massively and in barely 48 hours, Blockstreet’s native token has pulled off a near 150% rally, ripping from $0.466 to a fresh all-time high near $1.20. And no, this wasn’t random. The timing lines up almost perfectly with the project finally dropping its long-awaited tokenomics reveal.
Tokenomics Reveal Sparks Sudden Market Frenzy
Most interestingly, the announcement wasn’t just another whitepaper dump but it laid out a full ecosystem vision. Its post said that BSB isn’t just a token; it’s pitched as the backbone of utility access, liquidity participation, staking alignment, and governance across Block Street’s infrastructure.
Utility, staking, governance, it checked all the boxes traders like to hear. Add in structured yield access, fee reductions, and liquidity incentives, and suddenly the narrative writes itself. Since, markets love a clean narrative and BSB gave that.
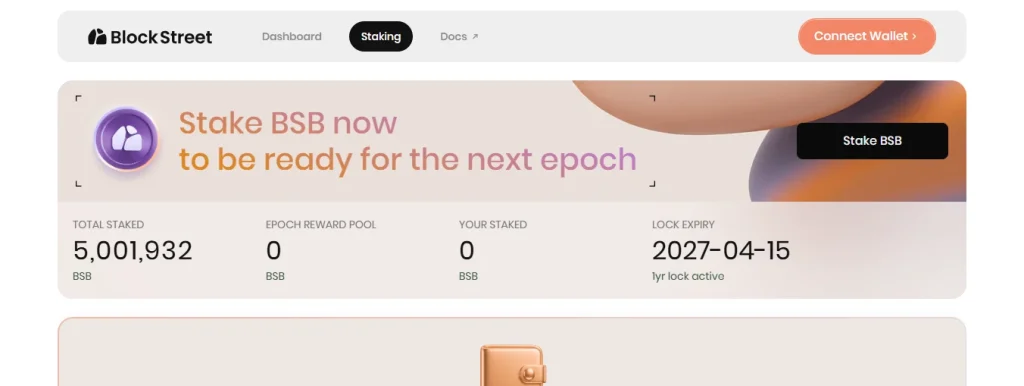
Staking Surge Signals Strong Conviction Shift
But let’s be real price doesn’t move like that on words alone, real participation is needed. The staking data adds another confirmation layer to this engagement. As over 5 million BSB is now locked, signaling something deeper than speculative hype. That’s capital committing, not just rotating.
The messaging around “alignment” and “coordination” clearly hit home. It’s not just yield farming anymore but it’s kind of a positioning within a system that’s trying to look bigger than just another token launch.
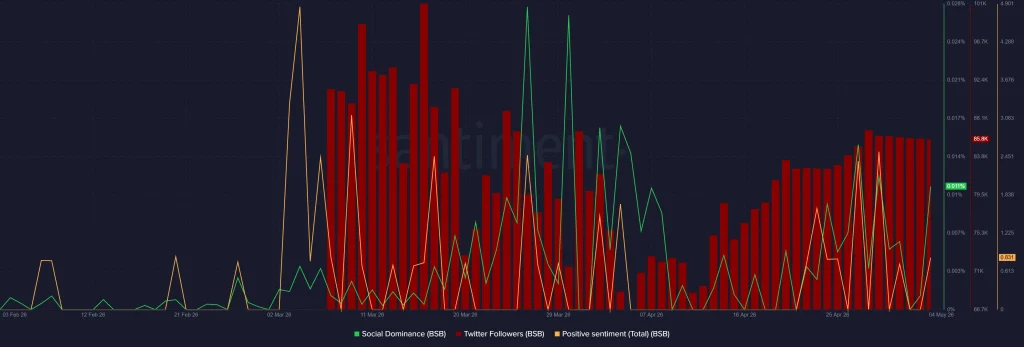
Social Hype Machine Kicks Into Overdrive
Now throw social metrics into the mix. Since April, Twitter followers have been climbing, and social dominance has spiked alongside positive sentiment. That’s usually the fuel phase where awareness turns into momentum.
Now, the BSB price now sits in a high-risk zone. Momentum was aggressive, but the spike reduced from $1.20 to around $0.80 support, which has emerged as the line in the sand. Lose that, and the chart opens up quickly with a potential retrace toward $0.30 lurking beneath.
Hold it, though? Different story. Sustained strength could legitimize this breakout as more than just a news-driven spike.
Right now, BSB price action isn’t subtle. It’s loud, fast, and very, very dependent on whether conviction sticks around.
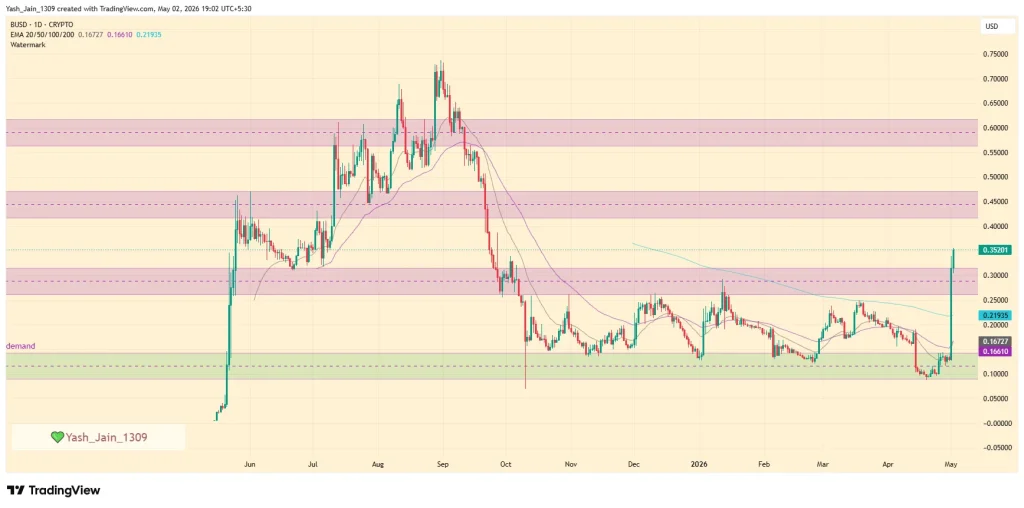
The B crypto price just did what most altcoins only dream about thats by ripping through a major downtrend with a brutal 60% intraday surge, landing near $0.352. No slow grind, no polite breakout. Just a straight-up detonation fueled by a viral social media wave that, oddly enough, involved an animated Donald Trump and a lion mascot.
Really? Yes. But beneath just an meme something more structural just shifted.
B crypto price breakout flips bearish structure completely
For months, B was stuck in a classic downtrend with lower highs, fading interest, the usual slow bleed. Then came the breakout today by a meme post. And which is clearly not a subtle one.
The B crypto price blasted through multiple resistance levels in a single session and, more importantly, reclaimed the 200-day EMA sitting around $0.219. That’s not just a technical milestone, it’s a regime change or kind of change in character. Assets don’t casually reclaim that level unless sentiment flips hard.
Volume backed it up too. This wasn’t thin liquidity pushing candles higher. This was real participation.
So yeah, technically speaking, B just walked out of a bearish phase and into a high-volatility expansion. The kind traders chase and regret later if they’re late.
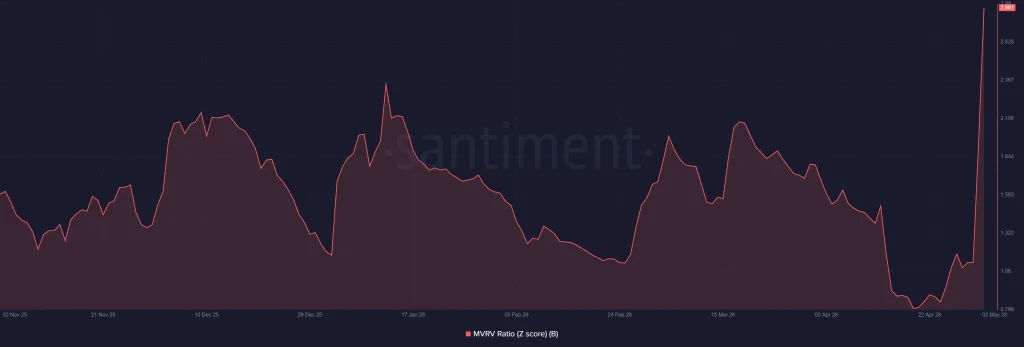
Now, here’s where things get a little less comfortable. Yes, the price run was good but the MVRV Z-score has climbed to around 2.86, too which is pretty high. Translation? The market value is running way ahead of what holders actually paid for the asset.
Historically, this is kind of a “red zone” where profit-taking may start creeping in if demand fails to sustain or push higher. Not always immediately, but the risk builds. The higher it goes, the more tempting it becomes for early buyers to cash out.
So while the rising Z-score confirms strong momentum, it’s also quietly flashing a warning: things might be getting a bit stretched. And markets hate being stretched for too long.
Derivatives explosion and short squeeze fuel rally
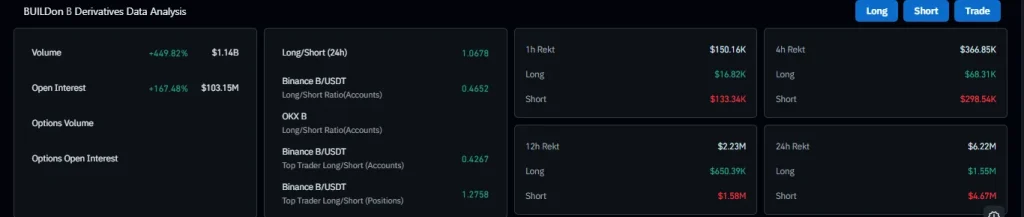
Well, with the move today, the sleeping derivatives activities went absolutely wild. As trading volume surged over 449%, hitting $1.14 billion. Open Interest? Up 167%, now sitting at $103.15 million. That’s not passive interest that’s aggressive positioning.
And then came the squeeze, which perhaps was the major fuel. Data says, over $4.67 million in short positions got wiped out in 24 hours. That’s forced buying pressure, the kind that accelerates moves and creates those vertical spikes everyone screenshots.
But let’s be real, because practically this cuts both ways. Why? Because, high leverage always means high fragility. If sentiment shifts even slightly, then this same structure can unwind just as fast as it built.
So, curious wanna basically want to know what’s next? Everything now hinges on one level: $0.30. Hold it, and the B crypto price might stabilize and build a base for continuation. Lose it, and the market could cool off quickly as profit-taking and leverage unwind kick in.
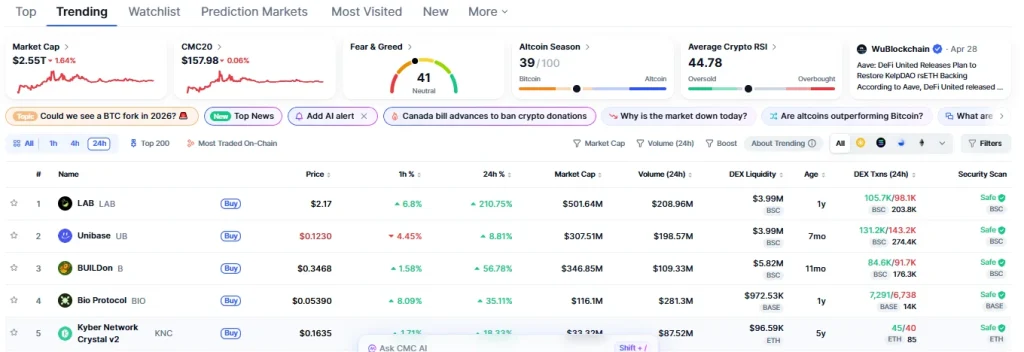
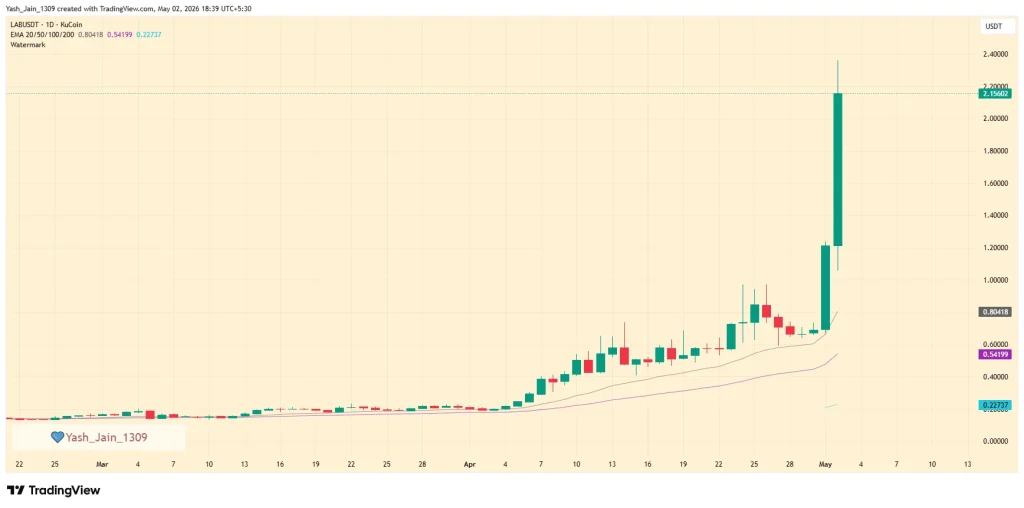
The LAB crypto price didn’t just rally today it detonated. Up over 210% intraday and now sitting with a market cap around $502 million, it has bulldozed its way to the no. 1 trending spot on CoinMarketCap. And no, this isn’t one of those quiet pumps nobody notices. This one came loud, fast, and packed with narrative.
Because apparently, trading isn’t just about reacting anymore but it’s about “understanding why.” That’s the pitch LAB is selling. And right now, the market seems to be buying it.
LAB crypto price breakout backed by strong narrative
Let’s rewind for a second. On April 27, the chart printed a clean hammer candle right on the 20-day EMA which clearly a classic signal that sellers were losing grip. Fast forward to today, and the LAB crypto price has blasted past $2 like it was barely there. Coincidence? Probably not.
The project has been actively pushing its core idea that most tools show activity, but LAB claims to connect the dots behind it. It’s a subtle shift in messaging, but clearly, it landed. Add to that the announcement of an upcoming mobile app which is still in its final polishing stage and you’ve got a narrative cocktail that traders love: utility + anticipation.
But let’s be real narratives don’t move markets alone. Liquidity does.
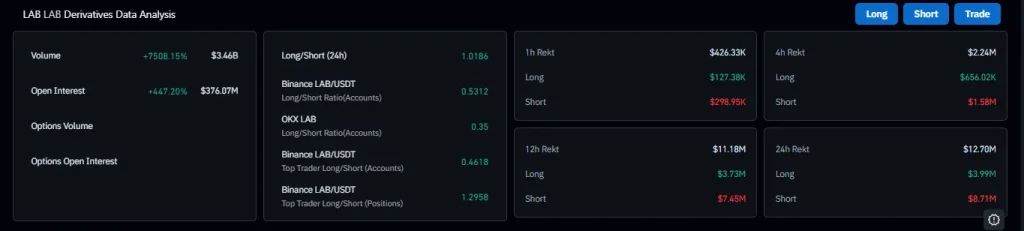
Well, here’s where things get wild. The derivatives market didn’t just react but it went into overdrive. Trading volume surged a ridiculous 7,500%, while Open Interest jumped 450%. That’s not organic growth. That’s traders piling in, fast and leveraged.
And then came the squeeze. Liquidation data shows $12.70 million wiped out in the last 24 hours, with $8.71 million of that being short positions. In plain terms? Bears got steamrolled. The kind of move that forces exits, fuels momentum, and creates those vertical candles everyone chases too late.
So yeah, the LAB crypto price didn’t climb it was pushed by leveraged fuel.
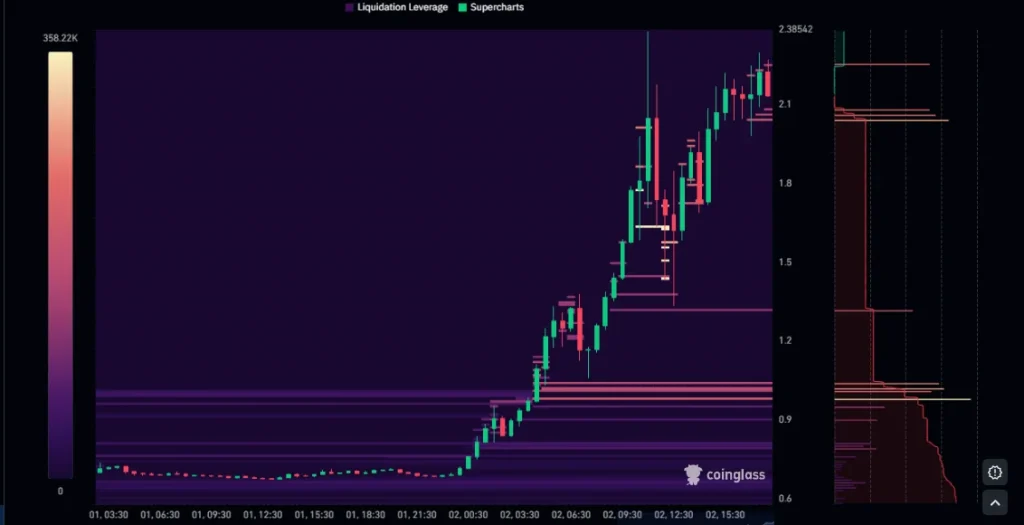
The $2 level now decides everything
Now comes the part nobody likes talking about during a rally and this is possible the downside condition.
The liquidation heatmap paints a pretty clear picture. The $2.00 level isn’t just psychological anymore it’s structural. Lose it, and there’s a gap below. Not a gentle decline. A drop into thin air, with potential targets around $1.31 and even $1.00. That’s the risk.
But flip it around, and things get interesting. If the LAB crypto price holds above $2 and manages a strong weekly close, the upside opens up significantly. We’re talking about a potential extension toward the $4 to $5 range that will be effectively another 100% move from current levels. Sounds crazy? Maybe. But then again, so did a 210% intraday rally.