Render (RNDR) Price Prediction 2026, 2027 – 2030: Long-Term Forecast and Growth Outlook
The post Render (RNDR) Price Prediction 2026, 2027 – 2030: Long-Term Forecast and Growth Outlook appeared first on Coinpedia Fintech News
Story Highlights
- The live price of the RNDR token is $ 2.00884250.
- If demand for decentralized GPU infrastructure expands, RNDR could climb toward $18 by 2026.
- With sustained growth in AI computing and Web3 infrastructure, Render could potentially reach $100 by 2030.
Render (RNDR), a leading decentralized GPU rendering network, is emerging as a key infrastructure layer in the rapidly expanding AI and digital content economy. Initially built to power distributed rendering for creators and studios, the network is now evolving into a broader compute marketplace, enabling scalable GPU access for AI workloads, 3D rendering, and real-time applications.
The recent transition to Render Network on Solana has significantly improved transaction efficiency and scalability, positioning the protocol to handle higher demand from both developers and enterprise users. At the same time, growing interest in AI-driven applications and GPU-intensive workloads is strengthening Render’s long-term utility narrative.
As demand for decentralized compute continues to rise, the focus for 2026 shifts toward adoption and network utilization. The key question remains whether Render can convert this expanding use case into sustained growth and price momentum, as the market increasingly values real-world infrastructure over speculative narratives.
This article delves into Render’s 2026 outlook and long-term price prediction, analyzing whether these catalysts can translate into a sustained breakout. Explore this Render price prediction 2026 and beyond, filled with expert insights and ambitious forecasts.
Table of Contents
Render Price Today
| Cryptocurrency | Render |
| Token | RENDER |
| Price |
$2.0088
|
| Market Cap | $ 1,042,073,508.53 |
| 24h Volume | $ 97,172,443.3627 |
| Circulating Supply | 518,743,261.0141 |
| Total Supply | 533,503,434.2941 |
| All-Time High | $ 13.5961 on 17 March 2024 |
| All-Time Low | $ 0.0368 on 16 June 2020 |
Render (RENDER) Price May 2026 Outlook
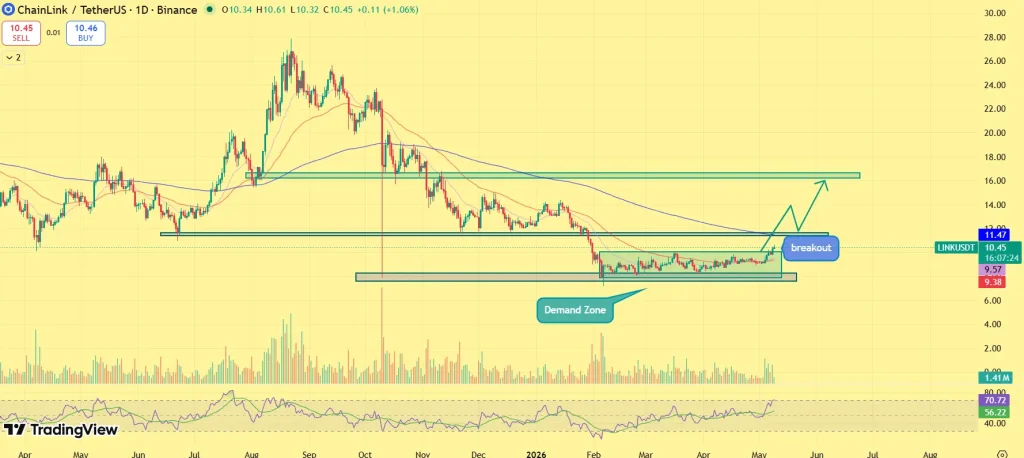
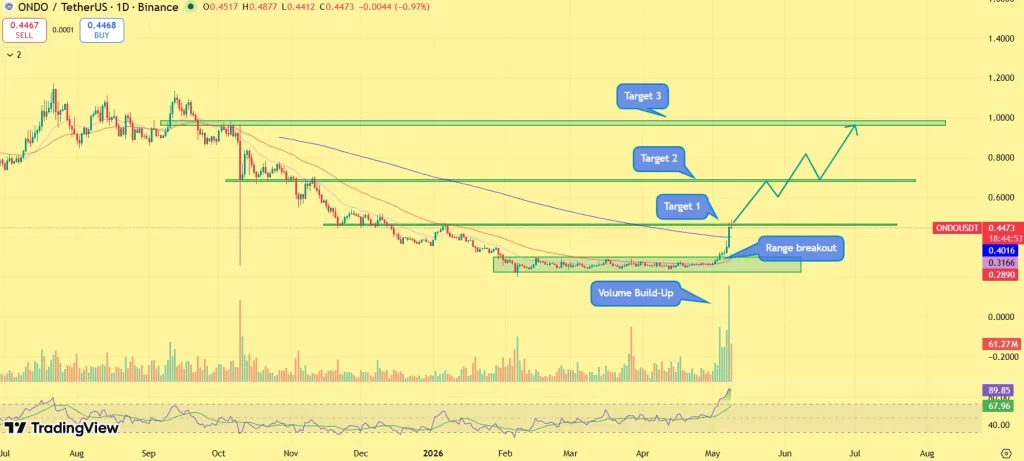
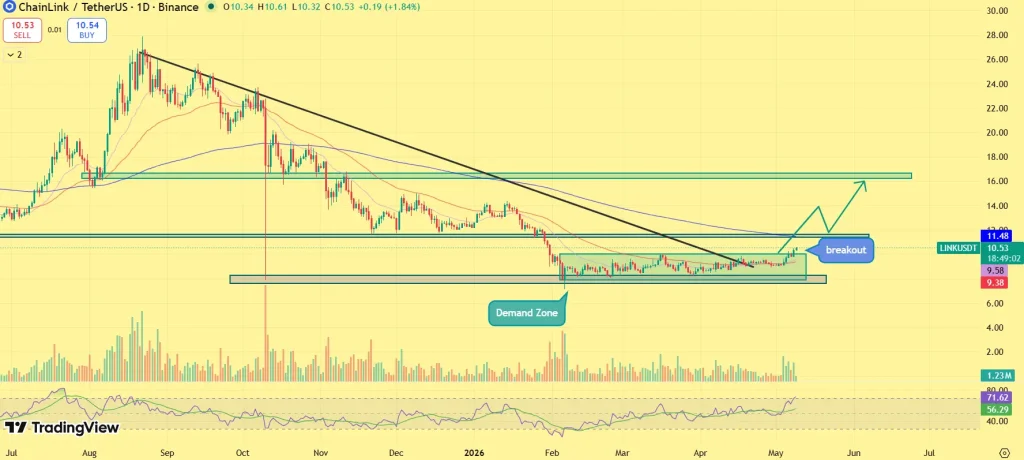
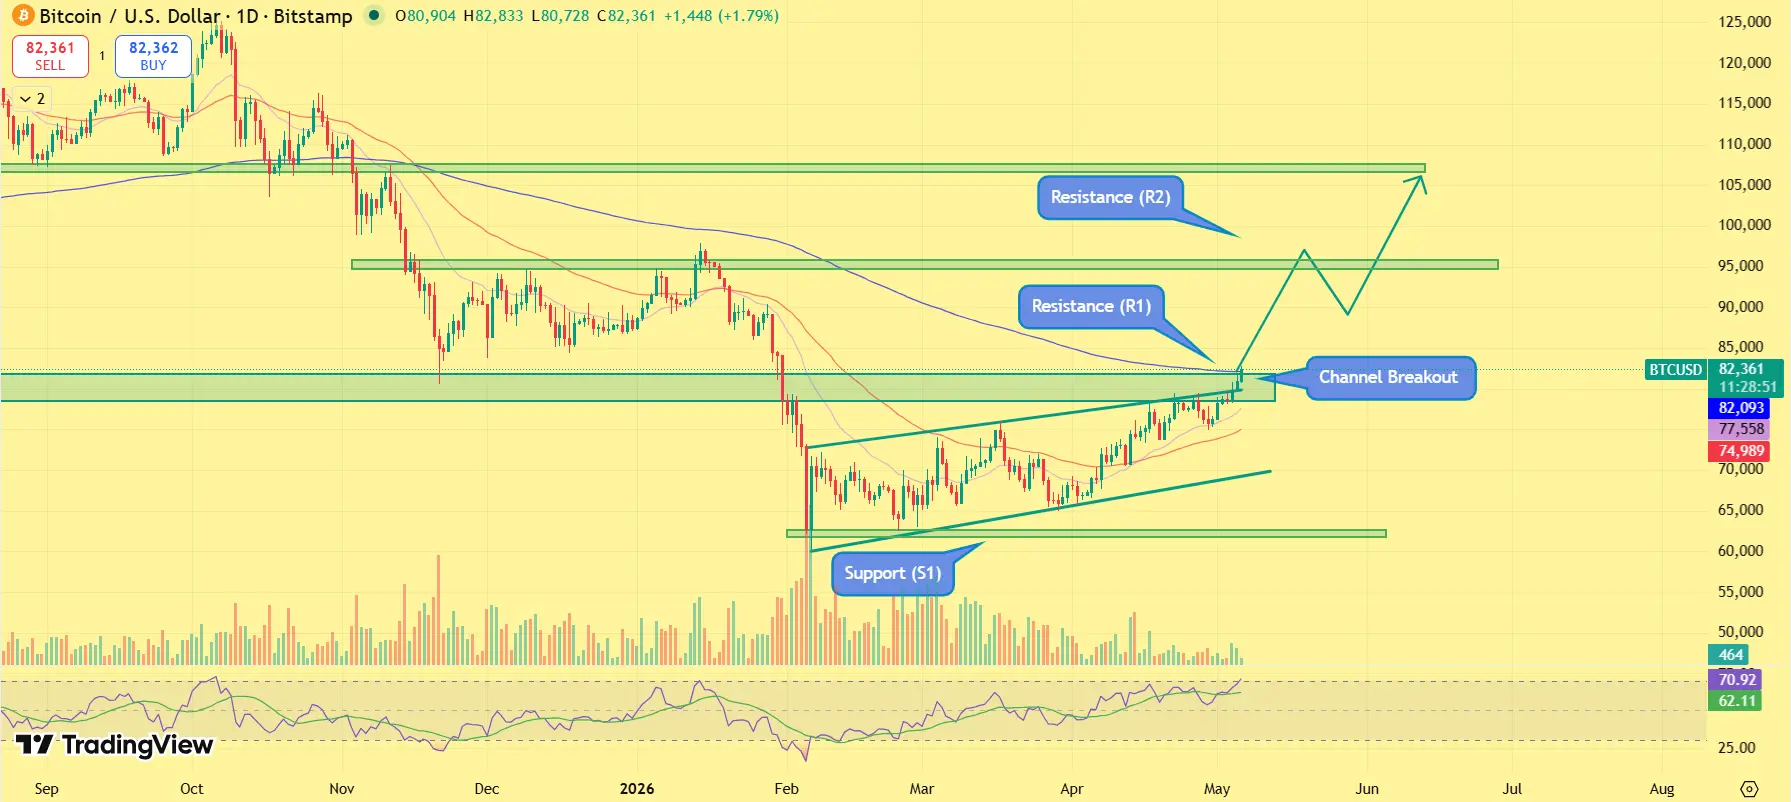
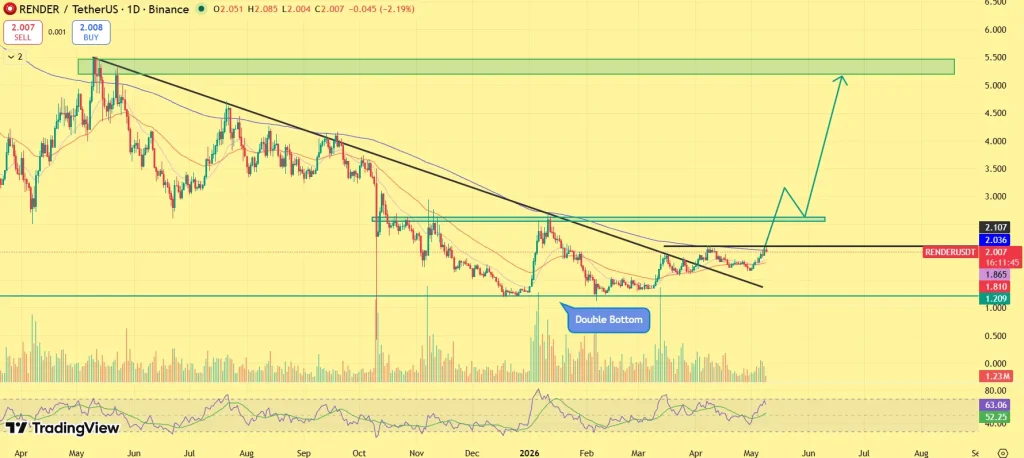
Render is starting May with one of its strongest technical structures in months, as the AI-focused token finally breaks out of a long-standing downtrend that had capped price action since late 2025. Trading near $2.06, RENDER is no longer behaving like a weak rebound asset. Instead, the chart now reflects early trend-reversal conditions, with buyers aggressively defending dips while momentum steadily expands above the breakout zone.
The shift comes as AI-linked crypto narratives regain traction across the market. Growing demand for decentralized GPU infrastructure, AI compute networks, and rendering capacity is pushing capital back toward fundamentally aligned projects, and Render remains at the center of that conversation. Unlike speculative meme-driven rallies, RENDER’s recovery is increasingly being supported by narrative strength alongside improving market structure.
The recent double-bottom formation near macro support suggests that seller exhaustion may already be complete. If bulls continue holding the $1.90–$2.00 range as support, the next major resistance sits around $2.50–$2.80. A decisive move above that region could trigger a stronger expansion phase toward the $3.50–$5.00 range during May and early Q2.
At the same time, broader crypto sentiment is stabilizing as Bitcoin holds firm near higher levels and risk appetite slowly returns across altcoins. That environment is beginning to favor high-utility sectors again, particularly AI infrastructure plays with real demand narratives.
Still, confirmation remains essential. Failure to sustain above the breakout zone could slow momentum and pull RENDER back into consolidation near the $1.70–$1.85 region before another breakout attempt develops.
For now, however, Render appears to be shifting from accumulation into expansion, with May shaping up as a potentially decisive month for the token’s broader recovery trend.
Coinpedia Render (RENDER) Price Prediction 2026
The broader outlook for Render (RNDR) in 2026 reflects a transition phase, where the asset is attempting to rebuild momentum after a prolonged correction from its previous highs. Following its peak near the $13–$14 region, RNDR entered a consolidation structure, with price stabilizing around lower demand zones.
As 2026 progresses, the structure appears to be gradually shifting. RNDR is forming a base above key support zones, while improving fundamentals, particularly rising demand for GPU compute and AI workloads, are strengthening its long-term narrative. This suggests that the current phase may represent a foundation for the next major upward move.
If buyers continue to defend the accumulation range and push the price above critical resistance levels near $5–$7, it could trigger a broader trend reversal. In such a scenario, momentum expansion could accelerate toward the $10–$14 range, with a potential extension toward $16–$18 under a strong bullish cycle. However, failure to sustain above key breakout zones may delay this trajectory, keeping RNDR within a prolonged consolidation phase before a confirmed expansion.
Overall, Render is likely to trade between $5 and $18 this year, with upside dependent on sustained AI-driven demand, network adoption, and successful breakout above macro resistance levels.
RENDER News and Catalysts
Rising institutional focus on AI infrastructure and GPU-compute networks is reviving demand across AI-linked crypto assets, with Render emerging as one of the sector’s strongest beneficiaries.
Increased adoption of decentralized rendering solutions among AI developers and creative studios is strengthening Render’s long-term utility narrative beyond speculative trading activity.
Expansion of partnerships and ecosystem integrations tied to GPU sharing and distributed compute markets is improving confidence in Render’s real-world scalability.
Renewed capital rotation into high-conviction AI narratives has accelerated momentum across the sector, with traders increasingly positioning RENDER as a leading infrastructure play for the next AI-driven crypto cycle.
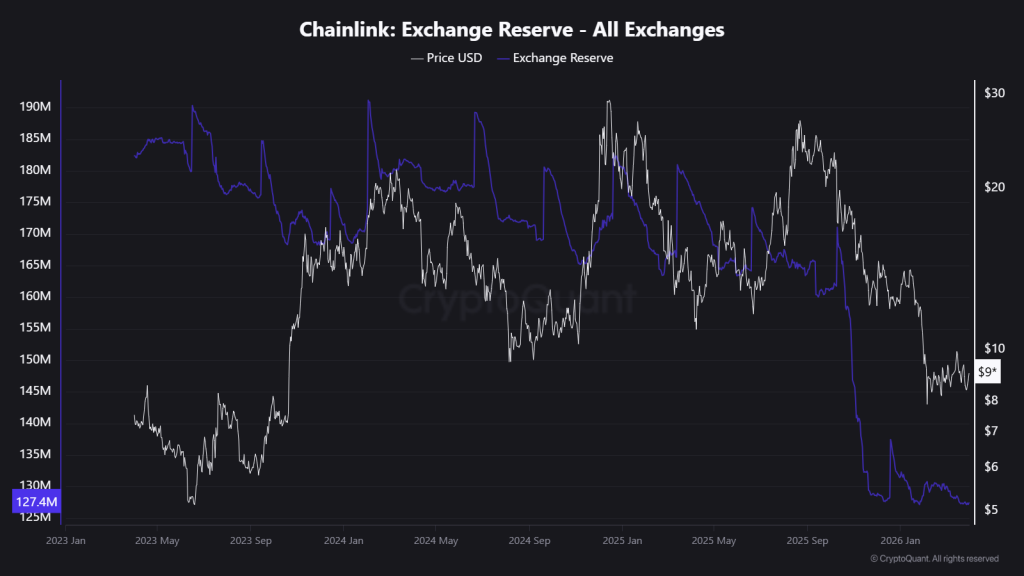
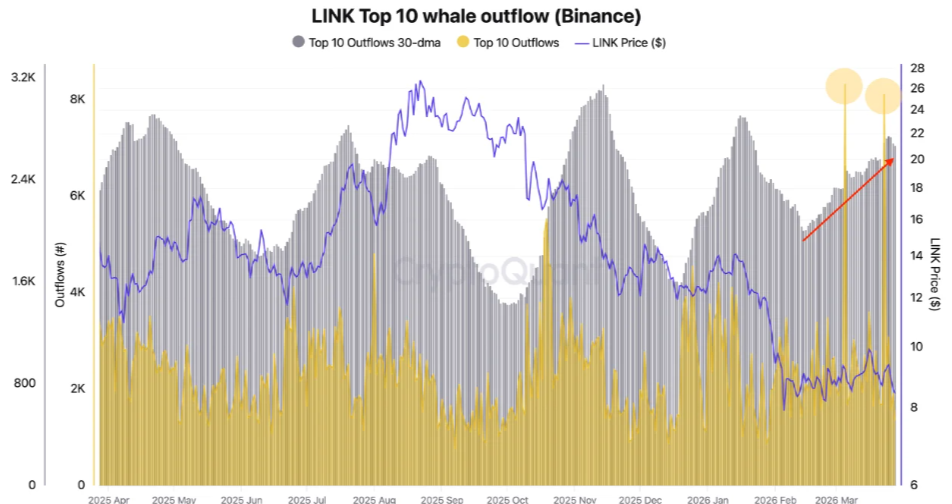
Render (RENDER) On-Chain Analysis
Render’s on-chain data reflects a constructive setup, where underlying network strength is stabilizing while speculative excess resets. Active addresses (7D) remain relatively steady despite recent price fluctuations, indicating that core network usage continues to hold. This consistency suggests that demand for Render’s GPU infrastructure is not purely speculative, but supported by ongoing utilization.
At the same time, development activity shows periodic spikes, highlighting continued protocol-level progress and active ecosystem development. Sustained builder engagement is a critical signal, particularly for infrastructure-focused projects where long-term value is driven by adoption and technological advancement.
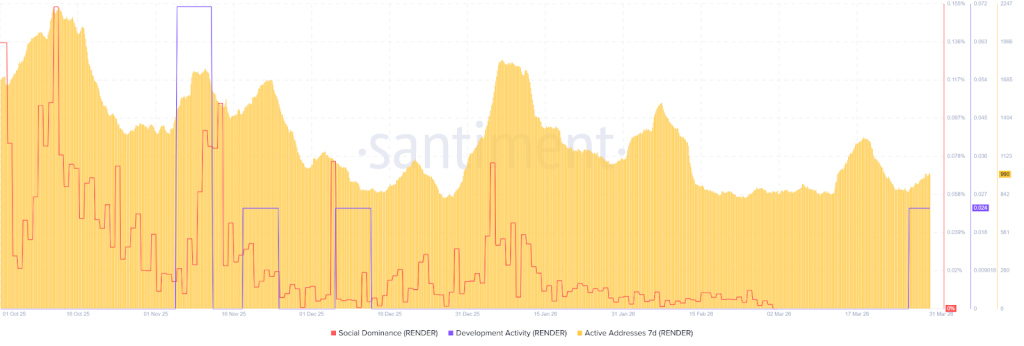
Meanwhile, social dominance has trended lower compared to previous peaks, reflecting reduced hype-driven participation. This decline often marks the unwinding of speculative interest, creating conditions for more sustainable, fundamentally driven growth.
The combination of stable network usage, ongoing development momentum, and cooling social hype points toward a reset phase that typically precedes stronger, more sustainable expansion cycles.
Render appears to be transitioning from a hype-driven phase into a utility-backed growth cycle, where continued adoption and real-world demand for decentralized GPU compute could act as the primary drivers of its next upward move.
RNDR Crypto Price Prediction 2027– 2030
| 2027 | 15 | 20 | 32 |
| 2028 | 24 | 38 | 50 |
| 2029 | 35 | 60 | 75 |
| 2030 | 62 | 88 | 100 |
RNDR Price Prediction 2031, 2032, 2033, 2040, 2050
The long-term projection assumes Render sustains relevance in enterprise blockchain use cases, with growth moderating over time as the asset matures.
| Year | Potential Low ($) | Potential Average ($) | Potential High ($) |
| 2031 | 90 | 100 | 130 |
| 2032 | 120 | 170 | 200 |
| 2033 | 180 | 240 | 300 |
| 2040 | 250 | 360 | 450 |
| 2050 | 500 | 670 | 750 |
RNDR Price Prediction: Market Analysis?
| Year | 2026 | 2027 | 2030 |
| Changelly | $6.20 | $9.50 | $18.00 |
| CoinCodex | $10.00 | $18.00 | $22.00 |
| Binance | $14.00 | $20.00 | $30.00 |
Never Miss a Beat in the Crypto World!
Stay ahead with breaking news, expert analysis, and real-time updates on the latest trends in Bitcoin, altcoins, DeFi, NFTs, and more.
FAQs
Render is a decentralized GPU network that lets creators and developers access distributed computing power for AI workloads, 3D rendering, gaming, and visual computing.
Render could trade between $5 and $18 by 2026 if adoption of decentralized GPU computing and AI infrastructure continues expanding across blockchain and tech industries.
Render could trade between $62 and $100 by 2030 if decentralized GPU networks gain adoption and demand for AI computing infrastructure continues rising.
By 2050, Render could potentially reach $500–$750 if decentralized GPU marketplaces remain relevant in AI, cloud computing, and Web3 infrastructure.
Render is considered a strong infrastructure project because it connects unused GPUs with users needing computing power for AI, graphics, and metaverse development.
RNDR price growth may depend on AI adoption, GPU demand, Web3 infrastructure expansion, and broader crypto market cycles increasing usage of decentralized computing.