Dubai is taking a bold step in luxury and finance as Billiton Diamond and Ctrl Alt announce a new initiative to put polished diamonds on the blockchain. The project has already tokenized more than AED 1 billion (over $280 million) worth of certified diamonds held in the UAE, making it one of the largest real-world asset tokenization efforts to date.
The partnership aims to transform diamonds—traditionally illiquid and difficult to verify—into transparent, secure, and easily transferable digital assets. Ctrl Alt is responsible for converting the physical diamonds into blockchain-based tokens, while Ripple’s custody technology ensures ownership remains safe, auditable, and tamper-proof.
Dubai Brings Diamonds On-Chain
The tokenized diamonds are issued on the XRP Ledger (XRPL), chosen for its fast settlement speeds and low transaction costs—key advantages when handling high-value luxury assets. Each token is backed by a certified physical diamond stored securely in the UAE, with full traceability and real-time verification.
Billiton plans to launch a dedicated digital platform where buyers and sellers can view diamond inventory, certification records, and ownership details instantly. The platform may later enable regulated secondary trading, opening the door for improved liquidity and faster settlement for manufacturers, traders, and investors.
DMCC has played a central role by connecting stakeholders and guiding the regulatory framework, reinforcing Dubai’s growing leadership in blending physical commodities with advanced financial technology.
Executives from Billiton, Ctrl Alt, DMCC, and Ripple describe the initiative as a new benchmark for bringing high-value assets on-chain. Crypto analyst WrathofKahneman called it a major step forward for real-world asset adoption, while Bill Morgan joked that although his wife can’t wear a tokenized diamond, she might still want one.
Never Miss a Beat in the Crypto World!
Stay ahead with breaking news, expert analysis, and real-time updates on the latest trends in Bitcoin, altcoins, DeFi, NFTs, and more.
FAQs
What is diamond tokenization and how does it work?
Diamond tokenization converts physical diamonds into digital tokens on blockchain, allowing secure, transparent, and tradable ownership.
How does tokenizing diamonds benefit investors?
It increases transparency, reduces costs, and improves liquidity by making diamonds easily tradable digital assets with clear provenance and ownership records.
Is tokenized diamond trading regulated in Dubai?
Yes, all trading of tokenized diamonds will require approval from Dubai’s Virtual Assets Regulatory Authority (VARA), ensuring compliance and investor protection.
US President Donald Trump has signed a massive $1.2 trillion government funding bill, bringing an end to a brief four-day federal shutdown. The shutdown began over the weekend after lawmakers failed to reach an agreement on key spending measures.
The decision has reduced political uncertainty and brought a positive reaction in the crypto market, especially for Bitcoin.
Trump Signs $1.2 Trillion Bill Ending Government Shutdown
On February 3, 2026, US President Donald Trump signed the Consolidated Appropriations Act of 2026, a massive $1.2 trillion spending bill.
The bill was passed by Congress in the House by a narrow margin, 217-215. It finalizes 11 major annual spending bills that cover government programs and operations for the rest of the fiscal year.
BREAKING: The law being signed by President Trump SLASHES $10B in wasteful and fraudulent foreign aid, ENDS taxpayer grants to NPR and PBS, and solidifies the closure of USAID
With Trump’s signature, most federal agencies will now remain funded through September 30, 2026.
Key Highlights of the Spending Bill
The newly signed bill includes several important changes. It cuts funding for NPR and PBS, reduces foreign aid by nearly $10 billion, raises military pay, and increases money for deportation flights. It also confirms that USAID will be closed as part of budget reforms.
However, not everything is settled yet. The spending plan for the Department of Homeland Security is still under negotiation, with Democrats pushing for tighter limits on enforcement actions.
The bill also showed divisions inside the Republican Party, as some members disagreed with parts of the spending plan.
House Democratic Leader Hakeem Jeffries said Democrats will not support any more short-term funding for Homeland Security unless major changes are made. This creates a risk of another partial government shutdown soon.
How the Bill Impacts the Crypto Market
The bill does not include any direct rules for cryptocurrency, but it still affects the crypto market in important ways. As the bill was signed, Bitcoin saw a small recovery bounce from $75,600 and $77,310.
During the four-day shutdown, regulators like the SEC and CFTC were partly inactive, which slowed crypto approvals and ETF discussions.
With the government now reopened, key economic data, including the January jobs report and weekly jobless claims, will be released on time. These reports influence Federal Reserve decisions, which have a strong impact on crypto prices.
Never Miss a Beat in the Crypto World!
Stay ahead with breaking news, expert analysis, and real-time updates on the latest trends in Bitcoin, altcoins, DeFi, NFTs, and more.
FAQs
What does the $1.2 trillion funding bill do?
It ends the four-day shutdown and funds most federal agencies through Sept 30, 2026 with $1.2T in approved spending.
How did the bill affect Bitcoin and crypto markets?
It eased uncertainty; Bitcoin rebounded as markets welcomed reopened agencies and timely economic data that guide Fed expectations.
Does the bill include new cryptocurrency regulations?
No. It adds no crypto rules, but reopening the SEC and CFTC restarts reviews, data releases, and ETF-related processes.
Is another government shutdown still possible?
Yes. DHS funding is still disputed, and party divisions mean a partial shutdown risk remains if talks stall.
The Bitcoin price is under pressure after slipping below its April 2025 low. The move has reignited fears of a deeper correction, but analysts remain divided on whether this is the final phase of the bear market or just another leg down before recovery.
Historically, Bitcoin bear markets last around 12 months. Considering this, the current cycle appears roughly one-third complete. However, this time the decline has been faster than usual, raising the possibility that the bottom could arrive earlier than in past cycles.
Bitcoin Market Cycle Appears to Be Moving Faster
One key difference in this cycle is speed. Bitcoin topped earlier than expected in October, and the decline since then has been sharper than previous bear markets. Some analysts believe this faster drop could mean the bottom also forms sooner, possibly between June and August instead of late Q4.
There is also a growing belief that Bitcoin market cycles are shortening overall. As institutional participation increases, long-term holders and miners may have less influence on price swings, slowly pushing Bitcoin toward behavior closer to traditional risk assets like the S&P 500.
How Low Can Bitcoin Price Crash?
Based on historical drawdowns, Bitcoin often finds strong buying interest after falling 40% to 60% from its peak. In this cycle, many analysts do not expect a 70% crash like earlier bear markets.
Current estimates suggest Bitcoin may be 20% to 30% away from the final bottom. If price continues lower, the $65,000 level is seen as a zone where fear typically builds. A deeper drop toward $55,000 could trigger panic selling.
So, Late Q3 or early Q4 could offer better conditions for long-term investors to re-enter the market with confidence. Using the traditional 365-day bear market model, there are roughly 200 days left before a formal bottom forms.
From here, Bitcoin may move sideways with slow weakness, or it could drop sharply, bringing the bear phase to an earlier end.
Bitcoin Below Long-Term Support Raises Risk
Veteran trader Peter Brandt has noted that Bitcoin has breached an important long-term support level on the weekly chart. Historically, when this happens, the price often moves lower before finding real stability.
Past cycles in 2014, 2018, and 2022 show that once Bitcoin fell below the 100-week moving average, it often dropped quickly toward the 200-week level before any meaningful bounce occurred. This history suggests that short-term relief rallies are not guaranteed.
Galaxy CEO Says Bitcoin Is Near the Lower End of a New Range
Galaxy Digital CEO Mike Novogratz believes Bitcoin’s recent drop is driven by profit-taking rather than a breakdown in fundamentals. After Bitcoin surged above $100,000 and later reached near $130,000, many early investors locked in gains, creating selling pressure.
According to Novogratz, Bitcoin may now be trading within a broad $70,000 to $100,000 range. With price hovering near $76,000, he believes much of the excess leverage has already been flushed out, bringing the market closer to balance.
Further, macro conditions may play a role in stabilizing the Bitcoin price. The progress on crypto market structure regulation and shifts in interest rate expectations could improve sentiment.
Novogratz also highlighted that stablecoin usage and blockchain infrastructure growth remain strong, suggesting adoption continues even as prices struggle.
FAQs
How low can Bitcoin price fall during this correction?
Analysts see strong demand between $65,000 and $55,000, a range where fear peaks and long-term buyers often step back in.
Why is this Bitcoin market cycle moving faster than before?
Higher institutional activity and faster capital flows are shortening cycles, making price drops sharper but potentially reducing bear market length.
When could Bitcoin recover from the current downturn?
If history repeats, Bitcoin may stabilize by late Q3 or early Q4 as selling slows and macro conditions improve.
The nomination of Kevin Warsh as the next Chair of the US Federal Reserve is already facing serious hurdles. The group, led by Senator Elizabeth Warren are pushing back strongly, warning that the warsh nomination should not move forward while major investigations involving current Fed Jerome Powell remain unresolved.
Why Democrats Want Warsh’s Fed Nomination To Be Delayed
In a letter to the committee, the Democrats demanded that “any nomination proceedings for Mr. Warsh” be put on hold until the investigations are fully completed. They believe it would be unfair and politically risky to replace Powell while the cases are still open.
Jerome Powell is currently being investigated by the Department of Justice over possible issues tied to $2.5 billion in extra renovation costs at the Federal Reserve headquarters.
Although Powell has called the investigation “unprecedented” and hinted that it may be connected to political pressure from President Donald Trump over policy disagreements.
At the same time, Fed Governor Lisa Cook is reportedly dealing with a separate legal issue connected to an alleged mortgage fraud case. Trump had previously tried to remove Cook from her role, but she remains in office for now.
Concerns Over Federal Reserve Independence
Democrats say these investigations are being used as a political tool to weaken the independence of the Federal Reserve. They argue that allowing Trump to choose a new Fed Chair while two sitting officials are under investigation creates a dangerous situation.
The letter from Democratic lawmakers warned that letting the administration influence the Fed in this way could damage the credibility of the central bank.
They called the situation “absurd” and accused the government of trying to take control of the Fed through legal pressure.
Thin Senate Margin Gives Democrats Leverage
The Senate Banking Committee is narrowly divided, with 13 Republicans and 11 Democrats. While Democrats alone cannot block the nomination, even a single Republican dissent would be enough to stall Warsh’s confirmation.
That risk became real after Senator Thom Tillis announced he would oppose any Federal Reserve nominations until the investigations conclude. His stance effectively gives Democrats the leverage needed to delay the process.
Perhaps, until the investigations are closed, Warsh’s nomination is unlikely to advance smoothly. Even if Republicans push forward, the risk of a committee deadlock remains high.
Binance’s Secure Asset Fund for Users (SAFU) has made another big move in its ongoing plan to shift its $1 billion emergency reserve from stablecoins into Bitcoin. The fund added 1,315 BTC worth about $100 million in its latest buy, boosting total two‑day accumulation to 2,630 Bitcoin valued at roughly $201 million. This purchase is part of a 30‑day conversion strategy announced by Binance, reflecting confidence in Bitcoin as a core reserve asset and strengthening user protection in volatile markets.
Monero (XMR) is showing early signs of stabilization after a prolonged decline, rising over 3% on the day as price reacts from a technically significant support zone. The bounce comes at a critical moment, with XMR retesting the lower edge of a multi-week rising channel while broader crypto markets remain fragile. This creates a familiar dilemma: Is the move simply a relief bounce inside a weakening trend, or the early phase of a rotation back toward the upper channel near $500?
Monero’s price has defended the channel support zone of $380 and showed a pullback during the intraday session. This bounce has remained orderly rather than impulsive. As XMR approached the lower edge of the channel, selling pressure slowed gradually, with downside wicks expanded, suggesting sellers are no longer in control at current levels. Technically, the $360-$380 region has emerged as a demand zone.
As long as Monero price holds above this zone, the broader channel structure remains intact. The immediate test now lies at $390-$400, where sellers placed their positions. A strong break of this region would shift the corrective structure to neutral-bullish, opening the door toward $420-$450. While further strength above the 50-day EMA mark could extend the recovery toward the $480-$500 zone back into focus as a rotational target rather than a distant hope. On the other side, a break below $360, however, would invalidate the channel and expose deeper downside making the current bounce technically decisive.
Open Interest and Liquidation Map Point to Short-Covering Risk
Derivatives data adds weight to the rebound scenario. Monero’s future open interest has risen above $142 million, up more than 4% even as price stabilizes, a sign that traders are adding exposure, not exiting. This increase in open interest alongside price rise often signals shorts being forced to defend positions, especially when price sits near crucial support.
Liquidation heatmap data shows a clean cluster of short liquidation levels stacked above the current range, particularly between $390 and $410. If XMR price pushes into this zone, forced short closures could accelerate upside momentum, turning a slow rebound into a sharp squeeze. At the same time, downside liquidation pressure appears relatively thin below current price levels, reinforcing the idea that sell-side leverage has already been flushed during the prior decline.
Broader Context Keeps Reversal in Check
Despite the improving micro-structure, Monero is still trading within a broader environment of risk aversion, where capital remains selective and volatility elevated. Privacy-focused assets have lagged during recent market weakness, making confirmation, not anticipation. This means the rebound needs a follow-through, not just reaction. Without acceptance above reclaimed resistance, the move risks fading into another lower-high sequence. As XMR price remains at a decision point, holding above the support zone of $360 keeps the path toward $400-$420 viable.
Elon Musk has pulled far ahead as the world’s richest person after SpaceX acquired his AI startup xAI. Forbes’ real-time tracker now estimates Musk’s net worth at $852.5 billion. The deal merged SpaceX, xAI, and X, valuing the combined company at $1.25 trillion. Musk owns 42% of SpaceX, which now accounts for more than half of his total wealth. His fortune is now larger than the combined wealth of Jeff Bezos, Larry Page, and Sergey Brin. Tesla still makes up about 12% of his holdings, while SpaceX’s Starship and Starlink continue to drive growth.
Bitcoin price today dropped sharply, falling to the $74,000 level and triggering another wave of selling across the crypto market. Ethereum slipped nearly 10% to around $2,100, while most major altcoins declined between 5% and 10% today.
The sudden move has raised fresh concerns about whether Bitcoin is entering a deeper correction phase after weeks of volatility.
Possible Reasons Behind the Bitcoin Crash Today
The latest Bitcoin crash is not linked to a single event. Instead, analysts point to multiple factors hitting the market at the same time, creating strong downward pressure.
Heavy Liquidations Accelerate Bitcoin Decline
One of the main reasons behind the drop is massive liquidations in the futures market. Market data shows that over $500 million worth of Bitcoin positions were liquidated in recent sessions.
Many traders were using high leverage. When Bitcoin slipped even slightly, automatic liquidations kicked in, forcing positions to close. This led to a chain reaction of selling, pushing prices lower within minutes.
After the U.S. market opened, Bitcoin dumped another $1,700, wiping out more than $55 million in long positions in just two hours. The overall crypto market lost nearly $50 billion during the same move.
US Stock Market Weakness Hits Crypto Hard
The crypto sell-off mirrored weakness in traditional markets. The S&P 500 fell nearly 1.3%, as investors moved away from risk assets.
Historically, when global markets turn cautious, cryptocurrencies tend to react faster and more sharply. The same pattern played out this time, with Bitcoin and altcoins facing intense selling pressure.
Spot Bitcoin ETF Outflows Add Pressure
Another key factor weighing on prices is strong outflows from spot Bitcoin ETFs.
As per CoinGlass data, on February 3, spot BTC ETFs recorded $272 million in net outflows. BlackRock’s IBIT stood out as the only major buyer with $60 million in inflows, while other funds continued to see selling.
When ETF flows turn negative like this, it often signals reduced confidence among institutional investors, even if long-term interest remains intact.
Epstein Files Add to Market Uncertainty
Beyond macro pressure and liquidations, renewed discussion around the Epstein files has added another layer of uncertainty to the crypto market. Reports highlighting Jeffrey Epstein’s past connections to early Bitcoin research, funding linked to MIT’s Digital Currency Initiative, and ties to prominent crypto figures have resurfaced online.
While there is no direct evidence linking these revelations to current price action, the narratives have fueled speculation on social media and increased short-term volatility. During already weak market conditions, such controversies often amplify fear and contribute to risk-off behavior among traders.
Rising global tensions have also played a role. Ongoing disputes involving the United States, Iran, and Venezuela, along with tariff-related concerns, have increased uncertainty across financial markets.
During such periods, large funds and ETF managers usually cut exposure to risky assets. This capital outflow has added further pressure to Bitcoin and the broader crypto market.
Profit-Taking After Bitcoin’s Massive Rally
Galaxy Digital CEO Mike Novogratz believes the recent decline is mainly driven by profit-taking, not panic.
According to him, many investors who bought Bitcoin at much lower levels started selling after prices crossed $100,000, locking in gains after a long rally. He described the move as a “seller’s wave”, rather than fear-driven selling.
Novogratz also dismissed concerns around emerging threats like quantum computing, saying price moves are still driven by basic supply and demand.
Bitcoin Price Analysis: Key Support and Resistance Levels
The market is sitting at a critical turning point. If Bitcoin slips below the $74,500 support, the next downside target is seen around $69,800–$68,000, a zone that previously acted as strong resistance.
A deeper breakdown from there could drag prices toward the $53,000–$54,000 range, implying a correction of nearly 30% from current levels.
On the upside, analysts believe a quick recovery is unlikely, as Bitcoin would need to reclaim the $90,000–$95,000 resistance zone and establish a clear higher-high structure before any sustained rebound can take shape.
Never Miss a Beat in the Crypto World!
Stay ahead with breaking news, expert analysis, and real-time updates on the latest trends in Bitcoin, altcoins, DeFi, NFTs, and more.
FAQs
Why is Bitcoin price down today?
Bitcoin is down today due to leveraged liquidations, weak U.S. markets, ETF outflows, profit-taking after the rally, and rising global uncertainty.
How do U.S. stock market declines impact Bitcoin prices?
When stocks fall, investors reduce risk exposure. Bitcoin typically reacts faster, leading to sharper declines during market-wide sell-offs.
Is the current Bitcoin drop a healthy correction?
Yes. Many analysts view this move as a normal correction after a strong rally, helping reset leverage and excess speculation.
Does profit-taking mean Bitcoin’s bull market is over?
No. Profit-taking is common after major rallies and does not signal the end of a long-term bullish trend.
What could drive Bitcoin prices higher again?
Stabilizing markets, renewed ETF inflows, reduced leverage, and improving macro sentiment could support a recovery.
BitMine Immersion Technologies is facing fresh pressure after reporting over $6 billion in unrealized losses linked to its Ethereum-focused treasury strategy. As the Ethereum price fell along with the broader crypto market, BitMine shares (BMNR) dropped another 5% on Monday, trading near $23.83, their lowest level since the stock jumped in July 2025 following the ETH treasury announcement.
The decline has raised concerns among investors, but company leadership says the reaction is missing the bigger picture.
Tom Lee Says Losses Are Part of the Plan
BitMine Chairman Tom Lee rejected claims that the losses show a failed strategy. In posts shared on X, Lee explained that the company is not trying to time the crypto market.
These tweets miss the point of an ethereum treasury: – BitMine is designed to track the price of $ETH – outperform over the cycle (think up ETH) – crypto is in a downturn, so naturally ETH is down$BMNR will see “unrealized” losses on our holdings of ETH during these times: -… https://t.co/VpoNjAnJdC
— Thomas (Tom) Lee (not drummer) FSInsight.com (@fundstrat) February 3, 2026
Instead, BitMine is designed to track and outperform Ethereum over a full market cycle, similar to how long-term index funds work in traditional markets. According to Lee, losses during market downturns are expected, not accidental.
He added that index funds are rarely criticized during bear markets — and BitMine should be viewed the same way.
Heavy Ethereum Holdings Increase Price Impact
BitMine’s large Ethereum holdings make the company especially sensitive to price swings. It currently owns around 4.24 million ETH, worth about $9.6 billion, down from nearly $14 billion at last year’s peak.
Despite the price drop, BitMine continues to buy more Ethereum. The company added 41,788 ETH in just the past week, showing strong confidence in ETH’s long-term value.
Because of this scale, even small ETH price moves can have a big impact on BitMine’s reported losses, especially during periods of market stress and forced selling.
Rather than selling assets during downturns, BitMine earns income through Ethereum staking. The company expects to generate about $164 million per year from staking, with an average return of 2.81%.
As of February 1, around 2.9 million ETH — valued at nearly $6.7 billion — is actively staked. This provides steady income even when prices are weak.
Strong Balance Sheet With No Debt
One key advantage for BitMine is its debt-free balance sheet. The company reports:
193 Bitcoin holdings
$586 million in cash
$200 million stake in Beast Industries
No outstanding debt
This financial position allows BitMine to hold through market downturns without being forced to sell Ethereum at lower prices.
Long-Term Ethereum Strategy Remains Unchanged
Looking ahead, BitMine plans to launch its MAVAN validator network in 2026, partnering with three staking providers to expand operations. Despite short-term pressure, Lee says the company’s belief in Ethereum remains strong.
His message is clear: price volatility is temporary, but Ethereum’s role in the future of finance is long-term. For BitMine, current losses are not a warning sign; they are the cost of sticking with a long-term Ethereum investment strategy.
Never Miss a Beat in the Crypto World!
Stay ahead with breaking news, expert analysis, and real-time updates on the latest trends in Bitcoin, altcoins, DeFi, NFTs, and more.
FAQs
How much Ethereum does BitMine currently own?
BitMine holds about 4.24 million ETH. Because of this scale, even small ETH price changes significantly affect reported results.
Is BitMine financially stable despite the crypto market decline?
Yes. BitMine has no debt, holds substantial cash, Bitcoin, and equity investments, giving it flexibility to weather market downturns.
How does Ethereum staking impact BitMine’s financial performance?
Ethereum staking provides recurring revenue. BitMine expects roughly $164M per year, helping stabilize cash flow during crypto downturns.
Does BitMine have debt or liquidity risks as a crypto stock?
No. BitMine has zero debt, strong cash reserves, Bitcoin holdings, and equity investments, supporting long-term crypto exposure.
Bitmine (BMNR) has faced criticism after reports showed an unrealized loss of about $6.6 billion on its Ethereum holdings amid a market downturn. Some traders warned that this could create future selling pressure and limit ETH’s price. Bitmine Chairman Tom Lee pushed back, saying these views misunderstand the purpose of an Ethereum treasury; it’s meant to mirror ETH’s price over the full cycle, so paper losses during a slump are expected. Lee called the losses “a feature, not a bug,” comparing them to index ETFs that also show losses in down markets, and emphasized Bitmine’s long‑term strategy and ongoing ETH accumulation.
Crypto.com has spun out its prediction markets business into a standalone platform after reporting explosive growth, entering a crowded but booming industry.
Tether has pulled back its fundraising plans after investors raised concerns about a reported $500 billion valuation, the Financial Times reported. The company had earlier considered raising $15–20 billion, but advisers are now discussing a much smaller amount of about $5 billion. CEO Paolo Ardoino said the higher figure was only the maximum Tether was willing to raise. He added that the company, which made around $10 billion last year from USDT reserves, is comfortable not raising any new funds.
The live price of the VeChain token is $ 0.00857868.
Price predictions for 2026 range from $0.035 to $0.088.
VET could extend toward $0.450 by 2030, if recovery structure holds.
VeChain (VET) enters the current market phase at a point where long-term fundamentals and price behavior are gradually beginning to align. As one of the earliest blockchain networks focused on real-world enterprise adoption, VeChain has spent years building infrastructure around supply-chain tracking, data transparency, and business-level integrations. While broader market interest faded during the prolonged correction, the protocol continued developing quietly, preserving its relevance beyond speculative cycles.
From a technical standpoint, VET’s chart structure no longer reflects panic-driven selling. Instead, price action has shifted into controlled consolidation, marked by lower volatility and consistent reactions around established demand zones. This type of behavior often suggests the market is transitioning from extended distribution into a valuation phase. As the year progresses, attention turns to whether VeChain can maintain this base and convert stability into a broader recovery move heading toward 2026.
As February unfolds, VeChain’s price action indicates that the market is prioritizing balance rather than momentum. VET has been rotating within a defined range, with buyers repeatedly defending the $0.020–$0.023 zone, while upside attempts continue to face supply pressure near $0.035–$0.038. As long as price holds above this lower support band, the broader structure remains constructive.
Rather than signaling weakness, this sideways movement suggests that selling pressure is being absorbed. A sustained break above the upper resistance zone would improve short-term sentiment, but even continued consolidation within this range supports the view that VeChain is building a base rather than entering a renewed downtrend.
VeChain (VET) Price Prediction 2026
Looking ahead, 2026 appears to be a transition year for VeChain, where prolonged consolidation may evolve into early trend development. The extended compression visible on higher timeframes suggests that speculative excess from previous cycles has largely been unwound, allowing price to rebuild on a firmer foundation.
During the first half of 2026, VET is likely to continue rotating within a broad band, potentially revisiting support near $0.030–$0.040 while making repeated attempts to reclaim resistance around $0.060. This range-bound behavior is typical during accumulation phases, where long-term participants gradually establish positions. If VeChain manages to reclaim and hold above the $0.060–$0.070 region later in the year, the technical structure would open the door for an advance toward the $0.088 level by year-end. Such a move would likely unfold gradually, supported by higher lows and improving trend consistency rather than sharp, speculative spikes.
VeChain Crypto Price Prediction 2026 – 2030
Year
Potential Low ($)
Potential Average ($
Potential High ($)
2026
0.035
0.060
0.088
2027
0.055
0.095
0.140
2028
0.085
0.160
0.250
2029
0.130
0.240
0.360
2030
0.200
0.350
0.450
VET Token Price Projection 2026
In 2026, VeChain price could project a low price of $0.035, an average price of $0.060, and a high of $0.088.
VeChain Coin Price Target 2027
As per the VeChain Price Prediction 2027, VET may see a potential low price of $0.055. Meanwhile, the average price is predicted to be around $0.095. The potential high for VET price in 2027 is estimated to reach $0.140.
VET Crypto Price Action 2028
In 2028, VeChain price is forecasted to potentially reach a low price of $0.085 and a high price of $0.250.
VeChain (VET) Price Forecast 2029
Thereafter, the VeChain (VET) price for the year 2029 could range between $0.130 and $0.360.
VeChain Price Prediction 2030
Finally, in 2030, the price of VeChain is predicted to maintain a steady positive. It may trade between $0.200 and $0.450.
The long-term projection assumes VeChain sustains relevance in enterprise blockchain use cases, with growth moderating over time as the asset matures.
Year
Potential Low ($)
Potential Average ($)
Potential High ($)
2031
0.30
0.40
0.60
2032
0.26
0.50
0.60
2033
0.30
0.55
0.75
2040
0.42
0.85
1.20
2050
0.65
1.40
2.20
VeChain (VET) Price Prediction: Market Analysis?
Year
2026
2027
2030
Changelly
$0.071
$0.105
$0.42
CoinCodex
$0.058
$0.082
$0.330
WalletInvestor
$0.086
$0.0125
$0.480
CoinPedia’s VeChain Price Prediction
Coinpedia’s price prediction suggests that VeChain is currently progressing through a late-stage accumulation phase. If VET continues holding its base and successfully reclaims higher resistance levels, the token could trade near $0.088 by the end of 2026, with longer-term potential extending toward the $0.30–$0.45 range by 2030, depending on market participation and trend strength.
Year
Potential Low ($)
Potential Average ($)
Potential High ($)
2026
0.035
0.060
0.088
Never Miss a Beat in the Crypto World!
Stay ahead with breaking news, expert analysis, and real-time updates on the latest trends in Bitcoin, altcoins, DeFi, NFTs, and more.
FAQs
What is the VeChain (VET) price prediction for 2026?
VeChain is projected to trade between $0.035 and $0.088 in 2026, with price action shaped by consolidation, accumulation, and gradual trend development.
What is the VeChain price prediction for 2027?
VeChain price prediction for 2027 suggests VET could trade between $0.055 and $0.140, supported by accumulation and gradual trend expansion.
What is the VET Chain price prediction for 2030?
VeChain price prediction for 2030 estimates a range of $0.200 to $0.450 if enterprise adoption grows and long-term market trends remain positive.
What is the VeChain price forecast for 2035?
VeChain price prediction for 2035 assumes steady maturity, with VET potentially trading between $0.45 and $0.75 as growth moderates over time.
What is the VeChain price prediction for 2040?
VeChain price prediction for 2040 projects VET could range from $0.85 to $1.20 if it maintains relevance in enterprise blockchain solutions.
How high can VeChain price go in 2025?
VeChain price in 2025 could range between $0.030 and $0.060 if consolidation holds and market conditions gradually improve without strong speculative momentum.
Is VeChain a long-term investment?
VeChain’s focus on enterprise blockchain use cases supports its long-term outlook, though price growth is expected to be gradual rather than explosive.
Polymarket is taking its brand offline, opening a free grocery store in New York City and backing it with a $1 million donation to fight food insecurity. Polymarket, the crypto-based prediction market platform, announced on Feb. 3 that it will…
The crypto market showed early signs of stability on Feb. 4 after U.S. President Donald Trump signed a funding bill that brought a short-lived government shutdown to an end. The move reduced immediate political uncertainty, which had unsettledfinancial markets in…
MetaMask has added access to more than 200 tokenized U.S. stocks and ETFs through a new integration with Ondo Finance, expanding users’ ability to trade traditional assets directly inside the wallet. Ondo announced the update on Feb. 3, saying its…
The site lets users set an hourly rate for tasks from errands to business meetings. It was built using AI agents in a "Ralph loop," a form of vibe coding.
The Ethereum co-founder said many layer‑2s have failed to decentralize and continue to be mediated by multisig bridges instead of inheriting Ethereum’s security advantages.
“Don Colossus” is not just a tribute to the 34-felony-count president. The New York Times describes a bizarre back-and-forth that proved to be a rollercoaster of financial hopes and legal disputes.
Crypto traders usually view negative funding rates as a buy signal, but this week’s volatile US earnings outcome may cloud its value for ETH investors.
Bitcoin’s volatility spiked, and its price plummeted to fresh lows as worrying US economic conditions emerged. Will credit stress data signal the next accumulation phase for BTC?
The Nasdaq-listed insurance brokerage said an unidentified investor would contribute Bitcoin in exchange for equity, alongside an AI- and crypto-focused partnership.
The Trump family is already making a mint off crypto: $802 million in the first half of 2025; over 90% of their reported income came from digital assets. Now, a new token is in the works.
Bitcoin (BTC) price has led the wider crypto market in a further selloff. After slipping below its crucial buy zone around $80k last week, Bitcoin price extended its selloff today to hit $72,889 on Tuesday, February 3, for the first time since the first week of November.
Bitcoin Price Falls on Leverage Flashouts
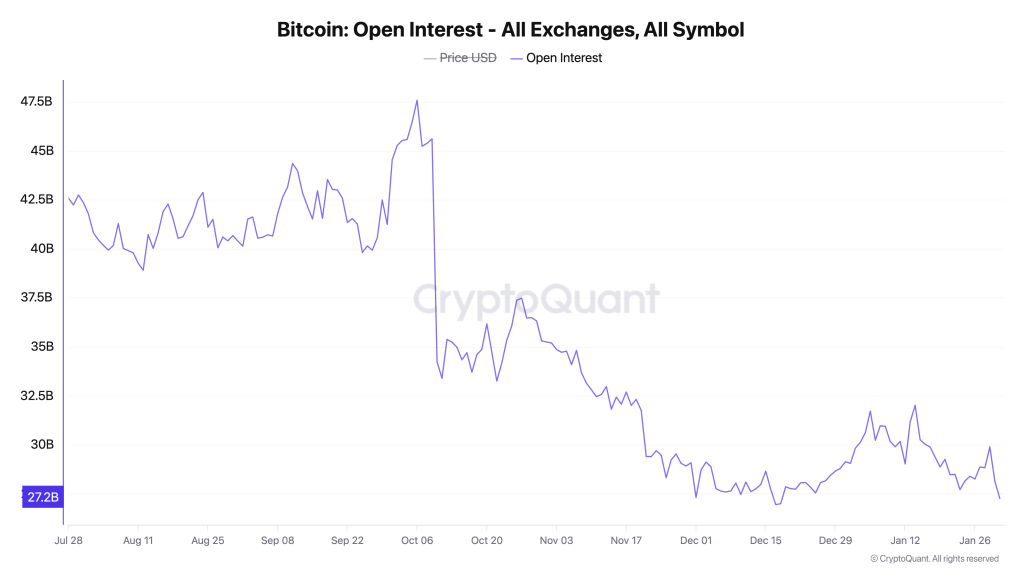
As such, more than 167k leveraged traders were flashed out, with more than $730 million liquidated during the past 24 hours. Out of this, more than $528 million involved long traders, amid the notable decline in Bitcoin’s Open Interest (OI).
According to market data analysis from CoinGlass, Bitcoin’s OI has continued to shrink since the October 11 crypto capitulation to hover about $52.7 billion at press time.
Following today’s BTC price capitulation to $72k today, Matt Hougan, Bitwise CIO, stated that the flagship coin is under the influence of a multi-month bear market. Hougan stated that the Bitcoin price has been in a bear market since early 2025, but the high institutional adoption and regulatory clarity have blinded investors.
“This is not a bull market correction or a dip. It is a full-bore, 2022-like, Leonardo-DiCaprio-in-The-Revenant-style crypto winter set into motion by factors ranging from excess leverage to widespread profit-taking by OGs,” Hougan stated.
What’s Next?
Hougan, however, stated that the Bitcoin bottom is closer as its four-year bear cycle is in the last phase. Moreover, Hougan believes that Bitcoin investors are banking on regulatory progress and high institutional adoption, to drive a bullish rebound ahead.
Nonetheless, onchain data from Santiment shows that key Bitcoin investors have been aggressively selling while retail buys-back, a classic sell signal. From a technical analysis standpoint, if Bitcoin buyers fail to defend $73k in the coming day, a further correction towards $69k will be inevitable.
Dave Weisberger, co-founder of CoinRoutes and the man who built Morgan Stanley’s first program trading system, thinks October’s crypto crash was a coordinated attack. He shared his views on the Thinking Crypto podcast with host Tony Edward.
Weisberger called it “the greatest mass liquidation event in history.” The damage, that has kept the industry talking, was $19 billion wiped out. Bitcoin alone saw $5 billion in liquidations. Many altcoins dropped 20-70% at the bottom.
“Was it manipulation? I damn well think so. I have no proof. But it was just too damn obvious a time for an incredibly profitable attack,” he said.
How Did It Happen?
Weisberger broke down the playbook. Attackers spend weeks building a position: long spot, short perpetual futures. Then they wait for a low-liquidity window and dump spot holdings. They place bids far below market price in perpetuals.
When prices fall, leveraged traders get liquidated. Forced selling kicks in. The attackers scoop up assets at rock-bottom prices and walk away with massive profits.
DeFi exchanges got hit hardest because positions were visible on-chain. Binance’s auto-deleveraging system, Weisberger said, was “broken” during the event.
Weisberger has no patience for the halving cycle theory. He pointed out it’s based on just three data points.
He compared it to the Super Bowl Indicator, a 16-year streak that linked NFL wins to stock market performance. That correlation was “complete and unadulterated bullshit,” he said. The four-year cycle, in his view, is no different.
Why Recovery Is Still on the Table
Weisberger stays bullish long-term. Hash rate is now 6x what it was in 2022. Around 10-30% of Bitcoin supply has moved from early holders with cost basis between $10 and $1,000 to newer buyers who paid more.
New institutional holders are making multi-year allocations, not leveraged bets, he noted.
His portfolio reflects that confidence: Bitcoin as his main holding, Solana and BitTensor as secondary plays, and smaller positions in Zcash and XRP.
Bitcoin fell under $73,000 as futures liquidations soared and worries over this week’s US corporate earnings triggered a stock sell-off. Will traders step in to buy “discounted” BTC?
The crypto company reported significant net losses to its balance sheet in 2025 due in part to “lower digital asset prices and approximately $160 million of one-time costs.“
Pedro Sánchez announced that Spain would implement several changes to laws impacting social media platforms starting next week, with potential criminal liability for executives.
2025 reshaped markets as trade tensions rose, yet stocks and gold surged, defying global uncertainty. 2025 has been a defining year for global markets, and cryptocurrency trading was no exception. Global trade tensions intensified as the US imposed steep tariffs…
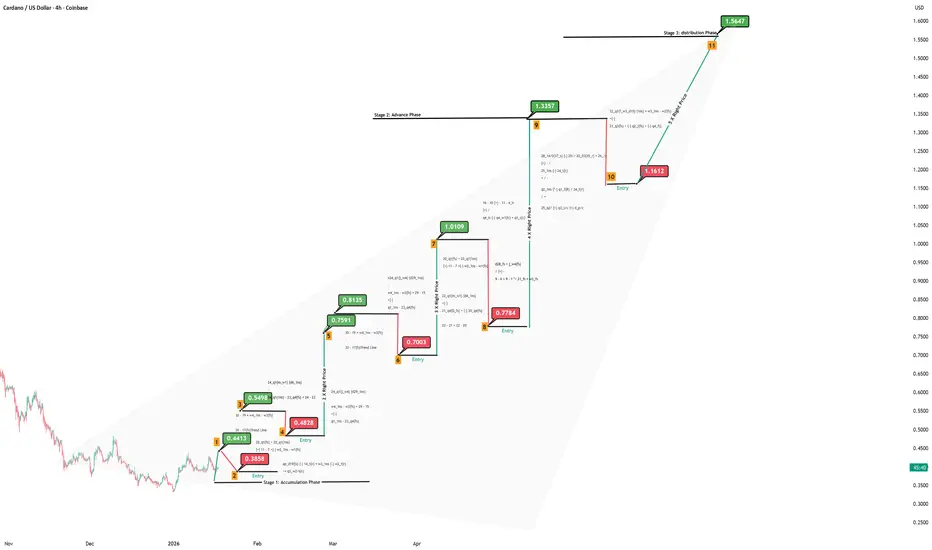
After rejecting the upper boundary of its long-standing ascending channel, Bitcoin has transitioned into a corrective phase, pulling back toward a critical support zone around $65,000.
Coinbase has taken its fight against crypto debanking to Australia’s parliament, filing a formal complaint that accuses the country’s biggest banks of shutting legitimate crypto businesses out of the financial system.
Here’s the scoop.
Big Four Banks Named in Filing
The submission, sent to the House of Representatives Standing Committee on Economics, names Commonwealth Bank, Westpac, ANZ, and National Australia Bank. Coinbase said these banks are closing accounts without warning and blocking transactions tied to digital assets.
“There is nothing that degrades trust in an economy faster than being told you cannot use your own money,” Coinbase wrote.
The exchange warned that debanking has gone from a rare problem to a “systemic feature of the Australian financial landscape.” With four banks controlling most of the country’s payment rails, losing access amounts to an “unlawful regulatory ban” on lawful businesses.
Data cited in the filing shows 60% of fintech businesses faced denial of service from banks in 2021. That problem remains unresolved.
Reforms That Never Happened
Coinbase urged lawmakers to pass five transparency measures that regulators recommended years ago. The government backed these reforms in August 2022, but they were never put into law.
The measures would require banks to explain account closures, give 30 days’ notice, and provide access to dispute resolution.
The exchange pointed to how other countries handle the issue. The EU guarantees a basic bank account for all legal residents. Canada allows account access even with a bankruptcy history. In the U.S., President Donald Trump signed an executive order last August to stop crypto-related debanking.
Australia’s $4 billion fintech sector now waits on parliamentary recommendations expected later this year. The outcome could determine whether crypto innovation stays or moves elsewhere.
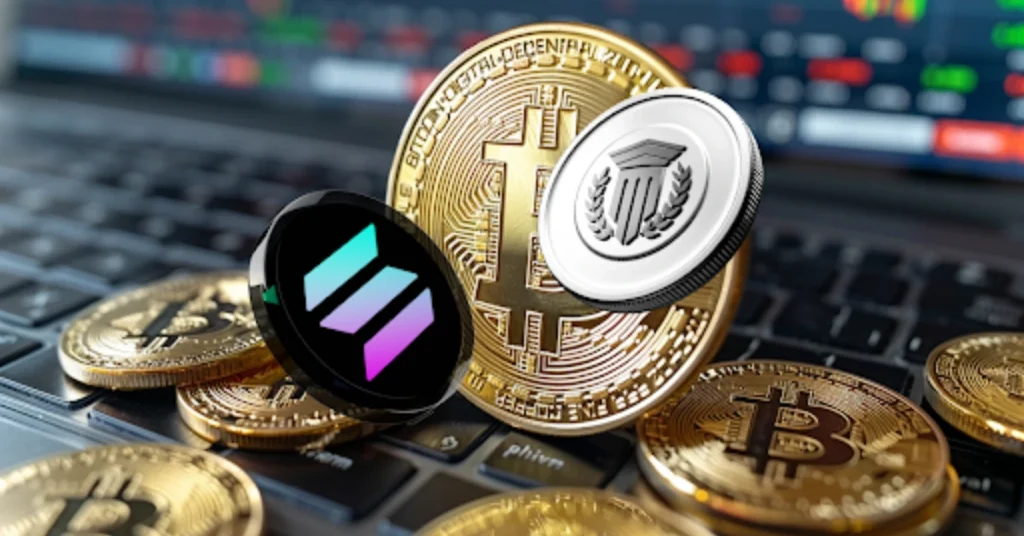
Recently the prices across the altcoin market remain under pressure. Yet a major institutional catalyst has emerged for the top blue chips of the industry. Moscow Exchange’s plans to launch cash-settled futures for Solana, XRP, and TRX adds regulated exposure at a time of heightened volatility, reshaping how these assets are viewed within long-term market frameworks.
MOEX Expands Crypto Derivatives Beyond Bitcoin and Ethereum
Moscow Exchange (MOEX) is preparing to broaden its regulated crypto derivatives lineup by introducing cash-settled futures linked to Solana, XRP, and TRX. The move extends the exchange’s existing Bitcoin and Ethereum offerings and aligns with its strategy to deepen institutional access to digital asset exposure in Russia.
Russia's Moscow Exchange announces plans to launch cryptocurrency indices for Solana, Ripple, $XRP and Tron by the end of 2026, signaling further crypto market integration in the country. pic.twitter.com/afvbVYhSjv
Initially, MOEX plans to launch indices tracking these altcoins, which will then serve as the underlying benchmarks for futures contracts. At the same time, settlement will be conducted entirely in Russian rubles, removing any need for physical cryptocurrency delivery and simplifying compliance requirements.
Regulatory Guardrails Shape Market Structure
Access to the new futures contracts will be restricted to qualified investors under Russian law. Meanwhile, contract specifications are expected to mirror MOEX’s existing crypto products, with monthly expiries and standardized risk controls.
JUST IN: Russia to roll out crypto regulatory framework this July, allowing retail participation. pic.twitter.com/rSGoesFBzK
This structure reflects a broader regulatory direction. The Russian government is working toward a comprehensive digital asset framework expected by July 1, 2026, positioning regulated derivatives as a controlled gateway for institutional participation rather than direct spot market exposure.
Institutional Credibility Versus Short-Term Market Stress
From a market context perspective, the announcement arrives during a sharp correction across the altcoin sector. While, prices for Solana, XRP, and TRX have all been influenced by broader risk-off sentiment rather than asset-specific fundamentals.
Still, promises for derivatives listings on national exchanges is a longterm. This broadly signal a shift in how assets are classified. Rather than speculative instruments, they begin to function as monitored financial products within formal trading ecosystems. That said, futures markets also introduce leverage and hedging dynamics, which can amplify volatility in the short term.
Sentiment Reset and Long-Horizon Positioning
At the same time, the current drawdown appears more consistent with a cooling phase than a structural breakdown. Market participation has thinned, forced liquidations have slowed after the event, and volatility is gradually normalizing.
Breaking developments such as MOEX’s futures expansion may not immediately reverse price trends. However, they do open the possibility of renewed interest once bearish pressure fades, particularly among long-term investors assessing regulated exposure and liquidity pathways rather than short-term price action.
How Futures Listings Could Influence Market Behavior
From an analytical perspective, regulated futures introduce price discovery mechanisms that operate independently of spot markets. For Solana, XRP, and TRX, this may gradually influence how capital flows react during future market cycles.
While price recovery is never guaranteed, the introduction of these contracts places the trio within a more formal derivatives framework. The presence of MOEX futures suggests that Solana, XRP, and TRX are increasingly treated as enduring components of the crypto market rather than transient narratives, reinforcing their standing within long-term structural discussions.
The crypto market is under pressure again, with prices sliding sharply during the latest trading session.
Total crypto market value has dropped 3.24% to $2.57 trillion, wiping out nearly $50 billion in a matter of hours. The selloff accelerated after the U.S. market opened, when Bitcoin suddenly fell by around $1,700.
Liquidations Add Fuel to the Drop
The sharp move triggered heavy liquidations.
Over $55 million in long positions were liquidated in just two hours
Traders betting on higher prices were forced out, pushing prices even lower
This happened despite positive news around the U.S. government shutdown, showing that market sentiment remains fragile.
Bitcoin and Ethereum Lead the Decline
Bitcoin fell more than 4% in 24 hours, trading near $75,700
Ethereum dropped over 6%, falling to around $2,220
Major altcoins like XRP, Solana, and Cardano also moved lower
Fear remains high, with the Crypto Fear & Greed Index stuck at 17, deep in “extreme fear” territory.
ETF Outflows and Weak Confidence
One key pressure point has been continued selling from institutional products.
U.S. spot Bitcoin ETFs have seen about $2.8 billion in outflows over the past two weeks
This steady selling has drained confidence and reduced buying support
Oversold conditions and low liquidity made the market vulnerable to sudden drops.
Ethereum at a Turning Point
Ethereum has broken below an important support level, adding to the bearish mood.
Short-term price trends remain weak
Longer-term trends are still pointing higher
Investors are now watching for a strong support zone to hold before any recovery can begin
Analysts say that Ethereum could still outperform Bitcoin later in the cycle, but only if broader market conditions stabilise.
A Sharp Contrast: Gold and Silver Surge
While crypto struggled, traditional safe-haven assets surged.
Gold is up 11% from its recent low, adding more than $3 trillion in value
Silver has jumped nearly 20%, adding around $800 billion
Together, nearly $4 trillion flowed back into precious metals in just 30 hours, a possible sign that investors are seeking safety.
What Should Investors Watch Next?
The next major catalyst will be the upcoming U.S. Federal Reserve meeting, which could set the tone for global markets.
Looking ahead, some research firms have warned that if selling pressure continues and no new catalysts emerge, Bitcoin could slide further and could even hit $58000, with long-term support levels coming into focus.
Crypto.com is spinning off its prediction market business into a standalone platform called OG, and it’s launching just days before the Super Bowl.
The platform will offer CFTC-regulated sports event contracts along with markets covering financial, political, cultural, and entertainment events. OG will also be the first prediction market platform to offer margin trading on prediction contracts.
The first one million users to sign up will receive up to $500 in rewards.
Why a Standalone Platform Now?
The numbers tell the story. Crypto.com has seen 40x weekly growth in its prediction market business over the past six months. That kind of traction demanded its own home.
“Crypto.com successfully built one of the largest brands and best app experiences in cryptocurrency during a period of hypergrowth amid a complex regulatory landscape, and now we will work to replicate this experience with OG in the prediction market space,” said Kris Marszalek, Co-Founder and CEO of Crypto.com.
OG is powered by Crypto.com | Derivatives North America (CDNA), the same CFTC-registered exchange and clearinghouse that launched the nation’s first federally licensed sports prediction contracts back in December 2024.
Nick Lundgren Named OG CEO
Nick Lundgren will lead OG as CEO. He currently serves as Crypto.com’s Chief Legal Officer and was the one who led the CDNA acquisition in 2022, then the largest acquisition in crypto history.
“Sports are the natural hub of prediction markets, and we see a massive opportunity to provide fans with an all-encompassing platform where it pays to be right,” Lundgren said. He called prediction markets a “deca-billion dollar industry.”
VIP Program Taps Major Sports Partnerships
OG will roll out a VIP program tied to Crypto.com’s existing sports deals. That includes access to experiences through Crypto.com Arena, UFC, Formula 1, and UEFA Champions League.
The launch lands at an interesting time. The CFTC said last week it would craft new rules for the prediction market industry. OG will be headquartered in the US and focused on that market first.
Ethereum founder Vitalik Buterin said the blockchain’s long-standing approach to scaling through layer-2 networks needs a rethink, as Ethereum’s core network grows faster than expected and many secondary chains struggle to meet earlier goals.
In a detailed post, Buterin said two developments have weakened the original case for treating layer-2 networks, or L2s, as extensions of Ethereum itself.
First, progress by L2s toward full decentralisation and security has been “far slower and more difficult” than expected. Second, Ethereum’s main network is now scaling directly, with transaction fees falling sharply and major increases in capacity planned from 2026 onward.
Together, those shifts mean the original vision for L2s “no longer makes sense,” Buterin said, calling for a new framework to define their role in the ecosystem.
From ‘Ethereum Shards’ to Independent Chains
Ethereum’s original roadmap imagined L2s as “branded shards” — tightly integrated networks that would inherit Ethereum’s security and censorship resistance while dramatically increasing transaction capacity.
But that vision has not materialised.
Some L2 developers have openly said they may never move beyond partial decentralisation, citing technical limits or regulatory demands that require retaining control. While that approach may suit certain users, Buterin said it does not align with the goal of scaling Ethereum itself.
“If you are doing this, then you are not scaling Ethereum in the sense originally intended,” he wrote.
Crucially, Buterin argued this is no longer a problem. Ethereum’s base layer is now expanding on its own, reducing reliance on L2s to deliver growth.
Ethereum’s Base Layer Gains Momentum
Rising capacity on the main network, combined with low fees, has weakened the argument that L2s must serve as near-identical replicas of Ethereum. Instead, Buterin said, L2s should be viewed as a broad spectrum — ranging from chains deeply secured by Ethereum to more independent systems with looser connections.
Users, he added, should decide how much trust or integration they require, rather than assuming all L2s offer the same guarantees.
What L2 Developers Should Focus On Now
Buterin urged L2 projects to define their value beyond simple scaling.
Possible directions include specialised features such as privacy tools, ultra-fast transaction processing, non-financial applications like identity or social platforms, and systems designed for workloads that even an expanded Ethereum mainnet cannot efficiently handle.
For L2s that rely on Ethereum-issued assets like ether, Buterin said a minimum level of security integration remains essential. Beyond that, flexibility — not uniformity — should be the goal.
A Push for Stronger Native Integration
On Ethereum’s side, Buterin said he has grown more confident in a proposal known as a “native rollup precompile” — a built-in feature that would allow Ethereum itself to verify advanced cryptographic proofs used by L2s.
Such a tool, he said, would reduce reliance on external security committees, improve trustless interoperability, and make it easier for L2s to build safely while adding unique features.
If flaws emerge, Ethereum would take responsibility for fixing them through network upgrades, bringing trust in the system.
Clear Guarantees, Not Perfect Uniformity
Buterin acknowledged that a more open approach will inevitably lead to some L2s being less secure or more centralised than others. That, he said, is unavoidable in a permissionless ecosystem.
“Our job,” Buterin wrote, “should be to build the strongest Ethereum that we can.”
Hashbitcoin leads 2026 cloud mining, letting beginners earn Bitcoin safely with AI-powered optimization. In 2026, cloud mining has become the easiest way for beginners to earn Bitcoin without purchasing expensive equipment. With growing electricity costs and complex mining setups, owning…
Hyperliquid price has rallied sharply from the $22 swing low, breaking bearish structure and reclaiming key levels, putting a potential macro bottom in focus if demand and volume continue to build.
OG launches a new prediction market, letting users trade, compete, and climb the leaderboard. OG, a new prediction market experience, today announced its official launch, introducing a new way for consumers to trade, engage with others, and climb the leaderboard.…
The crypto market held steady on Tuesday as investors bought the dip and as risky assets like stocks continued their recent rally. Bitcoin (BTC) price rose to $78,330, up by 5% from its lowest level this month. Other top altcoins…
Flare launches first modular lending markets for XRP via Morpho, enabling permissionless FXRP lending. Flare today announced the launch of the first modular lending markets for XRP on the network through an integration with Morpho, a modular lending protocol with…
Chainlink price has accelerated into a major historical support zone at $9.65 after losing key value levels, placing the market at a critical inflection point where a relief bounce may develop if demand returns.
Remittix draws attention as investors target potential 300% gains, driven by rising demand and real-world utility. Talk about 300% gains rarely stays quiet in the crypto market, yet this week all eyes are on Remittix as investors anticipate exactly that.…
XRP is showing tentative signs of stabilization after one of its sharpest pullbacks in recent months, even as broader crypto markets remain under pressure. For investors and experts, the focus is now shifting from panic-driven selling to whether prices are beginning to form a durable base.
How Far XRP Has Fallen
From its recent cycle high, XRP has declined by roughly 54%, a magnitude of correction that has historically preceded periods of consolidation or recovery rather than prolonged declines.
According to an expert, during the latest market-wide selloff, XRP briefly dipped toward recent lows but avoided setting a new breakdown point. Instead, prices rebounded quickly, suggesting that buyers are stepping in earlier than before.
This matters because in previous XRP cycles, declines in the 50–55% range have often marked exhaustion of selling pressure.
A Difference This Time: Higher Lows
While Bitcoin and Ethereum both pushed to new short-term lows during the latest drop, XRP did not.
XRP held above its prior low
This formed a higher low, a classic sign that downside momentum may be weakening
Buying interest appeared faster and more consistent on the rebound
For investors, this relative strength is important. It could mean that XRP is being accumulated at current levels rather than aggressively sold into weakness.
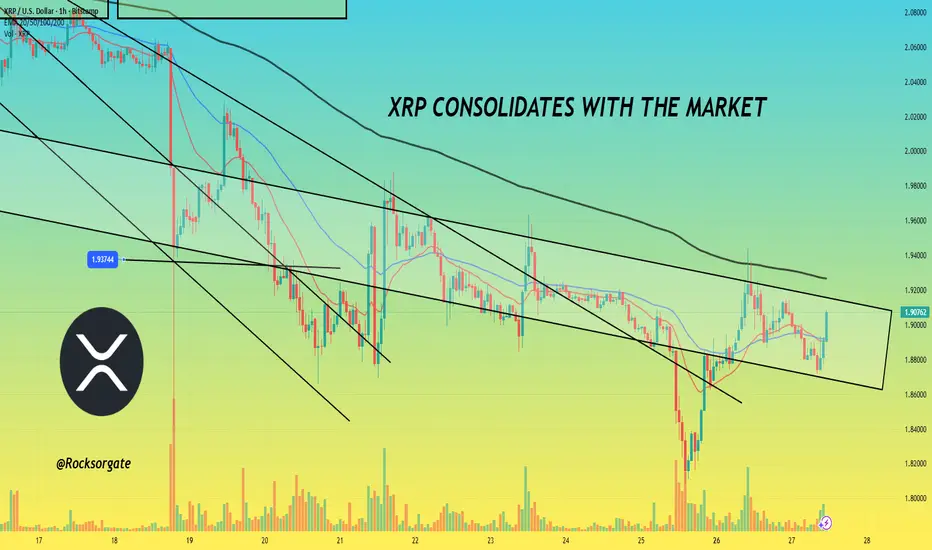
Short-Term Price Levels Investors Are Watching
XRP is now trading in a narrow recovery range, with several levels drawing attention:
Immediate support: The recent rebound zone where buyers stepped in aggressively
Near-term resistance: Around the $1.80 area, which previously acted as a floor before the selloff
Upside target if reclaimed: A sustained move above $1.80 could open the door toward $2.20–$2.30, where selling pressure last increased
A decisive break and hold above $1.80 would be an important signal that confidence is returning.
Bitcoin’s Role Remains Critical
Bitcoin is still hovering near a major support zone after its deepest pullback of the cycle. As long as Bitcoin holds these levels, XRP’s downside risk appears limited. A renewed breakdown in Bitcoin, however, would likely drag the entire market lower, regardless of individual strength.
In short: XRP can outperform, but it cannot fully decouple.
Broader Conditions Are Turning Less Hostile
Macro conditions are becoming less restrictive compared with recent months.
US economic data is pointing to renewed expansion
Expectations are growing for interest rate cuts later this year
Global trade tensions appear to be easing at the margin
After a brief recovery yesterday, the crypto market has turned red again.
On Monday, prices moved higher after comments from US President Donald Trump, who said he supports crypto and believes the US must lead in digital assets or risk falling behind China. That statement helped lift market sentiment for a few hours.
But the bounce did not last.
Crypto Market Slips Back Into the Red
At the time of writing, the total crypto market value has fallen 3.95% in the last 24 hours, dropping to $2.62 trillion.
Market sentiment remains weak
The Fear & Greed Index is at 17, showing extreme fear
Most major coins are still down sharply over the past week
Bitcoin, Ethereum and XRP are all trading lower again, along with most large altcoins.
Bitcoin Is Driving the Decline
Bitcoin continues to lead the market lower.
Bitcoin dominance is near 59%
This means the entire market is closely following Bitcoin’s price moves
When Bitcoin weakens, most other coins fall with it
Bitcoin is down more than 11% over the past seven days, keeping pressure on the broader market. Over $55 million worth of long positions were wiped out in just two hours as prices suddenly dropped.
The selloff came despite positive news around the U.S. government shutdown. BTC is currently down by more than 4%.
Ethereum Is Making Things Worse
Ethereum has fallen even harder than Bitcoin.
Ethereum is down more than 22% in the last week
This sharp drop has hurt confidence across the altcoin market
Many traders remain bearish, with little buying interest visible
Because Ethereum has such a large market value, its decline has added to the overall market losses.
Market Is Ignoring Stocks and Gold
Crypto is currently moving on its own, not in line with traditional markets.
Correlation with the S&P 500 is low
Correlation with gold is negative
This shows crypto is being driven mainly by internal fear and selling pressure
What Happens Next?
The market is at a critical level.
Holding above $2.59 trillion in total market value is important
A break below this level could lead to another sharp drop
Traders are watching US Federal Reserve signals and ETF fund flows for direction
Despite supportive comments from political leaders, crypto prices are falling again due to:
Continued Bitcoin weakness
Heavy losses in Ethereum
Extreme fear among investors
Lack of strong buying demand
Until Bitcoin stabilizes and sentiment improves, the market is likely to remain volatile.
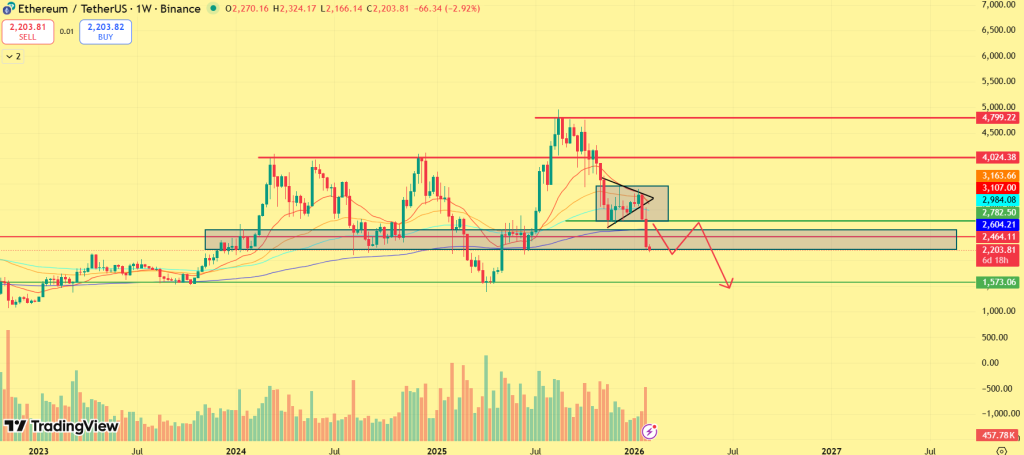
The rejection of $3000 has pushed the Ethereum (ETH) price into a strong bearish trajectory. The price is failing to secure an important range of around $2300, which has become a major resistance to break. Meanwhile, the bulls have been defending the pivotal support at $2,150, keeping the bullish possibilities alive. This may point towards an upcoming trend reversal, but a popular analyst, Ali, suggests the bottom has not been reached yet.
Large Holders Remain in Disbelief
The big players seem to be not confident in the current price rebound, as they have been distributing instead of accumulating. The data from Glassnode shows that the Ethereum whales have been steadily reducing their holdings, possibly relocating them to other tokens.
The declining bars are the number of wallets holding more than 10,000, which has declined from 1,262 to 1,120. This validates the claim of a possible supply rotation, as they are not aggressively adding or holding at current levels. This points towards a weakening of upside momentum as buying pressure fades off. This may not follow a sudden crash but rather keep the price consolidated within a tight range.
Ethereum is Yet to Reach the Bottom
A better way to determine whether the ETH price is undervalued or overvalued is to analyse the MVRV values. The chart below shows the Ethereum MVRV ratio and how it behaves at the extreme levels over time. Historically, when ETH’s MVRV moves into the red zone above ~3.2, it has marked overheated conditions and major tops, where profit-taking tends to kick in. On the flip side, when MVRV drops toward the green zone around 0.8–1.0, it has often lined up with cycle bottoms, signaling that ETH is undervalued and long-term accumulation starts.
Right now, MVRV is sitting closer to the lower band, not in extreme greed territory. Historically, the Ethereum price bottoms when the MVRV ratio drops below 0.8. Currently, the ratio sits at 0.96, which suggests the typical bottom conditions haven’t fully formed yet.
ETH Price May Plunge Below $2000
The second-largest token has been facing strong upward pressure over the past few days; still, the support at $2000 was held tight. However, the data revealed by the MVRV pricing bands suggests the ETH price may find its bottom below $2000. MVRV pricing bands are used to map out where ETH tends to be undervalued, fairly valued, or overheated based on on-chain data rather than pure price action.
Historically, when ETH trades near the lower blue/green bands (0.8–1.0 MVRV), it has marked strong accumulation zones and cycle lows. On the other hand, moves towards the yellow and red bands (2.4–3.2 MVRV) have aligned with market tops, where price becomes stretched and profit-taking increases. Right now, ETH is trading above the lower bands but well below the red zone, suggesting it’s no longer deeply undervalued, yet still far from euphoric territory. They hint that Ethereum has room to explore lower levels, and based on this model, a cycle bottom could form below $1,959.
Wrapping it Up
Ethereum has long been viewed as one of the more stable assets in the crypto market, yet even the strongest ETH bulls are now deep in the red. BitMine, led by Tom Lee, is currently sitting on an estimated loss of nearly $6.8 billion. Meanwhile, prominent crypto whale Garrett Jin has faced losses of around $770 million, including a $195 million ETH long liquidation. In another major hit, Jack Yi, founder of Capital Inc., has reportedly lost close to $680 million.
These losses reflect the broader market environment, where sentiment remains firmly fearful amid extreme volatility across major cryptocurrencies, including Bitcoin and Ethereum. At the same time, buying pressure remains negligible, keeping the probability of a near-term reversal low. Given the current structure, traders may prefer to stay cautious until market conditions stabilize and bulls show clear intent. A sustained move above $3,500 would be required to confirm that ETH is breaking out of bearish influence and regaining upside momentum. Until then, downside risk remains firmly in play.
Crypto use in Iran is rising as the country faces ongoing U.S. sanctions and a sharp decline in the value of its currency, pushing more people to look for alternative ways for ROI. According to researchers, many users have been moving toward crypto away from local exchanges during recent periods of economic instability. At the same time, the U.S. Treasury is reviewing whether some crypto platforms may be helping users bypass sanctions, following analysis by TRM Labs.
Iran’s $8–10 billion Volume Attracts US Probe
U.S. authorities are looking into whether some cryptocurrency platforms have been used by Iranian officials to get around international sanctions. The review comes as the use of crypto has grown quickly in Iran.
Researchers estimate that crypto transactions in the country reached between $8 billion and $10 billion last year, driven by increased activity from both state-affiliated entities and everyday investors, based on data from TRM Labs and Chainalysis.
Tom Keatinge, director of the Centre for Finance and Security at UK think-tank the Royal United Services Institute, said, “The harder one squeezes the Iranian economy, the more one better be ready to deal with the consequences, one of which is the expanding use of crypto.”
Activity on cryptocurrency networks linked to Iran remained high last year, with TRM Labs estimating roughly $10 billion in transactions, slightly below the $11.4 billion recorded in 2024. Data from Chainalysis shows inflows to Iranian-linked wallets continued to rise, reaching a record $7.8 billion in 2025, compared with $7.4 billion in 2024 and $3.17 billion in 2023.
As crypto use expands, the U.S. Treasury is assessing whether some digital-asset platforms may have helped state-connected actors evade sanctions. Ari Redbord, global head of policy at TRM Labs, said the review is focused on potential efforts to move funds overseas, gain access to hard currency or purchase goods despite restrictions.
US Keeps a Close Watch on Iran
Last week, two UK-based crypto exchanges were sanctioned by the U.S. after authorities said they processed funds linked to the Islamic Revolutionary Guard Corps, according to the Office of Foreign Assets Control. The U.S. also targeted Iranian financier Babak Morteza Zanjani over alleged support for IRGC-linked activities.
Researchers say it is extremely difficult to measure how cryptocurrencies are used in Iran, and estimates differ widely on how much activity is linked to the state versus ordinary users. Data from Chainalysis suggests that about half of last year’s crypto transactions were connected to the Islamic Revolutionary Guard Corps, a group with major political and economic influence in the country and close ties to Supreme Leader Ayatollah Ali Khamenei.
Other researchers highlight a very different picture. TRM Labs estimates that most Iran-related crypto flows come from retail investors, although it has still identified thousands of wallet addresses linked to the IRGC and says those accounts have handled around $3 billion in digital assets since 2023.
Canton network price today is trading near $0.189 as fresh institutional infrastructure developments reshape its market context. The catalyst comes from Fireblocks’ integration with the Canton Network, a move that strengthens regulated settlement access while drawing attention to CC/USD at a critical technical juncture.
Meanwhile, Fireblocks, which is known and trusted by more than 2,400 enterprises and securing over $5 trillion in annual digital asset transfers has announced a new integration with the Canton Network. The move expands Fireblocks’ regulated infrastructure offerings for tokenization, settlement, and institutional digital asset flows.
Financial institutions can custody Canton Coin and build on Canton's privacy-enabled infrastructure with the same security and policy controls they use across our platform.
At the same time, the integration introduces custody and operational support for Canton Coin (CC) directly within Fireblocks’ platform. This gives financial institutions a governed and privacy-enabled environment to begin settling assets on Canton using Fireblocks’ enterprise-grade policy controls and workflow automation.
Interest from traditional financial institutions has already been accelerating Canton’s momentum. The network is increasingly being viewed as a preferred infrastructure layer for regulated tokenization, including tokenized securities, deposits, and settlement workflows. That shift places Canton network crypto closer to institutional deployment rather than speculative experimentation.
Regulated Custody Strengthens Market Confidence
That said, custody for Canton Coin will be provided through Fireblocks Trust Company, a qualified custodian chartered by the New York State Department of Financial Services (NYDFS). This structure provides a regulatory-compliant custody framework designed to meet fiduciary and risk management standards expected by large financial firms.
Still, the update also leverages Fireblocks’ MPC security architecture and governance controls. Institutions operating on Canton now gain protections suited for institutional-scale adoption, including key management safeguards and operational oversight. These features are increasingly seen as prerequisites for regulated digital finance participation.
From a market perspective, such developments often influence how participants assess network credibility, even when broader crypto conditions remain uncertain.
Canton Network Price Chart Shows Improving Structure
From a technical perspective, the Canton network price chart suggests that CC/USD has been trending upward from a key support zone. On the daily timeframe, $0.177 has established itself as immediate support after the price flipped the $0.160 level.
Price structure aligns with both an ascending parallel wedge and a developing cup-and-handle formation. The current rally remains contained within the ascending channel, suggesting controlled momentum rather than volatility-driven expansion.
If price continues to respect this structure, the upper boundary of the wedge near $0.220 becomes a level of interest. That zone may act as resistance and could invite a pullback toward the lower channel boundary near $0.140, which would still preserve a constructive longer-term setup. However, a sustained move beyond $0.220 would open the possibility of a broader reassessment in the Canton network price forecast.
Derivatives and Sentiment Data Add Context
Additionally, derivatives data shows total open interest for CC/USD reaching an all-time high of $37.61 million. This indicates increasing participation, even as price action remains technically structured.
Social volume has also been building into Q1 2026, pointing to rising discussion around Canton network crypto. Weighted sentiment metrics suggest that commentary has skewed more positive than negative, reinforcing engagement without signaling speculative crowd behavior.
Taken together, these metrics suggest that the Canton network price is increasingly reflecting infrastructure-driven interest rather than short-term momentum trading, and that the price may tilt on the higher side for a longer span.
Bitcoin extended its sharp weekly decline after more than $1.5 billion in leveraged long positions were liquidated, triggering a liquidity squeeze that pushed prices down over 13% and dragged institutional flows, market participation, and media attention lower across the crypto…
PayPal stock price tanked by nearly 20% on Tuesday, becoming one of the top laggards on Wall Street, after publishing weak financial results and a leadership change.
The rollout provides access to tokenized US stocks, ETFs and commodities through Ondo GM tokens for non-US users on Ethereum, excluding 30 jurisdictions at launch.
Rails is betting that Stellar‑based smart contract vaults, onchain proofs and segregated collateral can make high‑speed perpetuals more palatable to institutions.
The Spanish Red Cross is rolling out RedChain, a privacy-preserving blockchain aid system that gives donors cryptographic proof of impact without exposing beneficiary identities.
Permissioned blockchains and centralized layer 2s rebuild intermediaries for tokenized assets. Based rollups inherit Ethereum security while enabling compliance.
Crypto cards promise everyday spending, but stablecoins are the infrastructure quietly making them practical at scale. Crypto cards are often framed as the bridge between web3 and everyday spending. They promise a simple idea: use crypto anywhere people would use…
Galaxy Digital stock price remains in a technical bear market after plunging by nearly 50% from its highest level in 2025, and a risky chart pattern points to more downside as its losses rise amid the crypto market crash.
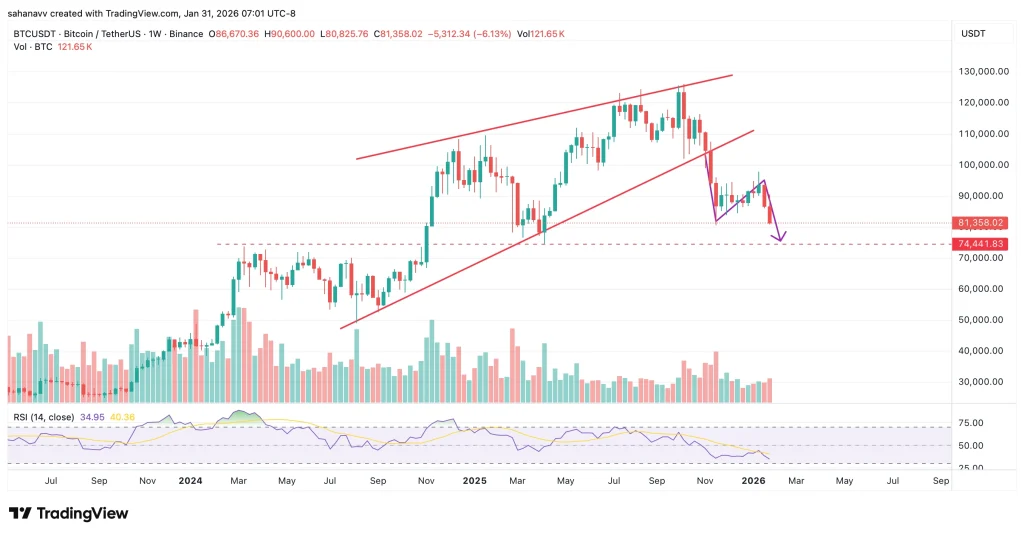
Despite the recent bounce, Bitcoin (BTC) price action continues to show clear signs of pressure as the correction stretches into its fifth straight month. Every recovery attempt has faced strong supply, with rallies repeatedly stalling below key resistance zones. This behavior points to ongoing distribution rather than a healthy consolidation phase. While buyers are stepping in near the lows, their lack of follow-through has allowed sellers to retain control of the broader trend.
As a result, BTC remains stuck in a corrective structure unless it can reclaim the critical $80,000 resistance with conviction. Until then, the market faces a near-term turning point. Traders are now watching closely to see whether Bitcoin can push above $80,000 this week—or if failure to do so leads to a breakdown below the $77,500 support zone.
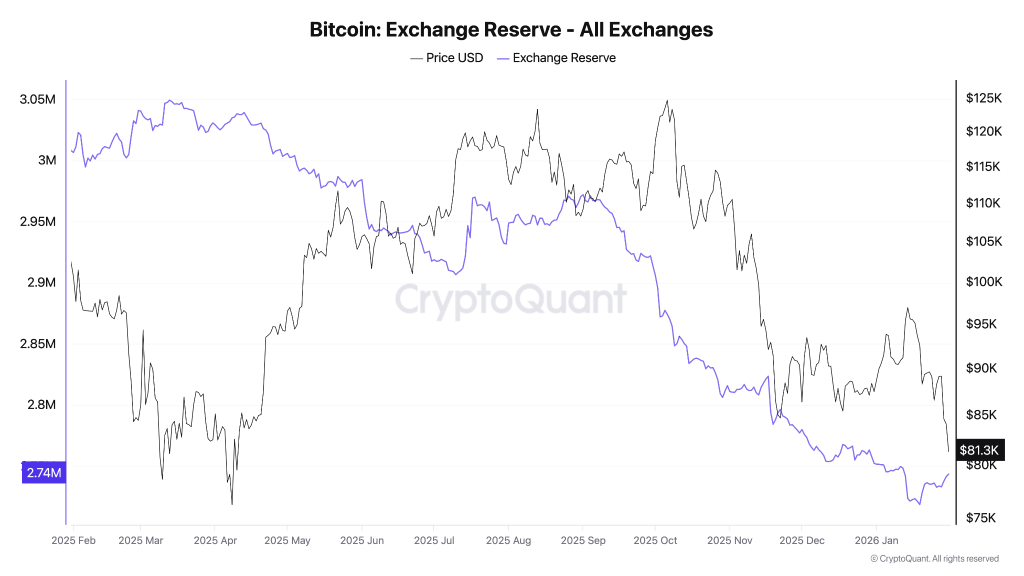
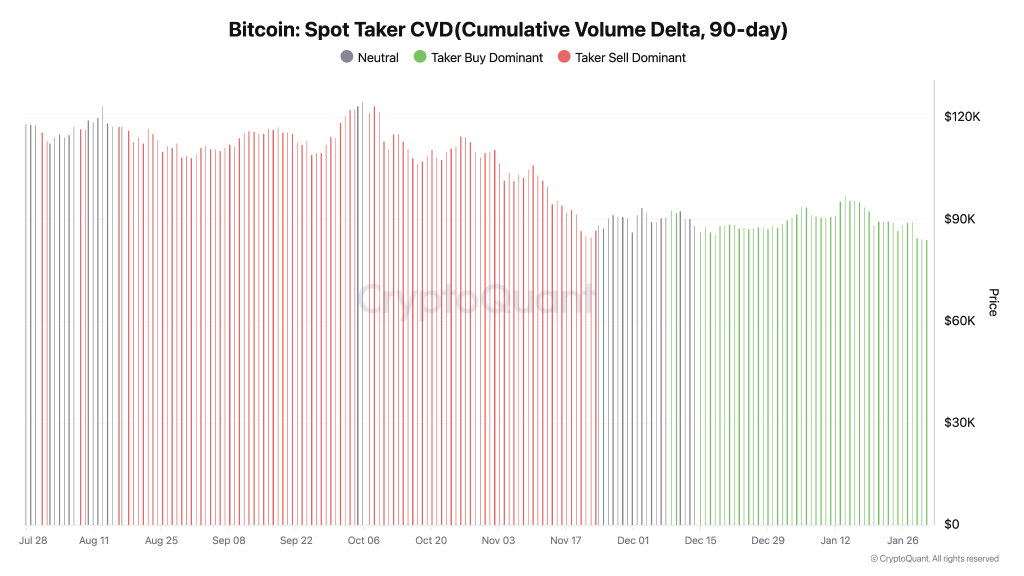
Bitcoin Spot Trading Volume Dries Up
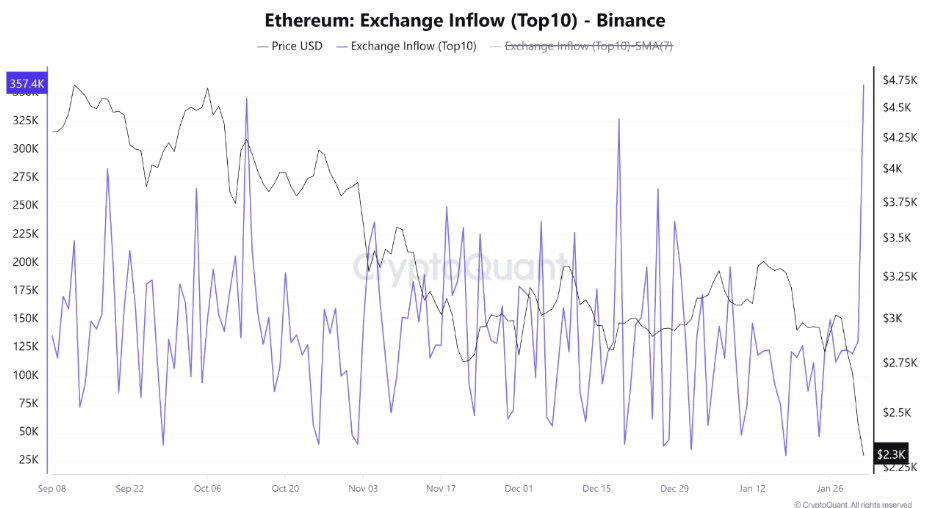
Bitcoin’s spot demand drying up is a subtle but meaningful signal—and CryptoQuant’s exchange data makes this clear. When spot volumes fall, it means real buyers are stepping back even if the price hasn’t yet cracked key levels. Historically, strong rallies in BTC have been backed by expanding spot demand on exchanges; without it, upside attempts tend to lack follow-through, and the price becomes more sensitive to headline moves or liquidations.
The CryptoQuant data shows key cycle moments: after the 2019 peak near $14K, spot demand faded, and price entered a prolonged consolidation and pullback; in late 2021, spot volumes dropped sharply after the all-time high, signaling distribution before the broader downtrend; and again in mid-2023, muted spot activity coincided with choppy range-bound price action before volatility picked back up.
As seen in these historical snapshots, drying spot demand on CryptoQuant typically aligns with consolidation, shaky breakouts, or increased volatility rather than sustained trend extensions.
Bitcoin (BTC) Price Sits on the Edge
The BTC price has been largely volatile since the last few days of January, which appears to have restricted the rally below the key resistance zone. The buyers and sellers are actively contributing, and as a result, volume remains elevated with no major impact on the price. The strength of the rally has been decaying since the start of the month, keeping the rally capped below an important resistance zone between $78,900 and $79,235.
As reflected on the chart, there has been a clear lack of aggressive buying interest from market participants. Since facing rejection near the $126,219 highs, price action has consistently printed lower highs and lower lows, reinforcing the ongoing bearish structure. This sustained absence of demand supports the view that spot buying interest has largely dried up over the past five months. Meanwhile, the RSI has slipped into oversold territory and is attempting a rebound, hinting at short-term relief potential rather than a confirmed trend reversal.
As a result, the Bitcoin (BTC) price is likely to remain range-bound below the $80,000 mark unless a clear surge in buying pressure pushes the price back above this bearish zone. Until then, any upside moves are expected to face strong selling pressure, keeping the broader corrective phase intact.
Arbitrum DAO has confirmed that its official X account has been compromised. The team warned users not to click on or interact with any posts or links from the hacked account. They are actively working to regain control. Importantly, the Arbitrum protocol and user funds remain completely safe, as the breach only affects the social media account. Users are advised to stay cautious and ignore any suspicious messages until the account is fully recovered.
Early-stage crypto interest is rising as Remittix gains traction with real-world PayFi utility and growing adoption. The cryptocurrency market is abuzz with renewed interest in early-stage tokens. There is a growing need to invest in projects that offer real-world utility,…
Despite a brief lift, the path ahead for Bitcoin (BTC) remains volatile, with key technical levels likely to dictate its next move in early February 2026.
Boomer investors quietly added about $500m to spot Bitcoin ETFs even as a $1.7b outflow streak, negative 2025 flows, and macro jitters keep Bitcoin pinned near $78k. Baby boomers quietly tried to catch the knife in Bitcoin (BTC) ETFs this…
Vitalik Buterin urges a hard reset of Ethereum governance, pushing a two-layer model that fuses prediction markets with anonymous, non-token voting. Vitalik Buterin thinks Ethereum (ETH) governance needs a hard reset, and he is done pretending it is complicated. In…
Hyperliquid price prediction HIP-4 expands outcome trading as HYPE trades far below its high, with rich valuations, heavy turnover, and skewed upside-downside risk. Hyperliquid (HYPE) is trying to turn “the perpification of everything” into a full‑stack derivatives and prediction‑market machine,…
Cboe is in talks to relaunch binary options contracts for retail investors, positioning regulated alternatives to compete with crypto prediction markets like Polymarket. Cboe circles binary options reboot Cboe Global Markets is edging back into the binary‑wager business, in what…
Dogecoin price jumped after a fresh comment from Elon Musk renewed interest in the meme coin. The move pushed DOGE price today to the top of the crypto market’s gainers over the past 24 hours.
The latest rally followed a playful yet powerful post from Elon Musk, where he hinted that Dogecoin could finally go to the moon next year. The comment referenced his long-standing promise from 2021 and brought fresh attention to the DOGE-1 lunar mission, a SpaceX-linked project funded entirely using Dogecoin.
DOGE-1 is planned as a lunar payload mission aimed at collecting data from the Moon, while also showcasing how cryptocurrency can be used beyond Earth. Although the mission has faced several delays and was earlier expected to launch in mid to late 2026, Musk’s latest comment reignited market hopes, at least from a sentiment point of view.
Dogecoin Price Today Outperforms Major Cryptocurrencies
Following Musk’s post, Dogecoin price surged nearly 5%, briefly reaching $0.109 before settling near $0.1068. This made DOGE the top-performing asset among the top 10 cryptocurrencies by market cap during early Tuesday trading.
The broader crypto market also moved higher, gaining around 2% during the same period. Bitcoin price today climbed above $78,000 but lagged behind Dogecoin, posting a smaller 2.4% rise. The gap once again highlighted how strongly DOGE reacts to sentiment, especially when Elon Musk is involved.
The renewed excitement has caught the attention of market analysts. Crypto trader Trader Tardigrade compared current market conditions to Dogecoin’s 2020 rally. According to the analyst, DOGE previously bottomed when the U.S. dollar index and gold peaked, leading investors to shift toward riskier assets like cryptocurrencies.
This comparison has strengthened the bullish outlook and added confidence to the idea that Dogecoin may be entering another upward phase.
DOGE Utility and ETF News Add Extra Support
Beyond hype, Dogecoin is also seeing progress in real-world use. House of Doge recently announced plans for a Dogecoin payment app, which will allow users to create wallets, buy DOGE, and make payments from one platform.
Meanwhile, Dogecoin ETFs are slowly gaining traction. After a quiet start, these products have recorded new inflows, pushing total net inflows close to $7 million. While still modest, this trend points to growing interest from institutional investors.
What’s Next for DOGE Price?
For now, Dogecoin’s rally remains largely driven by sentiment. Traders will be closely watching whether Musk’s comments lead to real progress or fade like previous hype-driven spikes. Until then, DOGE remains one of the most reactive cryptocurrencies, capable of strong price moves from a single social media post.
Remittix Wallet adoption is accelerating as crypto users increasingly look for products that offer real payment utility rather than short-term speculation. The Remittix Wallet launch on the Apple App Store marks a key step in this shift, placing Remittix directly into conversations around the top crypto to buy now as infrastructure-led projects gain momentum.
As wallet activity grows, attention is also turning to what comes next for the Remittix ecosystem, especially with its full PayFi platform launch now officially scheduled.
This growing focus on delivery aligns with broader demand for crypto with real utility, where live products and execution timelines matter more than narratives.
Remittix Wallet Growth Signals Demand for Real Utility
The Remittix Wallet is now live on the Apple App Store, where users can store, send, and manage their digital assets in a clean and scalable interface. This is Phase 1 of the Remittix DeFi Platform, and crypto-to-fiat is already in the pipeline.
Google Play deployment is currently underway, expanding access as the ecosystem grows.
This wallet adoption reflects rising interest in low gas fee crypto solutions that are designed for real use, not experimentation. Remittix targets everyday payments, remittances, freelancers, and global users who need reliable crypto tools connected to traditional finance.
Platform Launch Set for 9 February 2026
The Remittix team has now confirmed that the full PayFi platform will go live on 9 February 2026. This release unlocks the first complete version of the Remittix ecosystem, enabling direct crypto-to-fiat transfers into real bank accounts.
This launch marks the transition from wallet infrastructure to full payment execution.
Remittix is priced at $0.123 per token, with development funded through over $28.9 million raised from private funding, signaling demand tied to product delivery. With the wallet already live, the platform launch completes the core utility layer that the project has been building toward.
Urgency Builds as Token Availability Tightens
Interest around Remittix is increasing as availability narrows. Over 701.8 million of the 750 million total tokens have already been sold, placing distribution above 93%. This leaves a shrinking window for users positioning ahead of the platform launch.
Market participants are increasingly referencing Remittix as a best crypto presale 2025 alternative due to its delivery timeline and live products.
The previously offered 200% RTX 2026 bonus has fully sold out, reflecting strong community response. A 300% bonus is currently available via email, adding short-term pressure as users race to secure remaining allocations. This demand dynamic mirrors patterns seen in early-stage payment networks that later scaled globally, often compared to early XRP adoption.
Security, Listings, and Ecosystem Expansion
Remittix recently achieved full team verification by CertiK and is now ranked #1 on CertiK for pre-launch tokens, reinforcing trust and transparency ahead of launch. This milestone strengthens confidence as the project prepares to expand functionality.
Future centralized exchange listings have been revealed with BitMart and LBank, increasing planned accessibility without relying on speculative exposure.
The Remittix referral program has also been launched, allowing users to earn 15% rewards in the form of USDT, which can be redeemed daily via the Remittix dashboard. These developments show Remittix to be a well-thought-out DeFi project with a focus on payments, compliance, and usability, rather than trying to be a part of any short-term trading cycles.
Why Remittix Is Gaining Attention Now
Wallet live on App Store with Google Play rollout in progress
PayFi platform launch confirmed for 9 February 2026
Direct crypto-to-bank payments across 30+ countries
CertiK-verified team ranked #1 for pre-launch tokens
Over 93% of total token supply already sold
When Utility Meets Timing
The Remittix Wallet launch and confirmed platform release date mark a turning point for the project. With the token priced at $0.123, private funding exceeding $28.9 million, and supply nearing exhaustion, Remittix is entering a phase where execution, access, and timing intersect.
As users prepare for the PayFi rollout, the focus is shifting from early development to real-world adoption, placing Remittix among the new altcoin to watch as utility-driven crypto takes priority.
Discover the future of PayFi with Remittix by checking out their project here:
With BTC around $78K (down 11% this week), investors are rethinking their views on major cryptocurrencies. Smart money is moving towards defensive altcoins to buy, which are positioned to thrive even during downturns.
Digitap ($TAP) benefits the most from this shift, as a live omni-bank with structured crypto presale price increases. Other cryptos to buy include Solana (SOL), Polkadot (DOT), and World Liberty Financial (WLFI). These offer institutional interest and staking yields.
Digitap ($TAP): Best Safe Haven Token Of 2026
Solana (SOL): Network Utility And High Performance
World Liberty Financial (WLFI): Political Branding Momentum
Polkadot (DOT): Underrated Token With Cross-Chain Infrastructure Stability
1. Digitap ($TAP): Best Safe Haven Token Of 2026
Digitap is a comprehensive omni-bank that offers deposits, withdrawals, swaps, payments, and transfers. The platform is already live on iOS and Android, with out-of-the-box utility for users. This utility supports Visa-compatible card payments and offers cashback rewards for purchases at terminals worldwide.
A major advantage is Digitap’s token model. The platform allocates 50% of operational profits toward burning $TAP and rewarding stakers. This creates a feedback loop where growth directly benefits token holders. Unlike many early projects that rely only on token inflation, Digitap connects usage with real value creation.
Digitap has also expanded its technical reach through Solana integration. This improves transaction speed and reduces costs, making everyday payments more practical. Combined with tiered KYC onboarding that supports both casual users and regulated businesses, Digitap is positioned for global expansion and sustained adoption. Currently at $0.0467, the token will rise at each round before listing on an exchange at $0.14. This means that the price is immune to market downturns, and early investors will see their holdings rise steadily, offering psychological reassurance during bear conditions. $TAP holders can also benefit from 124% staking APY.
2. Solana (SOL): Network Utility And High Performance
Solana remains one of the most actively used blockchains in the industry. Its core strength is transaction speed and low fees, which make it attractive for payments, gaming platforms, and consumer-focused applications. At around $100, it is well priced given its technical capabilities, institutional adoption, and overall retail popularity.
From an investor standpoint, Solana benefits from deep liquidity and strong exchange coverage. This allows smoother trading during volatile conditions and helps preserve capital flexibility. Even during market pullbacks, developers continue building because of Solana’s performance and growing ecosystem.
The continued expansion of Solana-based applications also creates opportunities for integration with new platforms. This positions Solana as long-term infrastructure rather than a short-term speculation asset, reinforcing its place among leading altcoins to buy. SOL yields remain steady in the 6% to 7% range.
3. World Liberty Financial (WLFI): Political Branding Momentum
World Liberty Financial has gained attention through branding tied to political and ideological narratives, with connections to the Trump family. This strategy has helped attract a highly engaged community. Regardless of ideological preferences, connections with the current US president could have positive price implications. At $0.131, it could be a value purchase.
There is considerable speculation that fiat currencies are going to migrate to digital currencies. WLFI could benefit from this trend should a new economic system emerge. WLFI aims to integrate traditional finance features (like stablecoin infrastructure and borrowing/lending) with decentralized governance tools,
But it carries unique structural and regulatory features that differentiate it from other purely technical tokens. For investors seeking exposure to narrative-driven assets, World Liberty Financial represents a speculative opportunity.
4. Polkadot (DOT): Underrated Token With Cross-Chain Infrastructure Stability
Polkadot continues to position itself as a foundation for blockchain interoperability. Its architecture allows multiple networks to communicate while sharing security, making it attractive for complex app development. DOT is an interesting candidate because it is one of the only top cryptos by market cap that has seen an all-time decrease in value, down 44% since listing.
However, all that matters is where the price is heading, not where it was. DOT has a lot of momentum behind it in terms of technical upgrades and project integration. It could easily be an underrated crypto play, a Layer 0 blockchain network in a world that is now dominated by Layer 1 blockchain networks. Once at $55, it now trades at $1.55, with an APY of up to 15%.
During weak market conditions, infrastructure-focused projects also often outperform purely speculative tokens. Polkadot benefits from active governance, ongoing upgrades, and long-term development funding.
Why $TAP Is The Best Crypto To Buy For 2026
For investors seeking safe havens, $TAP increasingly looks like the best crypto to buy for 2026. Structured price increases make it immune to market downturns, which is exactly what people look for in this environment. It also offers 124% APY and a working app, something which is reassuring to investors worried about product delivery.
Other altcoins to buy, such as SOL, WLFI, and DOT, are practical tokens to hold for diversification. But only Digitap offers the potential for both portfolio stability and price explosions. While the coin price increases throughout the crypto presale, it could 50x or more when it lists on an exchange, due to its potential as the world’s first omni-bank.
Digitap is Live NOW. Learn more about their project here:
Grayscale-linked entities are quietly reducing their exposure to XRP and Solana as selling pressure builds across the crypto market. Recent US SEC filings show that insiders connected to Grayscale and its parent company, Digital Currency Group (DCG), have offloaded portions of their holdings in XRP and Solana-linked investment products amid a broader market pullback.
The disclosures come as the crypto market grapples with a sharp correction, wiping out nearly $5 billion in value and triggering sustained outflows from several spot and staking-based ETFs.
Insider Sales Signal Defensive Positioning
According to Form 144 filings, Digital Currency Group sold 15,000 shares of the Grayscale Solana Staking Trust (GSOL) on February 2, with the transaction valued at roughly $115,000. The sale was executed through Canaccord Genuity and involved shares initially acquired via a private cash transaction earlier this year.
This was not an isolated move. Over the past week, DCG is reported to have sold a total of 26,000 GSOL shares, signaling a cautious stance as Solana faced mounting downside pressure.
Solana’s price reflected this shift in sentiment, falling nearly 16% over the past week and slipping below the $100 mark, a psychologically important level for traders and long-term holders alike.
Solana ETF Outflows Add to the Pressure
The GSOL product has now recorded outflows for four consecutive trading sessions, with net redemptions totaling approximately $5.5 million. While spot Solana ETFs collectively saw modest inflows on Monday, GSOL itself failed to attract fresh capital, highlighting investor hesitation toward staking-linked exposure during heightened volatility.
The contrast between spot inflows and GSOL stagnation suggests institutions are becoming more selective about risk as price momentum weakens.
A similar pattern has emerged in XRP-linked products. DCG International Investments Ltd disclosed the sale of 3,620 shares of the Grayscale XRP Trust (GXRP), worth around $115,000, also executed on February 2. The shares were originally acquired in September 2024 through a privately negotiated deal.
The move follows an even larger reduction last week, when the firm sold 15,000 GXRP shares as XRP dropped below the $1.60 level.
ETF flow data paints a bleak picture. Spot XRP ETFs recorded their largest daily outflow at nearly $93 million, with Grayscale’s XRP product accounting for the majority of redemptions. Additional withdrawals were seen from rival offerings, reinforcing the bearish institutional tone.
What This Means for the Market
While insider selling does not necessarily indicate long-term bearish conviction, the timing is notable. With ETF outflows accelerating and prices under pressure, Grayscale-linked firms appear to be de-risking amid uncertain near-term conditions. For XRP and Solana, institutional confidence may need a clear shift in market structure before meaningful recovery can begin.
Never Miss a Beat in the Crypto World!
Stay ahead with breaking news, expert analysis, and real-time updates on the latest trends in Bitcoin, altcoins, DeFi, NFTs, and more.
FAQs
Why are Grayscale-linked firms selling XRP and Solana?
They’re reducing exposure amid market volatility and ETF outflows to manage risk and protect institutional investments.
Could Grayscale’s selling of XRP and Solana influence other institutional investors?
Yes. Large moves by prominent firms like Digital Currency Group often signal caution, prompting other institutions to reassess exposure. This can amplify short-term selling pressure even without broader market news.
What could this mean for retail investors holding XRP or Solana?
Retail investors may face increased volatility as institutional rebalancing affects price swings. While it doesn’t dictate long-term trends, monitoring market structure and ETF flows can help gauge near-term risk.
What are potential next steps for XRP and Solana markets?
Markets may stabilize if buying demand returns or macro conditions improve, but prolonged institutional caution could keep volatility high. Analysts will likely watch ETF flows, price levels, and sentiment indicators closely.
Cardano (ADA) price is drawing renewed attention after rebounding from the $0.27 level, a zone last seen in October 2023. This area has historically acted as a strong demand pocket, triggering dip-buying and short-covering activity. The bounce indicates that sellers are losing momentum near these discounted levels. From a market structure perspective, ADA is attempting to stabilize above the recent lows as liquidity begins to rebuild.
If price continues to hold above the $0.27–$0.28 range and momentum improves, traders may look for speculative long setups. A higher low or range expansion could act as confirmation for a potential breakout attempt in the near term.
Cardano (ADA) Price Enters Bullish Range
Cardano price is still stuck in a clear downtrend on the daily chart, moving inside a descending channel that’s been guiding price lower since the sharp October sell-off. Every bounce has been sold into, and the latest move toward the $0.27–0.28 zone shows that bears are still in control. For now, this channel defines the trend, and ADA needs to break out of it to change the broader narrative.
Looking at indicators, RSI is sitting near 32, which shows weak momentum and hints at exhaustion, but there’s no strong reversal signal yet. CMF hovering around neutral suggests buyers are hesitant, and capital inflows remain light. As long as ADA stays below $0.34–0.36, pressure likely persists toward $0.27, with $0.24–0.25 next if support breaks. A real trend shift starts only above $0.40.
What’s Next for Cardano Price?
Cardano is likely to remain under pressure in the coming week as long as it trades below the descending channel resistance. In the short term, price may attempt a relief bounce toward $0.32–0.34, but this zone is expected to act as strong resistance. If selling pressure persists, $0.27 remains the key support to watch, with a deeper move toward $0.24–0.25 possible on a breakdown. For the monthly outlook, a trend shift only comes into play if ADA reclaims $0.36–0.40 with volume; otherwise, the structure favors consolidation to a mild downside rather than a strong recovery.
As Q2 2026 gets closer, investors are paying more attention to low-priced crypto assets with strong upside potential. While Bitcoin and Ethereum slow down, many experts believe the next big crypto opportunity may come from a token selling out under $1.
Analysts point out that undervalued projects often show clear signs before wider market interest arrives. These include growing user demand, active development, and a clear use case. When these factors align, price usually follows.
According to market watchers, one new crypto under $1 stands out as being priced far below its potential. With key updates expected in the coming months, some experts say this could be a rare early entry window before momentum builds in Q2 2026.
Presale Dynamics and Strategic Entry
Mutuum Finance is currently conducting a phased distribution for its native token, MUTM. The project has officially raised over $20.2 million, supported by a growing community of more than 19,000 individual holders. This wide distribution is a key metric for analysts, as it suggests a decentralized foundation before the token even hits public exchanges.
The pricing structure of the presale is designed to reward early participation. The journey began in early 2025 at an initial price of just $0.01. As of early February 2026, the project is in Phase 7, with the token price now at $0.04. This represents a 300% increase from its starting point.
With a confirmed official launch price of $0.06, current participants are positioned for a 50% jump before the token is expected to reach mainnet. This structured progression has allowed the project to build a massive war chest to fund its technical development and security measures.
Building a Dual Lending Architecture
Mutuum Finance is building a specialized ecosystem focused on decentralized lending. The primary goal is to allow users to access liquidity without selling their digital assets. By building a secure environment, the protocol addresses one of the most consistent needs in the crypto economy. Instead of a single model, the project uses a dual-market design to accommodate both instant liquidity seekers and those who need more flexible, custom terms for their loans.
A central part of this engine is the mtToken system. When users supply assets into the protocol, they receive mtTokens as a receipt. These tokens are yield-bearing, meaning they grow in value relative to the deposited asset as interest is paid by borrowers.
This is supported by a buy-and-distribute developing mechanism. A portion of the protocol’s revenue is used to purchase MUTM tokens on the open market, which are then redistributed to participants. This creates a cycle where platform usage directly supports token demand. To verify the safety of this system, the lending contracts have undergone a full security audit by Halborn Security, a firm known for reviewing top-tier DeFi crypto protocols.
Stablecoin Integration and Price Forecasts
The roadmap for Mutuum Finance extends beyond basic lending. The team is planning to launch a native, over-collateralized stablecoin. This asset will be backed by the interest-generating collateral within the protocol, providing a stable medium of exchange for borrowers.
To ensure that collateral valuations remain accurate, the project is integrating decentralized oracles like Chainlink. These feeds provide real-time price data, which is essential for managing the Loan-to-Value ratios and protecting the protocol from market volatility.
Because of these integrated features, experts are highly optimistic about the future valuation of MUTM. Analysts believe the token is currently undervalued given its working product and security scores.
Many market models suggest that MUTM could reach the $0.25 to $0.50 range by the end of 2026. This would represent an increase of 6x to 12x from the current presale price. As the protocol moves toward mainnet and begins capturing a share of the billion-dollar credit market, the potential for reaching the $1 mark becomes a realistic long-term target according to current analyst opinions.
V1 Protocol Momentum and Whale Participation
The biggest milestone for the project arrived recently with the V1 protocol launch on the Sepolia testnet. This is a functional version of the app where users can test the lending flows and mtToken minting. The move from a whitepaper to a working testnet has triggered an acceleration in the presale. Phase 7 is quickly selling out as investors realize that the technical risks are decreasing while the launch date approaches.
A notable trend in this phase is the increase in whale allocations. Large-scale participants have been recorded making single contributions of over $175,000. This institutional-grade interest is crucial because it signals that major players are looking to secure large positions before the public launch at $0.06.
Whale accumulation often precedes a reduction in available supply, creating a high-demand environment for when the token finally hits exchanges. With the V1 protocol proving the technology works, the final window to secure MUTM under its launch price is closing fast.
For more information about Mutuum Finance (MUTM) visit the links below:
Aster CEO Leonard has denied recent rumors that insiders engaged in token dumping or that Binance founder Changpeng “CZ” controls the project, calling such claims baseless. He emphasized that Aster operates independently with YZi Labs’ investment locked long-term and follows published tokenomics. The DeFi perpetual exchange has completed 254 million token buybacks and burned 78 million, with automated daily buybacks planned. Future plans include deeper liquidity, a privacy‑focused Layer 1 chain, staking, and slowing token emissions to support long‑term growth.
Amid an overall crypto market decline, the XRP price has fallen nearly 15% this week to the $1.53 zone. Despite the drop, veteran trader CasiTrades sees signs of a short-term recovery towards $2 as XRP tests a key technical support area known as the golden pocket.
XRP Rally Fades as Market Sentiment Turns Bearish
XRP started 2026 on a strong bullish note, rising nearly 30% to reach a high of $2.41 in the early weeks of January. This rally was mainly driven by growing regulatory clarity and optimism around new XRP ETF approvals, which attracted millions of dollars in steady inflows.
However, that positive momentum did not last long. As market excitement cooled, many investors began booking profits, leading to a broader sell-off. XRP was not spared from this shift and soon slipped back below the important $2 level.
Fast forward to today, XRP is trading near $1.60 and showing early signs of stabilization after recently falling to a low of $1.53.
Important Resistance Levels to Watch for XRP
As per Casitrade’s analysis, XRP has completed a major downside move and is now sitting in what traders call the “golden pocket” support zone.
Looking at her XRP price chart, the recent drop followed an Elliott Wave pattern, with Wave 3 ending near the $1.55 to $1.60 area. This level acted as solid support and helped stop the fall.
Now traders are watching for a possible Wave 4 relief rally. As the first key resistance level to watch is around $1.78, which matches the 0.382 Fibonacci retracement and could act as a barrier.
Further, CasiTrades explains that Wave 2, earlier in the cycle, was very shallow. In Elliott Wave theory, when Wave 2 is shallow, Wave 4 usually becomes deeper. That means XRP could push higher than many expect during this relief rally.
If buyers step in with strength, XRP could move toward $1.93 or even $2.03. The $2.03 level is especially important because it represents the macro 0.5 retracement zone.
Why $2.03 Is a Critical Level for XRP
CasiTrades analysis highlights that XRP must reclaim $2.03 and hold above it to change the current bearish structure. If the price successfully breaks and stays above this level, it would reduce the chances of another drop toward $1.55 or lower.
A strong move above $2.03 could also increase the possibility that the expected final bearish wave fails, opening the door for a larger recovery.
Never Miss a Beat in the Crypto World!
Stay ahead with breaking news, expert analysis, and real-time updates on the latest trends in Bitcoin, altcoins, DeFi, NFTs, and more.
FAQs
What will XRP be in 2026 price prediction?
XRP price predictions for 2026 range between $3.45 and $5.05, depending on ETF inflows, market sentiment, and sustained demand above key levels.
What will XRP be worth in 2030?
By 2030, XRP forecasts suggest a potential range of $17 to $26.50 if adoption grows and Ripple maintains its role in global payments.
How much will 1 XRP be worth in 2040?
Long-term projections estimate XRP could trade between $97 and $179 by 2040, assuming continued network usage and institutional integration.
Is XRP a good investment going into 2026?
XRP’s outlook for 2026 depends on ETF inflows, broader crypto sentiment, and its ability to hold key support levels above $2.
Cardano price extended higher in today’s session as traders reacted to a regulatory development that adds a new dimension to ADA’s short-term outlook. After weeks of compression and downside pressure, price action has begun to stabilize as Cardano-linked ETFs surfaced in the U.S. Rather than triggering an impulsive spike, the news coincided with controlled accumulation, hinting that the market may be repositioning rather than chasing. That subtle change sets the stage for a more consequential question: Is ADA transitioning from correction to recovery?
ETF Filing Puts Cardano Back on the Institutional Radar
The catalyst came from a filing submitted by Volatility Shares Trust, which registered Form N-1A amendments covering spot Cardano ETF exposure, alongside 2x and 3x leveraged Cardano ETFs. The products are designed to track ADA’s daily performance and remain subject to regulatory approval, but the structure itself matters. This is not an approval event, yet it signals something important. Issuers typically prepare filings only when they believe market demand and regulatory conditions are worth testing. Including both spot and leveraged variants suggests expectations of sustained liquidity and active trading interest, not just a short-lived narrative.
From a market perspective, such filings tend to work less as instant price triggers and more as sentiment resets. They introduce optionality. Investors begin pricing in the possibility of regulated exposure, which can alter medium-term positioning even before any decision is made. That backdrop helps explain why ADA’s reaction has been controlled rather than euphoric.
ADA Price Tests Key Demand Zone: Reversal Imminent?
Cardano’s price action has entered a critical phase after breaking down from its prior trading range and sliding into a well-defined demand zone. The latest rebound shows a controlled accumulation and the market is reassessing whether ADA can see a recovery in the short-term. As Cardano price reached its make or break zone near $0.300, downside follow-through has weakened, with tighter candles and reduced extension lower. This behaviour typically signals seller exhaustion rather than renewed bearish conviction.
The structure forming inside the demand zone is notable. Rather than a sharp bounce, ADA appears to be building base, hinting at a potential transition from a trending phase into consolidation. If ADA holds the demand zone, it may rotate toward the 50 day EMA area of $0.4300 followed by 200-day EMA zone of $0.500 in the near term. For now, ADA is at a crucial decision point, either confirming a structural base for a recovery attempt of failing support and extending the broader corrective trend. The next directional move will depend entirely on how price behaves around this demand zone.
FAQs
Why is the Cardano (ADA) price rising today?
ADA is moving higher after ETF filings linked to Cardano surfaced, improving sentiment and encouraging controlled accumulation near key support.
What does the Cardano ETF filing mean for ADA?
The filing signals growing institutional interest. While not approved yet, it increases the chance of regulated exposure and longer-term liquidity.
What are the key resistance levels for ADA next?
If support holds, ADA may target the 50-day EMA near $0.43, followed by the 200-day EMA around $0.50.
Is Cardano shifting from correction to recovery?
It’s possible. A sustained hold above the demand zone would support a recovery, while a breakdown would extend the broader correction.
Aave founder Stani Kulechov has acquired a five-story Victorian mansion in London’s Notting Hill for £22 million (about $30 million), one of the few high-value property deals in the city’s luxury market over the past year. The purchase, completed in November, was roughly £2 million below earlier price guidance amid a slowdown in London’s high-end housing sector caused by higher taxes and reduced incentives for foreign buyers. The mansion offers extensive panoramic views and underscores continued global interest in prime real estate.
Elon Musk’s xAI is hiring a crypto finance expert to train frontier AI trading models across DeFi, derivatives and MEV — but offers just $45–$100 per hour. xAI is quietly assembling a new kind of crypto desk — one where…
Crypto VC deals fell in January, but funding exploded as big checks flowed into BitGo, Fireblocks, Ripple’s RLUSD push, DeFi bets, and SOL‑backed credit. Headline shift: fewer deals, much bigger checks According to RootData, just 52 crypto VC investments were…
A Nevada judge has temporarily barred prediction market Polymarket from offering event contracts in the state, pushing back against claims that only the CFTC can police those markets.
Jeffrey Epstein may have made a $3.2 million investment in Coinbase in 2014 and sold some of it for $15 million in 2018, according to the latest batch of released emails.
Almost 89% of the family offices polled by JPMorgan report zero crypto exposure, with average allocations to digital assets and Bitcoin remaining well below 1%.
ING Germany now lets retail clients trade Bitcoin, Ethereum, Solana and XRP crypto ETPs via securities accounts, partnering with 21Shares, VanEck and others. ING Deutschland, one of Germany’s largest retail brokerage firms, has launched cryptocurrency exchange-traded product (ETP) trading services…
Price predictions for 2026 range from $680 to $1160.
By 2030, BCH could reach highs of $3410, driven by increased adoption and transaction activity.
With Bitcoin smashing through the $100K barrier, all eyes are now on Bitcoin Cash (BCH) as traders wonder—will BCH price follow with a banana move of its own? Beyond hype, Bitcoin Cash is proving its value in the real world. Ranked 4th on Crypwerk’s global adoption list, BCH is gaining traction for its speed, low fees, and merchant-friendly design.
If you’re searching for answers to “Will Bitcoin Cash go up further?” — you’re not alone. In this Bitcoin Cash price prediction 2026–2030, we dive into the technicals and adoption trends shaping the next big BCH Price Prediction.
Q1 2026 could initiate a rally based on the success of the multi-year descending triangle pattern. On a 1-M timeframe, BCH/USD is in a consolidation between $425 and $689. But, sustaining above $689 would signal a trend shift. However, dropping below $450 risks a quick decline, with $300 as a critical support level.
BCH Price Prediction February 2026
In January, the price of Bitcoin Cash (BCH) briefly reached $689 but was rejected back into the 50-day EMA band. Now, it’s trading around $522 key support level. February can be seen as BCH trading around two key areas: $422 support, which could be tested if $522 is lost. Another is its resistance, which can be tested at around $620 if bullish demand returns around $522.
BCH Price Prediction 2026 (Q1)
Q1 2026 is set to be the most attractive period for the rally to truly kick off, because H2 2025 onwards it has broken out of a multi-year descending triangle pattern on the monthly chart, and ever since then it has mostly consolidated in a range of $425-$689. The range is quite big on a shorter timeframe, but on a longer timeframe, like monthly, it’s an ordinary consolidation whose movements are not as big as they sound compared to its historical price action.
In Q1 2026, it continues to consolidate in its range and has hit $689 once. And now, if it sustains above it in the coming months, that will signify a “Change of Character (ChoCh)” on the monthly chart, marking a significant long-term trend shift and unlocking potential for higher targets ahead.
Also, under the worst-case scenario, if the BCH price drops below critical support at $450, we could see a swift decline. The $300 level is expected to serve as a strong line of defense against further declines; however, breaking this level would completely delay the current long-term bullish sentiment
Year
Potential Low
Potential Average
Potential High
2026 (conservative)
$300
$605
$1200
Bitcoin Cash Price Targets 2026 – 2030
Year
Potential Low ($)
Potential Average ($)
Potential High ($)
2026
595
790
985
2027
680
925
1,160
2028
795
1,135
1,475
2029
1,025
1,480
1,955
2030
1,350
2,010
2,675
This table, based on historical movements, shows BCH price to reach $2675 by 2030 based on compounding market cap each year. This table provides a framework for understanding the potential BCH price movements. Yet, the actual price will depend on a combination of market dynamics, investor behavior, and external factors influencing the cryptocurrency landscape.
BCH Price Prediction 2026
In 2026, Bitcoin Cash price could project a low price of $680, an average price of $925, and a high of $1,160.
Bitcoin Cash Price Prediction 2027
As per the Bitcoin Cash Price Prediction 2027, BCH may see a potential low price of $795. Meanwhile, the average price is predicted to be around $1,135. The potential high for BCH price in 2027 is estimated to reach $1,475.
BCH Price Analysis 2028
Looking ahead to the Bitcoin Cash Price Prediction 2028, BCH is expected to have a low price of $1,025. With an average price of $1,480, the BCH price could make a high of $1,955.
Bitcoin Cash Price Prediction 2029
Finally, by 2029, Bitcoin Cash Price Prediction anticipates a low price of $1,350, an average price of $2,010, and a high of $2,675.
Bitcoin Cash Price Forecast 2030
For the year 2030, Bitcoin Cash Price Prediction forecasts a low price of $1809, an average price of $2705, and a high of $3410.
Never Miss a Beat in the Crypto World!
Stay ahead with breaking news, expert analysis, and real-time updates on the latest trends in Bitcoin, altcoins, DeFi, NFTs, and more.
FAQs
What is BCH price prediction for 2026?
BCH price prediction for 2026 ranges from $680 to $1,160, depending on whether it confirms a long-term bullish trend shift.
How much will Bitcoin Cash be worth in 2030?
Bitcoin Cash could trade between $1,350 and $2,675 by 2030 if adoption rises and market conditions remain favorable.
What is Bitcoin Cash price prediction for 2040?
By 2040, Bitcoin Cash could see significantly higher valuations if global payments adoption expands, though forecasts remain speculative.
Can Bitcoin Cash grow beyond its current use case?
Yes, BCH could grow through wider merchant adoption, faster payments, and improved on-chain utility in real-world transactions.
Is Bitcoin Cash a good long-term investment?
BCH has long-term potential due to low fees, fast transactions, and growing merchant adoption, but price depends on broader crypto market trends.
Can Bitcoin Cash reach its all-time high again?
Revisiting previous highs is possible if BCH sees sustained adoption and a confirmed long-term trend reversal, though it’s not guaranteed.
French authorities, including the Paris prosecutor’s cybercrime unit, CyberGEND, and Europol, raided Elon Musk’s X offices in Paris over alleged cybercrimes. The probe targets offenses such as distributing child sexual abuse material, pedophilic deepfakes, grooming minors, and data mishandling. The raid follows a 2025 investigation into Grok-generated non-consensual content. Elon Musk and X CEO Linda Yaccarino were summoned for questioning in April. The action underscores growing EU pressure on X regarding AI safeguards and content moderation.
HashKey Exchange, Hong Kong’s largest regulated crypto trading platform, will launch the SUI/USD spot trading pair and open over‑the‑counter trading at 16:00 HKT on February 4, 2026. Both the spot and OTC markets will be available only to professional investors, with the OTC marketplace offering real‑time quotes from top liquidity providers. SUI token deposits and withdrawals are already live, letting investors fund accounts ahead of launch. The move expands HashKey’s compliant trading options and supports growing institutional interest in SUI.
BSV has traded under the 200-day EMA band, indicating a bearish trend.
Analysts predict a gradual price increase, with potential highs reaching $175 by 2030.
Bitcoin SV price (BSV) has been on muted growth trajectory compared to other altcoins. Since the beginning of the year, signaling prolonged bearish sentiment, Bitcoin SV (BSV) has consistently traded below its 200-day EMA band.
Despite attempts to gain traction, the asset has failed to show any long-term bullish reversal, raising doubts among investors and traders about its recovery potential.
Even it’s a non-profit organization, BSV association, optimistic activities like successful collaboration and hackathon events are not manifesting on the BSV price chart
Many ask: “Can BSV Price break bearish trend above 200-day EMA?, “Is BSV a hidden gem waiting for its breakout, or just another risky bet?”. In this Bitcoin SV price prediction 2025 article, we’ll explore the future for BSV Price from 2025 through 2030.
Bitcoin SV (BSV) shows potential for a rebound in 2026 as it approaches a critical support level within a falling wedge pattern. If it sees a reversal and surpasses the $30 resistance in that process, BSV could reach $42 and $64 by year-end, assuming improved demand. Otherwise, consolidation may continue.
BSV Price Prediction 2026: Outlook Of Fresh Year
The current price of Bitcoin SV (BSV) presents a notable opportunity for investors. Although 2025 experienced heavy challenges after 2024’s high, things seem to be changing for BSV. The price prediction for BSV in 2026 points to a more optimistic future ahead.
This optimism stems from recent chart observations that have revealed what was hidden amid the intense downtrend in the BSV/USD price. The pattern that emerged was a falling wedge, which has significantly compressed the trading range over the last two years. This compression suggests a strong potential for a positive shift in 2026, which should be considered despite the recent price fluctuations.
The projections for Q1 2026 align well with this falling wedge, which has been forming for multiple years, indicating that the trading range is approaching a critical point. Many believe that a substantial bounce could occur, offering a promising outlook for the asset.
While past price action has shown some terrific declines, Q1 is approaching the lower border of the falling wedge. From a distance, BSV/USD appears to be seeking a stable footing, and the lower boundary could answer that call. It appears to have laid a solid foundation that could benefit from better, more favorable macroeconomic conditions in the future. Signs indicate that 2026 could be a significant rally year, and investors anticipate bullish demand.
With stabilizing market conditions, there appears to be potential for considerable upward movement. The immediate resistance level to watch is $30; if this threshold is surpassed, we could see levels of $42 and $64 by the end of the year. However, if demand does not improve, consolidation might continue for an extended period.
Year
Potential Low ($)
Average Price ($)
Potential High ($)
2026
30
42
65
Bitcoin SV Onchain Analysis
The 90-day Taker CVD is negative and declining, indicating that aggressive sellers have dominated the market. This means that those hitting the bid are selling more than they buy, which likely drives the BSV price down due to excess supply.
However, the large average order sizes indicated by the green dots on the chart suggest otherwise. When these order sizes remain high while prices drop, it signals that whales or big investors are placing significant buy orders. These players are absorbing the selling pressure, allowing retail investors to sell at lower prices into their large orders.
Historically, when high-value orders continue during a price decline, it suggests the market may be nearing a liquidity bottom.
Bitcoin SV Price Forecast 2026-2030
Year
Potential Low ($)
Average Price ($)
Potential High ($)
2026
60
90
130
2027
75
95
145
2028
85
115
155
2029
95
125
165
2030
105
135
175
This table, based on historical movements, shows BSV price to reach $175 by 2030 based on compounding market cap each year. This table provides a framework for understanding the potential BSV price movements. Yet, the actual price will depend on a combination of market dynamics, investor behavior, and external factors influencing the cryptocurrency landscape.
BSV Coin Price Prediction 2026
BSV price prediction for 2026 anticipates a potential low of $60 and a high of $130, with an average price projected at $90.
Bitcoin SV Price Forecast 2027
In 2027, the BSV token price can range between $75 and $145, with an average price of approximately $95.
Bitcoin SV (BSV) Price Prediction 2028
Based on the altcoin’s price history, it can target a potential low of $85 and a potential high of $155, with an average price expected to be $115.
BSV Crypto Price Prediction 2029
Bitcoin SV price targets in 2029 are estimated to range from $95 to $165, with an average price of around $125.
Bitcoin SV (BSV) Price Prediction 2030
The potential low for Bitcoin SV in 2030 is forecasted at $105, the potential high at $175, with an average price expected to be $135.
Market Analysis
Firm Name
2025
2026
2030
Digital Coin price
$78
$94
$199
Coindataflow
$75
$36
$70
Coincodex
$26
$21
$35
Swapspace
$23
$46
$360
Never Miss a Beat in the Crypto World!
Stay ahead with breaking news, expert analysis, and real-time updates on the latest trends in Bitcoin, altcoins, DeFi, NFTs, and more.
FAQs
What is the Bitcoin SV price prediction for 2026?
BSV could range from $60 to $130 in 2026, with an average price around $90, showing potential for a bullish reversal.
What is the Bitcoin SV price prediction for 2030?
By 2030, BSV may reach $105–$175, averaging $135 if adoption grows and market conditions remain favorable.
What is the price prediction for Bitcoin SV in 2040?
Long-term 2040 predictions are uncertain, but if growth continues, BSV could rise steadily with the broader crypto market.
Is Bitcoin SV better than Bitcoin?
BSV focuses on fast, low-cost transactions and enterprise use, while BTC is primarily a store of value. Choice depends on goals.
What are the main risks of investing in Bitcoin SV?
Risks include prolonged bearish trends, weak investor sentiment, regulatory uncertainty, and underperformance versus other altcoins.
Analysts predict PEPE could reach $0.0000539 by 2026.
Long-term forecasts suggest potential highs of $0.0002733 by 2030.
Pepe Coin (PEPE), the memecoin inspired by the iconic frog meme, has rapidly become a standout in the crypto world. Ranked just behind Dogecoin and Shiba Inu, PEPE’s explosive rise—boasting gains of over +130325085.96% from its all-time low—has captured investor attention globally.
As it maintains its position among top memecoins, many are now asking: Will PEPE price go parabolic by the end of 2025? In this article, explore CoinPedia’s in-depth PEPE coin price prediction for 2025, and discover long-term forecasts that look ahead to 2030.
PEPE’s price has struggled in Q4 2025 due to low liquidity and cautious investor sentiment. However, if new capital flows in, a price rise is likely in Q1 2026, supported by a tightening trading range which is indicating potential for a breakout more than ever.
PEPE Price Prediction 2026
The PEPE price has faced challenges in Q4 2025, falling short of the expectations set by experts and investors alike, primarily due to an overarching risk-off sentiment within the memecoin space.
However, it’s essential to acknowledge that the current low market liquidity and cautious investor behavior have kept new capital on the sidelines amid a series of bearish trends.
Nevertheless, it is also a fact that entering the crypto market through memecoins remains one of the most accessible and easiest methods available. Should new liquidity begin to flow in, we can undoubtedly anticipate a bigger rise in PEPE’s price. Q1 2026 stands out as an ideal timeframe for this potential resurgence, and the compression of the falling wedge shows compression of the trading range that confirms the effectiveness and reliability of these trendlines that have been containing the price of PEPE since 2025, and the odds of a rally to pop out soon have greatly risen.
PEPE On-Chain Outlook
As per the metric “90-day Spot Taker CVD”, the cumulative difference between market buy and market sell volumes has turned positive and is increasing, indicating that high-conviction traders are aggressively market-buying PEPE rather than waiting for passive fills at lower prices.
This aggressive participation is a hallmark of a robust accumulation phase, in which market demand begins to outpace available liquidity, often serving as a precursor to a volatile price expansion.
Given that similar green clusters on the historical chart preceded significant rallies in mid-2024 and mid-2025, the current uptick suggests that “smart money” is positioning for a major move as the asset stabilizes near its current support levels in January 2026.
PEPE Price Prediction 2026 – 2030
Year
Potential Low ($)
Potential Average ($)
Potential High ($)
2026
0.0000179
0.0000359
0.0000539
2027
0.0000269
0.0000539
0.0000809
2028
0.0000404
0.0000809
0.0001214
2029
0.0000607
0.0001214
0.0001822
2030
0.0000910
0.0001822
0.0002733
This table, based on historical movements, shows PEPE price to reach $0.0002733 by 2030 based on compounding market cap each year. This table provides a framework for understanding the potential PEPE price movements. Yet, the actual price will depend on a combination of market dynamics, investor behavior, and external factors influencing the cryptocurrency landscape.
Pepecoin Price Forecast 2026
Our PEPE price prediction suggests that the price of PEPE in 2026 might range between $0.0000179 and $0.0000539, with the average price of the meme coin at $0.0000359.
Pepe Coin Price Prediction 2027
For 2027, we predict that the price of PEPE could range between $0.0000269 and $0.0000809, and the average price of the meme coin is expected to be around $0.000539.
Pepecoin Price Targets 2028
As per our Pepe Coin Price Prediction, in 2028, the price could range between $0.0000404 to $0.0001214, with the average price of the meme coin at $0.0000809.
Pepecoin Price Projection 2029
For 2029, the price of PEPE could range between $0.0000607 and $0.0001822, with the average price of the meme coin expected to be around $0.0001214.
Pepe Coin Price Prediction 2030
Based on our Pepecoin price forecast, the price of PEPE in 2030 might range between $0.0000910 to $0.0002733, with the average price of the meme coin predicted to be around $0.0001822.
PEPE Coin Market Analysis
Firm Name
2026
2030
Changelly
$0.0020
$0.015
CoinCodex
$ 0.000026
$ 0.000047
Binance
$0.000014
$0.000017
Never Miss a Beat in the Crypto World!
Stay ahead with breaking news, expert analysis, and real-time updates on the latest trends in Bitcoin, altcoins, DeFi, NFTs, and more.
FAQs
How much is Pepe coin worth?
The current price of Pepecoin is $ 0.00000419.
What factors could drive PEPE’s price growth in the coming years?
PEPE’s price depends on meme coin market sentiment, liquidity inflows, social media trends, and broader crypto cycles rather than fundamentals alone.
Is PEPE a high-risk investment compared to other cryptocurrencies?
Yes. As a meme coin, PEPE is highly volatile and sentiment-driven, making it riskier than utility-based cryptocurrencies with real-world use cases.
How does PEPE compare with Dogecoin and Shiba Inu?
PEPE competes mainly on community hype and trading momentum, while DOGE and SHIB benefit from longer histories and broader ecosystem support.
What is PEPE price prediction for 2026?
PEPE could trade between $0.0000179 and $0.0000539 in 2026, depending on meme coin demand, liquidity inflows, and overall crypto market momentum.
What is PEPE price prediction for 2027?
In 2027, PEPE may range from $0.0000269 to $0.0000809 if bullish sentiment and retail participation remain strong across meme coins.
What is PEPE price prediction for 2028?
PEPE’s price in 2028 could move between $0.0000404 and $0.0001214, driven by broader market cycles rather than project fundamentals.
What is PEPE price prediction for 2030?
By 2030, PEPE could reach up to $0.0002733 in optimistic scenarios, though prices will remain highly sensitive to market sentiment and risk appetite.
TRUMP memecoin cools near $5.66 as election hype fades, but 2026–2030 price predictions show potential surges toward $69.90 amid rising crypto and political momentum.
TRUMP token forecast signals major volatility ahead, with 2026 lows at $5 and highs up to $11.20 as memecoin trends, DeFi adoption, and political narratives drive demand.
OFFICIAL TRUMP (TRUMP), the political-themed memecoin linked to U.S. President Donald Trump, has become one of the most watched and volatile tokens in the market.
Its sharp rise in 2025 was driven by election hype, strong celebrity support, and massive social media attention. This pushed TRUMP into the spotlight as a cultural trend, not just another cryptocurrency.
So, let’s dive deep into our in-depth analysis of TRUMP Price Prediction 2026–2030, to find out what’s coming for the investors.
Was TRUMP regarded as a negligible asset in 2025? Not at all; the late 2025 announcement of a game launching on the App Store significantly shifted perceptions. Now, with the highly anticipated “Trump billionaire game” set to debut on the Apple Store on February 17th, 2026, the outlook for recovery in 2026 is strong, even after a challenging market in 2025. An increase from $4.00 clearly indicates potential, and once the $8.50 resistance is surpassed, we are poised for a rally towards $12.00.
Trump Price Prediction 2026
In 2025, the TRUMP token did not appear to be a dead asset, particularly with the announcement of the “Trump Billionaire Game,” which added a utility aspect beyond its initial memecoin status. The launch is scheduled for February 17th, 2026, on the Apple Store.
However, the outlook for 2026 is complicated by the 2025 market performance, where bulls struggled significantly against robust bearish sentiment. This dynamic reflects the speculative and often volatile nature of TRUMP’s price movement throughout 2025.
As we look forward to the possibilities that 2026 may bring, particularly with Donald Trump’s ongoing influence in the political arena, the potential for adoption is indeed compelling. On the price front, the weekly chart showcases an intriguing setup; we’ve recently seen a demand around 4.00 in early February. The price pattern indicates a falling wedge, reflecting a tightly compressed trading range, much like a coiled spring ready to unleash its energy.
Given this technical formation, a rebound appears likely. If bullish momentum emerges in Q1 2026, it will be crucial to monitor the $8.50 resistance level. A decisive breakout above this level could signal a significant rally, potentially advancing toward $12.00 as the uptrend unfolds.
Year
Potential Low ($)
Potential Average ($)
Potential High ($)
2026
$7
$18
$26
Trump Coin On-Chain Analysis
On-chain analysis of the OFFICIAL TRUMP (TRUMP) token in January 2026 reveals a significant bullish divergence characterized by institutional-grade absorption. Over the last 30 days, a clear redistribution of supply has occurred, which means that retail addresses holding between 10 and 10,000 coins have been consistently offloading their positions, while high-conviction “whale” addresses especially those holding between 100,000 and 1,000,000 TRUMP coins, have moved into an accumulation phase.
This “smart money” behavior suggests that larger entities are leveraging short-term retail panic and distribution as liquidity to build substantial long-term positions. This is laying the structural groundwork for a powerful upward trend as market sentiment stabilizes.
TRUMP Price Prediction 2026 – 2030
Year
Potential Low ($)
Potential Average ($)
Potential High ($)
2026
$5.00
$7.10
$11.20
2027
$6.05
$12.65
$18.90
2028
$8.20
$18.20
$27.50
2029
$12.40
$28.10
$44.80
2030
$18.10
$45.10
$69.90
TRUMP Price Prediction 2026
By 2026, the value of a single OFFICIALTRUMP coin price could reach a maximum of $42.00, with a potential low of $14.00. With this, the average price could land at around the $28.00 mark.
TRUMP Price Prediction 2027
Looking forward to 2027, the TRUMP coin Price may range between $21.00 and $42.00, and a potential average value of around $63.00.
TRUMP Price Prediction 2028
The Trump price could achieve the $94.25 milestone by the year 2028. However, the viral memecoin could record a low of $31.50 and an average price of $62.00 if the crypto market turns bearish.
TRUMP Price Prediction 2029
During 2029, the TRUMP crypto could reach a maximum trading value of $141.50 with a potential low of around $88. Evaluating the market sentiments, the average price of this altcoin could settle at around $94.50.
TRUMP Price Prediction 2030
The TRUMP memecoin crypto prediction for the year 2030 could range between $70.75 to $212.25. Considering the buying and selling pressure, the average price could be around $141.50 for that year.
What Does The Market Say?
Firm Name
2025
2026
2030
Mudrex
$60
$100
$600
Icobench
$100
$150
$500
Binance
$13.93
$14.63
$17.78
CoinPedia’s TRUMP Price Prediction
According to CoinPedia’s analysis, TRUMP could recover from its 2025 decline if strong social buzz returns. As per our price outlook, renewed interest in political-themed tokens may help TRUMP climb toward a possible $11.58.
However, if the market turns cautious, the token may drop back toward $5.0 before finding stable support.
Year
Potential Low ($)
Potential Average ($)
Potential High ($)
2026
$5.0
$7.18
$11.58
Never Miss a Beat in the Crypto World!
Stay ahead with breaking news, expert analysis, and real-time updates on the latest trends in Bitcoin, altcoins, DeFi, NFTs, and more.
FAQs
What is the TRUMP token and why is it gaining popularity?
The TRUMP token is a political-themed memecoin that surged due to election buzz, celebrity attention, and strong community hype.
What is the TRUMP price prediction for 2026?
Analysts expect TRUMP to trade between $5.00 and $11.20 in 2026, depending on market liquidity, sentiment, and political momentum.
Can the TRUMP token reach $20 by 2028?
Yes, if market demand rises, TRUMP could test the $20 zone by 2028 as memecoins mature and investor interest strengthens.
What could drive TRUMP’s price higher by 2030?
Community activity, strong market cycles, and sustained interest in political tokens may push TRUMP toward higher long-term levels.
Trump says he knew nothing of a $500M Abu Dhabi-linked deal for World Liberty Financial, as critics probe conflicts of interest and ethics risks. Former President Donald Trump denied knowledge of a reported $500 million investment from an Abu Dhabi-linked…
Musk’s SpaceX and xAI are exploring a $1.25T merger to fuse Starlink’s satellite network with advanced AI, creating space-based data and compute infrastructure. SpaceX and artificial intelligence startup xAI are engaged in early merger discussions that could result in a…
PEPE trades at $0.0000043, down 29% monthly. Whales fade rallies but price holds 21-day EMA. Upside targets $0.000007–$0.000012 if liquidity returns. Pepe (PEPE) is trading in a fatigued downtrend but still primed for sharp mean‑reversion spikes if liquidity rotates back…
Remittix is drawing renewed attention in early 2026 as strong demand, rapid ecosystem growth, and aggressive incentives fuel expectations of outsized returns.#partnercontent
XRP’s derivatives market just snapped back to life — and that usually means the next leg is coming, one way or another. XRP (XRP) futures netflows jump 749% after a $69M long wipeout, lifting price off $1.52 but leaving leveraged…
A sharp XRP ETF outflow was quickly followed by renewed inflows, highlighting a growing disconnect between short-term price weakness and longer-term positioning. #partnercontent
Polygon (POL) price is taking a breather above $0.11, rebounding about 11% from the key psychological support at $0.10, signaling short-term relief after recent weakness. On-chain data shows January’s activity driving a sharp increase in token burns, with roughly 25.7 million POL removed from circulation, marking one of the largest monthly burns since the POL transition. Network usage has also fuelled bridged net inflows and a rise in stablecoin supply, supported by the adoption of Ethereum’s trustless agent standard (ERC-8004) on Polygon, which expands utility and liquidity flows on the layer-2 chain.
Despite these bullish fundamental cues, POL’s technical picture remains under pressure. The token is still trading within a broader downtrend, with key moving averages sloping downward and the market structure showing lower highs, suggesting the recent bounce could be a relief rally rather than a confirmed trend reversal.
POL Price Analysis for this Week
The POL price in the short term is attempting a short-term trend reversal after completing a deep corrective move from the $0.18 high. Price has defended the $0.10–0.11 demand zone and is now trading around $0.115, just above the 0.236 Fibonacci level at $0.119, signaling early signs of accumulation. The structure suggests a higher low is forming, which keeps a relief move in play as long as the price holds above $0.11.
From an indicator perspective, price is trying to reclaim the MA ribbon (20/50/100 EMA–SMA cluster), with the 50-SMA curling up, often an early trend-shift signal on lower timeframes. RSI at ~61 shows improving momentum without being overbought, supporting continuation rather than exhaustion. On the upside, a clean hold above $0.12 opens the door to $0.132 (0.382 Fib), followed by $0.143 (0.5 Fib). A stronger breakout above $0.15 would expose $0.186. On the downside, losing $0.11 would invalidate the bounce and bring $0.099–0.10 back into focus.
Can the POL Price Trigger a 100% Rise This Month?
A 100% move-in Polygon (Ex MATIC) price this month sounds bold, but it’s not impossible. The price has already shown strength by holding the $0.10 support and starting to reclaim key moving averages, which keeps the recovery story alive.
The POL price still needs to break and hold above $0.15, and then convincingly clear the $0.18 resistance, where sellers were active earlier. Without strong volume and a supportive market backdrop, any upside is more likely to come in steady legs rather than a straight vertical surge.
STX price staged a sharp intraday recovery, climbing close to 18% after weeks of persistent downside pressure. The rebound unfolded during a session marked by improving risk appetite across select altcoins, but STX stood out as price reacted decisively from a compressed range near recent lows. The move was not gradual, as STX price accelerated higher after absorbing sell orders clustered below the $0.30 region, an area that had repeatedly acted as short-term support. Once that supply was cleared, STX pushed higher in a single directional move, signaling a shift in near-term market control.
The recovery has pulled STX away from its local bottom, placing price back into a technically important zone where prior breakdowns occurred often the first area traders watch to assess whether a bounce has follow-through potential.
STX price action is now shifting into a post-breakout retest phase, a behaviour typically seen after aggressive trendline breaks. After clearing the descending trendline that capped the token upside for weeks, STX did not extend vertically. Instead, it pulled back in a controlled manner to retest the former resistance as new support, a structurally constructive signal. On the chart, Stacks price is compressing above the reclaimed zone, with higher lows rather than slipping back into the prior range. This suggests sellers are failing to regain control, while buyers are defending the breakout level with reduced volatility.
If STX price continues to hold above this retest area, the structure opens the door for a continuation move toward the $0.45-$0.50 region. A clean push above the local consolidation zone would likely trigger momentum-driven participation, especially given the earlier short-side pressure. Failure of the retest, however, would delay the bullish thesis and push STX back into range-bound behaviour rather than invalidate the broader recovery.
Futures Market Data Outlook
Derivatives positioning played a key role in today’s rally. Liquidation heatmap data shows dense short liquidity stacked between the $0.30 and $0.32 range, levels that were swept as price moved higher. As STX crossed into this zone, forced short exits amplified upside momentum rather than organic spot demand leading the move.
Furthermore, the open interest surged alongside price, indicating fresh positions entering the market instead of leverage being flushed out entirely. This matters. Moreover, exchange data further shows short exposure outweighing longs near the lower range, leaving additional downside protection for price as long as STX holds above reclaimed intraday levels.
Dubai is taking a big step toward the future of digital assets. Billiton Diamond and tokenization company Ctrl Alt have partnered to launch a major diamond tokenization project worth more than $280 million.
The initiative aims to make diamond trading faster, more transparent, and easier to access for investors around the world.
Diamond Tokenization To Be Minted On XRPL
In a recent press release by Ctrl Alt, the company confirmed a historic partnership with Billiton Diamond to tokenize more than AED 1 billion ($280 million) worth of polished diamonds in Dubai.
This collaboration aims to modernize the diamond industry by using blockchain technology to make diamond trading more transparent, secure, and efficient.
The project focuses on turning physical diamonds into digital tokens that can be easily tracked, transferred, and verified on the blockchain.
These tokenized assets are being minted on the XRP Ledger, a fast and low-cost blockchain network, while Ripple’s enterprise-grade custody technology is being used to secure the assets.
How Diamond Tokenization Will Change the Industry
Traditionally, buying and selling diamonds has been a slow and complex process. Investors often face challenges such as limited transparency, high costs, and difficulty in verifying authenticity. Through tokenization, every diamond can now have a digital record showing its origin, grading, and ownership history.
The company is also exploring ways to enable future trading of tokenized diamonds on primary and secondary markets.
However, all these activities will be subject to approval from Dubai’s Virtual Assets Regulatory Authority (VARA).
Industry leaders believe this project could change how diamonds are bought and sold. According to Billiton Diamond’s Joint Owner Jamal Akhtar, tokenization turns diamonds from an illiquid asset into a transparent and investable digital product. He added that it can improve liquidity and shorten working capital cycles for traders and manufacturers.
Ripple’s Managing Director for Middle East & Africa, Reece Merrick, also highlighted that the initiative proves high-value physical assets can be safely managed on-chain.
Ripple is proud to support Billiton Diamond and @CtrlAltCo who have tokenized over AED 1 billion ($280m) of certified polished diamonds on the XRPL.
This initiative shows how @Ripple's technology can bridge the gap between physical assets and the digital economy, utilising our…
“Ripple is proud to support Billiton Diamond and Ctrl Alt, who have tokenized over AED 1 billion ($280m) of certified polished diamonds on the XRPL.”
With strong regulatory support and advanced technology, Dubai is positioning itself as a global leader where traditional commodities meet the digital economy.
Never Miss a Beat in the Crypto World!
Stay ahead with breaking news, expert analysis, and real-time updates on the latest trends in Bitcoin, altcoins, DeFi, NFTs, and more.
FAQs
What is diamond tokenization and how does it work?
Diamond tokenization converts physical diamonds into digital tokens on blockchain, allowing secure, transparent, and tradable ownership.
How does tokenizing diamonds benefit investors?
It increases transparency, reduces costs, and improves liquidity by making diamonds easily tradable digital assets with clear provenance and ownership records.
Is tokenized diamond trading regulated in Dubai?
Yes, all trading of tokenized diamonds will require approval from Dubai’s Virtual Assets Regulatory Authority (VARA), ensuring compliance and investor protection.
As the Epstein files continue to be released, new claims are surfacing almost every day, raising serious concerns. One recent claim circulating on X and within crypto circles alleges that Israel secretly gained control of the Bitcoin network more than a decade ago.
The claim also tries to connect the newly discussed Epstein files with Bitcoin core developers, Blockstream, and Tether.
So Coinpedia stepped in to fact-check whether the claim is real or just another false allegation.
Who Made This Claim?
The claim was made by SwanDesk CEO Jacob King, who cited an alleged Epstein file document. He says the document shows a conversation between Jeffrey Epstein and Joichi Ito, a Japanese entrepreneur, suggesting that some Bitcoin core developers received hidden gifts.
King also claimed that Israel paid the salaries of about 60% of Bitcoin developers. He further alleged that Epstein and Israel were major investors in Blockstream, and that Blockstream and Tether could influence Bitcoin’s price and code.
But is all this claim true? Let’s break it down.
Coinpedia’s Key Findings: What’s Actually True?
No Evidence Israel Controlled Bitcoin Developers
The recent release of millions of documents by the U.S. Department of Justice (DOJ) under the Epstein Files Transparency Act has found no substantiated evidence that Israel hijacked control of the Bitcoin network
Also, the claim that Israel paid 60% of Bitcoin core developers is unsupported. Meanwhile, no document proves Israeli state payrolls or centralized hiring.
Epstein Had a Minor, Indirect Blockstream Investment
MIT Digital Currency Initiative (DCI) records show that Jeffrey Epstein donated around $850,000 to MIT between 2002 and 2017. Perhaps, this does not amount to control or major ownership.
In 2015, part of this money was reportedly used by MIT’s Digital Currency Initiative to pay salaries of Bitcoin Core developers like Gavin Andresen and Wladimir van der Laan. This support came after the Bitcoin Foundation shut down, and funding for developers became uncertain.
Why is Israel being linked to the Bitcoin Foundation and MIT Media Lab?
The main Israel link comes through former Prime Minister Ehud Barak. Records show Barak stayed at Jeffrey Epstein’s New York home several times between 2013 and 2017, the same period when claims of Israeli control over Bitcoin.
Epstein also reportedly acted as a backchannel for Israeli interests, helping arrange security deals in several countries.
In 2015, Epstein donated $850,000 to the MIT Media Lab. Prominent Israeli figures, such as designer Neri Oxman, were senior researchers at the Media Lab during the period it was accepting Epstein’s funds.
Epstein was also connected to Bitcoin infrastructure as well. In 2014, he joined an $18 million funding round for Blockstream, a company that employs important Bitcoin developers.
However, Blockstream CEO Adam Back later clarified that Epstein’s stake was quickly sold and the company has no financial ties to him today.
In 2014, during Blockstream’s seed-round investor roadshow, the company was introduced to then MIT Media Lab director Joi Ito. Subsequently Blockstream met with Jeffrey Epstein, who was described at the time as a limited partner in Ito’s fund. That fund later invested a minority…
Claims that Bitcoin’s price can be manipulated using “unbacked Tether” are separate allegations. These claims do not prove that anyone controls the Bitcoin network, controls Bitcoin developers, or that any government is manipulating Bitcoin.
Summary Table: Coinpedia’s Evidence Against the Theory
Claim Made by Theory
Coinpedia’s Counter-Evidence
Does Israel Hijack Control of the Bitcoin Network?
U.S. Department of Justice (DOJ) said their were no substantiated evidence to support this claim
Did Epstein funded Bitcoin takeover?
Minor, but that was also through indirect investment of only $50,000 and $500,000
Were 60% of devs paid by Israel
No Document to support these claims.
Conclusion
Claim
Do the Epstein Files Reveal Israel Hijacked Control of the Bitcoin Network?
Verdict
False
Fact-Check by Coinpedia
As per Coinpedia research and a review of official sources, there is no credible evidence that Israel controls Bitcoin, pays core developers, or manipulates the network through Blockstream or Tether. Until then, this claim remains unverified and speculative.
Never Miss a Beat in the Crypto World!
Stay ahead with breaking news, expert analysis, and real-time updates on the latest trends in Bitcoin, altcoins, DeFi, NFTs, and more.
Cathie Wood’s Ark Invest has added over $15 million worth of Robinhood shares across two of its exchange-traded funds. According to data compiled by Ark Invest Tracker, Ark Invest bought 363,317 Robinhood shares, worth approximately $32.7 million across three of…
Tether has partnered with Opera MiniPay wallet to expand access for USDt and Tether Gold XAU₮ across emerging markets. Opera shares have rallied nearly 18% since the partnership was announced. According to a Feb. 2 announcement, MiniPay wallet users are…
Bitcoin’s fall toward the $75,000 level did not come as a surprise to analysts. The move was not caused by panic selling or bad news. Instead, experts say the drop is the result of a long-term technical breakdown that has been building for months.
According to analysis shared by The Block Vlog, Bitcoin has shifted from a strong uptrend into a broader correction phase after losing key support levels.
Bitcoin Trend Shift Started in Late 2025
The first warning signs appeared in November 2025, when Bitcoin failed to hold its important $91,000 daily support. This level had supported the bullish trend for weeks.
Once that support broke, the market structure changed. Bitcoin stopped making higher highs and higher lows, confirming that the previous bull market cycle had ended. A rising wedge pattern also broke down, which is often a bearish signal.
At the same time, momentum indicators across higher timeframes turned weak. Weekly momentum slowed, medium-term indicators flipped bearish, and monthly candles began closing below short-term moving averages. Together, these signals pointed to a deeper correction, not just a short pullback.
Why Bitcoin Falling to $75,000 Was Expected
After losing the $91,000 support, downside targets between $76,900 and $71,800 became active. Bitcoin reached the $75,000 zone within days, confirming those technical predictions.
The speed of the drop stood out, especially because it happened over the weekend, when markets usually move more slowly. This suggested strong selling pressure rather than normal profit booking.
Although $75,000 is an important psychological level, analysts say it is not a strong long-term support. From a weekly view, Bitcoin already lost the more critical $85,000 support, leaving the price vulnerable to further declines.
For Ethereum, analysts are paying more attention to the ETH/BTC chart than the dollar price. While Ethereum remains bullish in the long run, it must hold the 0.026–0.029 support range against Bitcoin.
If Ethereum fails to show strength relative to BTC, it is unlikely to outperform Bitcoin in the near term, even if the broader market stabilizes.
What Next For BTC Price?
If the downtrend continues, a larger measured move from the weekly chart points toward the $63,000 region as a possible next target. This does not mean an immediate fall, but it remains a realistic risk if weakness continues.
On the upside, short-term relief rallies may face resistance near $78,500. Stronger selling pressure is expected between $84,500 and $87,200. A rejection from these zones would likely strengthen the bearish trend again.
The bearish outlook would only change if Bitcoin can reclaim and hold above the $93,000–$94,000 range on a weekly close. Until then, analysts expect high volatility, with downside risks still very much in play.
FAQs
How low could Bitcoin price go in this correction?
Technical projections point to $63,000 as a potential downside target if the current bearish trend continues.
When could Bitcoin price stabilize?
Bitcoin may stabilize once selling slows near major weekly supports or after a period of high volatility and consolidation.
Can Bitcoin recover above $80,000 soon?
Short-term rallies could test $78,500–$80,000, but sustained recovery requires stronger demand and trend reversal signals.
Elon Musk’s AI company xAI is hiring crypto specialists to train its AI on trading and digital asset strategies. The roles require expertise in on-chain analysis, DeFi, derivatives, arbitrage, MEV, quantitative methods, and risk management. These remote positions pay $45 to $100 per hour for US applicants outside Wyoming and Illinois and require a master’s, PhD, or equivalent experience. The move has been welcomed by crypto communities as a step toward mainstream adoption, with some joking that Bitcoin is now the currency of AI.
ING Deutschland, one of Germany’s largest retail brokers, has opened up new ways for ordinary investors to buy and sell crypto exchange‑traded products (ETPs) through its standard securities accounts. The bank’s Direct Depot now includes Bitcoin, Ethereum, and Solana ETPs, as well as crypto index products, all provided by major issuers such as 21Shares, Bitwise, and VanEck, and traded on regulated markets. These ETPs are physically backed, letting clients gain exposure to digital assets without managing wallets or private keys, while relying on familiar banking infrastructure. ING says this move aims to lower barriers to crypto investing while using familiar banking infrastructure.
Stacks (STX) price moved higher today, outperforming several large-cap cryptos as the broader market attempts a cautious recovery. The price uptick comes after recent weakness across digital assets, with traders rotating into select altcoins showing relative strength. The move comes as the Bitcoin price shows early signs of stabilizing after its latest correction. In the absence of a major protocol announcement, traders appear to be rotating into assets that have already absorbed selling pressure, with Stacks emerging as one of the more resilient names in the market.
Will this bullish momentum prevail for long? Will the STX price reclaim $0.4 this week?
Stacks Price Gains Strength Without Major Catalyst
STX price is one of the day’s top gainers, up more than 18% to $0.29, with a nearly 240% increase in trading volume. The rebound from the established support levels has lifted Stacks above the major cryptos like BTC and ETH. The token experienced aggressive buying activity from market participants, contributing to the upticks in price after recent weakness. With no adverse news and a modest recovery in the broader crypto space, traders have rotated into assets like STX that have been oversold, helping lift the price in the process.
STX looks to be coming out of a long downtrend and entering a base-building phase. Price has formed higher lows near the $0.23–0.25 demand zone, signalling that selling pressure is fading. The recent bounce from the lower Bollinger Band and a move toward the 20-SMA suggest short-term recovery momentum. However, price is still capped below the key $0.40–0.42 resistance, which has rejected multiple rallies.
On the indicator side, MACD is turning up from negative territory, hinting that downside momentum is weakening, even though a full bullish crossover is yet to be confirmed. If STX holds above $0.28–0.30, a move toward $0.36–0.38 looks likely, with $0.40–0.42 as the major hurdle. A breakout above that could push the price toward $0.48–0.50, while a drop below $0.26 risks a retest of $0.23.
Conclusion: Can STX Reach $0.50?
A move toward the $0.50 level for Stacks (STX) cannot be ruled out, but it would likely depend on more than short-term market rebounds. While recent price strength reflects improving sentiment and a relief-driven rotation into select altcoins, sustained upside would require broader support from the crypto market and renewed interest in Bitcoin-linked applications.
If momentum around Bitcoin stabilises and activity across the Stacks ecosystem continues to grow, STX could gradually work its way higher. However, in the absence of a strong ecosystem or market-wide catalyst, the $0.50 mark remains a medium-term possibility rather than an immediate expectation.
FAQs
Why is Stacks (STX) price rising today?
STX surged over 18% as traders rotated into oversold altcoins, with Bitcoin stabilizing and selling pressure easing on key support levels.
Is STX outperforming Bitcoin and Ethereum?
Yes, STX recently gained more than 18%, outpacing BTC and ETH during this selective market rotation into oversold altcoins.
Is STX in a base-building phase?
Yes, higher lows near $0.23–$0.25 suggest STX is forming a base after a downtrend, reducing selling pressure and preparing for potential upside.
ARK Invest increased exposure to Robinhood, Circle, BitMine, Bullish and other crypto-linked firms within several innovation and fintech-focused ETFs this week.
Stablecoin issuer Tether said the initiative will help millions of users from emerging markets such as Africa, Latin America and Southeast Asia with global financial inclusion.
Hyperliquid price rallied over 40% this week as whales showed renewed demand for the token. Can it recover back to its October highs of around $50 now that a bullish crossover has been confirmed on its charts? According to data…
United States President Donald Trump has denied any knowledge of reports that a company linked to Sheikh Tahnoon bin Zayed Al Nahyan has acquired a 49% stake in World Liberty Financial. “I don’t know about it,” Trump said during a…
Zcash price is hovering near a key technical support zone after weeks of steady losses, with traders watching closely for signs of short-term exhaustion. As of this writing, Zcash was trading at $289, down 1.7% in the past day. The…
Bitcoin price edged higher on Feb. 3 after days of heavy selling, as pressure from forced liquidations faded and fresh capital returned to U.S. spot Bitcoin exchange-traded funds. Bitcoin was trading at $78,659 at the time of writing, up 3.8%…
Tether has officially entered the Bitcoin mining infrastructure space with the launch of MiningOS (MOS), an open-source operating system designed to simplify, enhance transparency, and scale Bitcoin mining. The stablecoin issuer states that the move is designed to lower entry barriers for miners and promote greater decentralization across the Bitcoin network.
Ending Reliance on Closed Bitcoin Mining Software
According to Tether, Bitcoin mining has traditionally relied on closed, proprietary software that forces miners to depend on expensive third-party providers. With MiningOS, Tether aims to eliminate these “black box” systems by giving miners full visibility and control over their operations.
The company emphasized that transparency and collaboration are core principles of MiningOS, marking a shift away from vendor-controlled mining platforms toward open Bitcoin mining infrastructure.
Scalable Bitcoin Mining Software for Small and Large Miners
MiningOS is built as a modular and scalable platform, capable of supporting both home-based mining setups and large-scale industrial mining operations. The system uses a self-hosted architecture and connects mining devices through an integrated peer-to-peer network, reducing reliance on centralized services.
Tether also introduced a management dashboard that allows miners to optimize settings based on performance, scale, and output needs. CEO Paolo Ardoino described MiningOS as a complete mining framework that can operate efficiently across multiple locations while maintaining consistent performance.
Released under the Apache 2.0 open-source license, MiningOS is free to use, modify, and customize. Tether stated that the software is built using Holepunch peer-to-peer technology, ensuring there are no hidden controls, backdoors, or centralized dependencies.
Unlike some existing solutions, such as mining software from Block that is optimized for proprietary hardware, MiningOS is hardware-agnostic. This allows miners to use a wide range of mining machines, making the platform more accessible to operators with diverse hardware setups.
MiningOS Aligns With Tether’s Broader Crypto Expansion
Tether first revealed plans for an open-source mining operating system in June last year, citing the need for new miners to compete without relying on costly vendors. The release of MiningOS aligns with Tether’s broader expansion beyond stablecoins.
The company has recently increased its involvement in Bitcoin mining, tokenization, artificial intelligence, decentralized finance, and alternative assets, while also expanding its exposure to Bitcoin and gold.
By open-sourcing Bitcoin mining infrastructure, Tether is positioning itself as a key contributor to strengthening decentralization and transparency at the network level.
Never Miss a Beat in the Crypto World!
Stay ahead with breaking news, expert analysis, and real-time updates on the latest trends in Bitcoin, altcoins, DeFi, NFTs, and more.
FAQs
What is Tether MiningOS (MOS)?
MiningOS is Tether’s open-source Bitcoin mining operating system designed to improve transparency, reduce costs, and help miners manage operations more efficiently.
How does MiningOS improve Bitcoin mining transparency?
MiningOS removes closed “black box” software, giving miners full visibility and control over performance, settings, and data without relying on third parties.
Who can use Tether’s MiningOS?
MiningOS is built for everyone, from home miners to large industrial farms, with scalable features that adapt to different sizes and mining needs.
Why is Tether expanding into Bitcoin mining software?
Tether aims to support decentralization, lower entry barriers for miners, and expand its role beyond stablecoins into Bitcoin infrastructure and technology.
ZIL price surged more than 70% today, marking one of its strongest single-day performances in months. The rally unfolded as traders reacted to confirmation of an upcoming Zilliqa network upgrade, triggering renewed attention toward the protocol at a time when the broader crypto market remains under pressure. While most large-cap and mid-cap tokens struggled for direction, the Zilliqa price attracted concentrated inflows, pushing it decisively out of its recent consolidation range. As volume accelerated and volatility expanded, the focus quickly shifted from whether ZIL could move to how sustainable the move might be.
Zilliqa’s Upgrade Catalyst Drives Spot Demand and Narrative Shift
ZIL price rally followed confirmation of a significant Zilliqa network upgrade, which laid out concrete technical and ecosystem developments rather than vague roadmap promises. The network rolled out node version 0.20.0, aligning Zilliqa with Cancun-era EVM functionality and setting the stage for a hard fork scheduled for February 5, 2026. This upgrade improves smart-contract compatibility, enhances tooling for developers, and lowers friction for applications integrating with Ethereum-based environments. Beyond core infrastructure, the update also introduced a meaningful institutional signal.
A government-linked trust network from Liechtenstein is set to participate as a validator, strengthening decentralization and validator credibility. Additional improvements included expanded API capacity for enterprise users and resolution of validator stability issues that had previously constrained performance. For markets, this was not abstract development talk, it was actionable progress, and price reacted accordingly.
ZIL Price Shows Massive Breakout: Is $0.0100 Next?
Zilliqa price chart shows a falling wedge pattern breakout with strong surge in volume. With the start of this month, ZIL price rallied more than 90% and skyrocketed above the supply zone of $0.007000. ZIL’s price action indicates a clear shift in trend, with price surpassing the short-term moving averages and is eyeing to smash the 200 day EMA cluster of $0.007800. Once ZIL price strikes above the zone, further rally would take shape which could push Zilliqa price toward $0.01000 in the near term.
On the downside, the former channel resistance now acts as near-term support. A sustained move back below that level would signal loss of momentum and put the breakout at risk. Until then, the chart reflects trend transition rather than exhaustion.
ZIL’s rally was reinforced by a sharp and measurable shift in derivatives positioning. Total open interest surged to roughly $55.1 million, marking a near 922% jump intraday, a clear signal that fresh leverage entered the market rather than price moving on low participation. At the same time, 24-hour futures volume expanded to approximately $856 million, up more than 4585%, confirming that the breakout attracted broad-based speculative interest across major venues.
Long/short positioning tilted decisively toward the long side, with the aggregate long-short ratio pushing above 1.20, indicating bullish dominance but not yet an overcrowded long trade. Liquidation data further supports this structure: short-side liquidations dominated, while long liquidations remained relatively contained, suggesting bearish exposure was flushed as price accelerated. This combination of rising open interest alongside expanding volume typically reflects new directional conviction, not late-stage short covering alone, which gives a clear bullish outlook.
FAQs
Why Zilliqa (ZIL) price is up today?
ZIL price is up today due to confirmation of a major network upgrade, strong spot buying, and rising derivatives activity signaling renewed bullish interest.
What is the Zilliqa network upgrade and why is it important?
The upgrade improves EVM compatibility, validator stability, and developer tools, making Zilliqa more attractive for apps and institutions.
Is the ZIL rally driven by real demand or speculation?
Rising spot volume, higher open interest, and limited long liquidations point to fresh demand, not just speculative hype.
The live price of the Zilliqa crypto token is $ 0.00680531.
ZIL price could claim its potential high of $0.0350 in 2026.
By 2030, Zilliqa could revisit the $0.18 range if its sharding-based infrastructure regains relevance in Web3.
Zilliqa is one of the first blockchains to use sharding as a built-in solution to handle more transactions at the same time. By processing transactions in parallel, it aimed to reduce network congestion long before scalability became a major topic in crypto.
However, despite being an early innovator, Zilliqa lost attention as newer Layer-1 blockchains entered the market with bigger ecosystems and stronger funding.
Recently, interest in Zilliqa returned after the Cancun hard fork went live. Following this upgrade, the ZIL token surged nearly 70%, now trading around $0.00670.
So, let’s dive into Coinpedia’s Zilliqa (ZIL) price predictions for 2026, 2027, and 2030.
Zilliqa (ZIL) is now working on a major upgrade called Zilliqa 2.0, which will bring big changes to the network. As part of this update, the blockchain is moving from the older Proof-of-Work system to a faster and more efficient Proof-of-Stake model.
An important technical upgrade is set for February 5, 2026, aimed at improving network speed, scalability, and performance.
The update will also add Cancun-compatible Ethereum Virtual Machine (EVM) features to make Zilliqa more developer-friendly and better connected with the wider crypto ecosystem.
Ahead of the major upgrade, the ZIL token has already seen a strong price pump and is now trading around $0.0066.
Coinpedia experts believe this momentum could continue, with the token potentially rising to around $0.0130 by the end of February.
Technical Analysis
Looking at the ZIL/USDT 1-day price chart, ZIL was moving inside a clear downward channel for many weeks, showing strong bearish control. Price kept forming lower highs and lower lows.
Recently, ZIL broke above the upper trendline of this channel with a sharp bullish candle and high volume, which signals a potential trend reversal.
However, the immediate resistance is near $0.007, a breakout above this level could push the price toward $0.010, and if momentum stays strong, ZIL may reach up to $0.013.
Meanwhile, the RSI has also jumped above neutral levels, confirming rising momentum.
Month
Potential Low ($)
Potential Average ($)
Potential High ($)
ZIL Crypto Price Prediction February 2026
$0.0042
$0.0077
$0.0130
Zilliqa Price Prediction 2026
The year 2026 will test whether Zilliqa can convert technical upgrades into ecosystem growth. Beyond the Cancun hard fork, Zilliqa’s plan focuses on performance optimization, developer tooling, and real-world use cases.
Zilliqa has continued to position itself in gaming, payments, and enterprise blockchain solutions, areas where low fees and high throughput matter. If the network attracts new projects or revives existing dApps post-upgrade, demand for ZIL staking and transactions could rise.
However, competition from newer high-performance chains remains intense. To keep growing, the network will need to stand out and offer clear advantages over its rivals.
Year
Potential Low ($)
Potential Average ($)
Potential High ($)
Zilliqa Price Prediction 2026
$0.0026
$0.0155
$0.0350
Zilliqa (ZIL) Price Prediction 2026 – 2030
Year
Potential Low ($)
Potential Average ($)
Potential High ($)
2026
$0.0026
$0.0155
$0.0350
2027
$0.0671
$0.0280
$0.0600
202
$0.0107
$0.0514
$0.0953
2029
$0.0336
$0.0750
$0.1301
2030
$0.0550
$0.115
$0.180
Zilliqa (ZIL) Price Prediction 2026
In 2026, ZIL may stabilize after the Cancun-driven rally. A push toward $0.035 is possible if network usage grows meaningfully.
Zilliqa Price Prediction 2027
By 2027, broader adoption of scalable Layer 1s could support ZIL near $0.06, assuming Zilliqa maintains developer engagement.
Zilliqa Price Forecast 2028
In 2028, if Zilliqa secures long-term partnerships in gaming or payments, prices could approach $0.095.
Zilliqa Coin Price Prediction 2029
As Web3 infrastructure matures, Zilliqa’s early sharding advantage may regain attention, lifting ZIL toward $0.13.
Zilliqa Price Prediction 2030
By 2030, Zilliqa’s valuation will depend on sustained relevance. Under favorable conditions, ZIL could test $0.18.
What Does The Market Say?
Year
2026
2027
2030
Coincodex
$0.005158
$0.0049
$0.0022
Changelly
$0.00743966
$0.01033266
$0.00523643
DigitalCoinprice
$0.00826
$0.0108
$0.0181
CoinPedia’s Zilliqa Price Prediction
From a CoinPedia perspective, Zilliqa represents an early scalability pioneer attempting to regain relevance in a crowded Layer 1 market. The Cancun hard fork has improved sentiment, but sustained growth depends on real usage.
CoinPedia expects ZIL to see a gradual recovery in 2026, with a potential high near $0.035 if post-upgrade adoption improves.
Year
Potential Low ($)
Potential Average ($)
Potential High ($)
2026
$0.0026
$0.0155
$0.0350
Never Miss a Beat in the Crypto World!
Stay ahead with breaking news, expert analysis, and real-time updates on the latest trends in Bitcoin, altcoins, DeFi, NFTs, and more.
FAQs
What is the price prediction for Zilliqa (ZIL) in 2026?
Zilliqa’s 2026 price is projected to range between $0.0026 and $0.035, with upside depending on post-upgrade adoption and network activity.
What is the Zilliqa price prediction for 2028?
In 2028, Zilliqa may trade between $0.010 and $0.095 if gaming, payments, and enterprise use cases gain traction.
What is the Zilliqa coin price prediction for 2030?
ZIL’s 2030 forecast ranges from $0.055 to $0.18, depending on long-term relevance, adoption, and broader crypto market growth.
What is the Zilliqa (ZIL) price prediction for 2040?
By 2040, Zilliqa’s price will depend on sustained relevance; optimistic scenarios suggest higher valuations if adoption continues.
What role does Zilliqa 2.0 play in ZIL’s future price?
Zilliqa 2.0 shifts the network to Proof-of-Stake, improving speed and efficiency, which could support long-term value if adoption rises.
Is Zilliqa (ZIL) a good investment?
Zilliqa may appeal to long-term investors if upgrades translate into real usage, but it carries risk due to strong Layer-1 competition.
Since USDT began to explode in 2021, USDT (TRC-20) has become the number one currency for on-chain payments and transfers, and one of the most popular rails for stablecoin transfers.
But frequent users quickly find out that USDT (TRC-20) transfers aren’t necessarily “cheap” by default. Transaction costs are closely linked to the availability of resources like TRON Energy.
TronZap addresses this friction and offers on-demand TRON Energy and Bandwidth rental so that users can process USDT transfers with less cost, without staking TRX or locking their funds. This review explores how TronZap works, its primary use cases, and how it fits within the wider infrastructure stack of TRON.
What Is TronZap?
TronZap is a TRON blockchain infrastructure service that efficiently minimizes the cost of transactions on the network while renting the blockchain resources (Energy and Bandwidth) to users.
On TRON, when users are utilizing smart contracts that interact with TRC-20 tokens like USDT, they need Energy, and in this case, this Energy is not sufficient; the TRON blockchain burns TRX to fill that gap. TronZap alternatively lets users rent such Energy temporarily so they may not have to burn TRX while interacting with contracts.
Their service is publicly presented in the TRON ecosystem, and they are proud members of TBL. Besides, TronZap publicizes their product and roadmap in the TRON DAO forum, making it easy for developers and users to understand how to interact, what to expect, and what the foundations.
Why TRON Energy Matters for USDT Transfers
TRON’s resource-based fee system is a little different compared to the gas-based blockchains we’re used to, like Ethereum. Instead of paying a flat fee per transaction, users pay using the energy and Bandwidth that is allocated to your account.
For a standard USDT (TRC-20) transfer:
A typical transfer will consume ~65,000 Energy
Transfers to new addresses can require up to 131,000 Energy
If a wallet doesn’t have enough Energy to pay for a transfer, TRON automatically burns some TRX to pay for it, which is why you often see USDT transfers costing 13 TRX or more even on the TRON blockchain. TronZap’s main promise is a simple one – rent out the Energy you need instead of burning TRX, reducing transfer costs while making them more predictable.
Core Capabilities of TronZap
Rent TRON Energy
TRON Energy rental is TronZap’s core feature. Users can rent preset amounts of Energy for a preset amount of time (normally one hour). This takes care of the majority of USDT transfers and eliminates the surprise burns of TRX.
Buy TRON Bandwidth
In addition to Energy, TronZap allows for TRON Bandwidth rental too – for the basic transactions that aren’t smart contracts. This is useful for people with different transaction types across the TRON network.
No-Registration Energy Purchases
One of TronZap’s distinguishing features is that registration is optional. Users can simply:
Send TRX to the address displayed on the TronZap website
Receive delegated Energy back to the same wallet automatically
Use the Energy immediately for transactions
No staking, no account creation, and no private key sharing are required.
Telegram Bot Integration
TronZap also operates an official Telegram bot (@tronzap_bot), offering a faster workflow for users who prefer chat-based interaction. Through the bot, users can:
Buy Energy instantly
Rent Bandwidth
Estimate Energy requirements
Track transactions
Manage subscriptions
The bot is non-custodial, and all delegations occur on-chain.
Dashboard & Account Features
Users who choose to register gain access to a personal dashboard where they can:
Track Energy purchases
View transaction history
Manage recurring usage
Monitor account activity
This is particularly useful for frequent users and businesses.
TronZap API: Energy Automation for Developers and Services
For teams building on TRON, TronZap has a dedicated TRON Energy API that expands its on-demand resource rental model beyond individual users.
The API allows developers and businesses to automate TRON Energy provisioning and further reduce USDT (TRC-20) transaction costs across high-frequency and backend-driven operations.
Programmatic Energy Management: Buy and delegate your TRON Energy within your application flows, with the ability to anticipate USDT transfers in a predictable and programmable fashion without needing to buy TRX or stake TRX for a longer period.
Secure and Developer-Friendly: API requests are authenticated via bearer-token and SHA-256 hashed signatures, securely balancing everything to cater for high volume use-cases.
Ready-to-Use Tooling: Official open-source TRON Energy SDK on GitHub for PHP, Node.js, and Python, along with a Postman collection, simplify integration and testing for wallets, DeFi platforms, payment services, and bots.
TRON Energy Subscriptions
Subscription plans: for those with predictable transaction patterns, rather than paying to rent Energy as required, get it automatically on an ongoing basis – a perfect fit for bots, wallets, and payment services.
AML Crypto Checks
TronZap AML crypto checks: identity and transaction risk checker. There are growing compliance demands in crypto, and this service will meet demands across the industry.
How TronZap Works in Practice?
TronZap operates through on-chain Energy delegation. Once TRX is paid, Energy is delegated directly to the user’s wallet for a limited period, usually one hour.
Key operational points:
Energy is temporary, not permanent
There is no TRX locking or staking requirement
Energy purchases are non-refundable, as TRX is immediately staked to generate resources
Delegation typically completes within one minute
To avoid failed transactions or unexpected fees, TronZap recommends renting 131,000 Energy when sending USDT, especially to new or inactive wallets.
Sending USDT Without Holding TRX
One practical advantage of TronZap is that people can send USDT without having to own TRX. Because Energy is delegated externally, you can use a wallet that only holds USDT to make transactions – as long as you have enough rented Energy. This removes a common friction point for people who are accustomed to using just stablecoin balances.
Cost Structure and Fee Optimization
Without Energy:
A USDT (TRC-20) transfer may cost ~13–14 TRX
With rented Energy:
The same transfer typically costs ~3 TRX
The difference becomes significant for users making frequent transfers. Rather than staking large amounts of TRX to maintain Energy, TronZap offers a more flexible, pay-as-you-go alternative.
Who Is TronZap Best Suited For?
TronZap is designed for:
Users who send USDT on TRON frequently
Businesses handling recurring TRC-20 payments
Developers building TRON-based services
Bots and automated wallets
Users seeking predictable transaction costs
It is less relevant for users who only send USDT occasionally.
Limitations and Considerations
While TronZap solves a real problem, users should understand its limitations:
Energy is time-limited and must be used promptly
Purchases are non-refundable
Incorrect Energy estimation can still lead to TRX burns
It is not a replacement for long-term staking strategies
Understanding these factors is essential for effective use.
Pros & Cons
Pros
Reduces USDT (TRC-20) transaction costs
No registration required for basic use
Telegram bot
API and SDKs for developers
Subscription options for recurring usage
AML compliance tools
24/7 live support
Cons
Energy duration is limited
Purchases are non-refundable
Requires a basic understanding of TRON resources
Less useful for infrequent transactions
Final Verdict
TronZap solves one of TRON’s biggest usability headaches: unpredictable transaction costs for USDT transfers. By wrapping Energy and Bandwidth rental into a simple on-demand service, it gives everyday users greater control over fees, without requiring them to stake or commit to longer-term use.
For frequent TRON users, TronZap is a useful infrastructure, not a speculative product. TronZap relies on optional registration, Telegram integration, and simplicity for developers.
While it wouldn’t replace staking by any means, it fills a clear niche—enabling efficient resource management to reduce the cost of USDT transfers on TRON—and does so transparently and as part of the ecosystem.
After dropping from last week’s high of $90,562 bitcoin price is now facing one of its toughest market phases in recent years. Alex Thorn, Head of Research at Galaxy Digital, the world’s largest cryptocurrency, may fall much lower in the coming weeks.
According to Alex Thorn, Bitcoin’s recent performance shows clear weakness following a big sell-off in late January. The price fell nearly 15% in one week and dropped to around $74,551, close to its April 2025 low.
This sudden crash also triggered more than $2 billion in long-position liquidations, one of the largest in Bitcoin history.
Another major concern Thorn highlighted is that Bitcoin has fallen below the average buying price of U.S. Bitcoin ETFs, which is around $84,000. ETF investors are usually long-term holders, so this drop is a negative sign.
In the last two weeks, Bitcoin ETFs saw outflows of about $2.8 billion, showing weaker confidence from big investors.
What is more concerning is that Bitcoin has failed to rise along with traditional safe-haven assets like gold and silver, which hit new ATHs. This has weakened Bitcoin’s image as a hedge against currency devaluation.
Nearly Half of Bitcoin Supply Now in Loss
Right now, Bitcoin is trading near $78,392, which is almost 38% below its all-time high of $126,296. Because of this drop, on-chain data shows that around 46% of the total Bitcoin supply is now in loss. This means nearly half of all BTC was last bought at prices higher than today.
In past bear markets like 2015, 2018, and 2022, major Bitcoin bottoms have often formed when the number of holders in profit and loss was nearly equal.
Right now, it’s moving toward that point, suggesting the market could be nearing a bottom.
Further into the analysis, Alex Thorn noted that Bitcoin has already lost an important technical level, the 50-week moving average. In past market cycles, whenever BTC breaks below this level, the price often falls toward the 200-week moving average.
Currently, the 200-week moving average is near sept 2024 low of $58,000, while Bitcoin’s realized price stands around $56,000. These levels have historically acted as strong long-term support zones, and Thorn believes BTC could test these ranges in the coming weeks or months.
And one of the biggest reasons for this to happen is the supply gap between $70,000 and $80,000, where fewer coins were bought, making support weak.
If demand doesn’t pick up, Bitcoin could first dip toward $70,000 and then possibly reach $58,000–$56,000, which are strong long-term support levels.
Never Miss a Beat in the Crypto World!
Stay ahead with breaking news, expert analysis, and real-time updates on the latest trends in Bitcoin, altcoins, DeFi, NFTs, and more.
FAQs
How low could Bitcoin price go in 2026?
Bitcoin may drop toward $56,000–$58,000 if current weakness continues, testing long-term support levels before a potential rebound.
When might Bitcoin start a bullish trend again?
A bullish trend could start once the market balances holders in profit and loss and demand returns near long-term support levels.
What does it mean that nearly half of Bitcoin supply is in loss?
It indicates about 46% of BTC was bought higher than current prices, signaling potential for reduced selling pressure and market stabilization.
How does Bitcoin compare to gold and silver now?
Bitcoin has lagged behind gold and silver gains, weakening its image as a hedge against currency devaluation.
Could Bitcoin become a safe-haven asset again?
Yes, if it stabilizes near long-term support and regains correlation with inflation hedges like gold, investor confidence may return.
The broader crypto market is attempting a cautious recovery after the recent sell-off pushed the Bitcoin price below the $75,000 mark. While sentiment across major assets remains mixed, Hyperliquid has moved in the opposite direction, maintaining a strong upward trend and outperforming the wider market.
The divergence comes as Hyperliquid breaks above a key consolidation range following the announcement of a new product update under HIP-4, which expands the platform’s trading capabilities and introduces new on-chain use cases.
HYPE price reacted swiftly to the development, climbing more than 20% on the day. The token moved decisively higher from the $30 consolidation zone to trade above $37.5, signaling renewed bullish momentum. The rally has also pushed Hyperliquid into the top 10 crypto by market capitalization, overtaking Cardano.
The price surge followed the unveiling of HIP-4, a proposal that introduces outcome-based trading on Hyperliquid. The upgrade brings prediction market–style instruments and option-like derivatives directly on-chain, marking a significant expansion beyond the platform’s core perpetual futures offering.
According to Hyperliquid, the new product structure allows traders to express market views with predefined risk, without relying on traditional liquidation mechanics. This design is seen as a step toward positioning Hyperliquid as a more comprehensive trading venue rather than a platform focused solely on perpetuals.
The announcement has been well received by the market, with traders increasingly viewing HIP-4 as a milestone in Hyperliquid’s evolution toward a full-spectrum DeFi trading hub.
Why the Update Matters
The HIP-4 upgrade strengthens the longer-term narrative around platform diversification and potential revenue stability. By introducing outcome-based instruments, Hyperliquid opens the door to new liquidity sources and user segments, including more sophisticated traders seeking structured, on-chain exposure.
Market participants are now closely watching whether adoption of the new trading format translates into sustained volume growth and deeper network effects. If participation follows product expansion, demand for HYPE could remain supported beyond the initial reaction.
For now, Hyperliquid’s ability to rally against a fragile market backdrop highlights the impact of protocol-specific catalysts, as traders rotate toward assets showing both technical strength and clear fundamental developments.
Hyperliquid Price Analysis: Will HYPE Reach $50?
As mentioned earlier, HYPE has maintained a strong upward trend, defying broader market sentiment and outperforming several top cryptocurrencies. Despite only a modest rise in trading volume, buying pressure has been strong enough to lift the price out of its consolidation range near $30 and push it above $37.
The move allowed HYPE to break through the key $35–$36 resistance zone. With that level cleared, the token is now testing its next major technical barrier—the 200-day moving average near $38.01. The focus now shifts to whether this resistance can flip into support, a development that could strengthen the bullish structure and open the door for a move toward the $50 level.
HYPE is finally showing some life after a long corrective phase. Price has bounced strongly from the $28–30 demand zone and is now pushing into the $35–37 resistance area, which earlier acted as a key support before the breakdown. This zone also lines up closely with the 200-day SMA near $38, making it a crucial level to watch. The recent move is backed by better volume and a positive shift in CMF, hinting that buyers are slowly stepping back in, rather than this being a random spike.
If HYPE manages to hold above $35–36, the recovery can extend toward $43 in the near term, followed by a bigger test around $48–50, where strong selling pressure is likely. However, rejection from this zone could send the price back toward $30, and if that fails, $26–28 comes back into focus. Momentum is improving, but the real trend shift only confirms above the 200-day average.
Bottom line: Can the HYPE Price Reach $50 in February 2026?
Hyperliquid’s latest rally has drawn comparisons to the market response following the HIP-3 update, which marked one of the protocol’s earlier major product milestones. After HIP-3 was rolled out, HYPE saw a sustained price expansion, rising from the low-$20 range to above $30 over the following weeks, a move of roughly 40%–45%, supported by rising platform activity and visibility rather than a short-lived speculative spike.
If HIP-4 gains traction similar to HIP-3, increased participation and liquidity could make the current rally more durable rather than just a short-term spike. With this, the possibility of surpassing $50 could be more realistic, paving the way for a new ATH this month.
FAQs
Why is Hyperliquid (HYPE) price up today?
HYPE jumped after the HIP-4 product update expanded on-chain trading features, attracting buyers despite weakness in the broader crypto market.
What is the Hyperliquid HIP-4 upgrade?
HIP-4 introduces outcome-based and option-style on-chain trading, expanding Hyperliquid beyond perpetual futures into a broader DeFi trading hub.
Is Hyperliquid outperforming the broader crypto market?
Yes. HYPE has risen over 20% and entered the top 10 by market cap, outperforming major tokens during a fragile market recovery.
The live price of the Cardano token is $ 0.29777966.
Price prediction suggests potential to reach $2.75 to $3.25 by year-end 2026.
Long-term forecasts indicate ADA could hit $10.25 by 2030.
The Cardano price prediction 2026 is generating significant buzz in the crypto market, as the last quarter is soon to close in few days, boosting interest for the next altcoin. The 2025 for ADA/USD began with numerous fundamental updates strengthening its future, including the transformative Plomin Hard Fork, but 2026 seems even more constructive.
Now, Questions abound: “Will Cardano spearhead the altcoin movement?” and “What heights can ADA reach by 2050?” Explore this Cardano price prediction 2026 and beyond, filled with expert insights and ambitious forecasts.
Coinpedia’s Cardano Price Prediction
The Cardano price outlook 2026 is shaped by its remarkable 4,000% surge in 2020, currently resting at a similar support level. If market sentiment improves, even a modest increase could trigger a potential 1,000% rise to around $4.50.
A more conservative target of $1.40 suggests a 300% gain based on current trends. Analysts are optimistic that ETF approvals could enhance institutional adoption and stability, with price projections ranging from $2.05 to $2.80.
The ADA price action is currently in an intense sell-off, but in early February, it found an old demand area, and new demand could form here, taking it to new heights. Also, a falling wedge’s lower border acts as support, suggesting the nearest spike could occur, and the ADA price might hit $0.60 in February.
Cardano AI Price Prediction For February 2026
Source
Low Price
Average Price
High Price
Gemini
$0.85 – $0.95
$1.00 – $1.20
$1.30 – $1.50+
BlackBox
$0.65
$1.00
$1.50
ChatGPT
$0.75
$0.95
$1.25
ADA Price Prediction 2026
The Cardano price forecast for 2026 points to an important support level on its weekly chart, a range that has consistently acted as a strong pivot point for price trends, and is currently giving off signals of another potential rally. This support level is known for displaying remarkable resilience over time, suggesting that if Cardano price USD can maintain its position above this threshold once again, it could pave the way for significant price movements in 2026.
Looking back at Cardano’s historical performance on the weekly chart, it shows an extraordinary rally in 2020, when the asset posted staggering gains of nearly 4,000%. During that bullish phase, the Cardano price USD spent an extended period consolidating around the dynamic support trendline, which appears to be a strategic accumulation at discounts from smart money, contributing significantly to its eventual surge.
If the current market sentiment shifts positively, a resurgence in investor confidence could lead to a recovery. Not ambitiously, even modestly, past performance could give a tremendous surge. Last year’s performance was 4000%. If we assume 1/4 of that momentum, it would result in an increase of approximately 1000%, potentially elevating Cardano’s price to $4.50 by 2026.
Conversely, a more conservative approach suggests a realistic price target of around $1.40, indicating a potential increase of about 300%. This estimate remains feasible, especially since it is based on fundamental analyses and market trends that are not reliant on speculative triggers, such as the possible approval of exchange-traded funds (ETFs).
Additionally, many experts propose that these ETFs could significantly impact the market by boosting institutional investment and improving market stability. In a situation where ETF approvals occur and retail investor excitement rises, Cardano’s price could realistically range from $2.05 to $2.80.
Scenario
Potential Low
Average Price
Potential High
Without ETF Approval
$0.85
$1.10
$1.25
With ETF Approval + Retail Surge
$1.20
$1.65
$2.05
Bullish Breakout (with ETF & macro support)
$1.50
$2.05
$2.80
Cardano On-chain Analysis
As per Cardano’s on-chain metrics, “Smart Money” accumulation phase is the best observation right now, because the divergence between retail and institutional holders is more vivid than ever.
As the number of addresses holding between 10 and 1 million ADA is declining, and the consistent surge in the 10 million to 100 million coin bracket confirms this, this represents a major supply consolidation. The observation shows that these mega-whales are strategically absorbing the “weak hands” during price dips, effectively building a rock-solid fundamental floor for the asset. Also, the fact that the 1M to 10M coin bracket is also growing confirms that professional high-net-worth investors seem to be positioning for a recovery, too.
Similarly, the surge to 4.57 million total holders despite a grueling 2025 proves that Cardano’s ecosystem is expanding its reach even in a “stress test” environment. This growth in the holder base suggests that the asset is not being abandoned; rather, it is being redistributed into a more stable, long-term foundation. When a holder count rises as prices fall, it signals that the market views current levels as a deep-value opportunity rather than a reason to exit.
Additionally, the Weighted Sentiment flipping the 0 line to 0.656 is a crucial momentum trigger. Professionally, this “0-line flip” indicates that the aggregate social and market bias has shifted from fear to optimism.
Combined with the strategic whale accumulation, this sentiment pivot suggests that the “disbelief” phase is ending and that a bullish rally is likely once the remaining retail sell pressure is fully absorbed by the growing whale cohorts.
Cardano (ADA) Price Prediction 2026 – 2030
Price Prediction
Potential Low ($)
Average Price ($)
Potential High ($)
2026
2.75
3.00
3.25
2027
4.50
4.75
5.00
2028
5.25
5.50
5.75
2029
6.75
7.25
7.75
2030
9.00
9.75
10.25
This table, based on historical movements, shows ADA prices to reach $10.25 by 2030 based on compounding market cap each year. This table provides a framework for understanding the potential Cardano price movements. Yet, the actual price will depend on a combination of market dynamics, investor behavior, and external factors influencing the cryptocurrency landscape.
Based on the historic market sentiments and trend analysis of the altcoin, here are the possible Cardano price targets for the longer time frames.
Market Analysis
Firm Name
2025
2026
2030
Changelly
$0.752
$1.18
$6.05
Coincodex
$0.79
$0.53
$0.89
Binance
$0.79
$0.83
$1.01
*The aforementioned targets are the average targets set by the respective firms.
Coinpedia’s Price Analysis provides you with the latest content on the recent market trend that enables you to get closer to the price movements & actions of the various cryptocurrencies.
Never Miss a Beat in the Crypto World!
Stay ahead with breaking news, expert analysis, and real-time updates on the latest trends in Bitcoin, altcoins, DeFi, NFTs, and more.
FAQs
What is Cardano’s (ADA) price prediction for 2026?
Cardano could trade between $2.75 and $3.25 in 2026 if market sentiment improves, adoption grows, and key support levels hold.
Is Cardano a good long-term investment?
Cardano is considered a long-term project due to its research-driven development, scalability upgrades, and focus on decentralization.
What factors could drive ADA’s price higher in the future?
ETF approval, institutional adoption, network upgrades, and improved macro conditions could all positively impact ADA’s price.
Where will ADA be in 5 years?
In five years, ADA could trade between $7 and $10 if Cardano adoption grows, scalability improves, and the crypto market enters a strong cycle.
What will Cardano be worth in 2030?
By 2030, Cardano could be valued around $9 to $10 based on long-term growth, network usage, and sustained investor confidence.
XRP price currently stands at $2.99, with a market capitalization of $179.79 billion. Analysts and AI forecasts alike suggest that XRP could reach $5.05 by the end of 2025. Long-term XRP price predictions also place it as high as $26.50 by 2030, with an ultra-bullish target of $526 by 2050.
Ripple (XRP) remains one of the top five crypto assets in the world, gaining traction as institutional adoption ramps up and its prolonged legal battle approaches resolution. Since President Trump’s return to office, XRP has seen a resurgence in on-chain activity, investor sentiment, and even XRP ETF approved turned it into a bluechip asset.
Now, making this the most ideal time for XRP price prediction 2026-2030 to be in more focus. Read this to know in depth what’s coming next in XRP.
XRP/USD is in a bearish trend, approaching the $1.40 support level. If it doesn’t reverse, a drop to $0.92 may occur. A Q1 reversal is needed, with $2.40 as key resistance to retest the ATH of $3.66. For XRP to reach a new ATH by year-end, it must close above $3.66.
XRP February Outlook
In January, it peaked at $2.40 but has fallen since, and in February, it even breached $1.81 support, indicating that bears are dominant, with the next support at $1.40. If it takes support at $1.40 and recovers, its new resistance levels are $1.81 and $2.00.
XRP Price Prediction 2026
On the monthly chart, XRP price exhibits a notably bullish outlook, characterized by a double bottom pattern and a Fibonacci 0.50 retracement that indicates a strong accumulation phase occurred in 2025. This setup suggests that once a rally commences, the all-time high (ATH) could merely be the beginning, with targets potentially reaching $9 and even $13, primarily driven by its utility.
Conversely, the weekly chart presents a bearish picture, as XRP/USD has breached $1.81 level and is approaching $1.40 support 1 in early February.
Should it fail to execute a reversal from this level, a decline towards $0.92 (Support 2) could ensue.
However, if we observe a reversal in Q1, flipping the resistance at $2.40 will be essential to enhance the probability of XRP attempting to retest its ATH of $3.66. For the year to conclude with a new ATH, it is imperative that XRP break above $3.66 and secure a weekly close over this level.
Year
Potential Low
Potential Average
Potential High
2026
$1.75
$3.45
$5.05
XRP Price Predictions for January 2026 by AI platforms
Platform
Low Price
Average Price
High Price
Claude
$3.00 – $3.15
$3.50 – $4.00
$7.50 – $8.20
Blackbox
$2.50
$3.50
$5.00
Gemini
$3.00 – $4.00
$4.50 – $6.00
$6.50 – $8.00+
XRP Onchain Outlook
The XRP Ledger: DEX Transaction Count chart indicates a significant bullish divergence starting from May 2025. While the price is consolidating, the activity in decentralised exchanges (DEX) is increasing sharply.
The high transaction volume, which includes both orders placed and cancelled, shows that experienced traders are actively positioning themselves and adding liquidity in anticipation of a future price movement.
As a result, this on-chain metric suggests that the market is preparing for a powerful and sustainable rally in the XRP price ahead.
Also, the biggest fact right now in December is that altcoin liquidity is drying up. Projects securing new liquidity channels like ETFs have a better chance of long-term survival, and since November 14th, the XRP ETF has been seeing positive inflows consistently, despite what price action is, and so far, Cumulative Total Net Inflow has crossed $756 million, while total net assets are worth $723.05 million, by December 1st.
Ripple XRP Price Prediction 2026 – 2030
Year
Potential Low ($)
Potential Average ($)
Potential High ($)
XRP Price Prediction 2026
5.50
6.25
8.50
Ripple Price Prediction 2027
7.00
9.0
13.25
XRP Price Prediction 2028
11.25
13.75
16.00
XRP Price Prediction 2029
14.25
16.50
21.50
XRP Price Prediction 2030
17.00
19.75
26.50
This table, based on historical movements, shows XRP price prediction 2030 to reach $26.50 based on compounding market cap each year. This table provides a framework for understanding the potential XRP price movements. Yet, the actual price will depend on a combination of market dynamics, investor behavior, and external factors influencing the cryptocurrency landscape.
Based on historic price sentiments and XRP’s rising popularity, here are the XRP future price projections beyond 2030, where Ripple price forecasts suggest that it has become more speculative. Therefore, assuming continued adoption and dominance, XRP may see aggressive valuations in the decades ahead.
Year
Potential Low ($)
Potential Average ($)
Potential High ($)
2031
25.00
29.50
35.25
2032
31.50
36.75
41.25
2033
35.75
42.25
47.75
2040
97.50
135.50
179.00
2050
219.25
331.50
526.00
A look at this table, highlights the XRP price prediction 2040 and XRP price prediction 2050 potential high ambitious targets but this reflect a transformative vision for XRP as a dominant global payment player.
Market Analysis
Firm Name
2025
2026
2030
Changelly
$2.05
$3.49
$17.76
Coincodex
$2.38
$1.83
$1.66
Binance
$2.16
$2.27
$2.76
Never Miss a Beat in the Crypto World!
Stay ahead with breaking news, expert analysis, and real-time updates on the latest trends in Bitcoin, altcoins, DeFi, NFTs, and more.
FAQs
What will XRP be in 2026 price prediction?
XRP price predictions for 2026 range between $3.45 and $5.05, depending on ETF inflows, market sentiment, and sustained demand above key levels.
What will XRP be worth in 2030?
By 2030, XRP forecasts suggest a potential range of $17 to $26.50 if adoption grows and Ripple maintains its role in global payments.
How much will 1 XRP be worth in 2040?
Long-term projections estimate XRP could trade between $97 and $179 by 2040, assuming continued network usage and institutional integration.
Is XRP a good investment going into 2026?
XRP’s outlook for 2026 depends on ETF inflows, broader crypto sentiment, and its ability to hold key support levels above $2.
Bitcoin is currently trading at: $ 78,411.71255218
Predictions suggest BTC to hit $150K to $250K before 2026 ends.
Long-term forecasts estimate BTC prices could hit $900K by 2030.
The Bitcoin price prediction 2026 is becoming increasingly bullish as the 2025’s second half comes to a close soon, with all-time highs of $125K reached this year as the highest point.
As a wave of bullish momentum sweeps into the market, investors and traders are intrigued by its next stop.
The year was marked by optimism, driven by massive inflows into spot Bitcoin ETFs, skyrocketing institutional adoption, clearer regulations, and unwavering political support. There were several macro downturns, too, that capped BTC’s uptrend, like trade tariffs and wars.
Despite that, BTC holds its level, making it now seen as “a hedge against inflation” more than ever. Major players, including MicroStrategy, Metaplanet, and several other entities, are boldly adding BTC to their balance sheets, signaling unshakable adoption and confidence in its future.
The market enthusiasm is at a fever pitch, investors are buzzing with questions: “Can Bitcoin sustain its meteoric rise?” and “Will it redefine the financial landscape in the next five years?” This Bitcoin price prediction 2026 – 2030 dives deep into the trends driving this historic rally. Read on for the full scoop.
Coinpedia’s BTC Price Prediction 2026
In early February, BTC dropped below $74,420, signaling potential further decline. A recovery may face resistance at the 200-day and 50-day EMAs. Breaching these could allow for an uptrend; failing to do so might lead to a downtrend.
What is the Bitcoin price prediction for today?
The BTC price may range between $74,844.86 and $79,258.61 today.
Since late November 2025, consolidation has mainly been within a tight range of $84800-$94500. But this consolidation seems like a big accumulation phase and has been happening near a multi-year trendline support, which feels very optimistic but also gives chills, as this range has built a lot of suspense in the market, too.
But, like the fall was feared, it happened exactly in the starting days of February, it fell to $74420, which is now a very vulnerable state; another bearish move could extend the crash further. But, if it reverses, then $85K could be an important resistance followed by another resistance at $89K.
Bitcoin Price Prediction 2026
In early February, the BTC price broke the ascending wedge support and dropped to $74420. This confirms the breakdown of this pattern and suggests a further decline is still a possibility if it fails to sustain $74420, but if it makes a comeback hereonward, then the 200-day and 50-day EMA bands are two major dynamic resistance areas. If it breaches this, then an uptrend may have another chance; otherwise, this bull cycle may end, and a downtrend may extend.
Month
Potential Low
Potential Average
Potential High
2026
$80,000-$95,000
$100,000 – $108,000
$115,000 – $118,000
Bitcoin (BTC) Price Prediction January 2026: What AI Platforms Project?
Source / Platform
Low Price (USD)
Average Price (USD)
High Price (USD)
Gemini (AI-assisted)
$110,000 – $125,000
$130,000 – $150,000
$160,000 – $180,000+
ChatGPT (OpenAI)
$92,000
$117,000
$138,000
BlackBox AI
$100,000
$125,000
$150,000
Bitcoin Price Onchain Outlook
The on-chain data has showed strong accumulation in 2025 and sustained declines in exchange reserves. Crucially, this confirms the elevated institutional commitment, which is evident even in the US Spot ETFs data figures and the corporate adoption also reinforces this trend, with public company holdings nearly doubling since the start of the year.
Ultimately, a Bitcoin price prediction 2025 suggests that the future potential depends strictly on how sustained buying demand remains, as well as geopolitical stability and regulatory clarity.
If the current bullish sentiment persists, the BTC price is expected to reach a cycle high target of $150,000. Conversely, should global uncertainty intensify and sentiment turn negative, the downside risk is projected to find strong support around the $70,000 mark.
The BTC price range in 2026 is expected to be between $150K and $230K.
BTC Price Prediction 2027
Subsequently, the Bitcoin price range can be between $170K to $330K during the year 2027.
Bitcoin Predictions 2028
With the next Bitcoin halving, the price will see another bullish spark in 2028. Specifically, as per our Bitcoin Price Prediction, the potential BTC price range in 2028 is $200K to $450K.
BTC Price 2029
Thereafter, the BTC price for the year 2029 could range between $275K and $640K.
Bitcoin Price Prediction 2030
Finally, in 2030, the price of Bitcoin is predicted to maintain a positive trend. Indeed, the BTC price is expected to reach a new all-time high, ranging between $380K and $900K.
Based on the historic market sentiments and trend analysis of the largest cryptocurrency by market capitalization, here are the possible Bitcoin price targets for the longer time frames.
Year
Potential Low ($)
Potential Average ($)
Potential High ($)
2031
$540,830.43
$901,383.47
$1,261,936.86
2032
$757,162.60
$1,261,936.86
$1,766,711.60
2033
$1,059,945.80
$1,766,711.60
$2,473,477.75
2040
$5,799,454.28
$9,665,757.13
$13,532,059.98
2050
$161,978,188.65
$269,963,647.74
$377,949,106.84
Bitcoin Prediction: Analysts and Influencers’ BTC Price Target
As per the Bitcoin price forecast by Blockware Solutions, the price of 1 BTC could hit $400,000
Cathie Wood predicts the price of BTC to achieve the $3.8 million mark by 2030.
Michael Saylor-led MicroStrategy expects Bitcoin to soar beyond $13 million by 2045.
ARK Invest has increased its bullish BTC price target to $2.4 million by 2030.
Never Miss a Beat in the Crypto World!
Stay ahead with breaking news, expert analysis, and real-time updates on the latest trends in Bitcoin, altcoins, DeFi, NFTs, and more.
FAQs
What are the biggest risks to Bitcoin’s price in 2026?
Major risks include global recessions, tighter crypto regulations, declining liquidity, or a sustained breakdown below key support levels.
How much will BTC be worth in 2030?
Bitcoin price forecasts for 2030 range from $380K to $900K, driven by scarcity, long-term adoption, and expanding institutional participation.
What will be the price of Bitcoin in 2050?
While uncertain, many long-term projections suggest Bitcoin could exceed $1 million by 2050 if it becomes a global store of value.
Is Bitcoin still a good hedge against inflation in the long term?
Bitcoin’s fixed supply makes it attractive as an inflation hedge, especially during currency debasement and long-term economic uncertainty.
Price predictions for 2026 range from $0.60 to $4.00.
JUP could extend toward $10 by 2030, if the recovery structure holds.
Jupiter (JUP), a leading liquidity aggregation protocol within the Solana ecosystem, enters February at a point where fundamentals and technicals are beginning to converge. On the fundamental side, Jupiter continues to remain a core piece of Solana’s on-chain trading infrastructure, maintaining relevance even as broader market participation cooled. On the technical side, JUP’s price action has shifted noticeably over recent months from persistent decline to a more controlled, range-bound phase.
After an extended post-launch correction, the token is no longer experiencing aggressive sell-offs. Instead, price volatility has compressed, and reactions around key demand zones have become more consistent. This combination often reflects a market transitioning from distribution into accumulation. As February begins, attention is now focused on whether JUP can sustain this stabilization phase and begin laying the groundwork for a longer-term recovery cycle extending into 2026 and beyond.
February is shaping up to be a confirmation month rather than a breakout month for Jupiter. Current price behavior suggests that the market is prioritizing balance, with buyers and sellers testing levels without committing to large directional bets. If JUP continues to hold above its recent demand zone, February could reinforce the view that downside risk is diminishing.
This type of behavior is often seen before broader trend development, even if price remains visually unimpressive in the short term. However, if price loses support decisively during February, it would likely extend the consolidation phase rather than trigger a fresh collapse. At this stage, the technical bias favors range continuation with improving stability, not renewed distribution. By the end of this month, JUP may cross the next hurdle of $0.4000.
Jupiter (JUP) Price Prediction 2026
Looking ahead, 2026 appears to be a structural transition year for Jupiter, rather than a year of immediate price euphoria. The prolonged consolidation seen so far suggests that speculative excess has largely been absorbed, allowing price to begin rebuilding from a more stable foundation.
In the first half of 2026, JUP is likely to continue oscillating within a broad range as long-term participants accumulate and short-term traders test resistance levels. This phase is crucial, as it determines whether Jupiter can convert prior resistance into sustainable support. If JUP manages to reclaim higher levels and hold above key breakout zones later in the year, price could begin transitioning into an early expansion phase. This would likely unfold gradually, marked by higher lows and improving trend structure rather than sharp vertical moves. By the end of 2026, Jupiter price may reach a potential high of $4.00.
Jupiter Crypto Price Prediction 2026 – 2030
Year
Potential Low ($)
Potential Average ($
Potential High ($)
2026
0.60
1.60
4.00
2027
1.70
3.60
5.00
2028
2.50
4.50
6.80
2029
3.50
6.20
8.50
2030
4.00
7.50
10.00
Jupiter Price Prediction 2026
The Jupiter price range in 2026 is expected to be between $0.60 and $4.00.
Jupiter Crypto Forecast 2027
Jupiter (JUP) price range can be between $1.70 to $5.00 during the year 2027.
Jupiter Token Price Outlook 2028
In 2028, Jupiter price is forecasted to potentially reach a low price of $2.50 and a high price of $6.80.
Jupiter Coin Future Prediction 2029
Thereafter, the Jupiter (JUP) price for the year 2029 could range between $3.50 and $8.50.
Jupiter Price Prediction 2030
Finally, in 2030, the price of Jupiter is predicted to maintain a steady positive. It may trade between $4.00 and $10.00.
Based on the historic data and trend analysis of the cryptocurrency along with the market sentiments, here are the possible Jupiter price targets for the longer time frames.
Year
Potential Low ($)
Potential Average ($)
Potential High ($)
2031
480
8.50
11.90
2032
5.60
10.00
13.80
2033
6.40
11.30
15.60
2040
9.50
17.20
25.00
2050
14.00
26.00
40.00
Jupiter (JUP) Price Prediction: Market Analysis?
Year
2026
2027
2030
Changelly
$2.00
$4.30
$8.00
CoinCodex
$2.80
$5.00
$8.20
WalletInvestor
$4.00
$6.00
$12
CoinPedia’s Jupiter Price Prediction
Coinpedia’s price prediction indicates that Jupiter is currently transitioning from a prolonged corrective phase into early-stage accumulation. If JUP maintains stability above its demand zones and gradually reclaims resistance levels, we expect the token to trade toward $3+ during 2026, with the potential to reach the $4–$10 range by 2030 under sustained market expansion.
Year
Potential Low ($)
Potential Average ($)
Potential High ($)
2026
0.60
1.60
4.00
Never Miss a Beat in the Crypto World!
Stay ahead with breaking news, expert analysis, and real-time updates on the latest trends in Bitcoin, altcoins, DeFi, NFTs, and more.
FAQs
What is Jupiter (JUP) and why is it important in the Solana ecosystem?
Jupiter is Solana’s leading liquidity aggregator, helping traders get the best swap prices by routing trades across multiple on-chain venues efficiently.
What is the price prediction for Jupiter (JUP) in 2026?
Jupiter’s 2026 price is projected to range between $0.60 and $4.00, depending on market conditions and its ability to hold long-term support.
What is the Jupiter (JUP) price prediction for 2030?
By 2030, Jupiter could trade between $4.00 and $10.00 if Solana adoption grows and JUP maintains its role in on-chain liquidity.
What is the Jupiter (JUP) price prediction for 2040?
Long-term projections suggest Jupiter may reach up to $25 by 2040, assuming sustained ecosystem relevance and broader crypto market expansion.
Is Jupiter (JUP) coin a good investment?
Jupiter can appeal long-term if Solana usage grows and liquidity demand rises, but like all crypto, it carries risk and requires careful research.
Crypto prices today saw modest gains after a violent weekend sell-off cooled, offering the first signs of stabilization following days of forced deleveraging. Bitcoin was trading at $78,465 at press time, up 5.2% over the past 24 hours. The broader…
Hyperliquid has launched Outcome Trading testnet, introducing fully funded contracts for prediction markets and event-based trading. Hyperliquid announced on Feb. 2 that it has launched “Outcome Trading” on its testnet under Hyperliquid Improvement Proposal 4. The new feature allows users…
Tether first announced plans for an open-source mining OS in June last year, aiming to let Bitcoin miners “enter the game” without relying on expensive third-party vendors.
Ether has fallen despite strong fundamentals as leverage remained absent and precious metals diverted risk appetite, according to Fundstrat's research head.
The reported World Liberty Financial deal, said to have been made four days before the president’s inauguration, would make the UAE company the largest shareholder in WLFI.
Multiple charts and historical data suggest Bitcoin’s recovery from its weekend crash below $75,000 could take several months, rather than producing a quick rebound.
The rise and fall of the manufacturing index from mid-2020 through 2023 broadly tracked movements in Bitcoin and the wider crypto market over the same period.
Tether has open-sourced its Bitcoin mining operating system, aiming to make mining operations easier and more accessible for operators of all sizes. The announcement was made by Tether chief executive officer Paolo Ardoino on Feb. 3, who said the company’s…
Bitcoin flashed a major discount signal after capital outflows increased following BTC’s abrupt drop below $75,000. Historical data now points to a potential 10% rebound rally in the short-term.
The meeting came more than two weeks after the Senate Banking Committee postponed a markup on the CLARITY Act, with stablecoin yield among several unresolved issues.
Bitcoin's recent price decline has prompted renewed discussion among market analysts about the potential for an extended downturn in cryptocurrency markets, according to statements from industry observers.
Vanguard Group CEO Salim Ramji called the initiative a "fabulous concept" and praised its underlying ethos. But some critics point to several potential drawbacks
With over 16 million users now migrated to Mainnet, Pi Network is pushing forward with key improvements that will unblock millions for migration and KYC submissions.
The blockchain security auditor said violence against wallet holders has become a “core threat vector in the crypto ecosystem,” marking a sharp rise from 2024.
Bullish traders finally showed up to buy the dip in Bitcoin and altcoins as they fell to new 2026 lows, but selling at the intraday range highs may prove that the market correction is far from over.
Five New York officials reportedly argued that the GENIUS Act could reduce incentives for stablecoin issuers to cooperate with law enforcement, potentially allowing criminal misuse.
The XRP price token crashed to its lowest level since October last year; tehcnicals points to more downside, possibly to the key support level at $1 in the near term.
BTC price fell sharply to $74,500 over the weekend following a sudden escalation in geopolitical tensions and a sharp rally in the US dollar. The violent move was cruelly responsible for erasing billions in market value, triggering forced liquidations and exposing fragile leverage across crypto markets as risk appetite abruptly vanished.
BTC Price Breakdown Fueled by a Liquidity Shock
The weekend sell-off marked one of the most aggressive downside moves in recent months and as experts hoped for a positive Q1 2026 it didn’t went as planned. As thin liquidity conditions amplified volatility as Bitcoin became a source of immediate liquidity rather than a defensive asset. Contrary to safe-haven expectations, BTC price USD moved in tandem with risk assets like ETH, XRP, and others as traders rushed to reduce exposure.
At the same time, President Donald Trump’s anger over the current Fed chair, Jerome Powell, led to the nomination of Kevin Warsh to the Federal Reserve, which further strengthened the dollar. This surge cruelly pressured traditional hedges as well, with gold and silver experiencing sharp declines post news. In light of this news, automated sell orders cascaded across crypto assets, accelerating the downside.
From a BTC price chart perspective, the speed of the drop suggested forced selling rather than discretionary exits, with leveraged long positions bearing the brunt of the move.
Retail Distribution vs Whale Accumulation
Beyond price action, on-chain data presents a more complex picture. Santiment metrics indicate that retail wallets holding fewer than 1,000 BTC were responsible for the crash as they have been steadily reducing exposure for over a month. This persistent selling aligns with fear-driven behavior often observed during sharp drawdowns.
Meanwhile, larger holders tell a different story. Wallets holding between 1,000 and 10,000 BTC have continued accumulating during the decline. This divergence suggests that while sentiment among smaller participants has deteriorated, but larger investors may be treating the drawdown as a rebalancing phase rather than an exit signal.
That said, this accumulation has not yet translated into visible price support, highlighting the scale of selling pressure still present from retailers.
Derivatives Market Shows a Forced Reset
From a derivatives standpoint, the BTC crypto market has undergone a rapid reset. CryptoQuant data shows open interest collapsing from nearly $47.5 billion in late 2025 to roughly $24.6 billion, a drawdown of almost 50%. This signals the near-total removal of speculative leverage that previously supported higher prices.
Funding rates further confirm the shift. Rates plunged deep into negative territory, reaching levels not seen since September 2024. A reading near -0.008 reflects aggressive short positioning and the complete loss of short-term bullish control.
Meanwhile, the Coinbase Premium Index has remained deeply negative. This suggests that US-based institutional and professional traders continue to lead the selling pressure, reinforcing the lack of domestic demand.
Miner Capitulation Adds Structural Pressure
Still, pressure has not been confined to traders alone. The Bitcoin network has seen an estimated 30% drop in hashrate, pointing to meaningful miner capitulation. Rising miner outflows indicate a transition from holding mined BTC to active liquidation.
From a structural angle, miner selling typically accompanies periods of margin stress and declining profitability. While painful, these phases often coincide with broader market resets rather than trend continuation.
The crypto market has turned green over the last 24 hours, offering some relief after a sharp sell-off earlier this week. Total market value has climbed back to around $2.66 trillion, while sentiment remains careful, with the Fear and Greed Index still deep in “extreme fear” territory.
Bitcoin Finds Support Above $75,000
Bitcoin is trading near $78,700, staying above the $75,000 level, which many analysts see as a weekly support. This zone was tested recently, and so far, buyers have managed to defend it.
On the weekly chart, Bitcoin has slipped below both the 20-week and 50-week moving averages, which is typically a bearish signal. However, this does not automatically mean a long-term bear market. It can also happen after a heavy correction.
One possible scenario is that $75,000 becomes the bottom, with Bitcoin holding the April 2025 low and forming a higher low. If that happens, the broader uptrend of higher highs and higher lows would remain intact, and the recent drop would be seen as a pullback rather than a trend break.
For a stronger bullish signal, Bitcoin would need to reclaim and close above the 50-week moving average, currently near $100,400. A clean weekly close above that level would suggest momentum has shifted back in favor of buyers.
Ethereum Holds Near Important Levels
Ethereum has rebounded to around $2,370, after recently trading near levels that some analysts had flagged months in advance as potential support. Activity on the Ethereum network is reportedly picking up, with increased on-chain usage as traditional financial players continue building infrastructure.
While Ethereum is still down significantly from recent highs, the current bounce has raised hopes that a short-term bottom may be forming if prices can hold above the $2,300–$2,400 zone.
XRP Shows Strong Support
XRP is trading around $1.64, with strong demand seen between $1.60 and $1.65. This area has been tested multiple times, and buyers continue to step in, suggesting a solid base is forming.
If this support holds, analysts say XRP could attempt a move back toward $2.00, with $3.00 or higher possible over time if overall market conditions improve.
What’s Driving the Market Mood?
Recent selling pressure was fueled by ETF outflows, signaling institutional investors were reducing exposure. A hotter-than-expected inflation report and uncertainty around US monetary policy also weighed on risk assets.
However, some market watchers believe the worst may be over. Veteran strategist Tom Lee has said crypto may have just bottomed, pointing to a rare alignment of time and price targets, along with rising activity on Ethereum.
The current Ethereum price is within a long-term five-year range and positioned below key volume levels, increasing the probability of a rotation toward $950.
BlockDAG is entering its final presale hours at a fixed price of $0.0005, with only 400 million coins remaining before public trading begins. Backed by a $453 million presale and a $0.05 launch target, the window for early entry is…
Ripple has received full approval for an Electronic Money Institution (EMI) license in the European Union, following authorization from Luxembourg’s financial regulator, the Commission de Surveillance du Secteur Financier (CSSF).
The approval comes after Ripple met all regulatory conditions set by the CSSF. The company had announced preliminary clearance for the license last month, with full approval now allowing it to operate as an EMI across the EU.
With the license in place, Ripple can formally expand its payments-related services across European markets under EU regulatory rules. The move strengthens the company’s ability to work with banks, payment providers, and other financial institutions that require regulated electronic money services.
Ripple’s Europe-focused leadership said the authorization reinforces the company’s long-term commitment to the region and positions it to support businesses moving toward digital and blockchain-based payment infrastructure within a regulated framework.
The Luxembourg approval adds to Ripple’s growing list of regulatory clearances globally. In January, the company also secured an EMI license and cryptoasset registration from the Financial Conduct Authority in the United Kingdom.
According to Ripple, it now holds more than 75 regulatory licenses worldwide, reflecting its focus on operating within established regulatory systems as digital asset adoption grows. The expanded licensing footprint is expected to support Ripple’s efforts to offer compliant cross-border payment and digital asset services to institutional clients across multiple jurisdictions.
The development comes as European regulators continue to implement clearer frameworks for digital finance, with companies increasingly seeking regulated status to operate across the bloc.
“I can now share that we have fulfilled the conditions set by the CSSF, resulting in Ripple being granted its full EU EMI license – a transformative milestone that allows us to scale our mission of providing robust, compliant blockchain infrastructure to clients across the EU,” Cassie Craddock of Ripple said.
HBAR price is trading near $0.09418 as bearish pressure continues across the broader altcoin market. Despite the drawdown, on-chain signals tied to development activity and real-world asset focus suggest Hedera is retaining underlying demand, offering context for why the HBAR price has avoided a deeper unwind so far.
HBAR Price Finds Support Amid Persistent Market Pressure
At the surface level, HBAR crypto appears to be moving with the market’s broader risk-off tone. Selling pressure has persisted, and price has yet to establish a decisive recovery trend. However, unlike many comparable altcoins, HBAR price USD has spent more time consolidating than accelerating lower.
This relative stability stands out. While price momentum remains cautious, the absence of aggressive capitulation hints that sellers are meeting steady demand, particularly near established support zones.
Meanwhile, market participation metrics suggest interest has not meaningfully deteriorated, even as price continues to grind lower.
Development Activity Offers Structural Support
One of the clearest differentiators for Hedera remains its ecosystem activity. Santiment data tracking the top ten real-world asset-focused networks by 30-day GitHub development activity places Hedera near the top of the list. This positioning highlights sustained engineering momentum rather than short-term narrative cycles.
At the same time, Santiment data reinforces this view. Since January, Hedera’s development activity has remained elevated, recently registering around 234. Notably, this strength has persisted even as price declined, signaling a disconnect between market valuation and underlying network work.
Social volume has also increased over the same period. Still, unlike speculative spikes, this rise has occurred alongside falling prices, suggesting discussion has leaned analytical rather than euphoric.
Enterprise Narrative Continues to Anchor Hedera
From a structural perspective, Hedera’s enterprise-first design continues to define its appeal. The network’s governance model, low transaction costs, and fast finality are tailored to regulated use cases, particularly in financial and real-world asset contexts.
Ongoing upgrades and collaborations with large institutions also reinforce this positioning. That backdrop helps explain why HBAR price has shown resilience during periods when speculative demand across altcoins has faded.
Rather than chasing momentum, Hedera crypto appears to be retaining relevance through utility-driven participation.
HBAR Price Chart Signals Compression, Not Capitulation
From a technical perspective, on the daily timeframe, the HBAR price chart still reflects an overall downtrend, marked by lower highs and lower lows. Beyond the existing downtrend, early February’s recent price action adds nuance, as HBAR/USD dipped to near $0.0840 before rebounding, suggesting demand is emerging near support.
This bounce doesn’t come from just any level; in fact, it closely aligns with the lower boundary of a falling wedge pattern. While the pattern often works but still has a chance of failing, this support still fuels some hope, as it introduces the possibility of stabilization rather than the continuation of decline.
If HBAR price reverses from the wedge’s lower edge, resistance comes into focus around $0.108–$0.110, depending on broader market conditions.
Conversely, a sustained move below $0.088 would expose the $0.083–$0.085 zone, with $0.078 acting as the next area of potential demand if weakness deepens. In this context, HBAR price continues to trade at a technical crossroads shaped by both structure and fundamentals.
Bitcoin is showing early signs of stabilising after bouncing from its recent April low, but analysts say price action remains fragile and important levels will decide what happens next. For now, the market is still trading below major resistance, meaning the correction may not be fully over yet.
Bitcoin Holds April Low, but Bounce Is Limited
Bitcoin recently defended the April 2025 low, which has acted as an important short-term support. Buyers stepped in near this level, triggering a modest bounce. However, analysts stress that this move is not a strong recovery yet, but rather a normal reaction after a sharp sell-off.
At current levels, Bitcoin remains trapped below resistance, suggesting the market is still in a corrective phase rather than a confirmed uptrend.
$74,000–$75,000 Still a Key Downside Zone
On the downside, there is focus on the $74,000 to $75,000 range. This zone has been watched closely for weeks as a potential area where Bitcoin could form a more meaningful low. A brief dip below the April low into this range is still considered possible, especially if broader market weakness continues.
Such a move would not necessarily be bearish long term. In fact, a final dip could help clear remaining selling pressure before a stronger bounce develops.
$80,500 Is the Level That Matters Most
On the upside, $80,500 is now the most important price to watch. A clear break above $80,500, especially if followed by continued strength, would be the first real sign that Bitcoin’s low is likely in place.
An ideal scenario would be a breakout above this level, followed by a shallow pullback that holds above support. That would mean buyers are gaining control and price is ready to move higher.
Oversold Signals Support a Short-Term Bounce
Technical indicators show Bitcoin is deeply oversold, even more than during some previous market pullbacks. Historically, such conditions often lead to short-term relief rallies, although these rallies can be choppy and unstable at first.
Because of this, Bitcoin may attempt several bounces before a clear trend emerges. Early rallies can fail, so confirmation through price structure is critical.
While further downside toward the mid-$70,000s cannot be ruled out, risk is becoming more balanced between buyers and sellers.
In the coming days, all eyes will be on whether Bitcoin can hold above support and eventually reclaim $80,500. Until then, volatility is likely to remain high, and traders are advised to watch price levels closely rather than rely on sentiment alone.
The crypto market has been under heavy selling pressure over the past few days, with Bitcoin sliding toward the $75,000 level. Market sentiment has worsened sharply, as the Crypto Fear & Greed Index fell deeper into “extreme fear,” dropping to 14. At the same time, the total crypto market capitalization has plunged to $2.54 trillion, with over $500 billion erased in just a few days. As a result, altcoins are taking a hard hit, and Solana is now testing the key psychological support level around $100. Traders are closely watching to see whether SOL could break below this level next.
Solana Forms Bearish Pattern Amid Negative Metrics
The crypto market crash has sent Solana price toward the $100 mark as long-liquidation surged. Data from Coinglass shows that Solana faced a total liquidation of nearly $35.3 million over the last 24 hours. Of this, buyers liquidated around $24.7 million.
This rising liquidation suggests that sellers are increasingly gaining control, sending the SOL price toward $100 for a retest. However, this bearish drop might further extend due to several negative on-chain metrics.
Solana Funding Rate
Data from CoinGlass shows that Solana’s OI-weighted funding rate has turned negative, signaling that more traders are betting on further downside rather than a price rebound. The metric shifted into negative territory last week and currently sits at -0.0057%, meaning short sellers are paying long traders, a signal of rising bearish threat around SOL.
This bearish outlook is strengthened by Solana’s long-to-short ratio, which now stands at 0.94. A ratio below 1 suggests that more traders are positioned for a price decline than a rise.
Beyond derivatives data, institutional interest in Solana has also weakened in recent weeks. According to SoSoValue, Solana spot ETFs saw net outflows of $2.45 million last week, marking the first weekly withdrawals since their launch. If these outflows continue or accelerate, SOL could face additional downside pressure in the near term.
What’s Next for SOL Price?
Solana’s price moved within a range between $117 and $147 for some time, but that pattern broke to the downside, suggesting sellers are starting to take control. As a result, the price fell to around $95. As of writing, SOL price trades at $105, recovering nearly 3% in the last 24 hours.
SOL/USDT Chart
If SOL closes below $100, the SOL/USDT pair could slide toward the $95 support level. Buyers are likely to defend this zone aggressively, as a break below $95 could open the door for a deeper drop toward $80.
For bulls to regain control, the price would need to climb back above the moving averages. That would indicate the dip below $117 may have been a false breakdown, potentially setting the stage for a move back toward the $150 resistance.
Canary Capital CEO Steven McClurg has shared his views on where Ripple could create the biggest real-world impact, following the company’s recent launch of Ripple Treasury after acquiring G Treasury.
Remittances Still Matter Most
McClurg said Ripple’s global remittances network remains one of the most important use cases in crypto today. While it may not be the biggest money-maker for the company, he believes it solves a real problem at global scale by making cross-border payments faster and cheaper, especially for countries that rely heavily on remittances.
RLUSD Seen as a Major Opportunity
Looking ahead, McClurg said the product he is most bullish on is RLUSD, Ripple’s U.S. dollar-backed stablecoin. He expects RLUSD adoption to grow quickly once it is fully integrated across Ripple’s partner network.
According to him, RLUSD could even challenge USD Coin over time, especially because of the regulatory framework under which RLUSD operates. He noted that RLUSD appears to have stronger oversight in the United States, which could make it more attractive to institutions and governments.
Could the U.S. Outsource a Digital Dollar?
McClurg also said that if the U.S. government decides not to launch a full central bank digital currency, it could instead outsource a digital dollar to private companies. In his view, Ripple and Circle would likely be the two main contenders for such a role.
He added that governments around the world have been exploring digital currencies for years and often approach companies with early experience in stablecoins. Based on those trends, he believes it is only a matter of time before the U.S. moves in this direction.
Institutional Questions Around XRP
When discussing XRP ETF, McClurg said one question comes up repeatedly from institutional investors: what gives the token its value? Unlike Bitcoin, which is widely understood as a digital currency, XRP requires more explanation.
He said institutions often need clarity on how XRP is tied to Ripple’s network and how it functions within that ecosystem. While the explanation can be complex, he believes it is a fair and important question that serious investors need answered.
Palantir stock price remains under pressure and in a technical bear market after plunging by 30% from its all-time high, mirroring the performance of other software companies like Microsoft, Adobe, ServiceNow, and Intuit.
Learn why analysts view ZKP as a potential 7,000x crypto opportunity, surpassing XRP and Cardano, as its presale auction sees explosive demand ahead. #partnercontent
Bitcoin printed its fourth red monthly candle in a row as BTC price fell below $80,000, with many traders questioning whether the bull market will return.
Warsh’s nomination as the new Fed chair has ignited US liquidity drought concerns, but his interest rate policy may hold the silver lining for risk asset recovery, according to market analysts.
Latest filings show Strategy bought 855 Bitcoin at about $88,000 each last week, as BTC briefly fell below its average cost for the first time since 2023.
The Financial Supervisory Service said automated models now scan crypto trading activity across timeframes, reducing reliance on manual investigations.
Popular opinion is missing the sea change in the UK’s crypto operating environment. Beneath regulatory criticism, the UK is accelerating its crypto evolution
Binance kicked off its $1 billion SAFU conversion into Bitcoin with a $100 million purchase, shifting its user protection fund out of stablecoins and into BTC.
The Justice Department on Friday released additional documents from the Jeffrey Epstein files, and Ripple executives stress there is no evidence linking the sex offender to XRP, Stellar, or their development.
Markets are under heavy pressure as crypto and precious metals have dropped sharply, triggering what analysts are calling a short-term market emergency. Bitcoin, gold, and silver have all seen steep declines, leaving investors focused on price levels that could decide what happens next.
Gold Sees Sharp Drop, Bounce Levels in Focus
Gold has fallen around 16% from recent highs, a move that surprised many traders. According to analyst Dylan, the first important bounce zone sits near $4,780, where gold has already shown some buying interest. If prices rebound further, the $5,130–$5,140 range is being watched closely, as it could act as a strong resistance area where selling pressure returns.
If gold weakens again, deeper support is seen near $4,700, and lower down around $4,550 to $4,480, where the 50-day moving average sits. These zones could attract buyers if broader market weakness continues.
Silver Crashes Harder Than Gold
Silver has taken an even bigger hit, falling nearly 38% from its highs. The sharp drop punished late buyers, but silver did manage a short-term bounce from its 50-day moving average. The most important support level now is around $70, which analysts describe as a “must-hold” zone. If silver fails to hold there, downside risk increases.
On the upside, resistance is expected near $92 and $98, where any short-term rally could face selling. In the near term, silver may see quick rebounds, but analysts warn these could be temporary in a volatile environment.
Bitcoin Under Pressure, Key Levels Ahead
Bitcoin is also facing strong selling pressure. On longer time frames, the analyst says $78,000 to $75,000 is the first major support zone to watch. A bounce from this area is possible, but it may only be short-lived. If selling continues, Bitcoin could dip toward the $70,000 area, and in a more extreme case, even the mid-$60,000 range.
On a monthly view, deeper downside zones around $57,000 to $50,000 are also being discussed as possible future bounce areas if market stress continues.
Bearish Mood Could Set Up Short-Term Bounces
Market sentiment is extremely negative right now, with fear spreading across crypto and metals. Such “peak fear” conditions sometimes lead to short-term relief rallies, even if the broader trend remains uncertain.
The next moves in Bitcoin, gold, and silver are likely to depend on how markets react around these critical price zones in the coming days.
TRON touts H2 2025 stablecoin settlement growth and ecosystem expansion as new fraud allegations emerge against founder Justin Sun. TRON (TRON) published its second-half 2025 report detailing developments in stablecoin settlement and ecosystem expansion. The report follows a previous analysis…
Leaked Epstein court files show a 2014 Austin Hill email pressuring investors tied to Ripple and Stellar, reviving scrutiny of Epstein’s Bitcoin funding, MIT links and XRP’s long SEC fight. Leaked court documents have revealed email communications between convicted financier…
Neo founder Erik Zhang has launched Neo Global Resources to align Neo 4 research, engineering and enterprise partnerships around real-world use cases and long-term ecosystem growth. Neo founder Erik Zhang has announced the formation of Neo Global Resources (NGR), a…
UAE security chief Sheikh Tahnoon quietly bought 49% of Trump-linked World Liberty Financial, tying its USD1 stablecoin to a $2B Binance deal and sensitive US AI chip policy. Sheikh Tahnoon bin Zayed Al Nahyan, a senior United Arab Emirates official,…
SoftBank is reportedly weighing up to $30B more for OpenAI in a $100B round valuing the AI firm near $830B, deepening their Stargate data center and SB Energy push. SoftBank Group is in discussions to invest up to $30 billion…
Crypto funds saw $1.7B in weekly outflows, flipping 2025 flows negative as Bitcoin ETFs trade below cost basis and short BTC, tokenized metals attract fresh demand. Digital asset investment products recorded a second consecutive week of substantial outflows, erasing year-to-date…
Jim Cramer says Saylor could jam Bitcoin from sub-$80k toward $82k, warning that any rebound, short-seller games and fresh volatility show BTC is still unreliable as money. CNBC Mad Money host Jim Cramer stated that Bitcoin (BTC) could rally to…
Michael Saylor’s Strategy has continued buying Bitcoin steadily, adding 855 BTC in a recent purchase worth about $75.3 million at an average price of around $87,974 per coin. As of February 1, 2026, the company now holds a total of 713,502 Bitcoin. In total, Strategy has invested roughly $54.26 billion in Bitcoin, with an average purchase price of $76,052 per BTC, showing strong long term confidence in Bitcoin’s value.
2026 has come with a massive shift in market dynamics as Ethereum (ETH) struggles to reclaim its momentum above the $3,000 psychological barrier. While the second- biggest crypto has often determined the momentum of altcoin seasons, smart money is flowing toward projects offering real-world utility.
Powering this shift is Digitap ($TAP), an omni-bank ecosystem blending blockchain speeds with the spendability offered by traditional banks. Digitap is a functional global banking rail offering a live, dual-integrated platform for crypto and fiat. These features explain why $TAP’s crypto presale is enjoying massive retail adoption.
For investors who want projects that might outperform ETH this year, Digitap, TRON (TRX), and Chainlink (LINK) are the best altcoinsto buy.
Digitap ($TAP): The Future of Banking is Already Here
TRON (TRX): The Unshakeable King of Stablecoin Settlement
Chainlink (LINK): The Oracle Standard Powering Real-World Assets
Digitap’s Live Omni-Bank Makes $TAP Best Crypto to Buy
While most projects in the 2026 landscape are still thriving on promises of future utility and hype, Digitap has already built a fully functional product. It has a functional app live on iOS and Android, which helps grow its user base rapidly. Its omni-bank offers users essential tools to help them navigate the global economy.
Digitap offers offshore banking flexibility by integrating crypto and fiat on one dashboard, where users can manage all their financial transactions. Investors believe this “banking completeness” enables users to spend crypto like cash in the real world.
By collaborating with the Visa network, Digitap enables investors to spend their crypto balances at over 80 million merchant locations globally. This tangible daily utility is what the market wants, explaining why investors consider $TAP as the best crypto to buy.
Digitap’s ability to bridge the gap between on-chain wealth and off-chain spending is the reason it is outperforming Ethereum’s utility in the current market. Moreover, its activation of Solana-native deposits has turned the world’s most active retail blockchain into a direct feeder for Digitap’s banking rails.
TRON Outshines Ethereum as 2026 Payment Workhorse
Another project that could outperform Ethereum is TRON. The asset has enhanced its position as the “workhorse” of the 2026 market. While Ethereum struggles with high gas fees during network congestion periods, TRON remains the primary destination for stablecoin settlements.
With more than 3 million daily active addresses, TRX has grown to become an essential component in the global peer-to-peer payment market.
Traders consider TRX among the best altcoins to buy due to its resilience in a volatile market. It is more than a speculative asset in the market. TRON has developed into an essential tool for millions of users in emerging markets who depend on it for low-cost transactions.
The continuous organic demand offers TRX a price floor that ETH lacks. As the rate of stablecoin adoption intensifies heading toward the projected $4 trillion mark, the TRX burn-mechanics ensure its value remains linked to real network usage. This makes TRX one of the best altcoins to buy in the current market alongside $TAP.
Chainlink’s RWA Utility Enables it to Outshine Ethereum
Chainlink is another asset whose fundamentals show it could outpace Ethereum. Being the Oracle Standard, it has become an integral component in the tokenization of Real-World Assets (RWAs). This enables the project to dominate one of the hottest narratives in the current cycle.
Whether it is an institutional credit market being brought on-chain or a real estate fund being tokenized, Chainlink has built the bridge that ensures these transactions are verified. Smart investors are buying into the LINK market because it offers a utility that enables it to survive in volatile markets.
While Ethereum currently lacks catalysts to propel it upward, Chainlink is always announcing institutional-grade collaborations that fuel LINK’s fundamental value.
By offering the data infrastructure needed by all other protocols to operate, LINK works as the “index fund” for the Web3 ecosystem. This huge utility could enable it to outpace ETH in the current cycle. Thus, it is a good crypto to buy.
Digitap-Solana Partnership Makes $TAP Best Altcoin to Buy
Digitap leads this group as the best crypto to buy since it has collaborated with Solana, enabling users to top up their accounts with SOL. This move is considered strategic and lucrative because it integrated the world’s most active retail chain with Digitap’s banking rails.
Through the partnership, SOL has become a spendable global currency. Solana investors can now connect their assets directly with the omni-bank without needing to engage with a third-party exchange. These users can instantly access cross-border transfers for less than 1% in fees.
The Digitap- Solana collaboration transformed potential rivals into powerful partners. Digitap leverages Solana’s speed to deliver a better banking experience. This explains why over 120,000 wallets are now connected to its dashboard.
$TAP’s Huge Crypto Presale Momentum Appeals to Investors
When comparing the three assets with ETH, the potential for growth shows why they could outpace the biggest altcoin in this cycle. For ETH to double from its current price, there needs to be a huge influx of institutional capital, which is highly unlikely in the current market conditions.
On the contrary, small-cap gems like Digitap could deliver multiplier gains in this cycle, supported by its huge banking utility. Currently available at $0.0454, $TAP is selling at a 67.57% discount from its exchange listing price of $0.14.
The current buyers will see ROI of 208% before the token hits the open market for trading. When these gains are added onto the 124% APY for stakers, the growth potential easily outpaces large tokens like ETH, TRX, and LINK.
Digitap has raised more than $4.8 million after selling more than 210 million tokens. With Round 3 of the crypto presale selling out quickly, it means investors want functional banking ecosystems that make digital assets spendable in the global economy.
Utility Triumphs Legacy: Digitap Leads ETH Outperformers
The current market favors execution and utility over legacy brand names. While Ethereum plays an important role in the blockchain sector, its potential to offer multiplier gains has reduced as it continues to mature.
Digitap, TRON, and Chainlink represent the three essential fronts of a modern portfolio: banking utility, payment rails, and data infrastructure. They are all good altcoins to buy for investors looking for assets that could outperform ETH in this cycle.
Digitap leads the group because of its massive real-world utility. It has partnered with Visa, incorporated Solana deposits into its ecosystem, and delivered a live omni-bank experience. Thus, it has proven it can do what Ethereum only promises.
This makes Digitap’s crypto presale the most logical way to enjoy huge profits in a volatile market.
Discover how Digitap is unifying cash and crypto by checking out their project here:
Bitcoin price projections for 2035 have become a recurring topic as institutional models extend further into the future. These forecasts vary widely, reflecting uncertainty around adoption pace, macro conditions, and Bitcoin’s eventual role in the global financial system.
Alongside these projections, attention has increasingly shifted toward infrastructure built around Bitcoin. Bitcoin Everlight is being discussed in that context, focusing on transaction routing and execution rather than price outcomes.
Long-Term Bitcoin Price Forecasts for 2035
Forecasts for Bitcoin’s value in 2035 cluster around several broad scenarios. Most base-case institutional models place Bitcoin between $1 million and $1.5 million, while more aggressive assumptions extend toward $3 million under favourable conditions.
Models produced by CF Benchmarks outline a probability-weighted framework. Their base case estimates Bitcoin near $1.42 million, with a bull case around $2.95 million if Bitcoin captures a dominant share of the global store-of-value market. Their bear case places Bitcoin closer to $637,000, reflecting slower adoption.
Survey-based and asset-manager projections fall into a similar range. Bitwise has modelled outcomes near $1.3 million, while the Finder.com Expert Panel averages predictions around $1.02 million by 2035. Analyst Timothy Peterson projects approximately $1.5 million, applying network-growth models such as Metcalfe’s Law.
Structural Assumptions Behind These Projections
These price targets depend heavily on structural assumptions. At $1 million per Bitcoin, total market capitalization would approach $21 trillion, roughly comparable to estimates of above-ground gold.
Scarcity is another core factor. By 2035, more than 99% of Bitcoin’s fixed 21 million supply will have been mined, while block rewards will have continued to halve. Many long-term models treat this declining issuance as a reinforcing constraint on supply.
Sovereign and institutional adoption also play a role. Higher-end scenarios typically assume that Bitcoin becomes part of national reserve strategies or long-term institutional balance sheets, a premise explored in several models published by ARK Invest.
Where Bitcoin Everlight Fits Into a Long-Term View
Bitcoin Everlight is not designed to influence Bitcoin’s price trajectory. Instead, it focuses on how Bitcoin is used at the transaction and execution level over time.
Everlight operates as a lightweight transaction layer alongside Bitcoin, without modifying Bitcoin’s protocol, consensus rules, or monetary properties. Bitcoin remains the settlement layer. Everlight handles transaction routing, node coordination, and fast confirmation through its own node network, with optional anchoring back to Bitcoin.
This approach positions Everlight as infrastructure intended to remain relevant across multiple price scenarios, whether Bitcoin adoption accelerates rapidly or progresses more gradually.
Execution and Network Development Today
Development progress has centered on making routing behaviour observable during early deployment. Transactions are processed by Everlight nodes rather than Bitcoin full nodes, with quorum-based confirmation producing confirmations in seconds.
Node operators stake BTCL tokens to participate in routing and lightweight validation. Performance is measured through uptime coefficients, latency, and confirmation success. Routing priority adjusts dynamically, and nodes that underperform see routing volume reduced until metrics stabilize. A fixed 14-day lock period limits rapid participation changes during early network operation.
Independent technical walkthroughs have examined these mechanics. In a recent video, Crypto Tech Gaming reviews Everlight’s routing structure, node participation model, and confirmation flow during active development.
Review Standards and Accountability
Bitcoin Everlight has completed third-party reviews covering protocol integrity and operational accountability. Smart contract logic and system components have been examined through the SpyWolf Audit and the SolidProof Audit, with assessments focused on execution paths, deployment structure, and relevant risk surfaces.
BTCL has a fixed total supply of 21,000,000,000 tokens. 45% is allocated to a public presale structured across 20 stages. The project is currently in Stage 2, with BTCL priced at $0.0010, progressing toward a final stage price of $0.0110.
Presale distribution follows a defined schedule: 20% unlock at the token generation event, with 80% released linearly over six to nine months. Additional allocations include 20% for node rewards, 15% for liquidity, 10% for team tokens under a 12-month cliff and 24-month vesting schedule, and 10% for ecosystem development and treasury use.
Find out how to purchase BTCL and participate in the Bitcoin Everlight presale.
Unverified claims circulating online are once again linking early crypto figures, old emails, and the long-running XRP story. At the centre of the discussion is an alleged email from July 31, 2014, said to have been sent by tech entrepreneur Austin Hill, which raised concerns about Ripple and Stellar, a project founded by Jed McCaleb, who also co-founded Ripple and XRP.
What the Alleged Email Says
According to online posts, the email was addressed to Joichi Ito and Jeffrey Epstein, with the subject line “Stellar isn’t so Stellar.” In it, Hill allegedly warned that it was harmful for the ecosystem to have investors “backing two horses in the same race,” referring to Ripple and Stellar competing for the same financial backers.
Commentators claim this points to early power struggles in crypto’s formative years, though there is no proof of wrongdoing by any of the parties involved.
Claims Around MIT and Funding
The narrative goes further, alleging that Epstein had financial ties to academic institutions such as MIT’s Media Lab, where blockchain research was conducted. Public records have previously confirmed that Epstein donated money to MIT. However, claims that this funding influenced crypto markets, projects, or regulators remain unproven.
Attempts to Link XRP to the SEC Case
Some online discussions also try to connect these past associations to the SEC’s lawsuit against Ripple, filed in 2020, and to former SEC chair Gary Gensler, who previously taught blockchain-related courses at MIT. While allegations of conflicts of interest are being circulated, there is no evidence that the SEC’s case against Ripple was driven by these academic or personal links.
“I hate to be a conspiracy theorist, but I wouldn’t be at all surprised if this is just the tip of a giant iceberg. The sad part is, we really are all in this together and this kind of attitude hurts everyone in the space.”
What Is Fact and What Is Not
Experts stress that many of these stories rely heavily on speculation, coincidence, and unverified interpretations rather than confirmed facts. The Ripple vs SEC case has unfolded mainly through court filings and judicial rulings, not leaked emails or historical associations.
As of now, there is no official confirmation that the alleged 2014 email or the relationships being discussed had any influence on XRP, Bitcoin, or regulatory decisions. Analysts caution investors to separate documented facts from online theories, especially during volatile market conditions when such narratives tend to spread quickly.
Never Miss a Beat in the Crypto World!
Stay ahead with breaking news, expert analysis, and real-time updates on the latest trends in Bitcoin, altcoins, DeFi, NFTs, and more.
FAQs
Could these claims affect investor confidence in Ripple or Stellar?
Speculative claims can temporarily influence sentiment, causing some investors to hesitate. However, long-term confidence typically relies on project fundamentals, regulatory clarity, and market performance rather than historical allegations.
Should investors worry about unverified crypto conspiracies?
Speculative stories can spread fast, especially in volatile markets, but confirmed facts should guide investment decisions.
The final days of January 2026 have brought a sudden chill to the digital asset landscape. After a period of relative calm, Bitcoin (BTC) has experienced a sharp pullback, dropping nearly 6% in a single day to hit its lowest level since November. This sudden reversal from the $90,000 range has sent ripples through the entire sector, with Ethereum (ETH) and once-high-flying meme coins losing momentum as sellers dominate the top 100 assets.
While the broader market appears to be drifting into a bearish phase, a quiet but significant shift in capital is occurring. Experienced market participants are moving away from speculative assets and focusing on a specific new cheap crypto protocol that is just beginning to activate its core technology.
Why Traders Are Suddenly Watching MUTM
In this climate of uncertainty, Mutuum Finance (MUTM) has emerged as a primary point of interest for those looking for functional utility. While the rest of the market faces rejection at key resistance levels, this protocol is drawing attention because it is building a solution for one of the oldest problems in crypto: the need to sell assets for liquidity.
Mutuum Finance is developing a hub where users could access the value of their holdings without exiting their long-term positions. By providing a structured environment for decentralized credit, it offers a reason to hold assets even when market prices are volatile. The timing of this attention is tied directly to the project’s recent technical progress, as it moves from a development roadmap to a working product.
What the Numbers Are Signaling
The data surrounding this protocol suggests a level of confidence that is rare for an unlisted asset. The project has officially surpassed the $20.1 million mark in total funding, a figure that has grown steadily even as other assets have stalled. More telling than the dollar amount is the holder count, which now exceeds 19,900 individual participants.
These numbers act as a signal of trust, showing that a broad community is willing to back the project before it reaches major exchanges. This is not the result of a single group of buyers but a distributed accumulation across thousands of wallets. For those tracking market sentiment, this kind of growth during a bearish turn is often viewed as a sign of underlying strength.
MUTM Structure and Price Progression
The economic design of the MUTM token is built around a capped supply of 4 billion tokens. To ensure a fair distribution, 45.5% of this supply—approximately 1.82 billion tokens—was allocated to early participants. The flow of MUTM has been managed through a series of stages, with the current price sitting at $0.04.
The progression has been deliberate; the project began at $0.01 in early 2025, meaning it has already moved through a 300% increase across previous stages. As each stage reaches its limit, the availability of tokens at the current rate tightens, making the entry point more competitive. This structure ensures that the total market cap grows in steps, reflecting the project’s milestones rather than erratic market swings.
Core Utility Architecture
Mutuum Finance’s V1 protocol just landed. This is a critical moment where the code becomes accessible for public scrutiny. In this environment, users can now test the core mechanics that will drive the final platform. This includes liquidity pools for established assets like ETH, USDT, LINK, and WBTC, alongside the mtToken system which serves as a yield-bearing receipt for lenders.
The testnet also features debt tokens that transparently track borrow positions and an automated Liquidator Bot designed to protect the system’s solvency. Seeing these tools function in a live setting provides the technical proof that investors look for before a major launch.
Why Timing Matters Right Now
The window for entering the protocol at its current valuation is narrowing as the project nears its final stages. Recent blockchain data shows an increase in “whale” activity, with larger wallets absorbing the remaining allocation in Phase 7.
Analysts are increasingly optimistic about MUTM due to its transition from a concept to a functional protocol on the Sepolia testnet. With the official launch price already fixed at $0.06, early Phase 7 buyers are looking at an immediate 50% discount.
Looking further into 2026, experts suggest that if the protocol reaches its target adoption levels for lending and borrowing, the MUTM price could accelerate into the 5x-9x range. Some bullish forecasts even suggest a move toward $0.45 by the end of the year as long as the “buy-and-distribute” fee model begins to reward long-term stakers.
For more information about Mutuum Finance (MUTM) visit the links below:
XRP price started today’s session under heavy pressure, sliding close to 5% lower amid broad crypto market weakness. However, as the day passed, the selling momentum faded, with price beginning to recover steadily, trimming losses to roughly –2% by mid-session. This rebound was not driven by a sudden spike in volume or speculative momentum. Instead, buying interest emerged gradually near lower levels, suggesting measured dip accumulation rather than forced short covering.
The absence of follow-through selling indicates that downside pressure is being absorbed, even as broader sentiment remains cautious. While XRP has not confirmed a trend reversal, the intraday recovery highlights a shift from aggressive selling to price stabilization, often seen when markets enter a reassessment phase.
On-Chain Metrics Signal a Market in Balance, Not Breakdown
On-chain metrics shows that XRP continues to trade well below its 200-day moving average, with price hovering near the $1.8–$1.9 zone while the 200DMA sits closer to $2.5. This roughly 25% gap confirms that the broader trend has not flipped bullish yet. However, the absence of sharp downside continuation suggests the market is operating in a corrective equilibrium, not a structural collapse. Looking deeper, the 30-day Sharpe Ratio remains close to zero, around 0.03–0.04, indicating that recent returns have barely compensated for risk. Historically, such readings emerge during consolidation phases, when volatility compresses and directional conviction fades.
At the same time, the Sharpe Z-Score, near +0.7, shows modest improvement relative to recent history. While still below levels associated with strong trend formation, it signals that downside efficiency has weakened. While short-term momentum metrics echo this view, with the 7-day Sharpe Momentum slightly positive but subdued consistent with early base-building rather than impulsive upside. Together, these indicators suggest XRP is losing bearish momentum, even if it has not yet regained bullish dominance.
Ripple Escrow Activity Draws Attention
Ripple’s escrow mechanism returned to focus after on-chain trackers flagged a series of large XRP unlocks during the session. Data shows that close to 1 billion XRP was unlocked in multiple tranches, including 100 million and 400 million XRP transactions, with individual releases valued between $160 million and $650 million at prevailing prices.
Despite the scale, the unlocks followed Ripple’s predefined, transparent escrow schedule, a system that has been in place for years. Importantly, an escrow unlock does not automatically translate into spot market selling. Past cycles show that a significant portion of unlocked XRP is either re-locked into escrow or used for liquidity operations tied to Ripple’s payment infrastructure. The market response this time reinforces that pattern. Spot order books showed no surge in sell-side aggression, and price remained stable following the unlocks. In practical terms, the escrow activity added supply visibility, but failed to trigger distribution behavior, suggesting traders had largely anticipated the event.
XRP Price Rebounds Highlights Buyer Accumulation at Key Levels
XRP’s price action tells a more nuanced story than the headline selloff suggests. The session began with downside continuation, pushing XRP close to –5% intraday and briefly threatening to extend the broader corrective structure that has defined recent weeks. XRP price action trading close to a well-defined demand zone that has capped downside attempts since late January. As price dipped into this region, sell-side momentum visibly weakened, and buying interest emerged almost immediately. This allowed XRP to reclaim lost ground and recover toward –2% on the day, signaling active dip-buying rather than passive consolidation.
Structurally, XRP remains below its longer-term trend markers, meaning the broader bias is still corrective rather than bullish. The chart continues to reflect a descending structure, with lower highs guiding price action since the breakdown. The $1.70–$1.80 region remains the key level to watch. A sustained hold above this zone keeps XRP in a base-building phase, opening the door for a relief bounce toward nearby resistance if broader market conditions cooperate. Conversely, a clean breakdown below the $1.40-$1.60 area would invalidate the intraday recovery and expose XRP to renewed downside pressure.
FAQs
Why is XRP price down today?
XRP is down due to broader crypto market weakness, but losses are easing as buyers step in near key support levels.
Will XRP price recover soon?
XRP may rebound if buyers hold $1.70–$1.80 support, but broader crypto trends will influence recovery speed.
Is XRP likely to enter a bullish trend soon?
XRP is still below its 200-day moving average; sustained gains above $2 may be needed to confirm a bullish trend.
What is XRP price prediction for 2026?
XRP may trend higher if adoption and market sentiment improve, but price depends on crypto trends and regulatory developments.
JasmyChain’s ecosystem grows with the launch of Jasmy Swap, a third-party decentralized exchange protocol. Built on JasmyChain, it uses smart contracts to automatically execute digital asset swaps, serving as a technical proof-of-concept for blockchain-based trading. The launch has sparked positive market response, with JasmyCoin rising 3.64%. Jasmy Swap highlights the ecosystem’s innovation and potential, showing how the chain can support new DeFi applications and increase activity within its blockchain network.
Gurhan Kiziloz has built a $1.7bn personal fortune by scaling Nexus International to institutional size without outside capital, retaining full ownership in an industry defined by dilution. #partnercontent
By 2025–2026, in-wallet swaps stopped being a feature and became the primary execution layer shaping user trust, retention, and revenue. #partnercontent
Right now, the short-term XRP price prediction is anything but stable. Expect a bounce between $1.55 and $1.83, moving sideways as traders assess the market.
Saylor’s surprise Epstein files cameo rattles sentiment, but MSTR still trades mainly as a high‑beta Bitcoin proxy, not a reputational meltdown play. Michael Saylor’s brief cameo in the newly unsealed Epstein documents hit MicroStrategy’s stock like a flash crash in…
Vitalik Buterin pockets $70k fading “crazy” Polymarket bets, arguing rational pricing of extreme scenarios can still beat crypto’s most heated narratives. Vitalik Buterin has quietly turned prediction markets into a lab for rationality under stress, cashing roughly $70,000 in profit…
Justin Sun’s alleged ex accuses CZ’s Binance and Tron of using paid KOL networks and insider trading tactics to rig TRX markets, raising new questions for regulators. Justin Sun’s alleged former girlfriend has ignited a storm around Binance founder Changpeng…
Alleged Justin Sun insider claims TRX was manipulated on Binance as SEC wash‑trade charges and WLFI’s TRON‑linked footprint raise fresh regulatory questions. Allegations around TRON’s (TRX) early trading are resurfacing—this time from inside Justin Sun’s personal orbit. Core allegations and…
Ripple has reached a major regulatory milestone in Europe after obtaining full approval for an Electronic Money Institution (EMI) license from Luxembourg’s financial regulator, the Commission de Surveillance du Secteur Financier (CSSF). This authorization upgrades Ripple’s status from “in-principle” approval to a fully operational license, allowing the company to legally provide regulated payment services across the European Union. The move places Ripple under a unified regulatory framework, enabling it to serve clients across multiple EU member states through passporting rights.
From Conditional Approval to Full Authorization
Ripple first revealed its preliminary approval for the Luxembourg EMI license last month. Since then, the company has satisfied all regulatory, operational, and compliance requirements set by the CSSF, clearing the final hurdle for full authorization. With this approval, Ripple is permitted to issue electronic money and deliver payment services throughout the EU without needing separate licenses in each jurisdiction.
Cassie Craddock, Ripple’s Managing Director for the UK and Europe, described the approval as a key step in strengthening Ripple’s role within European finance. She emphasized that Europe remains central to Ripple’s long-term strategy and that the license enhances the firm’s ability to provide compliant, blockchain-powered financial infrastructure to businesses transitioning toward digital-first payments.
Expanding Ripple Payments Across the EU
The Luxembourg EMI license is expected to accelerate the rollout of Ripple Payments, the company’s cross-border payments solution built for banks, fintech firms, and enterprise clients. Ripple Payments aims to modernize international transfers by improving settlement speed, lowering transaction costs, and increasing transparency compared to traditional correspondent banking systems.
Luxembourg’s status as a preferred hub for regulated financial services makes it a strategic base for Ripple’s EU expansion. While the company has not outlined a specific timeline or named initial markets, the license gives Ripple flexibility to scale its payment services across the bloc as demand grows.
Ripple’s European progress comes alongside recent regulatory wins in the United Kingdom, where the company secured both an EMI license and cryptoasset registration from the Financial Conduct Authority. With the Luxembourg approval included, Ripple now holds more than 75 regulatory licenses and registrations worldwide, positioning it as one of the most heavily regulated firms in the digital asset industry.
Rather than viewing regulation as a barrier, Ripple sees compliance as a competitive advantage as institutional adoption of blockchain-based payments accelerates.
Unlocking Institutional-Scale Capital Flows
Commenting on the broader implications, X user Nzheo highlighted that infrastructure developments like this could unlock as much as $2 trillion in USD and EUR value moving daily. The focus on instant settlement, no pre-funding, and lower costs marks a significant improvement over legacy payment rails. Nzheo added that once a permissioned decentralized exchange becomes operational, real-world assets could begin moving on-chain quickly, potentially opening the door to large-scale institutional capital flows across regulated blockchain networks.
Never Miss a Beat in the Crypto World!
Stay ahead with breaking news, expert analysis, and real-time updates on the latest trends in Bitcoin, altcoins, DeFi, NFTs, and more.
FAQs
How does Ripple’s EU license benefit customers?
It enables faster, cheaper, and more transparent cross-border payments for businesses across Europe using Ripple’s blockchain-powered infrastructure, all under a unified regulatory framework.
How does the Luxembourg license help Ripple Payments expand?
The license accelerates Ripple Payments rollout for banks, fintechs, and enterprises by providing a compliant base for faster, cheaper, and more transparent cross-border transfers across the EU.
How did the XRP price react to this news?
XRP showed limited short-term price reaction, as broader market conditions dominated, but the news strengthens long-term institutional confidence.
Russian Bitcoin mining giant BitRiver is on the brink of bankruptcy after a court launched insolvency proceedings over unpaid debts of more than 700 million rubles related to equipment and electricity costs. The company has shut down several facilities, faced management departures, and grappled with creditor lawsuits. Adding to its challenges, founder Igor Runets has been charged with tax evasion and placed under house arrest, intensifying the financial and legal pressures on the once‑leading mining firm.
The crypto market is once again under pressure today, falling about 2%, pulling back to a total value of $2.61 trillion. Interestingly, 87 out of the top 100 cryptocurrencies are currently trading in the red.
Bitcoin, the leading cryptocurrency, has dropped to its lowest level since April last year and is now trading around $77,324. Other major coins, including Ethereum, XRP, Solana, and DOGE, have also seen sharp declines today.
So, what is driving the crypto market lower today?
Kevin Warsh as New Fed Chair
One of the main reasons behind today’s drop is renewed fear around interest rates. Market sentiment turned negative after U.S. President Donald Trump nominated Kevin Warsh as the next Federal Reserve chair.
Warsh is known for supporting tighter monetary policy, which has raised concerns that interest rates could stay higher for longer. Meaning investors usually move money away from risky assets like Bitcoin.
Adding to the uncertainty, investors are also concerned about the ongoing partial U.S. government shutdown. House Speaker Mike Johnson said the House is working to end the shutdown by today.
Such political uncertainty often pushes investors away from risky assets, which puts more pressure on crypto prices.
Bitcoin and Ethereum ETF Outflows Continue To Hurt
Another major factor dragging the market lower is continued outflows from crypto exchange-traded funds. Last week alone, Bitcoin ETFs saw nearly $1.5 billion in outflows, signaling that large institutions are reducing exposure. Major players like BlackRock, Fidelity, and Bitwise led the withdrawals.
Ethereum ETFs also faced pressure, recording close to $460 million in outflows over the same period. These exits have added selling pressure to the spot market.
Liquidation Add Fear In the market
The sell-off was made worse by heavy liquidations. More than $800 million worth of leveraged crypto positions were wiped out in the last 24 hours, mostly from long trades using high leverage.
The largest single liquidation occurred on Hyperliquid, with a BTC-USD position worth $15.46 million.
As liquidations surged, fear increased. The Crypto Fear and Greed Index has now dropped to 15, signaling extreme fear.
How Low Could Bitcoin Price Go?
After the recent sharp fall, veteran trader Peter Brandt has lowered his Bitcoin price target from $58K to $54K. Bitcoin is now hovering near key support around $74,500, and if this level breaks, the next major drop could take BTC down to about $66,530.
Another crypto trader, Captain Faibik, warned that Bitcoin has lost a very important long-term support level, the weekly EMA100, for the first time in more than 840 days. This is seen as a negative signal on bigger timeframes.
For now, traders are closely watching the $68,000 to $70,000 range.
Never Miss a Beat in the Crypto World!
Stay ahead with breaking news, expert analysis, and real-time updates on the latest trends in Bitcoin, altcoins, DeFi, NFTs, and more.
FAQs
Why is the crypto market falling today?
The crypto market is down due to interest rate fears, U.S. political uncertainty, ETF outflows, and heavy leveraged position liquidations.
How low could Bitcoin price go next?
Bitcoin may drop to $68K–$70K if key support breaks, with potential further declines to $66,530 according to traders tracking major technical levels.
What does extreme fear mean in crypto markets?
Extreme fear, shown by a low Fear & Greed Index, signals panic selling and heightened market uncertainty, often leading to volatile price movements.
When will the crypto market recover from this downtrend?
Recovery depends on interest rate clarity, political stability, and investor confidence, but short-term rebounds are possible if selling pressure eases.
While Bitcoin and major altcoins remain under pressure, select assets have begun to decouple from the broader market trend. MYX Finance and River prices have emerged as the top gainers among the top 100 cryptocurrencies, posting outsized moves despite prevailing risk-off sentiment. Their relative strength stands out at a time when most tokens are struggling to hold key supports, prompting traders to closely assess whether these rallies are driven by short-term momentum or the early stages of a broader trend shift.
The daily chart highlights a steady recovery phase following a sharp post-spike correction, with the price now consolidating around the $5.7 region. MYX price continues to trade within the upper half of a rising structure, suggesting that buyers are gradually regaining control. However, price remains capped below a clearly defined resistance band, making the current setup a crucial decision zone that could determine whether the ongoing uptrend extends or transitions into deeper consolidation.
The MYX price is trading inside a rising parallel channel, which usually reflects a healthy and controlled uptrend. However, the area between $6.3 and $6.8 has acted as a stubborn ceiling, rejecting the price multiple times and keeping MYX in consolidation.
The RSI is pointing to mild bullish strength without any signs of exhaustion, while the MACD has started to flatten, suggesting the market is pausing rather than reversing. As long as MYX holds above the $5.2–$4.6 support zone, the upside structure remains intact. A clean breakout above $6.8 could push the price toward $7.9 and $9.5, while a breakdown below channel support would shift attention toward the $4.2 region.
River (RVR) Price Aims for a 30% Recovery
The chart shows the River price coming off a strong impulsive rally, followed by a sharp pullback as it reacts to a major resistance zone. After pushing aggressively higher within a rising channel, RIVER has cooled down and is now hovering around the $21 area, where buyers are attempting to stabilize the move. This phase looks less like panic selling and more like a natural reset after an overheated run.
RIVER had been trending cleanly higher inside a rising wedge, signaling strong bullish momentum and experienced a breakdown. The pullback has now brought RIVER back into a key demand area around $14–$18, which previously acted as resistance and is now being retested as support. Momentum indicators reflect this cooldown: RSI has dropped toward the mid-40s, suggesting momentum has reset from overbought levels, while CMF, hovering slightly below zero, points to short-term capital outflows but not heavy distribution. If RIVER holds above the $14 support zone, a relief bounce toward $26 looks likely, followed by a retest of $35–$45 if buying strength returns.
The Bottom Line
Even as Bitcoin and most large-cap altcoins lose momentum, MYX and RIVER are quietly holding up well, which is hard to ignore. MYX is respecting its rising structure, and RIVER is trying to stabilize after a strong run and a healthy pullback. This kind of price action usually points to selective buying rather than risk-off panic. If Bitcoin continues to drift without a sharp breakdown, these two could keep outperforming in the near term. That said, broader market sentiment still matters, so BTC’s next move will likely decide whether this relative strength turns into a sustained rally or fades.
Ripple has officially received its full Electronic Money Institution (EMI) license from Luxembourg’s CSSF, marking a major step in its European growth. The approval allows Ripple to offer regulated blockchain-based payment solutions across the EU, supporting businesses in moving to modern, digital-first finance. This comes after recent UK approvals and adds to Ripple’s portfolio of 75+ global licenses, making it one of the most regulated and trusted players in the crypto and digital assets space.
The ongoing crypto sell-off has rattled investor confidence, but macro investor Raoul Pal believes the narrative around crypto being “broken” is deeply flawed. According to Pal, the current downturn has little to do with crypto-specific issues and everything to do with a severe liquidity crunch in the United States, triggered by repeated government shutdowns and broader structural drains in the financial system.
U.S. Liquidity, Not Crypto, Is the Core Problem
In a recent X post, the Global Macro Investor founder explained that markets should be trending higher this cycle, but U.S. liquidity constraints are holding them back. Pal pointed to two U.S. government shutdowns as a major shock to liquidity, combined with issues in what he described as “U.S. plumbing.” Notably, the Reverse Repo facility drain was largely completed in 2024, removing a key source of excess liquidity that had previously supported risk assets.
The most recent shutdown began last Friday, despite the Senate reaching a funding deal. With the House not in session until later this week, liquidity conditions tightened further, creating what Pal described as a temporary “air pocket” for markets. Still, he remains optimistic that the shutdown could be resolved soon, removing what he believes is the final major hurdle for liquidity to return.
Debunking the Fed and Warsh Narrative
Pal also dismissed growing concerns around former Federal Reserve Governor Kevin Warsh, who has been nominated as the next Fed chair. Some market participants have labeled Warsh as hawkish, suggesting rate cuts may be delayed or avoided altogether. Pal called this narrative “baseless,” arguing that Warsh’s mandate aligns with a Greenspan-style playbook.
According to Pal, Warsh is expected to cut rates and largely stay out of the way while fiscal authorities and banks drive liquidity. He emphasized that balance sheet tightening is unlikely due to existing reserve constraints, warning that aggressive moves could destabilize lending markets.
Bitcoin Slides as ETF Outflows Accelerate
While macro pressures dominate, Bitcoin remains under pressure in the near term. BTC is down another 2%, trading near $76,000 at press time, marking a sharp reversal from the upward momentum seen earlier this month. Heavy spot Bitcoin ETF outflows have amplified the weakness.
Over the past two weeks alone, spot BTC ETFs recorded roughly $2.8 billion in net outflows, making January one of the worst months on record for institutional selling. Total assets under management across Bitcoin ETFs have now fallen about 31% from their October peak, dragging sentiment lower across the broader crypto market.
Looking Ahead: Patience Over Panic
Despite the brutal price action, Pal ended on a bullish note. He believes the forces suppressing liquidity are nearly exhausted and that markets are approaching a turning point. In his view, time, not short-term price moves, matters most in full-cycle investing. If liquidity begins to flow again as expected, Pal sees the groundwork being laid for a powerful bull phase heading into 2026.
Never Miss a Beat in the Crypto World!
Stay ahead with breaking news, expert analysis, and real-time updates on the latest trends in Bitcoin, altcoins, DeFi, NFTs, and more.
FAQs
How could U.S. liquidity issues impact other financial markets beyond crypto?
Liquidity constraints can tighten borrowing conditions for banks, corporations, and investors, slowing trading and investment across equities, bonds, and commodities. Reduced liquidity can also increase market volatility, making it harder for large trades to execute without moving prices significantly.
What might happen if U.S. government shutdowns continue or recur?
Prolonged or repeated shutdowns could further restrict liquidity, delaying recovery in both traditional and crypto markets. They may also undermine investor confidence, slowing capital inflows and creating temporary market dislocations.
Who is most affected by short-term liquidity constraints in this environment?
Hedge funds, institutional investors, and leveraged traders are particularly exposed, as they rely on accessible capital to maintain positions and meet margin requirements. Retail investors may feel indirect effects through heightened volatility and wider spreads in crypto and equity markets.
Solana price is trading just above the critical $100 support after failing to sustain moves above the $118–$120 supply zone, placing the market at a critical turning point. Price has compressed into a narrow range between $100 and $108, reflecting indecision after the recent sell-off. With previous demand clustered near $92–$95 and no strong follow-through buying above $110, traders are now questioning whether $100 can continue to hold.
Will dip buyers defend this level, or does a daily close below $98 open the door toward deeper downside? The next few sessions are likely to define Solana’s near-term trend.
The daily SOL chart shows Solana testing a critical demand zone after a prolonged downtrend, with price slipping to the $100–$103 region. This area has historically acted as a strong accumulation zone, making the current structure pivotal for the next medium-term move. While broader momentum remains weak, early signs suggest selling pressure may be nearing exhaustion, setting the stage for a potential relief bounce or base formation.
From a price-action perspective, SOL has formed lower highs and lower lows since the October peak near $260, confirming a dominant bearish trend. The recent sharp sell-off resembles a capitulation move, as the price wicked close to the $95–$100 support band.
RSI (14) is near 28–30, deep in oversold territory, hinting at a possible short-term rebound.
OBV continues to trend lower, indicating weak accumulation and cautioning that any bounce may initially be corrective.
The horizontal support zone between $95 and $103 is crucial; a sustained breakdown below this range would expose deeper downside.
Heading into February 2026, Solana’s price action remains at a make-or-break zone. As long as $100 holds on a daily closing basis, the market may attempt a relief rebound toward $108–$112, where supply has consistently capped upside. However, a confirmed close below $98 would weaken the structure and shift focus toward the $92–$95 demand band, followed by a deeper downside risk toward $85 if selling accelerates. Momentum remains fragile, and February is likely to be defined by range resolution rather than trend expansion, unless volume returns decisively on either side of the $100 level.
Ether treasury firms are pressured by the crypto market downturn, as Trend Research was forced to sell $77 million in Ether at a loss, while others are holding through paper losses.
Bitcoin slid below $80k after Warsh’s Fed nod, triggering $2.5B liquidations before stabilizing near a key mid-cycle support zone analysts see as potential cycle floor. Bitcoin fell below $80,000 over the weekend following confirmation that Kevin Warsh will become the…
Bitcoin price briefly fell to a nine-month low of $74,546 on Monday, as massive crypto liquidations and a drop in precious metal prices rattled global markets. According to data from crypto.news, the Bitcoin (BTC) price fell 5.7% to an intraday…
Chainlink price is losing momentum as traders turn more defensive across the altcoin market. After failing to hold above $11, LINK extended its pullback today over 6%, pushing price toward the $9 mark, a zone where buyers are now expected to show intent.
The move lower has unfolded without panic. Instead, it reflects a gradual withdrawal of demand, with rebounds failing to attract sustained follow-through. This kind of price behavior often signals a market that is reassessing value rather than reacting emotionally.
As LINK price approaches key technical territory, on-chain data offers insight into why confidence has thinned.
Spot Market Data Shows Steady Distribution Into Weak Rallies
Spot on-chain metrics point to persistent but controlled selling pressure rather than panic-driven exits. Over the past several sessions, LINK has recorded net exchange inflows averaging 2500,000–4000,000 LINK per day, even as price attempted minor recoveries. These inflows have coincided closely with short-term bounces, indicating that holders are using strength to distribute rather than accumulate. Exchange balances remain elevated relative to early-month levels, while spot volume on green candles has consistently lagged volume on red sessions.
This imbalance confirms that sell-side activity is absorbing demand faster than buyers are willing to step in. Crucially, there is no sign of aggressive accumulation clusters forming at current prices. Historically, LINK bottoms have aligned with sharp reductions in exchange inflows.
Leverage Exposure Resets as Risk Appetite Pulls Back
Derivatives data reinforces the idea that LINK’s move lower is driven by positioning reset, not aggressive bearish conviction. Open interest has declined near 2%, dropping from approximately $470 million to near $450 million, signaling that traders are reducing exposure rather than piling into shorts. This contraction reflects long-side unwinding, not fresh downside speculation.
However, funding rates across major perpetual markets have cooled from mildly positive territory to near neutral, removing a key bullish tailwind that supported LINK earlier in the cycle. The absence of strongly negative funding also suggests shorts are not pressing aggressively. While, liquidation data reveal a notable concentration of long liquidation liquidity between $9.00 and $9.50, with estimated exposure exceeding $60–$80 million. Above current price, short-side liquidity remains relatively thin, reinforcing downside gravity if spot demand fails to stabilize.
Chainlink Price Analysis: Is LINK Set to Retest $8?
Chainlink price has continued to paint the lower highs and lower lows swings, trapped inside a descending channel. Amidst the recovery in early 2026, LINK has failed to crack the $14 hurdle and faced decisive rejection, resulting in drop below the $10 crucial support zone. The $10 level has now flipped into resistance. The current price action suggests that Chainlink price may grab liquidity toward the $8 demand zone in the coming sessions.
As long as LINK price trades below the $9 zone, market structure favors continuation pressure toward the $7.50-$8.30 zone, where historical demand and accumulation zone intersect. A decisive defense of $9 could allow LINK to compress and stabilize ahead. However, the current phase is defined by distribution over accumulation and risk reduction over leverage expansion. The market awaits clear evidence of bottoming out and stronger volume response at support. Until then, LINK is not being chased, it is being tested.
FAQs
Why is Chainlink (LINK) price falling today?
LINK is declining due to reduced demand, steady spot selling on small rallies, and traders lowering risk rather than panic selling.
Is Chainlink facing panic selling right now?
No. On-chain data shows controlled distribution and position unwinding, not emotional exits or aggressive bearish pressure.
Could LINK price recover from this pullback?
A recovery is possible if buyers strongly defend $9 with higher volume, signaling accumulation instead of distribution.
Gold and silver deepened their dramatic decline on Monday, extending last Friday’s historic rout that erased trillions in market value. What had been a powerful safe-haven rally quickly flipped into a violent correction, driven by a stronger U.S. dollar, aggressive profit-taking, and rising margin pressures. Analysts say the speed and scale of the move signal that speculative positioning had reached unsustainable levels.
Spot gold dropped around 5% to $4,616.79 per ounce, following nearly 10% losses on Friday when prices crashed below $5,000. Silver fared far worse. After plunging nearly 30% in a single session last week, its worst daily performance since March 1980, the metal extended its fall, briefly sliding more than 12% before stabilizing near $78.30 per ounce.
Trillions Wiped Out in Days
Crypto analyst, Bull Theory, described the move as a historic crash rather than a routine correction. According to the analyst, nearly $10 trillion in combined market value was erased from gold and silver in just three days. Gold alone was estimated to be down roughly 20% from its peak, wiping out about $7.4 trillion in value, around five times the entire market capitalization of Bitcoin.
Silver’s collapse was even more extreme. Analyst noted that the metal has fallen close to 40% from its highs, erasing roughly $2.7 trillion in market value, a figure comparable to the entire crypto market. The analyst warned that so-called safe-haven assets are now trading with volatility levels more commonly associated with crypto memecoins, highlighting how crowded and leveraged these trades had become.
What triggered the sell-off?
A key driver of the sell-off has been renewed strength in the U.S. dollar. The dollar index has gained around 0.8% since Thursday, making dollar-denominated gold and silver more expensive for overseas buyers. At the same time, expectations for tighter monetary policy have increased the opportunity cost of holding non-yielding assets like gold.
Markets were caught off guard after President Donald Trump nominated former Federal Reserve Governor Kevin Warsh to succeed Jerome Powell as Fed chair when his term ends in May. Warsh is known for favoring tighter monetary policy, a shift that has boosted the dollar and dampened enthusiasm for rate-sensitive assets.
CME Margin Hikes Add Pressure
The CME Group moved quickly in response to last week’s volatility, announcing higher margin requirements effective after Monday’s market close. Margins on COMEX gold futures were raised from 6% to 8%, while margins on COMEX 5,000-ounce silver futures jumped from 11% to 15%.
Experts Watch the Crypto Link
Crypto analyst Michaël van de Poppe focused on silver’s extended correction, noting that the metal was down more than 40% in just two days. He described the move as a “massive bloodbath” and pointed out that Bitcoin had already felt the impact over the weekend, though it had begun to stabilize as commodities took the brunt of the selling.
Van de Poppe emphasized a recurring market pattern: when commodities fall sharply, crypto often follows. However, he also noted that once commodities find a bottom, digital assets have historically outperformed.
Never Miss a Beat in the Crypto World!
Stay ahead with breaking news, expert analysis, and real-time updates on the latest trends in Bitcoin, altcoins, DeFi, NFTs, and more.
FAQs
How much market value was lost in the gold and silver crash?
Nearly $10 trillion was wiped out in three days, with gold down 20% and silver falling close to 40% from recent highs.
Did the gold and silver crash affect Bitcoin?
Yes, Bitcoin dropped as crypto often follows sharp commodity declines, though it began stabilizing as metals took the brunt.
Will Bitcoin recover after metals like gold and silver crashed?
Historically, Bitcoin stabilizes after commodity crashes, often rebounding once gold and silver find a market bottom.
Why did safe-haven metals behave like crypto during the crash?
Heavy leverage, speculative positioning, and crowded trades made gold and silver react with crypto-like volatility in this sell-off.
The crypto market has entered a sharp corrective phase, dragging the cryptos from the recent highs. As predicted, the Bitcoin price dropped to $75,000 in early February as the selling and liquidations reached peaks. Initially, it appeared to be a routine pullback, which further transformed into a broader sell-off. This is reflecting the weakening prices, fading momentum, and rising volatility across the market.
Investor sentiment has turned cautious as key technical levels come under pressure, prompting traders to reassess near-term expectations. With Bitcoin acting as the market’s anchor, its decline has amplified downside moves across the crypto ecosystem, setting the stage for a critical period ahead.
Peter Brandt Flags Breakdown Risk as Bitcoin Slips Below Key Structure
According to veteran trader Peter Brandt, the daily Bitcoin chart is showing a decisive structural breakdown rather than a routine pullback. The price has slipped below a rising consolidation channel that previously acted as a pause within a broader downtrend. This breakdown is accompanied by continued rejection near the declining moving average, reinforcing bearish control.
Brandt highlights that failed recoveries and lower highs suggest distribution rather than accumulation. Based on the measured move from the pattern, the chart points toward a potential downside extension toward the $54,000 zone, with limited intermediate support visible. Unless Bitcoin swiftly reclaims the broken structure, the technical bias remains tilted firmly to the downside.
The Bottom Line!
Bitcoin remains under firm bearish control after losing the $78,000–$80,000 support zone, with price now trading below its short-term and medium-term moving averages. As per the chart shared by Peter Brandt, the confirmed breakdown from the rising consolidation structure opens downside risk toward $66,500 as an interim support, followed by the major bearish target near $54,000 based on the measured move.
On the upside, Bitcoin (BTC) price must reclaim $83,500–$85,000 on a daily closing basis to invalidate the bearish setup. Until that happens, any bounce toward $80,000–$82,000 is likely to be corrective, keeping the broader bias tilted toward further downside extension.
Solana-based decentralized exchange Jupiter is taking a significant step beyond token swaps by integrating Polymarket into its ecosystem. The move brings prediction markets to Solana through Jupiter for the first time, signaling a strategic shift toward building a more comprehensive on-chain financial platform. By adding event-based trading to its offerings, Jupiter is positioning itself as more than a liquidity router and aiming to become a central hub for multiple DeFi use cases.
Jupiter described Polymarket as the largest prediction market in crypto and said the integration is designed to give users a unified on-chain experience. Traders will be able to engage with prediction markets alongside traditional DeFi products, reflecting Jupiter’s ambition to make predictions a core part of its long-term growth strategy.
Building a Dedicated On-Chain Prediction Market Hub
Prediction markets have gained renewed attention over the past year, particularly as traders increasingly speculate on elections, macroeconomic data, and major global events. Jupiter plans to lean into this momentum by developing dedicated infrastructure around prediction markets. While the team has not shared a launch timeline or technical details, it outlined plans to roll out prediction-focused APIs, revamped market discovery tools, deeper data insights on individual markets, and new trading and communication mechanisms.
This focus suggests Jupiter sees prediction markets not as an add-on, but as a foundational pillar alongside swaps and other on-chain products.
Alongside the Polymarket announcement, Jupiter revealed it has secured a $35 million strategic investment from ParaFi Capital. The investment was settled entirely in JupUSD, Jupiter’s dollar-pegged token, and executed at spot price. ParaFi also agreed to an extended lockup for its JUP tokens, a move widely viewed as a signal of long-term confidence in Jupiter’s roadmap.
Jupiter said the fresh capital will be used to accelerate development across its broader on-chain financial infrastructure, with prediction markets expected to play a central role in the coming year.
Strengthening Jupiter’s Role in the Solana Ecosystem
Jupiter already holds a dominant position within Solana’s DeFi landscape, with roughly $2.35 billion in total value locked and strong fee and revenue generation. Adding prediction markets further diversifies its product stack and deepens its relevance to active traders.
At the same time, Jupiter has launched its long-awaited JUP airdrop, which has been highlighted as one of the largest token distributions on Solana. The airdrop is designed to reward genuine ecosystem participants, including users of swaps, perpetuals, lending, DCA, and limit orders, liquidity providers, stakers, and active SOL traders.
Never Miss a Beat in the Crypto World!
Stay ahead with breaking news, expert analysis, and real-time updates on the latest trends in Bitcoin, altcoins, DeFi, NFTs, and more.
FAQs
What is Jupiter’s integration with Polymarket?
Jupiter is integrating Polymarket to bring on-chain prediction markets to Solana, letting users trade event outcomes alongside swaps and other DeFi tools.
How will users benefit from prediction markets on Jupiter?
Users get a unified DeFi experience, trading predictions, swaps, and other products in one place without leaving the Solana ecosystem.
What are the broader implications for Solana’s DeFi ecosystem?
If successful, this move could attract new trading activity beyond swaps, encouraging other Solana protocols to build event-driven or data-based financial products.
What should users expect next from Jupiter after this announcement?
The next phase is likely infrastructure-focused, including developer tools and market interfaces. User-facing features may roll out gradually as Jupiter tests liquidity and demand.
The crypto market has seen a sharp sell-off, with total market value falling to $2.52 trillion, down by 6% in the last 24 hours. Bitcoin, the pioneer cryptocurrency, dropped heavily from $89,200 to a low of $74,561.
Other major coins like ETH, XRP, SOL, BNB, and ADA also faced strong losses of around 8% to 15%.
Now the big question remains: Will the crypto market recover this week, or will prices fall even further?
Why Bitcoin and Crypto Prices Fell
Today, Bitcoin price slipped about 2.2%, falling to nearly $76,600, a level last seen in November 2024
The biggest reason behind the market drop is growing uncertainty around global interest rates. Market sentiment turned negative after President Donald Trump nominated Kevin Warsh as a possible Federal Reserve chair, which raised fears that interest rates could stay higher for longer.
Key U.S. Economic Data To Impact the Crypto Market
Several major U.S. economic events this week could influence crypto prices. On February 5, the latest Initial Jobless Claims data will be released. Analysts expect claims to rise slightly to 212,000 from last week’s figure of 209,000.
If the number comes higher than expected, it may signal weakness in the U.S. job market. This could increase hopes that the Federal Reserve might slow down rate hikes, which is usually positive for Bitcoin and crypto prices.
Further, on February 6, the U.S. unemployment rate and the monthly employment report will be announced. The unemployment rate is forecasted to rise to 4.5%, compared to 4.4% in December 2025.
If economic data shows continued weakness, markets may price in future rate cuts, which could help crypto recover.
Following this major event, Crypto trader Captain Faibik highlights that Bitcoin is losing a key long-term support level, the weekly EMA100, for the first time in over 840 days. This is seen as a warning sign on higher timeframes.
$BTC bulls are losing the weekly EMA100 Support after 840 days.. Not a healthy sign on the higher timeframe.
Singapore Gulf Bank has announced a new service that lets institutions mint, trade and convert stablecoins to fiat within a single regulated platform. According to a press release shared with crypto.news, the new service will allow SGB clients to mint,…
Cross-chain liquidity protocol CrossCurve has been targeted in a smart contract exploit, with attackers draining roughly $3 million across multiple networks. CrossCurve confirmed the exploit via a Feb. 2 X post and has requested all users to “pause all interactions”…
Ethereum price continued its downtrend for the fifth straight day, dropping over 11% in the past 24 hours amid massive liquidations of bullish bets and whale selling. As macroeconomic concerns continue to lower risk appetite, will the asset fall below…
A Nevada state court has issued a two-week temporary restraining order preventing Blockratize, the operator of the prediction market Polymarket, from offering sports and event contracts to residents, saying those activities likely violate Nevada’s gambling laws. The judge agreed with the Nevada Gaming Control Board’s civil complaint that Polymarket is operating without a state gaming license and that the federal Commodity Exchange Act does not give the CFTC exclusive authority over these contracts. If upheld, Polymarket and similar platforms may have to obtain state licenses or stop offering such markets.
Although the loss remains only on paper, the drop in BTC value has also dragged down Strategy’s stock price, raising concerns among investors about whether Strategy will liquidate Bitcoin to reduce further losses
Bitcoin Drop Pushes Strategy Into $900 Million in Paper Loss
As of now, Strategy holds a massive 712,647 BTC, valued at around $54.36 billion. However, these coins were bought over time at an average price of about $76,040 per Bitcoin.
Lookonchain, an on-chain analytics platform, highlighted that Strategy’s Bitcoin holdings briefly showed an unrealized loss of over $900 million when BTC dipped below $75K.
This means short-term price drops do not automatically create financial pressure on the company. As a result, there is no immediate risk of liquidation, even during sharp market swings.
Strategy Stock Remains Under Pressure
However, Bitcoin’s price still matters greatly for Strategy. The company’s stock is closely linked to BTC movements because Strategy continues to fund its Bitcoin strategy through equity sales.
A filing with the U.S. Securities and Exchange Commission earlier this year confirmed that Strategy relies on at-the-market share sales and other securities to raise capital for further Bitcoin purchases.
While Bitcoin has stabilized, Strategy’s stock continues to struggle. Shares are down about 56% over the past year and recently traded near $149.7. As history shows, when Bitcoin rises, Strategy’s stock often moves faster, but when Bitcoin falls, losses can deepen just as quickly.
Michael Saylor Signals More Bitcoin Buying
Despite recent market weakness, Strategy shows no signs of changing direction. In a recent tweet post, Michael Saylor hinted at more Bitcoin purchases through a short social media post referencing “oranges,” a signal he has used many times before.
In the past, similar posts have often been followed by official Bitcoin purchase announcements early the following week, suggesting another buy could be coming.
After dipping below $75K, Bitcoin has rebounded and is now trading near $76,443. This recovery has pushed Strategy back into a small unrealized profit of around 0.40% on its total Bitcoin holdings.
Never Miss a Beat in the Crypto World!
Stay ahead with breaking news, expert analysis, and real-time updates on the latest trends in Bitcoin, altcoins, DeFi, NFTs, and more.
FAQs
How many Bitcoins does Strategy currently hold?
Strategy owns 712,647 BTC, valued at $54.36B, with an average purchase price of $76,040 per coin.
Will Strategy sell Bitcoin after the price drop?
No. Short-term BTC dips don’t force sales, and Strategy is sticking to its long-term Bitcoin accumulation plan.
How does Strategy fund its Bitcoin purchases?
Strategy raises money through equity sales and at-the-market offerings to keep buying Bitcoin over time.
How has Strategy’s stock performed alongside Bitcoin?
Shares fell 56% over the past year, reflecting Bitcoin’s swings, showing a strong correlation between BTC and stock price.
Ethereum co-founder Vitalik Buterin says the future of on-chain system design will rely on a two-layer structure. The first layer focuses on open and accountable execution, such as prediction markets, where correct decisions are rewarded, and wrong ones face losses. The second layer handles preferences and judgment, using decentralized, anonymous, and non-token-based voting systems like MACI. This design aims to resist capture, prevent collusion, and reduce the risk of 51% attacks.
Nomura's CFO, Hiroyuki Moriuchi, reportedly reaffirmed the company's long-term commitment to digital assets but said it had to manage short-term risks.
The amount of crypto stolen in January is also a 214% increase from the month before, with a majority of the value lost due to a single phishing incident.
Solana price has broken below the $100 level for the first time in ten months, putting the market’s focus squarely on whether the next layer of support can hold. As selling pressure continues to build throughout the crypto market, Solana…
Ethereum (ETH) entered the week under heavy pressure, falling nearly 8% today and slipping decisively below the $2300 level amid a broader crypto market selloff. The move unfolded quickly, with downside momentum accelerating as leveraged long positions were forced out and spot demand failed to stabilize prices. While on-chain behaviour shows capital moving toward exchanges rather than into long-term storage alongside the rising macro uncertainty suggest Ethereum price is facing more than a routine pullback, resembling that ETH may be entering a distribution phase.
On-Chain Flows Signal Elevated Distribution Risk
Ethereum’s downside was preceded by a notable shift in on-chain behavior, particularly among large holders. Exchange inflow data shows a sharp and synchronized increase in ETH deposits, a signal often associated with preparation for selling, hedging, or risk reduction. On February 1, inflows into Binance alone surged to roughly 357,000 ETH, marking the exchange’s highest daily inflow since September. At the same time, total inflows across all major exchanges approached 600,000 ETH, one of the largest coordinated spikes seen in recent months.
Such concentrated inflows rarely appear during periods of strong accumulation. Instead, they tend to surface when large holders reposition exposure near key price levels. The timing of this inflow surge just ahead of ETH’s breakdown below $2,300, significantly increased the market’s sensitivity to downside moves. Combined with rising leverage, these inflows reduced the market’s ability to absorb selling pressure, amplifying the liquidation cascade once price began to slide.
Liquidation Pressure Builds as Leverage Unwinds Aggressively
Derivatives data shows Ethereum at the center of the latest liquidation wave. Over the past 24 hours, ETH-related liquidations surged to approximately $280 million, surpassing Bitcoin’s $250 million and reinforcing Ethereum’s role as the primary stress point in the market.
The liquidation heatmap reveals that long positions dominated losses, confirming that bullish leverage had become overcrowded near recent consolidation highs.
Once ETH slipped below short-term support, cascading stop-outs accelerated the move lower, pushing price swiftly through thin liquidity zones. This pattern reflects structural weakness rather than panic selling. When liquidations cluster this tightly, price movements tend to overshoot fair value before stability returns, leaving Ethereum vulnerable to additional volatility in the near term.
Ethereum Price Structure Weakens Below Key Support
Ethereum’s recent breakdown below the support zone of $2500 carries meaningful implications. The loss of the $2300-$2500 support level invalidated the prior consolidation structure and shifted market control firmly toward sellers. Ethereum price is now trading below its short-term moving averages, with momentum indicators pointing lower rather than stabilizing.
The absence of strong buying volume on the way down further suggests that demand remains cautious rather than aggressive. The immediate support sits near $2000, which if breaks a major decline toward $1600 could be seen next.
Is the Worst of the ETH Selloff Already Priced In?
Despite the ongoing selloff, Ethereum’s higher-timeframe structure is beginning to hint at a potential inverse head-and-shoulders formation. The structure formed after ETH’s slide toward the $2100-$2500 zone, where selling momentum started to fade and volume failed to expand on fresh lows. Recent price action suggests a right shoulder may be developing, indicating stabilization rather than going lower.
This reversal scenario gains credibility only if ETH price reclaims the $2500 neckline on strong volume. Until then, the pattern remains conditional, with a loss of $2100 invalidating the setup and restoring downside risk. A period of consolidation or a technical relief bounce cannot be ruled out if ETH holds its current demand zone. Until reclaim levels are decisively broken, the broader outlook stays cautious, with volatility likely to remain elevated.
FAQs
Why Ethereum Is Going Down Today?
Ethereum is dropping due to rising exchange inflows, leveraged long liquidations, and weak buying amid broader crypto market pressure.
How much ETH was liquidated recently?
Over $280 million in ETH long positions were liquidated in the last 24 hours, highlighting market stress and weak support.
Could Ethereum stabilize or reverse soon?
A potential inverse head-and-shoulders pattern suggests stabilization, but ETH must reclaim $2500 on strong volume to confirm.
January 2026 opened with a sharp reminder of crypto’s volatility. Bitcoin slipped toward the $82,000 mark, while total market liquidations surged past $1.7 billion in a single wave of selling. Investor sentiment deteriorated rapidly, with the Crypto Fear & Greed Index falling into extreme fear territory. Amid this market stress, a high-profile meme coin collapse drew widespread attention across the crypto community.
Murad’s Portfolio Suffers a Severe Drawdown
According to Ash Crypto, prominent meme-coin KOL Murad Mahmudov saw his meme coin portfolio collapse by nearly 86% over the past six months. At its peak in July 2025, the portfolio was valued at around $67 million. Today, that figure has fallen sharply to roughly $9.1 million, translating to cumulative losses of about $58 million during the downturn.
The scale of the drawdown has made Murad’s portfolio a clear case study of how quickly speculative crypto wealth can evaporate when market conditions shift.
Concentration Risk Amplifies Losses
Murad’s holdings were heavily concentrated in meme-based tokens, which suffered some of the steepest declines during the broader market pullback that began in late 2024. His largest reported position, SPX6900 (SPX), dropped more than 80% from its all-time high. Other major meme coin positions reportedly fell between 75% and 90%, compounding the overall damage.
This concentration significantly amplified losses as risk appetite faded. Unlike larger cryptocurrencies with deeper liquidity and broader use cases, meme coins tend to move sharply with sentiment, making them especially vulnerable during market-wide sell-offs.
Why Meme Coins Get Hit the Hardest
Analysts point to several overlapping factors driving such extreme declines. A shift in macro sentiment often pushes investors away from speculative assets first. Meme coins, which typically lack strong fundamentals or utility, are highly dependent on hype cycles and social momentum. Once that momentum breaks, selling pressure can escalate quickly.
Leverage also plays a key role. Aggressive traders frequently use borrowed capital in meme coin markets, which can trigger cascading liquidations as prices fall, accelerating losses across the board.
A Broader Lesson for Crypto Investors
While Mahmudov’s experience is notable due to his public profile, the pattern itself is familiar to seasoned crypto observers. Sharp drawdowns of 75% to 95% are not unusual for meme coins during broader downturns. The episode reinforces a long-standing lesson: diversification matters, speculative assets carry outsized risk, and capital allocated to high-volatility tokens must be money investors can afford to lose.
As crypto markets remain fragile, Murad’s portfolio collapse stands as a timely reminder that even during bull cycles, risk management remains essential.
Never Miss a Beat in the Crypto World!
Stay ahead with breaking news, expert analysis, and real-time updates on the latest trends in Bitcoin, altcoins, DeFi, NFTs, and more.
FAQs
Why did meme coins crash harder than Bitcoin in January 2026?
Meme coins rely heavily on hype and leverage, so when sentiment turns negative, they often fall faster and deeper than established assets like Bitcoin.
How much did SPX6900 and other meme coins lose recently?
SPX6900 lost over 80%, while other top meme tokens fell 75–90% during the latest crypto market downturn.
Are large drawdowns common in crypto markets?
Yes. Meme coins often fall 75–95% during downturns, highlighting the importance of risk management and portfolio balance.
What lessons do investors learn from meme coin crashes?
High returns come with high risk; disciplined investing, research, and diversification reduce the chance of catastrophic losses.
Tron Founder Justin Sun has again found himself in fresh allegations after a woman named Ten Ten, who claims to be his ex-girlfriend, shared a series of posts on X accusing him of manipulating the price of TRX.
The claims have drawn attention across the crypto community, and calls for stricter action from law enforcement agencies.
Justin Sun Accused of TRX Market Manipulation
In a recent tweet post on X, Ten Ten said she is not making baseless accusations and claims to hold extensive evidence.
She alleged that Justin Sun used the identities of several employees in Beijing to operate multiple Binance accounts in late 2017 and early 2018. According to her, these accounts were used to carry out coordinated buying and selling of TRX in order to push prices higher.
She alleged that these actions were meant to artificially increase TRX’s market capitalization. Once prices rose, she claimed large-scale sell-offs followed, allowing insiders to profit while retail investors faced losses.
I am not making empty accusations. I have a substantial amount of evidence, and what has been disclosed so far is only a very small portion of it.
Justin Sun used the identities of multiple employees based in Beijing to operate accounts on the Binance exchange, through which he… https://t.co/cq5fEzb9H9
Ten Ten also alleged that Justin Sun used media exposure and public hype to build excitement around TRX. She claimed this created an image of innovation and success, while the real activity involved insider trading and coordinated trades behind the scenes.
According to her, insider trading and coordinated trades were taking place, and these actions played a key role in growing Justin Sun’s wealth.
She also shared the names of twelve people from mainland China, alleging they worked under Justin Sun and took part in these activities. The names included Liu Tingting, Zhao Ling, Wei Shuai, Du Xuewen, Zhang Xin, Huang Kaijie, Han Min, Liu Jintong, Quan Yueyuan, Jiang Nijun, Liu Siqin, and Zhao Jitong.
Why Ten Ten Was Silent For These Years
Ten Ten said she was in a personal relationship with Justin Sun during Tron’s early days, which she claims gave her direct knowledge of these events.
She added that she stayed silent for years out of fear, saying money, influence, and power kept her from speaking earlier, but that fear is now gone.
She then followed up with a joke that, “I also have an ‘Epstein files’ of the crypto world.”
Willingness to Cooperate With U.S. Authorities
Lastly, Ten Ten said she is prepared to cooperate fully with an investigation by the U.S. Securities and Exchange Commission. She claimed to hold WeChat chat records, emails, exchange activity logs, phone data, and employee-provided evidence to support her allegations.
She also publicly requested U.S. authorities to contact her.
As of now, Justin Sun has not publicly responded, and no official action from regulators has been announced.
Never Miss a Beat in the Crypto World!
Stay ahead with breaking news, expert analysis, and real-time updates on the latest trends in Bitcoin, altcoins, DeFi, NFTs, and more.
FAQs
Could Justin Sun face legal consequences for alleged TRX manipulation?
If authorities verify the claims, he could face fines, sanctions, or SEC enforcement actions for market abuse.
How do insider trading allegations affect a crypto project?
Insider trading can harm investor trust, reduce market liquidity, and trigger regulatory investigations.
How can investors protect themselves from crypto manipulation?
Diversify holdings, research projects carefully, avoid hype-driven trades, and monitor market activity for red flags.
In 2021, Solana (SOL) shocked the crypto world with one of the biggest bull runs in history. The token skyrocketed from under $2 at the start of the year to nearly $260 at its peak — delivering gains of more than 17,000% in just 11 months. That surge turned early believers into millionaires almost overnight and solidified Solana as a top-tier blockchain ecosystem.
Fast forward to 2026, and many investors are asking a familiar question: Which project could be the next Solana? According to analysts, one DeFi newcomer is showing all the early signs — Mutuum Finance (MUTM). With a live protocol already on the Sepolia testnet, audited smart contracts, and over $20 million raised in its presale, Mutuum Finance is beginning to attract attention as a project that combines early-stage growth potential with real working utility.
Solana’s 2021 Surge
Solana’s success story was built on a simple but powerful foundation — scalability and speed. By offering low transaction fees and lightning-fast processing, it became the blockchain of choice for developers and DeFi projects during the 2021 bull run. Its ecosystem exploded, driving massive demand for the SOL token and propelling its price from just $1.50 to almost $260.
However, while Solana remains a leading crypto asset today, trading around $95, its growth curve has stabilised. Analysts now view it as a blue-chip blockchain — strong but unlikely to deliver the exponential returns of its early years. That has investors turning their focus toward emerging projects with similar innovation potential but still at an early valuation stage.
Mutuum Finance (MUTM): A DeFi Platform with Proven Progress
Mutuum Finance fits that profile. The project aims to reshape decentralized lending and borrowing by combining user-friendly design, security, and practical yield mechanics. Mutuum has already launched its V1 protocol on the Sepolia testnet, allowing users to explore its main DeFi features using test tokens.
“Mutuum Finance Protocol is now live. You can now access the app, explore the initial markets, and start testing the core lending and borrowing flows.”
The protocol currently supports ETH, USDT, WBTC, and LINK, giving testers the ability to mint, supply, and borrow assets in a controlled environment. Users can deposit assets to earn yield, use them as collateral to borrow testnet USDT, and even stake mtTokens to receive simulated MUTM rewards.
Each depositor can track their portfolio through a real-time dashboard that visualizes lending and borrowing activity — a level of transparency that positions Mutuum as a serious DeFi contender once mainnet goes live.
How Mutuum Finance Works
When a user supplies assets, they receive mtTokens, which represent their deposits and accumulate yield over time. These tokens can also be staked to earn additional MUTM rewards through the project’s buy-and-distribute system, where a portion of protocol revenue is used to repurchase MUTM from the market and redistribute it to stakers.
Borrowers, meanwhile, receive Debt Tokens, which record both the principal and accrued interest tied to each loan. The platform also includes an Automated Liquidator Bot that monitors users’ collateral health and executes liquidations if necessary — ensuring system solvency and protecting lenders.
All of these features are currently available for testing on the Sepolia testnet, giving users a chance to experience Mutuum’s mechanics firsthand before the mainnet launch.
$20 Million Raised and Growing Investor Confidence
Mutuum Finance’s presale has become one of the most successful in the DeFi sector this year, raising over $20.25 million and attracting nearly 19,000 holders. The token, currently priced at $0.04 in Phase 7, has already surged 300% from its initial presale price of $0.01. With a confirmed launch price of $0.06, early investors are still entering at a discounted level before public trading begins.
Additionally, the project has reported that over 840 million MUTM tokens have already been sold, accounting for nearly 50% of the total 1.82 billion tokens allocated for the presale. This milestone underscores the strong investor demand and growing confidence in Mutuum Finance’s long-term potential, as the remaining allocation continues to diminish heading into the next phase.
Analysts See $0.50 by 2026 — and Beyond
Analysts are increasingly optimistic about MUTM’s price potential, with projections suggesting a rise to around $0.50 by late 2026 — a 1,150% gain from the current presale price. This outlook is supported by several key factors:
Real utility: Mutuum’s working protocol proves tangible value before launch.
Strong audits: Both Halborn and CertiK have reviewed its smart contracts, ensuring security and credibility.
Exchange readiness: With verified audits and a live product, MUTM is well-positioned for potential Tier-1 listings post-launch.
The Road Ahead
The Mutuum team has stated that their focus now is on improving and expanding the protocol with new functionalities and testnet updates in the coming weeks. Once mainnet-ready, the platform is expected to evolve into a full-scale decentralized ecosystem — a foundation that analysts say could replicate Solana’s early trajectory in its own sector.
If Solana’s 17,000% run in 2021 proved anything, it’s that early utility and timing matter most. Mutuum Finance appears to be aligning both.
At the current $0.04 price, a $1,000 investment would secure 25,000 MUTM tokens — worth $12,500 when the token reaches the projected $0.50 mark by 2026. For those who missed Solana’s breakout moment, Mutuum Finance could be the next best opportunity before the market turns parabolic once again.
For more information about Mutuum Finance (MUTM) visit the links below:
The search for the best cryptocurrency to invest in for short-term gains often leads traders to popular names. Today, many are looking at Dogecoin (DOGE), Ethereum (ETH), and a new contender, Mutuum Finance (MUTM). While DOGE and ETH have big communities, their short-term paths are filled with uncertainty. Dogecoin’s price swings on social media hype, and Ethereum’s progress is slow. This makes a new crypto coin with a clear launch plan very attractive for quick, smart growth.
Dogecoin: High Risk From Hype and Volatility
Dogecoin recently saw a huge surge in trading activity, but its core metrics are weak. Its price is falling, and large investors are moving away from it. DOGE often moves based on online trends, not real project development. This makes it a very risky short-term choice. A trader might buy DOGE hoping for a quick rise, but a sudden market shift could wipe out those gains just as fast. For people looking for the best crypto to buy today, this level of unpredictability is a major problem. It is better to find assets with real use and stable growth plans.
Ethereum: Strong But Slow for Short-Term Gains
Ethereum is a very important blockchain, but its price growth has been slow. Data shows that while trading activity has returned, the price of ETH has not followed. It is still much lower than its previous high. Experts think it might reach $4,000 again, but this could take a long time. For a short-term investor, waiting weeks or months for a small increase is not ideal. Ethereum is a good long-term hold, but it is not the top crypto for quick returns right now. Investors want faster opportunities, which newer projects can provide.
Mutuum Finance Presale: The Prime Short-Term Opportunity
Mutuum Finance (MUTM) stands out as the best cryptocurrency to invest in for the short term. Its presale is in Phase 7, with tokens at $0.04. This is the last chance to buy at this price before it increases. The launch price is set at $0.06, but analysts see much higher potential post-launch. Because of high demand and limited supply, some predict the price could jump 8x soon after listing. This means a $200 investment could become $1,600 in a short period. This growth is much faster and more certain than waiting for older coins to move.
Earn Immediate Rewards with Liquidity Mining
Another reason MUTM is a top crypto for short-term action is its liquidity mining program. Users can deposit funds to earn high yields. For example, providing $10,000 in liquidity could earn a 15% annual return. That could mean $1,500 in extra income in one year. But even in the short term, rewards are distributed frequently, providing quick income. This allows investors to earn while they hold, making their capital work for them immediately.
Get Regular Dividends from Protocol Fees
Mutuum Finance has a system that shares its success with token holders. A part of every fee from lending and borrowing is used to buy MUTM tokens back. These tokens are then given to people who stake their tokens in the system. Think of it like getting a cash dividend from a company. If you stake $10,000 in MUTM, you could earn a share of thousands of dollars in fee revenue. This creates a steady stream of extra tokens on top of any price increase. This double earning potential is what makes a new crypto coin like MUTM a powerful short-term asset.
Why MUTM Tops the List for Quick Growth
The V1 protocol launch for Mutuum Finance is a key event that has driven attention and value. While Dogecoin depends on memes and Ethereum moves slowly, MUTM offers a clear plan for rapid growth. Its presale phase offers a low entry point while its liquidity mining provides instant yield and its profit-sharing model rewards holders directly. For any investor making a list of the top cryptos to buy today for the short term, Mutuum Finance (MUTM) presents the strongest case. It combines the high growth of a new launch with real, working products that generate value from day one.
For more information about Mutuum Finance (MUTM) visit the links below:
MSTR stock price is under fresh pressure as Bitcoin’s slide below $75,000 pushes Strategy’s holdings into a $900 million unrealized loss. Strategy’s growing unrealized Bitcoin loss is putting fresh focus on its stock, as investors weigh whether MSTR has more…
Jupiter has integrated Polymarket into its platform, bringing crypto’s largest prediction market to Solana for the first time and giving users direct access to event-based trading without leaving the Jupiter app. The decentralized exchange announced the partnership on Feb. 1,…
The crypto market has shifted from building infrastructure to delivering real-world utility. Established projects like Sui (SUI) are developing and advancing their networks to attract large investors. While these developments happen, the retail world is craving for platforms that make crypto spendable like cash.
On that note,Digitap ($TAP) has come to fill this gap. It is building an omni-bank ecosystem that merges the speed of decentralized finance with the structural reliability of traditional banks. Digitap has transitioned beyond the whitepaper phase to deliver an operational bridge between the two sectors.
Despite being in its crypto presale, the project already has a live application available on iOS and Android. Remarkably, it is a fully functional banking app that treats digital currencies as primary tools for daily financial lives.
Moreover, it has connected at least 120,000 wallets, proving that the future of finance will be determined by how easily users can spend the digital assets in the real world. With the latest announcement that Solana deposits are live, Digitap outranks Sui as the best crypto to buy for real-world adoption.
Digitap Vs Sui: Real-World Spending Utility Beats Developer Infrastructure
Sui is a masterpiece of blockchain engineering. It is built with an object-centric architecture enhanced with fast transaction speeds. Despite the impressive components, the 2026 market values real-world utility. On that note, SUI is not directly connected to the global economy, which pushes investors toward other projects offering this utility.
Despite many network improvements, Sui remains a developer-first ecosystem, with success determined by Total Value Locked (TVL) and dApp deployments. For normal investors, the infrastructure-heavy model feels out of touch, since they only want a platform that lets them spend their crypto balances on real-world goods.
SUI’s price action shows signs of speculation fatigue, as the token struggles to maintain momentum amid ongoing token unlocks. Also, capital is flowing out as investors grow weary of a circulating supply that keeps diluting investments for early holders.
On the other hand, Digitap is dominating the market as the best altcoin to buy because it focuses on consumer-first finance. While Sui is building faster chains, Digitap is building faster ways of spending crypto in the real world. It offers a level of immediate usefulness that established infrastructure tokens like SUI cannot match.
Live Solana Deposits Drive $TAP’s Crypto Presale Surge
The official launch of Solana deposits is considered among the major catalysts fueling Digitap’s huge crypto presale momentum. Users can now top up their Digitap wallets with USDC and USDT directly from the Solana network without involving centralized exchanges.
This collaboration is considered a massive milestone because it enables Digitap to tap into the most active retail community dominating the crypto industry. In that context, Solana investors can move their assets into the Digitap banking rails almost instantly, benefiting from huge speeds and low-cost transaction fees.
Once the funds reach the project’s ecosystem, they become spendable like stablecoins or fiat via the Digitap Visa card. Hence, users can spend their SOL balances at over 80 million merchant locations where Visa is accepted.
With the Solana deposits live, Digitap has changed the world’s fastest retail blockchain into a global payment rail. The interoperability helps users avoid the challenges that come with using complex bridges or centralized exchanges. Therefore, users can manage their funds using one secure application functional on iOS and Android.
The Functional Omni-Bank Helps $TAP Outpace Competitors
Digitap also outpaces Sui as the best crypto to buy because it has a live omni-bank platform that offers real-world utility. Most presales depend on promises of future utility to thrive, while Digitap already has a functional mobile app. This early-stage utility eliminates the execution risk that affects new projects.
Users can download the app and set up their accounts to experience the smooth transition between crypto and fiat. The omni-bank infrastructure offers multiple services that outshine simple wallets. They have multiple features fueled by the $TAP utility token.
Investors are rushing to buy Digitap in its crypto presale since it offers a banking completeness experience. This enables $TAP to thrive even when the market is volatile.
People always transact and move money even when the market is shaky. Digitap has positioned itself as an essential financial tool, helping it build a resilient ecosystem that delivers continuous platform revenue.
$TAP’s financial structure is built for long-term scarcity and investor reward. In its crypto presale, investors can earn an impressive 124% APY by staking their tokens. In the case of other DeFi protocols, high yields often cause massive inflation.
On the other hand, Digitap’s staking rewards are powered by a fixed, pre-allocated pool enhanced with a revenue-sharing model. Moreover, the project features a hyper-deflationary “buy-back and burn” mechanism. Through this mechanism, 50% of all platform profits are used to buy $TAP tokens from the open market and burn them.
$TAP is currently in Round 3 of its presale, available at $0.0454. The token is trading at a 67.57% discount compared to its set exchange listing price of $0.14. Buyers who purchase the token at its current price will enjoy a built-in gain of 208% before the token hits the open market.
With a fixed supply of 2 billion tokens and a growing user base that now exceeds 120,000 wallets, investors consider it the best crypto to buy in this cycle. More than 206 million tokens have been sold, raising at least $4.7 million in early funding.
The Retail-First Powerhouse Bridging Crypto and Real-World Spending
While SUI remains a strong contender in the Layer-1 sector, its growth is limited by the slow speed of institutional infrastructure adoption. Investors consider it a mature token that would need billions in inflows for its price to record multiplier gains.
On the contrary, Digitap is thriving since it appeals to the retail market. Its crypto presale has moved from speculation toward execution after it launched Solana-native rails. The project has also integrated with Visa, helping make crypto spendable like cash in the real world.
For investors seeking the best crypto to buy, $TAP offers a great opportunity. It integrates early-stage pricing, high-yield staking, and real-world financial utility, making it a potentially lucrative investment option.
Discover how Digitap is unifying cash and crypto by checking out their project here:
Bitcoin infrastructure projects are no longer judged on vision alone. As the ecosystem matures, credibility is tied to whether a project demonstrates verifiable progress, defined utility, and accountable development while respecting Bitcoin’s conservative design philosophy.
This shift has produced a clearer framework for evaluation. When applied consistently, it highlights why some early-stage projects gain attention while others fade after initial exposure. Bitcoin Everlight is being examined through that lens during its formative stage.
Transparency and Verifiable Information
A credible Bitcoin infrastructure project provides concrete documentation and traceable information. This includes technical documentation that explains system design, clearly defined token mechanics, and disclosure around how the network is intended to operate under real conditions.
Bitcoin Everlight publishes detailed material covering its transaction-layer architecture, node mechanics, and token distribution structure. Team identities are disclosed and verifiable, reducing uncertainty around accountability during development and network operation. This level of disclosure allows external parties to assess design intent alongside observable execution.
Clear Utility Within the Bitcoin Ecosystem
Infrastructure credibility depends on whether a project addresses a specific constraint within Bitcoin’s existing framework. Bitcoin’s base layer prioritizes security and settlement finality, leaving transaction throughput and payment usability to layered systems.
Bitcoin Everlight functions as a lightweight transaction layer alongside Bitcoin, without modifying Bitcoin’s protocol, consensus rules, or issuance model. Bitcoin remains the settlement layer. Everlight focuses on transaction routing and rapid confirmation through a dedicated node network, producing confirmations in seconds with optional anchoring back to Bitcoin. This utility is defined by function, not abstraction, and can be evaluated during early operation.
Security Review and Team Accountability
Security discipline is central to infrastructure credibility. Bitcoin Everlight has completed third-party reviews covering smart contract logic and system components through the SpyWolf Audit and the SolidProof Audit. These reviews focus on execution paths, deployment structure, and identified risk surfaces relevant to a transaction-routing system.
Team accountability has also been addressed through formal identity verification, including SpyWolf KYC Verification and Vital Block KYC Validation. These processes link identifiable individuals to development, governance, and operational control, which is a prerequisite for institutional and infrastructure-focused scrutiny.
Decentralized Operation and Measurable Node Performance
Credible infrastructure avoids reliance on centralized control points. Bitcoin Everlight operates through a network of specialized nodes that are distinct from Bitcoin full nodes. Node operators stake BTCL tokens to register and participate in transaction routing and lightweight validation.
Network behavior is governed by measurable performance. Routing micro-fees are distributed based on transaction volume handled. Uptime coefficients track availability over defined intervals, while performance metrics measure latency, confirmation success, and sustained throughput. Nodes demonstrating consistent performance receive higher routing priority, directly affecting compensation. Nodes that fall below performance thresholds see routing volume reduced until metrics recover. A fixed 14-day lock period supports predictable participation during early network operation.
Presale Structure and Alignment With Execution
Token distribution plays a role in credibility when it aligns with network activity. BTCL has a fixed total supply of 21,000,000,000 tokens, with 45% allocated to the public presale across 20 stages. The presale is currently in Stage 2, with a token price of $0.0010, advancing toward a final stage price of $0.0110.
Presale release is structured to moderate circulation. 20% of tokens unlock at the token generation event, with the remaining 80% released linearly over six to nine months. Beyond the presale, 20% of supply is reserved for node rewards and network incentives, 15% for liquidity provisioning, 10% for the team under a 12-month cliff and 24-month vesting schedule, and 10% for ecosystem development and treasury use. BTCL utility is tied to transaction routing fees, node participation, performance incentives, and anchoring operations.
Community Engagement and Public Evaluation
Credibility also emerges from sustained external engagement. Bitcoin Everlight’s architecture and node mechanics have been discussed publicly, allowing independent observers to examine how the system behaves during early operation. In a recent overview, Crypto League breaks down Everlight’s routing flow, node participation structure, and confirmation process under live conditions.
Such third-party discussion contributes to an environment where technical progress and limitations are openly examined, which is essential for infrastructure projects operating within the Bitcoin ecosystem.
Evaluate which Bitcoin infrastructure projects demonstrate credibility through execution and transparency.
The latest crash came after US President Donald Trump nominated Kevin Warsh to replace Federal Reserve chair Jerome Powell, sending Bitcoin down to $75,892 late on Sunday.
Crypto prices today are under pressure as Bitcoin and major altcoins extended losses amid forced liquidations and weak liquidity. The total crypto market capitalization fell 2.8% to about $2.6 trillion. Bitcoin was trading at $75,501 at press time, down 5.2%…
Bitcoin opened the week with a sharp CME futures gap after January’s heavy losses, as weak liquidity and cautious positioning kept pressure on price. Bitcoin-linked derivatives opened the new trading week with a sharp price gap after CME futures reopened…
Price predictions for 2026 range from $0.008 to $0.014.
FLR could extend toward $0.30 by 2030, if recovery structure holds.
Flare (FLR) is a smart contract–enabled blockchain focused on cross-chain data access and interoperability. Since its initial listing phase, the token has spent a significant amount of time repricing, moving from early volatility into a prolonged period of range-bound trading.
Recently, however, the nature of price action has begun to change. Instead of sharp declines, FLR has started forming more stable reactions around established demand zones. Volatility has eased, and price swings have become narrower. From a market structure standpoint, these conditions often appear when an asset is transitioning from distribution into base formation, raising questions about whether FLR could be approaching a turning point as 2026 draws closer.
Looking further ahead, 2026 could prove to be a defining year for FLR if the current base resolves to the upside. Long periods of sideways movement often precede stronger directional moves once key resistance levels are cleared. Should FLR break above the $0.015–$0.018 resistance region and maintain acceptance, price could gradually work its way toward the $0.03–$0.04 zone. This area represents a prior congestion range and would likely attract increased trading activity.
If momentum remains constructive and broader market conditions cooperate, FLR could extend its advance toward $0.06 before the end of 2026. A cross of this level would mark a clear shift away from consolidation and into trend development. However, a drop below $0.0075 would undermine the recovery structure and delay bullish expectations.
Flare Crypto Price Prediction 2026 – 2030
Year
Potential Low ($)
Potential Average ($
Potential High ($)
2026
0.010
0.030
0.060
2027
0.025
0.060
0.095
2028
0.050
0.115
0.175
2029
0.090
0.190
0.245
2030
0.150
0.240
0.300
FLR Price Prediction for 2026
The Flare price range in 2026 is expected to be between $0.010 and $0.060.
FLARE Price Forecast for 2027
Flare (FLR) price range can be between $0.025 to $0.095 during the year 2027.
FLARE Price Outlook for 2028
In 2028, Flare price is forecasted to potentially reach a low price of $0.050 and a high price of $0.175.
FLR Price Forecast for 2029
Thereafter, the Flare (FLR) price for the year 2029 could range between $0.090 and $0.245.
Flare Price Prediction 2030
Finally, in 2030, the price of Flare is predicted to maintain a steady positive. It may trade between $0.150 and $0.300.
Based on the historic data and trend analysis of the cryptocurrency along with the market sentiments, here are the possible Flare price targets for the longer time frames.
Year
Potential Low ($)
Potential Average ($)
Potential High ($)
2031
0.180
0.290
0.390
2032
0.220
0.360
0.480
2033
0.220
0.430
0.560
2040
0.450
0.720
1.00
2050
0.700
1.10
1.50
Flare (FLR) Price Prediction: Market Analysis?
Year
2026
2027
2030
Changelly
$0.054
$0.090
$0.250
CoinCodex
$0.060
$0.108
$0.270
WalletInvestor
$0.037
$0.080
$0.280
CoinPedia’s Flare Price Prediction
Based on current technical structure and observed market behavior, Coinpedia’s price outlook implies that Flare (FLR) price is expected to trade between $0.010 and $0.060 in 2026, assuming support levels remain intact. Over the longer horizon, continued recovery could allow FLR to move toward the $0.20-$0.30 range by 2030, subject to overall market conditions.
Year
Potential Low ($)
Potential Average ($)
Potential High ($)
2026
0.010
0.030
0.060
Never Miss a Beat in the Crypto World!
Stay ahead with breaking news, expert analysis, and real-time updates on the latest trends in Bitcoin, altcoins, DeFi, NFTs, and more.
FAQs
Is Flare (FLR) a good investment for 2026?
FLR could be promising if it breaks key resistance and holds support. Its long consolidation suggests base formation, but outcomes depend on market conditions.
What price can Flare (FLR) reach in 2026?
In 2026, Flare is projected to trade between $0.010 and $0.060, with upside potential if it clears the $0.015–$0.018 resistance zone.
What is the long-term outlook for Flare (FLR)?
Long term, Flare shows potential for gradual growth, with forecasts suggesting higher highs through 2030 and beyond if development and usage expand.
How much will the Flare coin be worth in 2030?
By 2030, Flare could trade between $0.15 and $0.30 if network adoption grows and broader crypto markets remain supportive.
What is the Flare crypto price prediction for 2040?
Long-term projections suggest FLR may range from $0.45 to $1.00 by 2040, assuming sustained ecosystem growth and real-world utility.
The crypto market is under heavy pressure today, with prices falling sharply over the weekend and investors asking one question: what went wrong? The answer lies in a mix of forced selling, weak demand, and price levels breaking all at once.
The total crypto market value has dropped to around $2.6 trillion, down nearly 5% in the last 24 hours. Bitcoin, which was trying to hold above $78,000, has now slipped below that level, adding to market fear. Many traders are now watching the next major support near $75,000.
The biggest driver of today’s crash is liquidations. In just 24 hours, more than $2.58 billion worth of crypto positions were wiped out. This happens when traders use borrowed money and prices move against them, forcing exchanges to close positions automatically.
Weekend Trading Made It Worse
Weekend markets usually have lower trading volume and thinner liquidity. That means fewer buyers are available when prices start falling. As Bitcoin dropped below key levels, sell orders piled up quickly, pushing prices down faster than usual.
Bitcoin Breaks Key Levels
Bitcoin falling below $78,000 was a major technical trigger. This level had been acting as short-term support. Once it broke, many traders exited positions. Bitcoin is also testing an important long-term support level when compared to gold, making this zone critical.
If Bitcoin fails to hold near current levels, analysts see $75,000 as the next strong support. A break below that could bring even more selling.
Altcoins Hit Harder
Altcoins are feeling even more pain:
Ethereum is down sharply over the week, losing more than 20%
XRP, Solana, and BNB are all deep in the red
The CoinMarketCap 20 Index is down over 14% in seven days
Market Fear Is Extreme
Investor sentiment has collapsed. The Fear and Greed Index is at 18, which signals extreme fear. Technical indicators show most coins are now oversold, meaning prices have fallen very quickly in a short time.
Weak Demand Adds Pressure
On top of liquidations, demand has been weak. Large investors have been cautious, and there has been no strong buying support to absorb the selling. When forced liquidations meet low demand, prices fall fast.
What Happens Next
The market now depends on whether Bitcoin can stabilise above $75,000. If selling slows and liquidations dry up, a short-term bounce is possible. But if fear continues and key supports fail, volatility could remain high in the coming days.
For now, the weekend crash shows how quickly crypto markets can turn when leverage, fear, and low liquidity collide.
Analyst PlanC called the current $75,000–$80,000 zone a potential cycle bottom, stating there is “a decent chance this will be the deepest pullback opportunity this Bitcoin bull run.” Bitcoin (BTC) traded between $77,082 and $83,426 over the past 24 hours,…
India’s Union Budget 2026 has kept the existing crypto tax framework unchanged, even as the government moved to tighten compliance through stricter penalties. While oversight has increased, industry leaders say the Budget missed a key opportunity to support long-term growth in crypto and Web3.
The Finance Bill introduces penalties to enforce reporting under Section 509 of the Income-tax Act, 2025. Union Finance Minister Nirmala Sitharaman said the aim is to deter non-compliance in crypto-asset reporting.
Under the amendment, entities that fail to file crypto transaction statements will face a ₹200 per day penalty, while furnishing incorrect or misleading information — or failing to correct it — will attract a ₹50,000 fine. These provisions will take effect from April 1, 2026.
“Tax Regime Remains Restrictive”
Reacting to the Budget, Sathvik Vishwanath, Co-founder and CEO of Unocoin, said expectations from Budget 2026 were much broader than enforcement alone.
“The Union Budget 2026 was expected to play a decisive role in shaping India’s approach to crypto assets and Web3 technologies,” he said in an interview with Coinpedia. “A primary expectation was the rationalisation of the existing tax regime for virtual digital assets, which is currently restrictive and misaligned with broader financial market practices.”
Sathvik added that allowing loss set-offs, reducing transaction-level friction, and aligning crypto taxation with other asset classes would have helped restore domestic liquidity and encourage compliant participation within India.
Regulatory Clarity Still Missing
Beyond taxes, Sathvik stressed that the lack of a clear regulatory framework continues to hurt Indian exchanges.
“The absence of a comprehensive, crypto-specific framework has created uncertainty for exchanges, investors, and technology developers,” he said. “Clear definitions, licensing norms, compliance standards, and consumer protection mechanisms are essential for long-term planning and responsible innovation.”
He warned that unclear rules have already reduced local trading volumes and pushed users to offshore platforms.
“A well-defined framework would help retain market activity within India, strengthen domestic exchanges, and improve regulatory oversight,” Sathvik said.
How India Compares Globally
Sathvik also opened up about how India lags behind global crypto hubs. He pointed out that Dubai has introduced purpose-built digital asset regulations, while Singapore follows a structured licensing and consumer protection model. The United States, despite earlier fragmentation, is gradually moving toward clearer asset classification.
“Compared to these jurisdictions, India’s current framework lacks the clarity and cohesiveness required to compete effectively for global capital, talent, and innovation,” he said.
Classified emails from the Department of Justice’s document release revealed Jeffrey Epstein claimed direct contact with Bitcoin’s creators as early as 2016. A October 13, 2016 email from Epstein to recipients Raafat Alsabbagh and Aziza Alahmadi discussed using Bitcoin technology…
Solana price continued its strong downward trend and hit its lowest level since January 2024 as the crypto market crash intensified despite its strong fundamentals. Solana (SOL) dropped to $104, down sharply from its all-time high of nearly $300. This…
XRP’s recent price fall has worried many investors, but fresh chart analysis hints the move may not be the end of the cycle. Even after slipping below key levels, XRP is still behaving in a way that has historically led to strong rallies.
According to analyst Egrag Crypto, on the monthly chart, XRP recently tested an important support zone around $1.60–$1.61, with the lowest dip reaching near $1.50. Despite this drop, XRP managed to close the month above $1.60 and started February near $1.66, showing that buyers are still active around this level.
This area matters because it has acted as a key turning point in past market cycles. The recent dip appears to be a liquidity grab, a phase where prices briefly fall to shake out weak positions before the next big move.
Two Possible Paths From Here
Market history shows two common outcomes after similar setups:
First path: XRP sees a short-term bounce, then dips once more to test lower levels, before starting a stronger upward move. Second path: XRP skips the second dip and begins rising directly, similar to earlier cycles.
In past rallies, XRP delivered massive gains even without a full bull market:
In the 2021 cycle, XRP rallied about 340%, which would point to a price near $7 from current levels.
In the 2017 cycle, XRP surged nearly 1,600%, which would imply much higher long-term targets.
Why a Breakdown Is Not “Game Over”
A monthly close below $1.60 would confirm weakness in the broader trend. However, history shows that XRP’s strongest rallies often happen during bearish or corrective phases, not during clear bull markets.
Such breakdowns usually come with:
Fear-driven selling
Forced exits
A reset phase before larger moves begin
These conditions have previously set the stage for sharp recoveries.
The $7 Target Explained
If XRP continues to hold key structural levels and follows a pattern similar to the 2021 cycle, a 340% recovery would place XRP around $7. Analysts note that these moves are driven by market structure, not sentiment, and often start when confidence is at its lowest.
Pi Coin (PI) token plunged to a low of $0.1515, a few points below its previous all-time low of $0.1545. It has now plunged by over 93% from its record high of $2.98.
Bitcoin is at a crucial stage on the higher time frame charts. The broader structure still allows one final dip before a more stable base is formed. This aligns with earlier projections for early 2026, where prices were expected to make another low before any sustained recovery begins.
At current levels, Bitcoin may still revisit recent lows, with the $75,000 area emerging as an important zone to watch. Such moves are often seen near the end of corrective phases, where prices briefly fall lower before finding support.
What the Charts Are Signalling
Bitcoin remains close to levels that have historically marked important market bottoms. The Relative Strength Index (RSI) on this timeframe is nearing zones last seen during major downturns, suggesting selling pressure has already done significant damage.
On the daily chart, RSI has already moved into deeply stretched territory. In past cycles, similar conditions often appeared near points where prices later bounced. While this does not confirm an immediate recovery, it indicates that downside may be becoming limited.
Short-Term Levels That Matter
Despite a small rebound, analysts say Bitcoin has not yet confirmed a clear low. The recent move higher still looks like a short-term bounce rather than a full trend shift.
A first positive signal would be a sustained move above $80,000, followed by higher lows. A stronger confirmation would come if Bitcoin manages to break above $84,500, which could open the door to a broader recovery phase.
What Happens If Support Breaks
If Bitcoin fails to hold current support levels, another drop remains possible. In that case, the market could slide toward $75,000 before finding stronger buying interest. This zone is being closely watched as a potential area where prices could finally stabilise.
The crypto market is facing a major sell-off today, with total market value dropping to $2.66 trillion, down more than 6% in the last 24 hours. Bitcoin, Ethereum, XRP and other major cryptocurrencies have all fallen sharply, wiping out nearly $500 billion from the market in just a few days.
The biggest reason behind this fall is global uncertainty around interest rates. Investors turned bearish after news related to a new US Federal Reserve leadership appointment, which raised fears that future monetary policy could stay tighter for longer. When interest rates are expected to remain high, risky assets like crypto usually suffer, as investors move money into safer options.
This macro-driven fear pushed both stock markets and crypto lower at the same time. Over the past week, crypto prices have shown a strong link with US equities, showing how closely digital assets now react to traditional financial markets.
The decline was made much worse by massive liquidations. As prices started falling, leveraged traders were forced out of their positions. Over the last three days, nearly $5 billion worth of leveraged long and short positions were liquidated. When this happens, exchanges automatically sell assets to cover losses, which adds extra selling pressure and accelerates the crash.
Ethereum has been hit particularly hard. Reports of large unrealised losses held by institutional players increased fear around ETH, dragging down the wider altcoin market. As Ethereum weakened, confidence across the market dropped further.
Here’s how major cryptocurrencies were affected:
Bitcoin fell around 13%, losing nearly $265 billion in market value.
Ethereum dropped about 25%, erasing roughly $91 billion.
XRP declined close to 22%, wiping out around $24 billion.
Solana crashed more than 23%, losing about $16 billion.
Market sentiment has turned extremely bearish. The Fear and Greed Index has slipped to 18, a level classified as Extreme Fear. Many technical indicators now show the market is oversold, meaning prices may have fallen too fast in a short time.
Looking ahead, the short-term outlook depends on whether Bitcoin can hold the $77,000 support level. If that breaks, further downside is possible. Investors are also closely watching upcoming signals from the US Federal Reserve, which could determine whether markets stabilise or see another wave of selling.
The XRP price crashed to the lowest level since April last year as the crypto market plunged and liquidations accelerated. Ripple (XRP) token dropped to a low of $1.5000, down by 55% from its highest point in 2025, a plunge…
In this week’s edition of the weekly recap, Bitcoin pulled back sharply from its October all-time high while trading around $78,000, Tether disclosed record annual profits exceeding $10 billion, and the Department of Justice secured legal title to over $400…
Crypto Missing From India’s Union Budget 2026 Speech
India’s Union Budget 2026 speech made no mention of cryptocurrency or digital assets, signaling continued uncertainty for the domestic crypto industry. The absence of any policy update leaves existing tax and regulatory frameworks unchanged, despite repeated calls from industry participants for clearer rules.
February 1, 2026 06:51:22 UTC
India Budget 2026: Crypto Tax Data Shows Investors Paid Tax Even After Losses
New data shows a growing gap between crypto trading outcomes and tax liability. While high-activity traders contribute most of the TDS, thin profit margins mean both active and retail investors are facing liquidity pressure.
In FY 2024–25, investor results were almost evenly split, with 50.91% reporting net gains and 49.09% ending the year with net losses. Despite this, taxable capital gains rose to ₹3,722 crore, even though actual net profits were lower. Investors who collectively recorded ₹1,178 crore in net losses still paid tax on ₹180 crore of gains, as current rules do not allow losses to be set off.
February 1, 2026 06:51:22 UTC
India Budget 2026: Buybacks to Be Taxed as Capital Gains for All Shareholders
The government has announced a change in how share buybacks will be taxed. Union Finance Minister Nirmala Sitharaman said that buybacks will now be treated as capital gains for all shareholders.
The move is meant to stop the misuse of tax benefits through buybacks. Promoters, in particular, will have to pay more tax on buyback income. Corporate promoters will be taxed at 22%, while non-corporate promoters will face a 30% tax.
The new rule aims to make buyback taxation more uniform and reduce tax loopholes.
February 1, 2026 06:14:23 UTC
India Budget 2026: India’s Crypto TDS Mismatch Leaves Traders Owed Crores in Refunds
India’s crypto ecosystem saw ₹511.83 crore collected as TDS in FY 2024–25, but new data highlights a growing mismatch between tax deducted and actual tax owed. KoinX users alone contributed ₹130.16 crore, or 25.43% of total collections, even though their final tax liability stood at only ₹91.64 crore. This resulted in an estimated ₹38.52 crore locked in excess TDS and potential refunds.
The imbalance appears widespread. Over 30% of TDS deductions exceeded traders’ final tax dues, while nearly half of all TDS-paying users ended the year with net capital losses. At the same time, trading activity remains highly concentrated, with less than 5% of traders accounting for 87% of total TDS collections.
February 1, 2026 05:31:02 UTC
India Budget 2026: New Data Fuels Calls to Reform India’s Crypto Tax Regime
As the Union Budget 2026 approaches, India’s crypto industry is calling for a more outcome-based tax framework, including rationalisation of the 30% capital gains tax, permission to offset losses, and a review of the 1% tax deducted at source (TDS) on crypto transactions. These demands are supported by India’s Crypto Tax Story 2025, a new report by KoinX, which analyses anonymised data from nearly 7 lakh Indian crypto users in FY 2024–25 and shows how current tax rules often diverge from actual investor outcomes.
February 1, 2026 05:09:14 UTC
India Budget 2026: Crypto Rules Must Shift Beyond Tax and Enforcement,
Manhar Garegrat, Country Head–India at Liminal Custody, said India’s crypto policy needs to move toward market structure and sustainability, warning that current tax frictions are pushing compliant trading activity offshore. He urged Budget 2026 to rethink transaction-level taxes and consider a VDA transaction tax model to keep crypto activity onshore, transparent, and economically viable.
February 1, 2026 05:09:14 UTC
India Budget 2026: Will Crypto Take Center Stage?
Crypto and Bitcoin taxes are in focus today, with expectations of rationalisation and clearer rules rather than any expansion of the 30% levy, even as the government has not yet signaled formal changes.
The crypto market crash accelerated on Saturday as the futures open interest dipped and liquidations soared to over $1.6 billion, the highest level in weeks. This article explores whether the crypto industry will recover as the sell-off intensifies. Why the…
The ongoing crypto crash intensified on Saturday, with Bitcoin and most altcoins being in the deep red. Bitcoin (BTC) dropped below the important support level at $80,000 for the first time in months, while Ethereum (ETH) moved to a low…
Wintermute founder Evgeny Gaevoy dismissed claims that Binance caused the October 10 crypto market crash, calling attempts to blame a single exchange “intellectually dishonest.” Writing on X, Gaevoy called the event as “a flash crash on mega leveraged market on…
Bitcoin spot ETFs recorded $509.70 million in net outflows on January 30 and mark the fourth day of redemptions in five trading sessions. BlackRock’s IBIT led withdrawals with $528.30 million in outflows, while Fidelity’s FBTC attracted $7.30 million in inflows…
The market has been shaky for months. The recent crypto crash has pushed many prices down and shaken weak hands. But history shows that these periods often create the best entry points. When fear is high and prices are still calm, smart investors prepare for the next move up. As signs slowly point toward recovery, some projects stand out more than others. Among them, Mutuum Finance (MUTM), XRP, and Cardano (ADA) continue to attract attention for very different reasons. While XRP and Cardano (ADA) are well-known names, Mutuum Finance (MUTM) is still early. That early stage is exactly why many investors are watching it closely before the market turns bullish again.
XRP (XRP)
As of January 27, 2026, XRP is consolidating around $1.88–$1.90 after failing to break above the $2.00 resistance, with the Fear & Greed Index showing extreme fear (20–29). The market faces short-term bearish pressures, testing support near $1.80–$1.86, while resistance sits at $2.10–$2.30. Technicals indicate a strong sell on moving averages, with RSI at 46, and a descending triangle or wedge pattern suggests a possible short-term low before a rebound. Mixed ETF flows, institutional adoption, and the upcoming 1B XRP escrow unlock create cautious sentiment, keeping XRP neutral until bulls regain key levels.
Cardano (ADA)
Cardano (ADA) is trading on Coinbase against the USD, showing promising distribution levels that suggest strong potential for upward momentum. Key zones at $0.4413, $0.5498, $0.7591, $0.8135, $1.0109, $1.3357, and $1.5647 highlight areas where buying interest has historically been strong, providing solid support for bullish moves. ADA appears poised to test higher distribution levels, with mid-range zones offering a foundation for sustained gains. With growing adoption and positive market sentiment, ADA’s price could continue climbing, aiming to break above previous resistance levels and potentially reach new highs in the near term.
Mutuum Finance (MUTM) Presale Momentum and Early Opportunity
Mutuum Finance (MUTM) is currently in presale phase 7, with the token priced at $0.04. The total supply is fixed at 4 billion tokens, and combining all presale phases so far, the project has already generated around $20.20 million. More than 19,000 holders have joined across all phases, showing strong and growing interest.
Security is another major factor. In November 2025, Mutuum Finance (MUTM)’s smart contracts underwent a formal audit by Halborn, a respected blockchain security firm. The review flagged six issues, including one high-severity finding, all of which were fully resolved by the team. Halborn confirmed that 100% of reported findings were remediated.
Utility, Growth Drivers, and Why MUTM Stands Out
Mutuum Finance (MUTM) is designed as a decentralized lending and borrowing protocol with dual lending models. These models are peer-to-contract (P2C) and peer-to-peer (P2P). In the P2C model, users interact directly with liquidity pools managed by smart contracts. Lenders deposit assets into pools, while borrowers draw liquidity against collateral. In the P2P model, lenders and borrowers connect directly, allowing more customized terms between participants. This dual approach gives users flexibility and broadens the platform’s appeal.
The launch of Mutuum Finance (MUTM) V1 on the Sepolia testnet marks the project’s first live deployment in an environment close to mainnet conditions. This allows users to test the system without financial risk while helping the team refine the protocol through real activity. V1 introduces asset-based liquidity pools, mtTokens that earn interest, transparent debt tokens, automated liquidations, and support for ETH, USDT, LINK, and WBTC.
A practical example shows how this works. A lender could deposit $2,500 in USDT and receive mtUSDT, which grows in value as borrowers pay interest. On the borrowing side, a user could lock $5,000 worth of WBTC as collateral and borrow $3,000 in USDT. This allows access to funds without selling assets during a dip, a key advantage during uncertain market conditions.
These mechanics create a self-sustaining cycle. Lenders earn yield. Borrowers gain flexibility. Platform activity increases. As users interact with mtTokens and debt positions, MUTM becomes tied to real usage rather than pure speculation. This is a major growth driver, especially as defi crypto adoption continues to expand after the crypto crash.
Mutuum Finance (MUTM) also includes a buy-and-distribute mechanism. Part of the platform’s revenue from lending and borrowing will be used to repurchase MUTM tokens from the open market. These tokens will then be distributed to mtToken stakers as rewards. This structure encourages long-term participation and creates ongoing buy pressure as platform usage increases. Over time, higher activity means more revenue, more buybacks, and stronger demand for MUTM.
Community Growth
Community growth adds another layer. The project has already built a following of over 12,000 on Twitter. An $100K giveaway has already been running, with ten winners receiving $10,000 worth of MUTM each. The dashboard is already live, allowing users to track holdings and estimate potential returns. A Top 50 leaderboard rewards the largest contributors with bonus MUTM tokens. A daily 24-hour leaderboard also offers $500 in MUTM to the top-ranked user each day, provided they complete at least one transaction. These features keep engagement high and reward active supporters.
XRP and Cardano (ADA) remain solid projects with established ecosystems and long-term visions. However, their size means growth may be steadier rather than explosive. Mutuum Finance (MUTM), by contrast, is still early, utility-driven, and positioned to benefit strongly as sentiment shifts positive again.
For more information about Mutuum Finance (MUTM) visit the links below:
If you invest in crypto, you need to track Bitcoin closely because Bitcoin drives the whole market. When BTC goes up, most altcoins follow. But the real question is: is Bitcoin still the best choice to make serious money in crypto today, or are there better opportunities with bigger upside?
Bitcoin made people rich because they got in early, back when most people laughed at it and called it a bubble. The ones who understood what blockchain really was didn’t follow the crowd… they positioned first.
Today, Bitcoin can still outperform many classic assets like real estate, gold, and stocks. But let’s be honest: it’s no longer a life-changing 100x play. At this size, a 100x move would require a massive, almost impossible jump in market cap, something you shouldn’t expect anytime soon, especially not in the next 10 years.
So the real question becomes: where is the next “early Bitcoin” opportunity in crypto?
Because every cycle has one.
2020 gave Dogecoin with 100x+ returns.
2021 gave Shiba with 1000x+ returns.
2023 gave PEPE with 500x+ returns.
2025 gave BONK with 1000x+ returns.
What does that tell you? The biggest money in crypto isn’t made by chasing what’s already huge, it’s made by finding the next breakout early. That’s how a $10,000 position can realistically turn into a million… or more. We will see now which point can bitcoin go and what this will impact the market because bitcoin is related to all other coins
Bitcoin Price Prediction: How High Can Bitcoin Go in 2026?
Bitcoin price prediction for 2026: $300,000 is possible if the usual cycle repeats. The chart shows the same story every time. First, Bitcoin hits a bottom when everyone says “Bitcoin is dead” (2015, 2019, 2022). Then price starts rising, but most people don’t believe it (skepticism). After that, more people accept the trend (optimism).
The final stage is euphoria, when everyone feels like a genius and the last big push happens. Right now, the chart suggests we are moving from skepticism into optimism.
That matters because big bull runs usually grow while people are still scared. Euphoria is not here yet, and that is a good sign. Also, the math is simple: from the ~$80K–$90K area, $300K is about 3x to 4x. Bitcoin has done moves like that before when the cycle is strong. And even with “smaller gains each cycle,” $300K still fits a normal late-cycle run if money and confidence come back.
Now the real question is this: even if Bitcoin reaches $300,000, is it still the best crypto investment in such a volatile market? We all know how it works in crypto: if Bitcoin does a 3x, many smaller coins can do 10x, 50x, even 100x+ during the same cycle. So the smarter focus isn’t only “Will BTC go up?” it’s “Where is the next 100x opportunity before everyone notices?
So to answer that question, we have to look at past cycles and watch what smart wallets do early.
In every big meme run, two things matter most: hype and utility.
Look at two of the biggest winners:
SHIB became huge because it had massive hype, and it added some utility with ShibaSwap.
PEPE exploded mainly because of hype. It had the meme power, but no real system behind it.
But here’s the key point: ShibaSwap was utility, yes, but it wasn’t truly new or game-changing.
Now Pepeto is trying to combine both in a stronger way: big hype + real utility built for traders. And what makes people pay attention is this: some of the same early wallets that made millions on SHIB and PEPE are now moving part of their money into Pepeto.
Pepeto Is the Next Big 100x Memecoin: What Makes It Stand Out?
Pepeto (PEPETO) is making waves in the cryptocurrency world. Its reputation as the potential next big memecoin is growing rapidly. Investors are drawn to its high-return potential.
What sets Pepeto apart is its unique community-driven approach. Pepeto positions itself as an evolution of the well-known memecoin PEPE, adding the missing “T” and “O” that PEPE never had: Technology and Optimization. These two elements are what many analysts say the market now demands, helping Pepeto present itself as PEPE+TO rather than just another meme token. Several factors contribute to Pepeto’s appeal:
Innovative features: Pepeto offers more than simple utilities. It brings a full ecosystem built for the new era of meme coin trading, including a cross-chain bridge and a dedicated exchange designed to host future leading projects.
Successful Audits: Pepeto also brings a layer of safety that many early projects lack, having already completed successful smart-contract audits with SolidProof and Coinsult,
Vibrant community: Pepeto, known as the God of Frogs, already commands a powerful community of believers, surpassing 100,000 members across all socials and growing rapidly ahead of its official launch.
With this real utility and infrastructure, a 100x move for Pepeto feels like it’s only a matter of time. When you compare it to SHIB and PEPE, which already did 500x+ mainly on hype, Pepeto looks stronger in every way because it combines hype and real tools.
Conclusion: Pepeto stands out with real meme-utility infrastructure and early-stage
Institutions stacking Bitcoin is a loud signal, even if the chart looks quiet. It means confidence is building under the surface. Smart money tends to load up while the market is still unsure, and that’s usually how the strongest runs start.
At the same time, a growing number of early buyers are moving into Pepeto ($PEPETO) for the kind of upside you can only get before major listings and mainstream attention. Once a token goes live, the easy multiples are usually already gone.
For anyone asking what crypto to buy now, this isn’t about chasing pumps or buying tops. It’s about getting positioned early while the story is still cheap, especially when the project isn’t just hype.If you’re looking for a presale where timing still matters, Pepeto is still in that early window. Get your allocation while the presale stage is open at https://pepeto.io/.
FAQs
Why is Pepeto better than Bitcoin?
Bitcoin is safer, but it’s already big. Even if BTC hits $300K, that’s around 3–4x. Pepeto is still in presale at $0.000000180, so the upside can be much bigger if it takes off. This is the “early window” people usually miss.
What crypto to buy now for maximum upside?
If you want the biggest upside, it usually comes before big listings. Pepeto is still early, and that’s why people are rushing into it now, not later.
What are the best cryptocurrencies to buy right now?
Many investors do both: hold Bitcoin for stability, and put a smaller part into a high-upside presale like Pepeto to chase a possible 50x–100x.
What separates PEPETO from other presales?
Most presales are only hype. Pepeto is building real tools: zero-fee PepetoSwap, a cross-chain bridge, and a Pepeto Exchange planned for 2026 with 850+ projects already applying. If PEPETO becomes the token used behind all that trading, demand can explode fast.
Bitcoin price has entered a cautious phase after failing to hold its recent recovery, with price action gradually tilting back toward the downside. The pullback has been controlled rather than panic-driven, but signs of weakening demand are becoming harder to ignore. Spot buying remains limited, leverage continues to unwind, and sellers are still active beneath the surface. Together, these signals raise the likelihood of Bitcoin revisiting lower support levels, with the $75,000 region now emerging as a key area to watch as early February approaches.
Open Interest: Leverage Steps Back, Not In
Open interest across exchanges has declined sharply, signaling broad deleveraging rather than aggressive dip-buying. This drop suggests traders are closing positions instead of building fresh longs to defend current levels. Importantly, open interest has struggled to recover alongside price, reinforcing the idea that conviction remains weak.
When leverage exits the market without being replaced, the price often drifts toward the next support zone. This behavior aligns with the broader correction seen on the price chart and adds weight to the bearish near-term outlook.
Exchange reserve data shows Bitcoin balances ticking higher after a prolonged period of decline. While this does not point to panic selling, it does indicate that more BTC is becoming available to sell.
In past cycles, rising reserves during a corrective phase have often coincided with extended pullbacks rather than quick reversals. With spot supply increasing and no clear signs of aggressive accumulation, downside pressure remains a real risk if demand does not improve.
Spot Taker CVD: Sellers Still Have the Upper Hand
Spot taker CVD reinforces this cautious view. Over the past several months, sell-side market orders have dominated, and while selling pressure has eased slightly, buyers have yet to take clear control.
The lack of a strong bullish shift in CVD suggests that recent stabilization is more about sellers slowing down than buyers stepping up. Without sustained spot buying, any bounce is likely to remain corrective rather than trend-changing.
Is Bitcoin (BTC) Price Heading to $75,000?
Ever since the BTC price dropped below $100,000, it has slipped into extreme bearish conditions. It broke down below the rising wedge, which has been the start of a strong descending trend.
After breaking the wedge, the BTC price has also completed a small upside correction that resulted in a fresh descending trend. Meanwhile, the weekly RSI is also heading towards the lower threshold, indicating Bitcoin is yet to mark the bottom. Considering the chart structure, the next strong support is just below $75,000, at around $74,500, which could be the range where buyers may take control.
Conclusion: What Comes Next for Bitcoin?
Taken together, price structure, derivatives positioning, and spot market behavior all lean toward further downside exploration. Bitcoin does not appear to be in a capitulation phase, but it also lacks the conditions typically seen at durable bottoms. Unless spot demand strengthens and leverage begins to rebuild alongside rising prices, Bitcoin may continue drifting lower toward the $74,000–$76,000 support zone. A bounce from there is possible, but for now, the data supports caution rather than optimism.
The week of January 25-31, 2026, recorded $243.9 million in crypto VC funding across 14 projects, with Mesh (ex Front Finance) leading the final week of January. Here’s a look into this week’s crypto funding activity as per Cryptofundraising data.…
Bitcoin price continued its strong downward trend as ETF outflows accelerated, geopolitical risks rose, and the government shutdown continued. Bitcoin (BTC) dropped below the key support level at $81,000 and hit its lowest level since October last year. It has…
WLFI volatility weakens short-term trading confidence as investors turn to XRPstaking for structured, predictable yields. As Donald Trump restarts his long-term plan to acquire Greenland, interest in World Liberty Financial (WLFI) has surged, and its recent market performance has once…
The NFT market recorded $74.88 million in sales volume over the past week, plunging 38.25% from the previous period. NFT buyers climbed 29.75% to 242,824, while sellers jumped 32.02% to 217,181. Transaction volume increased 8.29% to 726,723. At the same…
Need to know what happened in crypto today? Here is the latest news on daily trends and events impacting Bitcoin price, blockchain, DeFi, NFTs, Web3 and crypto regulation.


 BREAKING: The law being signed by President Trump SLASHES $10B in wasteful and fraudulent foreign aid, ENDS taxpayer grants to NPR and PBS, and solidifies the closure of USAID
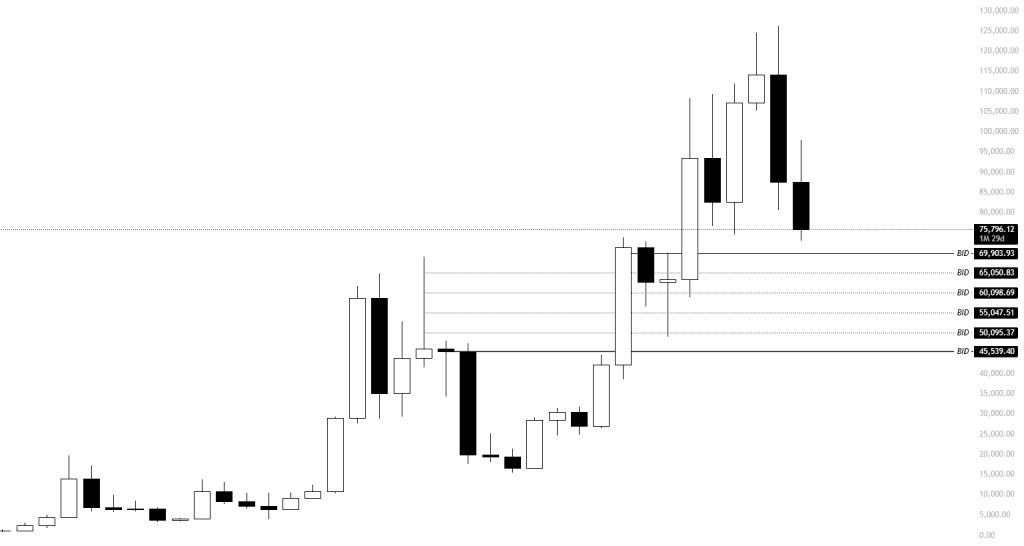
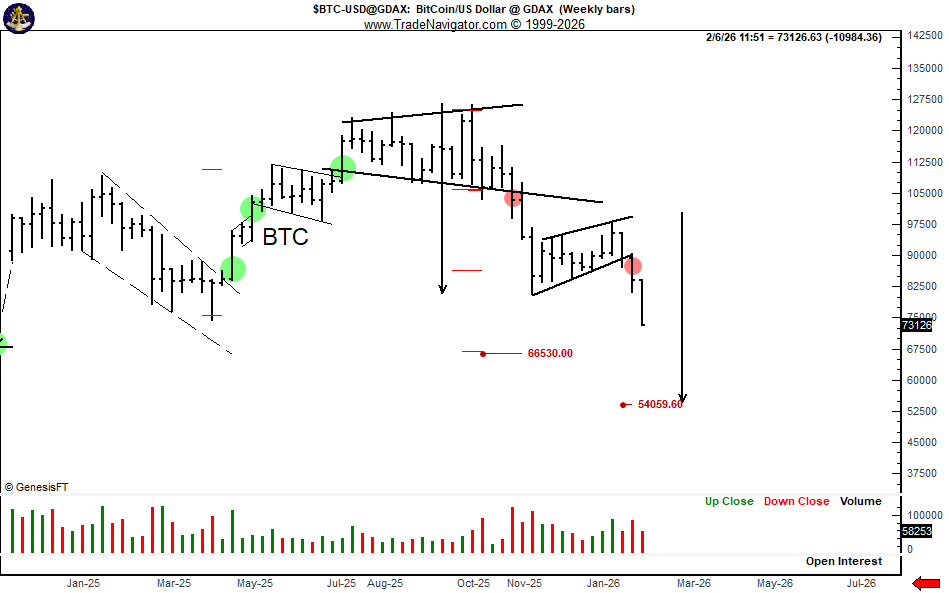

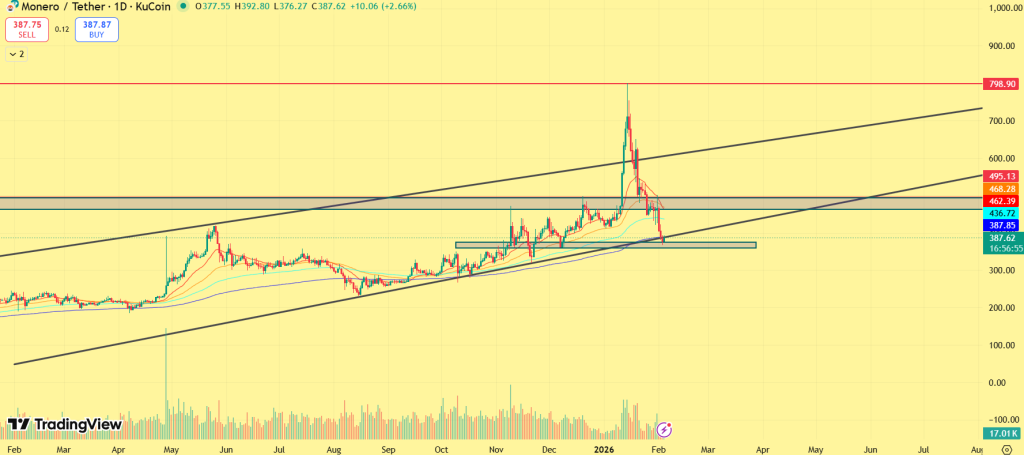
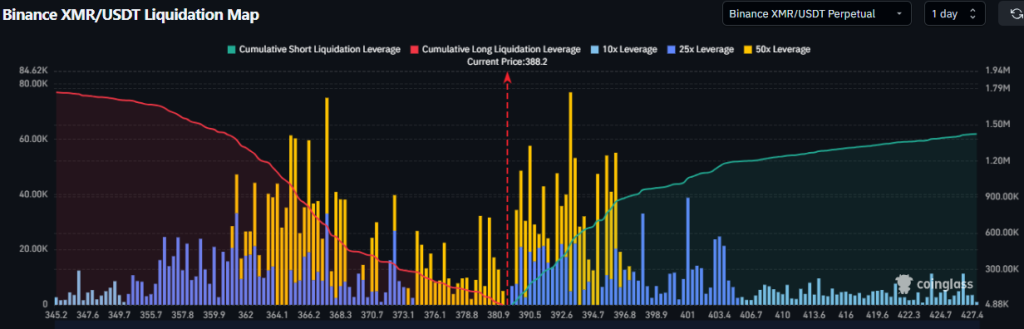


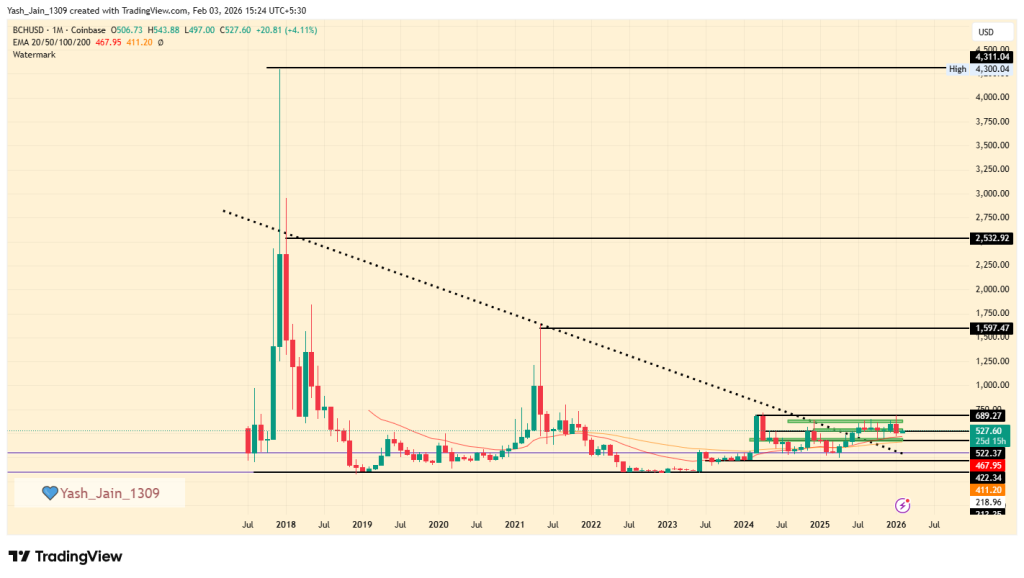


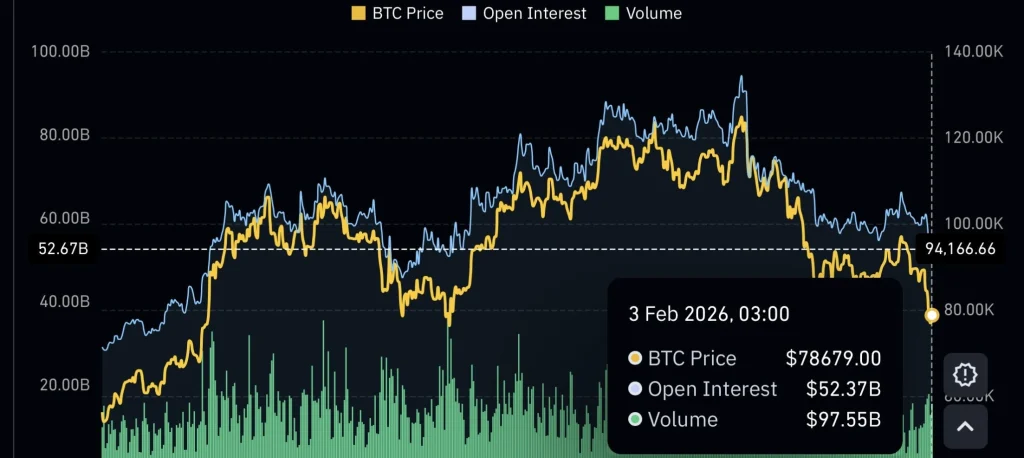
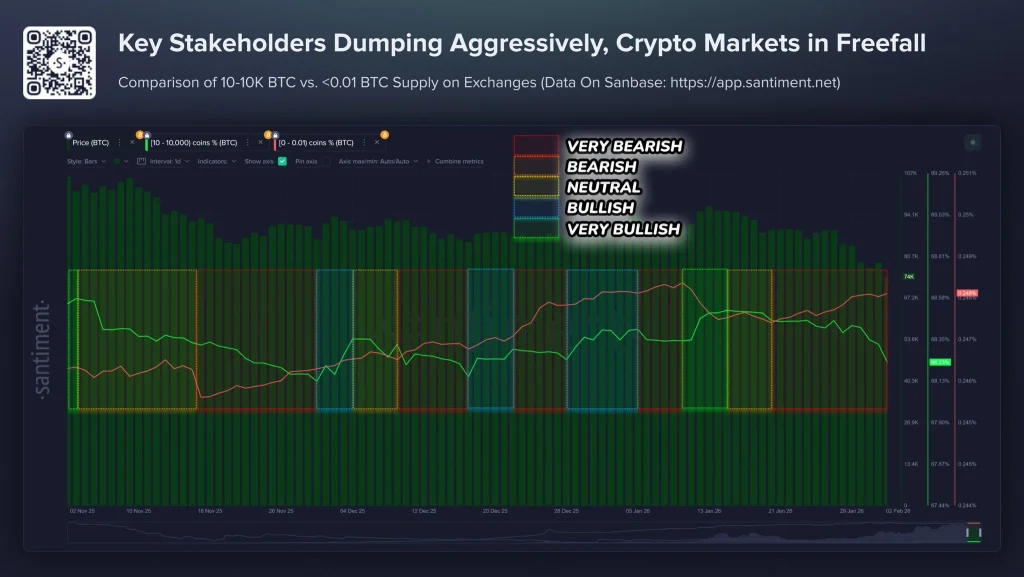


 Russia's Moscow Exchange announces plans to launch cryptocurrency indices for Solana, Ripple,
  |
| Russia to roll out crypto regulatory framework this July, allowing retail participation.
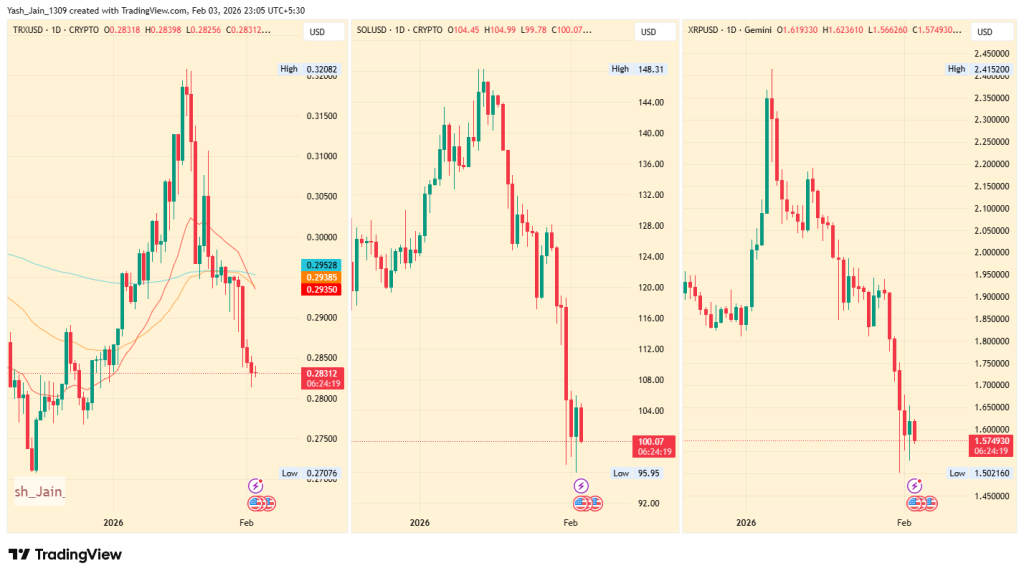


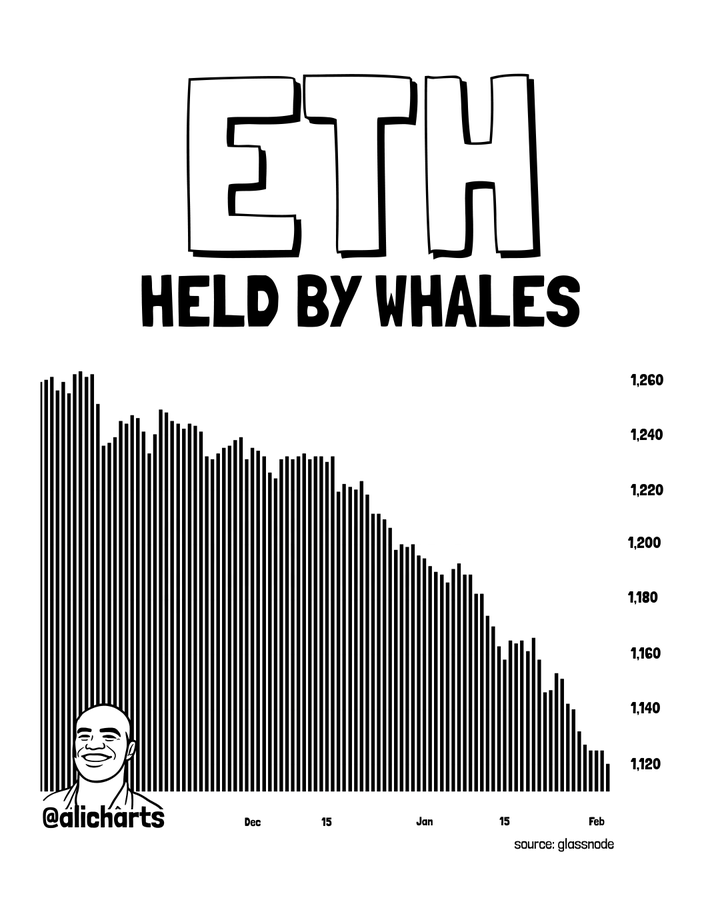
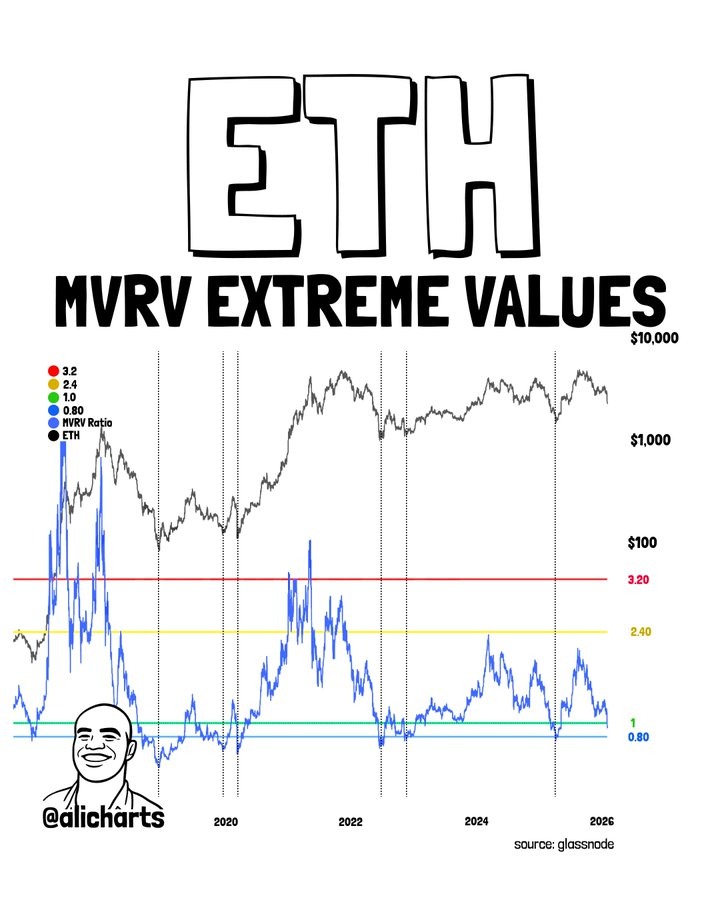
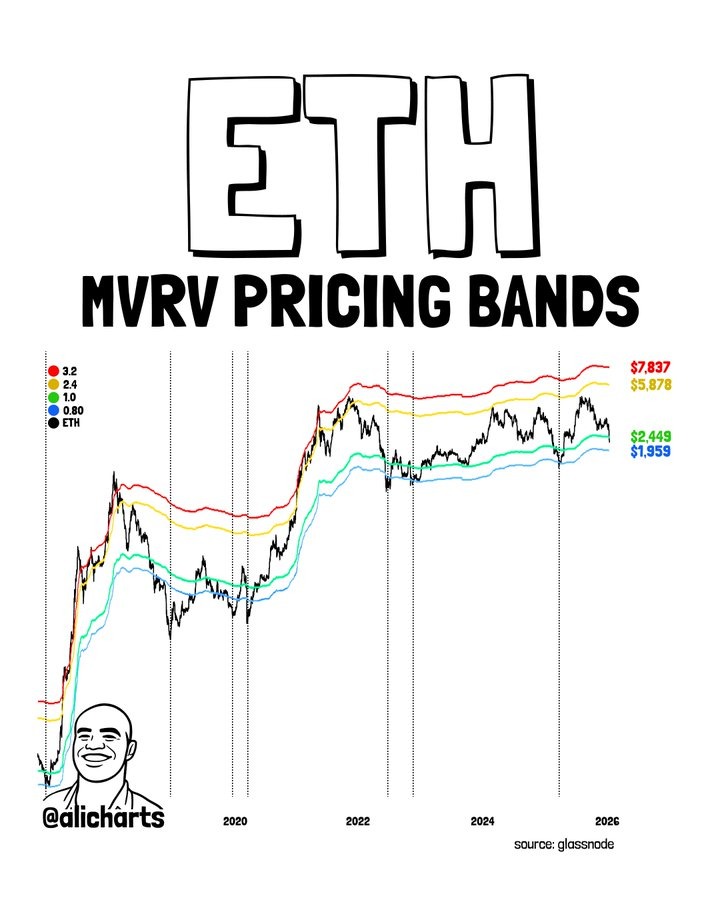
![Iran Economic Crisis [Live] Updates and Impact on the Crypto Market](https://image.coinpedia.org/wp-content/uploads/2026/01/13122147/Iran-Economic-Crisis-Live-Updates-and-Impact-on-the-Crypto-Market-1024x536.webp)
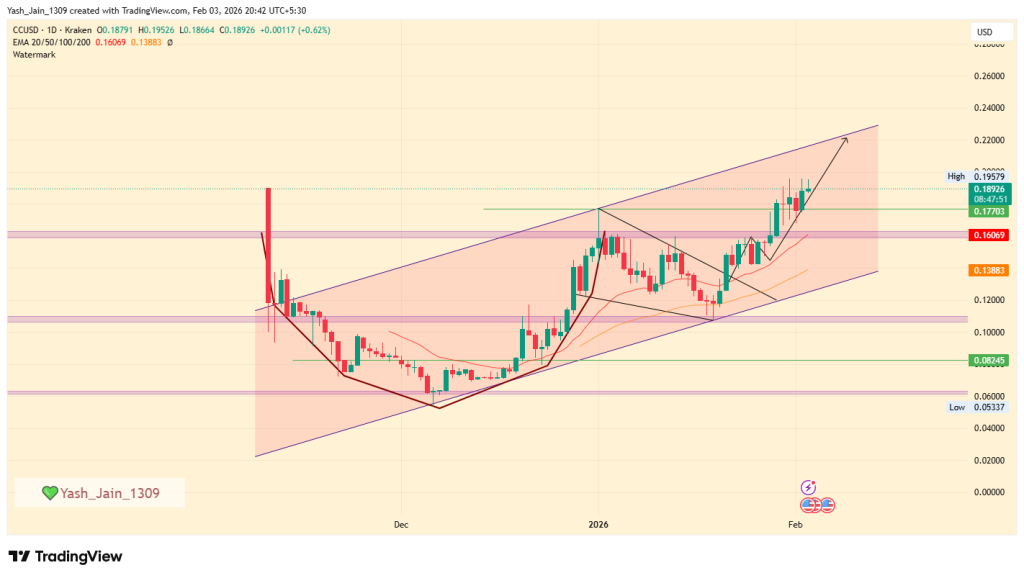
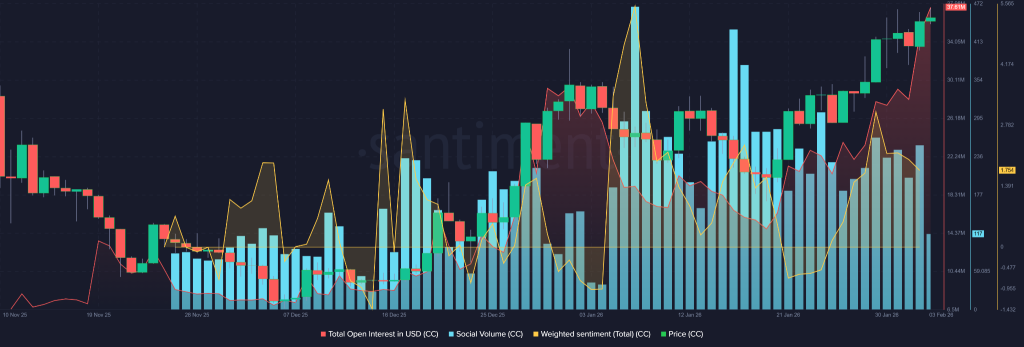


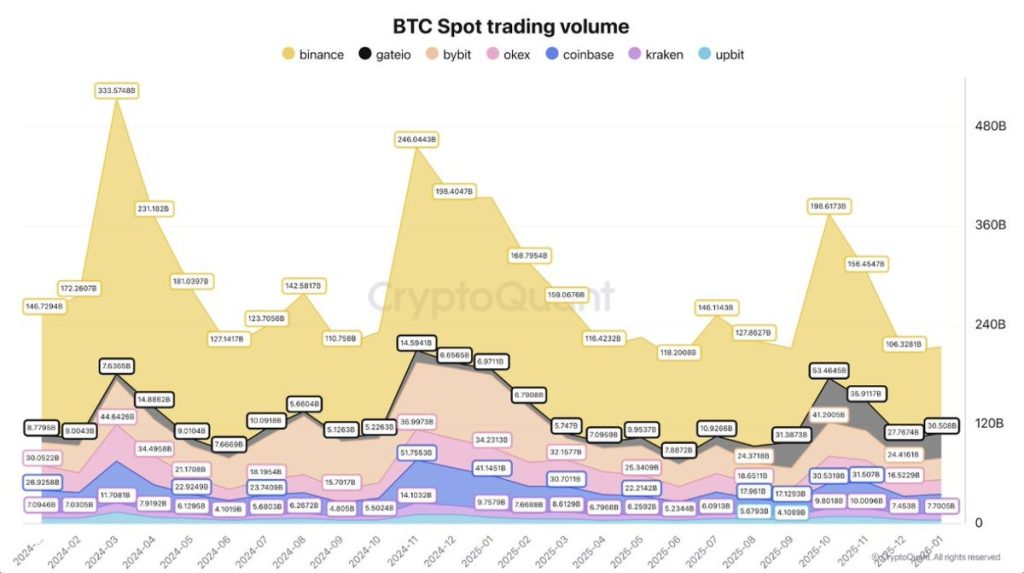
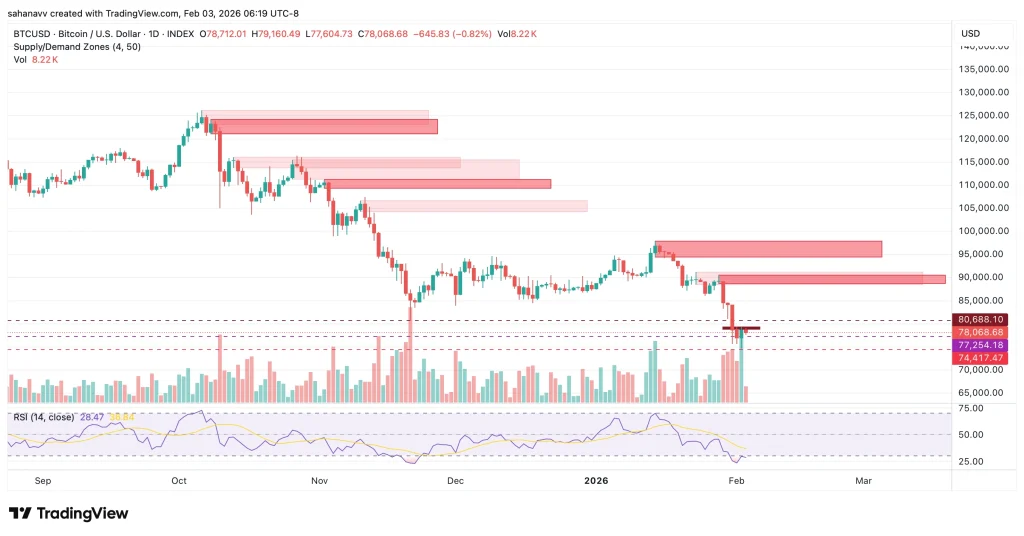


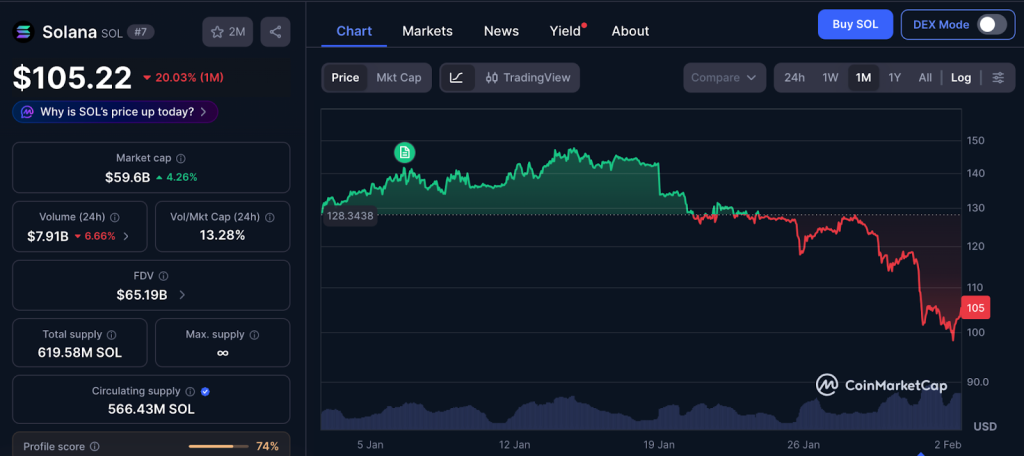


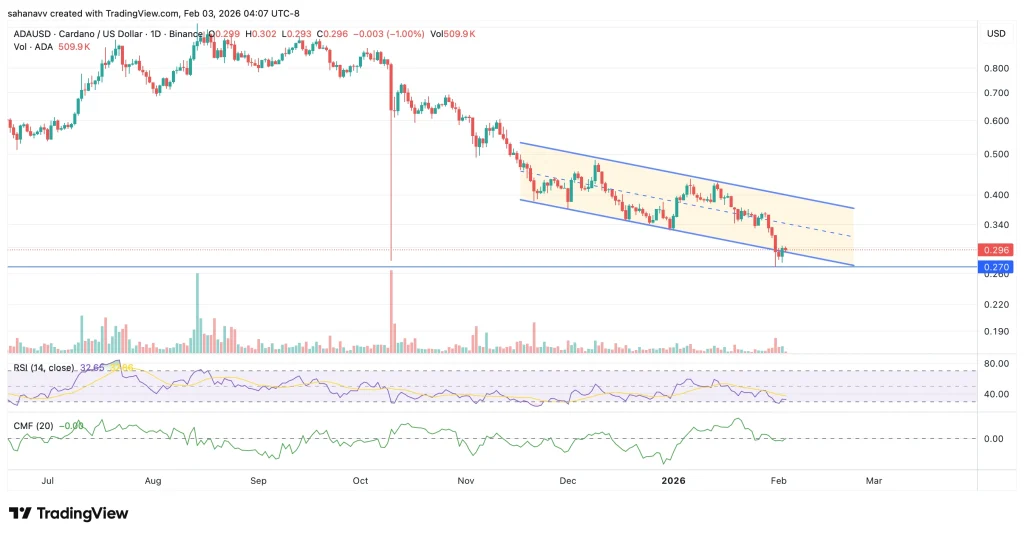


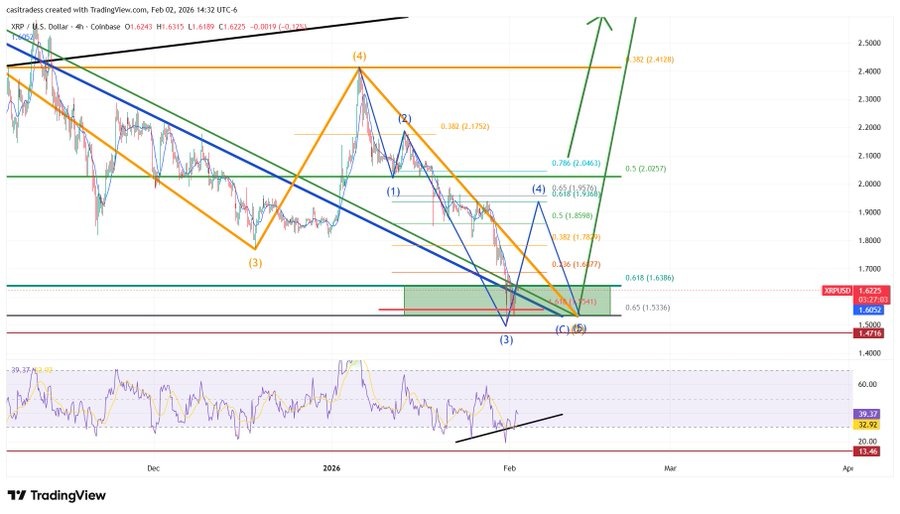

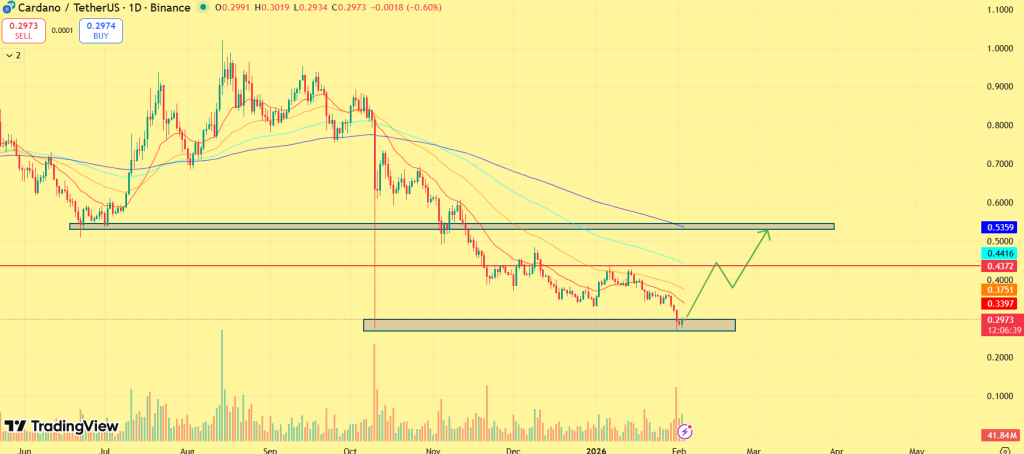


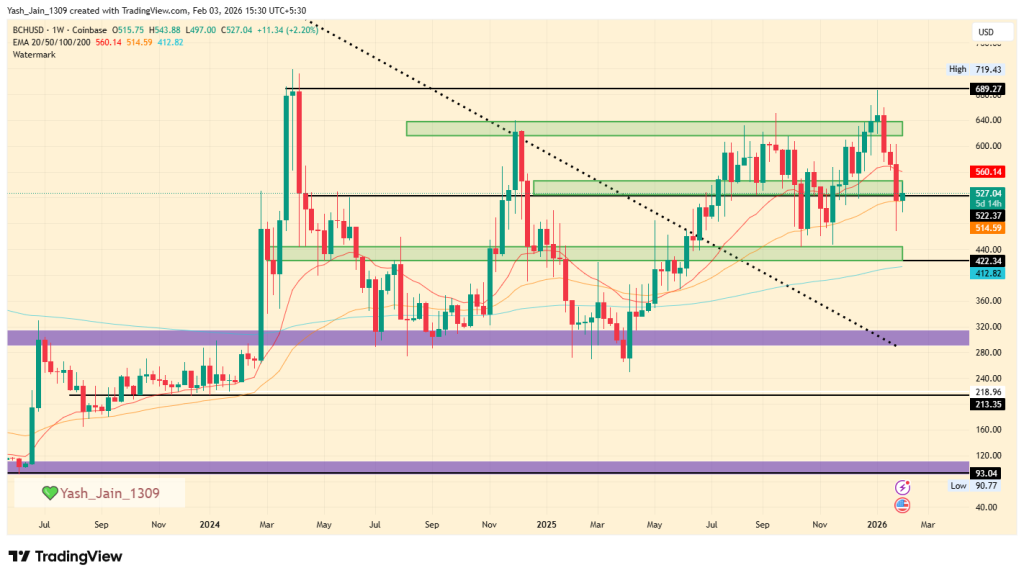


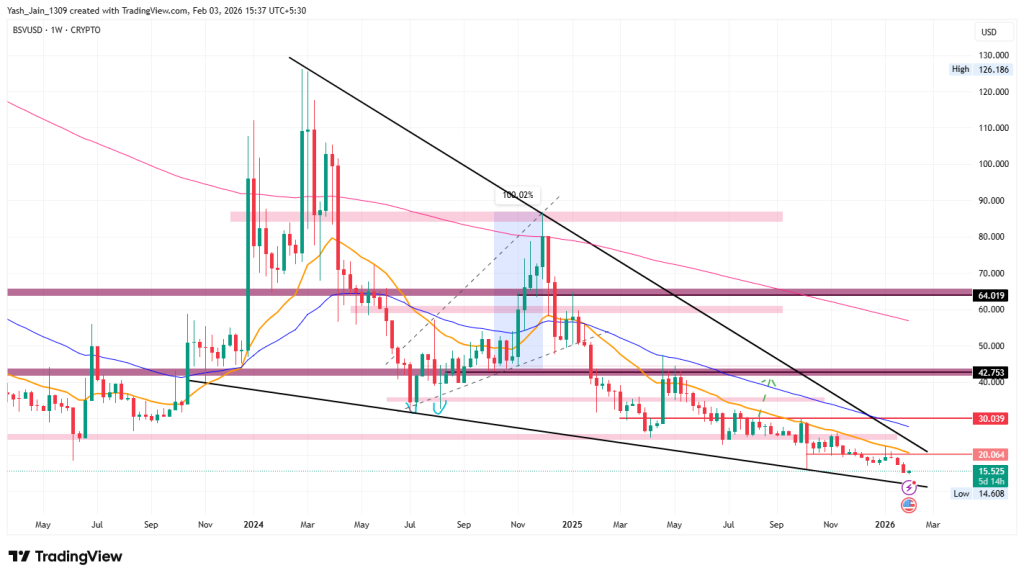
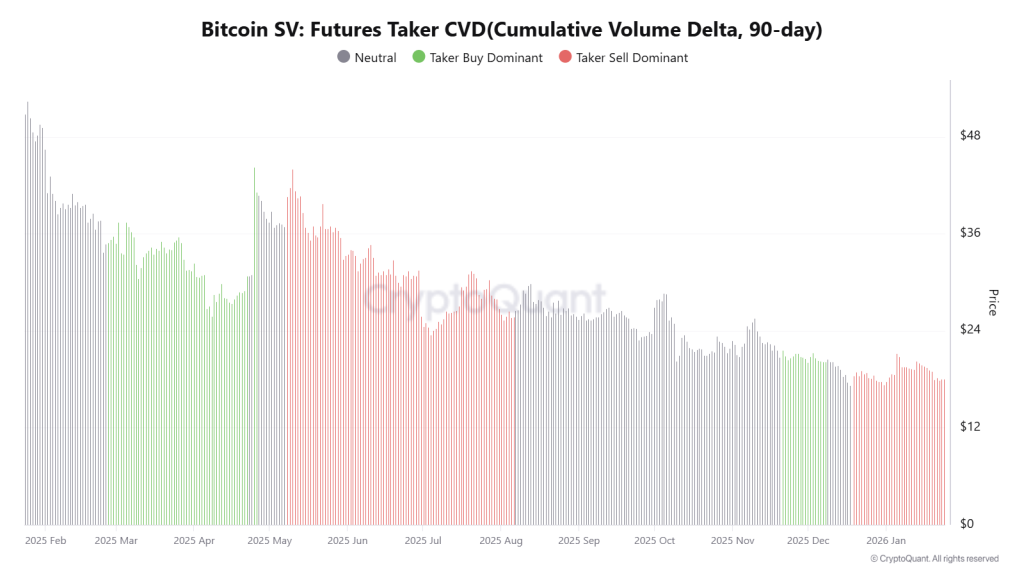
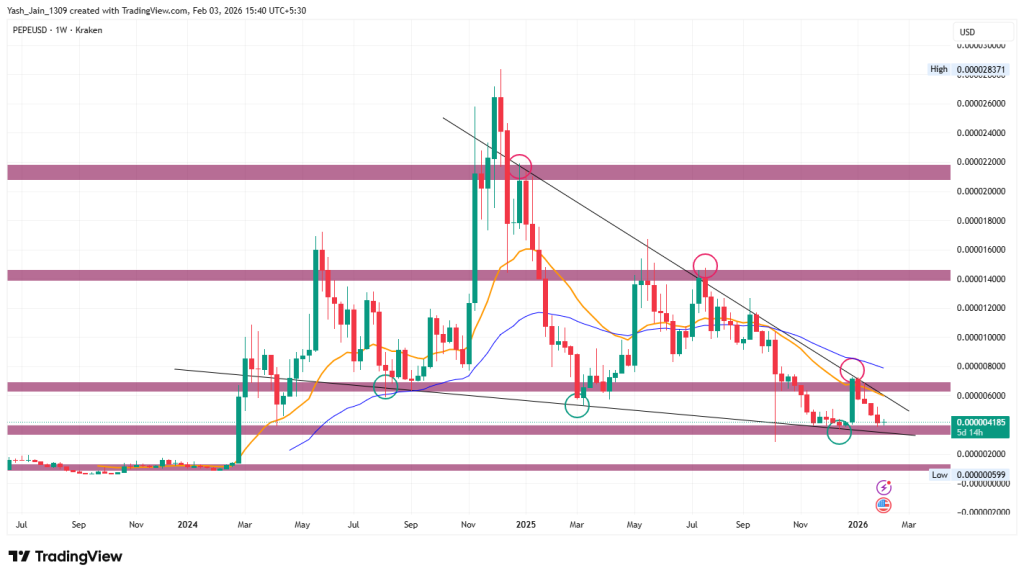
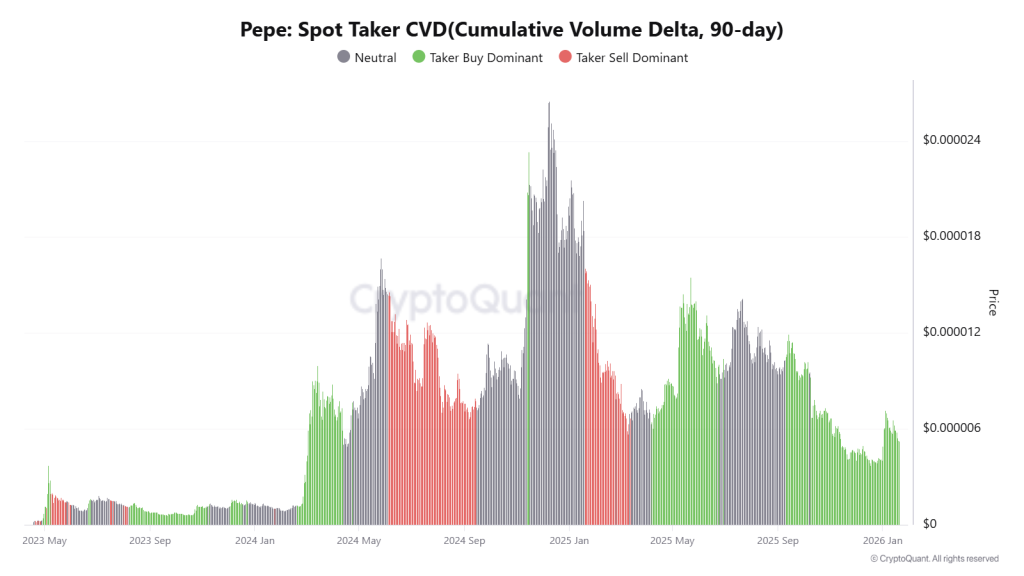
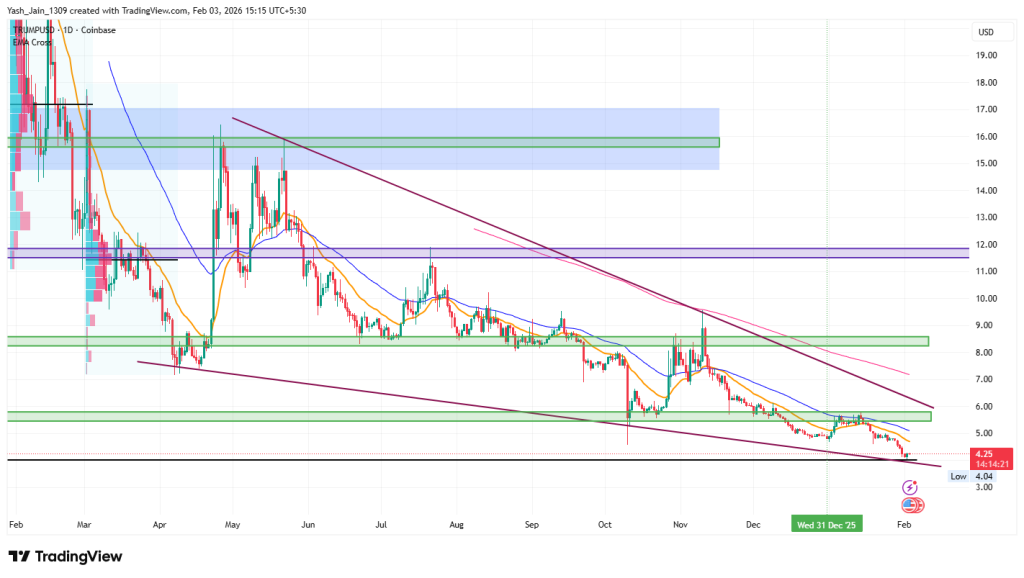
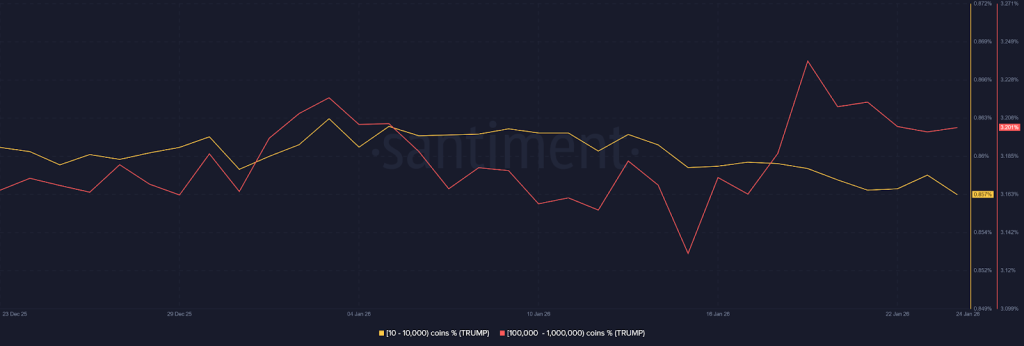


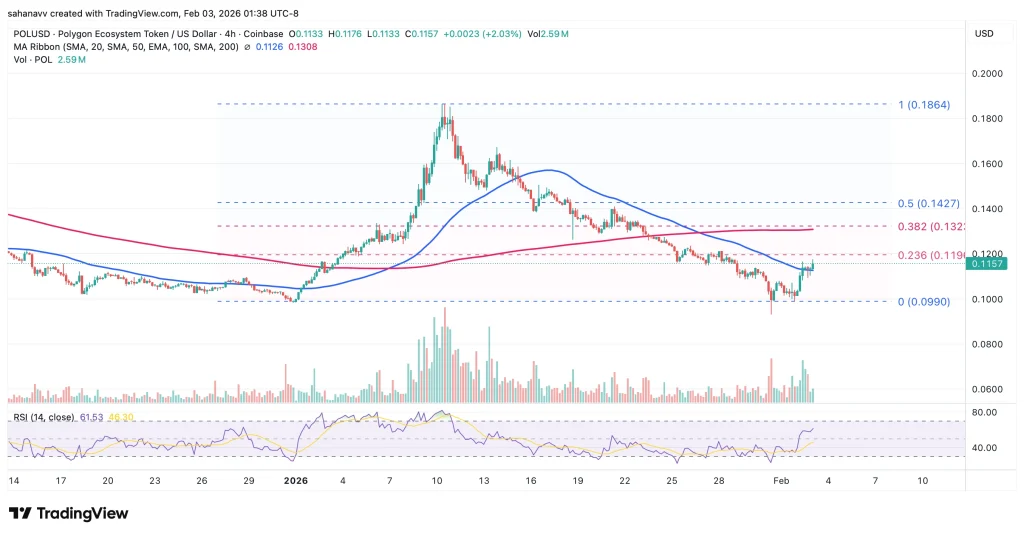

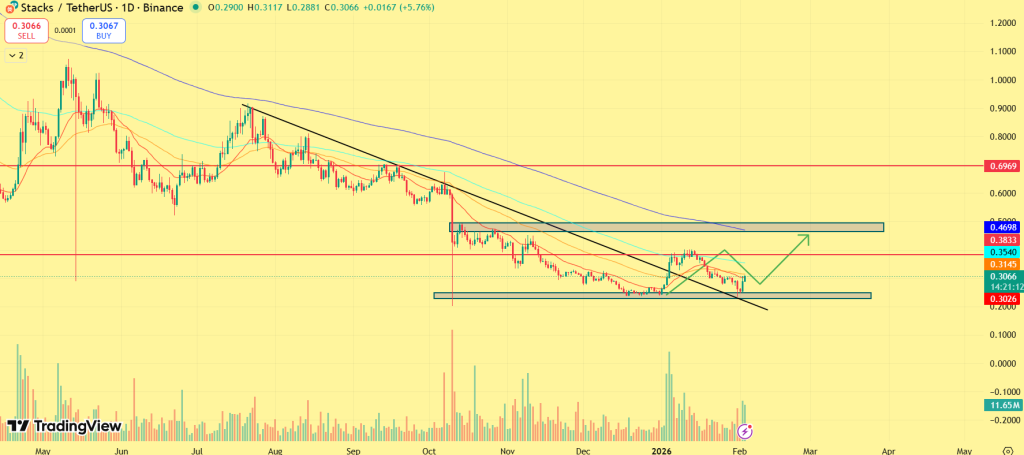
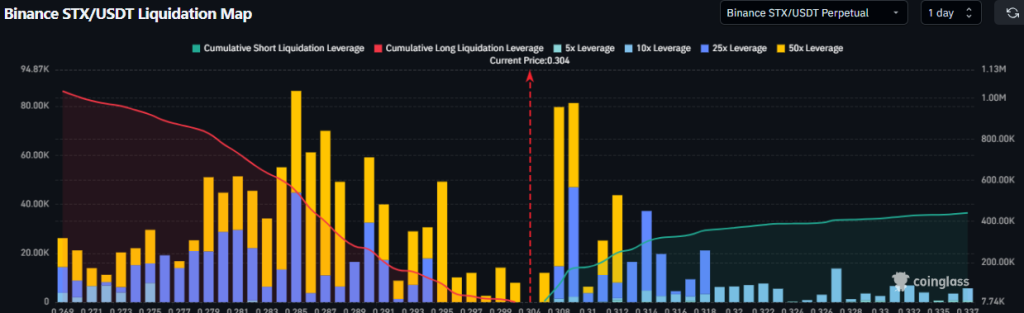

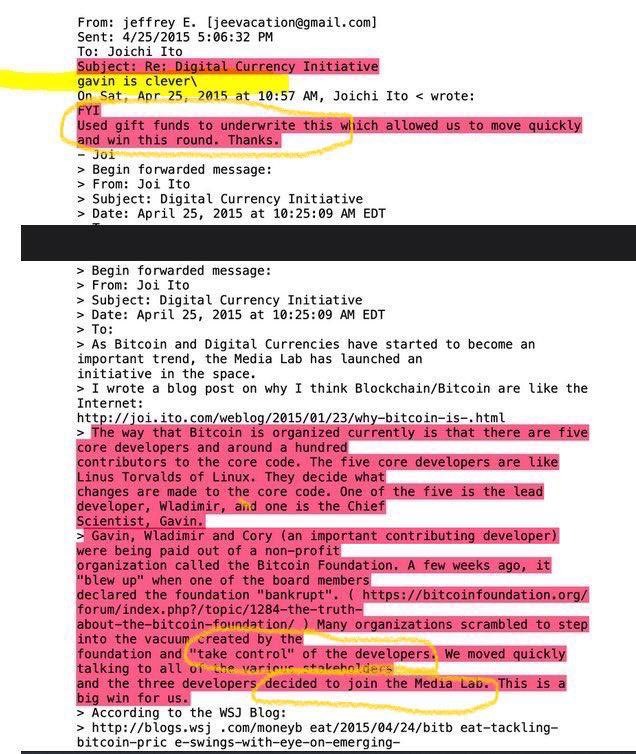
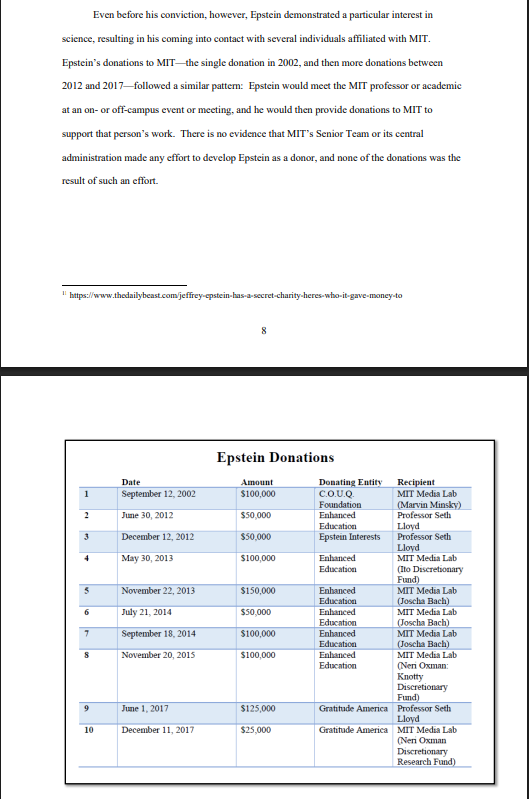
 False
False

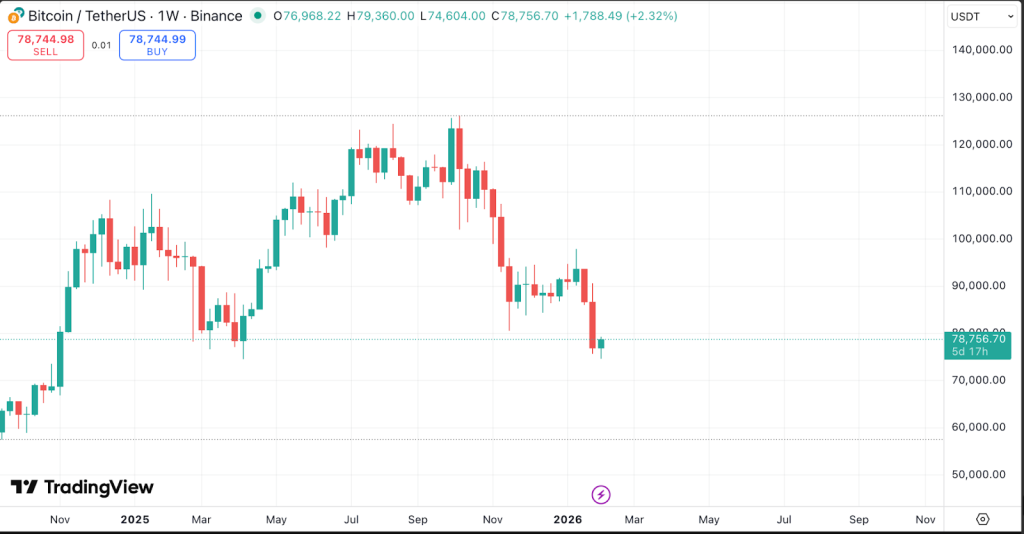
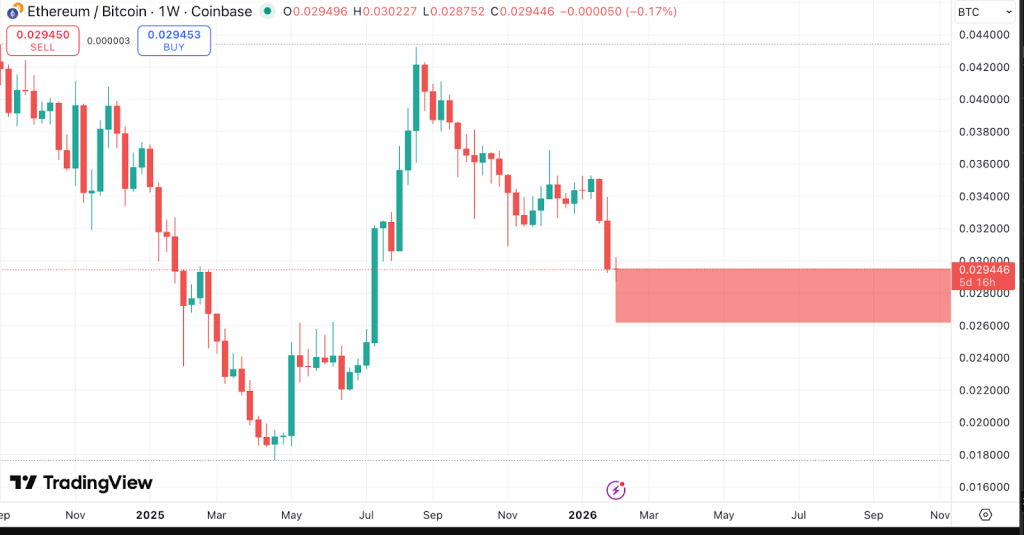


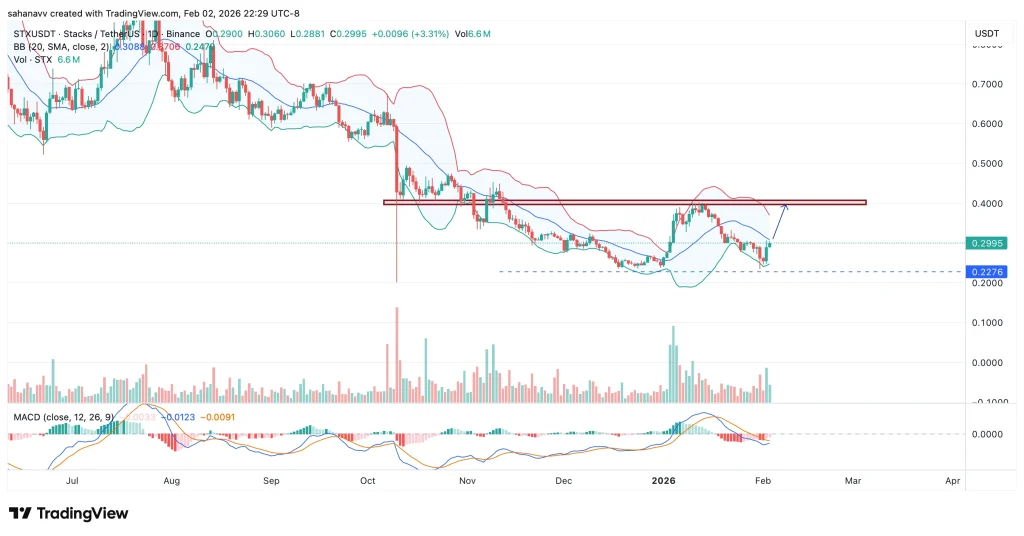


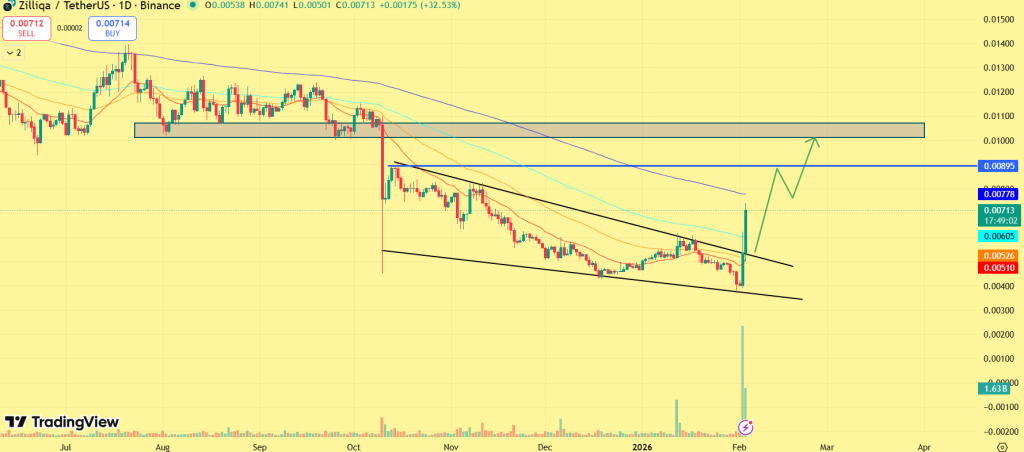
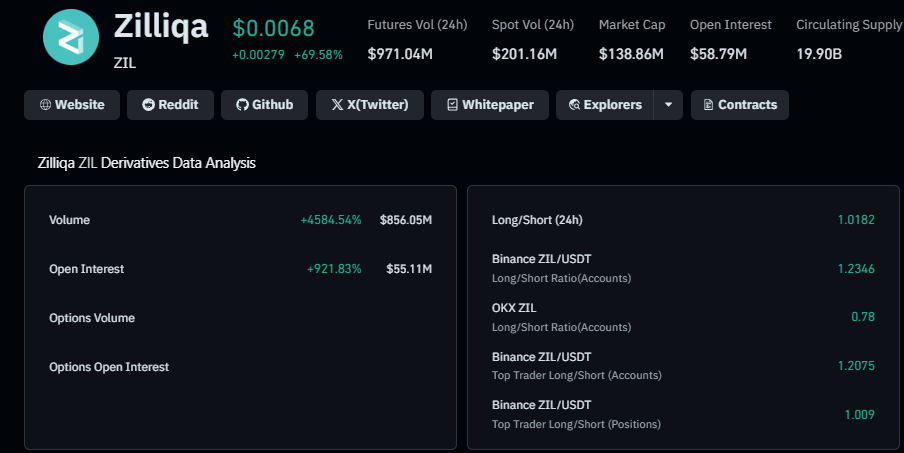
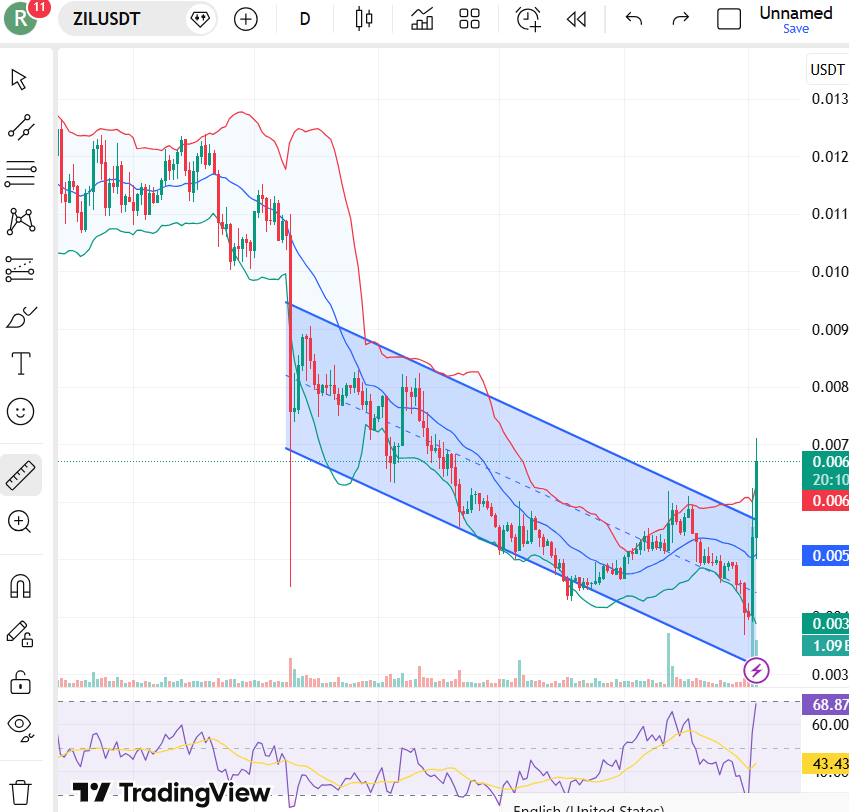
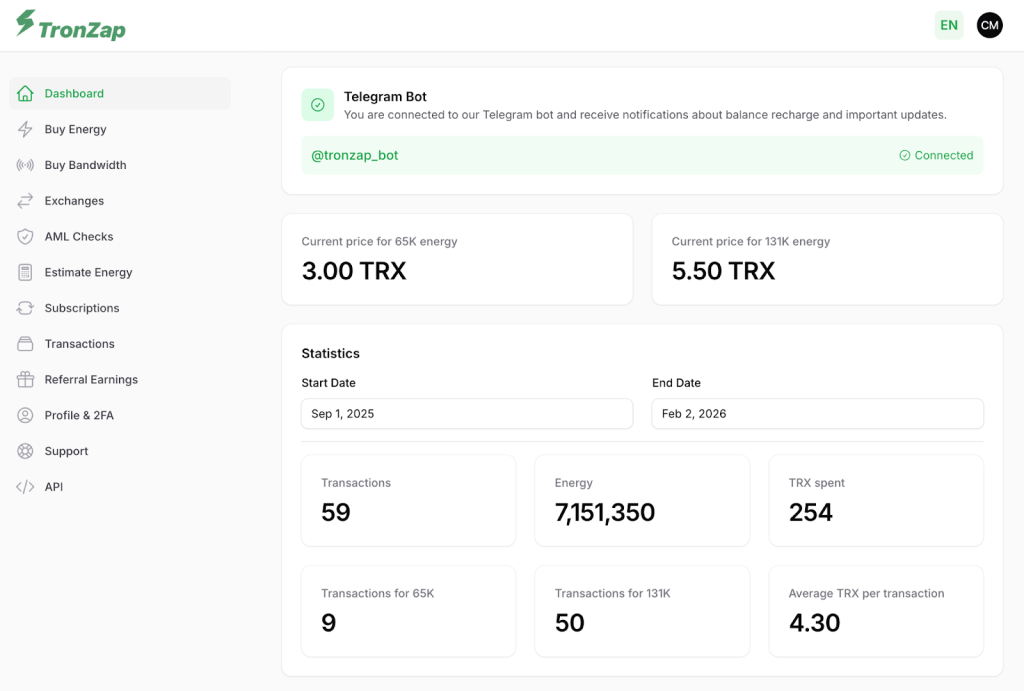
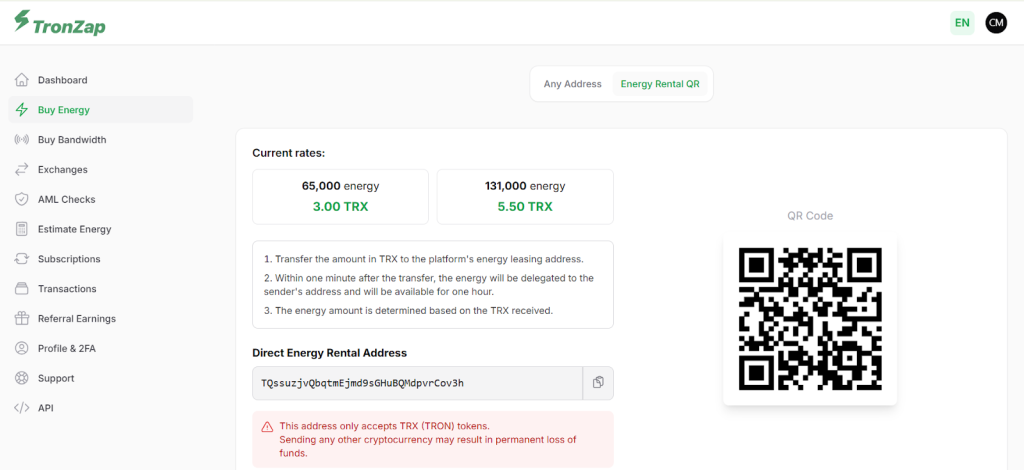
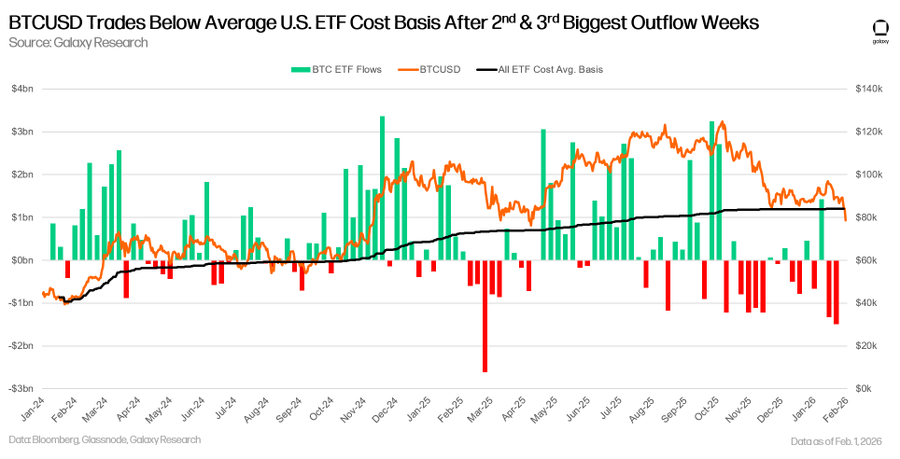
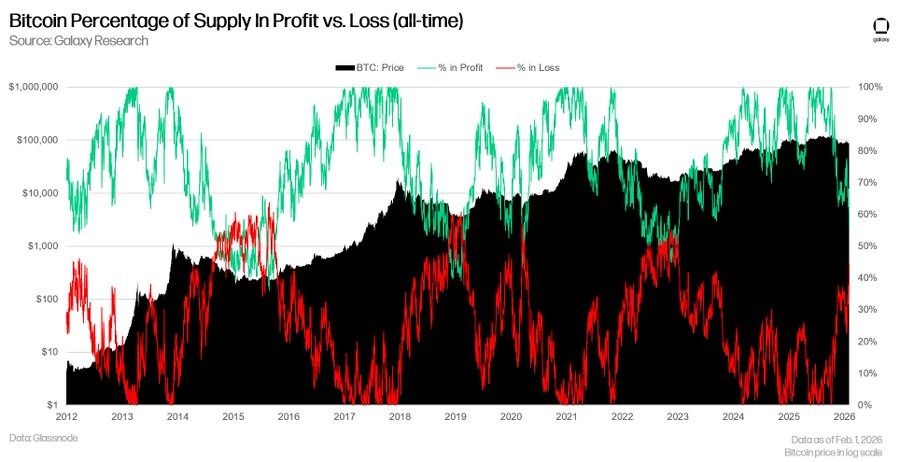
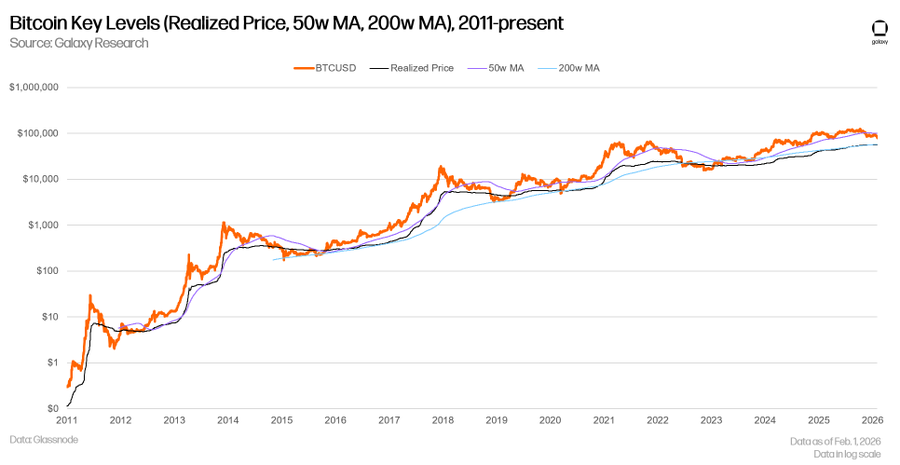
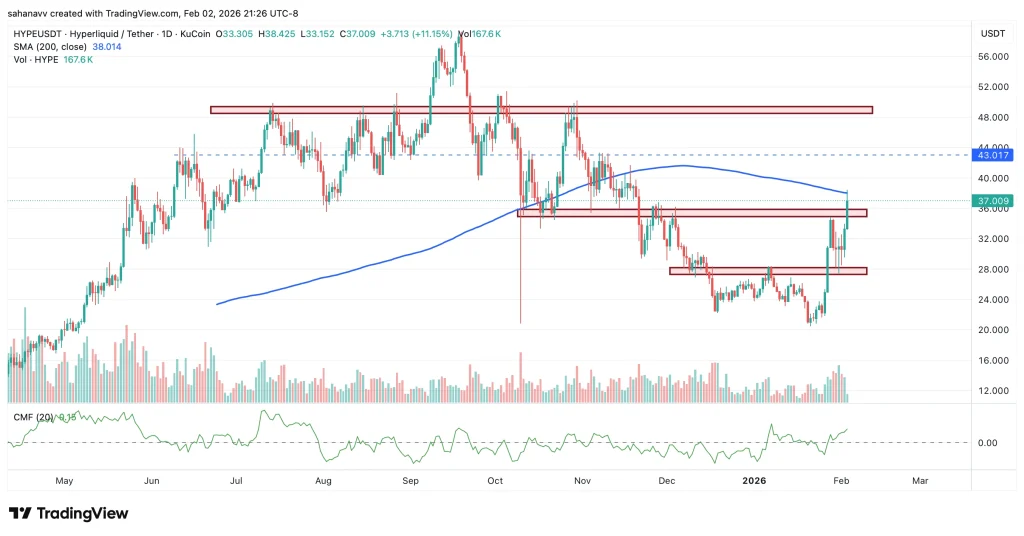

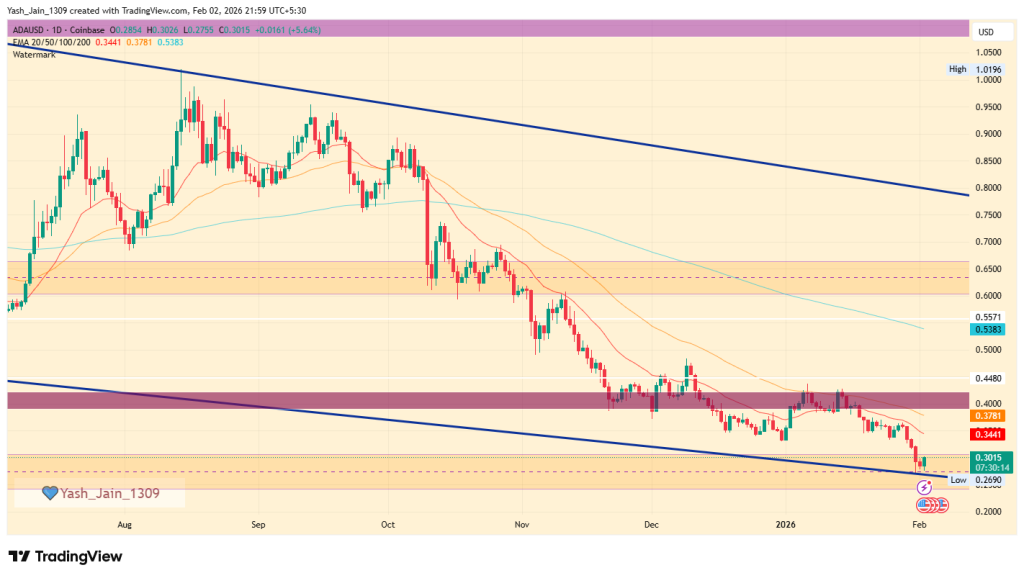
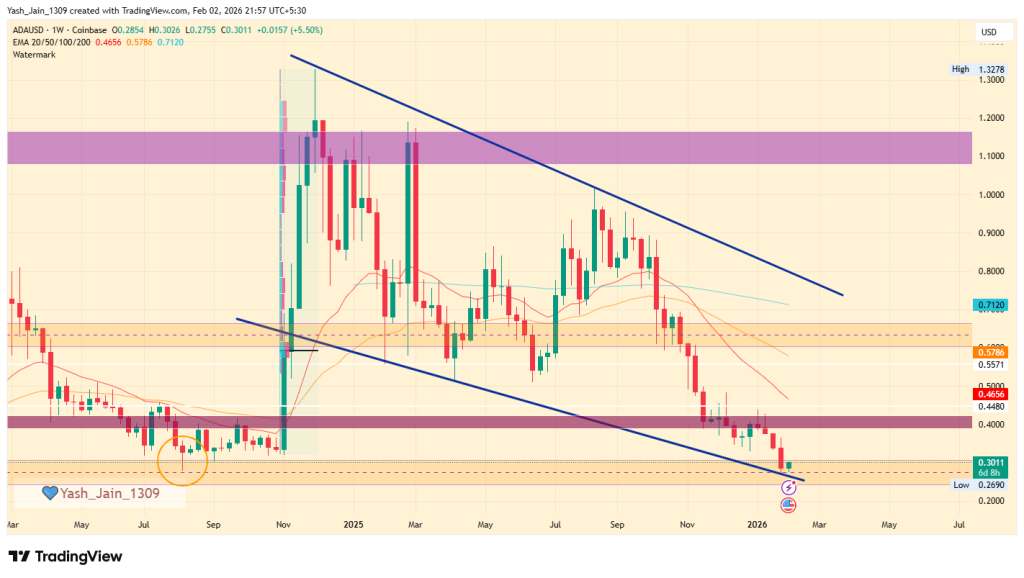
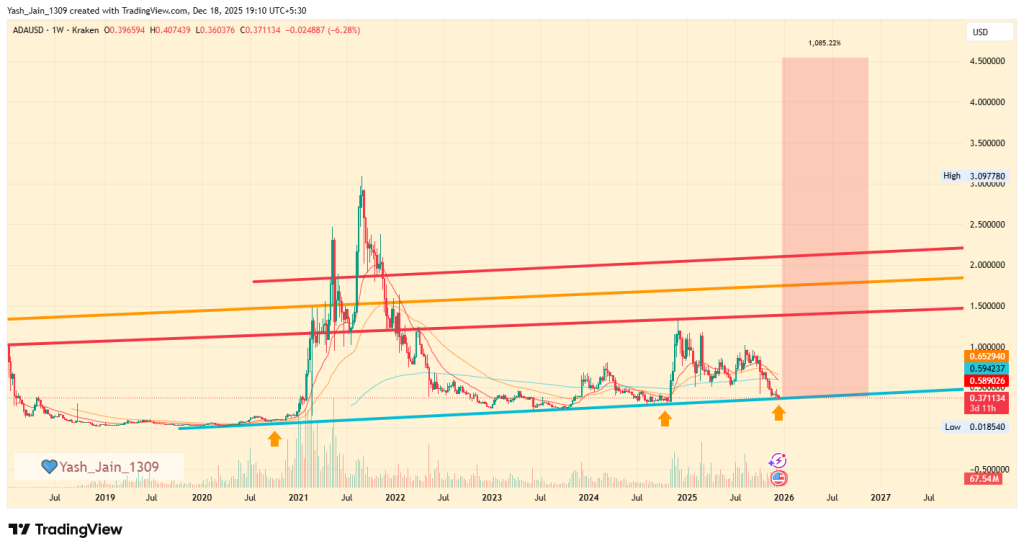
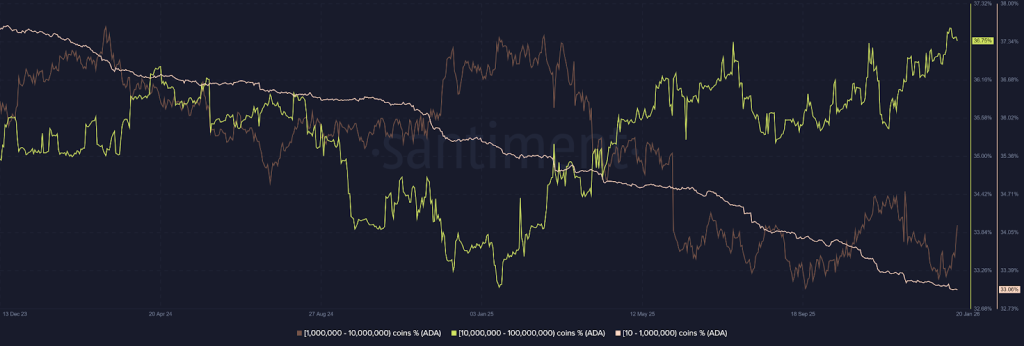
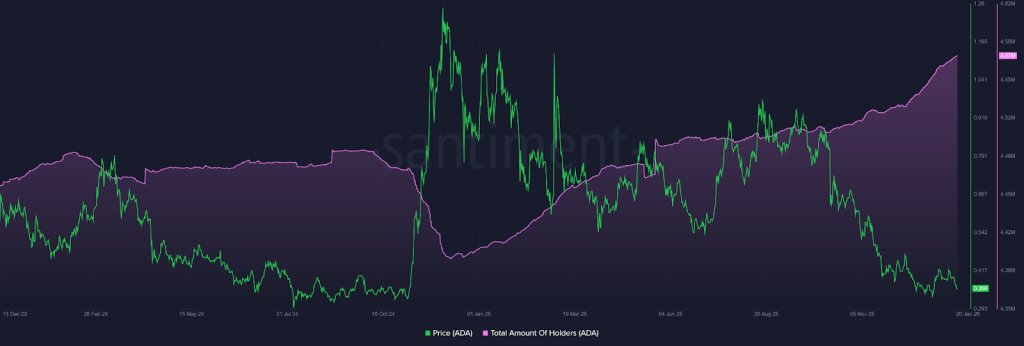
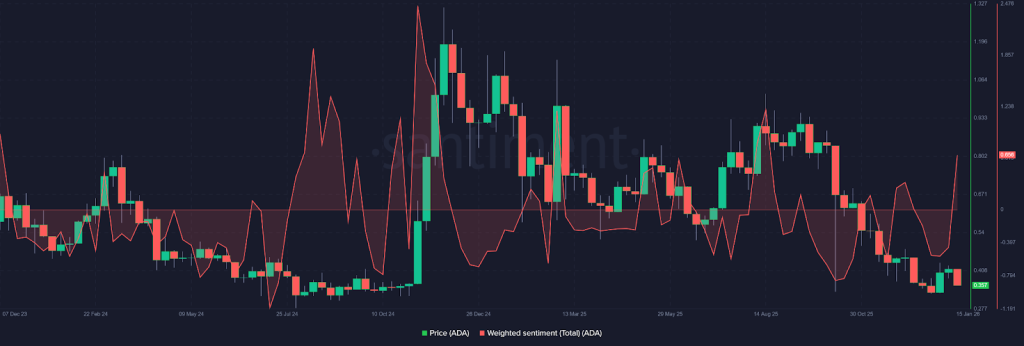

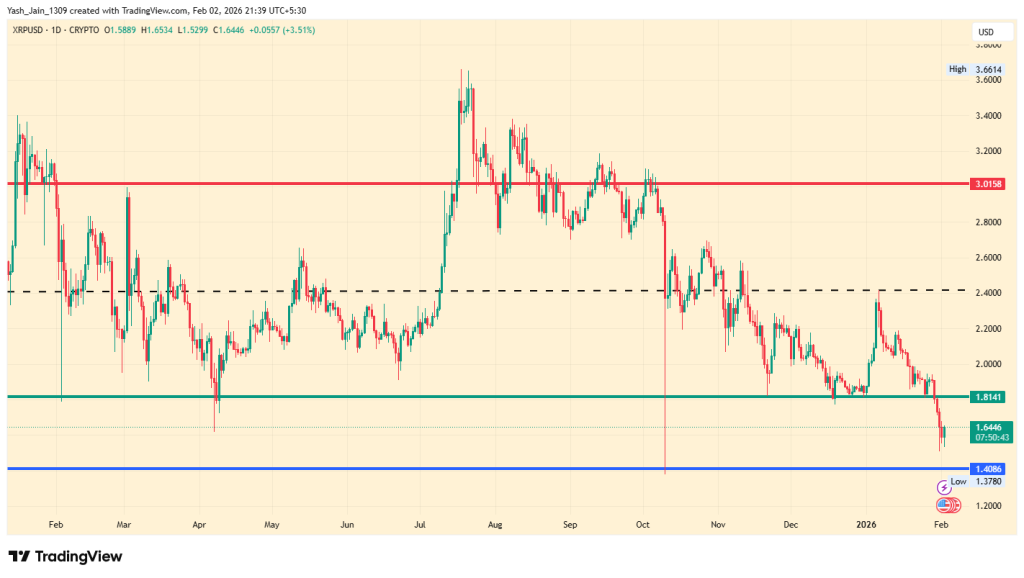
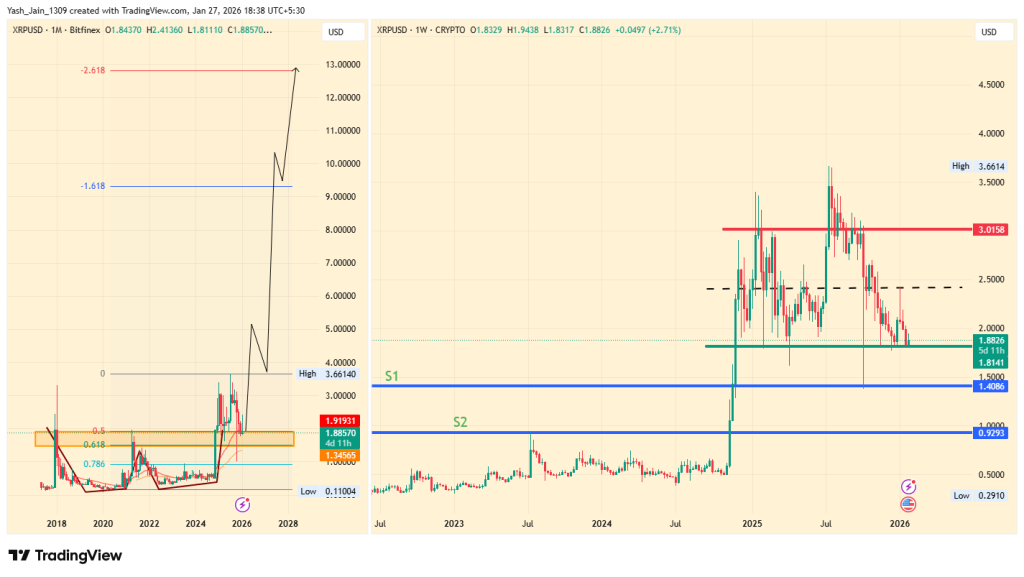
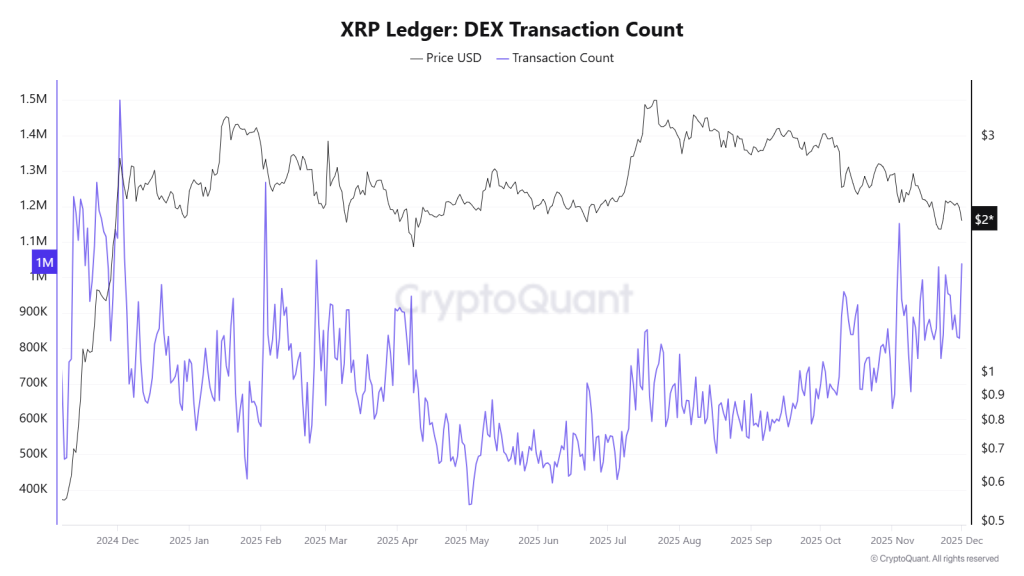
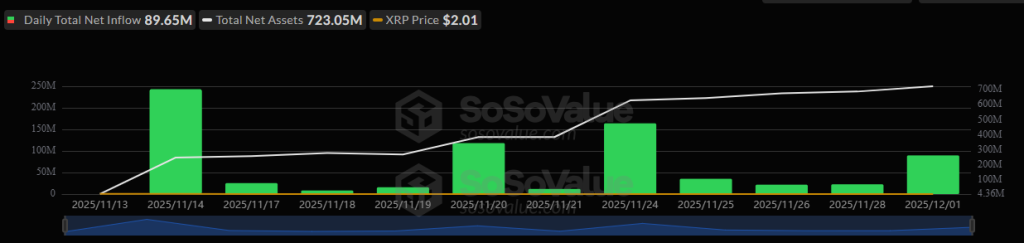

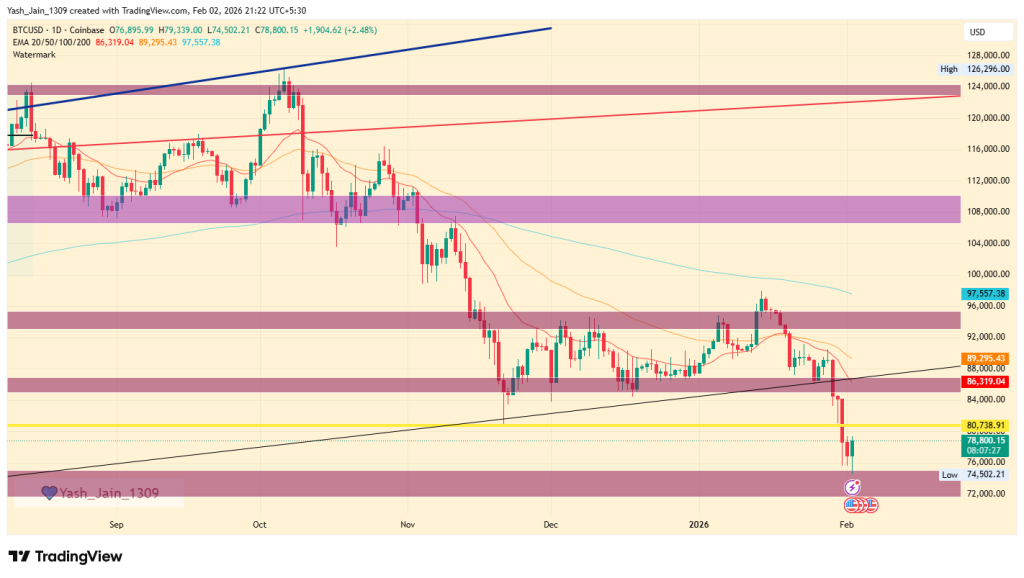
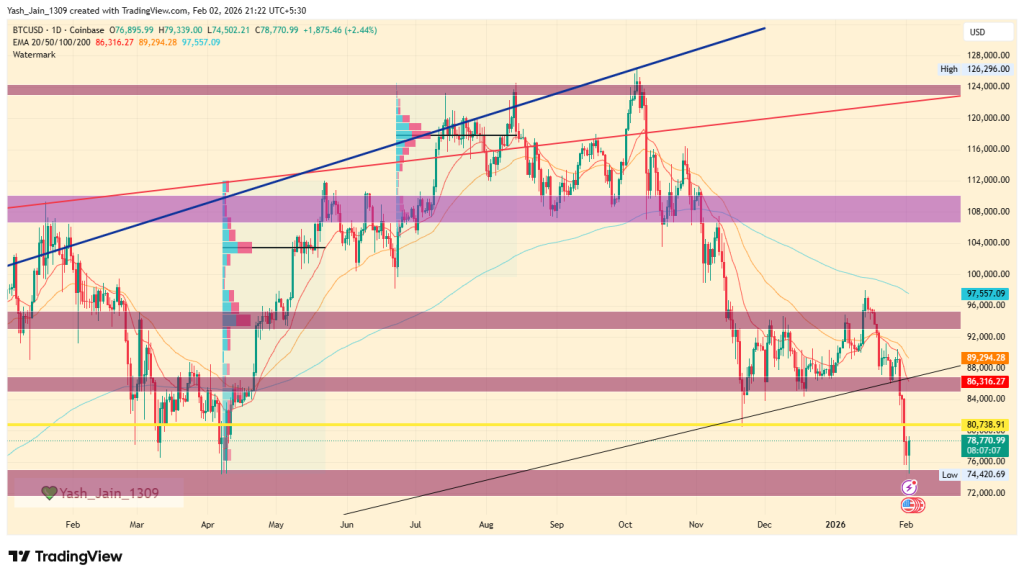


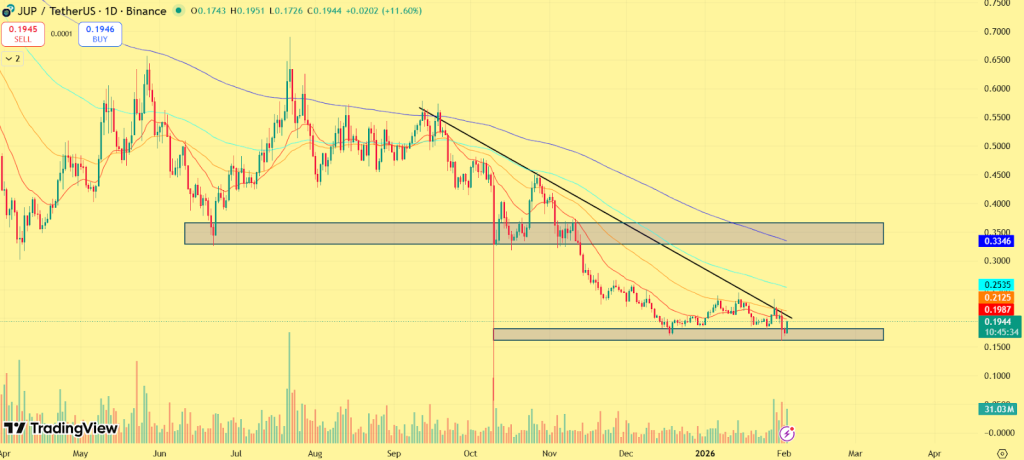


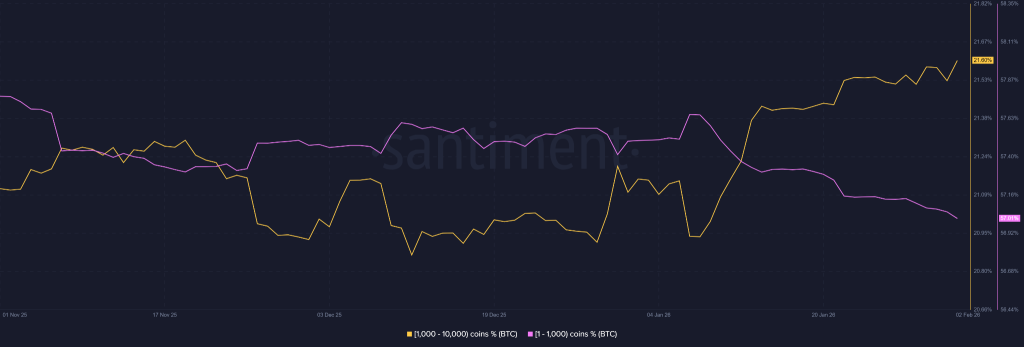
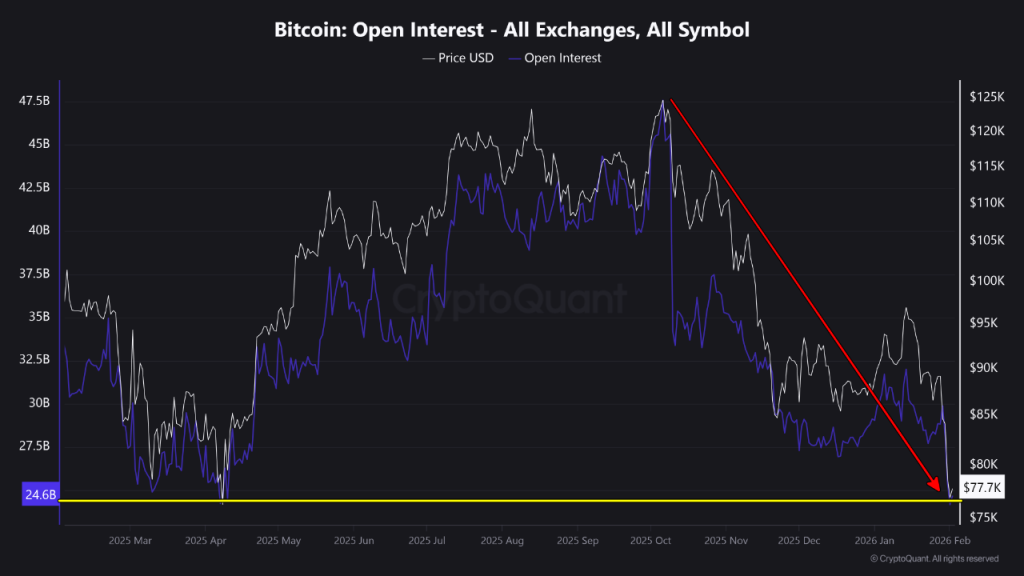
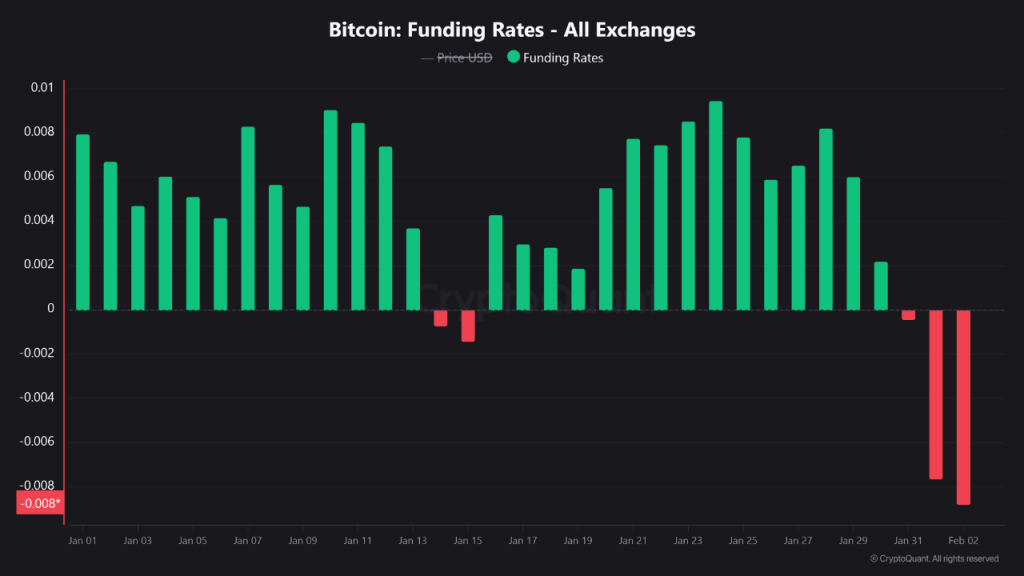
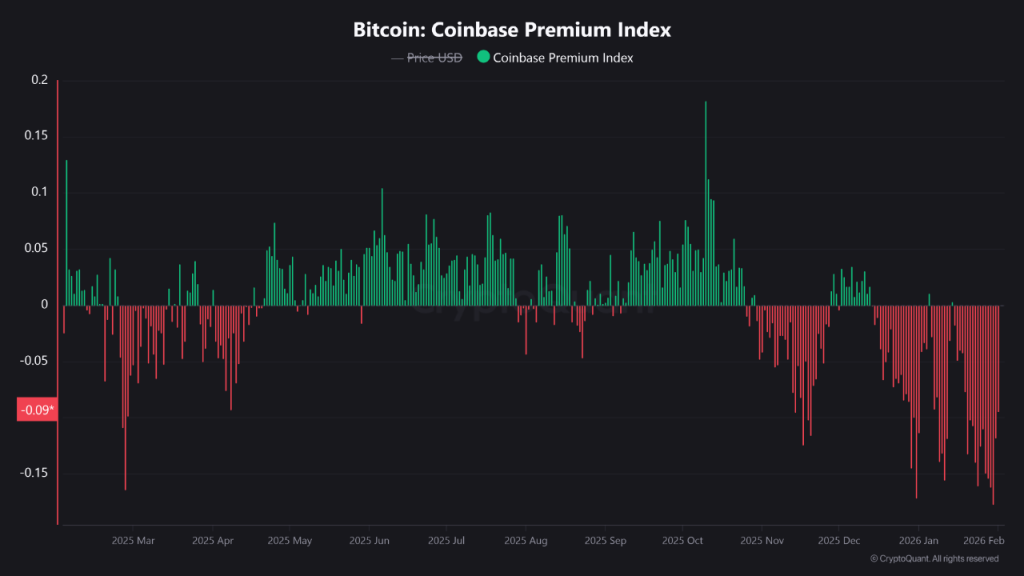
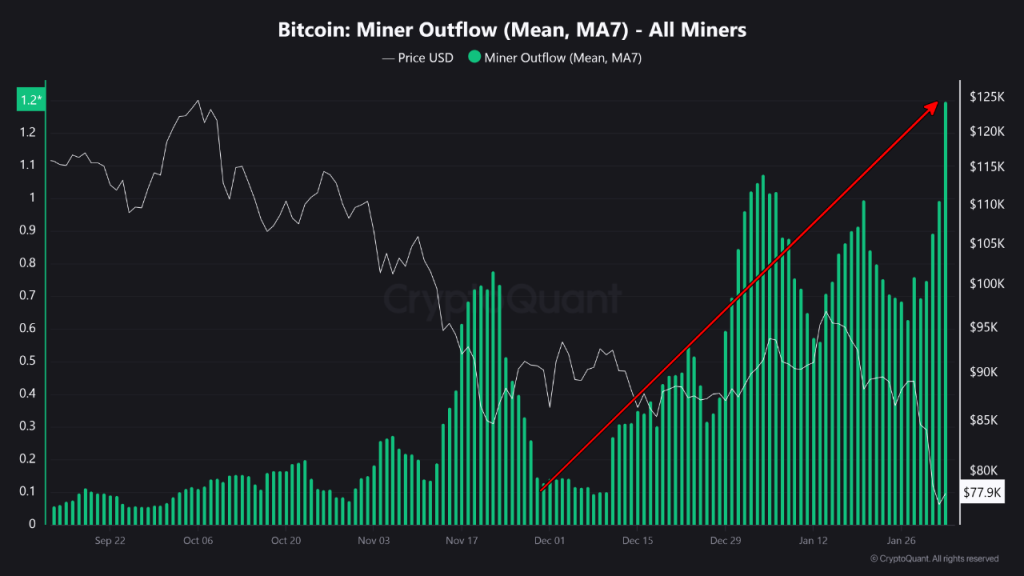


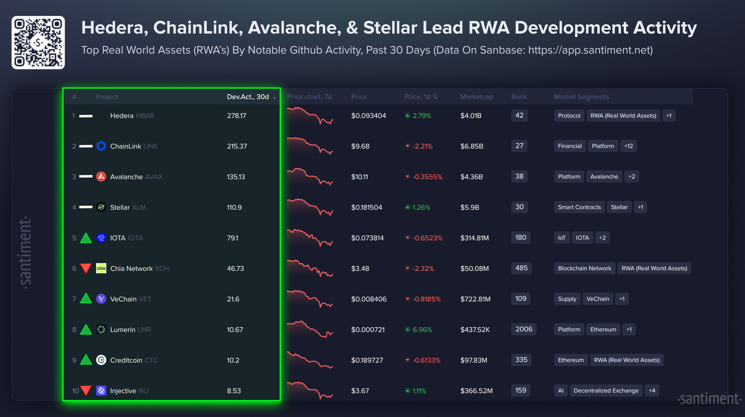
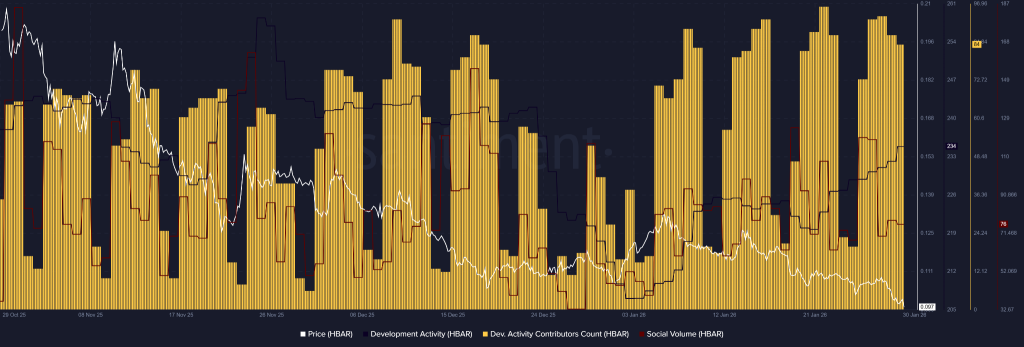
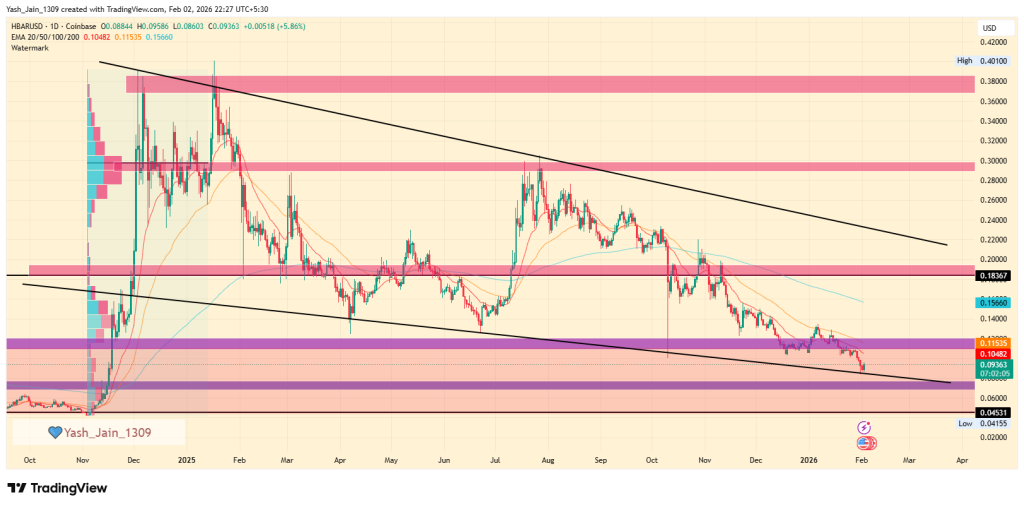
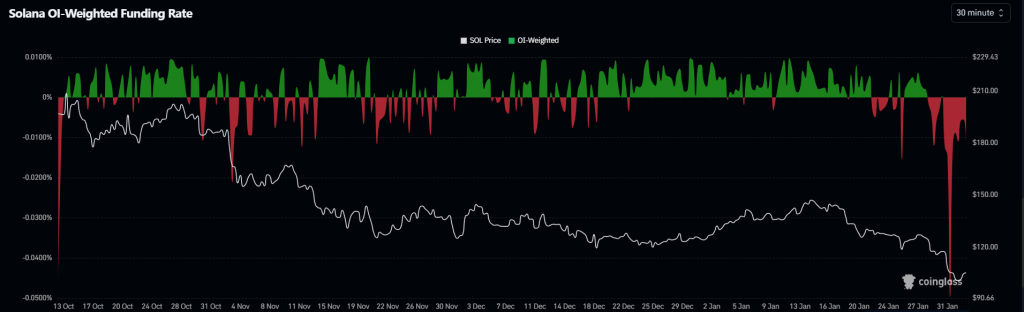
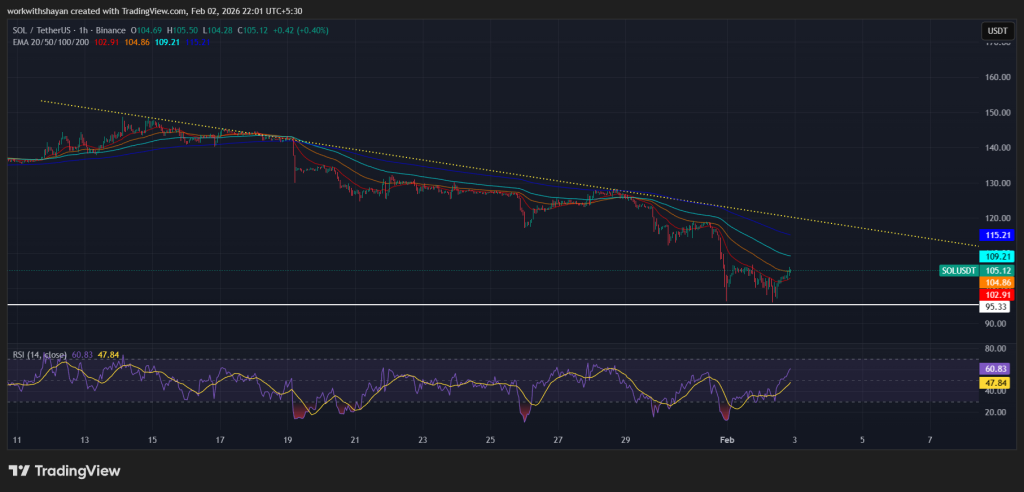


![Bitcoin 2026 [LIVE] Updates Stock Market, Gold And Silver Price, Crypto News](https://image.coinpedia.org/wp-content/uploads/2026/01/20181613/Bitcoin-2026-LIVE-Updates-Stock-Market-Gold-And-Silver-Price-Crypto-News-1-1-1024x536.webp)


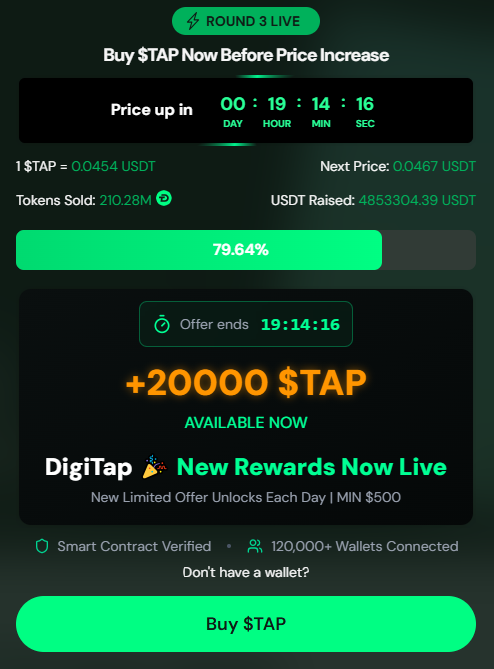


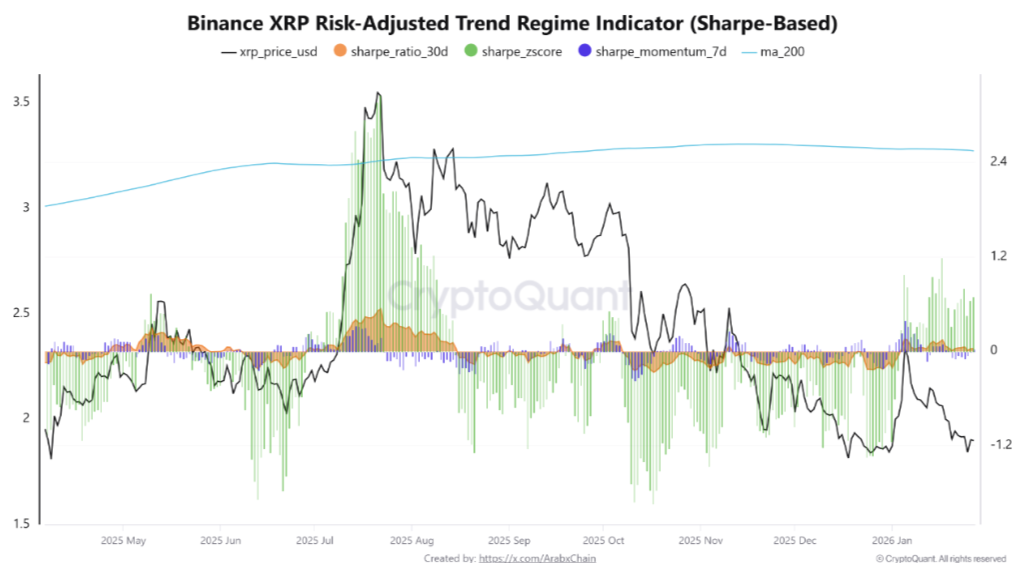


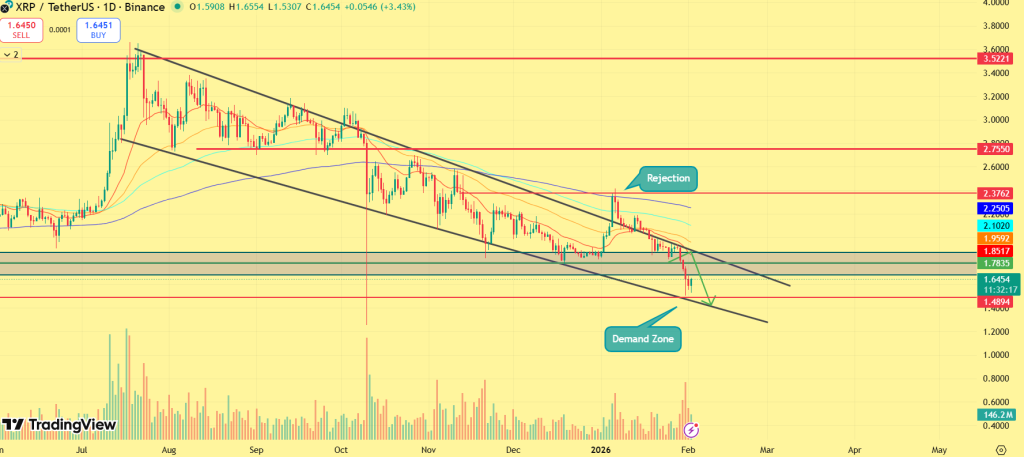


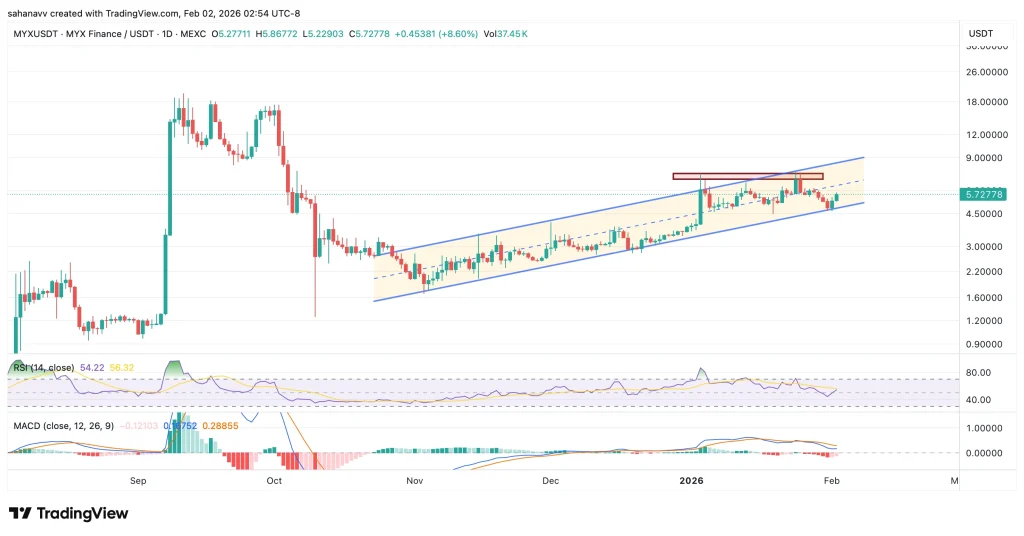
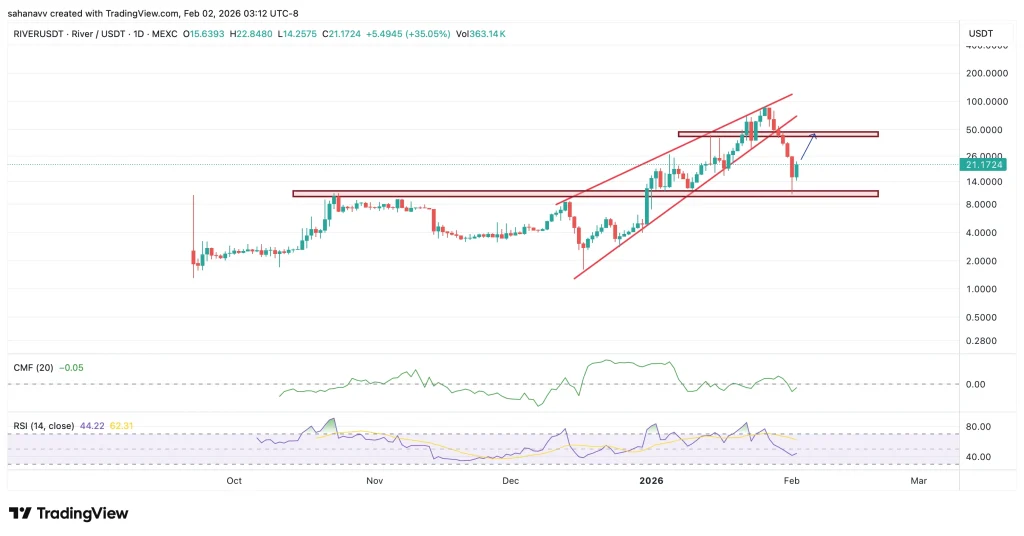
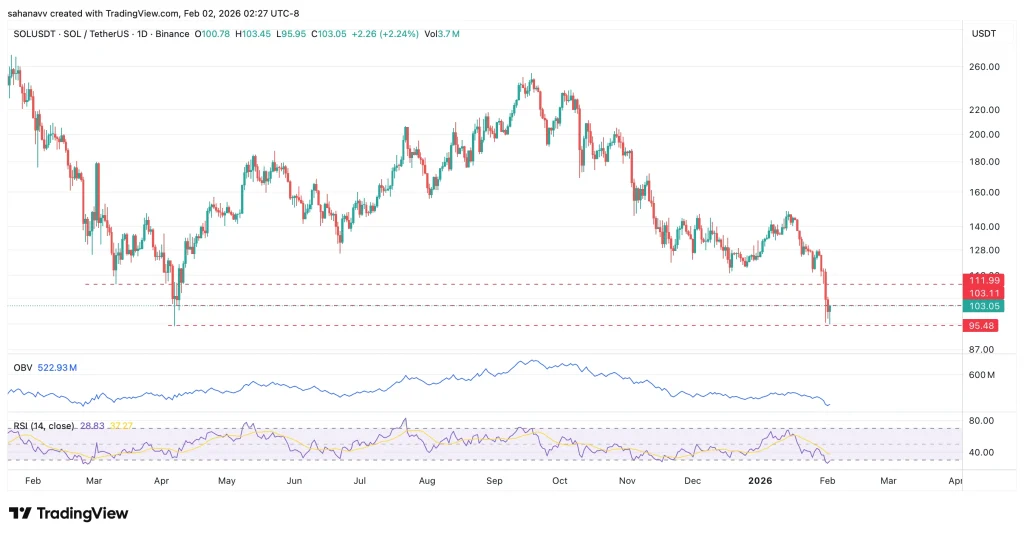


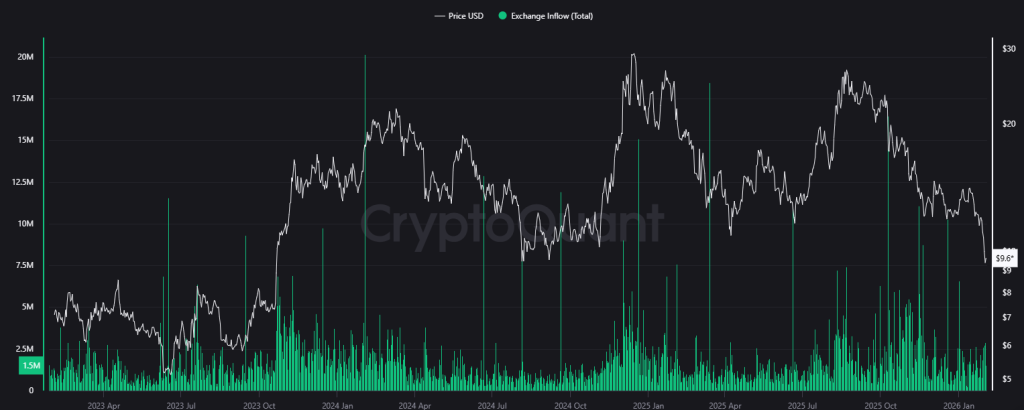
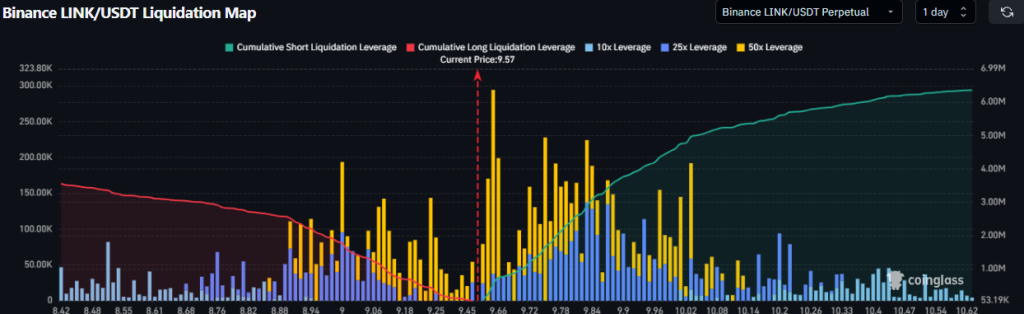
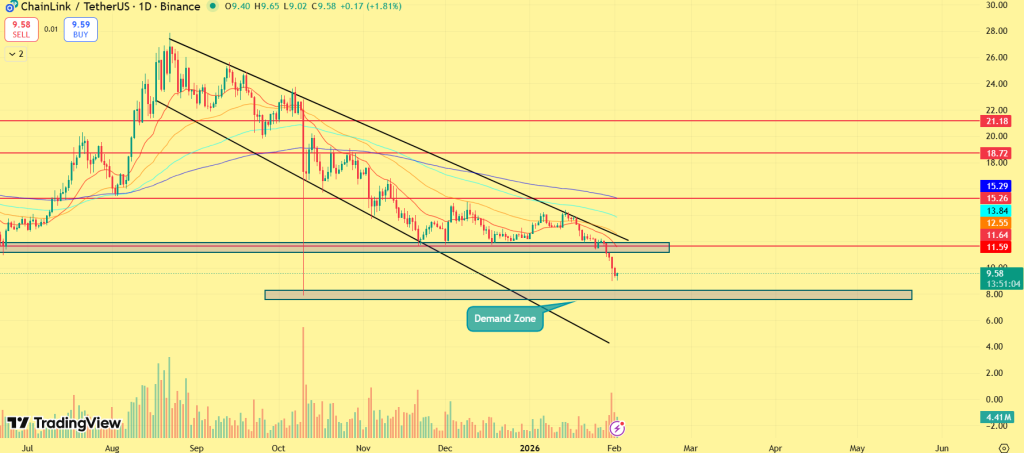

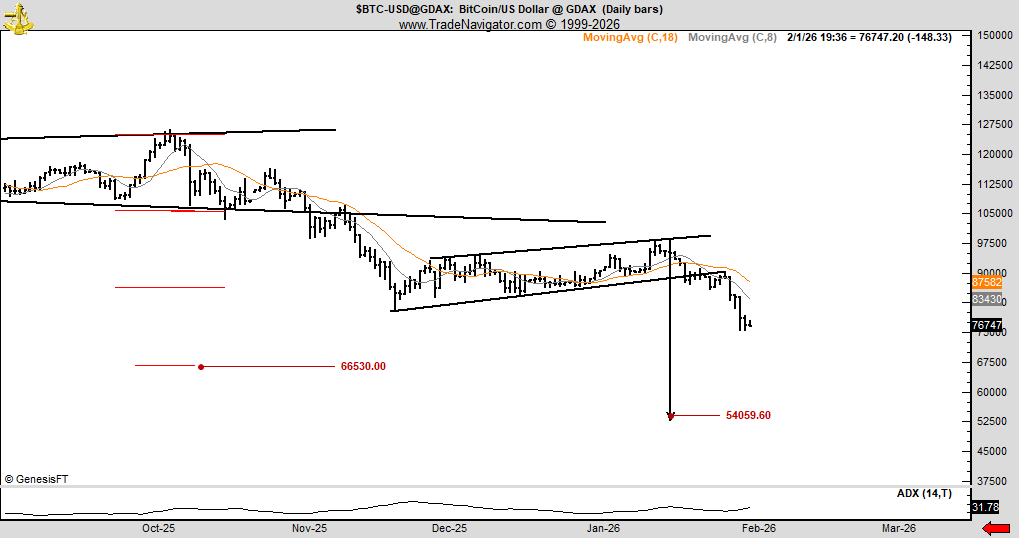
 (@CryptoFaibik)