ZEC price isn’t quietly trending but it’s stepping into a full-blown liquidity war. After months of suffocating under a descending triangle, ZEC price finally snapped the structure in early April, and yeah, it didn’t tiptoe either. The breakout shoved price action toward $400, effectively flipping the script on a long-term bearish trend that had been in control since late 2025.
But don’t get too comfortable on this rally. This isn’t a clean rally it’s messy, crowded, and very clearly dominated by whales.
ZEC Breakout Ends Months of Downtrend Pressure
The daily chart tells a straightforward story at first glance: a decisive breakout from a descending triangle, followed by a strong push higher. That move alone was enough to neutralize months of downward pressure. Easy narrative, right?
Well, price didn’t just keep running. It stalled. Instead of continuation, ZEC/USD slipped into a choppy range between $300 and $400. That’s not random. That’s where the real players showed up.
Whale Clusters Define Critical Support and Resistance
Zoom into the data, and things get interesting fast. Around the $300 level, there’s a heavy concentration of large buy orders with massive green clusters showing consistent whale accumulation. These aren’t casual trades. They’re deliberate, repeated entries, signaling that big players see $300 as a key re-entry zone.
In other words, it’s not just support it’s defended territory, at least it looks intact for now.
Now flip the script. Up near $400, the tone changes completely. Red clusters dominate, showing aggressive sell-side activity. Add to that the presence of large, persistent sell orders sitting at $410 and $430 for over ten days, and it’s clear: whales aren’t just taking profits they’re building a wall.
Order Book Reveals Where Next Volatility Hits
And then there’s the deeper layer the order book. Multiple pending orders exceeding $500,000 are scattered across key levels, with notable buy interest sitting around $290 and even as low as $175. These aren’t decorative numbers; they’re potential magnets for price.
So, what does that mean? If ZEC price dips and fills those $290 buy orders while open interest climbs, it likely signals fresh long positioning. That’s fuel. Real fuel. The kind that could drive a second leg higher, possibly toward the $636 macro target marked on the chart.
But let’s be real none of that matters if $300 support zone breaks cleanly.
ZEC Price Hinges on Whale Commitment at $300
Right now, Zcash price is hovering just above short-term moving averages, sitting dangerously close to that $300 cluster. This is where conviction gets tested. If the buy-side pressure holds and absorbs the sell orders stacked above, the structure leans bullish.
If not? Those lower liquidity pockets start looking very attractive. So, what’s next? Watch the whales. Not the headlines, not the hype but the actual orders. Because in this ZEC price setup, they’re not just participating in the market… they’re controlling it.
CHZ price just woke up with a sharp 10% intraday spike has pushed the token back into trader conversations, and this time, it’s not just technical noise. There’s a narrative building, and like always in crypto, that’s half the battle. The trigger? A clear push toward the U.S. sports market.
U.S. Expansion Narrative Fuels CHZ Price Momentum
Chiliz isn’t playing small anymore. After generating over $700 million for the sports industry through Fan Tokens, the project is now setting its sights on the United States. That’s not a casual move because it’s kind of a statement.
We have generated over $700M+ for the sports industry through Fan Tokens.
70+ top-tier clubs including FC Barcelona, Arsenal, Manchester City, PSG, Atlético Madrid, AC Milan, and Juventus have already launched their Fan Tokens.
— Chiliz – The Sports Blockchain (@Chiliz) April 19, 2026
And they’ve got the resume to back it. More than 70 top-tier clubs as they say including giants like FC Barcelona, Arsenal, Manchester City, PSG, Atlético Madrid, AC Milan, and Juventus have already launched Fan Tokens. That’s a serious footprint in global sports.
Now the pitch is simple: replicate that success in the U.S. Naturally if succeeds, CHZ prices will react. Fast.
SportFi Vision Expands Beyond Basic Fan Tokens
But here’s where things get interesting. Chiliz isn’t just selling tokens anymore they’re framing an entire category. “SportFi.”
According to the latest post, the chain isn’t trying to be a general-purpose network. It’s positioning itself as the global settlement layer for sports-based finance. Fan Tokens? Just the entry point.
We didn’t build a general-purpose chain. We built the global settlement layer for SportFi.
And Fan Tokens are the entry point to SportFi.
Next up: Fan Token Play. A new layer where on-pitch results meet tokenomics.@bitget breaks it down https://t.co/9m6JmpHaqD
— Chiliz – The Sports Blockchain (@Chiliz) April 20, 2026
And then comes the next layer: Fan Token Play. That’s where things shift from passive holding to active engagement where on-pitch results directly tie into tokenomics. It’s a bold concept, blending real-world sports outcomes with blockchain incentives. Whether it sticks… well, that’s another story.
Technical Indicators Align With Uptrend Structure
Now let’s talk charts, because hype alone doesn’t move markets but structure does.
CHZ price is currently climbing along an upward trendline, and so far, it’s respecting it. That’s a good sign for bulls, at least in the short term.
Volume data shows a fairly balanced fight: around 16.42 million in sell volume versus 15.79 million in buy volume. Not a runaway rally but not weak either.
Meanwhile, the Whale vs Retail Delta is sitting positive at 19.020, suggesting larger players are leaning slightly bullish. That’s usually where momentum starts to build.
Indicators aren’t asleep either. CMF is hovering around -0.11 still slightly negative, but not collapsing. RSI sits near 61.9, which puts CHZ in a “healthy but not overheated” zone. There’s room to run… if buyers stay interested.
CHZ Price Riding Narrative But Needs Follow-Through
So, this move is being driven by narrative and momentum working together. That’s powerful… but also fragile.
If the U.S. expansion story gains traction and SportFi actually delivers something tangible, CHZ price could keep grinding higher along that trendline.
But let’s be real if momentum fades, this could just as easily stall out. For now, CHZ price is moving up, backed by both headlines and technical structure.
Two days after the largest DeFi hack of 2026 drained $292 million from a bridge and sent $6.6 billion fleeing from Aave, Vitalik Buterin took the stage in Hong Kong and made the case for why Ethereum was built the way it was.
The timing was not lost on anyone in the room.
Vitalik’s Message Is Clear: Security Over Speed
Speaking at the opening ceremony of the 2026 Hong Kong Web3 Carnival, Buterin described Ethereum as a “world computer” – not a payments network competing on transactions per second, but a platform for verifiable data and shared digital assets where users control their own security.
That framing is a direct answer to the criticism Ethereum has faced for years. While Solana and other chains chase throughput, Buterin is doubling down on something different: trustworthiness.
Inside Ethereum’s Roadmap
Buterin laid out a three-layer plan.
In the short term, Ethereum is focused on scaling the gas limit, rolling out zkEVM, and beginning preparation for the post-quantum era. zkEVM allows Ethereum to perform more complex computations while keeping on-chain information verifiable – scaling without sacrificing transparency.
In the mid term, the goal is reducing transaction finality to between 10 and 20 seconds. Today that process takes roughly 16 minutes.
The long-term vision is the most ambitious: full quantum resistance, formal verification of the entire protocol, and maximised decentralisation. Buterin wants Ethereum to be verifiable by anyone on any device.
“zkVM allows you to verify the chain without relying on a large computer to run all operations yourself,” he said. “Everyone should verify the chain before you trust it; even your phone and IoT devices should verify the chain.”
The $292M Hack That Made Vitalik’s Argument For Him
The rsETH exploit on April 18 exposed exactly the kind of cross-chain bridge complexity Ethereum has historically been cautious about. An attacker used a single-verifier configuration on a LayerZero bridge to mint 116,500 unbacked rsETH tokens, deposit them on Aave as collateral, and walk away with real ETH. The fallout froze markets, trapped depositors, and raised uncomfortable questions about DeFi’s composability risk.
Buterin did not address the hack directly. He did not need to.
A roadmap built around security, decentralisation, and verifiability is the answer. The critics who say Ethereum moves too slowly might want to ask how a faster, less decentralised Ethereum would have handled Saturday.
Pi Network’s Protocol 22 upgrade deadline is just days away, and millions of Pi holders are hoping that Pi coin price will see a pump before the deadline.
As of now, Pi Coin (PI) is currently trading around $0.17, showing only a small gain as rising US–Iran tensions continue to hurt investor sentiment and keep trading cautious.
Pi Network Protocol 22 Upgrade Deadline Approaches April 27
According to the official confirmation from Pi Network developers, all node operators must complete the mandatory upgrade to Protocol 22.1 by April 27, 2026.
Nodes that fail to transition from version 21.2 will face automatic disconnection from the network.
This is more than just a routine update. It prepares the network for the upcoming Protocol 23 upgrade in May, which is expected to introduce full smart contract functionality.
Geopolitical Tensions Are Keeping PI Price Suppressed For Now
Despite the upgrade excitement, Pi Coin’s price is still under pressure due to global market weakness. Rising US–Iran tensions, especially around the Strait of Hormuz, have triggered a broader risk-off sentiment.
The situation worsened after Iran refused to resume peace talks unless the US lifts its blockade, followed by the US seizure of an Iranian-flagged cargo ship. This has added more uncertainty to the markets.
This “risk-off” environment is limiting buying activity in smaller tokens like Pi, and even Bitcoin is struggling to break above $76K.
Will Pi Network Coin Price Pump?
Historically, major network upgrades have acted as short-term price catalysts for the Pi token. At the time of the second migration event on March 28 triggered a 3.8% rally, and ahead of Pi Day, the token surged nearly 15%.
With the upgrade deadline now closed, similar pre-event buying activity could return. In fact, early signs are already visible.
A large outflow of over 1.7 million PI tokens from OKX suggests that some holders are moving their coins off exchanges, often seen as a sign that they are not planning to sell anytime soon.
Any bullish rally will test Pi day’s high price of $0.22, which will set the stage for further rally.
April has been one of the most turbulent months for the crypto markets, with over $600M lost across 12 exploits, exposing repeated failures in bridges, access controls, and governance—including the recent AAVE-linked disruption. But beyond these technical breakdowns, a different kind of risk is now coming into focus. Memecore (M), with its concentrated supply and low float, is raising structural concerns that feel familiar.
If exploits show how systems fail, what happens when the structure itself becomes the risk, and could this begin to resemble the path RAVE DAO took?
$6M+ Lost Across 12 Exploits—But Two Incidents Dominated the Damage
Crypto markets saw a wave of exploits this month, with 12 separate incidents exposing persistent weaknesses across DeFi, wallets, and infrastructure. However, the distribution of losses wasn’t even — two exploits alone accounted for nearly 95% of the total damage, highlighting how a single vulnerability at scale can outweigh multiple smaller failures combined.
The 12 Exploits This Month
Kelp DAO — $293M (Apr 18)
Drift Protocol — $285M (Apr 1)
Fake Ledger App — $9.5M+
Grinex Exchange — $13–15M (Apr 16)
Rhea Finance — $7.6M (Apr 16)
Hyperbridge — $2.5M (Apr 12)
BSC TMM — $1.67M (Apr 4)
Silo V2 — $392K (Apr 3)
Aethir — $423K (Apr 9)
Dango — $410K (Apr 13)
MONA — $61K (Apr 13)
SubQuery — $60K (Apr 12)
Zerion Wallet — $100K (Apr 14)
What stands out isn’t just the scale — it’s the repetition. Every single exploit this month falls into well-known attack categories, not unknown vulnerabilities. This suggests the issue isn’t innovation from attackers but persistent gaps in execution and security practices.
The main takeaway is clear: these were not unpredictable attacks, but they were preventable failures.
Crash Alert: Is Memecore the Next RAVE of the Crypto Market?
While exploits continue to expose technical weaknesses, another risk is quietly building on the market structure side. Memecore (M) price is now under scrutiny after on-chain investigator ZachXBT raised concerns over its high insider concentration, with reports suggesting more than 90% of the supply may be controlled by a small group.
Factors
Memecore (M)
Rave DAO (RAVE)
Supply Concentration
Reportedly, more than 90% held by insiders
Reportedly, more than 98% held by a few wallets
Float vs FDV
Low float, FDV (~$17B to $30B)
Low float, inflated valuation before the crash
Liquidity Depth
Thin relative to valuation
Thin liquidity before collapse
Price Support Mechanism
Insider control can defend the price in the short term
Price held artificially before breakdown
Market Behaviour
Prone to sharp moves on either side
Saw extreme volatility before the collapse
This creates a familiar setup. A low circulating float combined with a high fully diluted valuation ($17B–$30B) introduces structural inefficiencies, where price discovery becomes distorted. Similar conditions were seen in tokens like RAVE, which experienced a 95–99% drawdown after scrutiny increased and liquidity failed to support the valuation.
However, this isn’t a straightforward bearish case. Markets with tight supply and high insider control often behave differently. Limited float can artificially support price in the short term while also creating conditions for sharp short squeezes when liquidity is thin. At current levels, with the Memecore price at $3.3 to $3.4 and volume around $25 to $27 million, the gap between the circulating and total supply is pretty wide.
Hence, this suggests Memecore is a controlled environment where the price can move aggressively in either direction.
Key Signals to Watch Next!
After experiencing massive losses this month, here are the signals that matter next as the M price set-up is structure-driven and if a breakdown triggers, it would be a massive one.
Exchange inflow spikes → Large transfers (especially from insider wallets) signal potential distribution and incoming sell pressure
Price drop with rising volume → Indicates real selling, not just volatility; demand failing to absorb supply
Failure at key psychological levels (e.g., $3) → Loss of confidence triggers stops and accelerates downside
Thin liquidity vs high valuation → Weak order books + high market cap create unstable price conditions
Shift in narrative/sentiment → From “strong treasury” → “sustainability concerns” signals confidence breakdown
Insider wallet movements → Early holders reducing exposure can trigger broader market exits
Wrapping it Up: Is Memecore the next Rave Dao?
Memecore (M) price is showing structural similarities that can’t be ignored—concentrated supply, thin liquidity, and narrative-driven support. But it hasn’t reached the breakdown phase yet. For now, the setup remains stable on the surface, fragile underneath.
So the real question is: is Memecore the next RAVE DAO — or just another controlled market that hasn’t cracked yet?
The RaveDAO (RAVE) token has recorded one of the sharpest reversals in recent cryptocurrency trading, plunging more than 100% within 48 hours after a rapid surge, wiping out billions of dollars in market value.
The token had climbed steeply toward the $27 level before reversing course in an equally aggressive sell-off. Liquidity thinned quickly during the downturn, with prices cascading lower as bids evaporated, according to market data.
The abrupt move has drawn industry attention, with major exchanges including Binance, Bitget, and Gate.io now under scrutiny over trading activity around the peak.
Blockchain investigator ZachXBT alleged that insiders may have used large exchanges to engineer a short squeeze, driving prices sharply higher before exiting near the top. The claims have intensified calls for transparency as analysts examine trading patterns during the rally.
Executives at the exchanges acknowledged the situation and said reviews are underway.
Bitget’s managing director, Gracy Chen, said the platform launched an internal investigation shortly after the crash. Binance CEO Richard Teng stated the exchange is reviewing activity and would take action against any “market misconduct.” Gate.io representatives said user protection remains a priority as inquiries continue.
RaveDAO has denied involvement in any coordinated activity. Meanwhile, ZachXBT has reportedly offered a $25,000 bounty for whistleblowers, suggesting further disclosures could emerge.
RaveDAO (RAVE) Price Analysis: Parabolic Rally Ends in a Liquidity Collapse
Market participants said RAVE’s price structure resembled a textbook blow-off top. The token surged rapidly on momentum-driven inflows, reaching the $25–$27 range before reversing within hours.
Once the rally stalled, liquidity deteriorated sharply. The lack of buy-side support triggered a cascade-style sell-off, pushing the token back toward sub-$1 levels.
Analysts note that significant overhead supply now remains. Any short-term recovery could face resistance between $3 and $5, with stronger barriers near $8–$10 where previous trading activity was concentrated.
On the downside, holding above $1 is seen as critical. A sustained break below that level could push the token into deeper illiquid territory.
Multiple factors behind the collapse
Post-crash analysis suggests the move was driven by a combination of factors rather than a single trigger.
The rally appeared to be fueled by low float and speculative inflows, creating conditions for a short squeeze that forced bearish traders to cover positions. However, once upward momentum faded, long positions began unwinding, triggering a reverse liquidation cycle.
This feedback loop, combined with thin liquidity, amplified the speed and scale of the decline.
Market Impact and Outlook: Confidence Shaken, Uncertainty Remains
The episode has raised broader concerns about market integrity in low-liquidity tokens, particularly given the speed of the move and allegations of manipulation.
With exchanges continuing to review trading activity, sentiment remains cautious. Analysts say any near-term price rebounds are likely to be corrective unless key resistance levels are reclaimed with strong volume.
For now, uncertainty dominates the outlook, with both price action and the results of ongoing investigations expected to shape the token’s next move.
Michael Saylor’s Strategy has acquired 34,164 BTC for about $2.54B at an average price of $74,395 per Bitcoin. This latest purchase brings its total holdings to 815,061 BTC, accumulated for roughly $61.56B at an average cost of $75,527. The firm also reports a 9.5% BTC yield year-to-date in 2026. The move highlights Strategy’s continued aggressive accumulation approach, reinforcing its long-term conviction in Bitcoin despite ongoing market volatility.
The asset could reach a high of $6100 by the end of 2026.
The price of Ethereum could reach a high of $15,575 by 2030.
Since its launch in 2015, Ethereum has evolved from a pioneering smart-contract platform into the primary settlement layer for the global digital economy. What began as a space for experimental decentralized applications (dApps) has now transformed into a robust ecosystem attracting significant institutional interest. This shift is largely driven by Ethereum’s “Business Ready” infrastructure, which is designed to support high-assurance financial applications and large-scale tokenization initiatives.
The successful rollout of the Pectra and Fusaka upgrades has significantly improved Ethereum’s scalability and fee efficiency. These upgrades addressed long-standing network bottlenecks, making the platform more practical and cost-effective for enterprise adoption and high-volume blockchain activity.
As the ecosystem progresses through 2026, the narrative surrounding Ethereum has shifted from simple utility to institutional-grade resilience and infrastructure. With a well-defined roadmap emphasizing censorship resistance, modular scalability, and long-term sustainability, Ethereum is increasingly positioned to support the next generation of decentralized finance (DeFi) and global capital markets.
In this Ethereum price prediction for 2026–2030, we examine whether these structural improvements, combined with evolving macroeconomic conditions, could push ETH toward new valuation milestones over the coming years.
In the first quarter of the year, the price of Ethereum faced significant challenges, dropping from the $2,800 support level to a low of $1,750 in early February. Fortunately, February brought some stabilization, and March saw a promising rise to $2,370. However, by late March, ETH dipped below $2,000.
In April, the ETH price attempted to retest the $2,390 level, briefly reaching as high as $2,460 in mid-April. Currently, it is facing bearish pressure after taking liquidity above $2,390. The price is holding at the 50-day EMA band; if it drops below this level, a revisit to $2,000 is likely. However, if the 50-day EMA holds, there could be a strong upside breakout above $2,390 in the remaining days of April.
Ethereum Price Prediction 2026
The Ethereum price currently exhibits a compelling long-term technical structure on the monthly timeframe, anchored by a multi-year 45-degree ascending trendline that has guided price action since 2020.
Historically, this trendline has served as a critical pivot point, with the market oscillating between periods of aggressive upward expansion above the line and phases of strategic consolidation below it.
Notably, when ETH trades beneath this trendline, it often forms a secondary short-term ascending channel lasting a few months. These channels act as accumulation zones, where price fluctuates until sufficient demand builds, eventually leading to a high-momentum breakout once bullish conditions are met.
In the current 2026 market environment, Ethereum appears to be following a familiar structural pattern, albeit with increased volatility and a broader trading range. The ongoing ascending channel, which began in 2025, aligns with the multi-year trendline but is significantly wider compared to previous cycles. While the price action indicates recovery potential, the market has not yet reached the specific demand threshold required to trigger a definitive vertical surge.
Overall, Ethereum’s multi-year trendline combined with the current ascending channel suggests a measured accumulation phase, setting the stage for a potential strong bullish breakout in the months ahead.
From a volume perspective, the anchored volume profile suggests that Ethereum (ETH) is finding significant support around key high-volume zones. These areas, particularly the ranges between $1,700–$1,900 and $1,200–$1,400, have historically attracted institutional interest, creating a solid floor that bears are unlikely to easily break.
If buyer demand strengthens at these levels, ETH could follow a recovery trajectory with an initial target near $2,878. A successful breach of this level would then pave the way for a retest of the $4,076 psychological resistance, signaling renewed bullish momentum.
However, a cautious approach remains warranted. If the market fails to generate sufficient demand at these support zones, the current consolidation phase below the multi-year trendline is likely to continue. In this bearish scenario, ETH would remain trading within its 2025 ascending channel, extending the accumulation period before a decisive trend emerges.
The interplay between this short-term ascending channel and the long-term trendline will ultimately determine whether Ethereum’s next move is a bullish continuation or a prolonged sideways consolidation.
ETH On-Chain Analysis
Ethereum’s price is currently stabilizing and 30-days On-chain data shows major whale transaction counts beyond $1 million has been rising in past 30-days. This is signaling “smart money” accumulation near the $2,000 support.
Moreover, the fundamentals of the network are growing. Since January 2025, the value of tokenized real-world assets (RWAs) on the blockchain has reached $20.4 billion. The Ethereum ecosystem now has 146 active Layer 2 networks, with a total value of $38.2 billion locked in these networks. Together, Ethereum’s mainnet and Layer 2 networks show that stablecoins account for over 60% of the market share, totaling about $179 billion.
This indicates a significant amount of liquidity in the ecosystem. Additionally, the number of ETH tokens on centralized exchanges is falling, meaning fewer ETH tokens are less available on CEX platforms meaning bullish pressure increasing.
Ethereum Price Prediction 2027-2030
Year
Potential Low ($)
Potential Average ($)
Potential High ($)
2027
7,071.08
14,142.16
21,213.24
2028
10,606.62
21,213.24
31,819.86
2029
15,909.93
31,819.86
47,729.79
2030
23,864.90
47,729.79
71,594.69
Ethereum (ETH) Price Prediction 2027
The Ethereum 2027 forecast expects the ETH coin price to make a new all-time high at $21,213.24. However, a correction based on market shortcomings may drive the ETH crypto to $7,071.08, with an average of $14,142.16.
ETH Price Prediction 2028
In 2028, the chances of Ethereum dominating the crypto market rise as the ETH price potentially makes a new high at $31,819.86. On the other hand, the altcoin might fall to $10,606.62, making an average of $21,213.24.
Ethereum Price Forecast 2029
Approaching its all-time high of $47,729.79 in 2029, the Ethereum price is expected to surpass the psychological barrier of $40,000. In case of a correction, $ETH may reach a low of $15,909.93, with an average price of $31,819.86.
Ethereum Price Prediction 2030
As per our Ethereum Price Prediction 2030, the ETH crypto price is projected to reach a new all-time high of $71,594.69 in 2030, with a potential low of $23,864.90 and an average price of $47,729.79.
Ethereum (ETH) Price Prediction: Market Analysis?
Year
2026
2027
2030
Changelly
$5,800
$7,500
$25,000
CoinCodex
$6,300
$7,850
$28,200
WalletInvestor
$5,940
$7,450
$21,500
Never Miss a Beat in the Crypto World!
Stay ahead with breaking news, expert analysis, and real-time updates on the latest trends in Bitcoin, altcoins, DeFi, NFTs, and more.
FAQs
What is the Ethereum price prediction for 2026?
Ethereum could reach $6,200 in 2026 if accumulation strengthens and demand at key support levels increases.
What will be the price of Ethereum in 2027?
ETH may hit around $21,200 in 2027, with potential lows near $7,071 depending on market conditions.
How much will 1 Ethereum be worth in 2030?
By 2030, 1 ETH could reach a new all-time high of $71,500 under strong adoption and network growth.
Could Ethereum reach $100,000 by 2040?
If adoption and blockchain integration continue rising, Ethereum could theoretically approach $100,000 by 2040.
How high will Ethereum go in 2050?
Long‑term, Ethereum could exceed $150,000–$200,000 by 2050 with widespread global adoption, DeFi and tokenization.
Is Ethereum a good investment?
Ethereum remains a strong long-term investment due to growing DeFi use, Layer 2 adoption, and rising institutional interest.
Expanding exchange-ecosystem demand could lift BNB price toward $2000 by the end of this year.
Long-term network usage growth may extend BNB price toward $10,000.
Binance Coin (BNB) suggests a fundamental shift in how the asset responds to broader market dynamics. In 2026, the token’s performance increasingly reflects on-chain utility and ecosystem liquidity rather than mere speculative volatility. This transition from reactive price swings to a more structured price action indicates a maturing market environment.
As the ecosystem stabilizes, the technical narrative centers on long-term accumulation and the absorption of supply within established demand zones. Sustained network activity across the Binance Smart Chain provides a foundational backdrop for this consolidation, potentially setting the stage for a period of extended price discovery. By focusing on fundamental network health and institutional integration, the outlook for the next several years leans toward organic growth and structural resilience within the global digital asset landscape.
So, what’s next for the BNB price in the rest of 2026 and beyond? What can be the future price movements? Let’s get into the Binance Coin (BNB) Price Prediction 2026–2030.
In the third quarter of 2025, we witnessed an impressive rally, soaring 125% from the $600 support level to an exhilarating $1,375. However, by the fourth quarter of 2025 and into the first quarter of 2026, the BNB price retreated back to the $600 demand zone, erasing those remarkable gains.
Since February, we have observed a steady accumulation around this vital $600 level, a trend that has continued into March, so Q1 was tough. But, as Q2 began with April, this level appears to have solidified as a robust support point, suggesting that bullish momentum could very well resume this month.
Despite prevailing market challenges, the price has demonstrated remarkable resilience, remaining above $600 throughout Most of April. Should bullish pressure intensify in remaining days of April, we may see a potential retest of $750; otherwise, further consolidation may continue throughout the month.
Recent News/ Opinions
On April 1, 2026, Binance Earn launched new Yield Arena offers, providing limited-time opportunities to earn up to 35% APR. This weekly update spans across multiple products, including Simple Earn, ETH and SOL Staking, and Dual Investment.
On March 27, 2026, binance shared that equity and commodity perpetual futures on Binance surpassed $150 billion in cumulative trading volume. This milestone was supported by an immense processing of over 110 billion trades in one quarter, highlighting the growing crossover between traditional finance and digital markets.
A recent ruling news on March 7th came from the US federal court that it has positively dismissed all anti-terrorism claims against Binance, alleviating a significant legal burden. In the Southern District of New York, a judge concluded that the plaintiffs, comprising 535 individuals citing 64 attacks from 2017 to 2024, did not establish sufficient evidence to demonstrate that Binance had assisted or conspired with terrorist organizations. This decision marks a commendable step forward for Binance, affirming its commitment to compliance and integrity.
Binance Coin (BNB) Price Prediction 2026
Based on the technical structure of the BNB/USD weekly chart, the price action reflects a long-term ascending channel (or wedge) that has defined the asset’s trajectory since the massive demand surge from the $40 level in early 2021. This multi-year uptrend culminated in a new all-time high of approximately $1,375 in late 2025, validating the token’s utility and its position within the Binance ecosystem. Currently, the market is witnessing a convergence of horizontal price levels with channel’s dynamic trendline support, which reinforces the technical significance of the current price zone.
As of Q1 2026, BNB price is testing a critical turning support zone around the $600 horizontal support, which aligns precisely with the lower boundary of the primary ascending channel. This area is currently serving as a consolidation floor, suggesting a period of institutional accumulation. Historical precedent highlights the importance of this trendline; a similar touchpoint in late 2023 at the $200 range served as the launchpad for a massive rally, though it took roughly 238 days to reach the channel’s median line.
Looking ahead through 2026, the primary bullish thesis anticipates a recovery toward the $1,000 psychological level. If the recovery pace mirrors previous cycles, BNB/USD could reach the channel’s middle band by Q3 2026. However, if consolidation extends further into the year, the recovery might be more gradual, stretching toward the year-end.
Conversely, a decisive break below the $600 footing would invalidate the current setup, significantly increasing the probability of a deeper correction toward the major $200 demand zone.
BNB On-Chain Analysis
Recent on-chain data highlights the network’s resilience, with daily transactions stabilizing at 15 million in Q1 2026 despite market fluctuations. This sustained utility, paired with total unique addresses nearing the 800 million mark, signals a consistent rise in global adoption. These fundamental metrics suggest a robust foundation for long-term ecosystem growth and structural asset valuation.
Binance Coin Crypto Price Prediction 2027 – 2030
Year
Potential Low ($)
Potential Average ($
Potential High ($)
2027
1200
1420
1800
2028
1600
1950
2300
2029
2100
3250
3900
2030
2500
3800
4500
Binance Coin Price Prediction 2027
As per the Binance Coin Price Prediction 2027, Binance Coin may see a potential low price of $1200. The potential high for Binance Coin price in 2027 is estimated to reach $1800.
BNB Price Prediction 2028
In 2028, Binance Coin price is forecasted to potentially reach a low price of $1600 and a high price of $2300.
Binance Coin Price Forecast 2029
Thereafter, the Binance Coin (Binance Coin) price for the year 2029 could range between $2100 and $3900.
Binance (BNB) Coin Price Prediction 2030
Finally, in 2030, the price of Binance Coin is predicted to remain steadily positive. It may trade between $2500 and $4500.
The long-term projection assumes Binance Coin sustains relevance in enterprise blockchain use cases, with growth moderating over time as the asset matures.
Stay ahead with breaking news, expert analysis, and real-time updates on the latest trends in Bitcoin, altcoins, DeFi, NFTs, and more.
FAQs
What is the BNB price prediction for 2026?
BNB could recover toward $1,000 in 2026 if the $600 support holds and Binance ecosystem demand grows, supported by rising network usage and liquidity.
What will be the BNB price in 2030?
BNB could trade between $2,500 and $4,500 by 2030 if blockchain adoption grows and the Binance ecosystem maintains strong network activity.
How high can BNB price go by 2040?
Long-term projections suggest BNB could reach $13,000–$38,000 by 2040 if the network expands globally and maintains strong adoption across DeFi and Web3.
What factors influence Binance Coin’s price?
Price depends on exchange network usage, liquidity, adoption trends, historical support/resistance zones, and institutional participation.
Is Binance Coin (BNB) a good long-term investment?
BNB is often viewed as a strong long-term asset due to exchange utility, token burns, and ecosystem growth, though crypto investments always carry risk.
Bitcoin fell below $74,000 after weekend gains faded, following rising US-Iran tensions after a reported cargo ship seizure and retaliation threats. The price is now moving between key levels, with $74,000 as support and $76,000–$77,000 as resistance, while traders also watch a possible CME gap and liquidity zones. Sentiment remains divided between bullish continuation and deeper pullback, as geopolitical risks and high leverage continue to drive short-term volatility in the market.
A user on X posted what appears to be a demonstration of buying XRP directly inside WhatsApp using a Solana-based AI agent, and the post has turned heads, including a reaction from Solana co-founder Anatoly Yakovenko.
The user, posting under the handle nxxn, shared what they described as a swap of 0.1 SOL for 5.99 wXRP executed entirely within the WhatsApp messaging app. The instruction given to the bot was straightforward: “buy 0.1 SOL worth of wXRP.”
“I just bought XRP on Solana through WhatsApp,” the user wrote. “Solana is officially ready for boomers.”
The swap was reportedly carried out through @solanaclawagent, an AI-powered trading agent that appears to have integrated with WhatsApp as a conversational interface for on-chain activity.
Yakovenko’s response to the post gave it visibility well beyond what a typical product experiment would receive. When one of the architects of the Solana blockchain publicly acknowledges a use case, the community treats it as a signal of legitimacy rather than a novelty.
For the unversed, Hex Trust and LayerZero launched wrapped XRP on the Solana blockchain in December 2025 with over $100 million in liquidity. Adoption since then has been more measured than some expected, with the majority of wrapped XRP supply still sitting on Ethereum rather than migrating to Solana’s higher-throughput ecosystem.
The demo touches on something the crypto industry has discussed for years without delivering: making on-chain transactions accessible through interfaces that mainstream users already use daily. A WhatsApp interface for executing swaps could change that dynamic by reaching users who would never navigate a traditional DeFi front end.
Community reaction ranged from genuine excitement to playful scepticism. Whether the integration scales beyond a demo or remains a proof of concept is unclear.
The CLARITY Act has more institutional support behind it than at any point in its history.
The White House is pushing hard. Coinbase CEO Brian Armstrong, who blocked it twice, now backs it. Senator Lummis calls it now or never. And across crypto Twitter, the narrative that Trump will sign it soon is spreading fast.
But spend time in the Reddit threads and X reply sections where real XRP holders are actually talking, and you find something more complicated. Three distinct camps have formed.
The structural believers who think legal permanence changes everything for institutional adoption. The sell-the-news traders who think the market has already moved and late buyers will get burned.
And the exhausted long-term holders who have watched every catalyst produce a brief pop and then fade, and are not sure this one will be any different.
We went across Reddit and Twitter to find out what real XRP traders and investors are actually saying.
What Happens to XRP the Day the CLARITY Act Becomes Law
The structural case for the CLARITY Act is specific and it is strong.
Right now, XRP’s commodity classification is a regulatory opinion jointly issued by the SEC and CFTC in March. A future administration could reverse it without a single vote in Congress. Banks and asset managers with serious compliance obligations know this, and their legal teams will not greenlight large XRP allocations on the basis of guidance that could be undone.
The CLARITY Act converts that opinion into permanent federal statute.
The capital implications are significant. Standard Chartered projects $4 to $8 billion in XRP ETF inflows if the bill passes.
A banking industry professional on Reddit this week explained the mechanism: “Banks have a strong aversion to risk with large legal departments. Once there is codified legal clarity banks can begin adoption. It may not happen as a surge – it might be a slow trickle.”
Institutional adoption driven by legal permanence is structural. It does not arrive in one day and it does not get priced in overnight.
The CLARITY Act Has Not Even Had a Committee Vote Yet
Before the optimism runs too far ahead, the procedural reality deserves a clear read.
The CLARITY Act markup is targeted for late April but has not been formally scheduled. The bill still needs a Senate Banking Committee markup, a 60-vote Senate floor vote, reconciliation with the House version, and presidential signature. Four steps remain.
Realistically the earliest Trump signs anything is summer. Polymarket currently prices 2026 passage at 50%, down from 82% in February.
Senator Cynthia Lummis said it plainly:“This is our last chance to pass the Clarity Act until at least 2030.”
The Community Has Heard This Before
The skeptics are not arguing the bill is bad for XRP. They are arguing the market has already moved on the expectation of it passing, and that the actual vote will be the moment long-term holders finally exit.
The Bitcoin ETF comparison is everywhere in community threads. BTC ran 164% on ETF rumours. Then flatlined after approval. The traders who won were positioned before the confirmation, not after it.
The exhausted holders are a third camp entirely. These are people who bought at $0.28, held through the SEC lawsuit, watched XRP hit $3.65 in July 2025, and have since watched it drift back below $1.50 despite a string of genuine regulatory wins.
Garlinghouse has reportedly moved his CLARITY Act deadline three times. February he said 80% odds by end of April. April is about to end, and the markup has not been scheduled. The community has learned to discount every deadline.
“Nothing happens. Nothing ever happens to XRP except it drops,” reads one widely upvoted comment this week. It was not posted by someone who has given up on XRP. It was posted by someone who has been holding for years and is tired of being told the moment is finally here.
The bill has never had more support. The community has never been more worn down. In crypto, those two things have a habit of arriving at exactly the same time.
Coinbase has launched crypto-backed USDC loans for UK users, powered by the Morpho protocol on Base. The feature lets users borrow USDC against BTC, ETH, and cbETH, with limits up to $5M for Bitcoin and $1M for Ethereum. Loans have flexible repayment with no fixed schedules, but require monitoring of loan-to-value ratios to avoid liquidation risk. The move expands Coinbase’s 2025 US rollout, blending DeFi infrastructure with regulated access, aiming to boost liquidity while highlighting volatility and collateral risks.
Aave price has stabilized after its recent shock, but the real problem may still be unresolved. While price has attempted a recovery, deeper signals suggest the market is still dealing with the aftermath, not moving past it. The key question now isn’t just whether AAVE can bounce but who ultimately bears the brunt of the damage and whether this recovery can hold.
Exchange Inflows Spike — Are Holders Preparing to Exit?
AAVE is seeing a sharp surge in exchange inflows, with data showing nearly $21 million in tokens moving to Binance. This shift is significant, especially coming right after a period of heightened volatility. Exchange inflows typically rise when holders prepare to sell, and the timing suggests that participants may be positioning for exits rather than accumulation.
Souce: Cryptoquant
What makes this more notable is the behavior change. Earlier phases of the decline saw relatively muted inflows, indicating a willingness to hold through uncertainty. Now, that pattern appears to be shifting. While inflows alone don’t confirm immediate selling, they often act as a leading signal — particularly when they appear during weak recovery attempts. This raises a key risk: the recent bounce could be facing overhead supply waiting to be offloaded.
Weak Reclaim Raises Bull Trap Risk
AAVE’s recent price action adds to this concern. The bounce attempted to reclaim the $100 level but failed to hold, with the price quickly rejecting back below the resistance. This zone, which previously acted as support, is now functioning as supply—a classic role reversal that typically signals continued weakness.
The rejection was accompanied by a spike in volume, suggesting the move higher was met with active selling rather than sustained buying. Price is now hovering near the $90–$92 region, with $85.80 acting as the next key support. Momentum indicators reinforce this view. RSI remains below neutral, and MACD is already flattening after a brief bullish crossover, indicating that upside momentum is fading.
Key Levels to Watch
$100 — Immediate Resistance / Invalidation Level
$95 — First Reaction Zone
$88–$92 — Critical Support Zone
$85.8 — Breakdown Trigger
$80 — Next Downside Target
The Bottom Line: What Comes Next
AAVE is now at a decisive point. The $88–$92 range remains the immediate zone to watch. A break below this level could expose the $85 region, with further downside toward $80 if selling accelerates. On the upside, bulls need a strong reclaim of $100, followed by sustained acceptance above that level, to shift momentum and invalidate the current bearish structure.
Until then, the trend remains fragile. The bounce has not confirmed strength — it has only tested resistance. The initial shock may be over, but the market is still adjusting to its consequences. Exchange inflows suggest potential sell pressure, while price action shows that buyers have yet to regain control. This leaves AAVE in a transition phase — caught between recovery and continuation.
Access to liquidity has become a core part of crypto portfolio management, and speed has become a defining factor. Markets move continuously, and access to liquidity often determines whether an opportunity is captured or missed.
Borrowing against crypto has evolved to match that pace. What used to take hours—or even days—on traditional platforms is now executed in minutes, sometimes seconds. But “instant” in this context does not mean fast payouts; it reflects a different loan structure altogether.
How to Borrow Against Crypto Instantly
Borrowing against crypto has split into two distinct models: traditional loans and crypto credit lines.
A traditional crypto loan works like a bank loan. You choose an amount, submit a request, wait for approval, receive funds, and start paying interest on the full balance. Even if you do not use all the capital, the cost begins immediately.
A crypto credit line works differently. Instead of borrowing once, you unlock a revolving limit backed by your collateral. You can draw funds at any time, repay partially or fully, and reuse the same limit again. Interest applies only to the amount actually used, while unused credit remains free.
This is the model used by Clapp.finance, a regulated crypto investment platform that offers a flexible credit line, allowing users to access their available limit at any time once collateral is deposited. It supports multi-collateral lending, which means you can borrow fiat against BTC, ETH, SOL, XRP, and more than 19 cryptocurrencies within a single account.
Once the credit line is set up, there is no need to reapply. Liquidity is continuously available, which is what makes borrowing effectively instant.
How Borrowing Against Crypto Works
The flow is straightforward but important to understand precisely.
Step 1: Lock Collateral
You deposit assets such as BTC or ETH into the platform. These assets remain yours but are locked as collateral.
Step 2: Receive a Credit Limit
The platform assigns a borrowing capacity based on a loan-to-value ratio (LTV). For example, depositing $10,000 in BTC might unlock a $2,000–$5,000 credit line depending on risk parameters.
Step 3: Withdraw Funds Instantly
Once the credit line is active, you can draw funds at any time—without reapplying or waiting.
On platforms like Clapp, this process is designed as a continuous system:
Repaid amounts restore available credit immediately
This is what makes the experience instant. The loan is effectively pre-approved at all times.
Continuous Liquidity Instead of One-Time Borrowing
The impact of this structure becomes clear once it is used. A user depositing BTC worth $20,000 may receive a credit line of $6,000. Instead of withdrawing the full amount, they can draw only what is needed—say $1,000—while the rest remains untouched and free of cost.
If part of the borrowed amount is repaid, the available limit increases again. No reapplication is required. The cycle continues as long as the collateral remains in place.
Risks That Come With Speed
Instant borrowing simplifies access, but it does not reduce risk. It shifts responsibility to the user.
Loan-to-value remains the central factor. Higher LTV increases exposure to liquidation if the market drops, while lower LTV provides a buffer.
Market volatility also plays a direct role. Crypto prices can move sharply, affecting collateral value and borrowing capacity in real time.
Cost structure is another variable. Some platforms still apply interest to the full loan amount or rely on tiered systems. In a credit line model, efficiency comes from paying only for what is used and avoiding costs on idle capital.
Where Instant Crypto Loans Fit
This model is increasingly used for:
Liquidity without selling — access cash while keeping BTC exposure
Trading strategies — deploy capital quickly without exiting positions
Short-term cash needs — avoid liquidation of long-term holdings
Portfolio optimization — use idle assets as collateral
It aligns with how crypto portfolios are managed today: dynamically, across multiple use cases.
The Bottom Line
Borrowing against crypto instantly is not just about faster loans. It reflects a structural shift from fixed borrowing to continuous access to liquidity.
The key components are:
Collateral-backed credit limits
No approval delays
Pay-as-you-use interest
24/7 withdrawals
Clapp exemplifies this model through its credit line structure, where liquidity is always available, and borrowing becomes an ongoing capability rather than a one-time event.
For users, the decision is less about speed and more about structure. Instant access is only valuable if it remains efficient, predictable, and under your control.
The altcoin market is once again making headlines, with analysts split between collapse and comeback narratives. According to Michaël van de Poppe, the current shakeout is not only expected, but it’s also necessary.
“I think that it’s fully deserved that 99% of the altcoins are going to zero,” he said, drawing parallels to the Dot-com bubble, where most projects failed but laid the foundation for stronger innovation later.
Despite the harsh outlook, he remains highly positive: “There’s not been a moment… where I’ve been so bullish about the future of crypto.”
“99% Will Die — But That’s the Point.”
He says altcoins are quietly gaining strength, with “great momentum” lately as macro stays supportive, low VIX, strong equities, and Bitcoin holding up. He points to Arbitrum as a buy-the-dip setup, eyeing $0.16 if it pulls back. Overall, he compares this phase to early 2020, with signs like rising volume, bullish divergence, and key levels being reclaimed, usually a setup before a bigger rally.
His Altcoin Take
Bitcoin: expects more upside, eyeing new highs near $77K
Ethereum: still in a bull trend, “buy the dip” unless it loses key levels
Aave / DeFi: short-term pain from the KelpDAO hack, but stronger long-term
Overall, he is not bullish on all alts, just the strong ones like BTC, ETH, and major DeFi players.
Base Formation Before the Next Move
According to him, markets are currently in a base-building phase following the Q4 2025 capitulation. This phase typically lasts 2–4 months before a breakout. He also noted that Bitcoin itself has been building a base for about 2.5 months, suggesting the market may be nearing a transition point.
Historically, once breakouts begin, altcoins can deliver sharp moves, often ranging between 150% and 400% from their lows.
Good time to buy altcoins?
Not all analysts agree on jumping in now. Our Crypto Talk argues it’s still too early, saying “the simple answer is NO” when asked if it’s time to buy altcoins. Their framework is clear: a true altseason only begins when price moves above the 20 SMA and the 20 SMA crosses above the 50 SMA.
Right now, both conditions are missing, with Bitcoin still below key averages and dominance sitting around 57%. In their view, this is a “red zone” where markets tend to bleed rather than rally, meaning patience and waiting for structure confirmation is key.
Meanwhile, analyst Ted Pillows warns that rising Bitcoin dominance is “not a good sign for alts.”
For now, the market sits in a split phase, where weak projects continue fading, but stronger altcoins may be quietly preparing for the next big move.
BNB price has once again entered a “boring zone”- a phase where price slows down and momentum fades, but this is exactly where its biggest rallies have started in the past. Currently trading near the $630 level, BNB is moving sideways after a correction, showing stability rather than weakness. At the same time, supply is tightening following a $1 billion token burn, while on-chain data points to continued accumulation.
In previous cycles, similar phases have preceded sharp upside expansions, making the current setup critical. The key question now is whether this quiet consolidation is once again setting the stage for a breakout toward $900, or if BNB price will remain stuck in this range.
Analyst Insight: Why This ‘Boring Zone’ Matters for BNB
A recent analysis from crypto analyst highlights a pattern that many traders often overlook. In the previous cycle, BNB price moved sideways for a long period before suddenly rallying over 1,444%, a move that began when market interest was still low.
The idea is simple. During these quiet phases, price does not move much, which makes it look weak. But in reality, this is where buying happens slowly in the background, while sellers get exhausted. Analyst shows a similar structure forming again. BNB is currently trading in a tight range around $600–$650, holding support and showing no major breakdown despite low momentum.
This type of setup usually means the market is building a base, not topping out. Once enough supply is absorbed, price tends to move sharply as demand returns. In that context, the current “boring zone” is not a sign of weakness, it may be the phase where BNB prepares for its next strong move, just like it did in the past cycle.
BNB Supply Dynamics Strengthen: Burn and Outflows Support the Base
BNB’s ability to hold firmly near the $600 support zone is being reinforced by underlying supply trends. The network recently completed its 35th quarterly burn, removing around 1.57 million BNB worth over $1 billion from circulation. This has reduced total supply to nearly 134.79 million BNB, continuing its long-term deflationary path toward 100 million tokens.
At the same time, on-chain data shows consistent negative spot netflows, meaning more BNB is being withdrawn from exchanges than deposited. This typically reflects investor accumulation, as assets are moved into holding rather than being prepared for selling.
Even during recent consolidation, outflows have remained steady, indicating that buyers are actively absorbing supply rather than exiting positions. Together, these dynamics, shrinking supply and reduced exchange liquidity, help explain why BNB continues to hold its base, while also supporting the case for a stronger move once demand returns.
Key Levels to Watch: Structure Holds, Breakout Zone Near
BNB price continues to trade within a tight $600–$650 consolidation range, holding firm above its key demand zone while volatility remains compressed. The price action suggests a base formation, where downside attempts are being absorbed and buyers are gradually stepping in.
On the upside, a move above $700 would signal early strength, while a confirmed breakout above $740 could accelerate momentum toward $850–$900. On the downside, the $600 level remains critical. A breakdown below this zone would weaken the structure and may push price back toward the $560–$520 range, delaying any bullish continuation.
With this setup, BNB price can remain range-bound in the near term, but a breakout above resistance is likely to trigger a stronger upside move if momentum follows through.
The Bank for International Settlements (BIS) has warned over the rapid growth of US dollar-backed stablecoins, raising concerns about liquidity stress and systemic risk. Stablecoins like USDT and USDC remain near $1, but their rapid growth and structural risks are driving policy concern.
This indicates rising pressure for stricter global regulation as stablecoins move closer to mainstream finance.
Stablecoins Growing Faster Than Regulation
Speaking in April 2026 in Tokyo, BIS General Manager Pablo Hernández de Cos said these digital tokens could have “material consequences” for financial stability if they grow large enough to compete with traditional money.
Stablecoins like USDT and USDC have become widely used for payments, trading, and cross-border transfers. Their appeal lies in speed and ease of use.
He noted that while stablecoins offer innovation, they still fall short as a true form of money. Instead, he said they behave more like financial products.
“In this respect, they currently operate more like exchange-traded funds than like money.”
This means their value can sometimes move away from $1, especially during market stress, raising concerns for users.
G20 central bankers are pushing for urgent regulatory action as they warn dollar-pegged stablecoins could destabilize emerging economies. These assets risk accelerating uncontrolled dollarization and providing new channels for criminal activity across global markets. pic.twitter.com/mYuuXZaBJM
One of the biggest warnings from BIS is about sudden withdrawals.
Stablecoin issuers hold reserves in short-term government bonds and bank deposits. If users rush to withdraw funds during a crisis, issuers may be forced to sell these assets quickly. This could create pressure across financial markets and even affect banks.
De Cos warned that such “runs” could spread risk across the system.
“Runs on stablecoins could trigger market stress,” he said, adding that proper safeguards are still missing.
Concerns Around Regulation and Illicit Use
Another major issue is regulation.
Because many stablecoins operate on public blockchains and use private wallets, a large part of activity happens outside traditional monitoring systems. This creates challenges for anti-money laundering controls.
The BIS is now urging stronger global coordination to manage these risks and prevent misuse.
Europe and Global Regulators Step In
Governments are already responding. In Europe, officials are pushing for tighter rules on non-euro stablecoins. The European Central Bank has also raised concerns about liquidity risks.
In the UK, lawmakers have questioned whether stablecoins could drain bank deposits or trigger bank-like crises.
Meanwhile, Switzerland has started testing regulated stablecoins within controlled environments.
What Happens Next?
The next phase will likely bring tighter control. De Cos suggested that risks could be reduced if stablecoin issuers had access to systems like deposit insurance or central bank support.
He also pointed out that limiting interest payments on stablecoins could reduce their appeal compared to bank deposits.
Most Bitcoin price predictions are just numbers. Scaramucci just made an argument.
In a tweet that is circulating widely, SkyBridge Capital founder Anthony Scaramucci laid out why he believes Bitcoin does not just compete with gold, but outclasses it.
“A dollar bill is made of linen and cotton. But we accept it because we trust it. Over 16 years Bitcoin has built its own trust system – decentralized, no central authority, no single point of failure,” Scaramucci wrote.
Goldman Sachs and Morgan Stanley Validate the Bitcoin Thesis
Scaramucci pointed to Morgan Stanley entering the Bitcoin market and Goldman Sachs filing for a Bitcoin ETF as evidence the thesis is playing out in real time in the product lineups of the two most powerful investment banks in the world.
These are firms that move slowly, carefully, and only when the institutional case is bulletproof. When they show up, the conversation changes.
Scaramucci says Bitcoin is now part of “the model portfolio for individuals and institutions worldwide.” A year ago that sentence would have raised eyebrows. Today it is just a description of what is happening.
Why $1 Million Bitcoin Produces a $21 Trillion Market Cap
There will only ever be 21 million Bitcoin. If each coin reaches $1 million, the total market cap hits $21 trillion – still below the estimated value of all gold ever mined, but in Scaramucci’s words, “faster to move and easier to store.”
Scaramucci pointed his followers to Niall Ferguson’s The Ascent of Money.
Ferguson’s book’s central argument is that money has never derived its value from the material it is made of. It derives value from trust – collective belief in a system. The Renaissance was funded by Italian bankers who invented credit. The French Revolution was triggered by a stock market bubble. Finance, Ferguson argues, is the backbone of every major event in human history.
Scaramucci’s point is that Bitcoin has spent 16 years building exactly what Ferguson describes – a trust system – and it did so without a central authority or a government guarantee.
“Every characteristic that has defined money throughout human history – Bitcoin checks every single box,” Scaramucci wrote. “That’s why I’m bullish.”
Scaramucci Has 70% of His Wealth in Bitcoin
Scaramucci is not a neutral observer here. SkyBridge Capital has previously set a $1 million Bitcoin target by 2032, tied to the 2028 halving cycle. He has disclosed that 70% of his personal wealth sits in Bitcoin and has been actively buying during the current drawdown.
Not everyone buys the argument. Economist Tony Annett has pushed back directly, arguing Bitcoin still fails the three classical tests for money – medium of exchange, unit of account, and reliable store of value.
But the combination of a serious monetary theory argument, two Wall Street giants moving into the space simultaneously, and a fixed supply of 21 million coins is exactly the kind of setup Scaramucci has been building his thesis around for years.
When will the price catch up – that’s something only the markets and time can answer.
Australian lawmakers passed the Corporations Amendment Bill, creating a new category of Public Digital Token Infrastructure (PDTI).
Now, any firm that offers Real World Assets (RWAs) in a decentralized manner (non-custodial, no user funds in control, no private keys to withhold), can operate without a settlement license.
And while firms will now scramble to hire the technical resources to go completely non-custodial, Redbelly is already facilitating.
Accelerating the AUD 24 Billion Additional Market Value
An estimate by the Reserve Bank of Australia (RBA) puts an annual AUD 24 billion in RWA market growth.
This is good news for the industry and the economy. However, this value injection comes at a cost. Firms seeking to offer tokenized assets must comply with regulations, requiring strict standards to adhere to.
The new amendment, however, gives corporations an easier path: no settlement licensing required, as long as the tokenized assets are in full control of users.
Easier Said than Done
A no-license path is a boon for the tokenization market. However, building a non-custodial system has its own baggage. The infrastructure cost, not to mention the resources required, can be not only expensive but also tough for firms that don’t have the tokenization experience.
More than that, there is a risk of future non-compliance. An update in the regulation may mean the onboarding service or the blockchain in question can suddenly be in breach of rules. The only way out of this would be to shift to another blockchain or exit the tokenization race.
Neither is viable. Redbelly ensures that this doesn’t happen, ever.
Compliance is in Redbelly’s DNA
Unlike traditional blockchains that often treat regulation as an afterthought, Redbelly was engineered with a compliance-first philosophy. It operates with the transparency and security of a decentralized, non-custodial network while maintaining the accountability required by institutional finance.
At its core, Redbelly solves the identity paradox of DeFi. While users maintain full control of their private keys and assets (satisfying the PDTI requirements), the network ensures that every participant is known. By integrating identity verification directly into the protocol layer, Redbelly allows issuers to enforce proper permissions and restricted access.
Two Sides of the Token: Averer and Tokenizer
To bridge the gap between complex legal frameworks and seamless blockchain execution, Redbelly utilizes two distinct, specialized roles: Averers and Tokenizers.
Averers are responsible for verifying the real-world identity and credentials of users off-chain and recording that information onto the blockchain. This creates a verifiable digital identity that follows the user across the ecosystem, ensuring that only eligible investors can interact with specific assets.
The Tokenizer role handles the technical minting and management of the RWAs. Because Redbelly’s infrastructure is built specifically for RWAs, the Tokenizer can define the legal and financial rules of an asset (such as dividend rights or transfer restrictions) directly within the smart contract.
Together, these roles ensure that every transaction is not just technically valid, but legally compliant from the moment of inception.
Stay Ahead with Redbelly
As the Australian market prepares for the projected surge in RWAs, the first-mover advantage will belong to those who can deploy quickly without cutting corners on compliance.
Redbelly is the perfect partner for this transition. Instead of spending months building proprietary non-custodial stacks or risking future regulatory breaches on anonymous public chains, firms can plug into a network designed specifically for the regulated economy.
With Redbelly, you aren’t just adopting a blockchain; you are adopting a future-proof legal framework.
XRP hasn’t had the smoothest run recently. The token is down around 22% year-to-date, hovering near the $1.40–$1.43 range after a prolonged downtrend. While the broader market has shown signs of recovery, XRP is still trying to break out of its consolidation phase. However, despite the downtrend, the Motley Fool, an American advisory firm, has highlighted XRP as a token worth watching over the next few years, even as its price remains under pressure in 2026.
That said, analysts say this slow movement could actually be a setup phase rather than weakness.
Reason 1: Regulatory Clarity Is Finally Here
One of the biggest overhangs on XRP is now gone. The long-running battle between the U.S. Securities and Exchange Commission and Ripple was settled in 2025, with appeals dismissed later that year.
This has substantially improved the regulatory outlook in the U.S.
According to the firm, this clarity could unlock institutional participation, especially if upcoming frameworks like the Digital Asset Market Clarity Act come into play. With fewer legal risks, institutions may feel more comfortable using XRP for cross-border payments, which could boost adoption heading into 2027.
Reason 2: Ripple Is Expanding Beyond Payments
The second big shift is Ripple’s strategy. Instead of focusing only on fast transactions, the company is now building a broader financial ecosystem.
This includes stablecoins, tokenized assets like U.S. Treasuries, and lending infrastructure, making XRP more relevant for real-world financial use. That kind of utility is what institutional players typically look for.
Institutional Demand Is Already Showing
Supporting this view, Crypto trader Vlad Anderson noted that XRP is already seeing early institutional inflows. Spot ETFs recently recorded around $17 million in a single day, with firms like Bitwise, Franklin Templeton, and 21Shares driving demand.
Price action remains steady, not explosive, something he sees as accumulation. If inflows continue, XRP could grind higher, though resistance around $1.9–$2.2 remains key.
For now, the case for XRP isn’t hype; it’s about slow, steady positioning for the next cycle.
Since the US–Iran conflict began, the overall market has been under pressure, and crypto has been hit the hardest. Now, a popular trader, Crypto Jack, is warning investors to sell bitcoin now.
Bitcoin is showing signs of weakness after failing to break above $75K. And crypto Jack believes Bitcoin could fall to $48K before recovering in May.
Here’s why he thinks a drop could happen soon.
Iran to Skip Peace Talks After U.S. Seizes Iranian Ship
One of the biggest concerns right now is rising tension between the US and Iran. Reports suggest Iran may skip the second round of peace talks scheduled for April 20 in Pakistan, even as US Vice President JD Vance is expected to lead the US delegation.
Tensions increased after the US seized an Iranian-flagged cargo ship in the Strait of Hormuz, which Iran called a “violation of the ceasefire” and has promised to respond to.
Iran said Tehran may not join the talks unless the US lifts its blockade.
Bank of Japan Dumped $2.86B Liquidity Shock
Beyond geopolitics, financial signals are also turning negative. Just before the US market opened, the Bank of Japan reportedly dumped $2.86 billion in US Treasuries, marking the largest liquidation in 30 years.
BREAKING
BANK OF JAPAN DUMPED $2.86B IN U.S. TREASURIES
THIS IS THE BIGGEST LIQUIDATION IN THE LAST 30 YEARS
THE LAST TIME THEY DUMPED U.S. TREASURIES, THE STOCK MARKET DUMPED 15%
The last time a similar move happened, the stock market dropped nearly 15%, raising fresh fears across global markets.
Massive $53M Bitcoin Short Adds Pressure
There are also signs that large players are reducing risk. Reports suggest that market insiders are offloading large risk positions across US assets, exiting almost everything except oil.
At the same time, a trader linked to Trump’s circle has reportedly opened a $53 million Bitcoin short at 30x leverage.
His record is said to be perfect with 10 wins out of 10 trades, but even a small 7% price move against him could wipe out the entire position.
Bitcoin: Key Levels to Watch
From a technical perspective, Crypto Jack believes Bitcoin still has room for a short-term move higher. The liquidation heatmap shows a possible push toward $79K–$80K, especially if buying momentum increases in the near term.
The only major factor that could turn the market bullish, even temporarily, is a US–Iran peace deal. If tensions ease, risk assets like Bitcoin could see a quick relief rally.
However, the overall trend remains cautious. If Bitcoin fails to hold the key $60K support, it could fall further toward the $46K–$52K range.
Thus, Jack now sees $48K–$50K as a strong re-entry zone.
Why May Could Be A Comeback Phase?
At the same time, Crypto Jack’s main reason for suggesting an exit now and a comeback in May is seasonal performance. Historically, May has delivered an average return of around 8%, with Bitcoin closing in green in 7 out of 13 years.
He also notes that the second quarter often sees strong momentum, with an average surge of around 58%, making it one of the most important periods in the crypto calendar after a typically weaker phase earlier in the year.
Hyperliquid (HYPE) is at a decisive inflection point after a sharp rejection from the $50 supply zone, and the next move could be extreme on either side. The token has already slipped nearly 5%, signaling early weakness, yet derivatives data still shows a long-heavy market, raising the risk of a squeeze in either direction. At the same time, liquidation clusters are building both above and below current price, setting up a high-volatility breakout scenario.
With structure tightening, HYPE now faces a critical question: Can bulls reclaim momentum and drive a move toward $60, or is a deeper breakdown toward $20 starting to take shape? Read the HYPE price outlook below for more clarity.
Derivatives Positioning: Crowded Longs Raise Risk
Derivatives data shows a long/short ratio of 1.60, with approximately 36,673 long traders vs 22,786 short traders. This indicates a clear bullish bias in positioning. However, such imbalances often create instability. When longs dominate, the market becomes vulnerable to liquidation cascades, especially if price fails to move higher.
Funding sentiment and positioning suggest that traders are already betting on continuation, which reduces upside surprise and increases the probability of a contrarian move or shakeout before any sustained rally.
Hyperliquid Price Analysis: What’s Next for HYPE?
HYPE’s recent price action shows a clear ascending structure, where higher lows continue to form despite repeated rejections from the $48–$50 supply zone. This indicates that buyers are still active, but lack the strength to break overhead resistance, a classic compression setup.
HYPE price is currently trading around the $40–$41 region, sitting right above a rising trendline support. This trendline has acted as a dynamic accumulation zone over the past few weeks, with buyers consistently stepping in on dips. However, the token price remains above the short-term EMAs (20/50), which are now flattening, signaling a transition from impulsive rally to consolidation. However, the 200 EMA still lies above near $48–$50, reinforcing the strength of the supply zone.
If bulls manage to reclaim this zone with volume confirmation, the structure opens up a clean breakout path toward $55–$60, aligning with previous distribution levels. On the downside, a breakdown below the ascending trendline and loss of $38–$35 support would invalidate the bullish structure, exposing a deeper retracement toward the $28–$20 demand zone, where previous accumulation occurred.
Liquidation Map: Volatility Trigger Zones Identified
Liquidation data provides a clearer view of where the next move could accelerate. On the downside, a significant cluster of leveraged positions is stacked below $38–$35, meaning a breakdown into this zone could trigger forced liquidations, accelerating selling pressure. This aligns with the structural breakdown level on the chart.
On the upside, liquidity is concentrated above $45 and extending toward $50, where short positions and trapped sellers may get liquidated if price breaks out. This creates a liquidity magnet effect, pulling price toward that zone in case of strength. Notably, the liquidation map shows a balanced distribution on both sides, confirming that the market is in a neutral but fragile state, typically seen before large directional moves.
This setup increases the probability of a liquidity sweep first, followed by the actual trend move, meaning traders should expect volatility spikes before confirmation.
Final Take: Market Nears a Decisive Move
HYPE is approaching a critical phase where the current consolidation is unlikely to sustain for long. The combination of tightening price structure, long-heavy positioning, and visible liquidity clusters suggests that a directional move is building.
A sustained push above the $48–$50 supply zone would confirm strength and open the path toward $55–$60, backed by momentum and short covering. On the other hand, a breakdown below $38–$35 support would weaken the structure and increase the probability of a deeper move toward $28–$20 demand levels. The next confirmed move will likely set the tone, not just for the short term, but for HYPE’s broader trend ahead.
US spot crypto ETFs recorded strong institutional inflows last week, with Bitcoin ETFs attracting $996.38 million, the highest since mid January and marking a third straight week of gains. Ethereum ETFs added $275.83 million, while Solana and XRP ETFs brought in $35.17 million and $55.39 million, respectively. BlackRock’s IBIT dominated Bitcoin flows with $906 million. The surge highlights sustained institutional demand across major digital assets as ETF adoption continues to strengthen market liquidity and investor participation.
Hyperliquid (HYPE) price came under pressure as the broader crypto market turned bearish, dragging the price down to a critical support zone just above $40. The level held—for now, triggering a short-term bounce and raising the possibility of a relief move toward $45. However, the bigger picture remains conflicted. While buyers are attempting to regain control, the underlying price structure still leans bullish, hinting that this pullback could be a consolidation phase rather than a full trend reversal.
The price is at a critical turning point after a sharp pullback dragged the price back toward the lower boundary of its rising channel. Despite the recent 6% drop, the broader structure remains intact, with the price continuing to respect a series of higher lows. However, weakening momentum and rising sell-side pressure suggest that bulls are losing short-term control, putting the $40–$41 zone into focus as a key defense level.
Hyperliquid (HYPE) is currently trading at a crucial support zone near $40–$41, a level that aligns with the lower boundary of its rising channel and has historically acted as a strong demand area. Holding above this zone is critical for maintaining the broader bullish structure, with an immediate upside target at $43, followed by a key resistance band between $49 and $50 where the price recently faced rejection.
On the downside, a confirmed breakdown below $40 could invalidate the short-term uptrend and expose the price to deeper support levels around $35–$36, with an extended correction potentially reaching the $33 region. With price compressed between support and resistance, HYPE is approaching a decisive move, making these levels essential for traders to watch in the coming sessions.
While the broader structure still leans bullish, fading momentum and rising sell pressure suggest caution. Hyperliquid (HYPE) price is approaching a make-or-break zone near $40, where the next move will likely define short-term direction.
Anthony Scaramucci and analyst Back expect Bitcoin to reach between $500,000 and $1 million this cycle. Scaramucci highlights Bitcoin’s fixed supply of 21 million coins, saying a $1 million price would align with gold’s market value. Back points to rising ETF inflows, corporate accumulation, and growing institutional participation as key drivers. Bitcoin currently trades near $74,500 after peaking above $126,000 last year, reflecting ongoing volatility but strong long-term conviction among investors.
Upbit, South Korea’s largest crypto exchange, has listed PIEVERSE trading pairs against KRW, BTC, and USDT. PIEVERSE is a Web3 payment infrastructure project built for an agent native economy where humans, AI agents, and machines can transact seamlessly. It focuses on automated, verifiable, and cross-chain payments with improved transparency and efficiency. The listing is expected to increase liquidity, adoption, and market visibility as demand grows for AI-driven payment systems in the evolving digital finance ecosystem.
KelpDAO suffered a $290M exploit on April 18, 2026, after attackers used a highly targeted cross-chain message spoofing attack. According to post-incident analysis, North Korea’s Lazarus Group is the likely source. The attackers compromised and poisoned RPC nodes used by LayerZero’s DVN system, then triggered a DDoS to force failover to malicious nodes, allowing fake cross-chain messages to pass validation. The root issue was KelpDAO’s 1/1 DVN setup, which had no redundancy or backup verifiers. Only rsETH was affected, with no protocol-wide contagion, and infrastructure has since been replaced and secured.
Binance listed RAVE. A few days ago, the token crashed 95%, wiping out billions in market cap, triggering manipulation allegations from ZachXBT and forcing exchange investigations. The same exchange has still not listed Pi Network, a project with 18 million KYC-verified users, a functioning mainnet, and institutional-grade identity infrastructure.
The contrast has not gone unnoticed, and the frustration across the Pi community is building.
What RAVE’s Collapse Reveals
RAVE hit an all-time high of $27.94 before collapsing to under $1.50 in less than 24 hours. ZachXBT alleged that insiders controlled over 90% of the token supply and were manipulating prices on centralised exchanges. Binance and Bitget both opened formal investigations. An estimated $43 million in leveraged positions were liquidated during the crash.
The token met Binance’s standard listing requirements. It passed the process. It got listed. It collapsed. Pi Network, by contrast, has been waiting through community votes, public speculation, and months of market anticipation without a confirmed listing on any tier-one exchange.
The answer, according to Dao World, is more complicated than most people assume. Binance likely did want to list Pi at some point. The exchange hosted a community vote and built public hype around the possibility, something it rarely does without genuine intent behind the scenes.
“Binance has listed plenty of questionable coins,” he noted. “If they didn’t want Pi, they could have simply rejected it.”
More than 20 exchanges, including HTX, initially planned to list Pi for spot trading. Most never followed through. The reason, according to the analysis, is that the Pi Core Team introduced strict KYB (Know Your Business) requirements that exchanges must meet before being granted listing rights. Many simply did not qualify.
“In Pi’s case, the key decision about whether it gets listed still ultimately lies with the core team,” the analyst said.
A Flipped Model
This inverts the standard crypto listing dynamic entirely. Usually, exchanges decide what gets listed. With Pi, the project itself appears to be controlling who gets access, a position of unusual leverage for any token that has not yet secured a major exchange presence.
That selectivity could be interpreted as confidence in the project’s long-term value and a refusal to compromise on compliance standards. It could also be read as the reason Pi’s price has remained suppressed while projects with far weaker fundamentals and far more concentrated supply get listed, pump and crash within days.
RAVE token collapsed by about 95% after allegations of market manipulation rattled traders. Launched in December 2025, RAVE spiked from under $1 to nearly $28 within 10 days before tumbling to around $0.70 by April 20. Crypto analyst ZachXBT reported that nine addresses linked to the project held most of the supply and moved funds to major exchanges, wiping out billions in value. Several exchanges said they would investigate the activity, while the RaveDAO team denied any misconduct. Traders reacted with frustration as billions in value evaporated.
Polymarket is in talks to raise 400 million dollars in fresh funding, which could value the company at about 15 billion dollars, up sharply from its 9 billion dollar valuation in late 2025 following Intercontinental Exchange’s investment. The platform has experienced rapid growth, with March trading volume surpassing 10.5 billion dollars and daily revenue close to 1 million dollars, attracting investors who believe its decentralized structure and post-election momentum give it strong long-term potential despite competition from Kalshi.
A major exploit at KelpDAO has rattled the DeFi market, with losses estimated at nearly $293 million, making it one of the year’s biggest incidents. The issue was first flagged after “suspicious cross-chain activity involving rsETH,” prompting the team to pause contracts across the Ethereum mainnet and multiple Layer 2 networks.
The protocol, which allows users to restake assets like stETH or cbETH in exchange for rsETH, quickly became the center of a broader ecosystem concern as multiple platforms were exposed.
Analyst Breaks Down What Went Wrong
OneKey founder Yishi explained what went wrong. “KelpDAO dismantled the lock on its own door, LayerZero is selling the kind of door where you can pick the lock yourself, and Aave assumed the neighbor’s door was definitely locked tight.”
His roadmap for recovery starts with negotiation.
“The best outcome is to negotiate with the hacker, offer a 10–15% bounty, get the bulk of it back,” he said.
If that fails, he believes LayerZero should step in financially, noting it has “the deepest pockets and the most long-term skin in the game.”
He also labeled KelpDAO as the weakest link, suggesting compensation through tokens, future revenue, or even selling the project entirely.
Systemic Risk and What Comes Next
The biggest risk now lies with WETH. Yishi warned, “WETH depositors absolutely cannot take a haircut,” as any loss could trigger cascading effects across protocols like Morpho, Spark, Fluid, and Euler, potentially damaging the entire LRT sector.
Despite the scale of the incident, he remains confident in Aave’s resilience, pointing to safeguards like Umbrella and stkAAVE. “I believe Aave can weather this,” he said, even as markets continue pricing in the fallout.
Immediate Response Across Protocols
Following the incident, Aave confirmed that rsETH remains fully backed on Ethereum but moved swiftly to freeze its usage across V3 and V4 markets. WETH reserves were also frozen across networks including Arbitrum, Base, Mantle, and Linea as a precaution.
“KelpDAO is the broke one here—either make it up with tokens + future revenue, or just package the whole project and sell it off to L0 or BMNR.”
KelpDAO stated it is actively working with LayerZero, auditors, and security experts to investigate the root cause, while urging users to rely only on official updates.
HBAR price prediction for 2026 suggests potential highs of $1.05
Long term forecasts indicate HBAR could reach $2.20 by 2030.
Hedera has been making waves in the cryptocurrency space, with a fast and secure blockchain that offers a distinct approach to transaction processing compared to Ethereum and other smart contract chains. It’s permission-only, meaning the blockchain is managed by private companies. Limiting what types of decentralised applications are allowed is what makes Hedera stand out from the rest.
Having entered the top 20 digital assets by market cap in 2024, it is now eyeing a potential leap into the top 10 by the end of 2025. Hedera has also recently ramped up its development activities for its ecosystem. Its ecosystem is strengthening, despite its capped price action. With increasing real-world use cases, institutional interest, and strategic partnerships, many are closely tracking HBAR price chart 2025 to gauge how high the token can rise.
With major companies like Google, IBM, and Chainlink Labs backing the project, and discussions about SEC approved HBAR ETF would flood string liquidity. Many are intrigued that: Will the HBAR Price Reach $1? Let’s discuss this in our Hedera price prediction 2025 article.
As April progresses, HBAR’s price action reflects a market that has been stabilizing after a prolonged corrective phase, with price now holding around the $0.085–$0.09 support zone. Following months of downward pressure and consistent lower highs, the token is beginning to show early signs of base formation, indicating that selling momentum is gradually weakening.
HBAR is currently trading within a tight consolidation range, with price compressing just below short-term resistance while holding firm above key support. This narrowing range suggests that the market is preparing for a directional move, as volatility declines and participation begins to build.
The immediate focus now shifts to the $0.10–$0.11 region. A sustained move above this resistance band would signal a breakout from the current consolidation structure, opening the path toward the $0.13–$0.15 range, where previous supply zones may come into play. If momentum strengthens alongside broader market support, the move could extend further toward $0.18.
However, the structure still requires confirmation. If HBAR fails to reclaim resistance and faces rejection, the price may continue to consolidate within the current range. A breakdown below the $0.085 support could weaken the setup, potentially pushing the asset toward lower levels near $0.075 and delaying recovery.
In this context, HBAR in April may reach the $0.13–$0.15 range if a breakout sustains, while failure to build strength above resistance could keep the price range-bound as the market continues to form a base.
Recent Catalysts For HBAR
Strengthening enterprise narrative, with continued traction from global corporations and governing council expansion, reinforcing Hedera’s long-term institutional positioning.
Rising trading volume and steady price stability near key support suggest early accumulation, indicating that smart money may be positioning ahead of a potential move.
Improving broader market sentiment and capital rotation toward utility-driven altcoins are creating a supportive backdrop for HBAR’s recovery phase.
Coinpedia’s Hedera (HBAR) Price Prediction 2026
Heading deeper into 2026, Hedera is likely to move through a recovery cycle rather than an immediate breakout phase. The current structure suggests that the market is gradually shifting from accumulation toward early expansion.
The first important level to watch is the $0.20–$0.25 range, which previously acted as a major resistance zone. Reclaiming this level would signal that HBAR has moved beyond its base formation and entered a recovery phase. Once this level is secured, the price could move toward $0.40–$0.50, where stronger selling pressure may appear. This zone will act as a key test of whether the recovery has enough strength to continue.
If the broader market enters a bullish phase and enterprise adoption within the Hedera ecosystem continues to expand, HBAR could gradually build momentum. In a favorable scenario, HBAR could reach around $0.65 by 2026, reflecting a structured recovery rather than a sharp rally.
The long-term projection assumes Hedera sustains relevance in enterprise blockchain use cases, with growth moderating over time as the asset matures.
HBAR Price Prediction 2026 – 2030
Year
Potential Low ($)
Potential Average ($
Potential High ($)
2026
0.45
0.80
1.05
2027
0.65
1.00
1.20
2028
0.80
1.10
1.60
2029
0.90
1.60
2.20
2030
1.40
2.20
3.00
HBAR Price Prediction 2026
Moving forward to 2026, forecast prices and technical analysis project that Hedera’s price is expected to reach a minimum of $0.45. The price could escalate to $1.05 on the higher end, with an average trading price hovering around $0.80.
HBAR Price Forecast 2027
Looking ahead to 2027, the optimism around Hedera will lead to steady growth. Hence, the HBAR price is forecasted to reach a low of $0.65, with a potential high touching $1.20 and an average forecast price of $1.00.
Hedera Price Forecast 2028
As we advance to 2028, with moderate gains, the HBAR predictions indicate that the price of a single HBAR could reach a minimum of $0.80, with the ceiling potentially rising to $1.60. Within the range, the average price will be $1.10.
HBAR Price Target 2029
By the time 2029 rolls around, it’s predicted that Hedera’s price will maintain its upward trajectory, reaching a minimum of $0.90, with the maximum price possibly reaching $2.20 and an average of $1.60, reflecting cautious optimism.
Hedera Price Prediction 2030
By the end of this decade, HBAR is predicted to touch its lowest price at $1.40, aiming for a high of $3.00 and an average price of $2.20. Hence, the prediction suggests stable long-term growth for Hedera’s market value.
David Schwartz, CTO Emeritus at Ripple, had a pointed observation this week after the Kelp DAO rsETH bridge was exploited for approximately $292 million.
He had seen this coming. Not this specific attack, but the conditions that made it possible.
“I evaluated a lot of DeFi bridging systems for use by RLUSD,” Schwartz wrote on X. “I was almost exclusively focused on the security and risk aspect. One thing I noticed is that most schemes were very well designed and had really strong mechanisms available to protect against exactly the type of attack the KelpDAO situation seems to have been caused by.”
The Sales Pitch That Buried the Security Features
What Schwartz described is a pattern he encountered repeatedly during his evaluation process. Bridge providers would pitch their most advanced security features prominently, then almost immediately suggest that those features were optional and that most customers chose not to use them.
“They generally in effect recommended not bothering to use the most important security mechanisms because they have convenience and operational complexity costs,” he wrote. “We were frequently pitched the simplicity and ease of adding more chains with the implicit assumption we wouldn’t bother using the best security features they had.”
“Their sales pitch was that they have the best security features but they’re easy to use and scale, assuming you don’t use the security features,” he said.
What Actually Happened to Kelp DAO
On April 19, Kelp DAO identified suspicious cross-chain activity involving rsETH and paused contracts across mainnet and multiple Layer 2 networks. Approximately 116,500 rsETH was drained through LayerZero-related contract calls, worth around $292 million at current prices.
On-chain analysis from D2 Finance traced the root cause to a private key leak on the source chain, creating a trust issue with OApp nodes that the attacker exploited to manipulate the bridge.
Schwartz offered his own hypothesis about what likely went wrong at the protocol level. “I have a funny feeling part of the problem is going to be something like KelpDAO choosing not to use key LayerZero security features out of convenience,” he wrote.
LayerZero itself offers robust security mechanisms including decentralised verification networks. The question investigators are now examining is whether Kelp DAO configured its implementation using a minimal security setup, specifically a single point of failure with LayerZero Labs as the sole verifier, rather than the more complex but significantly more secure options available.
A memecoin called ASTEROID surged more than 68,000% in a week, crossing a $100 million market cap and generating over $100 million in 24-hour trading volume, driven by one of the most emotionally charged stories the crypto market has seen in years.
The token is not based on a dog or a cartoon. It is based on a Shiba Inu plush toy designed by Liv Perrotto, a 15-year-old who died after battling cancer. Her design flew as a zero-gravity indicator on a space mission. Before she passed, she had one request for Elon Musk.
“Can you make Asteroid the mascot for SpaceX?”
How Two Words From Musk Moved the Market
The story resurfaced online earlier this week and spread rapidly across social media. When it reached Musk, he replied publicly: “Will answer shortly.”
That single response was enough. ASTEROID’s market cap jumped from approximately $50,000 to over $20 million within hours as traders rushed to position themselves ahead of whatever came next.
Musk then followed up with a single word: “Ok.”
The confirmation sent the token parabolic. Traders interpreted the response as Musk agreeing to the mascot request, and the narrative had enough emotional weight to sustain buying pressure far beyond what most meme tokens ever see.
Another held through 580 days of near-zero value and saw $21K turn into ~$392K
Some traders even turned a few hundred dollars into $1M+ in days
What the Numbers Show
The scale of the move is difficult to contextualise within normal crypto market activity:
68,000% gain in a single week according to CoinGecko data
Market cap climbed from $50,000 to over $100 million at peak
$100 million in 24-hour trading volume at the height of activity
The move created significant returns for early holders and significant losses for those who entered near the top
The Broader Context
ASTEROID sits at the intersection of grief, internet culture, and financial speculation, a combination that has proven repeatedly capable of generating extreme short-term market movements regardless of underlying fundamentals.
The token has no formal connection to SpaceX, no confirmed endorsement beyond two informal social media replies and no guarantee that Musk’s response translates into any official action.
What it does have is a story that resonated widely and a market that priced that resonance in real time. Whether the price holds, fades, or collapses entirely now depends entirely on what happens next in a narrative that nobody fully controls.
XRP slipped below $1.46 over the weekend, a level that analysts had flagged as the most critical line for the token heading into the final stretch of April. The move was not entirely unexpected on the charts, but the catalyst that pushed it through was geopolitical rather than technical.
The important support to watch now is $1.41. As long as XRP holds that level, the analyst believes a broader bullish structure remains intact. Below that, $1.37 represents the 30-day rolling VWAP, a level that could come into play if genuinely bad news hits. A move all the way back to $1.31 is considered unlikely under current conditions.
To the upside, reclaiming $1.46 is the prerequisite for any meaningful rally. A clean break above that level would open the path toward $1.55 to $1.57.
The Short-Term Expectation
The honest near-term outlook is one of range-bound consolidation. The analyst described the most likely scenario as XRP drifting lower within the $1.35 to $1.46 range, finding support somewhere in that band, stabilising and then potentially mounting another attempt at the upper boundary.
A breakout above $1.46 remains possible but would require a continuation of the bullish fundamentals seen last week, including strong XRP ETF inflows and improving sentiment. Negative Bitcoin funding rates and the current uncertainty environment make that combination less likely in the immediate term.
What Is Working in XRP’s Favour
Despite the short-term weakness, several factors are pointing in the right direction. XRP ETF flows came in strongly last week. The XRP to Bitcoin ratio appears to have bottomed, which the analyst described as a meaningful signal for the token’s relative strength going into May.
The fundamentals, he said, are uncertain rather than negative. That distinction matters. Uncertain conditions can resolve either way. The bias for later in April and into May remains cautiously bullish if the macro environment cooperates.
CoinDesk recently reported that XRP is getting a fresh payments narrative after Rakuten integrated the token for transactions in Japan, adding real-world utility to a market that has been watching for the next leg of adoption. The same report also pointed to institutional flows and whale buying helping the move, while CoinDesk noted a separate XRP Ledger upgrade aimed at privacy for larger users.
That is why the current XRP road to $10 debate is getting louder again. XRP is trading near $1.42, down 0.97% over the last 24 hours but still up 7.10% on the week, which suggests buyers have not fully stepped away. For investors searching XRP road to $10, XRP price prediction, and the best crypto payments token, the market backdrop is now raising two questions at once: can XRP keep maturing from here, and where does the earlier upside sit if the next payments winner is still being built? That is where Remittix starts to enter the conversation.
XRP Price To $10: Why The Market Still Respects It
XRP remains one of the few large-cap crypto assets with enough history, liquidity, and brand recognition to be taken seriously by institutions and retail traders alike. At a $1.42 handle and a #4 market cap rank, it is no longer the kind of asset that can double simply on narrative alone.
That does not mean the upside story is over. The tight 24-hour range between $1.42 and $1.44 shows sellers are testing support rather than breaking trend, and the weekly gain keeps the broader structure constructive. For anyone still tracking XRP road to $10, XRP price prediction, and the best crypto payments token, the key point is simple: XRP can continue benefiting from adoption, but its size means the move from “credible” to “explosive” gets harder.
How Remittix Fits The Payments Conversation
Remittix is attracting attention because it is aimed at the kind of payments use case investors understand immediately. Users send crypto and the recipient receives fiat in a bank account, with real-time conversion and local payment networks handling the transfer.
That matters because it speaks directly to what the market is rewarding in payments-focused assets: utility, speed, and a clear reason to exist. Compared with XRP, which is already established and tends to move with more measured upside, Remittix is still earlier in its lifecycle and may offer more room for growth if execution stays on track.
Remittix is also building credibility in ways that matter to serious buyers. The project says it has raised more than $30 million in presale, has a wallet live on the Apple App Store, and is backed by a CertiK audit. Add a KYC-verified team and more than 35,000 holders, and the case becomes less about speculation and more about whether the market is still early enough.
Why Investors Keep Comparing XRP And Remittix
XRP is the proven asset in the room: liquid, recognized, and already tied to a major market narrative. Remittix is the younger contender: smaller, more focused on direct payments utility, and potentially better positioned if investors keep rotating toward names with more room to run.
That is the real tradeoff. XRP can still grind higher if adoption and institutional interest continue, but the move may be steadier than dramatic. Remittix is earlier and therefore riskier, but that also gives it the kind of upside profile established assets rarely have.
Conclusion
XRP still has a legitimate case as the safer, more proven payments asset, especially with recent adoption headlines and a constructive weekly trend. But for investors looking at XRP price prediction, and the best crypto payments token, the bigger asymmetry may be in Remittix, where the market is still pricing in early execution rather than full-scale success.
In other words, XRP looks like the established name that can keep grinding, while Remittix is the earlier bet with higher upside if adoption continues. The opportunity is tied to execution, and in a market that often rewards early positioning, waiting for full confirmation can mean missing the better entry.
Recent payments adoption headlines, institutional flow chatter, and steady weekly momentum are keeping the XRP road to $10 discussion alive.
Is XRP still a good long-term payment asset?
XRP remains a credible, established asset with real market presence, but its size makes outsized upside harder to capture than in earlier-stage projects.
Why are investors comparing XRP and Remittix?
Both sit in the payments category, but XRP is established while Remittix offers an earlier-stage setup with more room for asymmetric growth.
What makes Remittix different?
Remittix is built around crypto-to-fiat transfers, where users send crypto and the recipient gets fiat in a bank account through real-time conversion and local payment networks.
Ethereum is holding its ground even as the market tests whether its latest momentum can turn into a real breakout. CoinDesk recently highlighted that Ether has started to outperform Bitcoin while ETF flows and a sharp jump in on-chain activity moved in the same direction, and that combination is exactly why traders are watching ETH so closely right now.
With the broader crypto market still sorting out where risk appetite should flow next, Ethereum looks constructive, but not yet explosive. That tension is what keeps the debate alive around whether the biggest upside now sits in established names or newer opportunities.
That is also why Remittix is drawing attention. It is still early in its story, but early-stage assets often attract speculative capital when large caps start to look capped by size and structure.
Ethereum Price Today and Market Position
Ethereum is currently trading at $2,329.83, down 1.18% over the past 24 hours, but still up 5.85% over the past week. The intraday range of $2,305.27 to $2,370.27 shows that ETH is moving in a relatively controlled band rather than in a panic-driven selloff.
That matters because it suggests the market is not abandoning Ethereum; instead, it is pausing after a constructive weekly move. As the #2 asset by market cap, ETH still benefits from institutional credibility, ETF attention, and deep liquidity. The tradeoff is that it usually needs a meaningful catalyst to deliver outsized gains from here.
Ethereum Price Prediction (Short-Term)
In the short term, Ethereum looks positioned for a cautious bullish-to-range-bound move. If buyers can hold above the $2,300 area, ETH could trade back toward the $2,370 resistance zone and then attempt a push into roughly $2,400 to $2,480.
If the recent ETF and network-activity strength continues, a breakout above that zone could open the door toward $2,550. But the market is not fully convinced yet, so the more realistic near-term expectation is continued rotation between support and resistance rather than a straight-line rally.
The key level to watch is $2,300. A clean hold there would keep the bullish structure intact. A break below it would likely slow momentum and invite a deeper retracement toward the low $2,200s.
Asteroid Shiba Gains Attention After Musk’s SpaceX Nod
Asteroid Shiba has quickly become one of the most talked-about meme coins after Elon Musk responded to a viral post suggesting the Shiba Inu-themed “Asteroid” be made SpaceX’s mascot, reportedly replying “Ok” and fueling massive speculation.
The token, inspired by a real zero-gravity Shiba plush flown on a SpaceX mission, surged dramatically following the news, with its market cap jumping into the hundreds of millions as traders rushed in on the narrative.
Why Remittix May Offer Greater Upside
This is where Remittix becomes interesting. Ethereum may be the more established asset, but established names often face a ceiling on percentage gains because of their size. Remittix, by contrast, is earlier in its lifecycle, so meaningful adoption, exchange visibility, or a stronger narrative can have a much larger price impact.
Remittix is built around a simple use case: sending crypto that arrives as fiat in a bank account, with real-time conversion and local payment networks helping move value across borders more directly. That makes the project easier to understand in practical terms, especially for users who care more about payment speed and simplicity than crypto-native mechanics.
That does not make Remittix safer. It makes it more asymmetric. Investors looking for the next meaningful upside leg often have to choose between the relative stability of a major-cap leader and the possibility of stronger percentage gains from a newer name. Right now, Ethereum looks like the steadier setup, but Remittix is the one that could potentially outperform if momentum shifts toward early-stage speculation.
Conclusion
Ethereum’s current setup is constructive, but measured. The recent weekly strength, improved ETF backdrop, and rising network activity all support a bullish bias, yet the near-term market still looks more like consolidation than breakout. A move toward $2,400 to $2,550 is possible if support holds and buyers regain control, while a stronger medium-term advance could target $2,700 or even $3,000 if the trend continues.
Still, for traders focused on upside rather than just stability, Remittix may offer the more compelling opportunity. Ethereum can continue to grind higher, but Remittix has the kind of early-stage profile that can reprice faster if the market starts rewarding practical crypto use cases and lower-friction cross-border payments.
Ethereum looks mildly bullish in the short term, with a realistic range near $2,300 to $2,480 if support holds.
What is the main resistance level for ETH right now?
The immediate resistance zone sits around $2,370, followed by a broader breakout area near $2,400 to $2,480.
Can Ethereum reach $3,000?
Yes, but that would likely require sustained ETF inflows, stronger network activity, and a healthier risk-on crypto environment.
Why is Remittix being mentioned alongside Ethereum?
Because Ethereum is a large-cap asset with more limited percentage upside, while Remittix is an earlier-stage opportunity that may offer greater speculative return potential.
Is Ethereum still a good investment?
It can be, especially for investors seeking a more established asset with strong fundamentals. But for higher upside, some traders may prefer earlier-stage names like Remittix.
Bitcoin price faced a rejection near the crucial resistance, plunging by 2.62% to reach close to $75,000. The rally seems to be driven by geopolitical news, as the recent gains have completely faded. The IRGC fully blocked the Strait of Hormuz again, which has intensified the selling pressure on the token.
After another rejection near the $75K–$78K zone, price action is starting to show signs of exhaustion, not continuation. What makes this setup more concerning is what’s happening beneath the surface. Profit-taking is rising, positioning remains fragile, and the structure continues to print lower highs. This is not a confirmed breakdown yet—but it is no longer a healthy uptrend either.
The current setup increasingly resembles early-stage distribution, where upside attempts weaken, and downside risk quietly builds.
Profit-Taking Rises as Short-Term Holders Turn Active
Short-Term Holder SOPR is now consistently hovering around and above the 1 mark, signaling that recent buyers are actively realizing profits. When SOPR stays above 1, it typically reflects selling into strength rather than holding for higher prices, a behavior often seen during early distribution phases.
However, the data also shows that SOPR is not breaking down below 1 in a sustained way, meaning the market hasn’t entered capitulation yet. Instead, this points to a more controlled environment where participants are gradually offloading positions without panic. In other words, selling pressure is building, but not at a level that confirms a full trend reversal just yet.
Market Remains Indecisive as Long/Short Positioning Stays Mixed
The BTC long/short ratio reflects a market that lacks clear directional conviction. Buy and sell pressure continues to alternate, with no sustained dominance from either side. This kind of imbalance typically signals indecision rather than trend strength, especially when it appears near key resistance levels.
However, occasional spikes in long positioning suggest that traders are still attempting to bet on upside continuation. The problem is timing. When long exposure builds without a confirmed breakout, it often creates a vulnerable setup where even a small downside move can trigger liquidations. For now, the data doesn’t show extreme crowding, but it does highlight a market that is fragile, reactive, and prone to sudden volatility rather than stable continuation.
BTC Faces Rejection as Downtrend Structure Holds
Bitcoin’s price action continues to respect a clear descending trendline, with the latest move once again rejecting near the $75K–$78K resistance zone. This marks another lower high, reinforcing the broader downtrend that has been in place since the previous peak.
While the recent bounce from the $60K–$65K region shows buyers are still active at lower levels, the inability to break above resistance keeps the structure weak. As long as Bitcoin price remains below this trendline, the path of least resistance leans downward.
From here, the key level to watch sits near the $70K zone. A sustained move below this area could expose BTC to a deeper correction toward the $60K–$55K range. On the upside, bulls need a decisive breakout above $78K to invalidate the current structure and shift momentum back in their favor.
What’s Next for the BTC Price Rally?
The Bitcoin price is not breaking down yet, but the structure is no longer supportive of upside continuation. With repeated rejections at resistance, rising profit-taking, and fragile positioning, the market is starting to tilt toward a liquidity-driven move rather than a sustained rally. This is the kind of setup where late longs get trapped, and volatility expands quickly.
Unless the BTC price reclaims the $78K zone with strong confirmation, the current structure favors a move lower, with $70K acting as the first key test. A breakdown below this level could accelerate downside toward the $60K–$55K region.
LINK price prediction for 2026 suggests potential highs of $65
Long-term forecasts indicate LINK could reach $200 by 2030.
Chainlink (LINK), the leading decentralized oracle network, is entering a phase where expanding fundamentals are beginning to align with a developing technical structure. As adoption accelerates across real-world asset (RWA) tokenization, cross-chain interoperability, and institutional integrations, the network continues to strengthen its position as a core infrastructure layer within the blockchain ecosystem.
Despite this progress, LINK remains priced near the $9 level, significantly below its previous cycle highs, indicating that the market may still be in an accumulation phase. From a technical standpoint, price action is stabilizing above key support, while resistance near the $12–$15 range continues to cap upside momentum.
Looking ahead to 2026, the key consideration is whether Chainlink can translate its expanding utility into sustained demand, with a confirmed move above resistance likely to signal the beginning of a broader trend reversal. Here, we take a closer look at Chainlink’s price prediction for 2026 and beyond, assessing whether its growing role in blockchain infrastructure can drive a sustained breakout.
Chainlink’s short-term outlook for April 2026 reflects a consolidation phase, with price stabilizing around the $9 level while attempting to build a base above immediate support. Despite improving fundamentals, LINK continues to face resistance in the $10–$12 range, which remains a key zone for momentum confirmation.
The formation of higher lows suggests early signs of stabilization, although a sustained breakout has yet to materialize. A move above $12, supported by stronger participation and volume, could shift momentum toward the $14–$16 range, marking an early-stage trend reversal. On the downside, failure to reclaim resistance may keep LINK range-bound, with support expected near the $8 level.
Overall for April 2026, LINK is likely to trade within the $8 to $16 range, with breakout confirmation dependent on sustained strength above $12.
LINK Recent News and Catalysts
CCIP adoption is accelerating, with growing institutional integrations reinforcing Chainlink’s role in cross-chain and RWA infrastructure.
On-chain volume via CCIP is rising, signaling increasing real-world usage of Chainlink’s interoperability layer.
New data integrations across DeFi and exchanges are strengthening Chainlink’s position as a core on-chain data provider.
Coinpedia’s Chainlink Price Prediction 2026
Chainlink’s 2026 trajectory is increasingly tied to its ability to convert expanding network utility into sustained demand and capital inflows. LINK remains in a recovery phase, with price still trading below key macro resistance zones despite strengthening fundamentals. The network’s growing role in real-world asset (RWA) tokenization, cross-chain interoperability, and institutional integrations provides a strong foundation, but market confirmation remains dependent on price reclaiming higher levels.
In a bullish scenario, where adoption of Chainlink’s infrastructure, particularly CCIP and oracle services, continues to scale alongside broader market expansion, LINK could advance toward the $50 to $65 range, aligning with previous cycle valuations and renewed capital inflows.
A base-case outlook assumes gradual adoption growth without aggressive market expansion, positioning LINK within the $25 to $55 range over the course of the year. In a downside scenario, where market conditions weaken or adoption growth slows, LINK may remain range-bound below $35, extending its consolidation phase despite improving fundamentals.
Chainlink Crypto Price Prediction 2026– 2040
Year
Potential Low ($)
Potential Average ($
Potential High ($)
2026
35
50
65
2027
70
80
95
2028
75
85
120
2029
80
110
150
2030
120
170
200
2035
250
350
450
2040
400
520
650
Chainlink (LINK) Price Prediction 2026
As per Chainlink’s Price forecast for 2026, the high price could be $55, the low may reach $35. This makes the average around $50.
LINK Price Prediction 2027
Moving to 2027, the LINK Price projects that it might hit a high price of $95 potentially. With a $70 low and an average of $80
Chainlink Price Analysis 2028
Moving to 2028, the Chainlink Price Forecast predicts a high price of $104. On the flip side, the low may fall to $58, and the average is projected to be around $85.
Chainlink Price Forecast 2029
As per Chainlink Price Forecast 2029, LINK’s high price is predicted to be $150, with a low of $80 and an average of $110.
Chainlink Price Prediction 2030
Finally, as per the Chainlink Price Forecast 2030, LINK’s price can reach a high price of $200. With a low of $120 and an average of $170.
LINK/USD Price Prediction 205
As per Chainlink Price prediction 2035, LINK’s high price is predicted to be $450, with a low of $250 and an average of $350.
Chanlink (LINK) Price Targets 2040
Finally, as per the Chainlink Price Forecast 2040, LINK’s price can reach a high price of $650. With a low of $400 and an average of $520.
Chainlink (LINK) On-Chain Analysis
Chainlink’s on-chain metrics are increasingly pointing toward a tightening supply environment, supported by sustained exchange outflows and elevated whale activity.
Data on exchange reserves shows a persistent decline in LINK balances held across trading platforms, suggesting that tokens are being systematically moved into off-exchange storage. This trend is typically associated with reduced immediate sell-side liquidity and a shift toward longer-term holding behavior.
In parallel, whale outflows, particularly from major venues such as Binance, have intensified, with large transactions indicating active repositioning by high-value participants. These flows are generally interpreted as accumulation, especially when occurring alongside declining exchange reserves.
The interaction between these metrics highlights a contraction in available supply within the liquid market, while ownership appears to be consolidating among larger holders. Such conditions often precede periods of price expansion, provided that demand-side catalysts emerge.
Aave is dealing with the aftermath of a DeFi exploit, but the real damage came after. The event sparked a liquidation cascade that wiped out leveraged positions and pushed the price into a weak demand zone. Now, with support under pressure and traders reloading positions, the market looks far from stable. Is this where the AAVE price finds a floor—or is another move lower already in motion?
Exploit Triggered the Drop — Aave Moves to Contain Risk
The trigger came from an exploit tied to rsETH collateral (linked to KelpDAO), which exposed a structural weakness rather than a direct flaw in Aave itself. Attackers used rsETH within Aave’s lending markets to borrow large amounts of ETH, and when those positions turned unstable, it left the protocol with bad debt exposure. This wasn’t a smart contract hack on Aave — it was a case of collateral risk spilling into the lending layer.
The rsETH markets on Aave V3 and Aave V4 have been frozen. Aave's contracts have not been exploited and this is an exploit related to rsETH.
The freeze follows an exploit of the Kelp DAO rsETH bridge. Freezing the rsETH markets prevents new deposits and borrowing against rsETH…
Aave responded quickly to contain the damage. The protocol froze rsETH markets across Aave V3 (and related deployments, including upcoming V4 considerations) to prevent further borrowing and limit risk propagation. At the same time, liquidity stress intensified as users rushed to withdraw funds, pushing utilization rates higher and triggering forced liquidations. That combination — exploit-driven stress + defensive protocol action + user-driven exits — is what ultimately accelerated the downside move in AAVE.
Liquidations Accelerated the Downside
The exploit didn’t just trigger selling — it forced it. As liquidity tightened and prices started slipping, leveraged positions were pushed into liquidation. That created a cascade effect, where each forced exit added more pressure to the downside.
This type of move is typically fast and aggressive, and that’s exactly what played out. The sell-off wasn’t gradual — it was driven by forced unwinds rather than organic selling, which explains the sharp breakdown in price and the speed of the move.
AAVE at a Critical Level — Breakdown or Bounce Ahead?
AAVE is now testing a key demand zone near the $88–$92 range, a level that has already seen multiple reactions. Price also failed to reclaim the $95–$100 range, suggesting buyers are not in control yet. From here, the next move depends on how the price reacts at this level. A clean break below $88 could open the door toward the $85 region, with a deeper move toward $80 if selling pressure continues.
On the other hand, any recovery would first need a strong reclaim of $95, followed by acceptance above $100.
With the initial drop complete, the focus has now shifted to positioning. Open Interest (OI), which declined during the liquidation phase, has started to rise again, but the price has not shown a strong recovery. This matters. When OI builds while the price remains weak, it often signals new positions entering without clear directional control.
In many cases, this leans bearish, as markets tend to continue lower when fresh positions build into weakness. At the same time, it also increases the risk of sudden volatility if those positions get squeezed.
What Happens Next for the AAVE Price Rally?
The initial trigger is known. The liquidation phase has played out. Now, the AAVE price is entering a more uncertain phase where positioning and reaction at key levels will decide direction. Whether this turns into stabilization or another leg lower will depend on how the market responds here, but for now, the pressure hasn’t fully eased.
XRP is outperforming the market this week and has posted a 6 to 8% weekly gain, reclaiming the number four position by market cap ahead of BNB and Solana. What makes the XRP move interesting is not the size of it but the combination of factors arriving simultaneously.
What Is Actually Driving It
Three things are stacking at once.
First, ETF inflows. Spot XRP ETFs pulled in $13.74 million in a single day this week, with Bitwise contributing the largest share. Single-day inflows of that size suggest institutional positioning rather than retail enthusiasm.
Second, the CLARITY Act. The Senate Banking Committee is expected to move toward a markup this month, with a floor vote possible in May. XRP’s status as a digital commodity under existing guidance means it stands to benefit more directly than most assets from a finalised regulatory framework.
Third, fundamental expansion. Ripple’s 2026 focus appears to be cross-chain utility, making XRP functional across multiple networks, alongside expanding RLUSD across different blockchains. The Kyobo Life partnership in Korea, the Convera payments integration, and the Ripple Treasury launch all point to institutional infrastructure being built in real time.
The Technical Picture
XRP is trading above its 200-day EMA and pushing toward a key resistance zone at $1.44. The structure is constructive. Higher lows with repeated tests of the same resistance typically indicate pressure building toward a resolution in either direction.
A clean daily close above $1.44 with volume behind it opens the path toward $2.00 to $3.00, the next significant resistance cluster. That would represent a meaningful trend shift rather than a short-term bounce.
The Risk Worth Watching
Volume is the concern. The rally has been orderly but participation has not been overwhelming. Without an expansion in volume through the $1.44 level, the move risks another rejection and a return to the consolidation range.
Immediate support sits at $1.40. A break below that level likely means XRP slips back into the wider range and the breakout thesis resets.
A nearly $300 million exploit targeting Kelp DAO’s rsETH cross-chain bridge has triggered a mass withdrawal event at Aave, with over $5.4 billion in ETH leaving the protocol as users rushed to pull funds following concerns about bad debt accumulating on the platform.
The attacker deposited rsETH into Aave to drain ETH, leaving the protocol holding exposure it cannot easily unwind. The consequence was immediate. Aave’s ETH utilization rate climbed to 100%, meaning every available ETH in the lending pool is now borrowed and the protocol has no liquidity buffer remaining.
The Whale Exodus
The scale of the withdrawal was driven by large holders acting quickly. Justin Sun alone removed 65,584 ETH worth approximately $154 million from Aave in a single move, a transaction that on its own would have been headline news on any other day.
According to on-chain tracking by Lookonchain, the broader exodus of $5.4 billion reflects a wider panic among sophisticated users who understood what bad debt at Aave means for depositors unable to withdraw at will.
What Actually Happened
Kelp DAO paused rsETH contracts across mainnet and multiple Layer 2 networks shortly after identifying suspicious cross-chain activity. The team said it was working with LayerZero, Unichain, auditors and security experts to determine the root cause.
On-chain analysis from D2 Finance pointed to a private key leak on the source chain as the root cause, creating a trust issue with OApp nodes that allowed the attacker to manipulate the bridge.
A further nuance was added by investigators following the forensics. Two possible failure paths exist. If a legitimate source transaction exists for the relevant nonce, the compromise originated from the source-side OApp key. If no source transaction surfaces, the failure is on the DVN side, compounded by Kelp’s configuration of a single point of failure using LayerZero Labs as the sole verifier.
What Comes Next
Kelp DAO’s contracts remain paused while the investigation continues. Aave’s ETH utilization at 100% creates a situation where depositors cannot withdraw until borrowed ETH is repaid or new liquidity enters the pool.
The bad debt question is the more pressing concern. If the exploited rsETH positions cannot be recovered, Aave will need to determine how losses are distributed across the protocol, a process that has historically been contentious and slow.
Full forensics and an attacker cluster map are still being compiled. Official updates are expected through Kelp DAO’s verified channels as the investigation progresses.
Charles Hoskinson was asked a straightforward question during a recent discussion: even if Ripple keeps all the business value for itself, does it not still benefit XRP holders when the headlines drive the price up during a bull market?
His answer was pointed and detailed. “You got to understand that they gave themselves somewhere between 70 to 80% of the supply,” Hoskinson said. “The game is make the headlines, make the price go up, sell the XRP to other people, and then use the cash to buy assets.”
Hoskinson’s position is that XRP holders do not have legal ownership of anything Ripple builds with the money it raises from selling XRP. The prime broker, the custody business, the treasury management platform, the acquisitions, all of that belongs to Ripple as a private company with independent investors and shareholders.
“XRP holders have no legal ownership of those assets,” he said. “They go to a centralised company. The XRP token doesn’t really have much to say or do with that. There are no staking rewards or other things connected to it.”
“It’s basically like Tether from that perspective. One company gets all the value and the holders get some instrument and some network, but they don’t actually get any price appreciation from that,” he said.
The Circular Economy Problem
Hoskinson contrasted this with what he described as a properly structured tokenomic model. Using Midnight and Hyperliquid as examples, he argued that in a well-designed system, network activity creates direct buy demand for the underlying token. The more the network is used, the more demand there is for the token. Value flows back to holders.
“There is nothing in the Ripple network that creates buy demand for the XRP token. Nothing,” he said. “Whereas you can do that with Hyperliquid and absolutely can do it in the app chain model.”
He pointed to the EOS situation as the historical precedent. Block One raised $4 billion building the EOS network, declared it had no fiduciary obligation to the ecosystem, retained the capital, and EOS holders were left with a token that went nowhere while the company’s treasury compounded.
The Bull Market Counterargument
The question put to Hoskinson acknowledged the obvious: in a bull market, headlines drive prices. XRP holders profit when price goes up regardless of the underlying structure.
Hoskinson did not deny that. His argument is about the longer-term structure rather than short-term price action. Ripple has been selling hundreds of millions to billions of dollars worth of XRP every year, as documented in SEC filings that formed the basis of the lawsuit. That selling is ongoing. The cash goes into Ripple the company, not back into XRP.
“When they do make revenue and profit, there is no buyback. The Ripple company is not going and buying back XRP. They sell the XRP,” he said.
RaveDAO has collapsed. A token that reached an all-time high of $27.94 just days ago is now trading around $1.50, down 95% from its peak, after on-chain investigator ZachXBT publicly accused insiders of orchestrating a pump-and-dump scheme and both Binance and Bitget confirmed they had opened formal investigations.
Approximately $43.68 million in leveraged positions were liquidated in 24 hours as the allegations triggered panic selling and a cascade of forced closures across derivatives markets.
What ZachXBT Alleged
ZachXBT claimed that over 90% of RAVE’s token liquidity was controlled by a small group of insiders, a concentration that would give them the ability to manufacture price increases and sell into retail demand. He had previously attempted to contact the RaveDAO co-founder for comment and was left on read.
When Binance and Bitget confirmed investigations were underway, whatever confidence remained in the token evaporated.
On-chain data supported the concern. RAVE had approximately 12,139 holders at a point when it briefly carried a multi-billion dollar market cap, with an estimated 98% of supply concentrated in insider and early wallets. That structure made violent downside moves inevitable once selling pressure arrived.
RaveDAO Responds
The team published a six-part statement, denying involvement in the price action and framing the situation as industry noise directed at a legitimate project.
“RaveDAO team is not engaged in, nor responsible for, recent price action,” the team wrote. “We take transparency seriously and remain humbled by the attention, but our focus is on the mission: bringing mass adoption to Web3 through live events.”
The statement acknowledged plans to sell tokens to fund operations, described as being done according to a Token Release Schedule. It also announced the team is exploring performance-triggered or price-triggered lock mechanisms to align team incentives with ecosystem growth going forward.
The team closed by saying it was returning to building and would not engage further with what it called rumours.
Where RAVE Trades Now
RAVE is currently around $1.50, with the next support identified at $0.80. A recovery would require reclaiming $2.50 as support, a level that now represents significant overhead resistance.
The investigations at Binance and Bitget are ongoing. Until those conclude, analysts expect bearish pressure to continue, particularly given the overhang of insider supply that has not yet been distributed.
The token went from $0.14 to $27.94 in four months. It gave most of it back in less than 24 hours.
Bernstein holds a $150,000 Bitcoin year-end target citing ETF AUM approaching $250 billion and MicroStrategy’s treasury crossing 715,000 BTC. Standard Chartered’s Kendrick projects Ethereum at $7,500 following the Pectra upgrade activation, with Axi modeling an $8,000 to $10,000 consolidation range as institutional staking products scale.
Cardano’s Protocol 11 Van Rossem hard fork is confirmed for late June with Plutus smart contract upgrades and improved node security, but ADA has barely moved from $0.245 despite the $71 million treasury commitment to scaling. The crypto news today is dominated by large-cap catalysts that take quarters to price in. AlphaPepe is operating on a different clock. Over $890,000 raised across 7,700 wallets, a live AI DEX generating revenue, and a Q2 listing timeline that is outpacing Cardano’s upgrade schedule in raw capital accumulation speed.
Bitcoin and Ethereum Set Institutional Targets While Cardano Prepares Protocol 11
Bitcoin trades near $76,000 after spot ETFs absorbed $4.2 billion in Q1 with exchange reserves hitting 2.3 million BTC lows. Bernstein’s $150,000 thesis rests on ETF AUM doubling from $128 billion toward $250 billion as pension fund allocations begin flowing through regulated vehicles. Galaxy Digital extends the range further to $200,000 by Q4 if five Nasdaq 100 companies add BTC to balance sheets. From $76,000, the $150,000 target is a 97% move over eight months.
Ethereum sits at $2,330 with the Pectra upgrade now live and BlackRock’s staking-enabled ETHB ETF pulling $311 million since March. Standard Chartered’s $7,500 target and Fundstrat’s Tom Lee at $7,000 frame the upside at roughly 200% to 220% from current levels. The institutional thesis is strong. The timeline stretches through year end.
Cardano’s Van Rossem hard fork will deliver Protocol Version 11 in late June, enhancing Plutus primitives and enforcing VRF key uniqueness. Testing hit a memory regression in the 10.7.0 pre-release, adding 6 GB of RAM usage over 15 days, but the fix is bundled into 10.7.1 with the June timeline intact. ADA trades at $0.245 and has not responded to the upgrade confirmation. The $71 million treasury fund for Leios and Hydra scaling is the largest infrastructure commitment in Cardano history, but the price action says the market is waiting for delivery, not announcements.
AlphaPepe Accumulation Outpaces the Protocol 11 Timeline
Cardano’s Protocol 11 upgrade takes two more months to reach mainnet. AlphaPepe raised $890,000 in the time it took the Van Rossem pre-release to discover and patch a memory leak. That is not a criticism of Cardano’s engineering process. It is a statement about the speed at which capital moves into a protocol that already has its product live.
AlphaSwap is running. A cross-chain AI DEX screening contracts for exploit vectors, tracking whale activity across chains, and collecting fee revenue today.
Built by an engineer with 500 million Shibarium mainnet transactions behind them. The contract holds a perfect 10/10 BlockSAFU audit. Fixed supply of 1 billion tokens. Instant delivery. Zero vesting. Stakers earning 85% APR while Q2 approaches. Tier 1 CEX debut follows.
Stage 13 at $0.01494 with 7,700 wallets and 100 new addresses daily. A $1,500 entry secures 100,401 tokens. Analysts targeting $1.50 value that at $150,601. At $3.50 it crosses $351,403. Buyers at $2,000 or above can apply code ALPHA50 for a 50% bonus. Bitcoin needs ETF AUM to double for 97%. Ethereum needs staking adoption to scale for 220%. Cardano needs a hard fork to land in June. AlphaPepe needs Q2.
The Crypto News Today Is About Timelines. The Shortest One Wins.
Bitcoin, Ethereum, and Cardano are all building toward legitimate milestones. The presale at $0.01494 with $890,000 raised and a live AI DEX is not waiting for any of them. Stage 13 is filling and the next price level approaches.
What are the Bitcoin and Ethereum price predictions today? Bernstein targets $150,000 BTC on ETF AUM reaching $250 billion. Standard Chartered and Fundstrat project $7,000 to $7,500 ETH following the Pectra upgrade. Both timelines extend through year end.
What is Cardano’s Protocol 11 upgrade? The Van Rossem hard fork delivers enhanced Plutus primitives and node security in late June 2026. A memory regression in testing was patched without delaying the timeline.
How much has AlphaPepe raised? Over $890,000 across 7,700 wallets at Stage 13 pricing of $0.01494. The $1 million mark is approaching with 100 new wallets entering daily.
Ethereum price has been one of the stronger performers among the top 10, holding above the $2,000 level since March. However, the price has slipped nearly 3.5% in the past 24 hours, underperforming the broader market amid macro-driven selling pressure. Despite this short-term weakness, the larger structure remains intact, with three key indicators signaling a potential bullish shift that could drive the ETH price toward new highs.
Ethereum On-Chain Activity Surges to Multi-Year Highs
After a prolonged period of decline, chain transactions have rebounded sharply, reaching over 200 million in Q1 2026. This marks one of the strongest recoveries in network activity in recent years, breaking the previous downtrend that persisted through 2022–2024. This isn’t just a small uptick—it’s a structural reversal in usage.
Source: X
Rising transaction count typically signals increasing demand for the network, whether through DeFi activity, user growth, or broader ecosystem participation. More importantly, it suggests that fundamental usage is catching up with price, rather than price moving purely on speculation.
10% Volatility Haunts the Ethereum Price Rally
Ethereum’s liquidation map is starting to show a clear imbalance, and it’s not subtle. A large cluster of short liquidations is building above the current price, while long-side liquidity below has already been cleared to a large extent. This shift suggests that the market has already flushed weaker longs, leaving short positions exposed on the upside.
With price hovering near $2,350, the path of least resistance appears tilted upward. If ETH begins to push higher, it could trigger a cascade of short liquidations, effectively fueling the move toward higher levels. If ETH price surges by 10%, the token may face $800M in short liquidation, while a 10% pullback could trigger $2.3B in long liquidations.
Ethereum Price Prediction: Can ETH Price Hit $5000?
Ethereum’s higher timeframe structure is starting to mirror a familiar cycle, and that’s where things get interesting. Each major rally has followed the same pattern: impulse → consolidation → expansion. Right now, ETH appears to be sitting in that consolidation phase again, holding within a defined range after its last move higher.
The current structure between roughly $2,000–$4,000 looks similar to previous accumulation zones that eventually led to strong upside expansions. Price is compressing, volatility is cooling, and the market is building a base rather than trending aggressively. If this pattern continues, the next phase would be a breakout from this range, potentially leading to a new expansion leg. The projected move, based on previous cycles, points toward a gradual climb rather than a straight rally, likely forming higher highs along the way.
Ethereum isn’t trending; it’s preparing. And historically, this kind of consolidation has preceded some of the strongest moves, not the weakest. As long as the ETH price holds above the lower range (~$2,000), the structure remains intact. A breakdown below this level would invalidate the pattern and shift the outlook.
It’s not every day a “dead” token wakes up and decides to go vertical but HIGH/USD just did exactly that. A brutal 400% surge from the $0.10 zone has dragged Highstreet back into the spotlight, and no, it wasn’t random. This one had a trigger. A very specific one.
The Early Access launch of Highstreet: Calamity on Meta Quest VR flipped the switch.
VR Game Launch Sparks Sudden Market Revival
But honestly before this, Highstreet wasn’t exactly the market’s favorite child. It sat in what traders love to call the “graveyard zone.” Low interest. Flat price action. Basically invisible.
Then came the Calamity launch. Suddenly, the narrative changed. A roguelike VR brawler dropped into a niche but high-potential sector, metaverse gaming and just like that, the token had a story again. And in crypto, narratives move faster than fundamentals. The result? Buyers piled in. Fast.
Short Squeeze Chaos Drives Explosive Price Action
This wasn’t just organic demand. The derivatives market lit up like a Christmas tree. Futures volume exploded nearly 4800%, hitting $1.51 billion. Open interest? Up 830% to $35.25 million.
That’s not normal. That’s fuel. And then came the squeeze. Out of $10.47 million in total liquidations, a hefty $6.69 million were short positions getting wiped out. Forced buyers. Panic covering. You know the drill.
Each liquidation pushed the price higher… which triggered more liquidations… which pushed it even higher. A perfect feedback loop. Violent, fast, and completely unforgiving for anyone betting against it.
Zoom Out And The Picture Looks Less Impressive
But here’s the part nobody chasing green candles wants to hear. Zoom out to the weekly chart and the move barely registers.
Yeah, triple-digit gains look flashy on the daily timeframe. But structurally? HIGH/USD is still sitting well below its historical highs. No major long-term levels reclaimed. No confirmed macro reversal.
So what does that mean? Simple. This looks a lot more like a high-momentum trade than a confirmed long-term comeback.
Highstreet Needs More Than Just One Catalyst
So, what’s next? If this Highstreet rally is going to stick, one VR game launch won’t cut it. The market will need consistent ecosystem updates, sustained engagement, and let’s not ignore this favorable macro conditions is also needed to keep the broader trend in check. Otherwise, the risk is obvious.
Psst… Have you heard?
Highstreet: Calamity just dropped into Early Access on Meta Quest #VR Dive into the chaos with your friends, swing your way through the arena, and see if you’ve got what it takes. Jump in now → Download here: https://t.co/36ZEMr0gI3pic.twitter.com/nXAN93KgZH
Once the Highstreet hype fades and the forced buying dries up, HIGH/USD could slip right back into the range it just escaped from. That’s how these things usually play out.
For now, though, momentum is doing what momentum does best ignoring reality and pushing higher.
Solana price is walking a tightrope and below it sits a pile of liquidation fuel waiting to be lit. What looks like a simple rejection on the daily chart is actually a layered fight between short-term bears and overleveraged bulls, and right now, Solana price is stuck right in the middle of it.
Short-Term Pressure Mounts Near Critical EMA Rejection
Solana price just fell under the 50-day EMA, and it didn’t shrug it off either. The latest daily candle turned red, signaling that sellers aren’t just present they’re active.
Now here’s where it gets interesting. On the 1-day liquidation map, there’s roughly $99.73 million in cumulative short liquidation leverage stacked above price. That’s a crowded short trade. Normally, that kind of imbalance creates a magnet upward markets love punishing consensus.
But that’s not what’s happening… at least not yet. Instead, the price is slipping, suggesting that in the immediate term, the path of least resistance is still downward. In other words, bears are controlling the short-term narrative despite the temptation of a short squeeze.
Well, the 7-day data flips the entire story as that turns suddenly the market dangerously long. There’s a massive $319.59 million in cumulative long liquidation leverage sitting below current price, compared to just $150.63 million in shorts.
That’s not just an imbalance but clearly it’s a setup. Because, if Solana price starts breaking key supports, those long positions become liabilities. And when they unwind, they don’t do it quietly. Forced selling kicks in, accelerating downside momentum in what traders call a long squeeze.
Translation? The real liquidity target might not be above perhaps it’s below.
Trendline Support Now Decides Solana Price Direction
So, It all comes down to a pretty simple line on the chart to a short-term ascending trendline. Solana price is currently sitting right on it, and the reaction here will likely dictate the next move.
If this trendline and the nearby $85 Solana price support fails to hold, the probability of cascading liquidations increases significantly. That opens the door to a deeper correction, with price potentially targeting the $75–$80 support zone where that liquidity pool sits.
But let’s not get ahead of ourselves. There’s still a wildcard in play. That heavy cluster of short liquidations above means a sudden bounce could trigger a quick relief rally toward the $90–$95 region. It wouldn’t be sustainable on its own, but it could happen fast.
Crypto investigator ZachXBT has raised serious concerns about manipulation in the RAVE token. He said activity linked to Binance, Bitget, and Gate shows insiders controlling over 90% of supply and influencing price movements. He described coordinated pump and dump behavior targeting retail investors. ZachXBT also offered a $25K bounty for proof. Following the claims, Bitget CEO Gracy Chen confirmed that an internal investigation has started and promised action if misconduct is confirmed across exchanges globally now ongoing.
Price predictions for 2026 highlight a potential range of between $20-$80.
Long-term forecasts indicate AVAX could reach $518.50 by 2030.
Aave (AAVE) is a decentralized finance protocol built on Ethereum that facilitates permissionless lending and borrowing through smart contracts. After witnessing a strong expansion in the previous market cycle, AAVE entered a prolonged correction phase, with price gradually retracing from its earlier highs. Throughout 2025, AAVE remained in a consolidation structure, reflecting a period of market digestion rather than trend continuation. While short-term momentum has cooled, the broader technical structure suggests that AAVE may be transitioning into a new accumulation phase.
As volatility contracts and price holds above long-term demand levels, attention is now shifting toward whether 2026 can trigger the next major price discovery cycle.
Avalanche price (AVAX) remains confined within a long-standing rectangular consolidation range between $8.60 and $10.50 as it enters the second quarter of 2026. Following a rejection from the $15 resistance level back in January, the price has struggled to generate meaningful bullish momentum, spending the entirety of Q1 oscillating within this tight demand zone. While analysts initially anticipated a recovery earlier in the Q1, but the market has instead chosen to build a base at these lower levels.
As April ongoing so has Q2 2026 and AVAX price is currently hovering near the $8.60 lower boundary of this box. The immediate technical hurdle for the month is the $10.50 upper edge; a decisive breakout above this level is required to shift the bias and open the door for a retest of the $15 psychological resistance.
However, given the persistently low trading volume and current market indecision, failure to clear the $10.50 mark would likely result in continued sideways price action throughout the rest of April as the asset awaits a stronger catalyst.
Avalanche (AVAX) Price Prediction 2026
The weekly price action for Avalanche price (AVAX) has been defined by a multi-year structural decline following its Q1 2024 peak of $65. Throughout 2024 and 2025, the asset remained trapped under a descending resistance line, with bearish momentum intensifying in early 2026. This downward pressure drove AVAX price to a major horizontal support floor between $8.60 and $10.00, marking a critical “base-building” phase as Q1 concluded with a period of low-volatility consolidation.
As Q2 2026 begins, holding this demand zone is essential for any potential reversal. While the price has been stagnant for nearly two years, the prolonged accumulation at these lows suggests that a market bottom may finally be in place. If demand returns in April, the first half of the year could see a recovery rally toward $20, with an ambitious secondary target at the $28 level, which aligns with the 200-week EMA and the long-term descending trendline.
A decisive breakout above this $28 resistance would signal a major trend shift, potentially clearing the path for AVAX to reclaim $44 by the end of 2026. However, investors should remain cautious; if the $28 level repels the price, the recovery could stall, leading to extended consolidation within the lower ranges. The next few months are pivotal to determine whether AVAX/USD can finally emerge from the shadow of its multi-year bear market.
AVAX On-Chain Analysis
AVAX shows a highly bullish sentiment. Big Whale Orders in both spot and futures indicate strong institutional accumulation. With Taker Buy Dominance at 90 days, aggressive buyers are in control, while the Cooling volume bubble map suggests a healthy consolidation phase. Collectively, major metrics point to a bullish rally ahead.
Avalanche Price Prediction 2026 – 2030
Year
Potential Low ($)
Potential Average ($
Potential High ($)
2026
400
500
600
2027
550
690
820
2028
650
830
980
2029
740
950
1100
2030
820
1000
1200
AAVE Price Forecast 2026
Looking ahead to 2026, AVAX’s potential price is anticipated to rise even further, with a projected low of $20.00 and a high of $80.00. The average price for AVAX in 2026 will likely be $50.00.
AAVE Price Prediction 2027
In 2027, the analysis suggests a continued upward trend in AVAX’s value, with the price potentially ranging between $31.50 and $126.50. Based on the calculated figures, the average price is projected to be approximately $79.00 during this period.
AAVE Prediction 2028
By 2028, AVAX’s price could potentially experience further growth, falling within the range of $50.50 and $202.50. The average price during this period, calculated from the data, is expected to be around $126.50.
AAVE Price Prediction 2029
Moving forward to 2029, AVAX’s price is predicted to ascend between $81.00 and $324.00. The average price during this period is estimated at around $202.50 based on calculated figures.
AAVE Price Prediction 2030
By 2030, AVAX’s price is forecasted to soar between $129.50 and $518.50. Further, the average price during this period, calculated from the data, could stand at $324.00.
Based on the historic market sentiments and trend analysis of the largest cryptocurrency by market capitalization, here are the possible AAVE price targets for the longer time frames.
Year
Potential Low ($)
Potential Average ($)
Potential High ($)
2031
890
1100
1350
2032
920
1200
1500
2033
1100
1350
1780
2040
1600
2200
3000
2050
2600
3300
4500
AAVE Price Prediction: Market Outlook?
Year
2026
2027
2030
Changelly
$500
$750
$1100
DigitalCoinPrice
$480
$680
$1000
WalletInvestor
$520
$650
$1250
Never Miss a Beat in the Crypto World!
Stay ahead with breaking news, expert analysis, and real-time updates on the latest trends in Bitcoin, altcoins, DeFi, NFTs, and more.
FAQs
Is AAVE a good investment for 2026?
AAVE shows long-term growth potential if it breaks key resistance levels. However, price depends on market conditions and DeFi adoption.
What should investors watch before buying AAVE?
Watch support near $135–$150, resistance above $250, overall market trend, and activity within the Aave protocol.
What could drive Avalanche (AVAX) price growth in the coming years?
Key drivers include DeFi expansion, institutional adoption, subnet growth, and overall crypto market recovery cycles.
What is the AVAX price prediction for 2026?
The AVAX price prediction for 2026 suggests a potential range between $400 and $600 if market momentum and network growth remain strong.
What is the AVAX coin price prediction for 2030?
AVAX coin price prediction for 2030 points to a possible range of $820 to $1,200, assuming sustained adoption and favorable market conditions.
What is the Avalanche price prediction for 2040?
Avalanche price prediction for 2040 estimates a broad range between $1,600 and $3,000 if long-term blockchain adoption accelerates globally.
One of crypto’s most trusted on-chain investigators just called out a textbook pump and dump, and this time, major exchanges are named.
ZachXBT posted publicly that pump and dump activity for RAVE token originated on Bitget, Binance and Gate, with insiders controlling over 90% of supply. He called on Binance co-founder He Yi and Bitget CEO Gracy Chen to launch internal investigations and offboard the responsible actors.
He offered a $10,000 personal bounty for whistleblowers. Chen responded soon:“Thanks for highlighting! We’ve started investigating into $RAVE.”
How the Manipulation Worked
The setup was deliberate. Wallets linked to the RaveDAO deployer transferred 18.58 million RAVE tokens to Bitget before the pump began – with no announcement and no disclosure. The price was still below $0.50.
Ten hours later, the rally started.
With 74% of traders on Binance holding short positions, insiders then withdrew 29.78 million tokens from Bitget – draining exchange selling pressure entirely. The resulting short squeeze sent RAVE from $0.27 to over $14 in seven days, a gain of more than 5,500%.
ZachXBT had previously reached out to RaveDAO’s co-founder before posting publicly. He was left on read.
The Red Flags Were There
Intergovernmental Blockchain Advisor Anndy Lian flagged the warning signs clearly. The top 10 wallets hold 98.16% of total supply. Only 24-25% of the one billion token supply is in circulation. The fully diluted valuation sits at roughly four times the current market cap – a ratio that historically precedes 40-60% retracements. There is no public codebase and no completed security audit.
The project’s backer list is striking: World Liberty Financial, Warner Music Group, Tomorrowland, and YZi Labs – a Web3 incubator with former Binance staff. None of that changes what the on-chain data shows.
“We cannot allow this blatant market manipulation by insiders controlling more than 90% RAVE support to further extract from retail investors,”ZachXBT wrote.
Bitget has confirmed its investigation is underway. Binance and Gate have not yet responded publicly.
TRON is holding a bullish structure after confirming a breakout above its descending resistance, with price now sustaining above key levels. Following the breakout, TRX price continues to trade steadily above the $0.30 zone, forming consistent higher lows rather than sharp volatility. This controlled price action reflects ongoing accumulation, with buyers maintaining strength across sessions.
At the same time, strong network performance, highlighted by $826.9 million in Q1 revenue, is reinforcing the underlying demand. The key question now is whether this steady structure can translate into a sustained move higher.
TRON’s latest data highlights a strong fundamental backdrop supporting the current price structure. The network generated approximately $826.9 million in Q1 2026 revenue, placing it among the top blockchain ecosystems in terms of real usage. This growth is largely driven by stablecoin transfers, transaction volume, and consistent activity across decentralized applications.
At the same time, development activity remains stable, while social dominance has cooled, indicating reduced speculative noise. This combination reflects a low-hype, high-utility environment, where demand is driven by actual usage rather than short-term sentiment. Such conditions typically support price stability and accumulation phases.
TRX Price Analysis: Breakout Holds as TRX Forms Higher Lows
TRX price structure has shifted from a downtrend into a recovery phase. After forming a double bottom near $0.27–$0.28, the price established a strong demand base, preventing further downside. The key structural shift came with a breakout above the descending trendline, signaling weakening selling pressure.
Since the breakout, TRX has not shown aggressive upside but instead continues to form higher lows above $0.30–$0.31, reflecting controlled accumulation. This type of movement indicates sustained buying rather than speculative spikes. Short-term EMAs are gradually trending upward, supporting the current structure. As long as TRX holds above the breakout zone, the trend remains intact.
On the upside, immediate resistance lies near $0.34–$0.35, and a sustained move above this range could open the path toward $0.38, the next major supply zone. A breakdown below $0.30 would weaken the bullish structure and signal loss of momentum.
Final Take
TRON is maintaining a steady post-breakout structure, supported by both strong fundamentals and improving technicals. With price holding above key levels and network growth remaining strong, the setup favors continuation as long as support is maintained.
A move above $0.35 would confirm further upside potential, while holding above $0.30 remains critical. At this stage, TRX is positioned in a controlled accumulation phase within a bullish structure, with the potential to extend higher if momentum sustains.
XRP price is down 1.09% over the past 24 hours, trading near $1.43 and lagging behind Bitcoin’s strength. The move appears to be a technical pullback after recent overbought conditions—but the broader setup is starting to shift. Notably, one of the key indicators has just flipped bullish for the first time in months, hinting that underlying momentum may be changing.
At the same time, positioning data tells a different story. Open interest continues to climb, showing traders are stepping in aggressively, while funding keeps flipping—pointing to unstable conviction on both sides. This creates a clear tension: is XRP building strength for a breakout above $1.55, or setting up liquidity for another rejection?
Derivatives Signal: Positioning Builds, But Conviction Remains Split
The derivative data does not appear to point towards a clean trade setup, as Open interest climbs and funding rates continue to flip. XRP is down 1.09% over the past 24 hours, trading near $1.43 and lagging behind Bitcoin’s strength. The move appears to be a technical pullback after recent overbought conditions—but the broader setup is starting to shift.
Notably, one of the key indicators has just flipped bullish for the first time in months, hinting that underlying momentum may be changing. At the same time, positioning data tells a different story. Open interest continues to climb, showing traders are stepping in aggressively, while funding keeps flipping—pointing to unstable conviction on both sides.
This creates a clear tension: is XRP building strength for a breakout above $1.55, or setting up liquidity for another rejection?
XRP Supertrend Flips, But Resistance Still in Play
XRP is still range-bound—but one important shift just happened. The supertrend has flipped bullish for the first time since January, signaling a change in short-term momentum. This isn’t noise. It tells you the trend pressure that kept pushing the price lower for months is starting to ease. But here’s the catch—the price hasn’t been confirmed.
XRP continues to trade inside the $1.27–$1.55 range, with multiple rejections near the upper boundary. The current move is pushing into resistance again, but until $1.55 is taken out decisively, the structure remains unchanged. This is a clear divergence, as the indicator is turning bullish while the price is still stuck below key resistance. At the same time, RSI is climbing, showing improving momentum—but again, momentum without a breakout doesn’t change structure.
Therefore, a breakout above $1.55 may confirm the supertrend shift, which may open doors towards $1.70 and $1.80. Besides, a rejection may turn into another failed breakout, dragging the price back to the $1.30 zone. The supertrend flip is the first real bullish signal in months—but until price follows through, it’s just potential, not confirmation.
XRP at a Decision Zone: Breakout or Another Rejection?
The XRP price is approaching a decisive point where both price structure and positioning are about to resolve. The supertrend flip signals improving momentum, but the price still sits below a well-defined resistance. At the same time, rising open interest shows traders are heavily positioned, increasing the probability of a sharp move once direction is confirmed.
Momentum is building, but confirmation is missing. The next move isn’t about direction—it’s about whether $1.55 finally breaks or rejects again.
Prediction markets are watching XRP closely. Kalshi traders are now forecasting a high of $1.60 for XRP this month – and the signals behind that bet are stacking up fast.
Ripple CEO Brad Garlinghouse said it today:“Demand for XRP keeps growing. More access, more ecosystems, more utility.”
He was responding to RippleX announcing that wXRP is now live on Solana, enabled by Hex Trust and LayerZero. XRP liquidity is no longer contained to the XRP Ledger. It is moving cross-chain, and that is a new demand driver that did not exist a month ago.
$1.11 Billion in XRP ETF Assets – and Institutions Are Still Buying
Five spot XRP ETFs attracted $55.4 million in net inflows over the past five trading days, recording positive flows every single day. The largest single-day inflow arrived on April 15 at $17 million. Those five products now hold a combined $1.11 billion in assets – 1.22% of XRP’s entire market cap.
The week ending April 11 saw $119.6 million in weekly inflows, the strongest figure since December, according to CoinShares. Institutional demand is not fading. It is accelerating despite six consecutive months of price decline.
XRP Short Squeeze Setup Traders Are Watching Right Now
For the first time since January 17, the SuperTrend indicator has flipped bullish on XRP’s daily chart. The key level to watch is $1.55. A clean break and daily close above it would likely trigger a relief rally toward the $1.90 zone, according to technical analyst Ali Charts.
What makes the setup asymmetric is the positioning.
Funding rates are deeply negative – shorts are doubling down. Coinbase premium is positive – US buyers are stepping in.
With XRP already at $1.47, that ceiling is now less than 3% away.
The CLARITY Act Vote That Could Send XRP Soaring
The CLARITY Act Senate Banking Committee markup is targeted for late April. Standard Chartered explicitly models XRP trading above $1.60 if the committee delivers. JPMorgan says negotiations are down to two or three unresolved issues. If the vote happens, $1.60 is not a stretch – it may be a floor.
If it does not, analysts see XRP returning toward support at $1.28, and potentially $1.15 if that level breaks.
XRP has cleared every structural hurdle its community waited years for. The price has not caught up yet. That gap, and the timeline closing around it, is exactly what Kalshi traders are pricing in.
Chainlink is approaching a decisive phase as on-chain activity begins to rise near a critical price zone. After an extended correction, LINK is now holding firm above key support while exchange outflows increase. With price stabilizing and structure tightening, the market is entering a phase where a directional move becomes more likely.
On-Chain Data Shows Supply Reduction and Accumulation
Recent on-chain activity highlights a clear shift in supply dynamics. More than 257,000 LINK tokens (~$2.45M) have been withdrawn from Binance within a short period. Such movements typically indicate that tokens are being transferred to private wallets, reducing immediate sell-side liquidity. Alongside this, whale wallets have accumulated nearly 200,000 LINK (~$1.8M), suggesting that larger participants are positioning within the current price range.
At the same time, network activity and development metrics remain stable, indicating that the decline in price has not been driven by weakening fundamentals. This combination reflects a supply contraction phase supported by steady underlying activity, which is often observed during accumulation periods.
LINK Price Analysis: Downtrend Exhaustion Followed by Base Formation
LINK’s price structure shows a clear transition from a trending phase to stabilization. After a prolonged decline, price has stopped forming lower lows and is now consolidating within the $9.0–$9.5 demand zone. Multiple attempts to break below this range have failed, confirming strong buyer presence.
The broader structure still reflects a descending trendline resistance, which continues to cap upside movement. However, price is now compressing between this resistance and the demand zone, forming a tightening range. Moreover, the short-term EMAs remain below price but are flattening, indicating that bearish momentum is weakening. This creates a compression structure, where volatility contracts before expansion.
A sustained move above the $11.5–$12 resistance zone would confirm a structural shift, potentially opening a move toward the $15–$16 range, which aligns with the next supply zone. On the downside, a breakdown below $9.0 would invalidate the base formation and expose lower levels.
Final Words
Chainlink is holding a key structural support while on-chain data reflects reduced exchange supply and steady accumulation. LINK price remains within a consolidation range, with resistance still intact. A move above $12 is required to confirm a shift in trend, while holding above $9.0 remains critical. At this stage, LINK is forming a base within a broader corrective structure, with accumulation visible but breakout confirmation still pending.
Solana recorded over 10 billion transactions in Q1 2026, the highest quarterly level in its history, rising more than 60% from the previous quarter. The surge was driven by strong decentralized exchange activity and expanding real-world usage across DeFi and stablecoin markets. On-chain trading also gained major traction, with volumes competing closely with top centralized exchanges like Binance and Bybit, while outperforming Coinbase and Kraken. The growth highlights increasing adoption, deeper liquidity, and stronger network utility across the ecosystem.
PayPal’s stablecoin, PayPal USD (PYUSD), has reached a market capitalization of $4.11 billion, marking one of the fastest growth phases in the stablecoin space. The token has expanded rapidly since mid-2025, rising from around $500 million to over $4 billion.
In contrast, Ripple’s RLUSD, which once touched nearly $1.6 billion, has recently pulled back to around $1.42 billion.
PYUSD Growth Driven by Real Usage, Not Hype
PYUSD’s rise is not just about market cycles, it is driven by actual usage.
PayPal has expanded the stablecoin across 13 blockchain networks in 2025, including Ethereum, Solana, Arbitrum, and Stellar. This multi-chain approach allows users to move funds easily across networks, making PYUSD more accessible for both payments and DeFi.
A key push came through a LayerZero integration, which allowed PYUSD to move freely across nine additional chains.
On Solana alone, PYUSD became the second-largest stablecoin on the Kamino lending platform, with over $500 million in deposits. This shows strong demand beyond simple trading.
Even recently, Coinpedia news reported that YouTube announced that eligible U.S. creators can get paid directly in PayPal’s PYUSD stablecoin.
Yield and Rewards Attract Users
Another key reason behind PYUSD’s growth is incentives.
PayPal introduced around 3.7% yield on PYUSD balances, giving users a reason to hold the token instead of just using it for transfers. The stablecoin is currently trading close to $1, maintaining its peg, while daily trading volumes range from $85 to $100 million.
On top of that, features like cashback rewards linked to PYUSD created a real use case for everyday users.
Ripple RLUSD Faces a Tough Competitive Market
PYUSD surged over 600% in 2025, rising to $4.11 billion in market cap, while RLUSD dropped from its peak to around $142 billion.
Ripple’s RLUSD started strong after its launch in late 2024. It quickly grew to nearly $1.6 billion by early 2026, showing early traction. However, growth later slowed, and it dropped to around $1.42 billion.
The main reason is strong competition.
RLUSD entered a market led by USDT at $184 billion and USDC at $77 billion, making it hard to grow fast.
It also depends on the XRP ecosystem, and with XRP down over 40% in 2026, interest has weakened.
Signs of a Comeback for RLUSD
Despite the drop, RLUSD is not out of the race.
Ripple has been expanding its technology, allowing cross-chain transfers on networks like Base and Optimism, which improves its use in DeFi.
Recent data shows growth picking up again, suggesting a possible recovery phase.
With strong growth signals returning from March 31 onwards and new infrastructure coming online, RLUSD could be setting itself up for a run at new all-time highs in the months ahead.
The Bitcoin (BTC) price has been displaying significant strength in the past few days and marked monthly highs above $78,000. Currently, the price is experiencing significant upward pressure as it plunges below $76,500. The underlying data presents a more complex picture than the price action suggests, as the on-chain and derivatives signals reveal the token being in a transition phase.
This raises a key question for traders: is Bitcoin preparing for a breakout toward new highs or setting up for another rejection at resistance?
Bitcoin Price Tests Key Support Near $76.5K
Bitcoin has rebounded from the $65,000 region and is now testing the $76,000–$78,000 resistance zone, a level that has repeatedly capped upside in recent weeks. Despite the recovery, the broader structure still lacks a confirmed breakout, with price yet to establish a clear higher high above this range.
Derivatives data shows rising open interest, indicating fresh positioning, while funding rates remain slightly negative—suggesting that short positions are still dominant. This combination increases the likelihood of a short squeeze if resistance is broken. However, the absence of strong volume confirmation keeps the breakout scenario uncertain.
A sustained move above $78,000 could open the path toward $82,000–$84,000, while rejection at this level may push Bitcoin back toward the $72,000–$74,000 support zone.
Miner Selling Pressure Begins to Rise
The Miners’ Position Index (MPI) has recently turned positive after an extended period in negative territory, signaling that miners are beginning to sell again. While the current levels do not indicate aggressive distribution, the shift itself is important.
This suggests that miners are likely taking advantage of higher prices to realize profits, particularly as Bitcoin approaches resistance. Historically, such behavior tends to introduce supply pressure during rallies, especially when the price is testing key levels. In the current context, rising MPI adds a layer of caution, as it indicates that selling activity may increase if Bitcoin fails to break above resistance.
Low Miner Pressure Limits Downside Risk
The Puell Multiple remains in a relatively low range, reflecting that miner revenues are not elevated compared to historical averages. This indicates that miners are not under strong financial pressure to sell aggressively, which helps limit downside risk.
However, the metric is not in a deep undervaluation zone either, meaning it does not signal a strong accumulation phase or cycle bottom. Instead, it points to a neutral market condition where selling is opportunistic rather than forced. When combined with the rising MPI, the data suggest that miners are strategically distributing strength, rather than capitulating and potentially capping upside momentum in the near term.
Conclusion
Bitcoin is currently at a decisive level, with the price testing the $78,000 resistance amid conflicting signals from market data. While rising open interest and negative funding rates create conditions for a potential breakout and short squeeze toward $82,000–$84,000, increasing miner distribution introduces supply that could limit upside.
Unless the BTC price secures a strong breakout above resistance with volume confirmation, the current move risks turning into another rejection, with downside targets around $72,000–$74,000. For now, the setup remains balanced—but the next move will likely be decisive.
XRPL validators are casting votes on two amendments that would change what the XRP Ledger fundamentally does.
XLS-65, called SingleAssetVault, creates the pooled liquidity framework – a structure where multiple depositors contribute funds into isolated vaults, each holding one asset such as XRP or RLUSD. XLS-66, the LendingProtocol, sits on top of that. It enables fixed-term, uncollateralized loans issued directly at the protocol level, with creditworthiness assessed through off-chain underwriting rather than smart contracts.
Together they would make the XRPL a credit market, not just a payments network.
According to live data from XRPScan, XLS-65 currently has 8 validators voting yes at 22.86% consensus. XLS-66 has 7 validators at 20%. Both need 28 of 35 trusted validators to agree for two consecutive weeks before they can activate.
Both are still well short.
Payments Were Never the Full Story
At XRP Tokyo, Akinyele, Head of Engineering at RippleX, was direct about the direction.
“Payments was never the full story for the XRPL,” he said.“The real opportunity is actually more towards the ability for us to enable this notion of a full life cycle of capital. Issuance, trading, collateral, credit. And all of those things are coming together on the XRP ledger.”
His case for institutions was equally clear. XRPL features are native to the protocol, accessible through simple APIs with no smart contract expertise required. If an institution wants to build financial products on-chain, XRPL removes the need for deep blockchain expertise.
The protocol handles the complexity natively, so builders spend less time working around infrastructure and more time building the actual product.
Robert Kiuru, COO of Xaman – the largest self-custodial XRP wallet – put the demand signal plainly.
“We have over a million users who manage billions of XRP in self-custody,” he said. “They’re not looking to sell their capital. The next unlock that we see from our data is users looking for yields on their XRP.”
The lending protocol is the direct answer to that.
Panos Mekras, co-founder of Anodos, described the consumer vision as making the underlying technology completely invisible. Users should be able to access yield products and banking services without ever knowing XRPL is running underneath.
The validator vote is still open and climbing. Whether it reaches 80% in the weeks ahead will determine how quickly that vision becomes usable.
Ethereum is back in the conversation, and for good reason. Traders are starting to price in a possible move toward $3,000 by May, while XRP is still drawing attention with solid gains of its own. But the real shift in this market is happening elsewhere: a new payment token is pulling in fresh capital and forcing investors to rethink where the sharper upside may actually be.
Ethereum Price Prediction: Can ETH Really Push to $3K by May?
Ethereum is trading around $2,452.04, up 4.99% in the last 24 hours and 9.30% over the past week. That kind of move does not happen in a vacuum. It shows buyers are active and keeps ETH firmly in the conversation as one of the few large-cap cryptos still capable of grinding higher with real credibility.
Ethereum also has the kind of network activity that keeps it relevant. It remains the backbone for DeFi, stablecoin flows, and a huge share of on-chain applications, which means it continues to attract transactions even when the broader market cools.
That said, ETH is still a mature asset. It can absolutely keep climbing, but explosive upside is harder to unlock at this stage unless the market gets a stronger catalyst. A move to $3,000 by May is plausible, but it would still be a large-cap run, not an early-stage breakout.
XRP News Keeps Heating Up, But the Setup Is Different
XRP is trading around $1.50, up 4.38% on the day and 10.25% over the last seven days. The range between $1.42 and $1.51 shows active trading, and that matters because XRP tends to respond quickly when payment narratives start rotating back into focus.
Still, XRP is a more established story now. It has credibility, a large holder base, and a clear use case around payments, but that also means the market knows the playbook. The upside can still be meaningful, yet the move is less likely to surprise than something earlier in its lifecycle.
That is the key difference here. Ethereum is a proven infrastructure asset. XRP is a recognizable payments token. But neither has the same asymmetry as an emerging presale that is still being discovered by the market.
Why the New Payment Token Is Stealing Attention
The new token drawing attention is Remittix, and the reason is simple: it is built to send crypto that arrives as fiat in a bank account. Instead of forcing users to juggle wallets, bridges, and fragmented off-ramps, it focuses on direct crypto-to-bank transfers using real-time conversion and local payment networks.
That matters because cross-border payments are still slow, expensive, and buried under intermediaries. Banks, remittance services, and legacy rails all add friction that freelancers, businesses, and global users know too well. If a project can make that process faster and simpler, it has real-world utility, not just narrative appeal.
Remittix is starting to stand out because it is not trying to be another abstract blockchain story. It is a payment solution with a direct function, and that is exactly the kind of use case investors tend to reward early when adoption starts to take shape.
Why Investors Are Watching Remittix Closely
The presale has already raised $30M, the wallet is live on the Apple App Store, and the team is KYC verified. Those are not guarantees, but they do add credibility in a market where most presales are still selling a concept rather than a working product.
That is why Remittix, is being discussed as a stronger upside play than older names like ETH and XRP. Ethereum is credible but slower-moving. XRP is established but more priced in. Remittix sits in the more attractive zone: early enough for upside, real enough to matter, and focused on a problem the market understands immediately.
Of course, execution still matters. Adoption, product delivery, and market conditions will decide whether this turns into a major winner or just another promising idea. But the setup is hard to ignore when a presale combines utility, traction, and a clear bridge between crypto and banking.
Best Crypto to Buy Now? The Market Is Hinting at the Answer
If you want the safer, more established trade, Ethereum remains the cleaner large-cap bet, and XRP still has a place in the payments conversation. But if you want the sharper opportunity, the market is increasingly pointing toward Remittix.
Early positioning matters here. Once a presale gets fully priced in, the easy upside is gone, and waiting usually means paying more for the same story.
Gold had a 5,000-year head start. Bitcoin is 16 years old. And as Bitcoin crossed $77,000 this week, a striking data point is back in focus – more Americans own Bitcoin than gold.
River’s US Bitcoin adoption report, drawing on data from The Nakamoto Project and the Gold IRA Guide, puts the number at 50 million Bitcoin holders in the US versus 37 million gold owners. That is a 35% gap.
How America Became the World’s Biggest Bitcoin Economy
The US is not just leading on individual ownership. Americans hold 40% of the entire global Bitcoin supply – more than any other country. US public companies account for 94.8% of all corporate Bitcoin holdings worldwide. The US government itself holds approximately 198,000 BTC, representing 65% of all government-held Bitcoin globally.
The US holds the world’s largest national gold reserve at 8,133 tonnes – yet even that position is now being questioned by the public.
River boiled down the shift to two things: access and culture. Favorable regulation, almost zero barrier to entry, and an American instinct toward individual investing and financial freedom.
What Americans Are Saying About Gold Reserves
The ownership crossover is one thing. Public opinion is another.
A separate survey by The Nakamoto Project, conducted with Qualtrics across 3,345 Americans, found that 4 in 5 Americans support converting some portion of US gold reserves into Bitcoin. The median recommendation was 10%. For Americans under 45, it was 24%.
That is the generational divide in one number.
Why This Matters Right Now
This data point is not new. But the context around it in 2026 is.
Wells Fargo, Bank of America and Vanguard have all opened Bitcoin ETF distribution to their clients this year – meaning tens of thousands of wealth advisors are now actively recommending Bitcoin exposure for the first time. Goldman Sachs says 71% of institutional investors plan to increase their crypto allocation over the next 12 months.
The CLARITY Act is nearing a final vote in the Senate, with JPMorgan reporting negotiations are down to just two or three unresolved issues. If it passes, it would give Bitcoin a permanent legal status that gold has had for centuries – and XRP ETF inflows alone are projected to hit $5 billion on the back of it.
Every one of those developments lands differently when you know 50 million Americans already own the asset and are watching.
“America’s Story Began With Sound Money”
“America’s story began with sound money. Hard-working Americans saved their wealth in gold-backed money. Today, Bitcoin carries that torch forward,”River said in the report.
One caveat worth noting: the data counts anyone with $50 on Coinbase the same as a major holder. Depth of ownership is uneven. Gold still dominates at the institutional and central bank level.
But the direction of travel is clear. Bitcoin ETFs hit $10 billion in assets in seven weeks. It took the first gold ETF more than two years. Bitcoin’s daily price volatility is now approaching that of gold and the S&P 500.
The asset that spent a decade being called a scam just passed gold in American ownership.
And according to River, the US is “uniquely positioned to further their economic success and global leadership by embracing their current advantage in Bitcoin adoption.”
Aztec has completed the transfer of all ETH raised during its public token auction to Coinbase following a phased withdrawal over recent months. In December, the project sold 15% of its AZTEC supply, raising 19,388.4 ETH (around $59.13M) at an average price of $0.0473 per token, now significantly lower in value. During token generation, 4,234.6 ETH was allocated for liquidity, while the remaining 15,154 ETH was steadily moved to Coinbase, with the final transfer finalized on April 17 at 16:44 UTC.
MicroStrategy surged alongside Bitcoin’s breakout above $78,000 as renewed bullish momentum swept through crypto markets, while dramatic developments around Iran and the Strait of Hormuz injected fresh geopolitical tension into an already volatile news cycle.
Bitcoin is back in control, and when the market leader starts pushing higher with conviction, traders notice fast, and so do stocks like MicroStrategy that trade as leveraged proxies for BTC exposure.
At the same time, geopolitical tension tied to Iran and the Strait of Hormuz is adding another layer of uncertainty to risk markets. That kind of backdrop rarely leaves crypto untouched, but it can sharpen the divide between assets that are already priced in and newer opportunities that are still being discovered.
Bitcoin Breakout Keeps Bulls in Charge
Bitcoin is trading around $78,198.67 after gaining 4.71% in 24 hours and 7.25% over the past week. That is not just a bounce; it is the kind of move that starts to reset sentiment across the entire market.
The price action still shows active trading, with a wide intraday range between roughly $74,045 and $78,022. That tells you buyers are engaged, but the breakout still needs to prove it can hold. For now, the bias is clearly bullish.
MicroStrategy Still Benefits From Bitcoin Strength
MicroStrategy remains one of the clearest public-market ways to express a Bitcoin view. As BTC pushes higher, the stock tends to attract attention because it gives investors amplified exposure to the same upside narrative.
That said, MicroStrategy is still a slower-moving trade compared with the kind of early-stage upside investors chase in a presale. It is credible, liquid, and tied to Bitcoin’s direction, but much of that story is already understood by the market.
Why the Strait of Hormuz News Matters
The latest headlines around the Strait of Hormuz are a reminder that cross-border payments and global finance still rely on slow, expensive intermediaries. Banks, remittance rails, and legacy settlement systems move money across borders, but they do it with friction.
That is exactly why crypto payment projects are starting to draw more attention. When the world feels unstable, people look for faster settlement, fewer middlemen, and a simpler way to move value across borders.
Remittix Is Built for That Problem
Remittix is going after a very specific use case: sending crypto that arrives as fiat in a bank account. It bridges crypto and traditional banking using real-time conversion and local payment networks, so the user does not have to deal with the usual mess of wallets, exchanges, and manual cash-out steps.
That simplicity is the point. Freelancers, businesses, and global users do not need another blockchain narrative; they need money to arrive cleanly, quickly, and in the right currency. In a cross-border payments market this large, direct crypto-to-bank functionality is a much sharper pitch than generic infrastructure talk.
The investment case is straightforward too. Real-world utility plus an early-stage presale creates a stronger upside setup than an already mature asset like Bitcoin or a market-known proxy like MicroStrategy. Bitcoin is credible, but it is also more priced in. Remittix is earlier, more focused, and still being discovered.
The project does carry execution risk, as any payments product does. Adoption, partnerships, and market conditions will decide how far it goes. But the combination of utility and timing is what is starting to separate it from the average crypto presale.
Why Remittix Is Starting to Stand Out
Remittix is not trying to be everything to everyone. It is solving one practical problem: making crypto usable in the banking system without forcing users through extra steps.
That narrow focus is why it is drawing serious attention as a leading presale and a top ICO-style opportunity. The presale has already raised $30M, the wallet is live on the Apple App Store, and the team is KYC verified. Those are not guarantees, but they do matter because they separate real progress from empty hype.
In a market where Bitcoin is already established and MicroStrategy is already understood, the bigger upside may sit with the asset that is still early and still underpriced by the market.
If you want the more explosive setup, early positioning matters. Waiting for full confirmation usually means paying up later.
MicroStrategy is treated as a high-beta Bitcoin proxy, so when BTC strengthens, the stock often gets a lift from traders looking for amplified exposure.
What is Bitcoin trading at right now?
Bitcoin is trading around $78,198.67, after a 4.71% gain in the last 24 hours and a 7.25% rise over the past week.
What does Remittix actually do?
Remittix lets users send crypto that is converted in real time and delivered as fiat into a bank account, using local payment networks to make cross-border transfers simpler.
Why is Remittix being compared with Bitcoin and MicroStrategy?
Bitcoin and MicroStrategy are established names with credibility, but Remittix is earlier-stage and tied to direct real-world payments, which gives it a higher-upside presale profile.
HBAR is flashing early reversal signals just as momentum begins to build around its institutional narrative. After months of sustained downside, the token is now stabilizing within a key demand zone, with price action tightening and downside pressure fading.
At the same time, Hedera’s growing traction among enterprise players like Google and IBM is bringing the asset back into focus, aligning fundamentals with a shifting market structure. With broader crypto sentiment showing early recovery signs, HBAR is starting to re-enter the spotlight, and the current HBAR price outlook suggests that a decisive move could be closer than expected.
Big Data Narrative: Institutional Layer Supports Base Formation
Hedera’s positioning within the enterprise ecosystem continues to differentiate it from purely speculative assets. The network’s association with major players such as Google and IBM reflects ongoing development around real-world use cases, particularly in areas requiring high throughput and low-cost infrastructure. This creates a fundamental layer of demand that remains intact even during price weakness.
As market conditions stabilize, capital typically rotates toward projects with visible adoption and institutional alignment. HBAR’s current price stabilization near its demand zone coincides with this narrative, suggesting that accumulation may be driven by longer-term positioning rather than short-term speculation.
HBAR Price Analysis: Downtrend Exhaustion With Early Breakout Setup
HBAR’s price structure shows a clear transition from trend continuation to stabilization. After a prolonged descending channel, price has stopped printing lower lows and is now consolidating within a defined base. This indicates that downside momentum is weakening, with sellers no longer able to push price significantly lower.
The structure is compressing near the upper boundary of this range, while short-term EMAs are flattening, a signal that bearish pressure is fading. A sustained move above the immediate resistance zone and descending trendline could trigger a continuation toward the $0.10–$0.12 region, where previous supply remains active.
On the downside, the $0.085–$0.09 zone continues to act as a key support. Holding this level maintains the base structure, while a breakdown would invalidate the current setup and extend consolidation. The current formation reflects a base-building phase with breakout conditions developing, rather than an active downtrend.
Derivatives Data: Positioning Shifts as Price Holds
HBAR’s derivatives data shows a transition in positioning rather than a confirmed trend reversal. Short positions have dominated across recent sessions, reflected in consistent negative long/short imbalances. However, the ratio is now moving closer to neutral, with intermittent spikes favoring long positions.
This indicates that while the broader market remains cautious, long exposure is gradually increasing. At the same time, price has stabilized instead of reacting lower to bearish positioning. This divergence suggests that selling pressure is being absorbed, while early accumulation is taking place.
If long positioning continues to build alongside stable price action, it increases the probability of an upside move driven by positioning shifts rather than immediate sentiment change.
Outlook: Structure Builds as Market Conditions Improve
HBAR is no longer extending its downtrend and is instead forming a stable base supported by both technical and fundamental factors. With price holding key levels, derivatives positioning gradually shifting, and institutional narratives remaining intact, the asset is entering a phase where a directional move becomes more likely.
A confirmed breakout above resistance of $0.1020 would validate the transition toward recovery, while continued consolidation would indicate further accumulation.
Iran’s Parliament Speaker Mohammad Bagher Ghalibaf has criticized U.S. President Donald Trump, accusing him of making “seven false claims in one hour” and warning that the Strait of Hormuz may not remain open if the U.S. blockade continues.
The statement comes just a day after Iran’s announcement to complete the opening of the Strait of Hormuz for all.
Iran Speaker Slams Trump Over “False Claims”
According to Iranian officials, Trump made several major claims about the situation that Tehran strongly denies.
Ghalibaf said the US has not gained any real advantage through its statements and warned that negotiations would not move forward based on what he called false information.
These include:
He said the US “did not achieve success with these claims and will not succeed in negotiations either.”
He warned that if the US blockade continues, the Strait of Hormuz may not stay open.
He added that all ship movement in the Strait will follow designated routes and require Iranian approval.
He said authorities will decide the Strait’s status and rules on the ground, not on social media.
He also pushed back on what he called a “media war,” saying the Iranian public is not fooled by what he described as public opinion engineering from the other side.
On the nuclear front, Iran’s Foreign Ministry made it crystal clear that enriched uranium is going nowhere. Not to the US, not anywhere.
Iran rejected all of these points, saying they are “false” and part of an attempt to control how people see the situation. Ghalibaf said the real situation on the ground differs completely from what others are claiming.
Crypto Market in the Crossfire, Brace for Volatility
Rising Iran–US tensions are putting crypto markets directly in the crossfire again. Yesterday, when Iran first announced the Strait’s full reopening, it acted bullishly, jumping over 5%, while Bitcoin rallied to $78K.
However, Altcoins followed the rally to as sentiment flipped from fear to relief almost overnight.
But geopolitical calm in this region rarely lasts long.
Ghalibaf’s recent statement came after US markets had already closed for the weekend, giving traders no immediate place to react.
However, Bitcoin and the broader crypto market have given up some of their early gains and are now trying to find support to build a stronger base.
What Next in the US-Iran Conflict?
The two-week ceasefire will expire on April 22, while both sides have already accused each other of violations.
At the same time, the U.S. has not backed down militarily. President Donald Trump confirmed that the naval blockade on Iranian ports will remain in full force until what he called a “complete transaction” with Iran is finalized.
Worldcoin price has been on a consistent downtrend since the beginning, while the bulls have been exerting pressure at regular intervals. In times when the selling pressure is reducing, the price is down by 11% to $0.282. The token is underperforming a broader market rally and is primarily driven by a ‘sell-the-news’ reaction to its major protocol and high-profile partnerships with Tinder, Zoom, and DocuSign on April 17.
The WLD price is attempting a recovery after a sharp decline, but the bigger question remains—can this bounce actually hold, or is it just another trap for late buyers? While broader market sentiment shows signs of easing selling pressure, WLD continues to trade below key resistance levels. With price now approaching a crucial zone, traders are watching closely: is a breakout toward $0.30 possible, or will sellers regain control once again?
Worldcoin Stuck in a Strong Descending Trend
Ever since the start of the year, the WLD price has been trading within a descending parallel channel, forming consecutive lower highs and lows. It is following a pattern wherein the recovery is restricted below the previous resistance, and the latest push was also restricted at $0.32. Currently, the price is trying to defend the local support at $0.28, and if it manages to reclaim $0.29, a rise above $0.31 could be imminent.
After facing multiple supply zones, the buyers entered at $0.25 and pushed the price beyond $0.3. This suggests the presence of a support zone around this price range that may hold the rally in case of an extended pullback. Open interest is rising, hinting new positions are entering, while the funding rate is turning negative, indicating shorts are gaining control. Therefore, this suggests that the positions are building, but not the strength.
Meanwhile, RSI has bounced from the oversold range but is still below the strong bullish momentum zone. Besides, the MACD shows a drop in the buying pressure and hence is pointing towards recovery, but without strength. Hence, it may be said that traders are still bearish on the WLD price as new positions entering may not be long.
Will Worldcoin (WLD) Price Reclaim $0.32?
Worldcoin’s current bounce remains a reaction within a broader downtrend, and the next move will likely be decided around the $0.30–$0.33 resistance zone. A clean breakout and daily close above this range could shift short-term momentum, opening the door toward $0.38 and potentially $0.43.
However, failure to reclaim this level would reinforce the lower high structure, increasing the probability of a pullback toward $0.25, with a breakdown exposing $0.22 as the next downside target. For now, the bias remains cautious—strength needs confirmation, while rejection favours continuation lower.
Altcoin sentiment remains under pressure, and the data backs it. The CMC Altcoin Season Index is currently sitting at 37/100, firmly in Bitcoin season. Just a week ago, it was 34, and a month ago, 53, showing how momentum has faded. Compared to its yearly high of 78, the market is clearly far from an altcoin-driven phase, with most tokens still lagging Bitcoin.
But according to Michaël van de Poppe, this is exactly the kind of setup where reversals begin, and he’s leaning strongly bullish on altcoins from here.
“This Is the End Stage, Not the Beginning”
He says that 2025 has already acted as the bear market for altcoins. “The markets are approaching the end stage of the bear market… not the start,” he said, noting that most altcoins are down more than 90%.
While that drop makes sense after inflated valuations, he now sees the opposite problem. “Markets are currently underpricing the upside of altcoins massively,” he said, signaling his bullish stance on altcoins specifically at current levels.
On Bitcoin, he’s more neutral-to-bullish, suggesting the downside is likely done.
“The bear market of BTC rarely goes deeper… we’ve already hit that,” he added, implying Bitcoin has likely bottomed and won’t see major further downside.
Macro and Sentiment Starting to Align
He also pointed to macro shifts. Lower volatility in gold and oil typically supports risk assets, while equities lead the move. “Nasdaq vol up → more confidence → BTC to follow → altcoins to follow,” he explained.
Sentiment is another key factor. “The altcoin sentiment has seen the lowest read… nobody is interested,” he said, calling this a classic accumulation phase rather than a warning sign.
Why Altcoins Didn’t Run Earlier
Meanwhile, Benjamin Cowen provides a bigger outlook on why altcoins struggled in the first place. He argues the cycle lacked a proper altcoin season because Bitcoin topped without hype. Historically, in 2017 and 2021, Bitcoin topped with strong retail hype, which he calls “euphoria.” That excitement pushed profits into altcoins, triggering explosive alt seasons.
Without retail excitement, capital never rotated into altcoins. “When you top on apathy… there’s just no one left to sell the altcoins to,” he added, pointing to tight liquidity and a risk-off macro backdrop.
What Comes Next
Van de Poppe notes the setup is now changing. Bitcoin has likely bottomed, and altcoins could follow with stronger moves after a short lag.
“Bitcoin has bottomed… altcoins are violently following… the right time to accumulate is now.”
In short, the data explains why altcoins lagged, but if the cycle shifts, they may not stay quiet for long.
In an exclusive interview, Omri Raiter, CEO of RAKIA, has shed light on a massive cryptocurrency laundering ecosystem tied to state-backed actors — one that may be far larger than publicly reported.
Raiter challenges the widely cited figures, stating that “the real state-linked volume is materially higher,” suggesting the scale of activity extends well beyond the $3 billion benchmark often cited.
AI-Powered Intelligence Uncovers Hidden Networks
At the core of the discovery is RAKIA’s advanced intelligence platform, which uses AI-driven multisensory data fusion to analyze vast streams of information simultaneously.
Raiter explains, “where conventional blockchain tracing follows wallets, RAKIA connects those wallets back to real-world operators, devices, and infrastructure.”
This approach allows investigators to move beyond transactions and uncover the actual actors behind them — a critical breakthrough in identifying state-linked operations.
USDT on Tron Emerges as the Primary Rail
The interview also reveals a key operational trend: USDT’s dominance on Tron (TRC20) in these flows.
According to Raiter, “the operational state rail… runs overwhelmingly on USDT-TRC20,” highlighting how stablecoins have become the backbone of large-scale financial movement under sanctions.
While Bitcoin remains part of the ecosystem, particularly in mining and specific use cases, it is not the primary vehicle for day-to-day transactions.
Loopholes in Global Regulation
Despite increasing scrutiny, Raiter points to structural weaknesses in global crypto regulation that continue to enable illicit activity.
“By the time an address is designated, the funds have moved,” he notes, underscoring how reactive compliance systems struggle to keep pace with rapidly shifting wallets.
Unregulated exchanges and gaps in cross-chain monitoring further complicate enforcement, creating blind spots across the ecosystem.
Clear Signals of State Involvement
One of the most striking revelations involves activity during Iran’s prolonged internet blackout. Despite near-total civilian disconnection, RAKIA identified more than 1,100 active crypto nodes operating within the country.
Raiter states unequivocally, “this is direct state involvement. The infrastructure itself constitutes the evidence.”
The concentration of nodes in key strategic regions further reinforces the conclusion.
Crypto Payments Enter State Policy
The interview also highlights a major shift in how cryptocurrency is being used at the national level. RAKIA confirms that crypto-based toll systems are now operational in critical trade routes.
“It is real, it is operational, and it has been codified into Iranian law,” Raiter said, pointing to what he describes as a landmark moment in state adoption of digital assets.
A Defining Shift Ahead
From laundering networks to sovereign revenue systems, Raiter’s insights suggest that cryptocurrency is rapidly becoming embedded in state-level strategy.
The implications are significant: as enforcement struggles to keep up, the role of digital assets in geopolitical and financial systems is entering a new, more complex phase.
Strategy, the world’s largest corporate Bitcoin holder, has proposed a key change to its STRC preferred stock. The change is made to the dividend payments from monthly to semi-monthly to improve liquidity and stabilize the price.
Michael Saylor’s proposal was filed on April 17, and voting is expected to conclude by June 8.
Why Is Strategy Doing This?
Strategy’s Chairman and bitcoin supporter, Michael Saylor, stated that the proposed changes are meant to “stabilize price, dampen cyclicality, drive liquidity, and grow demand.”
Right now, STRC shareholders receive their dividend payments once a month. Strategy wants to change that to twice a month, thus investors would get paid every two weeks instead of waiting a full 30 days.
The annual dividend stays the same at 11.5%, no cut, no increase. Only the payment timing changes, from annual payout to smaller chunks.
Saylor says that getting paid more frequently means investors do not have to wait as long to reinvest their dividends. That reduces what is called “reinvestment lag,” which is the gap between receiving a payment and putting it back to work.
Complete Timeline for Semi-Monthly Dividends
In an annocunemnt saylor has outlined the full roadmap, step by step:
April 17, 2026 — Preliminary proxy filed with the SEC
April 28, 2026 — Definitive proxy filing expected, opening the voting window
June 8, 2026 — Voting closes
June 30, 2026 — New semi-monthly schedule takes effect
July 15, 2026 — First-ever semi-monthly dividend payment made to STRC holders
Lastly, shareholders will need to vote to approve this amendment before any of it becomes official.
Schiff Threatens Saylor with Lawsuits
Recently, Coinpedia News reported that Bitcoin critic and gold advocate Peter Schiff has been vocal in his concerns about STRC, calling the stock’s overall structure “misleading to constitute fraud.”
He has warned that if dividends are ever cut or the stock price falls significantly, investors could find themselves filing lawsuits against the company.
His main concern was that the money from STRC is used to buy Bitcoin, and if Bitcoin falls, it may become hard to keep paying those dividends.
As of now, Strategy’s STRC stock has seen a slight rise and is trading around $99.21. This uptick comes as geopolitical tensions ease after Iran fully reopened the Strait of Hormuz, improving overall market sentiment.
At the same time, the bitcoin price also jumped to $78k, while other large-cap altcoins jumped by 6 to 10%.
A new memecoin, Asteroid, has taken the crypto market by storm, jumping from a tiny $50K market cap to over $20M+ in just hours. Data shared by Arkham shows how quickly the token went parabolic, leaving traders scrambling to understand what just happened.
What is Asteroid Shiba (ASTEROID)
Unlike typical meme coins, Asteroid carries an emotional backstory. Radio host Glenn Beck shared Liv’s story publicly. It’s based on a Shiba Inu plush designed by Liv Perrotto, a 15-year-old who sadly passed away after battling cancer. Her creation wasn’t just a toy; it actually flew as a zero-gravity indicator on a space mission.
Before her passing, Liv had one dream: to connect with Elon Musk. One of her final questions stood out:
“Can you make Asteroid… the mascot for SpaceX?”
Musk replied :
“Will answer shortly.”
That was enough to ignite a market rally. Traders quickly piled in, betting on the possibility that Musk might acknowledge or even adopt the idea. As one trader described it:
“Degens are betting 5-6 figure positions that Elon Musk will make $Asteroid the mascot of SpaceX.”
From there, traders and whales amplified the move. According to Lookonchain, one early buyer held through 580 days of near-zero value, turning a $21K position into nearly $392K after the surge. On the other hand, a fast-moving trader flipped just 1 ETH into over $470K within hours by entering right after Musk’s comment.
At the same time, some market participants noted that such Musk-driven narratives tend to run stronger on Ethereum due to deeper liquidity, adding more fuel to the rally.
Why is ASTEROID Price surging?
This rally wasn’t driven by fundamentals; it was pure narrative power.
“It’s not just a memecoin… It’s a story with emotion, space, and community.”
The mix of a heartfelt story, space exploration ties, and Musk’s involvement created the perfect storm for virality.
What Next For Asteroid Shiba?
Right now, everything depends on one thing: whether Musk follows up.
“This is pure narrative-driven momentum… what happens next depends on if Musk responds.”
If the hype continues, the token could see further volatility. If not, momentum may fade just as quickly. In crypto, moments like this prove one thing: sometimes, a single reply is all it takes to create millions.
U.S. spot Bitcoin ETFs saw $663.9 million in net inflows, the strongest since January. BlackRock’s iShares Bitcoin Trust led with $284 million, extending its eight-day buying streak and pushing total holdings to around 803,000 BTC. Fidelity and ARK also posted solid gains. The steady inflows show growing institutional demand. Meanwhile, spot Ethereum ETFs added $127.4 million, with $30.8 million flowing into BlackRock’s ETHA, signaling continued investor interest.
Crypto Analyst Tony Edward spoke with Patrick Witt, Executive Director, President’s Council of Advisors for Digital Assets at the Solana Policy Institute summit, where Witt gave a grounded update on the Clarity Act and what’s actually coming next behind the scenes.
Witt made it clear that the stablecoin issue almost blocked the bill completely. That’s when the White House stepped in to mediate between banks and crypto companies, trying to find language both sides could live with.
“We had to step in there and serve as a mediator… bringing the banks and crypto companies together… and ultimately get it to a place where we felt like it was ready to hand back over to the Senate… not to say either side is thrilled about it.”
He explained that this wasn’t about making everyone happy; it was about getting enough agreement to move forward. Banks wanted stricter rules if crypto firms act like banks, while crypto players didn’t want extra layers added at all. The final version sits somewhere in between.
The Clarity Act Timeline Is Tight
Witt didn’t sugarcoat the timeline either.
“Just working backwards from the August recess… you realize you have to take action now to get this out of the banking committee.”
From here, the bill still has to clear the Senate, go through reconciliation, and pass the House before reaching Donald Trump. There’s still a process, and it’s not a short one.
What Happens After the Crypto Bill Passes
Once the Clarity Act is done, the focus shifts quickly.
“I would say on the legislative front, the next one up would be crypto tax… if there’s an opportunity… we would certainly seize that.”
But Witt focussed that passing the bill is just step one. The real work comes with implementation.
“These are going to be very hotly contested rulemakings… it’s going to require months and in certain cases years.”
Agencies like the SEC and CFTC are already coordinating closely so they don’t end up redoing rules later.
Bitcoin Reserve Update Coming Soon
On the Strategic Bitcoin Reserve, Witt gave a clear hint that updates are close.
“We’ll be making an announcement on that probably in the coming weeks… or next month or two.”
That includes both executive actions and new legislation tied to Bitcoin, showing it’s still very much in progress alongside the Clarity Act.
Wall Street Is Already Moving
Witt also pointed out something important: traditional finance isn’t waiting around.
“They recognize that this is part of the product suite that they’re going to need… to compete in this new era.”
Banks and financial firms are already building, hiring, and exploring blockchain integrations.
Put simply, the Clarity Act is just the first big step. What follows, tax rules, regulations, and Bitcoin strategy, is where things really start to take shape.
XRP holds a strong demand zone at $1.30–$1.40. If support remains intact, the token could shift from consolidation to recovery as broader crypto market momentum builds..
Long-term forecasts suggest XRP could reach $5–$6 by 2026 and potentially $18 by 2030, driven by institutional adoption, Ripple partnerships, and global payment integration
Ripple (XRP) Ripple’s XRP remains one of the most closely watched assets in the crypto market, largely due to its strong positioning in the cross-border payments sector and the continued expansion of Ripple’s financial infrastructure. Over the years, Ripple has focused on building partnerships with banks and payment providers to streamline international settlements through blockchain technology. XRP’s long-term outlook continues to revolve around global payment integration, institutional partnerships, and the adoption of RippleNet and On-Demand Liquidity solutions. These developments could gradually strengthen XRP’s role as a bridge asset for international payments.
XRP price structure around $1.30–$1.40 has emerged as an important demand zone where buyers have shown consistent interest. If this area continues to hold, the market could gradually shift from consolidation to recovery. With the broader crypto market entering another potential expansion phase, XRP remains positioned as one of the major altcoins that could benefit from renewed institutional and retail participation. Now, making this the most ideal time for XRP price prediction 2026-2030 to be in more focus. Read this to know in depth what’s coming next in XRP.
As April progresses, XRP’s price action reflects a market that is gradually transitioning out of a prolonged corrective phase, with structure beginning to stabilize near the $1.20–$1.30 demand zone. After months of consistent lower highs within a descending channel, the recent compression near support suggests that selling pressure is fading while buyers are starting to step in more actively.
XRP is now trading just beneath a descending resistance trendline, with price tightening into a narrow range as volume begins to rise. This combination of compression and increasing participation typically precedes a directional move, placing the asset at a critical breakout point.
The immediate focus now lies around the $1.60–$1.80 region. A sustained move above this zone would confirm a breakout from the descending structure, opening the path toward the $2.20 level, followed by a potential extension into the $2.10–$2.50 supply zone if momentum continues to build. This aligns with the broader structure where reclaiming lost resistance levels becomes key to shifting sentiment.
However, the structure still requires confirmation. If XRP fails to break above the trendline and faces rejection, the price may continue consolidating within the current range. A breakdown below the $1.30 support could weaken the setup, potentially pushing the asset back toward lower support levels and delaying the recovery phase.
In this context, XRP in April may reach the $2.20–$2.50 range if the breakout sustains, while failure to confirm strength could keep the price range-bound near current levels as the market builds further momentum.
CoinPedia’s XRP Price Prediction 2026
The broader price structure for XRP in 2026 suggests a market transitioning out of a corrective phase, but still awaiting confirmation of a sustained trend reversal. Following its rally in previous cycles, XRP peaked near the $3.50 region before entering a prolonged downtrend, defined by a descending resistance structure and consistent lower highs throughout 2025. This trend has carried into early 2026, with price recently stabilizing near the $1.20–$1.30 demand zone as selling pressure begins to ease.
At this stage, the focus shifts toward whether XRP can reclaim key resistance levels and attract renewed demand. The immediate barrier remains at $1.70, followed by stronger resistance at $2.50 and the major supply zone between $2.60–$2.80. Beyond technical structure, regulatory and institutional catalysts are likely to play a decisive role in XRP’s trajectory through 2026.
Developments around U.S. crypto legislation, particularly frameworks such as the CLARITY Act, aimed at defining digital asset classifications, could provide long-awaited regulatory certainty. For XRP, which has been heavily influenced by legal outcomes, clearer classification could significantly improve institutional confidence and unlock broader participation.
At the same time, ongoing expansion of Ripple’s enterprise payment solutions and XRP Ledger (XRPL) integrations in cross-border settlement continues to strengthen its real-world use case. Any acceleration in adoption among financial institutions or payment corridors could act as a direct demand driver. Additionally, increasing discussion around spot crypto ETF expansion beyond Bitcoin and Ethereum introduces a longer-term narrative tailwind. While speculative at this stage, any progress toward broader altcoin ETF inclusion could materially shift liquidity flows toward assets like XRP.
If these catalysts align with a breakout above key resistance levels, XRP could transition into a recovery phase. A sustained move above $2.50 would signal structural improvement, with a breakout above $3.80 opening the path toward the $6.00–$9.50 range over time. However, until both regulatory clarity and technical confirmation materialize, XRP remains in a transitional phase. Failure to hold the $1.20 support could extend consolidation and delay upside momentum.
Recent News/Catalysts for XRP
Progress around U.S. crypto regulation, especially frameworks like the CLARITY Act, is improving sentiment around XRP’s long-standing legal overhang.
Expansion of XRP utility across payment corridors and enterprise integrations continues to strengthen its real-world demand narrative.
Ongoing XRP Ledger upgrades and ecosystem developments are enhancing network efficiency and institutional readiness.
Improving macro sentiment and broader market recovery are supporting renewed capital rotation into large-cap altcoins like XRP.
XRP On-Chain Outlook
XRP’s on-chain data is currently pointing toward a cooling market environment, where activity has slowed but structural conditions are quietly improving. Spot trading volume across exchanges has dropped to its lowest level since 2024, reflecting reduced participation and weaker short-term momentum. This decline indicates that the market is no longer driven by aggressive trading, but is instead moving through a low-liquidity consolidation phase. At the same time, liquidity remains concentrated on major platforms like Binance, Upbit, and Coinbase, suggesting that while overall activity has declined, core market interest is still intact.
On the derivatives side, a more significant shift is unfolding. XRP’s leverage and open interest in Binance have dropped sharply, signaling a major reset in speculative positioning. The estimated leverage ratio has fallen substantially from previous highs, while open interest has cooled to much lower levels. This indicates that leveraged traders have largely exited or reduced exposure, removing excess risk from the market.
This combination of declining spot activity and reduced leverage suggests that XRP is transitioning from a highly speculative phase into a cleaner, more stable structure. With the market now less crowded and less prone to liquidation-driven volatility, the current setup reflects a reset phase, where pressure is building more gradually.
Overall, XRP’s on-chain signals point toward a market that is not weakening, but resetting after excess, creating conditions that often precede a more sustainable and directional move once momentum returns.
Ripple (XRP) Price Prediction 2026 – 2030
Year
Potential Low ($)
Potential Average ($
Potential High ($)
2026
3.40
6.50
9.50
2027
7.50
10.00
12.00
2028
8.80
11.50
16.00
2029
14.20
19.00
22.00
2030
18.80
23.00
30.00
Ripple (XRP) Price Prediction 2026
The XRP price range in 2026 is expected to be between $3.40 and $9.50
XRP Price Prediction 2027
Ripple (XRP) price range can be between $7.50 to $12.00 during the year 2027.
XRP Price Forecast 2028
In 2028, Ripple is forecasted to potentially reach a low price of $8.80, an average price of $11.50, and a high price of $16.00.
XRP Price Targets 2029
Thereafter, the XRP price for the year 2029 could range between $14.20 and $22.00.
Ripple (XRP) Price Prediction 2030
Finally, in 2030, the price of XRP is predicted to remain steady and positive. It may trade between $18.80 and $23.00.
Based on historical market sentiment and trend analysis, the following are the possible XRP price targets for longer-term time frames.
Year
Potential Low ($)
Potential Average ($)
Potential High ($)
2031
25.00
29.50
35.25
2032
31.50
36.75
41.25
2033
35.75
42.25
47.75
2040
97.50
135.50
179.00
2050
219.25
331.50
526.00
Market Analysis
Year
2026
2027
2030
Changelly
$3.00
$6.50
$17.76
DigitalCoinPrice
$4.20
$7.50
$18.00
WalletInvestor
$4.80
$7.90
$20.00
Never Miss a Beat in the Crypto World!
Stay ahead with breaking news, expert analysis, and real-time updates on the latest trends in Bitcoin, altcoins, DeFi, NFTs, and more.
FAQs
What is the XRP price prediction for 2026?
XRP could trade between $3 and $6 in 2026 if crypto market momentum strengthens and Ripple expands partnerships with banks using RippleNet and ODL.
How high will XRP go in 2030?
XRP could potentially reach $18–$30 by 2030 if the crypto market enters a strong bull cycle and Ripple expands global payment partnerships.
What is the price prediction for XRP in 2031?
Market projections suggest XRP could trade around $25–$35 in 2031, depending on global crypto adoption and Ripple’s continued growth in payment infrastructure.
How much will 1 XRP be worth in 2040?
If adoption of blockchain payments grows and Ripple strengthens its financial network, XRP could trade between $97 and $179 by 2040.
How much will 1 XRP be worth in 2050?
Long-term projections indicate XRP could reach $219–$526 by 2050 if blockchain payment networks become widely used across global financial systems.
What could drive XRP’s price growth long term?
XRP’s long-term growth may depend on global payment adoption, institutional partnerships, and wider use of Ripple’s blockchain infrastructure.
Is XRP a good investment?
XRP may be a promising investment due to its role in cross-border payments and growing institutional adoption, but price volatility and regulation risks remain.
DOGE price prediction for 2026 suggests potential highs of $1.25
Long term forecasts indicate DOGE could reach $3.00 by 2030.
Dogecoin continues to hold its position as one of the most widely recognized meme-driven assets in the market, supported by strong community backing, increasing integration in payment use cases, and periodic attention from high-profile endorsements. While it does not rely on deep protocol-level fundamentals like traditional Layer-1 networks, its strength lies in liquidity, accessibility, and its ability to capture retail-driven momentum during favorable market cycles.
At the same time, its 2026 price structure reflects a shift from prolonged decline toward early stabilization. After trending lower through 2025, DOGE has started forming a base near key demand zones, with price compressing within a defined range rather than continuing downward. This change in behavior suggests that selling pressure is easing, while accumulation is gradually building beneath resistance.
This sets up a familiar pattern. When Dogecoin transitions from low-volatility consolidation into expansion, the move tends to be sharp and sentiment-driven rather than gradual. The current structure indicates that the market is approaching that decision point.
In this Dogecoin price prediction 2026–2030, we will break down how this evolving structure, combined with market momentum and adoption trends, could shape DOGE’s long-term trajectory. Keep reading for more clarity.
Through April, Dogecoin is trading near the $0.095–$0.10 range, reflecting a steady consolidation phase after a prolonged downtrend. The highlighted accumulation zone on the chart continues to act as a reliable base, with buyers stepping in consistently each time price approaches this region. This repeated defense suggests that the market is no longer in aggressive selling mode, but rather in a phase of absorption. As long as this base holds, the structure remains stable with a slight upward bias.
On the upside, the immediate hurdle sits around $0.105–$0.11, which aligns with short-term resistance formed during recent recovery attempts. A sustained move above this level could trigger fresh momentum, allowing DOGE to push toward the $0.13–$0.15 range, where previous rejections have occurred and supply may re-enter.
The structure, however, is still in development. If the breakout extends with volume support, the next area to watch would be near $0.18, although such a move would likely require broader market strength and improved sentiment across altcoins. On the downside, a breakdown below the $0.095 support could weaken the current structure, with price potentially drifting toward the $0.085 region. This would indicate that the consolidation phase needs more time before any meaningful expansion.
For now, April appears less about sharp upside and more about whether DOGE can convert this accumulation phase into a breakout—because once that happens, the move tends to follow quickly.
Coinpedia’s Dogecoin (DOGE) Price Prediction 2026
Moving into the broader 2026 outlook, Dogecoin’s direction will likely be shaped by how the overall crypto cycle develops. Historically, DOGE has not required strong fundamentals to rally, it tends to respond quickly once liquidity and attention return to the market.
A move above $0.15–$0.18 would be the first sign that sentiment is shifting. From there, the next important zone lies around $0.30–$0.35, which could act as a mid-cycle barrier. If DOGE manages to maintain strength above this region, the structure begins to look more constructive, opening the door for a move toward $0.45–$0.50. Such a move would likely depend on broader market participation and renewed interest in meme-driven assets.
At the same time, if Dogecoin price struggles to hold above $0.08, the recovery timeline could extend, keeping DOGE in a longer consolidation phase. Overall, 2026 may not be about explosive moves initially, but rather about gradual rebuilding, with upside accelerating only if market conditions align.
Recent News/Catalysts for Dogecoin (DOGE)
Whale accumulation has picked up near the $0.09–$0.10 zone, signaling renewed confidence and supporting price stability.
Improving broader market sentiment, led by Bitcoin strength, is creating a supportive backdrop for meme coins like DOGE.
Rising social activity and renewed speculation around payment integrations (especially linked to X ecosystem) are driving retail interest.
Increased trading volume during consolidation suggests accumulation rather than distribution at current levels.
Dogecoin Price Prediction 2026 – 2030
Year
Potential Low ($)
Potential Average ($)
Potential High ($)
2026
0.75
1.00
1.25
2027
1.15
1.35
1.50
2028
1.25
1.75
2.00
2029
1.50
2.15
2.65
2030
2.50
2.75
3.00
This table, based on historical movements, shows DOGE price to reach $3 by 2030 based on compounding market cap each year. This table provides a framework for understanding the potential DOGE price movements. Yet, the actual price will depend on a combination of market dynamics, investor behavior, and external factors influencing the cryptocurrency landscape.
Dogecoin (DOGE) Price Prediction 2026
As per Dogecoin’s Price forecast for 2026, the high price could be $1.25, the low may reach $0.75. This makes the average around $1.00.
Dogecoin Price Prediction 2027
Moving to 2027, the DOGE Price projects that it might hit a high price of $1.50 potentially. With a $1.15 low and an average of $1.35
DOGE Coin Price Prediction 2028
Moving to 2028, the Dogecoin Price Forecast predicts a high price of $2.00. On the flip side, the low may fall to $1.25, and the average is projected to be around $1.75.
DOGE Price Prediction 2029
As per Dogecoin Price Forecast 2029, DOGE’s high price is predicted to be $2.65, with a low of $1.50 and an average of $2.15.
Dogecoin (DOGE) Price Prediction 2030
Finally, as per the Dogecoin Price Forecast 2030, DOGE’s price can reach a high price of $3.00. With a low of $2.50 and an average of $2.75.
Pi is trading between $0.165 and $0.178 and has been stuck there for weeks. The price story is bearish, but everything around it is not.
Where the Price Stands
The important level to watch is $0.171. Until Pi closes a daily candle above it, the recovery thesis stays on hold. Resistance stacks up quickly above that level:
20-day EMA at $0.175
50-day EMA at $0.181
100-day EMA near $0.19
The one constructive signal in the charts is the MACD, which has flattened to zero for the first time since February. That indicates selling pressure is fading. It does not confirm that buyers have arrived yet, but the shift in momentum is worth noting.
The Upgrade Deadline Nobody Should Miss
The most immediate event is the April 27 deadline for all node operators to upgrade to Protocol 22. Miss it, and nodes get disconnected from the network. No exceptions.
This deadline is part of a broader upgrade sequence that is moving faster than most Pi holders realise:
April 22: Protocol 22.1 rollout begins the upgrade cycle
April 27: Hard deadline for Protocol 22 compliance
May 18: Protocol 23 expected to introduce smart contracts
Beyond that: Early signals point to a push toward Protocol 26 before Pi2Day
Developers are already being told to prepare their applications for smart contract compatibility. That is a meaningful shift in what Pi could support as a platform.
The Fundamentals Stacking Up
Away from the price chart, three developments stand out this week:
18 million KYC-verified users. Pi continues to argue that its user base is different from that of every other crypto network. These are confirmed humans, not wallet addresses.
A whale accumulated 350 million PI. Large accumulation at current prices signals someone with long-term conviction is buying the range rather than exiting it.
Co-founder Chengdiao Fan confirmed for Consensus Miami on May 6. She will speak specifically about Pi’s verified identity network and its AI-era utility vision. This is Pi’s most significant mainstream stage appearance of the year and the kind of visibility the project has rarely had outside its own community.
The Headwind That Keeps the Rally Capped
None of the positives above changes one structural reality. Approximately 230 million PI tokens are set to unlock over the next 30 days. That is consistent sell pressure entering the market regardless of what the MACD is doing or how bullish the whale activity looks.
What to Watch
Pi is expected to hold the $0.165 to $0.18 range through the remainder of April. A daily close above $0.1715 opens the path toward $0.20, according to analysts. A genuine recovery signal requires a sustained move above $0.19.
Whale accumulation and exhausted bearish momentum suggest a floor is forming. The upgrade deadline, the smart contract roadmap, and the Consensus Miami appearance give the project genuine catalysts to work with.
Whether the price responds to any of them this week is the question every Pi holder is sitting with.
Jake Claver has an interesting answer to the question of where Ripple ends up on the global financial stage by 2040 to 2050.
“I think they will be the Goliath, the Amazon of payments and banking infrastructure,” he said. “Potentially even sooner with the acquisitions they made in 2025 and into 2026.”
The acquisitions he is referring to tell a story on their own. GTreasury for cash management. Ripple Prime, formerly Hidden Road, for clearing and prime brokerage. Rail for stablecoin issuance and managementRipple Custody, formerly Metaco and Standard Custody, which carries a trust-chartered bank and BitLicense in New York.
Put together, Claver describes Ripple as already functioning as a global infrastructure provider for backend payments and settlement. But he argues the endgame is something bigger.
Will XRP Holders Actually Hold to $10 and Beyond?
Claver was asked directly what percentage of retail XRP holders would sell before the token reached $10. His estimate was pointed.
“Probably 30 to 50% of people holding a significant amount of XRP will likely liquidate at least a portion,” he said.
His reasoning reflects the reality of who holds the asset. Globally, approximately 250,000 people hold more than 3,000 XRP. For many of them, a $10 price would represent a life-changing sum. Taking profits at 5x or 10x is rational behaviour, not weakness.
The holders Claver works with directly understand the longer thesis and are less likely to sell early. He has also built products allowing holders to collateralise their XRP and generate returns without liquidating, removing the need to choose between holding long-term and accessing liquidity.
Ripple’s trajectory, in Claver’s telling, is not primarily a crypto story. It is an infrastructure story. The company is building the backend that every major financial institution will eventually run on, whether they acknowledge it or not.
The Amazon comparison is not accidental. Amazon built warehouses and logistics before most people understood why. Ripple is building settlement rails, custody infrastructure and liquidity direction before most banks are ready to admit they will need it.
Binance Wallet just launched perpetual futures trading on BNB Smart Chain, powered by derivatives venue Aster and tied to an Alpha Points campaign running
through April 28 per crypto.news. That puts Binance Coin right at the center of the exchange race, but the BNB price prediction for 2026 maps out consistent growth rather than the type of entry that flips a portfolio upside down.
Last cycle made millionaires out of the wallets that bought exchange tokens before anyone cared. Pepeto opens that same door with the Binance listing approaching and $9.04 million raised.
Binance Wallet Perps Go Live as April BNB Price Prediction Targets Take Shape
Binance Wallet rolled out leveraged perpetuals covering crypto pairs, blue-chip stocks, ETFs, and commodities on April 14, letting users trade straight from their keyless wallet on BNB Smart Chain per crypto.news. The launch followed the 34th quarterly burn that destroyed 1.37 million BNB worth $1.28 billion in January 2026.
The network extended fee-free stablecoin transfers through April 30 as well. These improvements support usage growth, but analyst forecasts still point to capped upside with Binance Coin sitting near $624.
Where the Real Gains Are Building While BNB Trades Flat: BNB Price Prediction, Pepeto, and the Best Entry This April
Pepeto: The Earliest-Stage Entry That Last Cycle Proved Works
Anyone who grabbed BNB at $0.15 in the 2017 ICO and held through the run watched a small bet become generational money. Those who missed it remember exactly how that opportunity felt, and Pepeto is handing the market that identical chance again. A Binance veteran leads the technical build, SolidProof completed a full review of every contract, and the original Pepe builder who shipped exchange infrastructure before this project runs the entire operation.
PepetoSwap works across Ethereum, BNB Chain, and Solana while a bridge shuttles tokens between networks without charging a fee. An AI scanner evaluates every contract before money gets close and kills threats at the door. Every swap, bridge, and scan runs through the Pepeto token, creating the same kind of organic buy pressure that pushed BNB from pennies past $624.
The 100x projection from the $0.0000001863 presale floor to the listing price is backed by over $9.04 million already committed, with 183% APY staking padding every wallet that holds. The BNB price prediction delivers respectable gains, but if the thought of missing BNB’s ICO still stings, this is the sharpest reset the market has handed out.
The Binance date is locked, the exchange products already run, and the price has not budged. Buying at this level and staking straight through to listing day is how early positioning becomes real profit. Step into Pepeto while this number still shows on the screen.
Binance Coin (BNB) Price at $624 as On-Chain Perps Add New Demand Layer
Binance Coin (BNB) trades at $624 per CoinMarketCap with a market cap above $84 billion. The chart fell from its October 2025 peak near $1,370 and now rests on support around $581. Changelly projects April between $616 and $671 per Changelly, while InvestingHaven sees $590 to $900 for the full year.
That means roughly 10% to 15% near-term upside. Quarterly burns keep shrinking the 136 million supply toward a 100 million floor, but the bnb price prediction sitting on an $84 billion base simply lacks the math to deliver presale-level multiples. Put $1,000 into BNB at $624 and you hold 1.6 tokens. Put that same $1,000 into Pepeto at $0.0000001863 and you hold over 5.3 billion tokens positioned right beneath the listing.
Conclusion
The BNB price prediction for April 2026 describes a mature asset grinding inside a narrow band because the market cap already absorbed the explosive phase. The wallets that got rich last cycle did not enter BNB at $624. They got in at $0.15 when the name Binance meant nothing to anyone.
Pepeto mirrors that exchange architecture with working products, a Binance listing date confirmed, and an entry number that has not shifted. Every wallet collecting 183% APY pads its stack while the listing clock ticks down. That same $1,000 giving you 1.6 BNB right now gives you over 5 billion Pepeto tokens sitting directly below the listing, and that spread is how exchange token wealth gets built. Once trading opens, this number is gone and the payoff belongs to the wallets that committed early. Step into Pepeto now before listing day locks this door forever.
What is the BNB price prediction for April 2026 after the Wallet upgrade?
Changelly forecasts Binance Coin between $616 and $671 this month, healthy growth from $624 but capped next to a presale still priced below a fraction of a cent. InvestingHaven sees up to $900 for the full year.
Can any crypto token repeat what BNB did from its $0.15 ICO entry?
Pepeto runs the same exchange token model that took BNB from $0.15 beyond $624, with the original Pepe builder at the helm and a SolidProof audit done. The presale price is $0.0000001863 with 183% APY staking and the Binance listing date confirmed.
Morpho price didn’t just wake up bullish, it kicked the door open. A sharp 20% intraday surge pushed Morpho price cleanly above the $2.0 resistance, and suddenly, a protocol once quietly building is now sitting in the spotlight with a “DeFi unicorn” badge stamped by France’s Ministry of Finance.
Morpho Declared France’s First DeFi Unicorn Project
Well, this isn’t just another price pump story because of some broader market optimism. But, Morpho has officially been recognized as France’s first DeFi unicorn, a milestone that carries more weight than the usual crypto hype cycle. Even more eyebrow-raising? It’s now the most valuable French startup per employee at $26 million, outpacing even Mistral AI’s $17 million. That kind of efficiency tends to get attention.
@Morpho is now a unicorn – a major announcement at the French Ministry of Finance.
“We are France’s first DeFi unicorn” – @faufleuret
Fun fact: Morpho is now the most valuable French startup per employee ($26M), ahead of Mistral AI ($17M). pic.twitter.com/1tRO8dAKKx
And just as the headlines hit, Morpho doubled down with another move as it is going live on LI.FI Earn. The integration means any app, wallet, or fintech platform can now tap directly into Morpho’s on-chain yield strategies across multiple chains. In simpler terms: accessibility just went mainstream.
But markets don’t care about narratives unless price confirms them. And right now, Morpho price is doing exactly that.
The breakout above $2.0 wasn’t subtle. It came with a 20% intraday move, backed by broader altcoin strength as Bitcoin’s rally continues to lift the market. Momentum is clearly leaning bullish, and if it sticks, the next psychological level sits around $3.0.
Still, nothing moves in a straight line. If price fails to hold above $2.0, a round of profit booking could drag it back down. That level now acts as the line in the sand now lose it, and the breakout starts looking shaky.
Technical Indicators Suggest Bullish Momentum Building Up
So, what’s under the hood? Surprisingly solid. The CMF has pushed above zero, signaling capital inflows rather than exits. The Awesome Oscillator has just flipped into positive territory, and not in an exhausted way infact it’s early, meaning momentum might just be getting started.
Then there’s MACD, which has crossed above the zero line with a bullish crossover. That’s not noise; that’s structure. And RSI? Sitting at 66. Not overheated, not sleepy but shows that price has just enough room to push higher before things get uncomfortable. Put it all together, and the indicators don’t exactly scream “imminent dump” at least for now.
Macro And Market Risks Still Lurking Beneath
Of course, here’s where reality taps you on the shoulder. This entire setup leans heavily on broader market stability. A sudden geopolitical shift something that’s already been driving volatility in 2026 could flip sentiment fast. And when sentiment flips, altcoins don’t ask questions; they react.
But for now, momentum is intact thanks to open strait of hormuz during the 10-days ceasefire period.
In line with the ceasefire in Lebanon, the passage for all commercial vessels through Strait of Hormuz is declared completely open for the remaining period of ceasefire, on the coordinated route as already announced by Ports and Maritime Organisation of the Islamic Rep. of Iran.
Morpho price has the narrative, the breakout, and the indicators backing it. Whether it holds above $2.0 or not will decide if this is just another spike or the beginning of something a bit more sustained for Morpho price.
After nearly two months of conflict between the US, Israel, and Iran, Iran finally declared the Strait of Hormuz “completely open” for all commercial vessels on April 17, 2026, sending a wave of relief across global markets.
Bitcoin responded almost instantly, jumping from around $75,000 to $78,000, a surge of nearly 5.2%, as investors rushed toward risk assets on the back of easing geopolitical tension.
What Iran’s Foreign Minister Said
On 17 April, Iranian Foreign Minister Abbas Araghchi took X to make the announcement official. He stated that in line with the ongoing ceasefire in Lebanon, all commercial vessels are now free to pass through the Strait of Hormuz for the remaining period of the U.S.-Iran truce, which is currently set to expire on April 22.
The move came one day after U.S. President Donald Trump announced a 10-day ceasefire between Israel and Hezbollah in Lebanon, a development that appears to have set off a broader chain of diplomatic easing across the region.
Trump welcomed the news almost immediately, posting on social media in capital letters:
“Iran has just announced that the Strait of Hormuz is fully open and ready for full passage. Thank you.”
"IRAN HAS JUST ANNOUNCED THAT THE STRAIT OF IRAN IS FULLY OPEN AND READY FOR FULL PASSAGE. THANK YOU!" – President Donald J. Trump pic.twitter.com/xDQpCj8APe
The Strait of Hormuz is not just another shipping lane. It is the single most important oil corridor on the planet.
Before the U.S. and Israel launched their military attack on Iran on February 28, 2026, roughly 20% of the world’s entire crude oil supply passed through this narrow stretch of water every single day. Along with a large share of global LNG exports, mostly from Qatar.
When Iran effectively shut it down in response to the attack, daily ship traffic collapsed from over 100 vessels per day to single digits. The economic damage was immediate and severe.
Now that the Strait is open again, oil and gas shipments can move normally. This helps stabilize supply, ease energy prices, and improve overall market confidence.
Bitcoin and Crypto React Fast
Crypto markets reacted quickly, with the total market cap rising about 5% to $2.63 trillion. Bitcoin also moved higher, jumping to $78,000 after bouncing from its recent range near $75,000.
Major altcoins followed the same trend, with Ethereum, Solana, XRP, and others gaining around 6% to 10%.
The move shows a clear “risk-on” shift, where improving sentiment pushes investors back into crypto and other high-risk assets.
Bitcoin price is back in the spotlight and not quietly either. After weeks of chop and hesitation, the broader crypto market flipped risk-on almost overnight, and suddenly, Bitcoin price is pushing into territory that traders were doubting just days ago.
So what changed? Not the charts alone. This one’s macro-driven.
Middle East Calm Sparks Risk-On Crypto Rally
Well, its a fact that geopolitics blinked first. The announcement that the Strait of Hormuz will remain open during a ceasefire eased one of the biggest overhangs on global markets. Oil traders reacted instantly. WTI crude dropped nearly 10% to $85.90, and just like that, risk appetite came flooding back.
Crypto didn’t hesitate. Lower oil prices typically signal reduced inflationary pressure and less systemic stress. Translation? Investors get comfortable taking on risk again. And crypto, as always, is first in line when that switch flips.
But let’s be real macro alone doesn’t push price unless the chart agrees. Bitcoin price breaking above $76,000 wasn’t just another move; it marked a clean reclaim of a critical resistance level. The asset is now hovering around $76,400, up roughly 3% on the day, and sitting at a 10-week high.
That matters. Because after early 2026 volatility, this kind of structure suggests something more stable is forming. Not euphoric, not parabolic seems like just controlled upside atleast in the shortterm. The kind institutions prefer.
Institutional Demand Quietly Builds Under The Surface
While retail was busy reacting to headlines, institutions kept doing what they do best its accumulating.
Total institutional Bitcoin holdings have now crossed 1.047 million coins, per soso value data. That’s not noise. That’s positioning.
Even during earlier corrections this month, accumulation didn’t stop. Which tells you something important: this isn’t a reactive market anymore but kinda feels it’s strategic.
Meanwhile, Ethereum is tagging along at around $2,380 (+2.1%), with growing anticipation around the upcoming “Glamsterdam” upgrade in May 2026. The promise? Throughput scaling up to 10,000 TPS. Whether that delivers or not is another story—but for now, sentiment is clearly leaning bullish.
Altcoins And Market Momentum Add Fuel
So, what’s next? Crypto top dogs like Solana is hovering near $145 and leading in open interest, suggesting traders are leaning heavily into altcoin exposure as well. That’s usually a sign the market isn’t just defensive but it’s expanding risk.
Add to that the timing of major industry events like Paris Blockchain Week wrapping up, and you’ve got a perfect cocktail of narrative, liquidity, and momentum.
– Full on suits – very few degens – Institutional heavy, banking, payment, compliance, taxes, consulting. Many working on infra and some kind of “on-boarding” kits for more businesses to adopt blockchain – more commercial… pic.twitter.com/OrCIfJVU3D
But don’t get too comfortable. Because markets don’t move in straight lines. And while the macro relief has flipped sentiment for now, any reversal in geopolitical tone or oil could just as quickly pull the rug. Still, for the moment, Bitcoin price has the upper hand. And the market? It’s finally acting like it believes it.
It’s 2026, and crypto is still booming. Despite all the naysayers and skeptics who believed it was a bubble, crypto has managed to stand the test of time. Is it far more volatile than traditional finance? Sure, but it looks like the world is more than willing to accept the trade-off for the many benefits it brings.
For instance, Yahoo Finance reports that Wall Street has now fully embraced stablecoins and tokenized assets. This is accompanied by a significant increase in funding, hitting over $19 billion in 2025. It represents a $9 billion increase compared to 2024.
That said, this increased acceptance of crypto also means that you have to face more competition. How do you build credibility in your new crypto project and ensure you are taken seriously by institutions and consumers? That’s exactly what we’ll find out today.
Recognize the Importance of Winning Trust
Arguably, one of the biggest challenges that still exists in the crypto world is safety and trust. While industries and institutions are warming up to crypto, the same cannot be said for consumers.
One survey by the Pew Research Center found that 63% of Americans aren’t confident in crypto’s reliability and safety. Even among individuals who have invested in crypto, only 19% said they were ‘extremely’ or ‘very’ confident about it.
Some new crypto startups feel like there’s no point trying to convince consumers who take a firm stance toward anything crypto. They pivot to approaching non-consumer clients like institutions and businesses, who tend to be a little more open and willing to take risks.
However, if your ideal consumer is the everyday American, you need to seriously think about addressing their points of concern. An overworked mom of three or a broke college student won’t trust you just because Wall Street and large companies do. You have to clearly demonstrate how using your product or service leads to a better experience compared to the existing options.
Market Your Firm Through the Proper Channels
This is an angle that few crypto startups consider. For some reason, a lot of advertisements for crypto products end up happening in sketchy places. You see them often in online casino gambling and adult websites. As you can imagine, this isn’t particularly helpful, reputation-wise.
As Proleo.io explains, your crypto marketing strategy forms a core part of your brand identity, and it’s something to take seriously. You want to be keenly aware of the different strategies that you can use to market your brand. The last thing you want is for consumers to assume you’re another shady crypto service.
If that image enters people’s minds, no amount of “100% secure” promises will help.
Thus, if you’re hiring a marketing agency for your startup, ensure you have oversight on where your exposure comes from. The fact is that poor-quality exposure will also get results, but you’re then balancing short-term vs. long-term gains.
Ensure Internal Reality Matches Your Advertised Claims
In a similar vein to proper marketing procedure, you want to ensure you make your claims carefully. It’s tempting to make attractive promises and statements to win over customers and clients, but this can seriously backfire. So many crypto startups have their marketing material sound like they’re a well-established platform. In reality, they are still in or just exiting the prototype stage.
While this may not be too much of a deal breaker for simple features and UI, it’s considerably important in other areas. So, if you keep promising people that your service is the safest out there and something happens, your credibility is gone. What’s more, the odds aren’t exactly in your favour.
As the FBI reports, the number of complaints related to crypto fraud reached over 69,000 in 2023 and continues to steadily increase. They also noted that the total losses from crypto fraud added up to over $5.6 billion in the same year. This was a 45% increase compared to losses in 2022.
Thus, go over things with a fine-toothed comb and make sure that your product delivers exactly what it promises.
All things considered, crypto products are seeing increased acceptance today. Sure, you’ll likely have an easier time selling to B2B clients at the moment, but that’s changing already. Of course, ensuring that the average consumer benefits and is willing to accept the risks of crypto is another thing.
Credibility is important in any business, but it feels like crypto is one of those fields where it’s almost a requirement. There are just too many preconceived notions about the industry right now, and crypto firms need to correct the record.
Payward, the parent company of Kraken, has agreed to acquire crypto derivatives firm Bitnomial in a deal worth up to 550 million dollars, structured in cash and stock. The acquisition strengthens Kraken’s broader Payward ecosystem by adding a fully regulated U.S. derivatives stack that includes brokerage, clearing, and exchange services under one roof. The move is seen as a major step in expanding compliant derivatives infrastructure and deepening its presence in regulated U.S. markets.
Michael Saylor’s Bitcoin strategy is facing fresh criticism as gold supporter and Bitcoin critic Peter Schiff threatens him with upcoming Lawsuits. He called Strategy’s STRC stock “misleading” and warned it could lead to fraud claims.
He also said investors may face losses and even file lawsuits if dividends are cut or the stock falls.
Schiff Threatens Saylor of Coming Lawsuits
The latest tension started after Michael Saylor shared his Bitcoin accumulation strategy on X. His company has been raising money through STRC perpetual preferred stock, which is designed to stay near $100 and pays monthly dividends with an annual yield of about 11.5%.
Peter Schiff strongly reacted to this move and criticized the structure. He said it could mislead investors and may even be seen as fraudulent.
He warned that if dividends are ever cut or stopped and the stock price falls, investors could sue the company.
“It’s so misleading to constitute fraud. Get ready for the lawsuits when the dividends are cancelled and the stock craters.”
Schiff also repeated his warning that Bitcoin-focused investment strategies carry high risk and said investors should be careful with such financial setups.
Strategy Is Not Slowing Down
Despite the criticism, Saylor has shown zero interest in changing course. Strategy recently used STRC-raised capital to purchase another 23,934 BTC worth $1.76 billion, pushing its total Bitcoin holdings to a staggering 780,897 BTC, valued at nearly $59 billion.
Saylor’s response to all critics has been dismissive:
“If this makes you uncomfortable, it’s working.”
Strategy Stock See Small Spike
Meanwhile, MSTR stock itself closed 3.76% higher at $148.94 on 16th April, helped by broader market optimism around the Israel-Lebanon ceasefire. Even Bitcoin, the world’s largest cryptocurrency, jumped to $76k now trading around $75K.
But MSTR’s short-term gains do not erase the underlying risks Schiff is pointing to with STRC.
But the real test comes during a downturn.
If Bitcoin falls or funding slows, pressure on STRC could rise quickly. And if dividends are touched, Schiff believes the fallout could be immediate.
Shiba Inu has triggered a decisive breakout from a symmetrical triangle, with bulls stepping in aggressively and momentum building fast. After weeks of compression, the move is now unfolding with rising volume, putting SHIB at a critical breakout zone.
With SHIB price already pushing higher, the setup is turning explosive. Can Shiba Inu (SHIB) extend this move into a sharp rally from here?
SHIB Price Outlook: What Do Charts Say?
With the breakout now confirmed, SHIB’s price action is transitioning from consolidation into a continuation phase, supported by improving trend structure and moving averages. The move above the symmetrical triangle marks a clear shift in control, with buyers sustaining price above the breakout zone rather than allowing a pullback. This is important, as holding above the breakout level signals acceptance and strengthens the probability of continuation.
SHIB is now beginning to print higher lows, indicating that buying interest is increasing and dips are being absorbed earlier. This change in structure reflects a gradual shift from a bearish to a bullish market phase. At the same time, moving averages are starting to align in favor of the bulls. The 20-day EMA is now acting as immediate dynamic support, while the 50-day EMA is flattening, suggesting that downside momentum is fading and the trend is stabilizing.
As long as SHIB continues to hold above its breakout zone and maintains support above key moving averages, the structure remains favorable for continuation, with momentum likely to build gradually into the next phase of the trend.
Volume Spikes as Traders Rush Back In
Building on this breakout, underlying market data now reflects a clear rise in participation. Derivatives volume has surged by over 54% to nearly $249 million, while open interest has climbed toward $64 million, indicating fresh capital entering the market. This suggests traders are positioning early for continuation rather than reacting late to price.
At the same time, the long/short ratio remains balanced, keeping the structure stable and reducing the risk of overleveraged positions. Meanwhile, continued exchange outflows signal reduced selling pressure, reinforcing the accumulation trend behind this move.
All Eyes on Resistance – Rally or Rejection?
With structure and momentum aligning, SHIB now enters a decisive phase where key levels will determine the next move. The immediate hurdle sits near $0.0000065–$0.0000072, a zone that has previously capped upside. A strong move above this range could accelerate momentum toward $0.0000075, followed by the broader target near $0.0000080.
On the downside, the breakout zone around $0.0000060 now acts as critical support. Holding this level is essential to sustain the current trend, while a breakdown could pull price back toward the $0.0000058 region. With price positioned between confirmation and rejection, the setup is clear, a breakout continuation could trigger a sharp rally, while failure may lead to a quick reset.
Hyperliquid’s HYPE token has surged to a 2026 high of $45, rising over 108% from its yearly low. The rally is driven by strong trading activity, rising RWA open interest of $2.3 billion, and record daily revenue since February. Market attention is also on the upcoming HIP-4 upgrade, which may introduce binary options trading. The Hyperliquid Assistance Fund bought 37,000 HYPE tokens worth $1.6 million, supporting its buyback and burn program. Net inflows over 90 days exceeded $950 million overall.
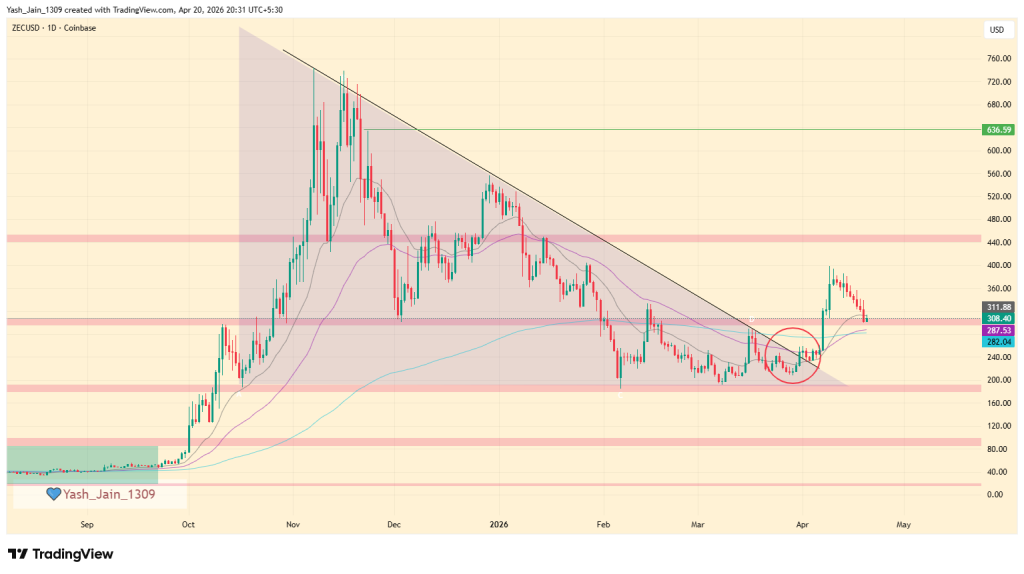
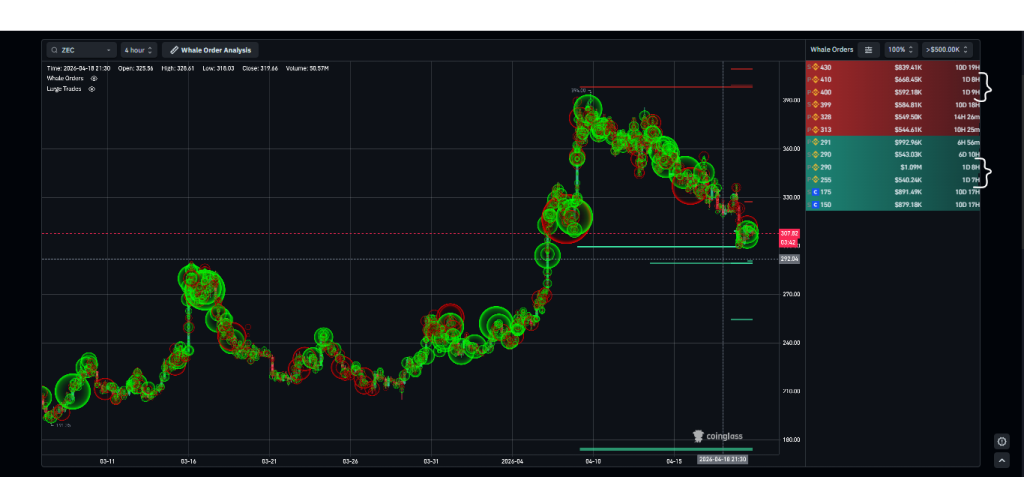
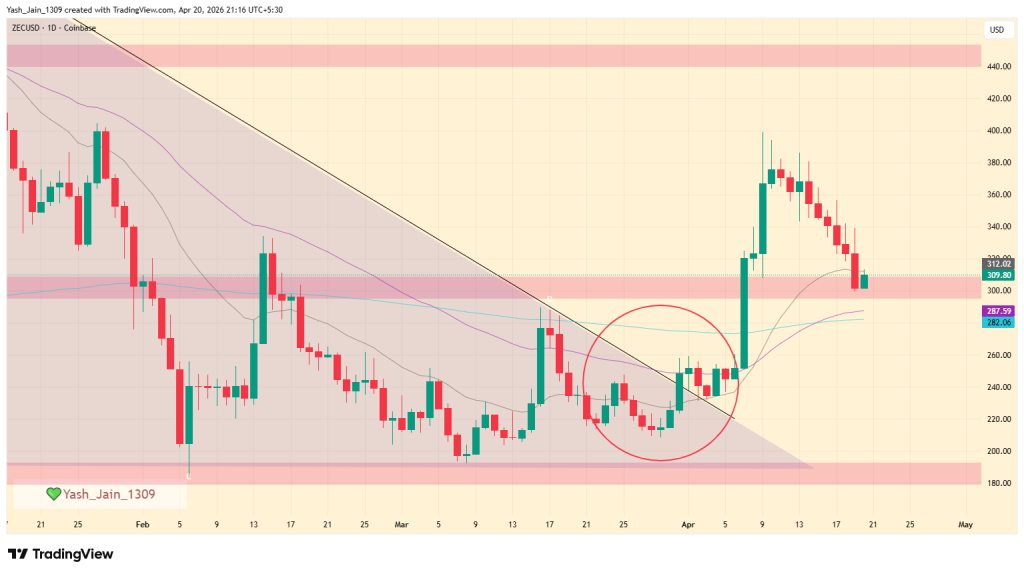

 are the entry point to SportFi.
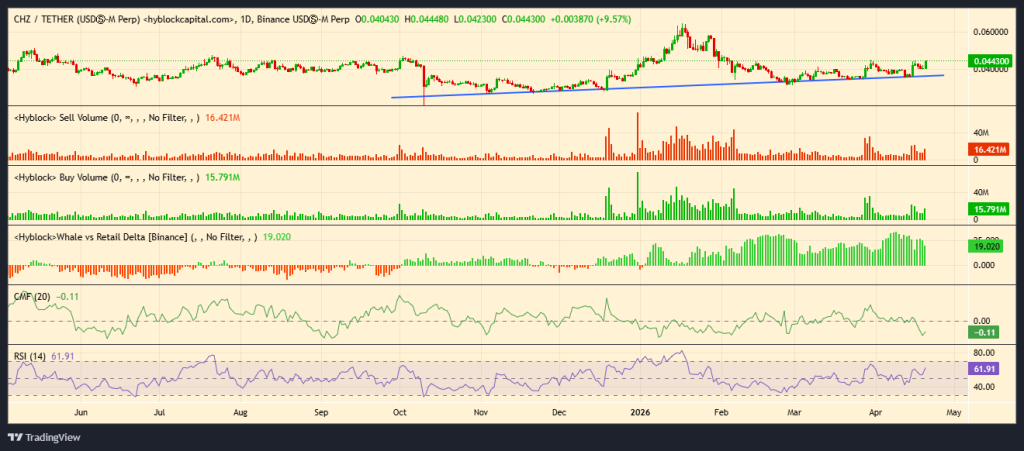


 THE
THE 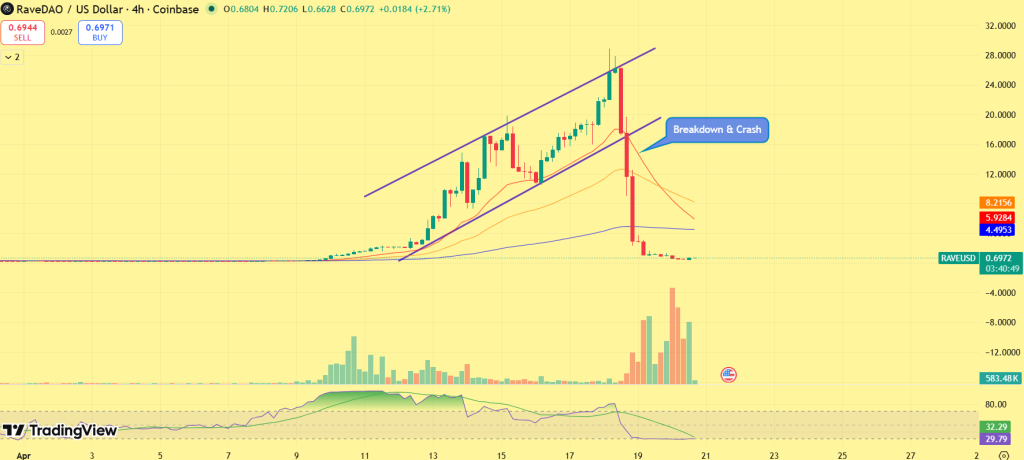
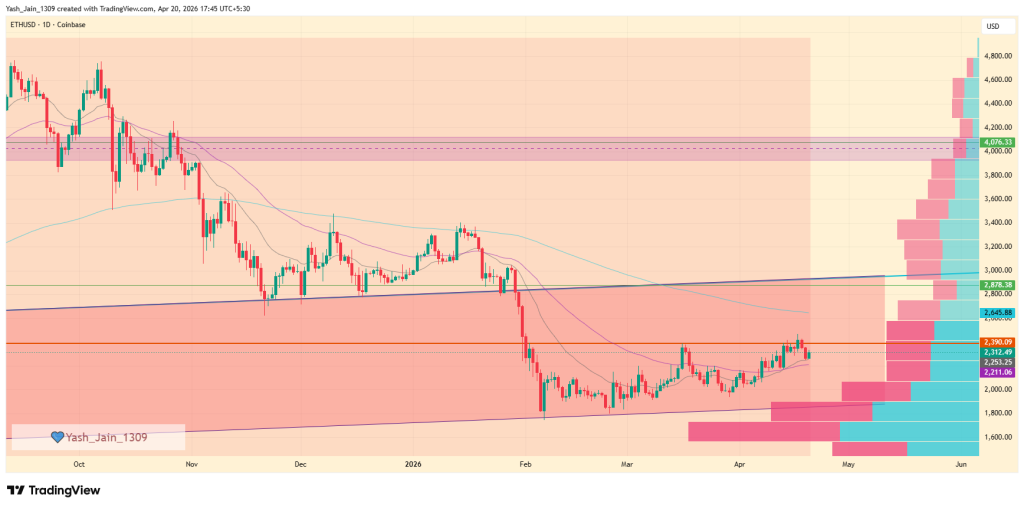


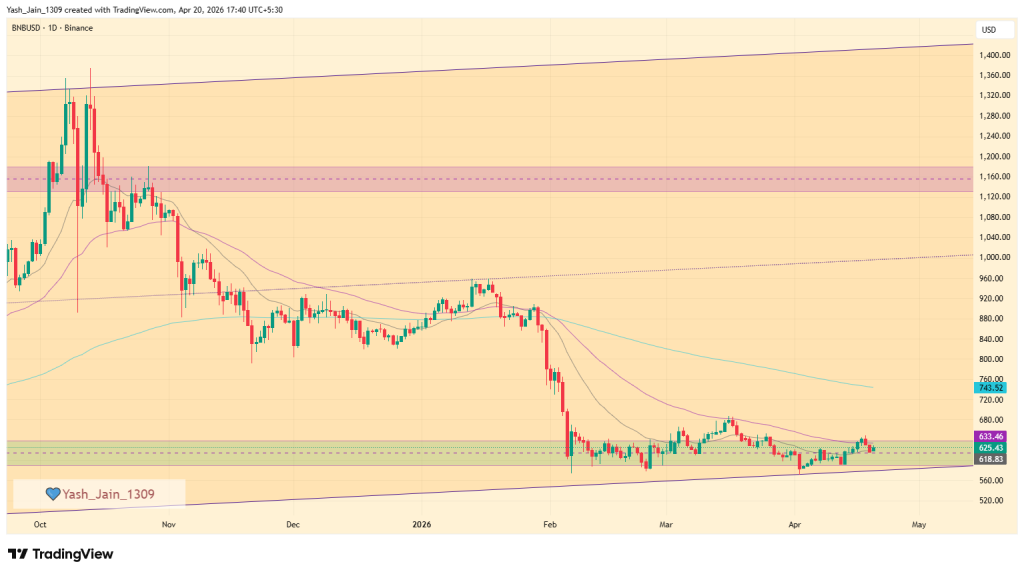
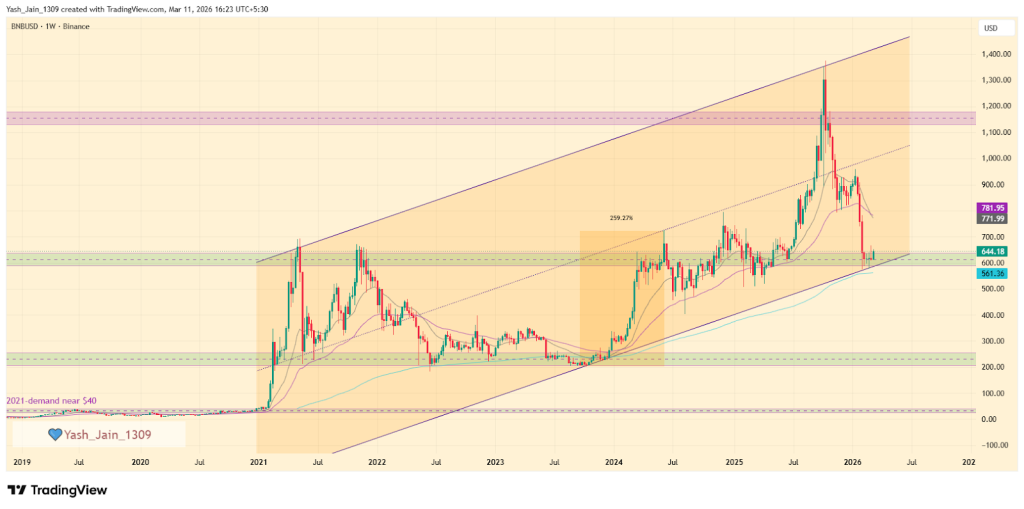
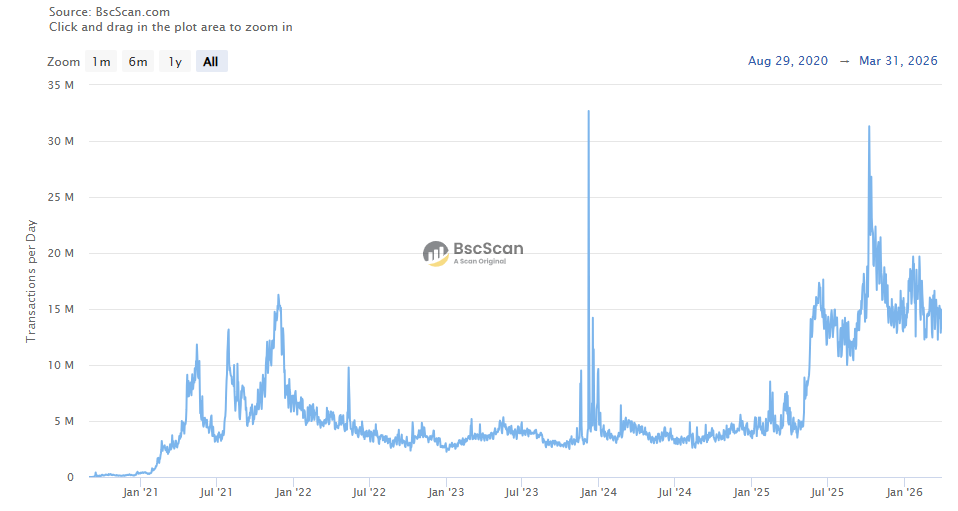
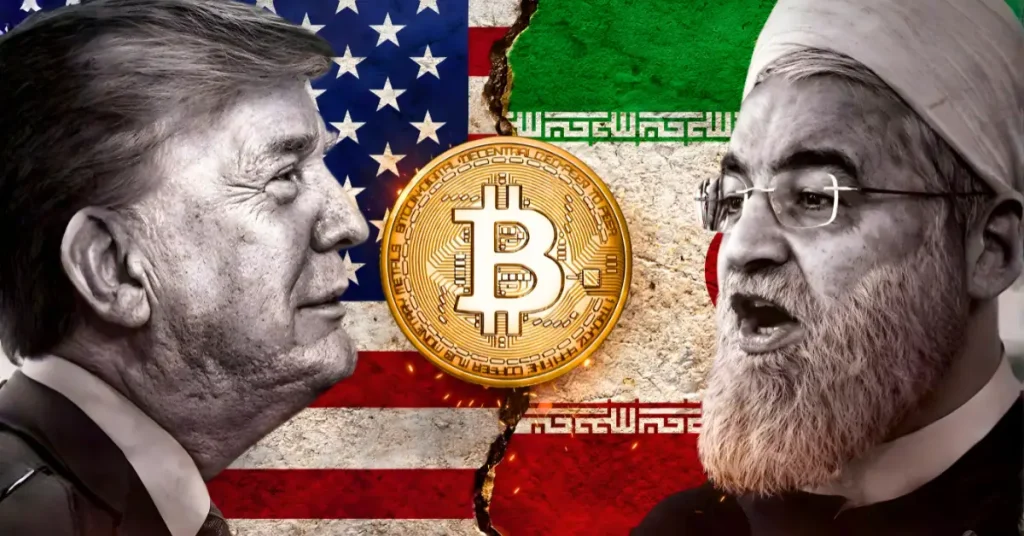

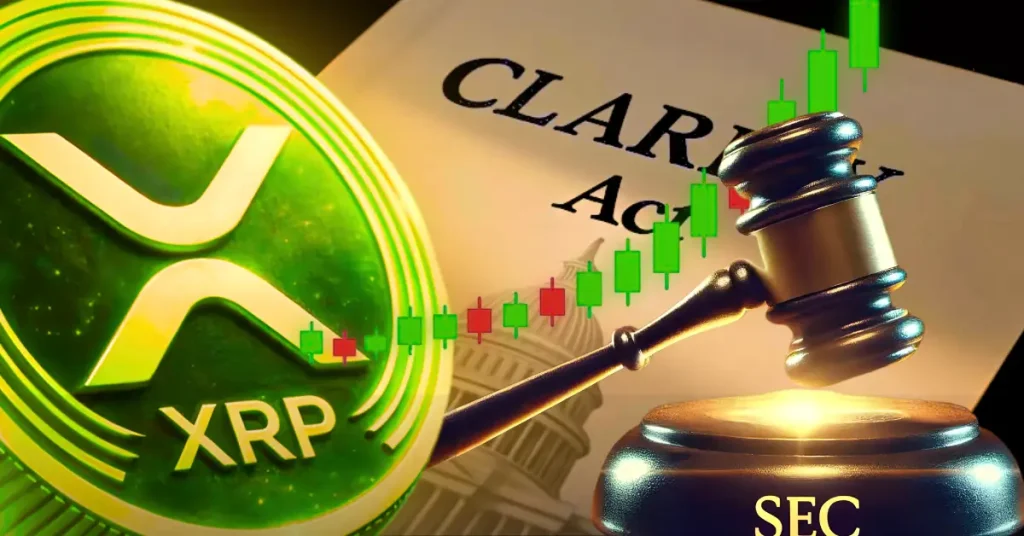

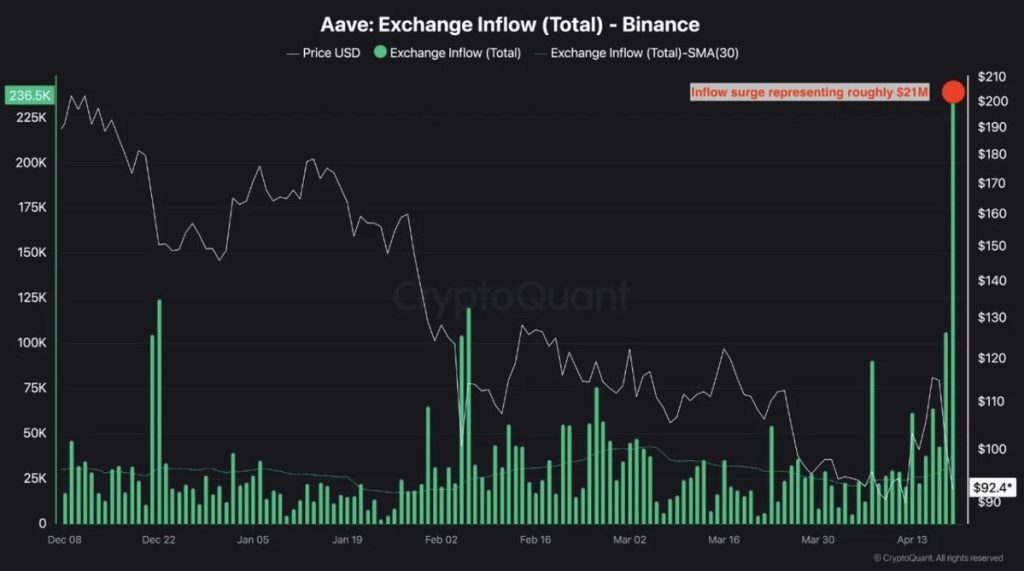
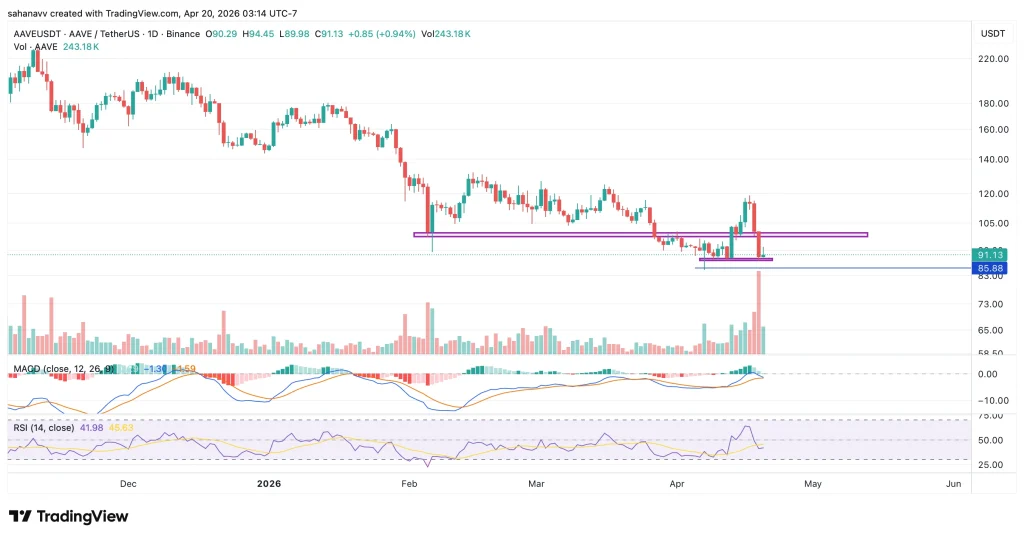
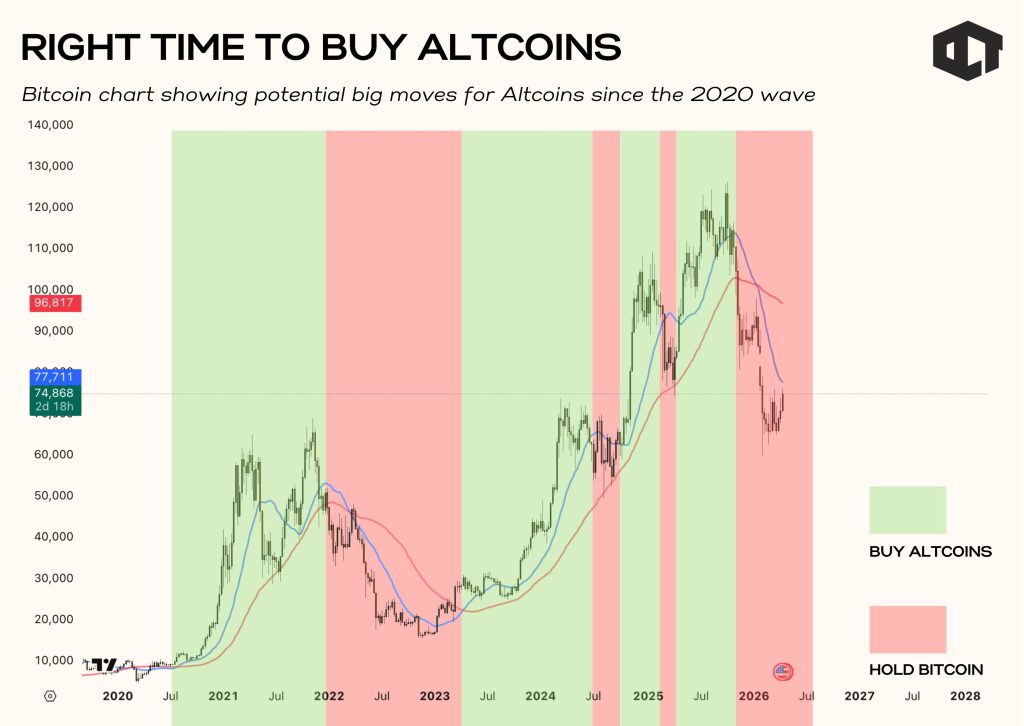
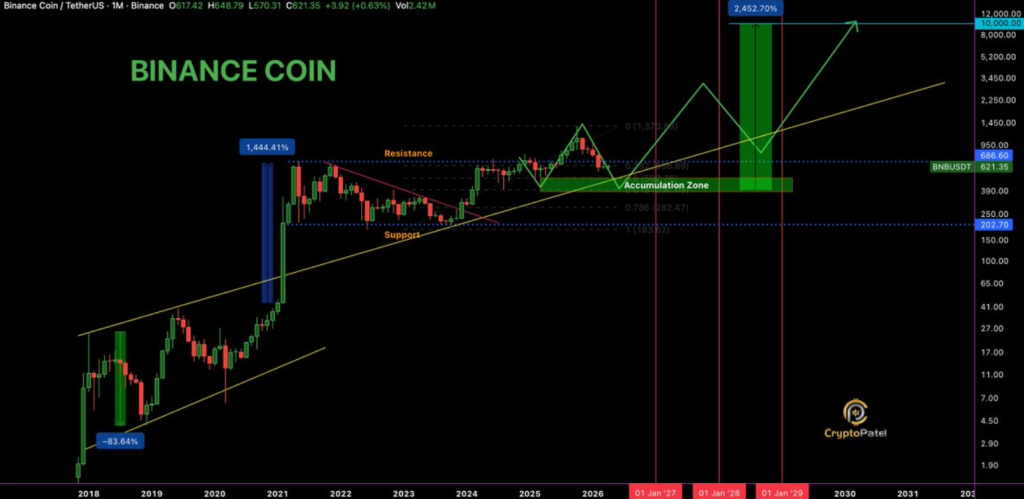
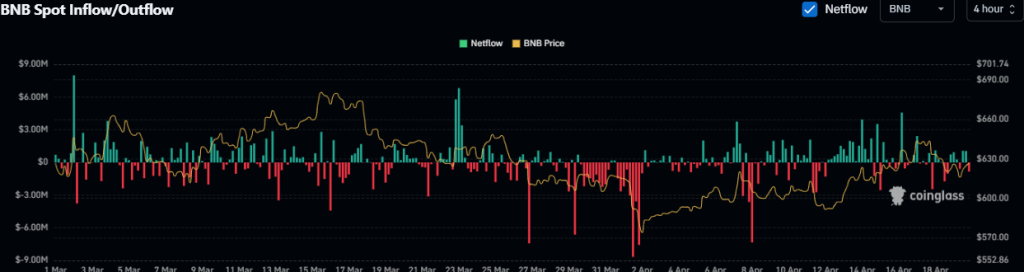
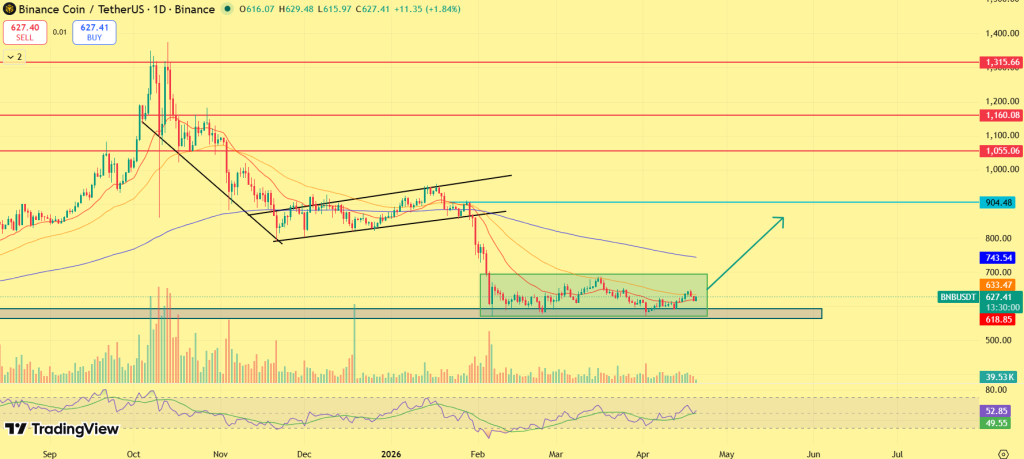


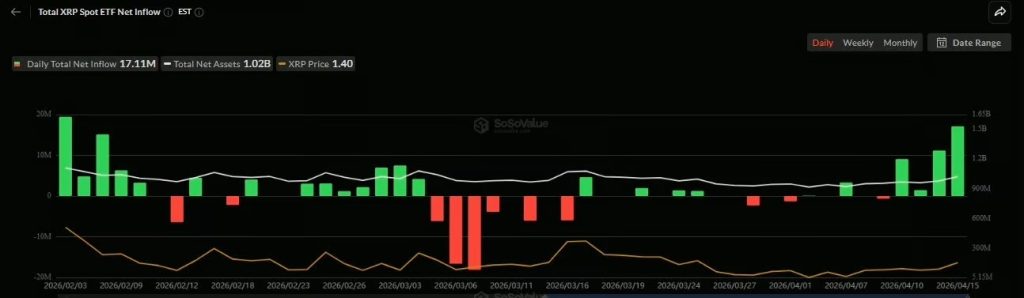
 BANK OF JAPAN DUMPED $2.86B IN U.S. TREASURIES
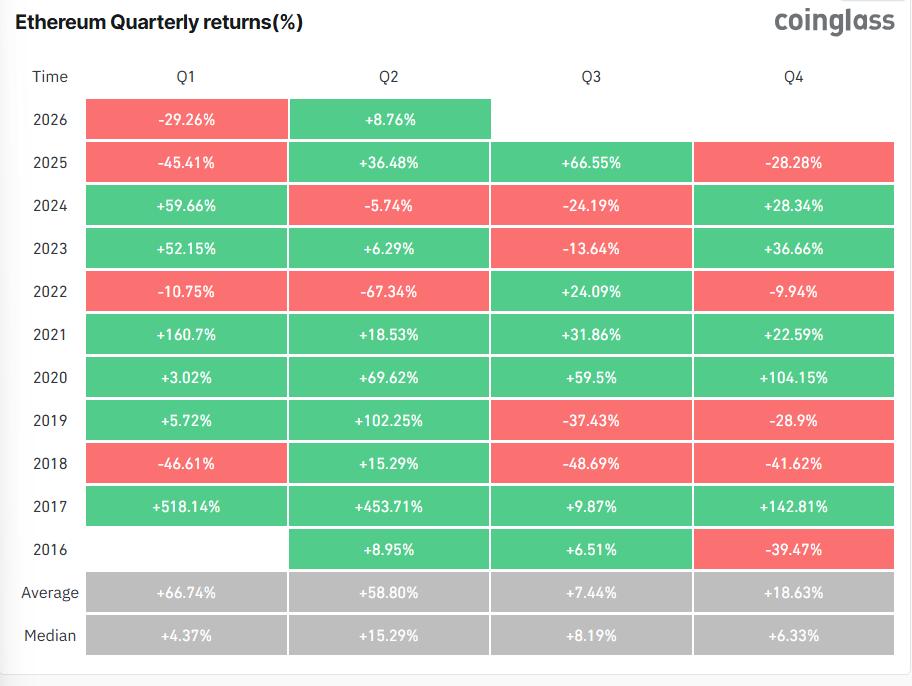
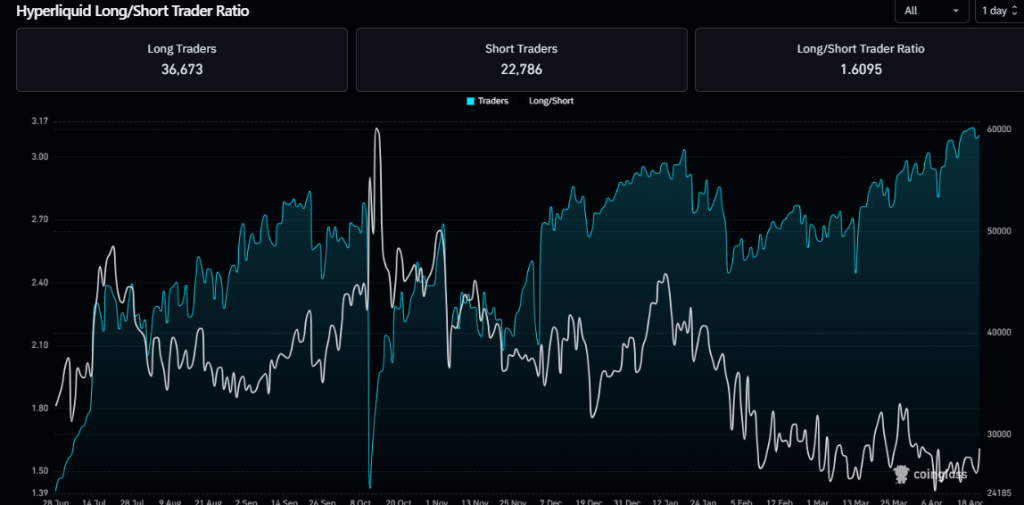
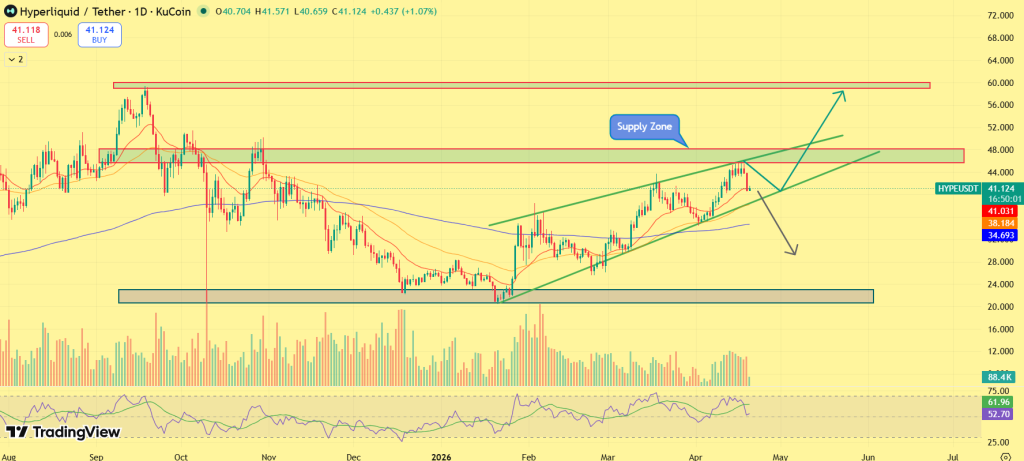
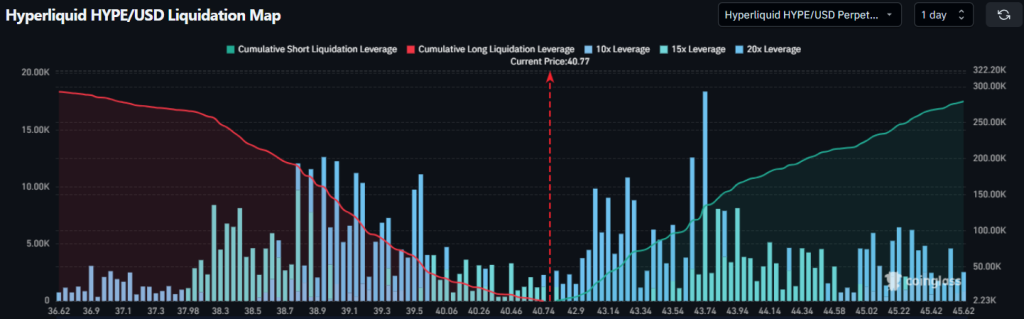

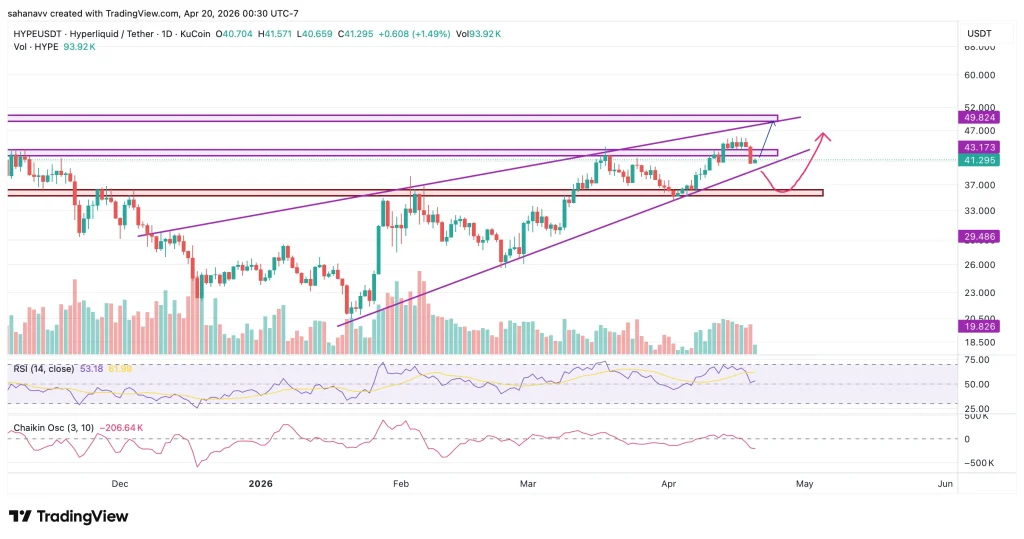


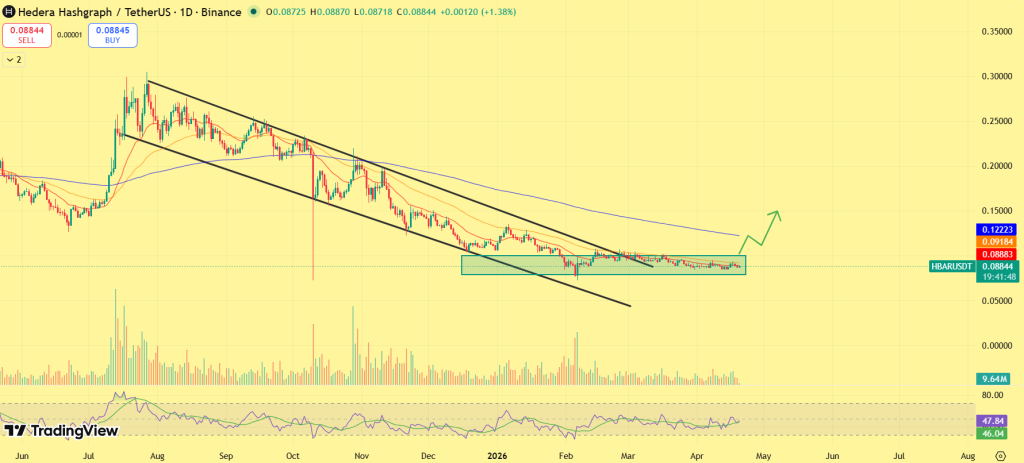


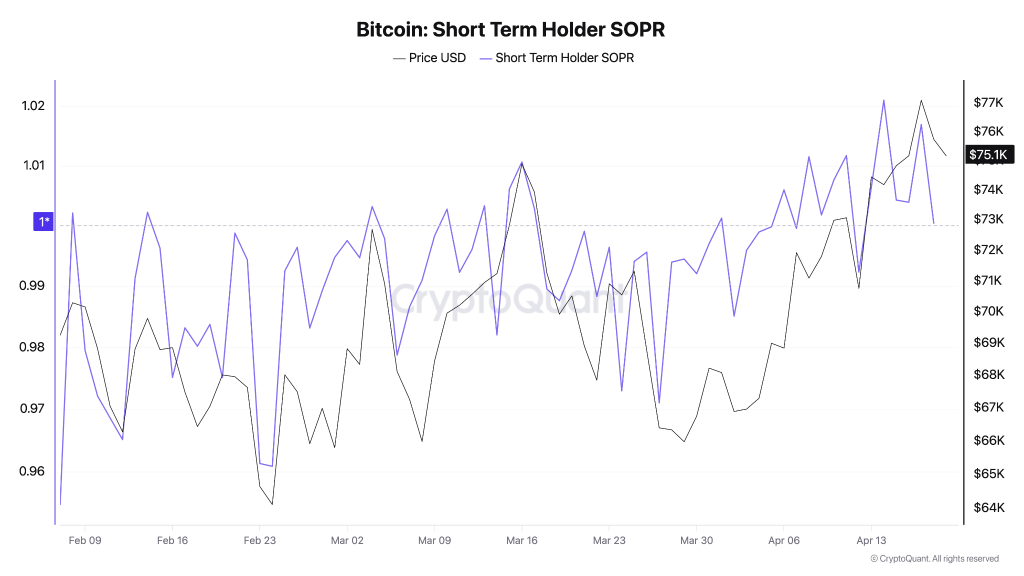
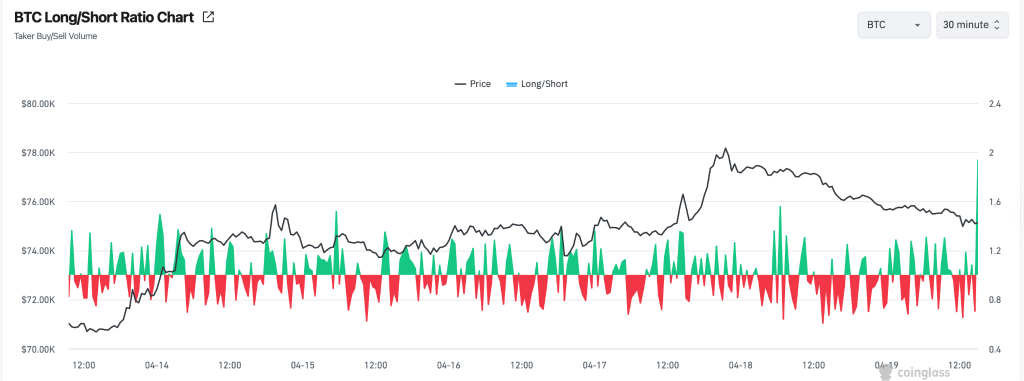
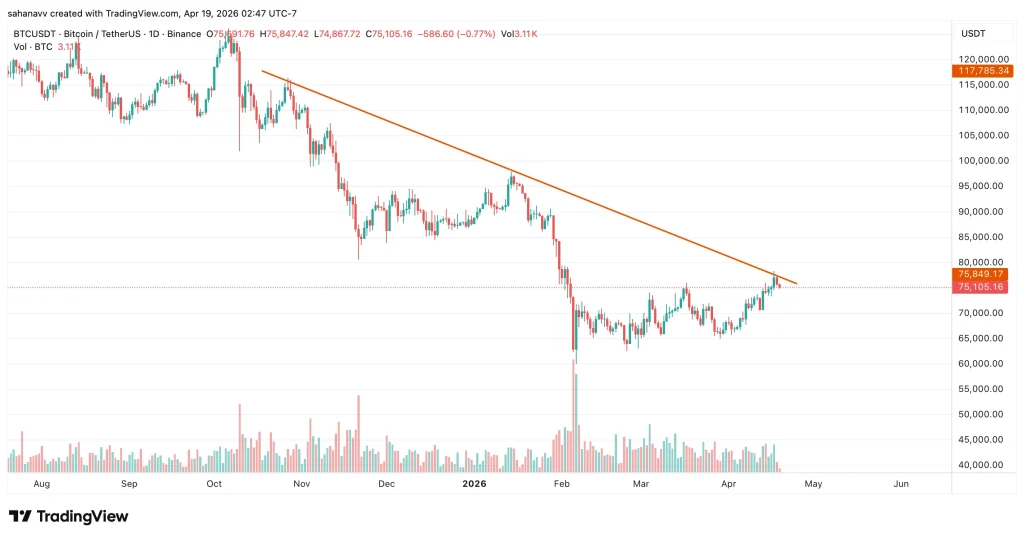
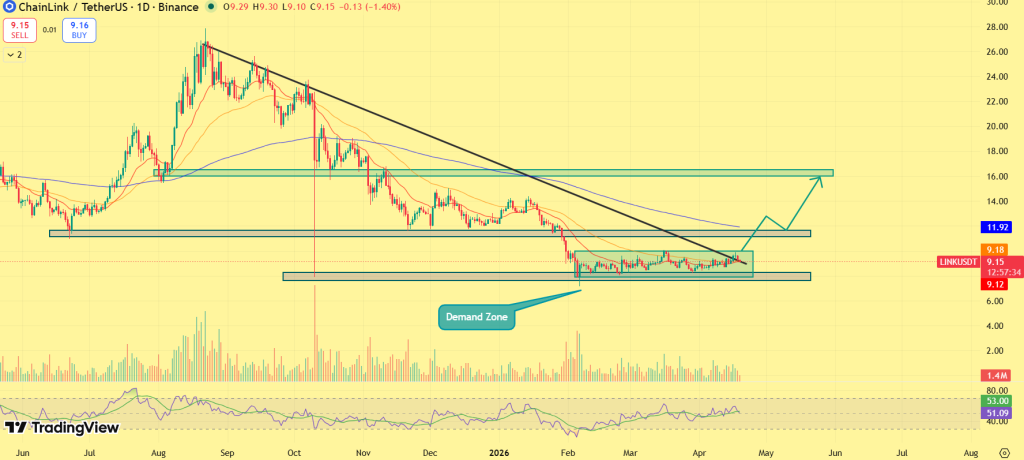
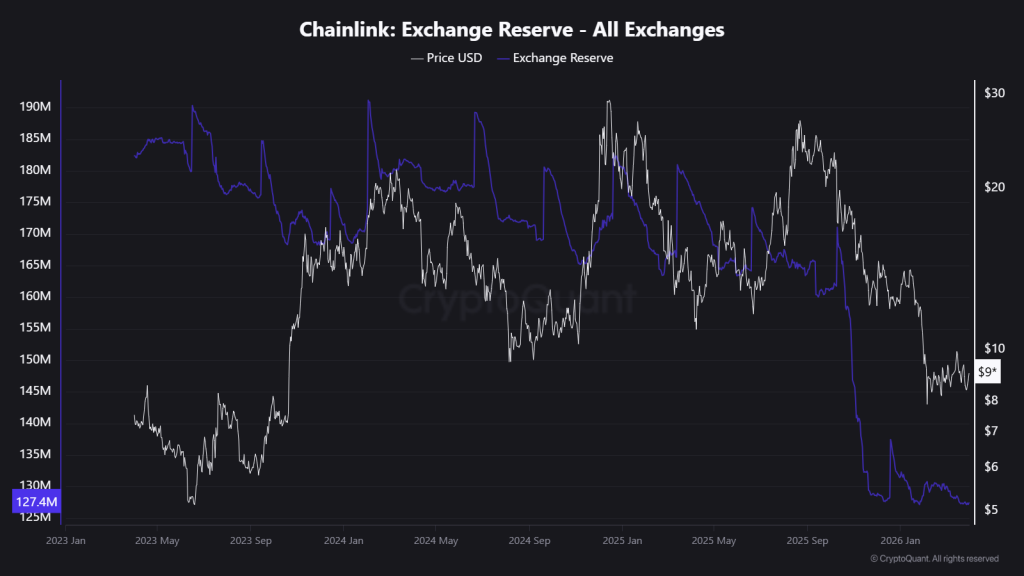
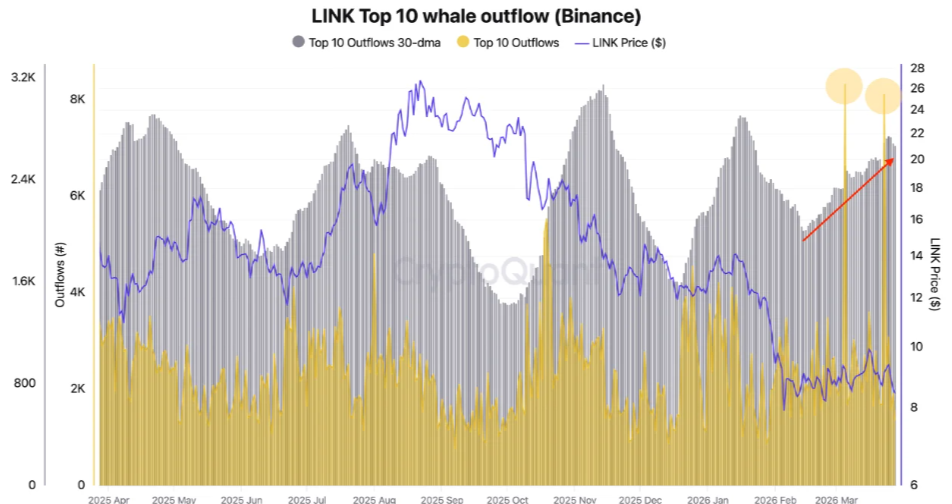
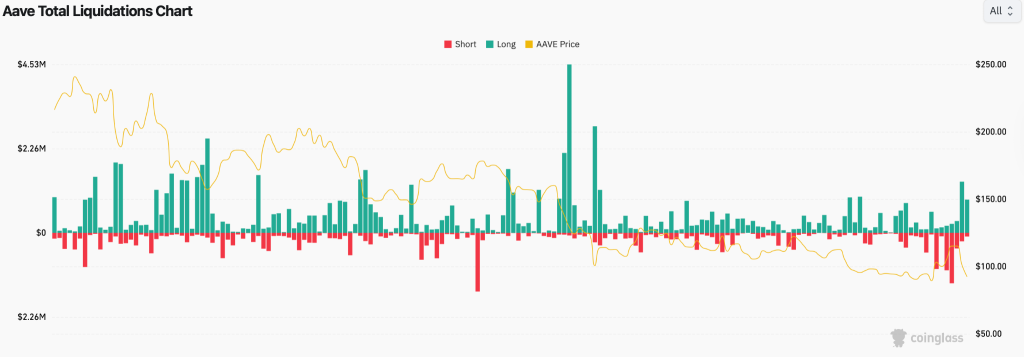
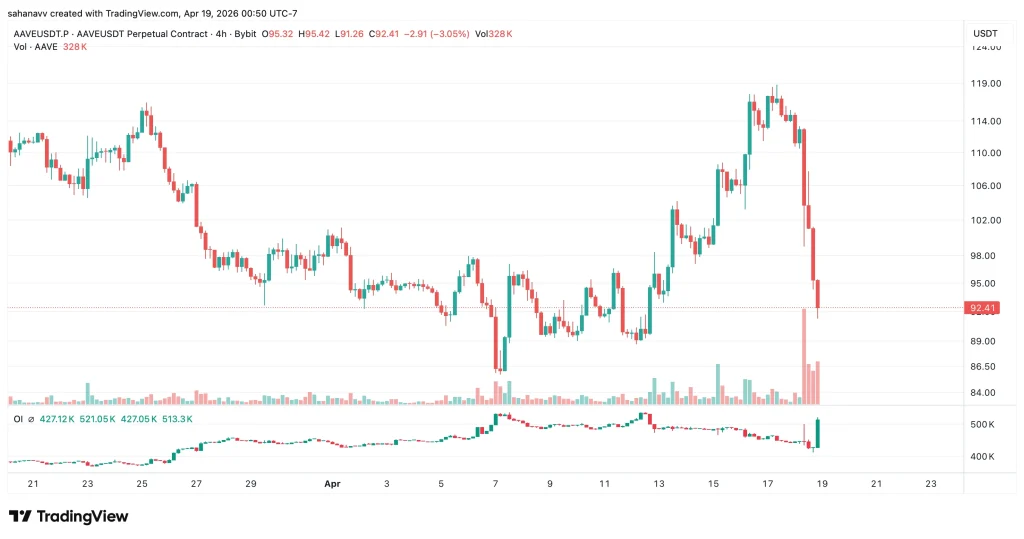


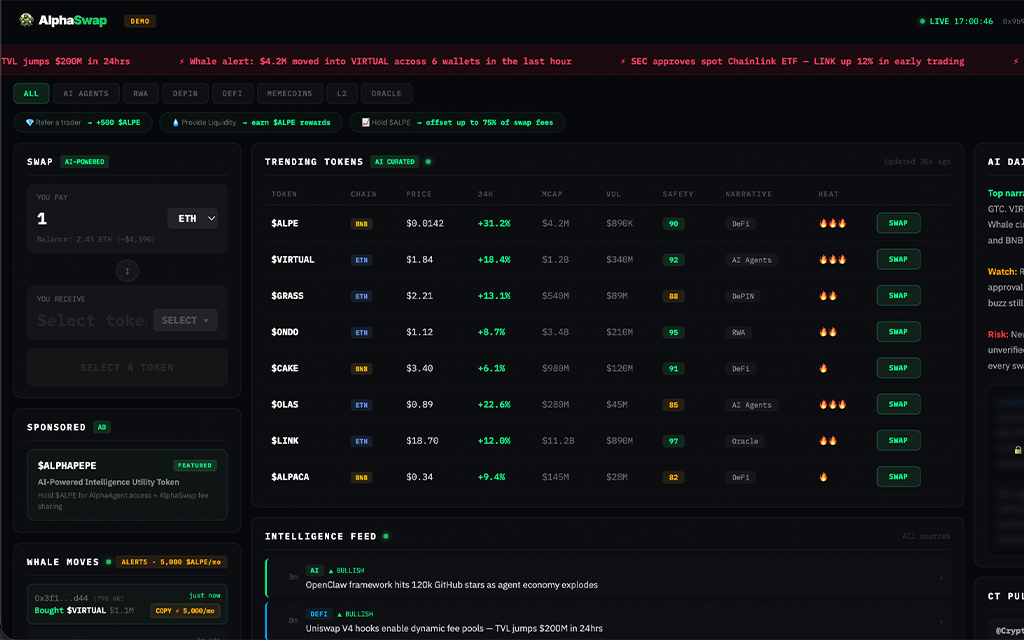

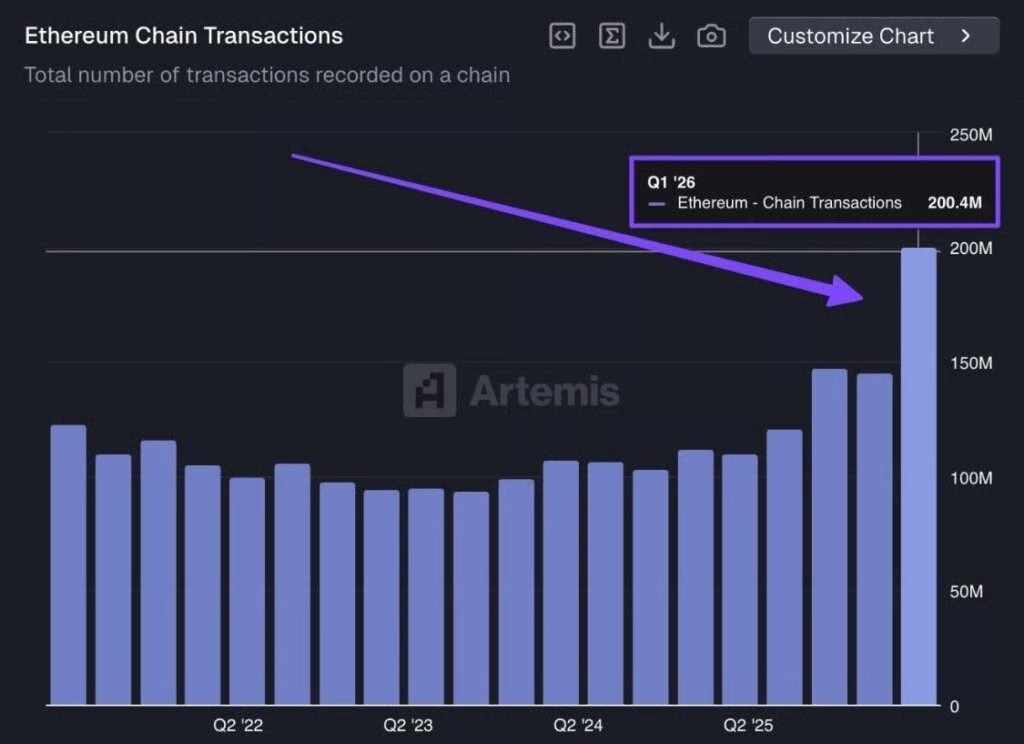
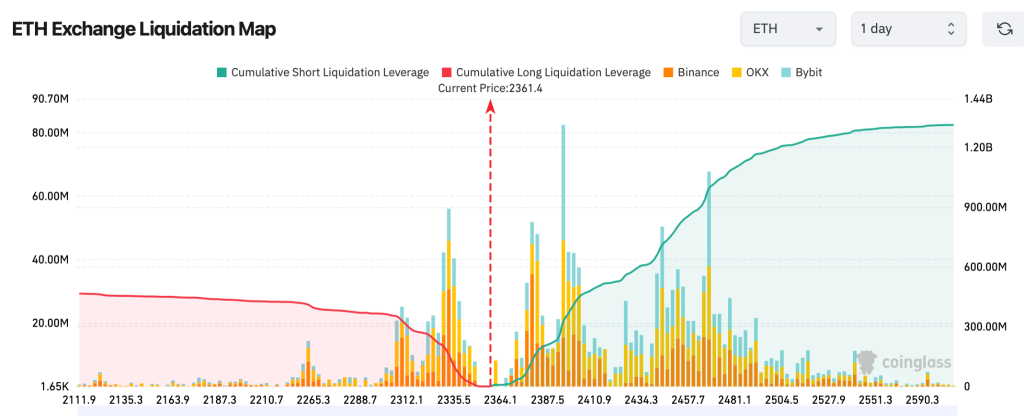
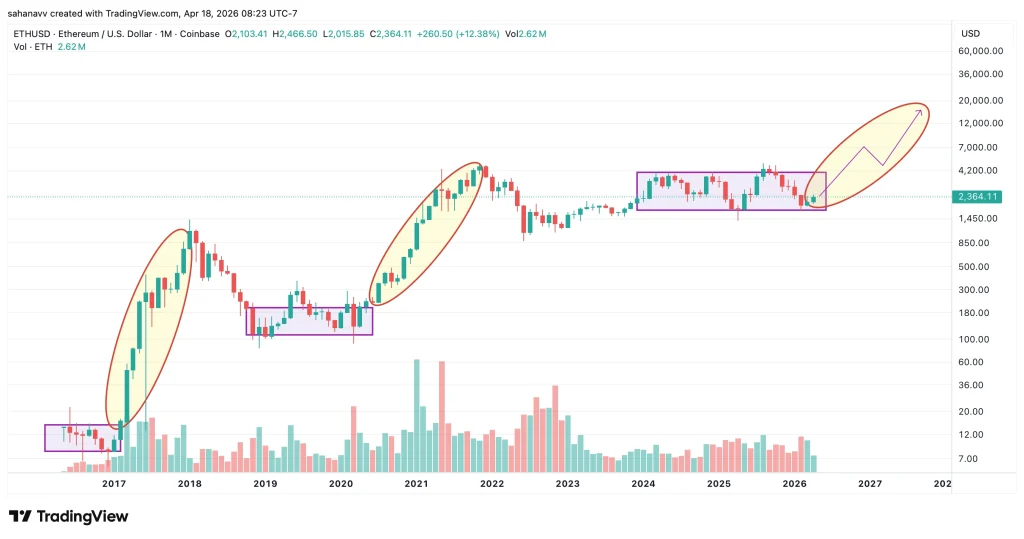
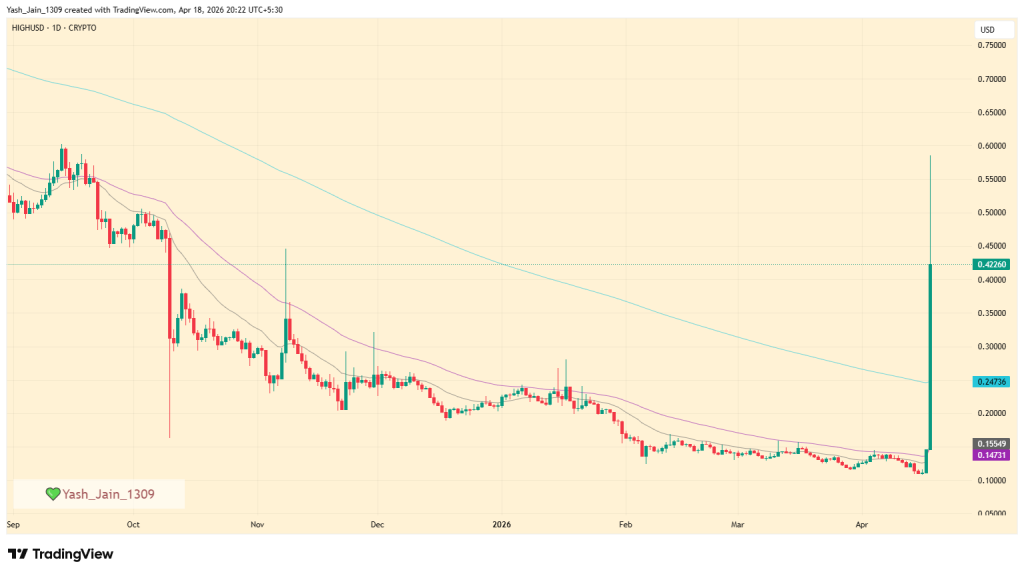
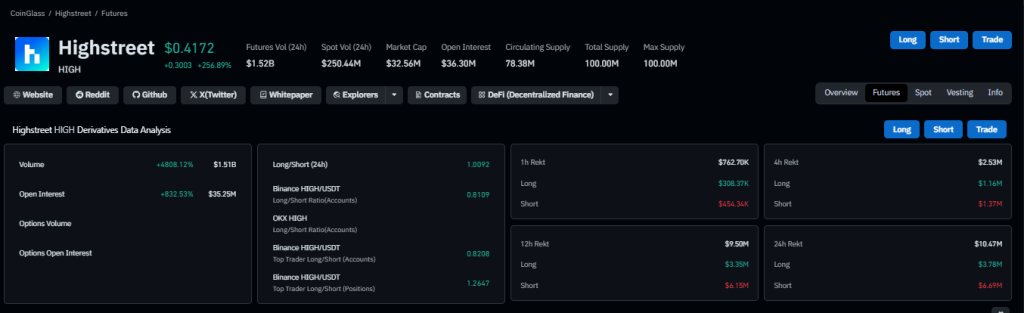
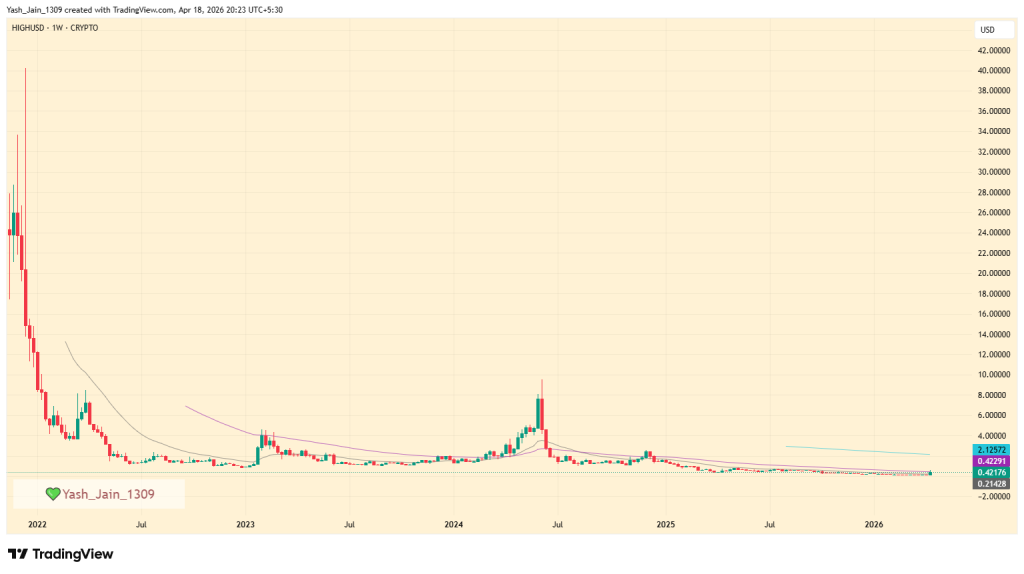
 Have you heard?
 Highstreet: Calamity just dropped into Early Access on Meta Quest
  Jump in now → Download here:
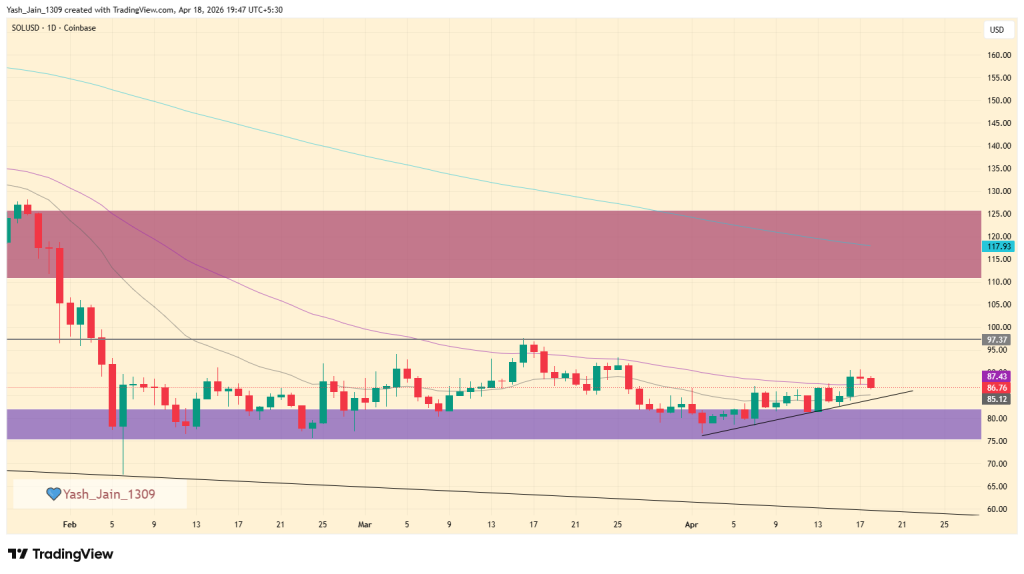
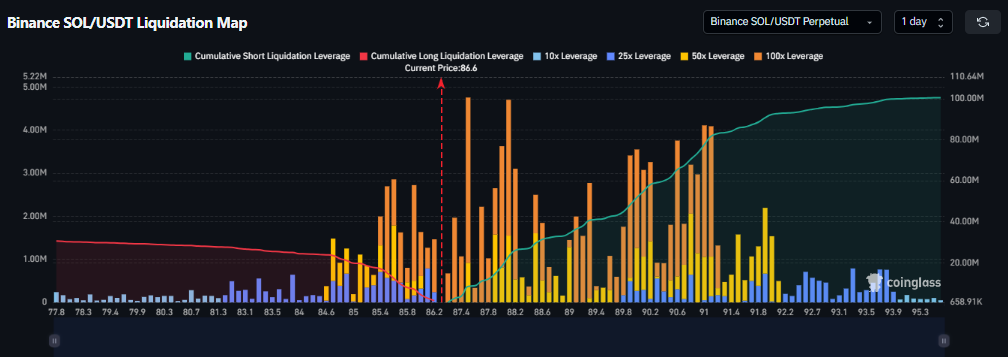
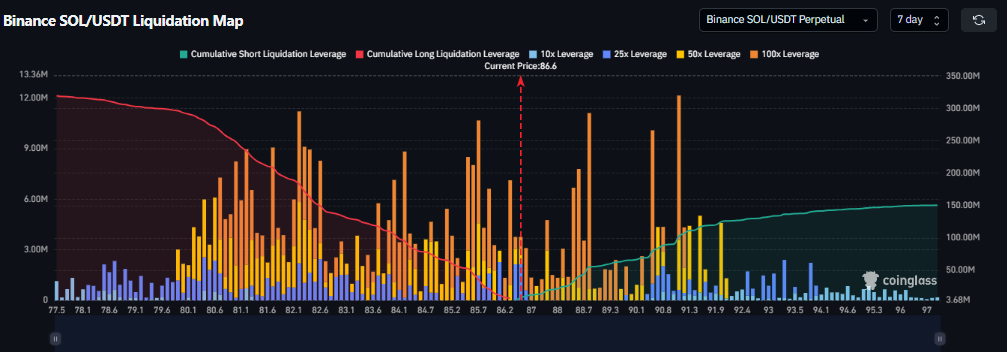
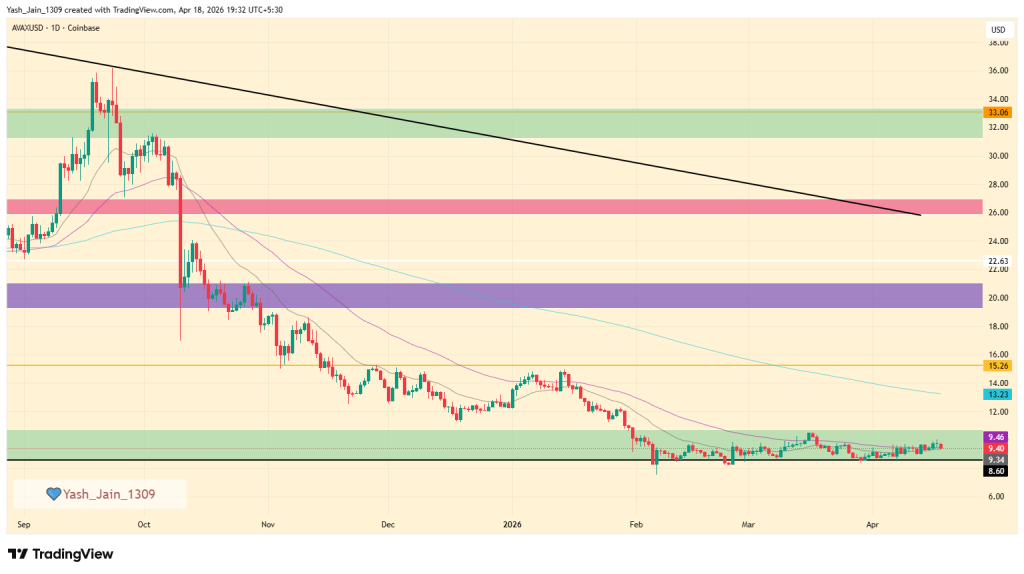
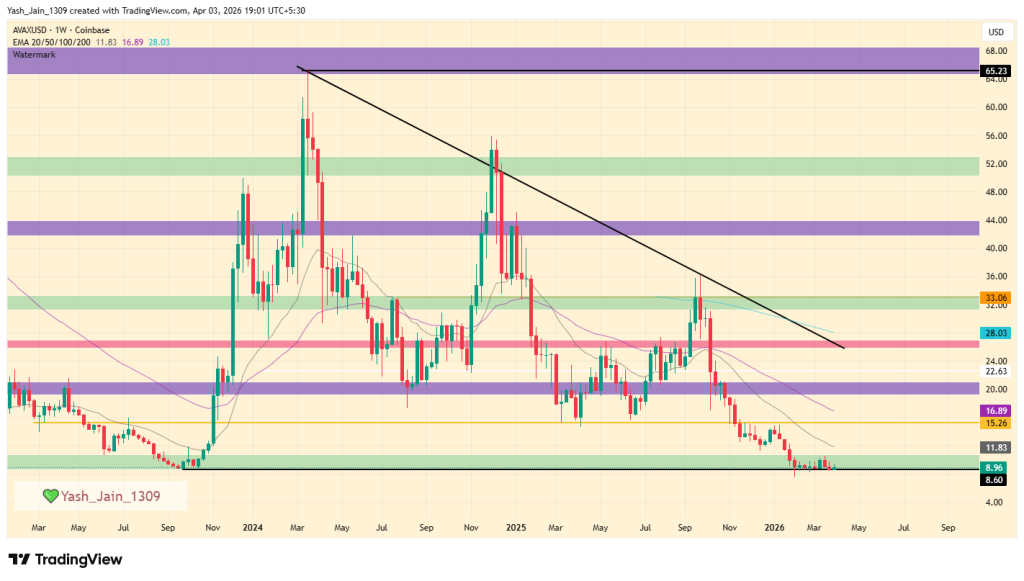
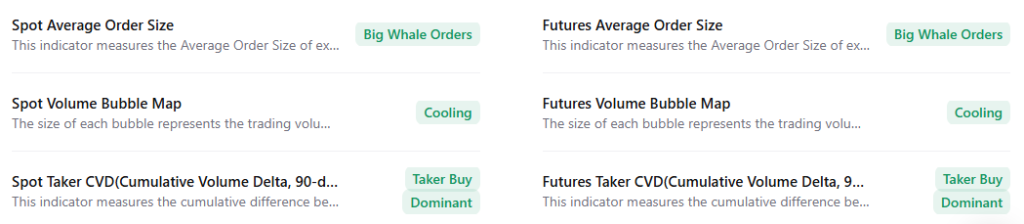
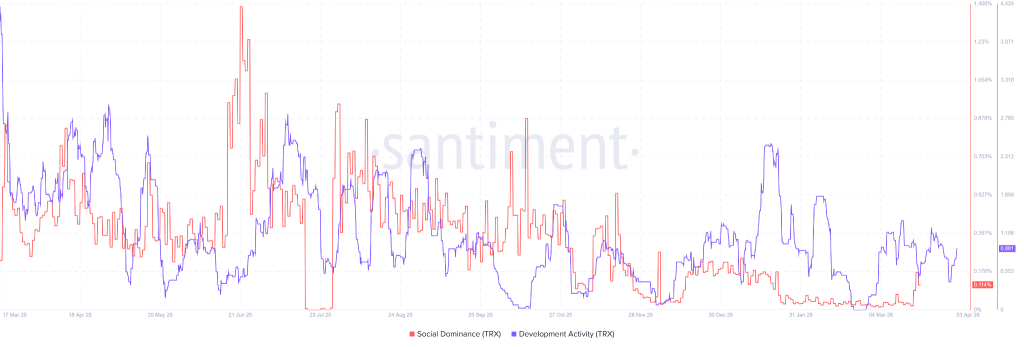
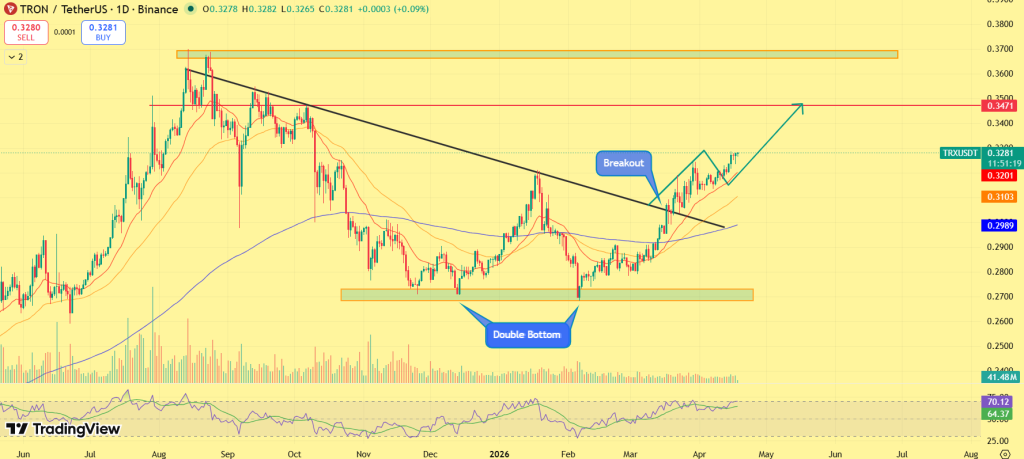
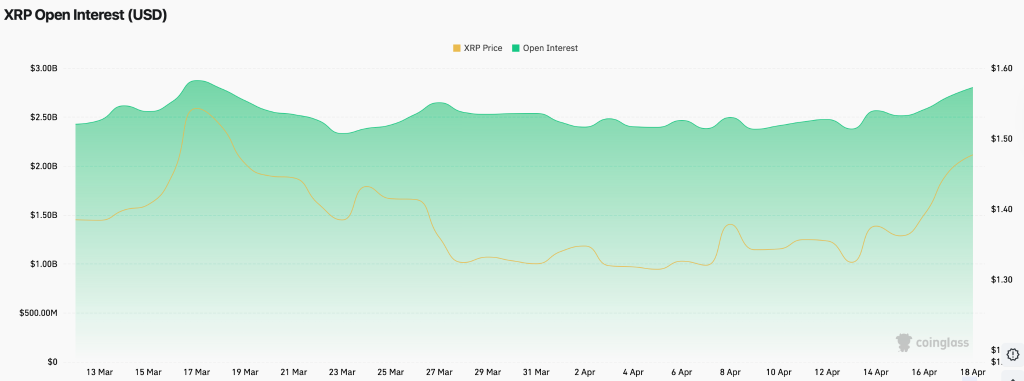
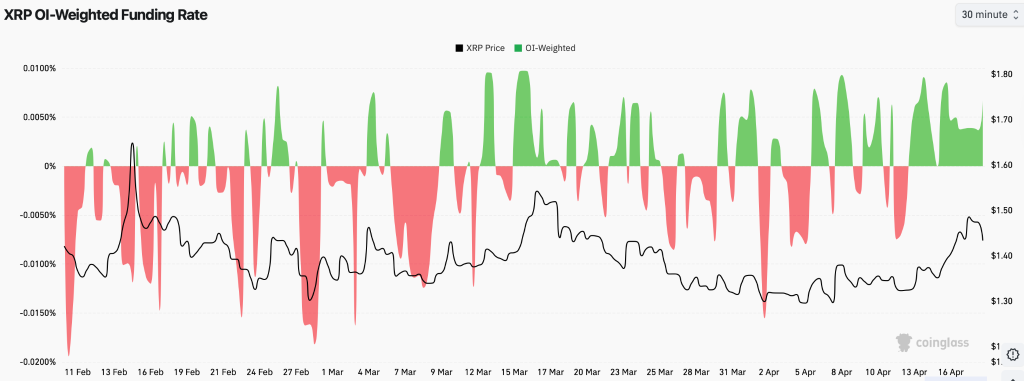
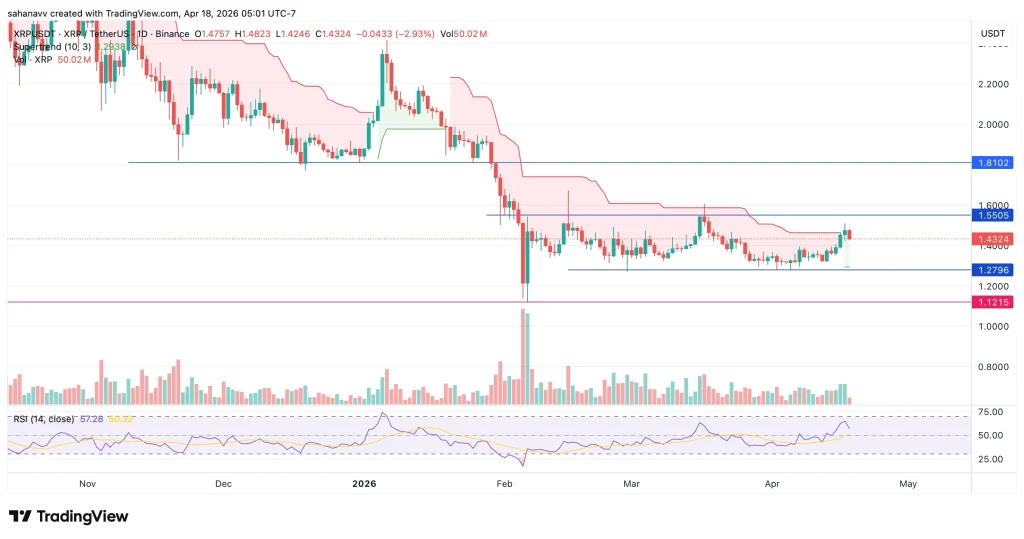

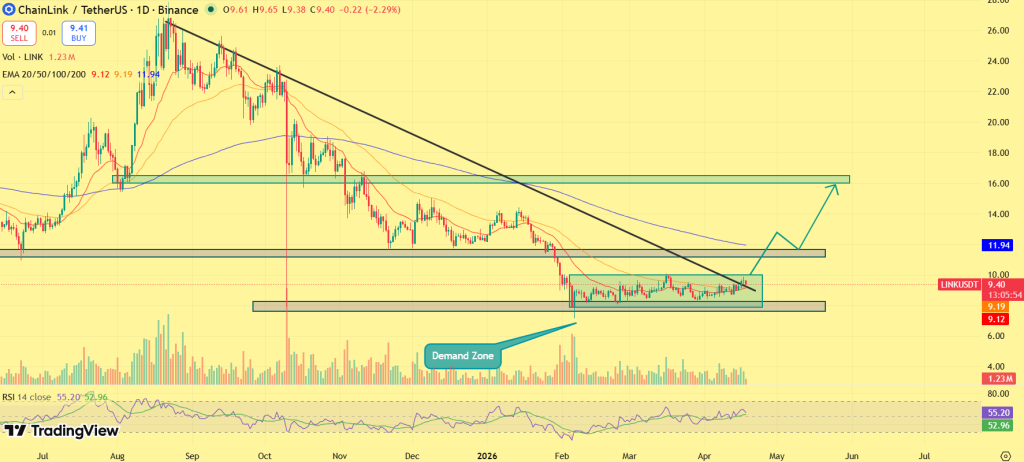

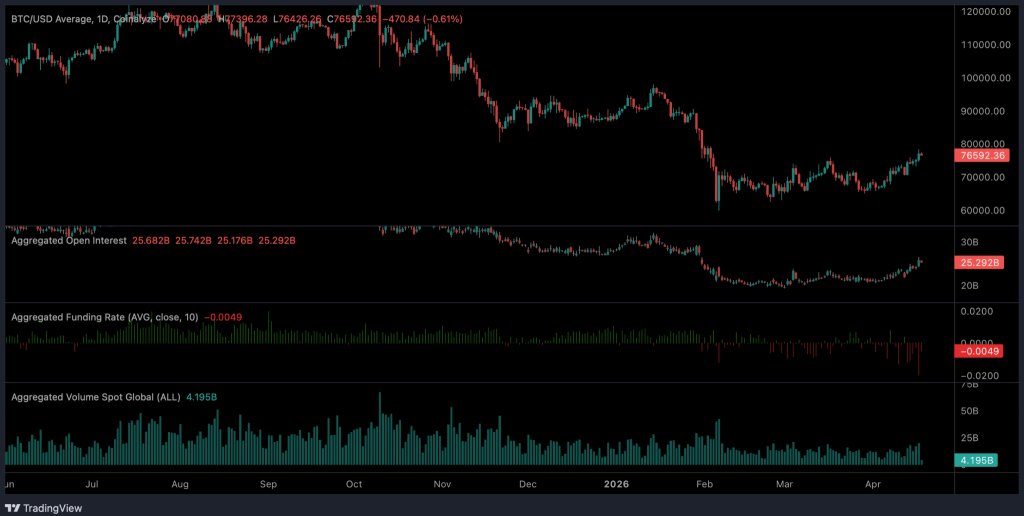
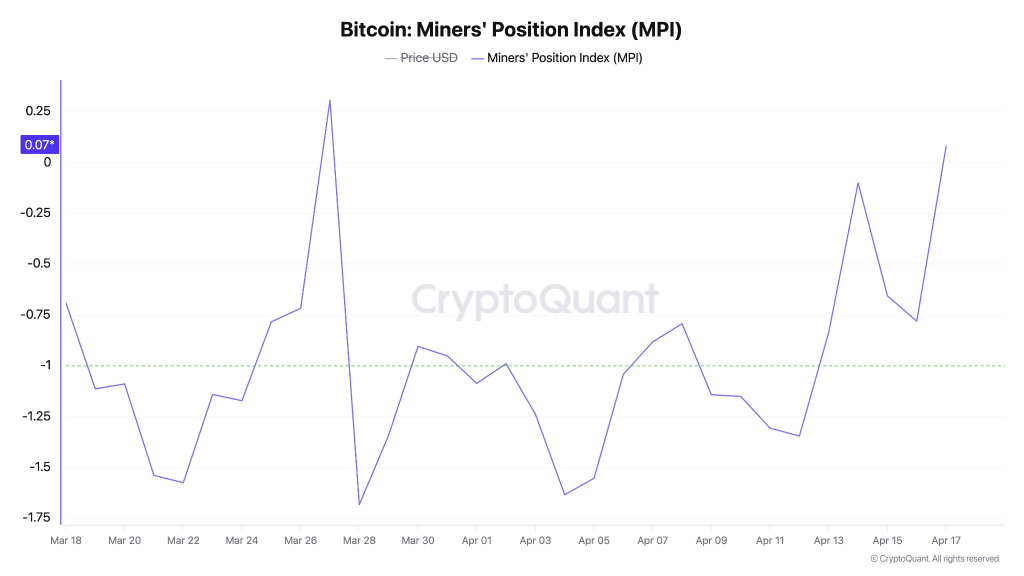
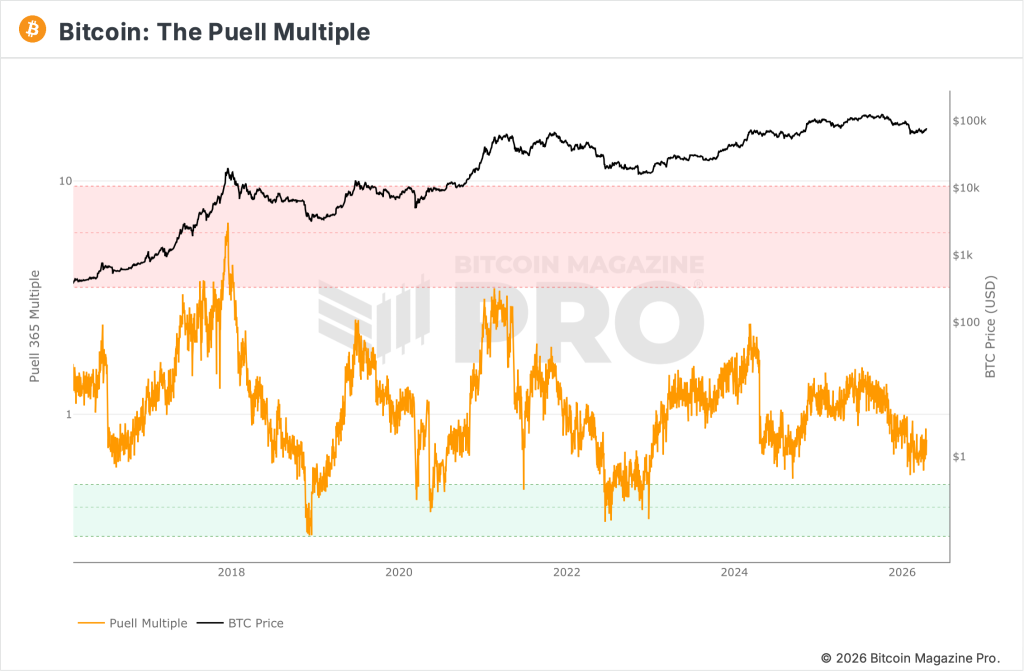


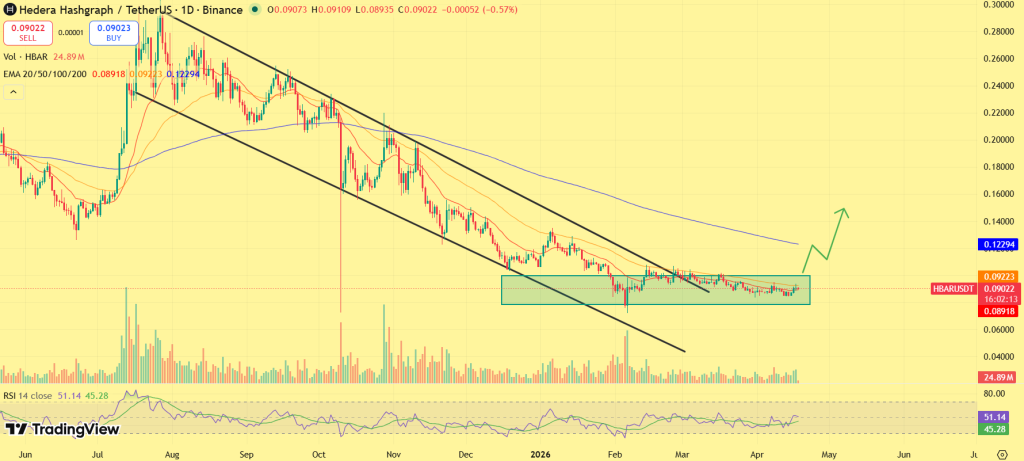
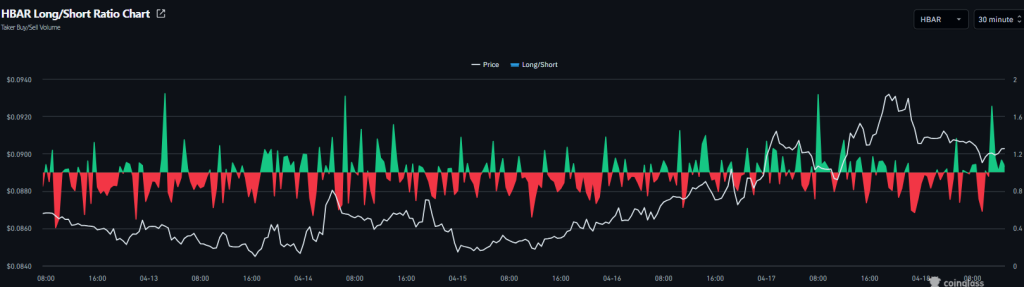

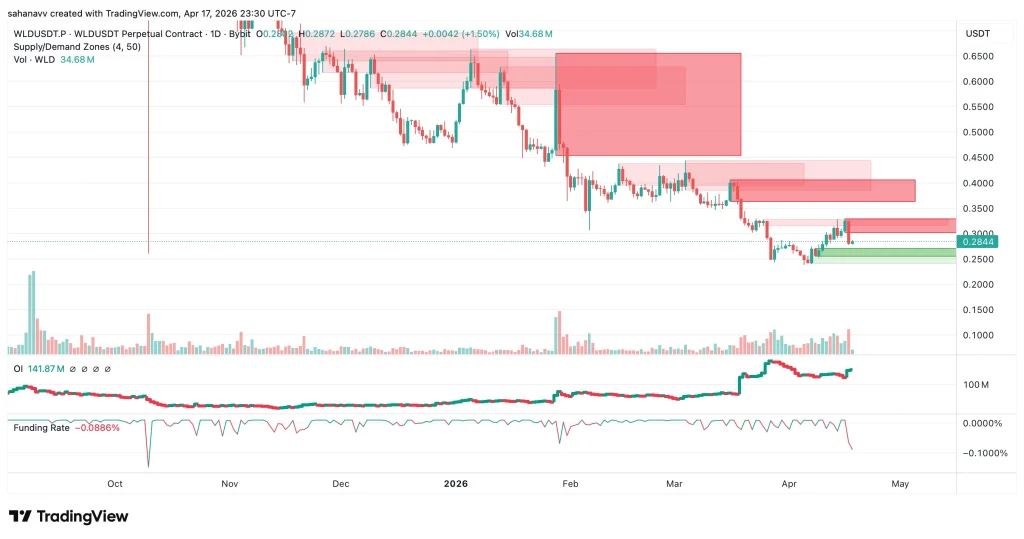
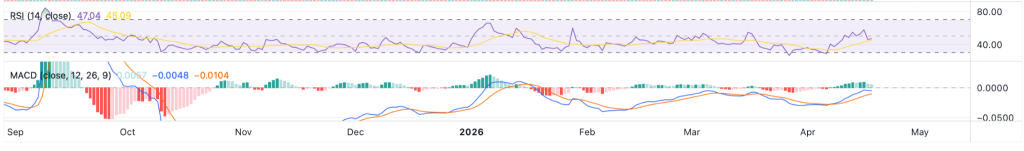


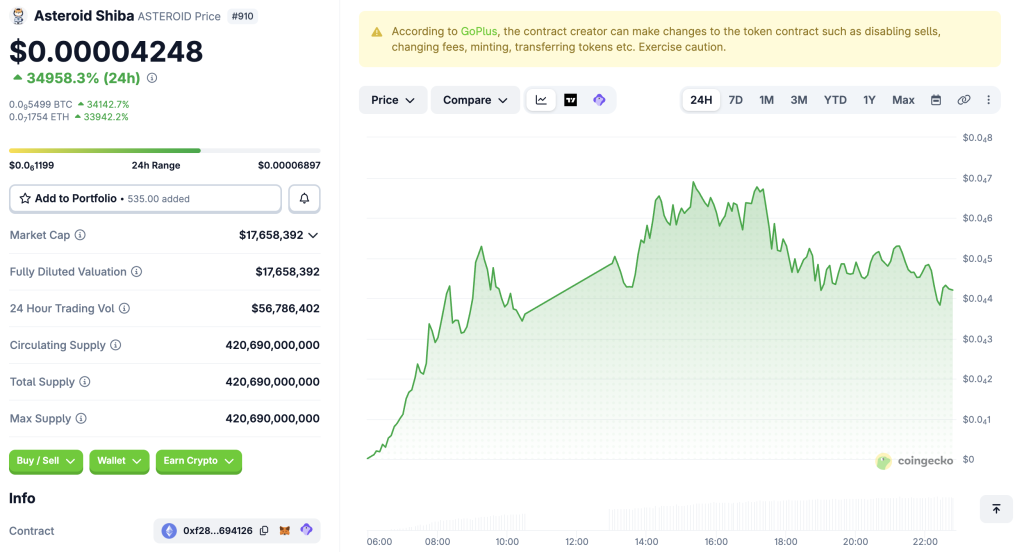


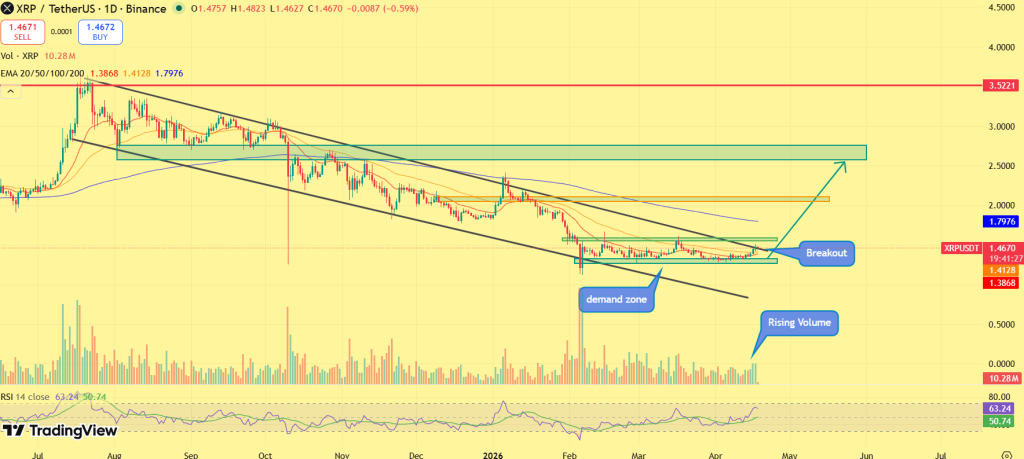
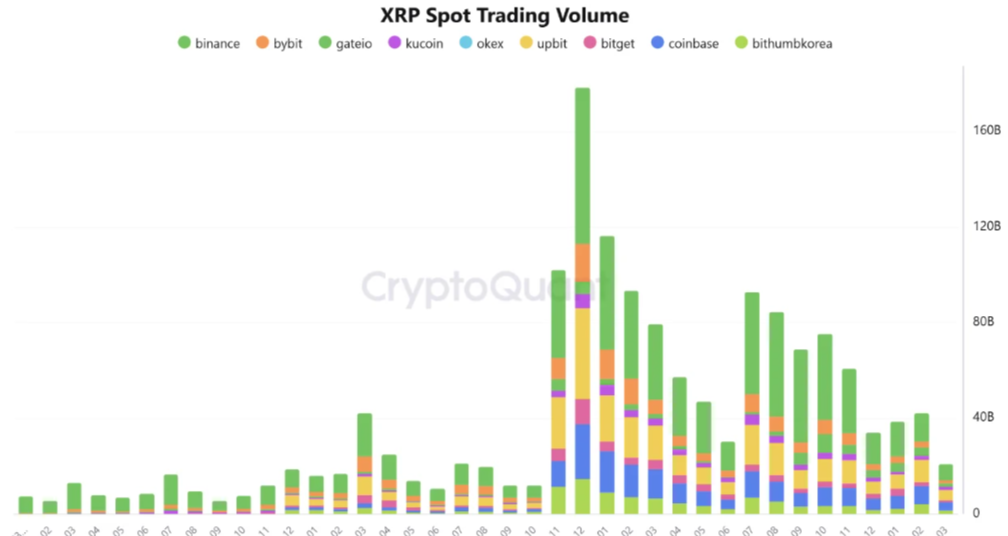
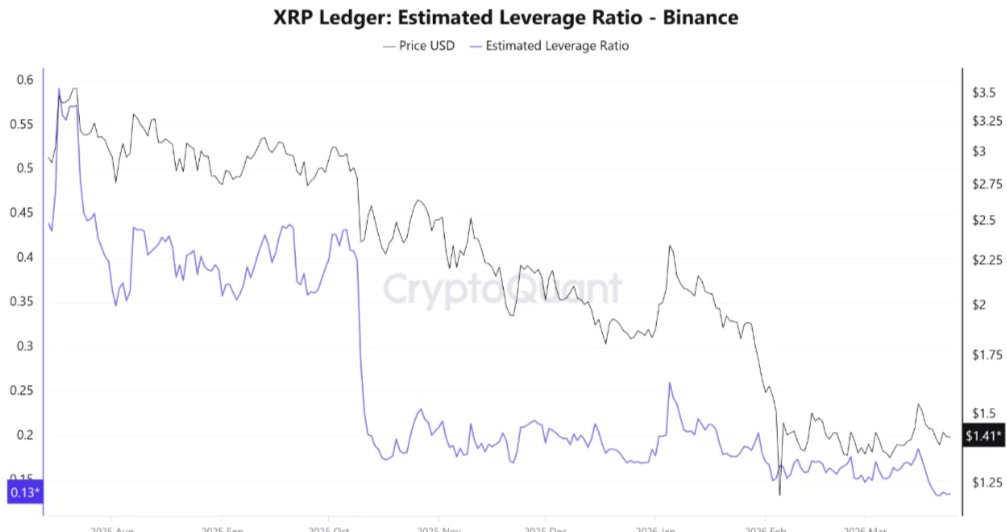
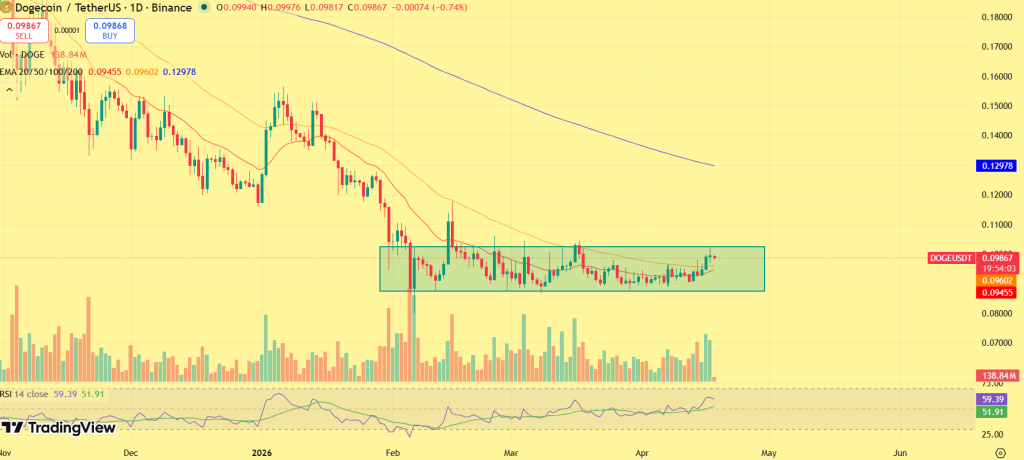
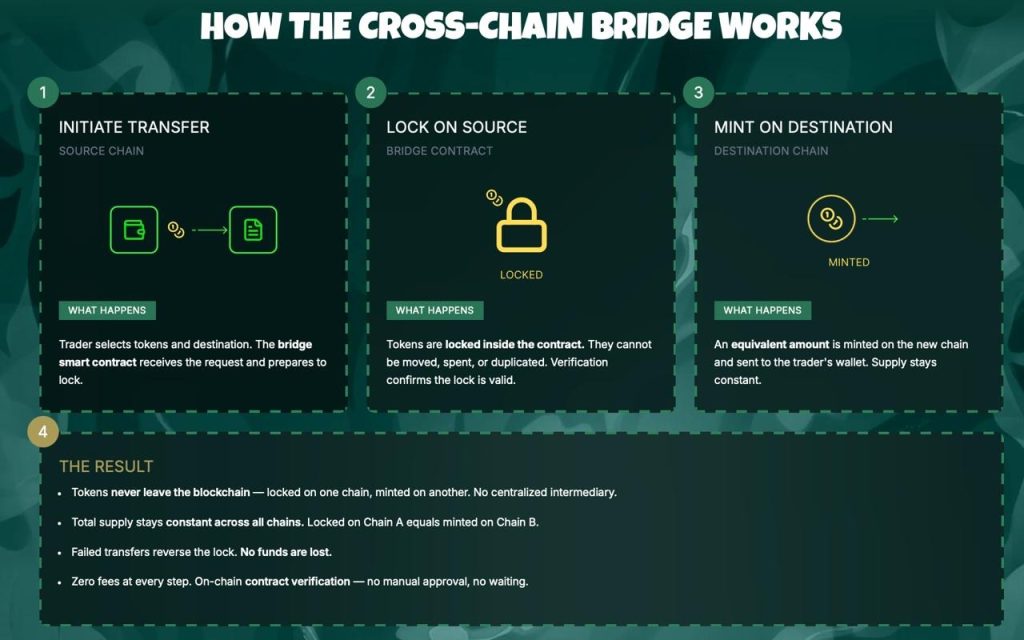
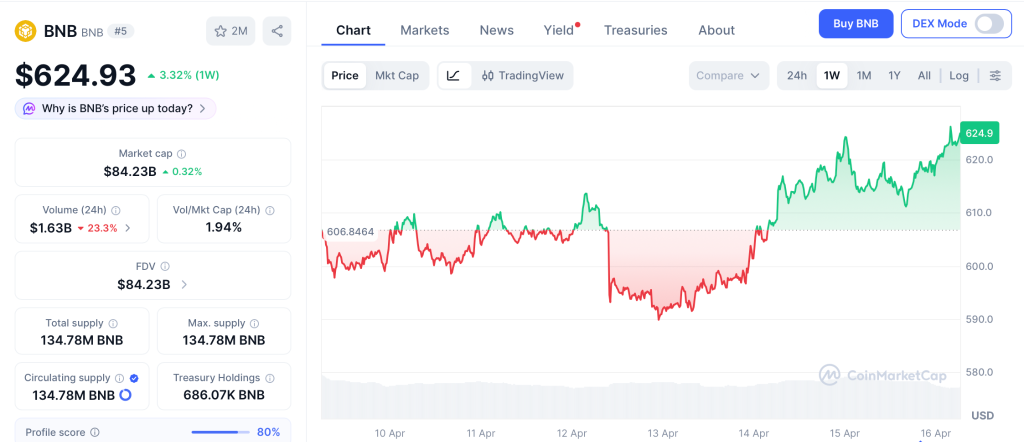


 (@Raph_Bloch)
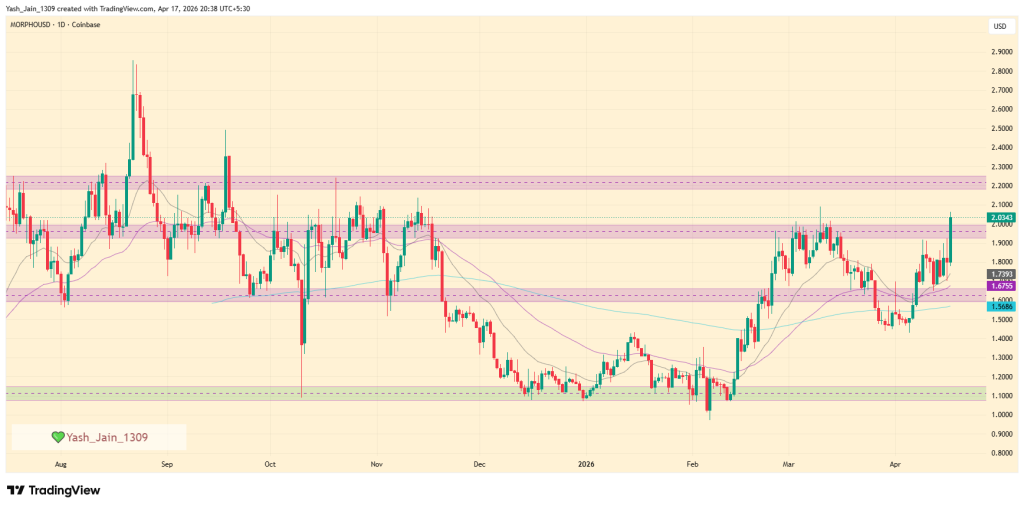
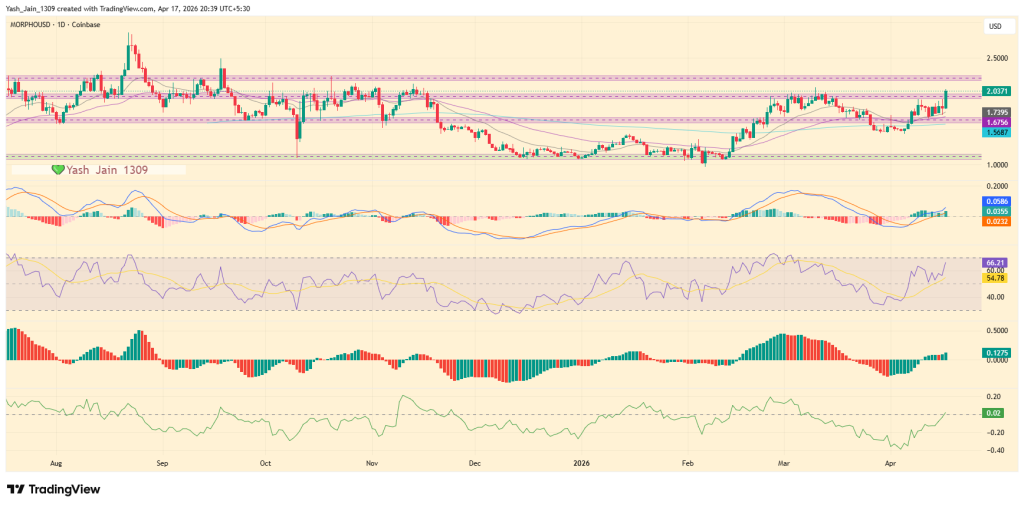
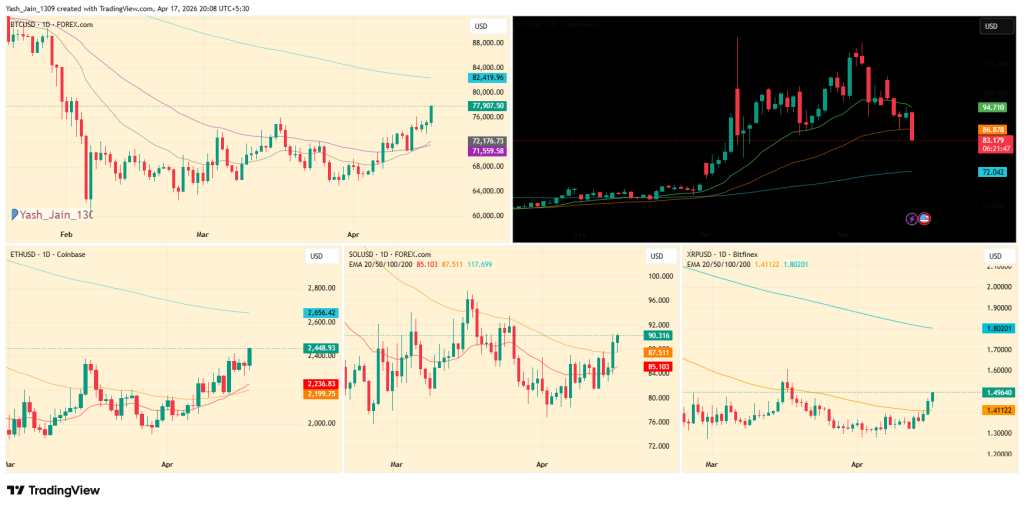
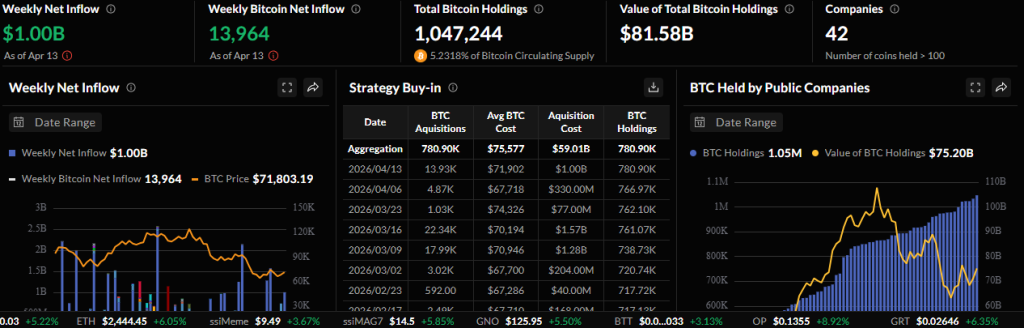
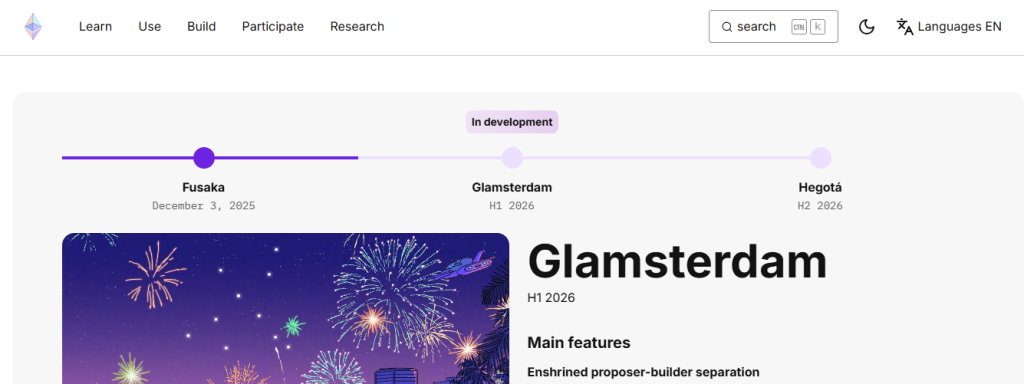
 PBW
PBW  (@AlsieLC)