Reading view

Official Trump Token Faces Tug-of-War Between Bulls and Bears— What’s Next for the Price?

TRUMP Coin Price

The post Official Trump Token Faces Tug-of-War Between Bulls and Bears— What’s Next for the Price? appeared first on Coinpedia Fintech News

After a sharp rally that sent the Official Trump (TRUMP) price token soaring in recent sessions, the momentum now appears to be cooling as the market enters a phase of equal bullish and bearish pressure. Traders are closely watching whether the token can sustain its gains or face a short-term correction amid broader market uncertainty. As buying momentum slows, the next few trading sessions could decide whether TRUMP’s price resumes its uptrend or confirms a near-term pullback.

Ecosystem Expansion and Massive Earnings Drive Official Trump Token’s Momentum

The Official Trump (TRUMP) token has captured market attention once again, surging nearly 30% after the announcement that USD1, a Trump-linked stablecoin, will launch on the Enso Chain. The move is seen as a key step in expanding the Trump crypto ecosystem, potentially enhancing TRUMP’s real-world utility and investor confidence. This expansion comes as momentum traders position for further gains, though short-term consolidation remains likely amid rising market volatility.

Adding to the buzz, a Reuters investigation revealed that the Trump Organisation generated approximately $802 million from crypto-related ventures between January and June 2025—surpassing its traditional business income during the same period. Of this, nearly $336 million reportedly originated from the TRUMP token, spotlighting the financial weight of the Trump-backed digital asset. However, the findings have reignited debate over governance, transparency, and political influence in crypto markets, with regulators and investors alike watching closely how the ecosystem evolves in the coming weeks.

TRUMP Price Analysis: Is A Bullish Monthly Close on the Horizon?

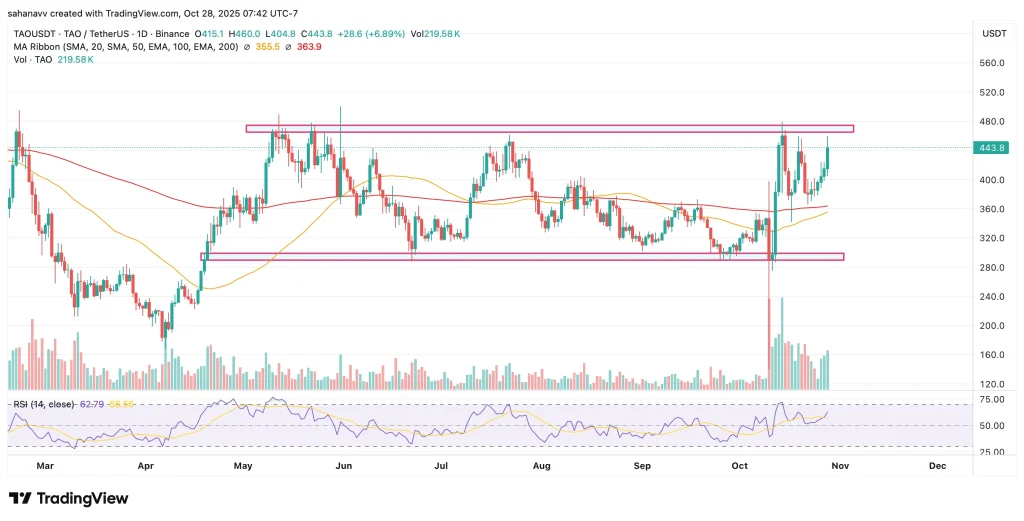
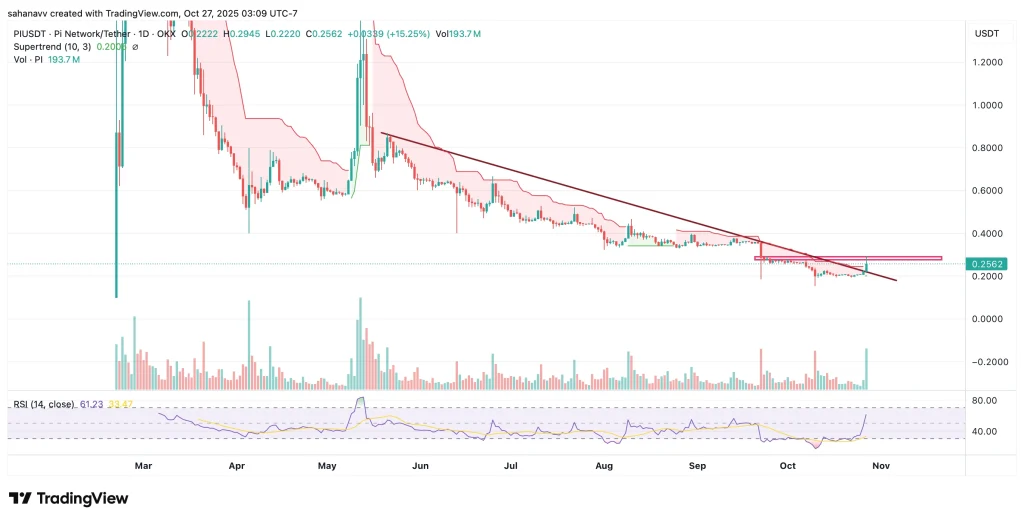
The Official Trump (TRUMP) token is showing signs of renewed strength after months of steady decline. Following a sharp rebound from its October lows, the price has broken above a key descending trendline for the first time since May, signalling potential bullish reversal momentum. Trading volume has spiked notably, reflecting increased investor interest. However, with the token now hovering near critical resistance around $7.20–$7.30, traders are watching closely to see if this breakout holds or fades into consolidation.

trump price

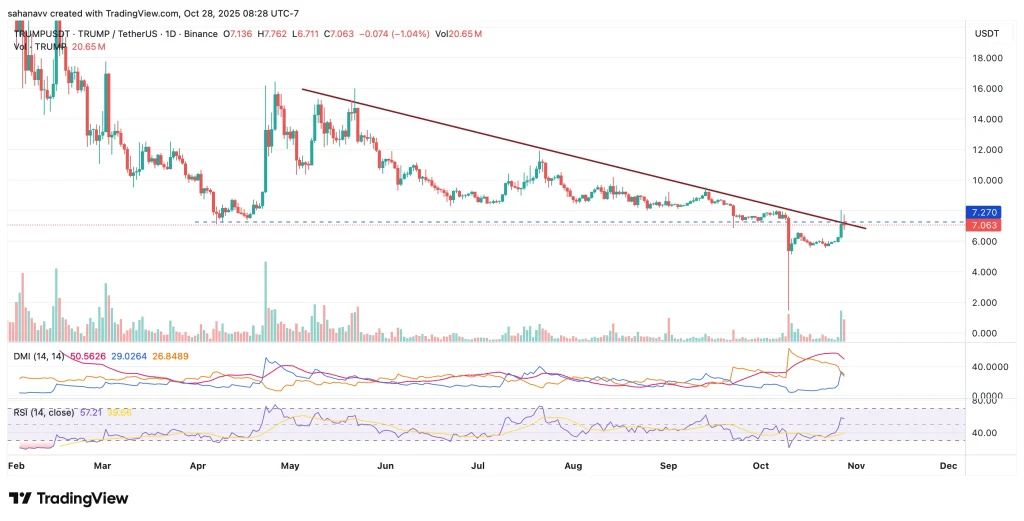
The chart shows TRUMP testing a long-term descending resistance trendline, with current price action slightly above the $7.20 resistance zone. The DMI indicator reveals tightening pressure between bulls (DI+) and bears (DI–), suggesting balanced momentum. Meanwhile, the RSI at 57 signals moderate bullish strength but not yet overbought, implying room for upside continuation. A decisive close above $7.30 could confirm a breakout toward $8.50, while rejection here may lead to a retest of the $6.20–$6.40 support region.

Conclusion—Will OFFICIAL TRUMP Reach $10?

The Official Trump (TRUMP) token’s recent rebound above its long-term trendline has re-energized bullish sentiment, but a sustained rally toward $10 will depend on continued ecosystem growth and broader market stability. A confirmed breakout above $7.50 could open the path toward $9.80–$10.00, especially if momentum strengthens alongside renewed buying volume. However, failure to hold above $6.20 may trigger another correction phase. For now, TRUMP stands at a crucial inflexion point—where market conviction will determine whether the next move is a breakout or a fade.

Bittensor (TAO) Price Jumps 10% as Subnet Demand Surges—Can the AI Crypto Rally Sustain?

Bittensor (TAO) Price Surges, Will Bulls Push Above $434 for a New 2025 High

The post Bittensor (TAO) Price Jumps 10% as Subnet Demand Surges—Can the AI Crypto Rally Sustain? appeared first on Coinpedia Fintech News

Bittensor (TAO) price surged over 10% in the past few hours, climbing above the $450 mark as renewed demand for its subnets and rising speculative activity fuelled fresh optimism in the AI crypto sector. The decentralized machine-learning network has seen a sharp spike in trading volumes and open interest, signalling growing investor confidence. As TAO breaks key resistance levels, traders are now eyeing the $500 milestone—raising the question: can this AI-powered blockchain sustain its bullish momentum?

Why Bittensor Price Is Rising?

Bittensor’s sharp rally can be attributed to a confluence of bullish technical and fundamental factors. The most immediate catalyst is the surging demand for Bittensor’s subnets, which recorded an 11% jump in market cap within 24 hours, reflecting growing usage and developer activity. On top of that, futures open interest spiked nearly 19%, signalling strong speculative participation.

Technically, TAO has broken above a long-term descending trendline, marking a key bullish reversal pattern. The breakout has drawn renewed attention from traders who see Bittensor as one of the most promising plays in the AI + crypto narrative, especially with major institutional interest brewing in decentralized machine learning networks.

Bittensor (TAO) Technical Outlook

From a technical standpoint, Bittensor’s breakout above $434 has flipped a crucial resistance level into support, confirming a bullish reversal on both the 4-hour and daily timeframes. The price has consistently formed higher highs and higher lows, signaling sustained buying momentum. Analysts point to $466–$475 as the next critical resistance zone, beyond which TAO could target $500 in the short term.  

tao price

Bittensor (TAO) is showing strong bullish momentum, rebounding from the $280–$300 support zone and now testing the key resistance near $470. The price has surged above both the 50-day and 200-day moving averages, with the two lines converging—hinting at a potential golden cross, a classic bullish signal that often precedes strong upward trends. Rising volume confirms growing momentum, while the RSI near 63 suggests steady buying pressure. A breakout above $470could pave the way toward $500, with support around $360.

Conclusion

Bittensor’s recent price rally underscores growing confidence in both its AI-driven narrative and improving on-chain fundamentals. With rising subnet activity, expanding trading volumes, and a potential golden cross on the horizon, TAO appears technically well-positioned for further upside. However, the $470–$480 range remains a critical barrier that must be cleared for continuation toward $500 and beyond. As momentum builds, traders should watch for sustained volume and confirmation above resistance to validate the next phase of Bittensor’s bullish trend.

Bitcoin Price Extends Gains, But Technical Signals Hint at a Pullback Below $110K—What’s Next?

Will Institutional Buying Push BTC Price USD to New Highs

The post Bitcoin Price Extends Gains, But Technical Signals Hint at a Pullback Below $110K—What’s Next? appeared first on Coinpedia Fintech News

Bitcoin (BTC) price continues to trade with upward momentum, recently reclaiming levels above $113,000 as market sentiment leans cautiously optimistic. The market has followed suit, with speculation of whether this momentum can be sustained amid tightening liquidity and rising volatility. However, several technical indicators now suggest a potential cool-off phase. This raises concerns of a short-term correction below the $110,000 support zone.

Is BTC Price Heading for a Pullback?

After rebounding sharply from lows near $107,800 earlier this week, Bitcoin has steadily reclaimed lost ground, climbing back above the $113,000 mark. This recovery reflects renewed buying pressure around key demand zones, supported by improving market liquidity and increased spot trading activity. However, BTC now faces a crucial test near the $114,500–$115,000 resistance area, where profit-taking has historically intensified. Momentum indicators hint at potential exhaustion, suggesting that if Bitcoin fails to secure a daily close above this range, a corrective drop toward $110,000—or even lower—could soon follow.

Another major reason to be bearish on Bitcoin is the recently formed CME gap with the lower range close to $110,000. 

bitcoin price

Bitcoin’s rebound from the $107,800 lows has lifted prices toward $114,600, yet the move now encounters a key CME gap between $110,700 and $113,500, as highlighted on the chart. This unfilled gap has become a focal point for traders, as Bitcoin often revisits these levels before establishing a sustained trend. The Ichimoku Cloud currently acts as dynamic resistance, with the upper boundary near $115,700 aligning with the gap’s top.

Historically, BTC has tended to “fill” such CME gaps before reversing direction, suggesting a possible short-term rejection if momentum weakens. Meanwhile, the RSI around 51 signals a neutral bias, indicating potential consolidation before the next major move.

Wrapping it Up

The recent rebound in Bitcoin (BTC) price underscores improving short-term sentiment, but the broader market remains cautious amid low volatility and mixed macro cues. A decisive move beyond the $115,700 cloud resistance could reignite bullish momentum across major altcoins, fueling renewed inflows into risk assets. However, failure to clear this zone may keep BTC range-bound, with traders eyeing $110,000 as a key defensive level. With upcoming macro events and ETF flows influencing liquidity, Bitcoin’s next move could set the tone for the entire crypto market heading into November.

Pi Network Price Prediction: Can PI Sustain Its Sudden 20% Jump?

Can Pi Network Price Hit $10 In The Next Two Months

The post Pi Network Price Prediction: Can PI Sustain Its Sudden 20% Jump? appeared first on Coinpedia Fintech News

The crypto market today is witnessing renewed bullish momentum, with Pi Network (PI) emerging as a top gainer amid altcoin recovery. In the past few hours, the PI price surged over 20%, rebounding sharply from the $0.21 support zone to trade around $0.26. This sudden rally comes as nearly 2.7 million users successfully migrated to the mainnet, marking a major milestone for the project and fueling optimism across the Pi community.

What’s Driving Pi Network’s Price Surge?

The recent rally in Pi Network’s price appears to be more than just a speculative bounce—it reflects improving market confidence and subtle on-chain shifts. Analysts point to increased user activity within the ecosystem, growing mainnet interactions, and renewed discussions around Pi’s future exchange listings. According to recent market data, Pi Network’s latest uptrend is backed by a combination of technical and fundamental factors:

  • Mainnet Migration Momentum — Over 2.69 million users completed KYC and migrated to the mainnet this week, signaling strong network participation.
  • Reduced Selling Pressure—A notable volume of PI tokens was moved off exchanges, tightening available supply and supporting prices.
  • Market Sentiment Shift—The broader altcoin market recovery and renewed investor interest in utility-driven projects have strengthened demand for Pi.
  • Speculative Trading Activity—As Pi remains unlisted on major centralized exchanges, limited liquidity has amplified short-term price volatility.

Can PI Price Sustain the Momentum?

Pi Network has been in a continuous downtrend since early 2025, printing lower highs and lower lows. However, today’s breakout above the long-term resistance line near $0.22 marks the first meaningful bullish signal in several months. The move is accompanied by strong buying volume, indicating that buyers are regaining control.

pi network price

Key Technical Indicators

  • Supertrend (10, 3): The Supertrend indicator has flipped bullish for the first time in weeks, turning green near $0.20. Sustaining above this level could confirm a trend reversal.
  • Volume Surge: Trading volume soared to 193.7 million, the highest since May 2025, validating the breakout and showing fresh accumulation pressure.
  • RSI (Relative Strength Index): The RSI has climbed to 61.23, signaling increasing bullish momentum but still leaving room for further upside before reaching overbought territory.

Support and Resistance Levels

ZoneTypeRange
Immediate SupportPost-breakout base$0.21–$0.22
Short-Term ResistanceSupply zone$0.28–$0.30
Next Major ResistanceApril swing highs$0.35–$0.38
Critical SupportBreakdown level$0.18

The zone between $0.28 and $0.30 represents a key test area. A decisive daily close above it could open the door for a push toward $0.34–$0.38. Failure to break through may lead to sideways consolidation between $0.21 and $0.28. The structure resembles a falling wedge pattern, a bullish reversal setup often seen after extended declines. Confirmation has been strengthened by the breakout above the wedge’s resistance line, rising RSI readings and a noticeable spike in trading volume.

This pattern implies a potential target near $0.34, derived from the measured wedge height added to the breakout point. Pi Network’s breakout above the descending trendline, supported by rising volume and positive RSI momentum, signals the first technical confirmation of a potential trend reversal. If the price manages to close above the $0.28–$0.30resistance area, PI could extend its rally toward $0.35–$0.38 in the near term.


However, traders should monitor volatility and avoid premature entries until volume confirms sustained buying pressure.

Caution Still Advised

Despite the surge, experts warn that Pi Network remains speculative. The project has yet to achieve a fully open mainnet or secure major exchange listings. Until these milestones are reached, price rallies may remain sentiment-driven rather than fundamentally supported.

Investors are advised to monitor:

  • Progress toward mainnet integration and ISO 20022 readiness
  • Exchange listing announcements
  • Partnerships or ecosystem expansions that enhance utility

If Pi Network continues its current pace of user migration and ecosystem development, analysts believe PI price could retest the $0.30–$0.35 range in the near term. However, without a confirmed listing or broader adoption, consolidation around current levels remains the most likely scenario.

Ethereum Eyes $5,000 in November 2025 — But a Strong Monthly Close Is Crucial!

ETH

The post Ethereum Eyes $5,000 in November 2025 — But a Strong Monthly Close Is Crucial! appeared first on Coinpedia Fintech News

The crypto market today is buzzing as the Ethereum (ETH) price edges closer to the $4,300 mark amid renewed bullish momentum and strong on-chain activity. However, analysts caution that a decisive monthly close above key resistance levels is essential to confirm the breakout and sustain upward momentum. With Bitcoin consolidating near local highs, investor attention has shifted toward Ethereum’s potential rally—positioning November as a make-or-break month for ETH’s long-term bullish trajectory.

Is the Capital Migrating from Ethereum to Bitcoin?

In the past week, specifically after the 20th of October, the Bitcoin ETF inflows have been steadily increasing, absorbing $446 million. However, the Ethereum ETF experienced a $244 million outflow led by Fidelity’s FETH with nearly $92.25 million. Interestingly, none of the nine ETH ETFs posted a net inflow. This indicates consolidation more than rotation, as every dollar leaving Ethereum could have found its way into Bitcoin’s vault. 

ethereum price

Bitcoin has become the global liquidity sink and the black hole of the capital trust, as it doesn’t promise yield but permanence.  This suggests the institutions are not betting against innovation but rather chasing immutability, as BTC doesn’t promise yield but permanence. 

Can the ETH Price Rise Above $4,300 Amid Outflows?

Ethereum price has been consolidating between $3,682 and $4,300 since the start of the month and as the markets are approaching the month-end, a major breakout is awaited.  The price, after the freefall from $4,732, is facing strong resistance at $4,271 which is the neckline of the double-bottom pattern. Currently, the ETH price is facing a similar action yet again, which raises concern over the next price action. 

ethereum price

As seen in the above chart, the ETH price is trading below the Ichimoku cloud, suggesting the bearish influence over the token. On the other hand, the CMF undergoes a parabolic recovery from 0, hinting towards a significant influx of buying volume. However, the levels are yet to rise above the ascending trend line that keeps the possibility of trend reversal open. Therefore, the ETH price appears to have entered a decisive phase, as a rise above the neckline at $4,271 could push the levels to $4,500 or above. Meanwhile, a rejection from here could keep the price within the consolidated zone mentioned above. 

Therefore, Ethereum’s current price action holds significant importance for the coming weeks. A decisive breakout above $4,300 could trigger a surge in liquidity, attracting strong buying interest and accelerating bullish momentum toward $4,800 and beyond. Such a move would greatly increase the likelihood of Ethereum reaching the $5,000 milestone before the end of 2025. However, analysts emphasize that a monthly close above $4,300 remains critical to validate the breakout and confirm the continuation of the long-term uptrend.

Altcoins Surge as Bitcoin Breaks $115,000—Will the Crypto Rally Continue?

Top Altcoins

The post Altcoins Surge as Bitcoin Breaks $115,000—Will the Crypto Rally Continue? appeared first on Coinpedia Fintech News

The crypto market today is witnessing explosive momentum as Bitcoin surges past the $115,000 mark, reigniting bullish sentiment across the board. Major altcoins like VIRTUAL, ZEC & DASH are skyrocketing, reflecting renewed investor confidence and growing market liquidity ahead of a high-volatility week. With traders eyeing key macro events and technical breakouts, the digital asset space is buzzing with optimism. The big question now—can this rally be sustained, or is the market gearing up for another round of sharp corrections?

Virtual Protocol (VIRTUAL) Price Breaks Bearish Pattern

Over the past few months, the Virtual Protocol price has been stuck within a descending parallel channel. The token attempted a breakout that resulted in forming yet another lower high, indicating the rising strength of the bears. However, it has broken above the structure following a strong influx of buying volume that suggests the VIRTUAL price is poised for a strong upswing. 

virtual price

The price broke above the channel with a huge rise in the buying pressure; however, the technicals point towards a consolidation ahead of the next breakout. The RSI entered the overbought range and appears to be flattening. On the other hand, On-Balance Volume spiked and continues to maintain a steady rise. Flattening RSI & rising OBV is usually a bullish signal, hinting towards accumulation during consolidation. It implies that smart money is quietly buying regardless of price movement and creating bullish pressure beneath the surface. 

Therefore, traders can expect a cooling phase before breaking the resistance zone between $1.86 and $1.94 that may pave the way beyond $2 to reach $2.1. 

Zcash (ZEC) Price Eyes 35% Rise to Hit $500

Zcash price is witnessing one of the bulliest months, not seen in the past few years. The buying volume rose back to the 2021 bull run days, which helped the price mark a steep rise after following a prolonged ascending consolidation. Currently, the ZEC price has surpassed one of the important resistances, which was the market top during the 2021 bull run. If the price sustains within the range, a continued upswing may help the price break higher targets. 

zcash price

As seen in the above chart, the ZEC price has broken the resistance zone between $293 and $316 and closed the weekly trade above this range. This suggests the bulls have held a tight grip over the rally, and the momentum may not fade as OBV remains escalated. Interestingly, the 50/200 weekly MA underwent a bullish crossover that could help the token sustain the upward trend and push towards the higher targets at 1.2 FIB at $471 and 1.4 FIB at $522. 

Regardless of the 20% Jump Dash (DASH) Price Awaits a Breakout

Ever since the rally rose above the impact of the 2022 bear market, the DASH price has been stuck within a massive descending parallel channel. Every attempt of the token to break the resistance has resulted in a strong rejection, while the current scenario raises some hopes. The price has been defending the pivotal support just above $40 for a few weeks and hence flashes a huge possibility of a breakout above $60 in the coming days. 

dash price

The DASH price remains within the descending parallel channel but has secured the pivotal support at the 200-day MA. With the volume spiking to the highest levels not seen in recent times, a breakout from the range could be imminent. On the other hand, the RSI has yet again entered the overbought range. Previously, this move followed a steep rejection, but the current rebound suggests there could be more room for the price to rise. Therefore, once the RSI reenters back into the overbought range, the price could break the channel and rise above the resistance zone between $61 and $63. 

Once these levels are secured, the Dash price may enter a strong bullish trend and probably reach $100 in 2025.

❌