Reading view

SEI Price Dips Sharply: Is it Time to Accumulate or Cut Losses?

SEI Price Rebounds Sharply, Eyes $0.2545 as Next Target

The post SEI Price Dips Sharply: Is it Time to Accumulate or Cut Losses? appeared first on Coinpedia Fintech News

SEI has entered a crucial phase as price action tests major structural levels following weeks of sustained sell pressure. Despite the broader market showing signs of stabilization, SEI price continues to hover near its yearly lows, sparking debate over its long-term viability. Network fundamentals remain intact, with strong throughput, growing ecosystem integrations, and a focus on high-performance trading infrastructure. Yet, investor confidence appears tested as liquidity thins and speculative momentum fades—leaving the market to decide whether SEI is oversold or losing ground in a competitive Layer-1 landscape.

Top Factors Preventing SEI’s Price From Gaining Momentum

Despite SEI’s strong network fundamentals, several underlying factors continue to limit its price recovery. One major concern is the decline in trading liquidity, as reduced market participation has amplified even minor sell-offs, keeping SEI under consistent pressure. Additionally, ecosystem growth has lagged behind expectations—with relatively few flagship DeFi or NFT projects launching on the network, organic demand for SEI remains subdued.

Another headwind comes from ongoing token unlocks, which introduce new supply into the market and dampen upward momentum. At the same time, investor capital has rotated toward larger, more established assets like Bitcoin, Ethereum, and Solana, leaving mid-cap projects like SEI struggling to attract fresh inflows. Finally, waning investor interest in Layer-1 narratives has contributed to overall fatigue across this segment, forcing SEI to prove its real-world utility before it can regain market attention.

What Could Trigger a Rebound for SEI

While sentiment around SEI has cooled, several developments could shift momentum back in its favor. The first catalyst could come from renewed ecosystem expansion—if the network attracts more liquidity protocols, DEX integrations, or real-world trading platforms, it could reignite interest in SEI’s unique positioning as a trading-focused Layer-1 chain.

Another potential turning point lies in strategic partnerships and developer traction. Increased activity from builders and cross-chain collaborations within the Cosmos ecosystem could strengthen SEI’s long-term value proposition. A clear rise in on-chain usage or TVL would likely validate the project’s technical advantages and help rebuild market confidence.

Lastly, a broader market rotation into high-performance Layer-1s could play to SEI’s strengths. As traders seek faster, more efficient alternatives for decentralized trading, Sei Network’s architecture could emerge as a preferred choice—positioning SEI as one of the few tokens capable of outperforming once liquidity and sentiment return.

Will the SEI Price Rebound to $0.5?

SEI’s price action has entered a critical zone as broader crypto markets consolidate ahead of major macro events. After months of steady decline, the token now trades near its long-term support, sparking debate between bearish exhaustion and early accumulation. Despite strong network fundamentals, investor sentiment remains cautious amid low liquidity and competitive pressures in the Layer-1 space. The coming weeks could be decisive in determining whether SEI’s consolidation signals a bottom or an extended phase of stagnation.

sei price

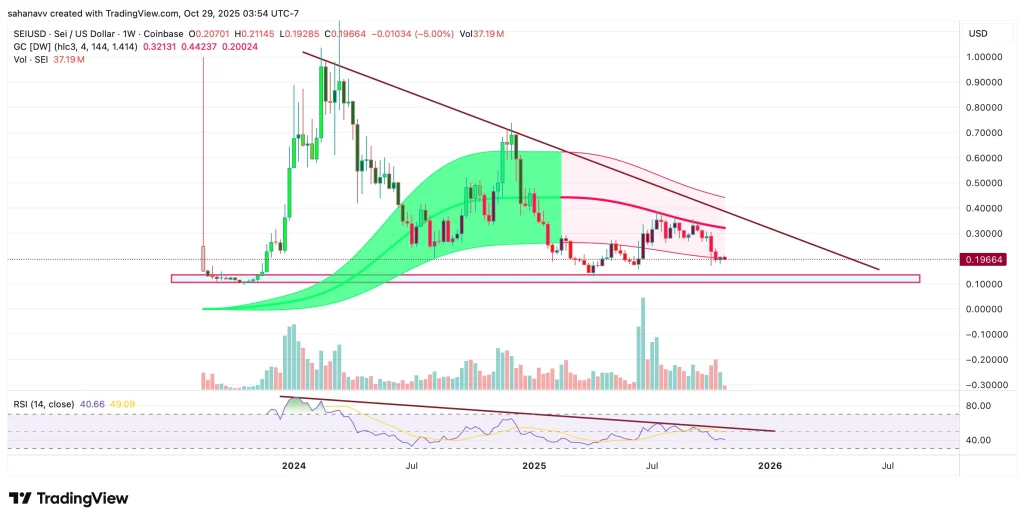
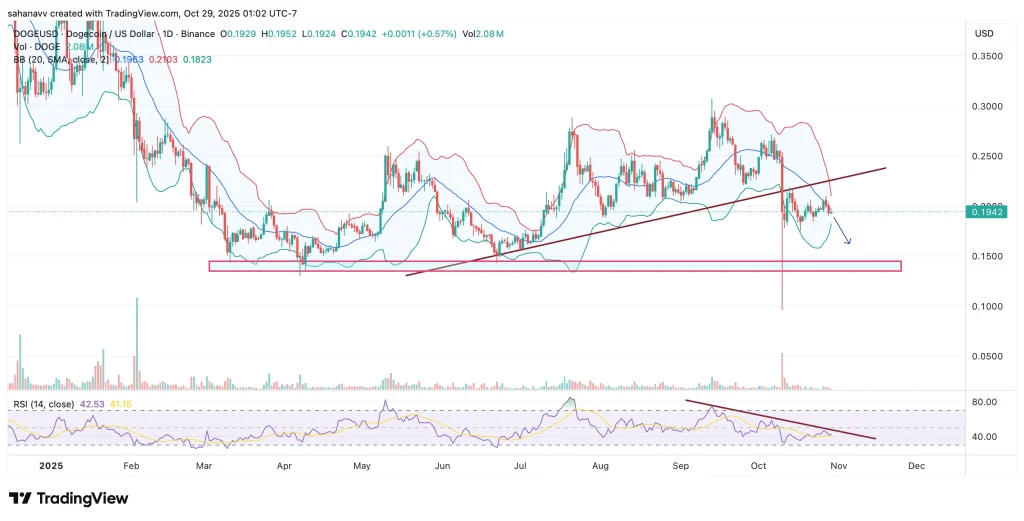
The weekly chart shows SEI testing the lower band of the Gaussian Channel, indicating an oversold zone where reversals often occur. The RSI hovers near 40, suggesting weakening bearish momentum but not yet signalling a clear recovery. If price rebounds from the channel’s lower boundary, SEI could retest the mid-channel resistance near $0.30, confirming early accumulation. However, a breakdown below the channel with RSI slipping further could reinforce bearish sentiment, potentially driving the token toward the next major support around $0.12.

Collectively, the short-term SEI price weakness reflects market fatigue, while the project’s focus on trading infrastructure and efficiency continues to set it apart in a crowded Layer-1 landscape. If Sei Network succeeds in attracting new dApps, partnerships, and liquidity, current levels could represent an attractive entry for long-term investors. However, sustained ecosystem stagnation may limit upside potential, leaving SEI struggling to reclaim broader market attention.

DOGE Price on the Verge of Breakout—Will Bulls Push It Past $0.215 This Week?

Why Dogecoin (DOGE) Price is Surging Today?

The post DOGE Price on the Verge of Breakout—Will Bulls Push It Past $0.215 This Week? appeared first on Coinpedia Fintech News

Dogecoin (DOGE) price is flashing a major bullish signal as the broader crypto market steadies ahead of this week’s highly anticipated FOMC meeting. Bitcoin (BTC) continues to consolidate around the $113,000 mark, while Ethereum (ETH) holds near $4,000, both awaiting fresh cues from the Federal Reserve’s policy outlook. Amid this cautious sentiment, DOGE has emerged as a standout performer, reclaiming key support levels and showing signs of renewed momentum. 

With rising trading volumes and improving technical structure, analysts believe DOGE could be gearing up for a decisive move toward the $0.215 resistance zone this week. 

On the other hand, the top memecoin is also displaying a bearish divergence, which needs to be considered ahead of the incoming volatility. Ever since the infamous crash fueled by the US-China trade war, the DOGE price has remained stuck within a narrow range. However, the price continued to form constant higher highs and lows, which raised the possibility of securing above the local resistance at $0.21. However, the technicals suggest the price may experience a notable pullback, preventing a rise above this range. 

doge price

The Dogecoin (DOGE/USDT) daily chart reveals a cautious yet potentially bullish setup. After breaking below its ascending trendline, DOGE has entered a consolidation phase near the $0.19 level, maintaining support above the $0.18 zone. The Bollinger Bands show price compression, indicating reduced volatility and a possible buildup for the next move. However, a downward arrow suggests a short-term correction toward the $0.16–$0.17 support range if the current support fails.

The RSI hovers around 42 with a visible descending trendline, reflecting weakening momentum but also hinting at a potential reversal if it breaks above resistance. Sustaining above $0.19 could open the path toward $0.21–$0.215, while rejection may trigger a retest of lower support levels.

In conclusion, Dogecoin’s price action suggests a make-or-break zone near $0.19. A confirmed rebound above this level could trigger a short-term rally toward $0.21 and potentially $0.215. However, failure to hold above the current support may drag the price back toward the $0.17–$0.16 demand zone before any bullish reversal attempts. Overall, DOGE remains range-bound but poised for a decisive breakout in the coming sessions.

Bitcoin Holds Steady Ahead of FOMC Decision—Will BTC Price Ignite a Major Rally Next?

Tucker Carlson

The post Bitcoin Holds Steady Ahead of FOMC Decision—Will BTC Price Ignite a Major Rally Next? appeared first on Coinpedia Fintech News

It’s again an FOMC day, and again Bitcoin prices have begun to consolidate ahead of the meeting, reflecting the prevailing uncertainty within the markets. The selling pressure has piled up during the last trading day, dragging the levels close to $112,000 from the intraday highs above $116,000. Although the bears have not held a tight grip over the rally, the hawkish stance of the Fed chairman could weaken the bulls. This could further cause more harm to the BTC price rally in the short term. 

Bitcoin price has retraced a bit ahead of most of the FOMC meeting, which has largely resulted in a strong breakout. The token recently rebounded before hitting the lower liquidity levels around $111,000, wherein over $100 million in longs were piled up. The trade is still active, suggesting the traders still look out for an entry at this point, while they are unsure above $114,000, as more than $121 million in shorts have already accumulated around this range. 

bitcoin price

The liquidity levels suggest indecisiveness among the traders as the price remains consolidated between the piled longs and shorts. So in this case, how FOMC may impact the prevailing accumulation, as a rise above $114,000 may trigger shorts, while a drop below $111,000 could liquidate the longs. 

Where Will Bitcoin (BTC) Price Head Next? 

Regardless of the FOMC volatility, the BTC price largely remains within a bullish structure, a rising parallel channel. The lower-timeframe chart displays a strong rebound from support after a pullback. However, the result of the upcoming FOMC meeting could have a significant impact on the rally, which may either rise above the average zone of the parallel channel or break the support. 

bitcoin price

Bitcoin is showing immense strength in the hourly chart, validated by the recent rebound, which was much above the pivotal support zone around $110,000. We had some volume spikes, but more importantly, the hourly MACD is about to turn bullish. This suggests the buying volume is slowly superseding the bears. On the other hand, the stochastic RSI just rebounded from the oversold zone, indicating a continued rise for the new hours. 

Final Take: Will FOMC Push the Bitcoin Price Above $115,000?

Bitcoin appears to be consolidating within a rising channel, with price action currently testing mid-range support near $112,500. The chart highlights a potential bounce toward the $115,000–$117,000 zone if bulls hold this level, which also aligns with the mid-channel Fibonacci retracement. However, failure to defend the support trendline and the nearby CME gap could trigger a sharp decline toward $108,000–$106,000, marking a deeper correction. The upcoming FOMC decision will likely determine which scenario unfolds.

Official Trump Token Faces Tug-of-War Between Bulls and Bears— What’s Next for the Price?

TRUMP Coin Price

The post Official Trump Token Faces Tug-of-War Between Bulls and Bears— What’s Next for the Price? appeared first on Coinpedia Fintech News

After a sharp rally that sent the Official Trump (TRUMP) price token soaring in recent sessions, the momentum now appears to be cooling as the market enters a phase of equal bullish and bearish pressure. Traders are closely watching whether the token can sustain its gains or face a short-term correction amid broader market uncertainty. As buying momentum slows, the next few trading sessions could decide whether TRUMP’s price resumes its uptrend or confirms a near-term pullback.

Ecosystem Expansion and Massive Earnings Drive Official Trump Token’s Momentum

The Official Trump (TRUMP) token has captured market attention once again, surging nearly 30% after the announcement that USD1, a Trump-linked stablecoin, will launch on the Enso Chain. The move is seen as a key step in expanding the Trump crypto ecosystem, potentially enhancing TRUMP’s real-world utility and investor confidence. This expansion comes as momentum traders position for further gains, though short-term consolidation remains likely amid rising market volatility.

Adding to the buzz, a Reuters investigation revealed that the Trump Organisation generated approximately $802 million from crypto-related ventures between January and June 2025—surpassing its traditional business income during the same period. Of this, nearly $336 million reportedly originated from the TRUMP token, spotlighting the financial weight of the Trump-backed digital asset. However, the findings have reignited debate over governance, transparency, and political influence in crypto markets, with regulators and investors alike watching closely how the ecosystem evolves in the coming weeks.

TRUMP Price Analysis: Is A Bullish Monthly Close on the Horizon?

The Official Trump (TRUMP) token is showing signs of renewed strength after months of steady decline. Following a sharp rebound from its October lows, the price has broken above a key descending trendline for the first time since May, signalling potential bullish reversal momentum. Trading volume has spiked notably, reflecting increased investor interest. However, with the token now hovering near critical resistance around $7.20–$7.30, traders are watching closely to see if this breakout holds or fades into consolidation.

trump price

The chart shows TRUMP testing a long-term descending resistance trendline, with current price action slightly above the $7.20 resistance zone. The DMI indicator reveals tightening pressure between bulls (DI+) and bears (DI–), suggesting balanced momentum. Meanwhile, the RSI at 57 signals moderate bullish strength but not yet overbought, implying room for upside continuation. A decisive close above $7.30 could confirm a breakout toward $8.50, while rejection here may lead to a retest of the $6.20–$6.40 support region.

Conclusion—Will OFFICIAL TRUMP Reach $10?

The Official Trump (TRUMP) token’s recent rebound above its long-term trendline has re-energized bullish sentiment, but a sustained rally toward $10 will depend on continued ecosystem growth and broader market stability. A confirmed breakout above $7.50 could open the path toward $9.80–$10.00, especially if momentum strengthens alongside renewed buying volume. However, failure to hold above $6.20 may trigger another correction phase. For now, TRUMP stands at a crucial inflexion point—where market conviction will determine whether the next move is a breakout or a fade.

Bittensor (TAO) Price Jumps 10% as Subnet Demand Surges—Can the AI Crypto Rally Sustain?

Bittensor (TAO) Price Surges, Will Bulls Push Above $434 for a New 2025 High

The post Bittensor (TAO) Price Jumps 10% as Subnet Demand Surges—Can the AI Crypto Rally Sustain? appeared first on Coinpedia Fintech News

Bittensor (TAO) price surged over 10% in the past few hours, climbing above the $450 mark as renewed demand for its subnets and rising speculative activity fuelled fresh optimism in the AI crypto sector. The decentralized machine-learning network has seen a sharp spike in trading volumes and open interest, signalling growing investor confidence. As TAO breaks key resistance levels, traders are now eyeing the $500 milestone—raising the question: can this AI-powered blockchain sustain its bullish momentum?

Why Bittensor Price Is Rising?

Bittensor’s sharp rally can be attributed to a confluence of bullish technical and fundamental factors. The most immediate catalyst is the surging demand for Bittensor’s subnets, which recorded an 11% jump in market cap within 24 hours, reflecting growing usage and developer activity. On top of that, futures open interest spiked nearly 19%, signalling strong speculative participation.

Technically, TAO has broken above a long-term descending trendline, marking a key bullish reversal pattern. The breakout has drawn renewed attention from traders who see Bittensor as one of the most promising plays in the AI + crypto narrative, especially with major institutional interest brewing in decentralized machine learning networks.

Bittensor (TAO) Technical Outlook

From a technical standpoint, Bittensor’s breakout above $434 has flipped a crucial resistance level into support, confirming a bullish reversal on both the 4-hour and daily timeframes. The price has consistently formed higher highs and higher lows, signaling sustained buying momentum. Analysts point to $466–$475 as the next critical resistance zone, beyond which TAO could target $500 in the short term.  

tao price

Bittensor (TAO) is showing strong bullish momentum, rebounding from the $280–$300 support zone and now testing the key resistance near $470. The price has surged above both the 50-day and 200-day moving averages, with the two lines converging—hinting at a potential golden cross, a classic bullish signal that often precedes strong upward trends. Rising volume confirms growing momentum, while the RSI near 63 suggests steady buying pressure. A breakout above $470could pave the way toward $500, with support around $360.

Conclusion

Bittensor’s recent price rally underscores growing confidence in both its AI-driven narrative and improving on-chain fundamentals. With rising subnet activity, expanding trading volumes, and a potential golden cross on the horizon, TAO appears technically well-positioned for further upside. However, the $470–$480 range remains a critical barrier that must be cleared for continuation toward $500 and beyond. As momentum builds, traders should watch for sustained volume and confirmation above resistance to validate the next phase of Bittensor’s bullish trend.

Bitcoin Price Extends Gains, But Technical Signals Hint at a Pullback Below $110K—What’s Next?

Will Institutional Buying Push BTC Price USD to New Highs

The post Bitcoin Price Extends Gains, But Technical Signals Hint at a Pullback Below $110K—What’s Next? appeared first on Coinpedia Fintech News

Bitcoin (BTC) price continues to trade with upward momentum, recently reclaiming levels above $113,000 as market sentiment leans cautiously optimistic. The market has followed suit, with speculation of whether this momentum can be sustained amid tightening liquidity and rising volatility. However, several technical indicators now suggest a potential cool-off phase. This raises concerns of a short-term correction below the $110,000 support zone.

Is BTC Price Heading for a Pullback?

After rebounding sharply from lows near $107,800 earlier this week, Bitcoin has steadily reclaimed lost ground, climbing back above the $113,000 mark. This recovery reflects renewed buying pressure around key demand zones, supported by improving market liquidity and increased spot trading activity. However, BTC now faces a crucial test near the $114,500–$115,000 resistance area, where profit-taking has historically intensified. Momentum indicators hint at potential exhaustion, suggesting that if Bitcoin fails to secure a daily close above this range, a corrective drop toward $110,000—or even lower—could soon follow.

Another major reason to be bearish on Bitcoin is the recently formed CME gap with the lower range close to $110,000. 

bitcoin price

Bitcoin’s rebound from the $107,800 lows has lifted prices toward $114,600, yet the move now encounters a key CME gap between $110,700 and $113,500, as highlighted on the chart. This unfilled gap has become a focal point for traders, as Bitcoin often revisits these levels before establishing a sustained trend. The Ichimoku Cloud currently acts as dynamic resistance, with the upper boundary near $115,700 aligning with the gap’s top.

Historically, BTC has tended to “fill” such CME gaps before reversing direction, suggesting a possible short-term rejection if momentum weakens. Meanwhile, the RSI around 51 signals a neutral bias, indicating potential consolidation before the next major move.

Wrapping it Up

The recent rebound in Bitcoin (BTC) price underscores improving short-term sentiment, but the broader market remains cautious amid low volatility and mixed macro cues. A decisive move beyond the $115,700 cloud resistance could reignite bullish momentum across major altcoins, fueling renewed inflows into risk assets. However, failure to clear this zone may keep BTC range-bound, with traders eyeing $110,000 as a key defensive level. With upcoming macro events and ETF flows influencing liquidity, Bitcoin’s next move could set the tone for the entire crypto market heading into November.

❌