Reading view

Ethereum Supported On Dips — Buyers Build Strength For Next Leg Higher

Ethereum price started a decent increase above $4,000. ETH is consolidating gains and could aim for more gains above the $4,220 resistance.

  • Ethereum started a fresh upward move above $4,000 and $4,120.
  • The price is trading above $4,080 and the 100-hourly Simple Moving Average.
  • There is a bullish trend line forming with support at $4,055 on the hourly chart of ETH/USD (data feed via Kraken).
  • The pair could continue to move up if it trades above $4,200.

Ethereum Price Holds Gains

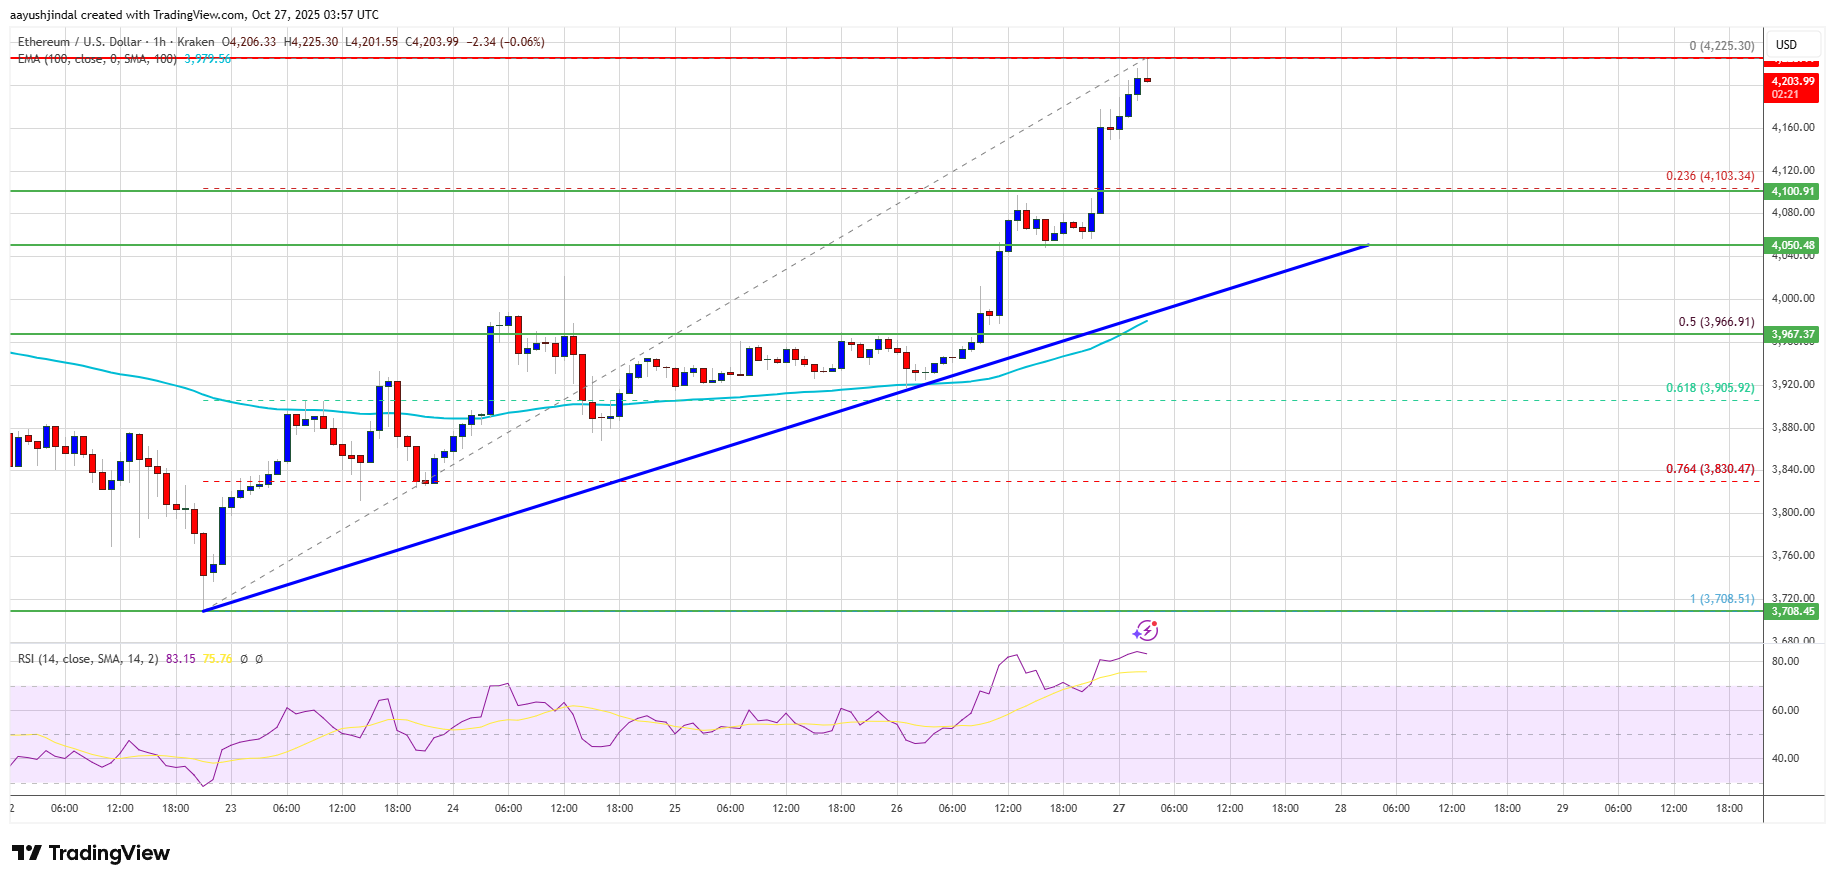
Ethereum price started a steady upward move above the $3,880 zone, like Bitcoin. ETH price surpassed the $4,000 and $4,120 levels to enter a short-term positive zone.

The price even spiked above $4,200. A high was formed at $4,252 and the price is now consolidating gains. There was a minor decline below the 23.6% Fib retracement level of the recent wave from the $3,708 swing low to the $4,252 high.

Ethereum price is now trading above $4,080 and the 100-hourly Simple Moving Average. Besides, there is a bullish trend line forming with support at $4,055 on the hourly chart of ETH/USD.

Ethereum Price

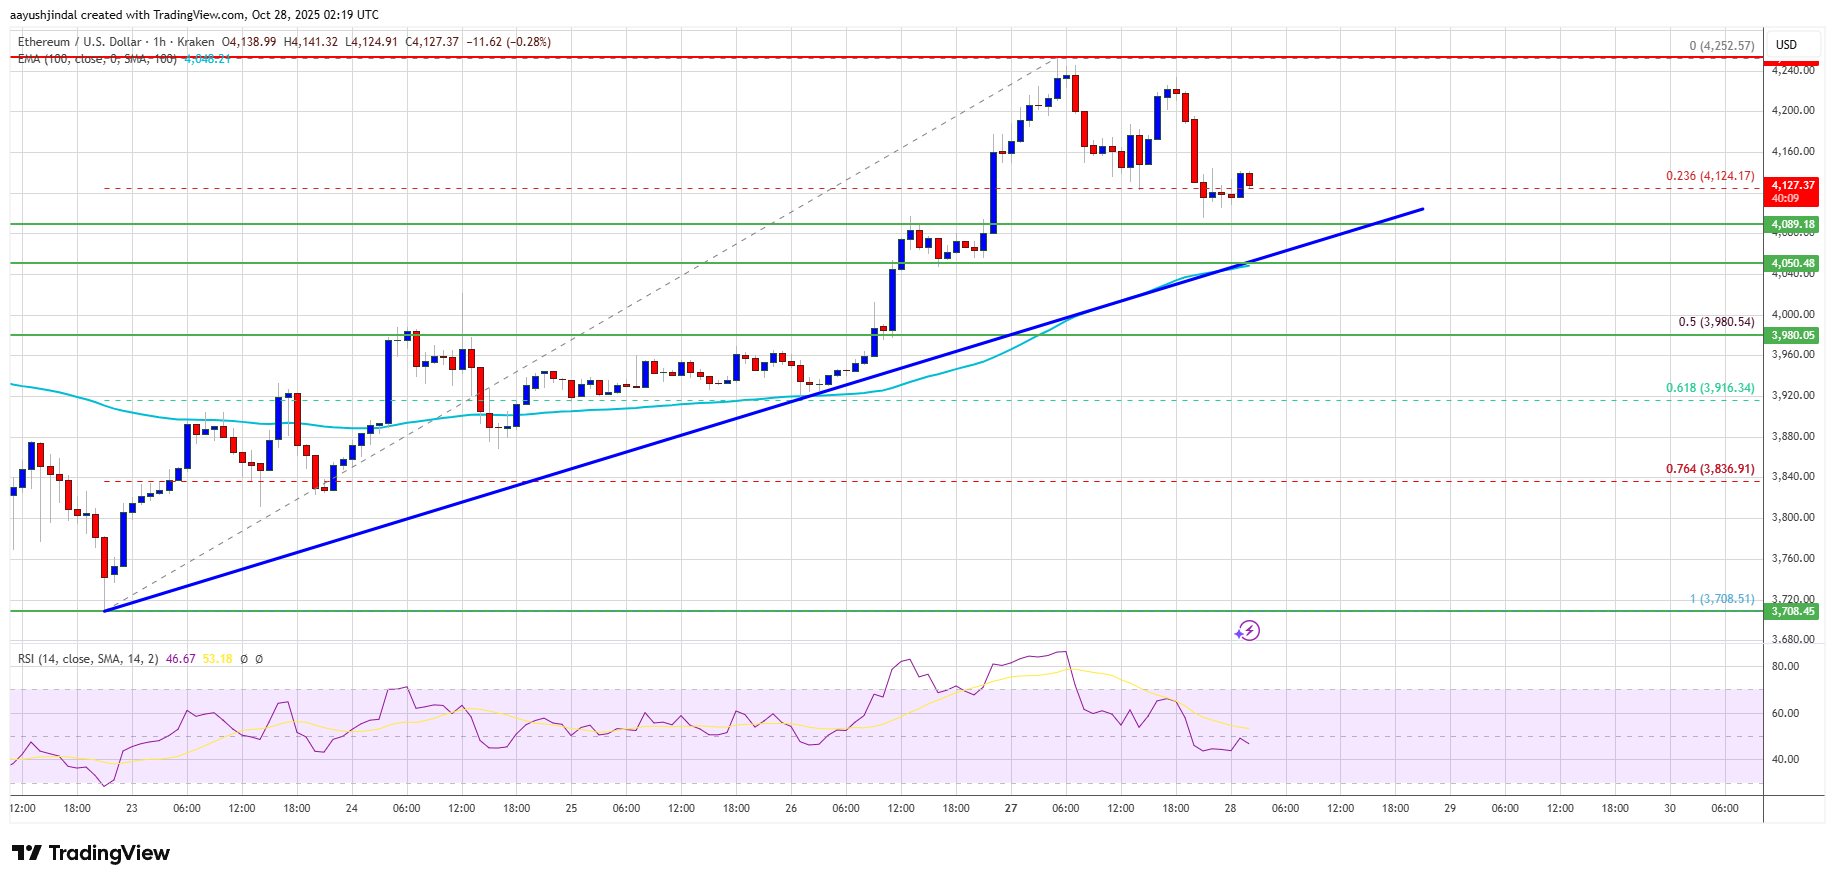
On the upside, the price could face resistance near the $4,180 level. The next key resistance is near the $4,200 level. The first major resistance is near the $4,250 level. A clear move above the $4,250 resistance might send the price toward the $4,320 resistance. An upside break above the $4,320 region might call for more gains in the coming sessions. In the stated case, Ether could rise toward the $4,480 resistance zone or even $4,500 in the near term.

Another Pullback In ETH?

If Ethereum fails to clear the $4,200 resistance, it could start a fresh decline. Initial support on the downside is near the $4,080 level. The first major support sits near the $4,050 zone and the trend line.

A clear move below the $4,050 support might push the price toward the $3,980 support or the 50% Fib retracement level of the recent wave from the $3,708 swing low to the $4,252 high. Any more losses might send the price toward the $3,840 region in the near term. The next key support sits at $3,780.

Technical Indicators

Hourly MACDThe MACD for ETH/USD is losing momentum in the bullish zone.

Hourly RSIThe RSI for ETH/USD is now below the 50 zone.

Major Support Level – $4,050

Major Resistance Level – $4,200

Crypto Analyst Shows The Possibility Of The Ethereum Price Reaching $16,000

Ethereum’s bullish momentum has intensified throughout the weekend, with the price climbing above $4,100. This steady recovery follows a strong rebound from the $3,500 region after a crash earlier in the month. 

Investor sentiment, as shown by trading volume and flows on exchanges, has turned optimistic amidst the recovery. Now that Ethereum’s price action is starting to turn bullish again, a new technical analysis shared by crypto analyst Freedomby40 on the social media platform X suggests that the current rally could be far from over, projecting a possible long-term climb to $16,000.

Wave Count Structure Points To A Continuation Phase

Freedomby40’s analysis, which is based on the Elliott Wave structure, presents Ethereum as currently positioned in an extended bullish sequence that began forming in late 2022. Posting the technical analysis on X, the analyst noted that Ethereum’s price action looks great for a continuation. 

His chart shows that the asset has just completed a corrective phase and is entering a renewed impulse wave, with support established between $3,225 and $3,563 at the 0.5 and 0.382 Fibonacci retracement zones, respectively. The analyst labels this zone as the ideal accumulation area for the next leg up, consistent with previous cycle structures seen in 2017 and 2021.

The Elliott Wave projection in his analysis presents a multi-layered confluence of impulse waves extending to the third degree. It illustrates that Ethereum is currently unfolding its fifth major impulse wave in a structure that traces back to mid-2022. 

The internal structure of this wave sequence also reveals a C wave in motion, which itself contains smaller sub-impulse waves. Within that C wave, Ethereum appears to be entering its own fifth sub-wave, which is known to be a decisively bullish wave.

Ethereum

Based on this setup, the analyst outlined two potential target zones on the chart: a green box representing the realistic price range for this wave cycle and a red box depicting the higher, more extended scenario that could push Ethereum’s market cap into the trillion-dollar level.

Fibonacci Extensions Predict Targets Of $9,000, $11,000, And $16,000

Freedomby40’s analysis identifies multiple price levels based on Fibonacci extensions from the current price action. The first price target is at $6,303, which is based on the 1.0 Fibonacci extension. This initial price target will see the Ethereum price break above its current all-time high, but this is the first of many.

The next target, the 1.236 extension, is positioned around $9,013. These two price targets ($6,303 and $9,013) were described by the analyst as very realistic. Possible extensions are at the 1.382 and 1.618 Fibonacci extension levels, corresponding to $11,210 and $16,077, respectively.

At the time of writing, Ethereum is trading at $4,160, up by 5.2% in the past 24 hours. Freedomby40’s outlook joins a growing list of ultra-bullish Ethereum price forecasts from institutional research desks and top analysts. Standard Chartered Bank recently raised its 2025 price target for Ethereum to $7,500, while projecting a potential long-term path to $25,000 by 2028.

Ethereum

Ethereum Moves Higher — Buyers Strengthen Grip Amid Renewed Market Optimism

Ethereum price started a recovery wave above $4,000. ETH is moving higher but faces a couple of key hurdles near $4,220 and $4,250.

  • Ethereum started a fresh recovery above $4,000 and $4,120.
  • The price is trading above $4,120 and the 100-hourly Simple Moving Average.
  • There is a bullish trend line forming with support at $4,050 on the hourly chart of ETH/USD (data feed via Kraken).
  • The pair could continue to move up if it trades above $4,220.

Ethereum Price Eyes Steady Gains

Ethereum price started a minor recovery wave above the $3,880 zone, like Bitcoin. ETH price surpassed the $4,000 and $4,050 levels to enter a short-term positive zone.

The price even spiked above $4,220. A high was formed at $4,225 and the price is now consolidating gains. The price is stable above the 23.6% Fib retracement level of the recent increase from the $3,708 swing low to the $4,225 high.

Ethereum price is now trading above $4,150 and the 100-hourly Simple Moving Average. Besides, there is a bullish trend line forming with support at $4,050 on the hourly chart of ETH/USD.

Ethereum Price

On the upside, the price could face resistance near the $4,220 level. The next key resistance is near the $4,250 level. The first major resistance is near the $4,320 level. A clear move above the $4,320 resistance might send the price toward the $4,450 resistance. An upside break above the $4,450 region might call for more gains in the coming sessions. In the stated case, Ether could rise toward the $4,500 resistance zone or even $4,550 in the near term.

Another Decline In ETH?

If Ethereum fails to clear the $4,220 resistance, it could start a fresh decline. Initial support on the downside is near the $4,150 level. The first major support sits near the $4,120 zone.

A clear move below the $4,120 support might push the price toward the $4,050 support. Any more losses might send the price toward the $4,000 region in the near term. The next key support sits at $3,880.

Technical Indicators

Hourly MACDThe MACD for ETH/USD is gaining momentum in the bullish zone.

Hourly RSIThe RSI for ETH/USD is now above the 50 zone.

Major Support Level – $4,120

Major Resistance Level – $4,220

❌