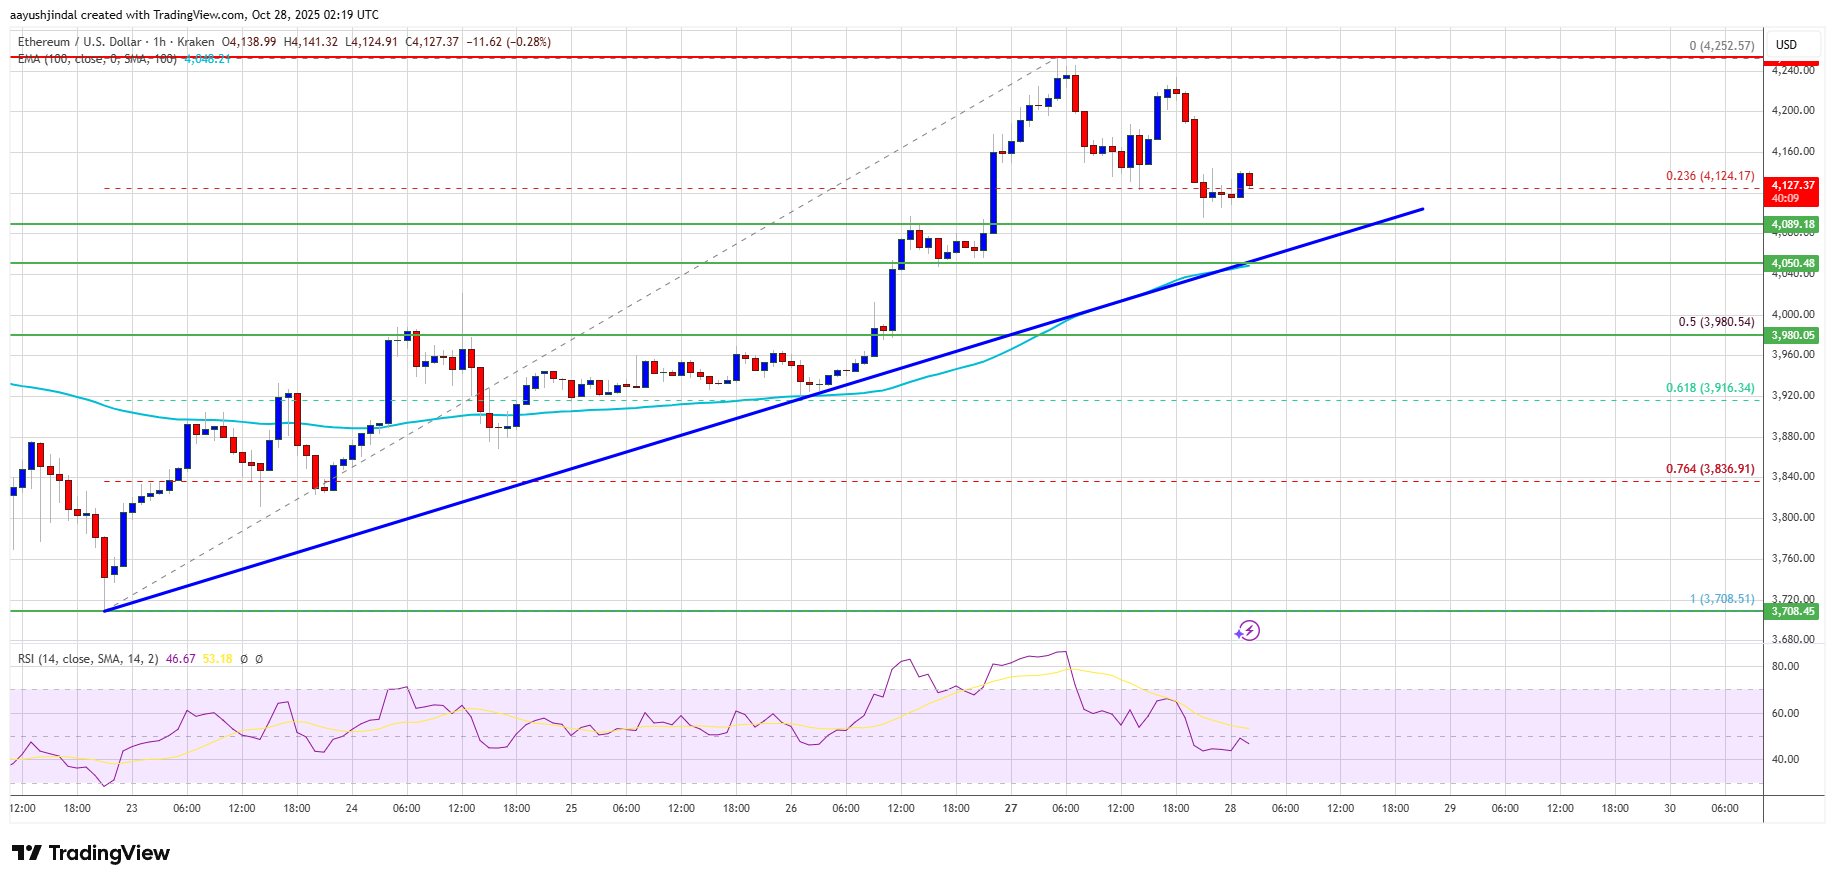
Ethereum price started a decent increase above $4,000. ETH is consolidating gains and could aim for more gains above the $4,220 resistance.
Ethereum started a fresh upward move above $4,000 and $4,120.
The price is trading above $4,080 and the 100-hourly Simple Moving Average.
There is a bullish trend line forming with support at $4,055 on the hourly chart of ETH/USD (data feed via Kraken).
The pair could continue to move up if it trades above $4,200.
Ethereum Price Holds Gains
Ethereum price started a steady upward move above the $3,880 zone, like Bitcoin. ETH price surpassed the $4,000 and $4,120 levels to enter a short-term positive zone.
The price even spiked above $4,200. A high was formed at $4,252 and the price is now consolidating gains. There was a minor decline below the 23.6% Fib retracement level of the recent wave from the $3,708 swing low to the $4,252 high.
Ethereum price is now trading above $4,080 and the 100-hourly Simple Moving Average. Besides, there is a bullish trend line forming with support at $4,055 on the hourly chart of ETH/USD.
On the upside, the price could face resistance near the $4,180 level. The next key resistance is near the $4,200 level. The first major resistance is near the $4,250 level. A clear move above the $4,250 resistance might send the price toward the $4,320 resistance. An upside break above the $4,320 region might call for more gains in the coming sessions. In the stated case, Ether could rise toward the $4,480 resistance zone or even $4,500 in the near term.
Another Pullback In ETH?
If Ethereum fails to clear the $4,200 resistance, it could start a fresh decline. Initial support on the downside is near the $4,080 level. The first major support sits near the $4,050 zone and the trend line.
A clear move below the $4,050 support might push the price toward the $3,980 support or the 50% Fib retracement level of the recent wave from the $3,708 swing low to the $4,252 high. Any more losses might send the price toward the $3,840 region in the near term. The next key support sits at $3,780.
Technical Indicators
Hourly MACD – The MACD for ETH/USD is losing momentum in the bullish zone.
Hourly RSI – The RSI for ETH/USD is now below the 50 zone.
Traders are betting on a Trump–Xi breakthrough and a dovish Fed pivot to revive “Uptober,” though markets remain wary that rare-earth restrictions and the U.S. shutdown could spoil the rally.
Investor sentiment, as shown by trading volume and flows on exchanges, has turned optimistic amidst the recovery. Now that Ethereum’s price action is starting to turn bullish again, a new technical analysis shared by crypto analyst Freedomby40 on the social media platform X suggests that the current rally could be far from over, projecting a possible long-term climb to $16,000.
Wave Count Structure Points To A Continuation Phase
Freedomby40’s analysis, which is based on the Elliott Wave structure, presents Ethereum as currently positioned in an extended bullish sequence that began forming in late 2022. Posting the technical analysis on X, the analyst noted that Ethereum’s price action looks great for a continuation.
His chart shows that the asset has just completed a corrective phase and is entering a renewed impulse wave, with support established between $3,225 and $3,563 at the 0.5 and 0.382 Fibonacci retracement zones, respectively. The analyst labels this zone as the ideal accumulation area for the next leg up, consistent with previous cycle structures seen in 2017 and 2021.
The Elliott Wave projection in his analysis presents a multi-layered confluence of impulse waves extending to the third degree. It illustrates that Ethereum is currently unfolding its fifth major impulse wave in a structure that traces back to mid-2022.
The internal structure of this wave sequence also reveals a C wave in motion, which itself contains smaller sub-impulse waves. Within that C wave, Ethereum appears to be entering its own fifth sub-wave, which is known to be a decisively bullish wave.
Based on this setup, the analyst outlined two potential target zones on the chart: a green box representing the realistic price range for this wave cycle and a red box depicting the higher, more extended scenario that could push Ethereum’s market cap into the trillion-dollar level.
Fibonacci Extensions Predict Targets Of $9,000, $11,000, And $16,000
Freedomby40’s analysis identifies multiple price levels based on Fibonacci extensions from the current price action. The first price target is at $6,303, which is based on the 1.0 Fibonacci extension. This initial price target will see the Ethereum price break above its current all-time high, but this is the first of many.
The next target, the 1.236 extension, is positioned around $9,013. These two price targets ($6,303 and $9,013) were described by the analyst as very realistic. Possible extensions are at the 1.382 and 1.618 Fibonacci extension levels, corresponding to $11,210 and $16,077, respectively.
At the time of writing, Ethereum is trading at $4,160, up by 5.2% in the past 24 hours. Freedomby40’s outlook joins a growing list of ultra-bullish Ethereum price forecasts from institutional research desks and top analysts. Standard Chartered Bank recently raised its 2025 price target for Ethereum to $7,500, while projecting a potential long-term path to $25,000 by 2028.
Photographer Chris Levine, who captured an iconic holographic portrait of Queen Elizabeth II, is being sued by artist Rob Munday who claims that he is the co-creator of the works Equanimity and Lightness of Being.
Ethereum enters the week with a sturdier floor. The tenor feels different, not loud, just confident. The latest on-chain reads show a market that prefers patience over drama, with long holders adding and fewer coins sitting on trading venues. That mix supports a measured push toward a decisive move above the recent pivot.
Why Ethereum staking matters now
The case starts with concrete data. Whale addresses holding 10,000 to 100,000 ETH expanded their stacks to roughly 31 million ETH, a band that grew during prior bull phases. Alongside that, total staked supply climbed to about 36.15 million ETH, while exchange reserves hovered near 15.9 million.
Together, the trio points to firmer hands and thinner near-term sell pressure, which often precedes breakouts when macro is not a headwind. These figures were highlighted in a Monday roundup that also noted ETH trading near 4,225 after a swift 7 percent rebound, published on October 27, 2025.
Ethereum staking is pulling coins out of the active float, which tightens supply during risk-on stretches and cushions drawdowns when volatility flickers. The mechanical effect is simple. Fewer liquid tokens on exchanges can amplify price sensitivity to fresh demand. The behavioral effect matters too. Participants willing to lock capital for yield tend to ignore noise and trade less often, which steadies the tape.
The Policy
Policy and positioning sit in the background like stage lighting. The fund market premium tied to ETH has held in positive territory in recent snapshots, a sign that institutional appetite remains constructive when futures trade above spot. When that premium stays above zero, subsequent weeks have often leaned higher, according to prior analyses.
Public voices are adding color. Vitalik Buterin recently defended the design choice that exiting validators face some friction, stating that
“friction in quitting is part of the deal. An army cannot hold together if any percent of it can suddenly leave at any time.”
The framing underscores why a multi-week exit path exists and why the process lowers reflexive churn during stress events.
Regulatory temperature also enters the frame. Brian Armstrong has pressed for uniform access to services, writing that “more dominoes [are] falling” and that states blocking staking harm residents by limiting participation. The comment came alongside progress on staking availability in key jurisdictions, reinforcing the view that participation can broaden as rules settle.
Ethereum staking: Source X
The whales’ role
From a trading perspective, Ethereum staking changes how pullbacks behave. When whales accumulate and a larger slice is locked, dips tend to meet bids faster, especially near well-watched supports. If buyers defend the 4,200 to 4,300 zone and the broader market avoids a macro shock, traders will likely lean into a retest of the next shelf overhead. The cleaner the order book, the faster momentum accounts re-enter.
The medium view improves if fund flows and derivatives stay balanced. A steady premium, coupled with calm liquidations, removes fuel for disorderly swings. That is the kind of backdrop where narratives breathe and relative strength rotates toward assets showing inflows. In that scenario, Ethereum staking can play the quiet role of ballast, letting incremental demand translate into a trend rather than chop.
ETH predictions
Price prediction is never a promise, but the map is readable. If ETH holds above the pivot and clears 4,500 with volume, the path opens toward a measured climb into the mid-4,000s, with an eventual attempt at the prior all-time high if macro winds cooperate.
If the pivot fails, a revisit of lower support would not break the thesis unless exchange reserves rise and long holders start distributing. The presence of large locked supply through Ethereum staking would still argue for a patient, stair-step structure rather than a slide.
Conclusion
Momentum grows when supply tightens and confidence improves. With whales adding, reserves thin, and the fund premium supportive, the setup leans constructive. A clean push through the pivot would validate the view that Ethereum staking is acting like a new version of strong hands, turning calm conviction into staying power.
Frequently Asked Questions
What is Ethereum staking and how does it affect price action? Ethereum staking is the process of locking ETH to secure the network and earn yield. Reducing the liquid supply on exchanges can make prices more sensitive to fresh demand, which may support trend formation when sentiment is improving.
Why does the fund market premium matter for ETH? A positive premium indicates that futures trade above spot, a sign of constructive positioning from larger investors. Persistent positive readings have historically aligned with upward drift in the following weeks.
Do validator exit queues weaken participation? Design friction exists to protect network security. As Vitalik Buterin put it, “friction in quitting is part of the deal,” which reduces herd exits during stress.
Glossary of long key terms
Fund Market Premium A metric comparing futures pricing to spot that helps gauge institutional sentiment. Positive values often signal supportive demand from professional money.
Exchange Reserves The aggregate ETH held on trading venues. Lower reserves suggest fewer coins available for immediate sale and can point to reduced sell pressure.
Realized Price An on-chain estimate of the average cost basis for all coins. Price action above realized price indicates aggregate profit, while deep moves below have aligned with capitulation zones in past cycles.
Whale Accumulation Band A supply band tracking holdings of large addresses. Rising balances in the 10,000 to 100,000 cohort have preceded strong cycles in earlier years.
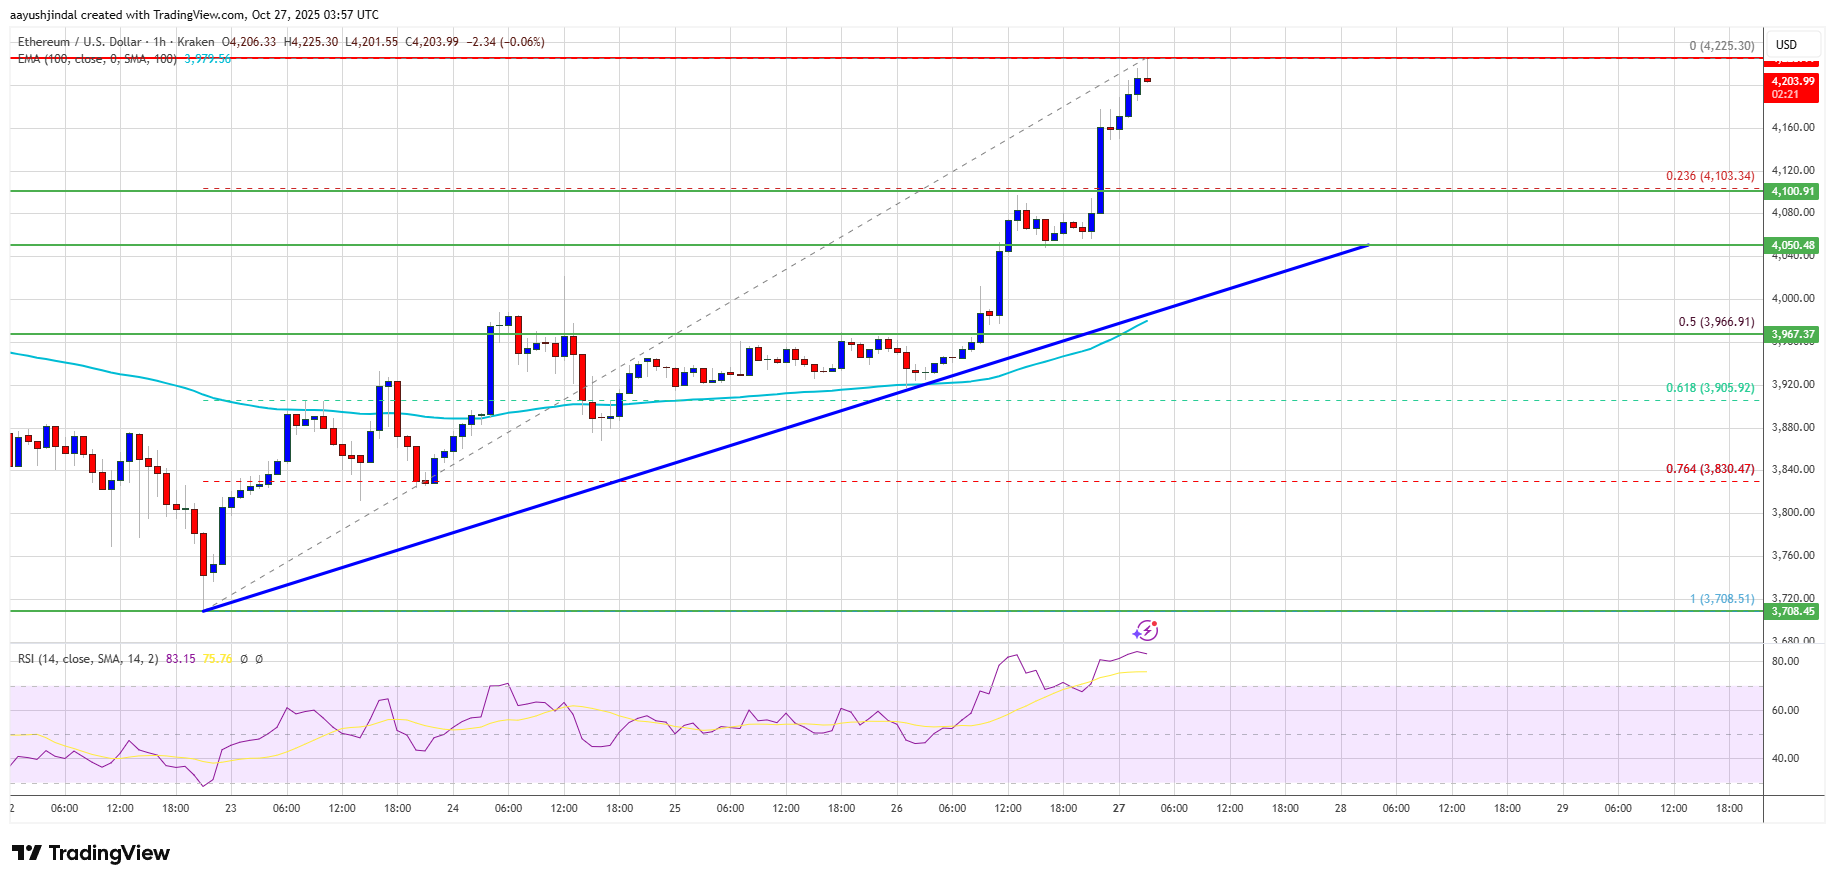
Ethereum price started a recovery wave above $4,000. ETH is moving higher but faces a couple of key hurdles near $4,220 and $4,250.
Ethereum started a fresh recovery above $4,000 and $4,120.
The price is trading above $4,120 and the 100-hourly Simple Moving Average.
There is a bullish trend line forming with support at $4,050 on the hourly chart of ETH/USD (data feed via Kraken).
The pair could continue to move up if it trades above $4,220.
Ethereum Price Eyes Steady Gains
Ethereum price started a minor recovery wave above the $3,880 zone, like Bitcoin. ETH price surpassed the $4,000 and $4,050 levels to enter a short-term positive zone.
The price even spiked above $4,220. A high was formed at $4,225 and the price is now consolidating gains. The price is stable above the 23.6% Fib retracement level of the recent increase from the $3,708 swing low to the $4,225 high.
Ethereum price is now trading above $4,150 and the 100-hourly Simple Moving Average. Besides, there is a bullish trend line forming with support at $4,050 on the hourly chart of ETH/USD.
On the upside, the price could face resistance near the $4,220 level. The next key resistance is near the $4,250 level. The first major resistance is near the $4,320 level. A clear move above the $4,320 resistance might send the price toward the $4,450 resistance. An upside break above the $4,450 region might call for more gains in the coming sessions. In the stated case, Ether could rise toward the $4,500 resistance zone or even $4,550 in the near term.
Another Decline In ETH?
If Ethereum fails to clear the $4,220 resistance, it could start a fresh decline. Initial support on the downside is near the $4,150 level. The first major support sits near the $4,120 zone.
A clear move below the $4,120 support might push the price toward the $4,050 support. Any more losses might send the price toward the $4,000 region in the near term. The next key support sits at $3,880.
Technical Indicators
Hourly MACD – The MACD for ETH/USD is gaining momentum in the bullish zone.
Hourly RSI – The RSI for ETH/USD is now above the 50 zone.
Ethereum’s largest non-exchange holders are tiptoeing back into accumulation. On-chain analytics platform Santiment reported that wallets holding between 100 and 10,000 ETH, also known as whales and sharks, have begun to rebuild positions after unloading roughly 1.36 million ETH between October 5 and 16.
Notably, the Ethereum collective holdings chart shows that nearly one-sixth of those coins have already been clawed back, as some confidence starts to return to the second-largest crypto asset.
Whales Reverse Course After Early-October Capitulation
The first half of October was highlighted by one of Ethereum’s most pronounced periods of capitulation this year. Macroeconomic fears due to US tariffs saw the Bitcoin price undergo a flash crash that dragged many altcoins to the downside. During this move, Ethereum’s price also fell very quickly, dropping from highs around $4,740 on October 7 to as low as $3,680 on October 11.
Interestingly, on-chain data shows that the selling pressure from large holders amplified this move, as the chart from Santiment shows a steep decline in their cumulative holdings from about 24.5 million ETH to roughly 22.6 million ETH. This 1.9 million ETH drop reflected clear risk-off behavior among whales and sharks, who had been net buyers since August.
However, once selling momentum began to fade, accumulation started to return. Institutional inflows started to return into Spot Ethereum ETFs, and whale/shark trades started accumulating Ethereum. Since October 16, the same cohort that contributed to the liquidation has begun adding back to their positions. Santiment noted that these holders are finally showing some signs of confidence, demonstrating an incoming extended recovery phase following the shakeout.
218,470 ETH Added In Last 7 Days
According to Santiment’s data, the collective holdings of addresses with 100 to 10,000 ETH have rebounded to approximately 23.05 million ETH after bottoming out in mid-October. A highlighted annotation on the chart shows that 218,470 ETH were accumulated in just the past week, signaling a tangible shift in on-chain behavior.
This increase represents roughly one-sixth of the coins previously dumped, a sign that major investors are gradually re-entering the market after what appeared to be an exhaustion phase. Similar accumulation trends have often preceded a broader recovery in Ethereum’s price, especially when accompanied by stabilization in the ETH/BTC trading pair.
As it stands, the Ethereum price appears to be building a firmer base for the next phase of its recovery heading into November. When whale wallets accumulate, it reduces the circulating supply available on exchanges and reduces selling pressure.
At the time of writing, Ethereum is trading at $3,940 and is on track to break and close above $4,000 again. Both Ethereum and Bitcoin have risen a bit in recent days after inflation report showed US inflation cooling to 3% in September, below the 3.1% forecasted by economists.
Featured image from Unsplash, chart from TradingView
Ethereum is showing renewed strength after rebounding from its Bull Market Support Band, a key zone that has historically served as a launchpad for major uptrends. The bounce signals a possible shift in momentum, but the real test now lies ahead. With the price approaching the crucial golden pocket resistance, a breakthrough is likely to confirm a sustained bullish phase.
ETH Bounces Back From Weekly Bull Market Support Band
In his recent update on ETH, Luca, a crypto analyst on X, noted that the asset has once again found solid footing at a familiar support area. According to Luca, the price has successfully bounced off the Weekly Bull Market Support Band. This rebound also aligns perfectly with the high-timeframe support range highlighted in his previous PAT updates, reaffirming the technical strength of this level.
He emphasized that this move was largely anticipated, as the support zone has repeatedly proven to be a reliable area for bullish reactions whenever ETH enters a corrective phase. The recent bounce signals that buyers are still active and willing to defend key levels, which could set the stage for renewed momentum if sustained.
However, Luca urged caution in the short term, pointing out that ETH is now approaching a major resistance zone. This zone corresponds with the golden pocket area between the 0.5 and 0.618 Fibonacci levels, where Ethereum previously encountered selling pressure. A failure to break above this region could result in sideways movement or a minor pullback before any decisive trend shift occurs.
ETH Eyes High-Timeframe Resistance Range For Next Leg Up
The analyst further explained that if Ethereum manages to break above the current resistance range, it would signal a decisive shift in market structure. Such a move would confirm renewed bullish momentum, paving the way for a mid-term uptrend toward the high-timeframe resistance zone marked in red.
He added that as long as ETH holds above the “golden pocket” zone after a breakout, the most likely outcome remains further upward. Sustaining momentum above this key area would reinforce the bullish narrative, suggesting that Ethereum could continue climbing toward higher resistance levels without facing major corrections.
However, until that breakout occurs, the analyst expects a period of consolidation around the current support band. According to the analyst, this phase would likely serve as a base for a more durable upside reversal in the future. At this time, patience remains essential, as the ongoing structure hints that Ethereum is preparing for a stronger, more sustained rally once the market confirms direction.
Analysts on X outlined five-digit targets for ether while Santiment said larger wallets have started adding again, framing a longer path higher if resistance gives way.
The cryptocurrency market has not had its typical “Uptober” performance so far this month, with most large-cap assets falling to new local lows in the past few months. The Ethereum price, which was on the verge of hitting $5,000 a few weeks ago, is now languishing below the $4,000 mark.
While the “king of altcoins” had a stop-start performance over the past week, its price seems to be in a better place than it was seven days ago. However, an interesting outlook has emerged for the Ethereum price, with the altcoin believed to have already reached its peak in this cycle.
How Feasible Is A Double Top For ETH Price?
Popular crypto analyst Ali Martinez recently took to the social media platform X to share insights into the current setup of the Ethereum price. According to the market pundit, the second-largest cryptocurrency could be in for an extended bearish period over the next few weeks.
This evaluation revolves around the potential formation of the “double top” pattern on the 3-day timeframe of the Ethereum chart. For context, the double top formation is a technical analysis pattern suggesting a possible bearish trend reversal after an asset’s price touches a resistance level without breaking through.
As observed in the chart above, the initial top came around late 2021 during the altcoin season when the price of ETH rose to the then-all-time high of above $4,800. This price peak was followed by a market crash, which saw the value of Ethereum drop to around the $1,000 mark by mid-2026.
Meanwhile, the purported second top of this Ethereum price setup is the current all-time high of $4,946, reached earlier in August 2025. According to data from CoinGecko, the altcoin’s value is currently more than 20% adrift from this record high.
While the two tops (nearly four years) look somewhat identical, the price action between them makes it tricky to definitively call them a “double top” pattern. Moreover, the double top can only be confirmed when the price drops below the support level, which typically is the lowest point between the two peaks. This support level would then be at around $1,000, which is a significant distance from the current price point.
Nevertheless, it is important to pay attention to the price movement of ETH over the next few weeks, as it could provide insight into the coin’s future relative to this setup.
Ethereum Price At A Glance
As of this writing, the price of ETH stands at around $3,983, reflecting an almost 3% jump in the past 24 hours.
Unlike Bitcoin, the Ethereum price has struggled to hold up, and even after the crypto market recovery, the price remains below $4,000, which is a major psychological level. Given this, it seems that the cryptocurrency is set to close the month of October in the red, losing almost 5% of its value already this month. However, with the month of November quickly rolling by, the Ethereum price might be in for a bounce, as November has historically been green for the market.
November Could Hold The Key For Ethereum Price
Looking at the historical price data for Ethereum on the CryptoRank website, there seems to be a balance between years when the month was red and years when it was green. In a decade, there have been five years where the Ethereum price has seen gains in November and five years where there have been losses.
However, there seems to be a rather bullish pattern: the years when the month was green saw double-digit gains, eventually resulting in higher gains than losses. As a result, the average return for the month is 6.93%, and the median return, while low, also remains positive at 1.42%.
Given the fact that there is no clear trend to pinpoint where the price is headed, the bears and the bulls look to have equal chances. But if it does turn out to be in the green, it is likely that the Ethereum price will witness a double-digit surge. Such a move would help it clear the $4,000 resistance with momentum.
Q4 Still Has Potential
Quarterly returns for the Ethereum price have not exactly been the best in the last quarter of the year, but that has not changed the fact that the altcoin tends to perform quite well overall. There is also the trend of Q4 ending in the green if the previous Q2 and Q3 were in the green, which is the case right now.
In Q2 of 2025, the Ethereum price ended with an average positive return of 36.5% and in Q3, it followed with a 66.7% return, the highest so far. With October trending low, there is already a 4.83% decline this year, but with more than 2 months to go, there is still time for things to change.
Only one year in history has the Ethereum price closed Q4 in the red after Q2 and Q3 ended in the green, and that was nine years ago in 2016. Since then, the trend has always seen the ETH price continuing the rally. This was the case back in 2017, and then again in 2020 and 2021.
Since then, this trend has not returned, and 2025 is the first time in four years that the Ethereum price has ended both Q2 and Q3 in the green. If the historical performance holds, the Ethereum price could see an average of a 50% increase, or even double, like it did back in 2017 and 2020, before the year is over.
The financial world is witnessing an unprecedented shift, as Ethereum solidifies its position as the sole asset capable of becoming a multi-trillion-dollar institutional store of value. ETH is the only one currently demonstrating the scale, utility, and institutional acceptance to command and securely hold multi-trillion-dollar allocations, fundamentally redefining the future of global wealth preservation and growth.
Why Ethereum Is The Foundational Role For Institutional Capital
Ethereum has quietly become the final form of digital trust for institutions to store trillions of dollars. A market expert and entrepreneur, partnering with OKX and MEXC, Ted Pillows, has stated on the social media platform X that ETH decentralization is nearly impossible to replicate, a network that was largely community-funded, not VC-funded, and forged through proof-of-work (PoW).
Furthermore, the reliability of ETH has been 100% uptime over 10 years of flawless operation and 16 successful upgrades. The ETH Layer 1 and Layer 2 architectures are designed to offer regulatory safety, where institutions can deploy compliant solutions. Meanwhile, the KYC-enabled Layer 2s do not compromise on the fundamental decentralization or security of the leading ETH blockchain.
Maintaining A Buffer For Market Opportunities
While Ethereum is a safe place for institutional investors to store trillions of dollars, analyst Luca has noted that the ETH price has shown strength as it bounced off the Weekly Bull Market Support Band, which has previously acted as a strong reversal over several weeks. This level also aligns with the high-timeframe support area marked in green, the same zone that served as a major resistance throughout most of 2024.
Luca believes that due to this confluence, and as long as the price holds above this range, the broader market structure will continue to favor the upside. However, ETH still faces a critical test ahead. Until it breaks above the golden pocket between the 0.5 and 0.618 Fibonacci retracement Point of Interest (POIs), the same zone that triggered the last rejection, the analyst highlighted that the best approach is to stay somewhat cautious. He also added that investors should be ready for further consolidation within the high-timeframe accumulation range.
As Luca has highlighted, the priority now is risk management. Avoid unnecessary leverage, don’t overexpose on short-term setups, and maintain a diversified portfolio with moderate exposure to defensive sectors. This will help ride out the volatility as ETH moves closer to the top of the cycle. While advocating for a cash buffer, the expert noted that if ETH breaks below the Weekly Bull Market Support Band, it would signal a potential deeper downside and justify hedging part of spot holdings to mitigate short-term risk.
Reports have disclosed a 400% rise in stablecoin transfers on Ethereum over the last 30 days, pushing total transfer volume to $581 billion and more than 12.5 million transfers, according to Token Terminal.
The stablecoin market cap on Ethereum now tops $163 billion. At the same time, Ethereum has fallen about 4.50% in the past week, and briefly tested support near $3,738, which some traders called a buying opportunity.
Whales Step In With Large Buys
On-chain trackers show heavy buying from large holders. A newly created wallet, 0x86Ed, spent $32 million to pick up 8,491 ETH in roughly three hours, based on Arkham Intelligence records.
Another high-profile account monitored by LookOnChain moved 284K USDC into Hyperliquid after recent liquidations, apparently to maintain long exposure to ETH.
Reports say October’s stablecoin transaction volume on Ethereum passed $1.91 trillion for the second time on record, a sign that big flows are still moving through the network.
USDT usage on Ethereum is at an all-time high, with key metrics up ~400% from Sep ’23 lows.
Monthly transfer volume in September was $580.9 billion & transfer count 12.5 million.
CryptoQuant and exchange data point to a rise in institutional interest. CME futures open interest for ETH has climbed, suggesting larger players are setting positions ahead of a potential price move.
Fundstrat’s Tom Lee was cited saying ETH could head toward $5,000 if the ETH/BTC ratio clears the 0.087 resistance. Matt Sheffield, CIO at Sharplink Gaming, told analysts that past liquidations did not stop real use and that the scale of payments on legacy systems — SWIFT processes about $150T a year — shows how much room exists for stablecoins to grow on Ethereum.
Big money is flowing into #Ethereum institutional interest is clearly rising fast….
The surge in CME futures open interest signals that smart money is gearing up for a major $ETH move ahead… pic.twitter.com/8oUfApDeoP
Technical analysis experts have noted a confluence of indicators near today’s prices. Currently, ETH is trading near $3887, just above the significant Fibonacci retracement of 0.618 at $3781.
The 0.786 retracement is near $3,640 with the level of formal invalidation set at $3443. Some technicians have pointed to a triple bottom trading pattern around $3600, as well as the potential for a new accumulation reading from a Wycoff re-accumulation pattern which could lead to higher targets (notably $5125 at the 1.618 extension.
Balance Between Flow And Risk
In sum, with heavy stablecoin flow, whale buying, and increasing interest in futures, this has created a basis for bullish calls into the $5000 range.
That said, chart patterns fail, on-chain movements may not lead to changes in price, and traders who remain cognizant of the ETH/BTC ratio, the invalidation line at $3443, and whether large transactions are transferring or being used for longer-term custody, may get more clarity in the coming sessions.
Featured image from Motion Island, chart from TradingView
Ethereum is struggling to push above the $4,000 level, as market sentiment remains uncertain and volatility keeps investors cautious. Despite several attempts, bulls have failed to sustain momentum, suggesting hesitation at key resistance levels. However, new on-chain data is drawing attention to potentially large-scale liquidity moves that could influence Ethereum’s next direction.
According to Lookonchain, an Ethereum OG holding 736,316 ETH (worth approximately $2.89 billion) recently deposited $500 million USDT into the vaults launched by ConcreteXYZ and Stable, just before their official announcement. This has sparked significant curiosity across the crypto community, as the transaction appears strategically timed and could signal preparation for major yield or liquidity activity.
ConcreteXYZ is a next-generation liquidity protocol designed to connect institutional and DeFi capital through tokenized vaults. It allows users to allocate stablecoins and crypto assets into yield-bearing strategies while maintaining full transparency and composability within the Ethereum ecosystem.
The whale’s massive deposit — preceding the public reveal — suggests potential insider positioning or high-conviction participation in these vaults. Such large inflows often act as early indicators of shifting liquidity dynamics, particularly when aligned with projects positioned at the intersection of DeFi infrastructure and institutional finance.
Whale Dominance in Aave and Stablecoin Vaults Raises Strategic Questions
According to Lookonchain, the same Ethereum OG who recently interacted with ConcreteXYZ and Stable deposited 300,000 ETH into Aave and borrowed $500 million USDT. Out of the total $775 million USDT deposited across the new vaults, this single whale accounted for 64.5% of the total liquidity, underscoring their dominant role in this sudden market activity.
This move represents a sophisticated on-chain strategy often seen among experienced whales. By supplying ETH as collateral on Aave — one of the largest decentralized lending protocols — and borrowing USDT against it, the whale effectively unlocks liquidity without selling their Ethereum holdings. This allows them to deploy large sums into yield opportunities, such as the newly launched ConcreteXYZ vaults, while retaining exposure to ETH’s long-term upside.
Such a concentration of liquidity from one entity can have several implications for the broader market. On one hand, it highlights growing confidence among deep-pocketed players in the DeFi ecosystem’s stability and profitability. On the other hand, it raises questions about market influence and systemic risk, since a single participant holds such a large portion of capital inflows.
If this borrowed liquidity is used for yield farming or strategic positioning rather than short-term speculation, it could reinforce Ethereum’s ecosystem fundamentals by increasing DeFi activity and on-chain engagement. However, if market conditions deteriorate and collateral values fall, liquidations could amplify volatility.
In essence, this massive Aave–ConcreteXYZ transaction demonstrates how whales leverage DeFi infrastructure to maintain dominance, optimize liquidity, and influence ecosystem-wide capital flows — making this one of the most significant on-chain moves of the quarter.
Ethereum Rebounds but Faces Resistance Near $4,000
Ethereum’s price is currently trading around $3,964, showing signs of a modest rebound after recent volatility. The daily chart indicates that ETH has been attempting to recover from its October lows. But remains trapped below key resistance at $4,000–$4,200, where both the 50-day and 100-day moving averages converge. This is a zone that often acts as a strong rejection area during consolidation phases.
Despite short-term gains, Ethereum’s broader structure still reflects uncertainty. The 200-day moving average, sitting near $3,200, continues to provide strong dynamic support, preventing a deeper breakdown. However, the inability to break above $4,000 has left the asset vulnerable to renewed selling pressure if momentum weakens.
Volume patterns suggest limited conviction among buyers, as each rally attempt has been met with fading strength. To regain a sustainable bullish outlook, Ethereum needs a decisive close above $4,200. This would signal a potential continuation toward $4,500 and higher. Conversely, failure to reclaim that range could lead to a retest of $3,600–$3,500.
Featured image from ChatGPT, chart from TradingView.com