Reading view

Crypto Analyst Shows The Possibility Of The Ethereum Price Reaching $16,000

Ethereum’s bullish momentum has intensified throughout the weekend, with the price climbing above $4,100. This steady recovery follows a strong rebound from the $3,500 region after a crash earlier in the month. 

Investor sentiment, as shown by trading volume and flows on exchanges, has turned optimistic amidst the recovery. Now that Ethereum’s price action is starting to turn bullish again, a new technical analysis shared by crypto analyst Freedomby40 on the social media platform X suggests that the current rally could be far from over, projecting a possible long-term climb to $16,000.

Wave Count Structure Points To A Continuation Phase

Freedomby40’s analysis, which is based on the Elliott Wave structure, presents Ethereum as currently positioned in an extended bullish sequence that began forming in late 2022. Posting the technical analysis on X, the analyst noted that Ethereum’s price action looks great for a continuation. 

His chart shows that the asset has just completed a corrective phase and is entering a renewed impulse wave, with support established between $3,225 and $3,563 at the 0.5 and 0.382 Fibonacci retracement zones, respectively. The analyst labels this zone as the ideal accumulation area for the next leg up, consistent with previous cycle structures seen in 2017 and 2021.

The Elliott Wave projection in his analysis presents a multi-layered confluence of impulse waves extending to the third degree. It illustrates that Ethereum is currently unfolding its fifth major impulse wave in a structure that traces back to mid-2022. 

The internal structure of this wave sequence also reveals a C wave in motion, which itself contains smaller sub-impulse waves. Within that C wave, Ethereum appears to be entering its own fifth sub-wave, which is known to be a decisively bullish wave.

Ethereum

Based on this setup, the analyst outlined two potential target zones on the chart: a green box representing the realistic price range for this wave cycle and a red box depicting the higher, more extended scenario that could push Ethereum’s market cap into the trillion-dollar level.

Fibonacci Extensions Predict Targets Of $9,000, $11,000, And $16,000

Freedomby40’s analysis identifies multiple price levels based on Fibonacci extensions from the current price action. The first price target is at $6,303, which is based on the 1.0 Fibonacci extension. This initial price target will see the Ethereum price break above its current all-time high, but this is the first of many.

The next target, the 1.236 extension, is positioned around $9,013. These two price targets ($6,303 and $9,013) were described by the analyst as very realistic. Possible extensions are at the 1.382 and 1.618 Fibonacci extension levels, corresponding to $11,210 and $16,077, respectively.

At the time of writing, Ethereum is trading at $4,160, up by 5.2% in the past 24 hours. Freedomby40’s outlook joins a growing list of ultra-bullish Ethereum price forecasts from institutional research desks and top analysts. Standard Chartered Bank recently raised its 2025 price target for Ethereum to $7,500, while projecting a potential long-term path to $25,000 by 2028.

Ethereum

Ethereum price forecast: ETH eyes $4,500 amid bullish momentum

Key takeaways

  • ETH is up 5.5% in the last 24 hours and is now trading above $4,100.
  • The coin could rally towards the $4,500 resistance level soon.

Ether hits $4,200 as the bullish trend returns

Ether, the second-largest cryptocurrency by market cap, is up by more than 5% in the last 24 hours. The rally allowed the coin to briefly hit the $4,200 level before retracing to now trade at around $4,160 per coin.

This latest development comes as Bitcoin and the broader cryptocurrency market recorded an excellent weekend. Bitcoin is trading above $115k once again after adding 3.5% to its value.

With Bitcoin, Ether, and other leading altcoins recording gains, the total cryptocurrency market cap now stands at $3.91 trillion. Ether could rally higher in the near term, with the technical indicators suggesting further buying pressure. 

Ethereum could surge to $4,500 amid bullish indicators

The ETH/USD 4-hour chart is bearish and efficient despite Ether adding 5% to its value in the last 24 hours. The technical indicators suggest that Ether could face further buying pressure thanks to its rally. 

Ether’s price surged by 5% last week, closing the weekly candle above the 50-day EMA at $4,129 on Sunday. It briefly climbed to $4,206 on Monday before retracing to now trading around $4,160. 

ETH/USD 4H Chart

The RSI of 67 shows a bullish momentum, with the MACD lines flashing a buying signal in the last few days. If Ether breaks and closes above its daily resistance of $4,232, it could continue its rally towards the next major resistance and TLQ level at $4,529. An extended bullish run could allow Ether to reclaim its recent high above $4,700. 

However, if Ether faces a correction following its recent run, it could dip towards the major support level at $3,593.

The post Ethereum price forecast: ETH eyes $4,500 amid bullish momentum appeared first on CoinJournal.

Ethereum Whales Start Buying Back: 218K ETH Added In A Week After October Dump

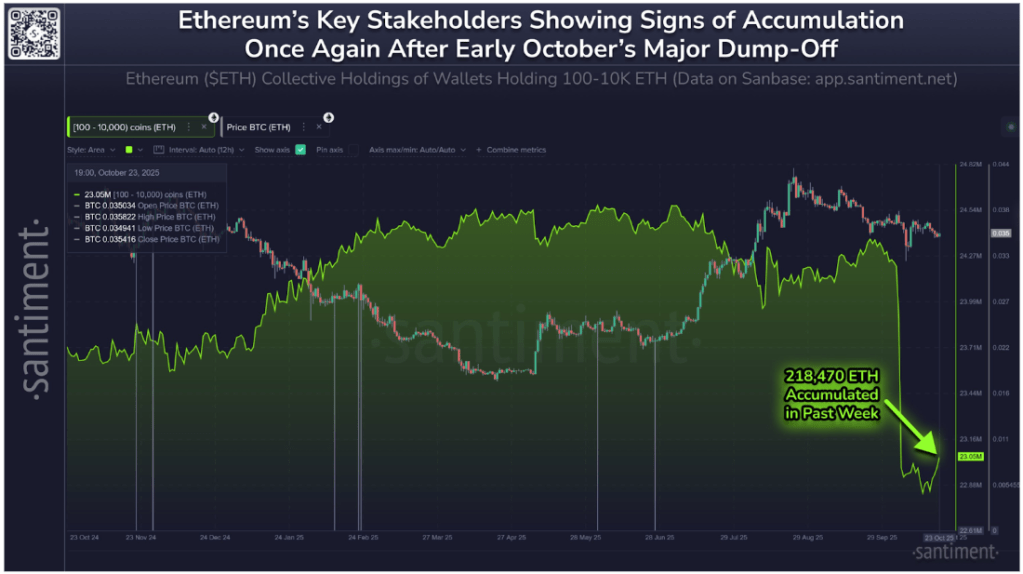
Ethereum’s largest non-exchange holders are tiptoeing back into accumulation. On-chain analytics platform Santiment reported that wallets holding between 100 and 10,000 ETH, also known as whales and sharks, have begun to rebuild positions after unloading roughly 1.36 million ETH between October 5 and 16. 

Notably, the Ethereum collective holdings chart shows that nearly one-sixth of those coins have already been clawed back, as some confidence starts to return to the second-largest crypto asset.

Whales Reverse Course After Early-October Capitulation

The first half of October was highlighted by one of Ethereum’s most pronounced periods of capitulation this year. Macroeconomic fears due to US tariffs saw the Bitcoin price undergo a flash crash that dragged many altcoins to the downside. During this move, Ethereum’s price also fell very quickly, dropping from highs around $4,740 on October 7 to as low as $3,680 on October 11. 

Interestingly, on-chain data shows that the selling pressure from large holders amplified this move, as the chart from Santiment shows a steep decline in their cumulative holdings from about 24.5 million ETH to roughly 22.6 million ETH. This 1.9 million ETH drop reflected clear risk-off behavior among whales and sharks, who had been net buyers since August.

However, once selling momentum began to fade, accumulation started to return. Institutional inflows started to return into Spot Ethereum ETFs, and whale/shark trades started accumulating Ethereum. Since October 16, the same cohort that contributed to the liquidation has begun adding back to their positions. Santiment noted that these holders are finally showing some signs of confidence, demonstrating an incoming extended recovery phase following the shakeout.

218,470 ETH Added In Last 7 Days

According to Santiment’s data, the collective holdings of addresses with 100 to 10,000 ETH have rebounded to approximately 23.05 million ETH after bottoming out in mid-October. A highlighted annotation on the chart shows that 218,470 ETH were accumulated in just the past week, signaling a tangible shift in on-chain behavior. 

Ethereum collective holdings of wallets holding 100-10,000 ETH. Source: Santiment

This increase represents roughly one-sixth of the coins previously dumped, a sign that major investors are gradually re-entering the market after what appeared to be an exhaustion phase. Similar accumulation trends have often preceded a broader recovery in Ethereum’s price, especially when accompanied by stabilization in the ETH/BTC trading pair.

As it stands, the Ethereum price appears to be building a firmer base for the next phase of its recovery heading into November. When whale wallets accumulate, it reduces the circulating supply available on exchanges and reduces selling pressure.

At the time of writing, Ethereum is trading at $3,940 and is on track to break and close above $4,000 again. Both Ethereum and Bitcoin have risen a bit in recent days after inflation report showed US inflation cooling to 3% in September, below the 3.1% forecasted by economists. 

Featured image from Unsplash, chart from TradingView

❌