Reading view

Solana Price Holds Above $180 as Traders Eye a Breakout Toward $200

Solana Price

The post Solana Price Holds Above $180 as Traders Eye a Breakout Toward $200 appeared first on Coinpedia Fintech News

Solana (SOL) price is inching closer to the crucial $180 mark, igniting speculation that a breakout toward $200 could be on the horizon. After weeks of steady gains and surging network activity, traders are debating whether this rally signals the start of a new leg higher—or the calm before a reversal. With bullish momentum building and key technical indicators flashing green, the next few sessions could determine whether Solana’s 2025 run is just getting started.

Current Solana Price Overview

At press time, SOL trades near $186, down nearly 2.34% in the past 24 hours, as the broader crypto markets continue to experience significant upward pressure. Trading volumes across centralized exchanges have plunged, with open interest in Solana futures also dropping—signaling rising speculative activity.

Institutional flows also remain positive, as Solana continues to attract capital through staking platforms and DeFi protocols built atop its network. The blockchain’s growing DEX volume and steady NFT activity have added fundamental support to its price base.

Solana Price Analysis: What’s Next for SOL?

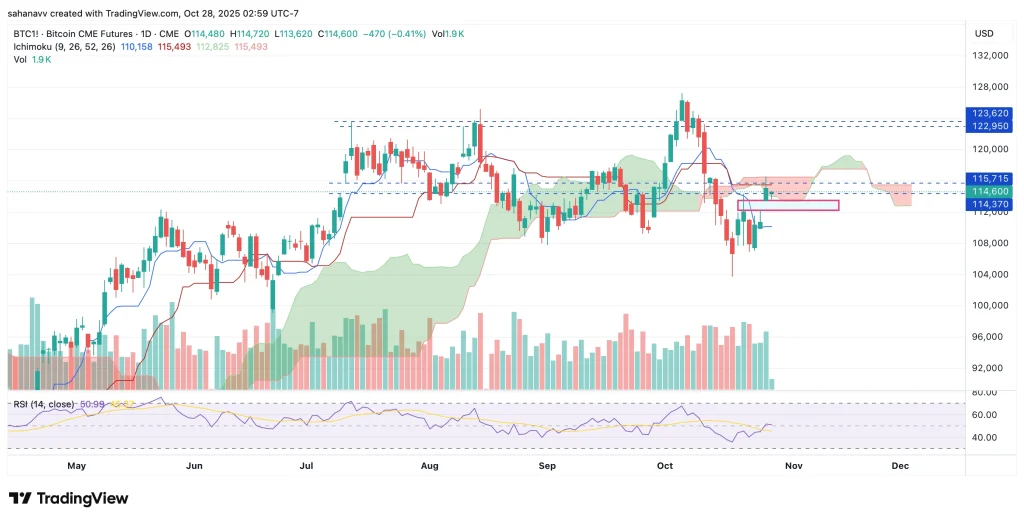
The Solana price rally faced a halt after it failed to break above the pivotal resistance at $250. Moreover, the bearish start for the month strengthened the bears, while the US-China trade tensions helped the token to form an intraday low close to $170. Since then, the SOL price has been trying hard to break through the pivotal resistance at $200, but each attempt has failed. Currently, the token is consolidating just below this threshold, appearing to be accumulating strength to trigger a breakout soon. 

solana price

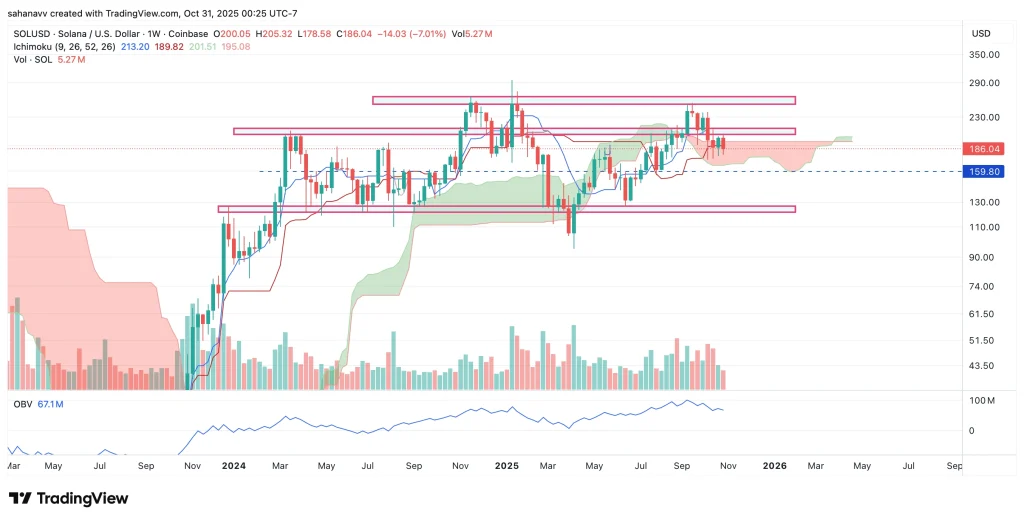
The latest pullback seems to have pushed the token into a brief consolidation phase as the price has entered the Ichimoku cloud, which is currently bearish. The levels have dropped below the baseline, and hence, continued bearish action could initiate a bearish crossover. Meanwhile, the On-balance volume has begun to form lower highs and lows, hinting towards a rise in the selling pressure on increasing volume. The volume is constantly flowing out of the crypto, which could weaken the rally in the short term. 

Solana Price Prediction: Will SOL Price Reach $220 by November 2025?

The SOL price is heading towards a bearish close for the month as the RSI is draining both in the weekly and daily timeframes. However, the bulls may defend the pivotal resistance at $183, which could help the token to begin the November trade on a bullish note. The current trade setup suggests the price could rise above $200 and make it to $208 to $210 range in the early months. The support at $200 will hold the rally strong throughout the month and close the month above the resistance zone around $215 and $220. 

This Altcoin Is Approaching a New ATH—Could Be the Start of an Altseason?

Altcoin season

The post This Altcoin Is Approaching a New ATH—Could Be the Start of an Altseason? appeared first on Coinpedia Fintech News

The crypto markets have become extremely volatile in the past 24 to 48 hours, raising huge speculation surrounding popular cryptos. For the second consecutive day, Bitcoin price is losing ground during the American trading session and has gained strength with the beginning of the Asian trade. Amid this, the Memecore (M) price maintains a sustained upswing and is trying to breach a pivotal resistance. This level can be considered a pivotal one, as the next pit stop for the M price rally could be the current ATH, close to $3. 

The Memecore price rose heavily by over 600% in September from the consolidated zone around $0.5. This move attracted significant attention from the investors, due to which the price has been consolidating above one of the important supports at $1.77. In times when the bearish influence over the markets is rising, technicals suggest that the Memecore price could eventually break above the current highs. 

Although the bullish indicators dominate, the token’s extreme volatility warrants caution. This raises the question of whether the Memecore price can make it to $3 or above, or will profit-taking reverse the gains?

m price

The Memecore price is about to begin with the 3rd bullish wave, as the token is showing signs of replicating a previous pattern. The price has rebounded from the ascending trend line for the third consecutive time. The token experienced over a 600% jump previously, and the current market dynamics suggest a similar upswing could be on the horizon. The RSI is displaying a parabolic recovery, and the price is about to breach the Supertrend line, which is currently bearish. 

The price crossing the line implies that the token is undergoing a bullish switch that could strengthen the ongoing upswing. With this, the RSI may enter the overbought range, and the bullish momentum could accelerate, pushing the Memecore price to a new ATH. The first target could be $3.68 at 1.2 FIB and later $4.06 at 1.4. If the token secures above this range, then the bulls may trigger a strong upswing to new highs. 

What’s Next for Hyperliquid (HYPE)? Breakout Toward ATH or Price Reversal Ahead?

Hyperliquid (HYPE) Breaks New ATH As Whales Fuel Rally_ Can Bulls Push Beyond $50

The post What’s Next for Hyperliquid (HYPE)? Breakout Toward ATH or Price Reversal Ahead? appeared first on Coinpedia Fintech News

The crypto markets are trying to recover from the recent bearish action, with the Bitcoin price marking weekly lows below $108,000. In the times when Bitcoin & Ethereum are displaying some stability, a few altcoins are ready to explode. One among them is Hyperliquid, which has recovered most of the losses incurred since the start of the month. The HYPE price is testing one of the crucial resistances and may form a new ATH if it triggers a breakout above this range. 

In times when the broader market conditions are volatile, the question arises whether HYPE’s price sustains its momentum or a correction is coming.

Recently, 21Shares filed an S-1 with the SEC for a Hyperliquid ETF, furthering its crypto-focused product line. This is expected to offer an exposure to Hyperliquid’s token and rewards through derivatives like swaps and options. If approved, it could bridge DeFi with institutional markets, giving funds access to on-chain perpetuals without holding tokens. HYPE’s ecosystem is already surging with 160% APR vaults and double-digit weekly TVL growth, and this ETF filing could open floodgates for regulated capital. 

Hence, when DeFi meets Wall Street, will HYPE be the next big thing in the markets? Will the price form a new ATH?

hype price

Hyperliquid (HYPE) is hovering near the crucial $50–$52 resistance, where multiple rejections have occurred previously. The chart shows a possible double-top pattern, but rising OBV indicates accumulation, supporting bullish sentiment. The RSI around 60 reflects steady momentum, suggesting buyers are still active. If HYPE manages a breakout and closes above $52, it could trigger a rally toward $58–$60. However, failure to clear this barrier might result in a pullback to $43–$44. Overall, the setup signals cautious optimism as traders await confirmation of the next move.

In conclusion, Hyperliquid (HYPE) is approaching a crucial resistance zone around $52, and its next move will likely define the short-term trend. A successful breakout could drive the price toward a new all-time high near $60, signalling renewed market strength. However, if the token faces rejection again, a pullback toward the $42–$44 range remains likely before any further rally. The coming days will be critical in determining whether HYPE extends its bullish momentum or enters another consolidation phase.

Despite Lagging 42% Behind the Bitcoin Rally, Ethereum Is Set to Dominate the Next Market Cycle—Here’s Why!

Ethereum Price Prediction

The post Despite Lagging 42% Behind the Bitcoin Rally, Ethereum Is Set to Dominate the Next Market Cycle—Here’s Why! appeared first on Coinpedia Fintech News

The crypto market is witnessing heightened volatility ahead of the upcoming FOMC decision, with Bitcoin consolidating near local highs and Ethereum trading at a steep discount. While BTC continues to dominate short-term momentum, Ethereum has quietly strengthened its fundamentals. Despite lagging nearly 42% behind Bitcoin’s rally, ETH shows growing signs of resilience—fueled by increased staking activity, expanding Layer-2 adoption, and robust developer growth. With institutional attention shifting toward potential ETH ETFs, analysts expect the Ethereum price to reclaim leadership and outperform in the next market cycle.

The Perfect Storm for Ethereum Is in the Making

Not just for this month or quarter—but over the next several years—Ethereum appears set to outperform the broader crypto market, including Bitcoin. A combination of structural dominance, institutional adoption, and network innovation is creating the perfect storm for ETH’s long-term growth.

Ethereum Dominates the Stablecoin Market

Ethereum accounts for over $169.4 billion in stablecoin issuance, representing more than half of the total supply across all blockchains. With U.S. regulators showing increasing support for stablecoins, corporate adoption is accelerating. Ethereum’s proven infrastructure positions it as the primary on-chain settlement layer for this booming sector.

Ethereum Leads the DeFi Ecosystem

With over $100 billion in total value locked (TVL), Ethereum continues to dominate decentralized finance. Layer-2 networks like Arbitrum and Base are seeing record transaction volumes driven by DeFi applications built atop Ethereum. No competing chain has managed to replicate this scale or liquidity depth, reinforcing ETH’s position as DeFi’s financial backbone.

Ethereum Captures Institutional Interest

Institutional demand for ETH is surging. Companies like SharpLink, Bitmine, and Quantum Solutions are adding ETH to their treasuries, while inflows into Ethereum ETFs keep hitting new highs. Beyond accumulation, institutions are actively building on Ethereum—developing Layer-2 scaling solutions and tokenization products, signalling deep-rooted confidence in its future.

Ethereum Is the World Computer

With a decade of 100% uptime and unmatched security, Ethereum remains the most reliable decentralized infrastructure ever built. Its recent Fusaka upgrade, along with upcoming advancements like zkVM, zkEthereum, and parallel scaling, promise exponential increases in efficiency and scalability.

Each of these four sectors—stablecoins, DeFi, institutions, and infrastructure—represents a trillion-dollar opportunity. Ethereum commands all four, making the projection of a multi-trillion-dollar market cap and $12,000–$24,000 ETH, as forecast by Fundstrat, a realistic long-term target.

What’s Next for ETH Price? 

Ethereum’s price is consolidating within a well-defined ascending parallel channel, reflecting a healthy long-term uptrend despite short-term volatility. While Bitcoin has dominated headlines, Ethereum continues to show strong structural strength, maintaining higher lows and gradually building upward momentum. The recent pullback aligns with a broader market cooldown ahead of macroeconomic events. Still, Ethereum’s on-chain activity, growing DeFi dominance, and institutional accumulation hint at a potential breakout phase once bullish momentum resumes across the broader crypto landscape.

ethereum price

The chart shows Ethereum trading near the midline of its ascending channel, currently finding support around $3,850–$3,680. The RSI at 52 suggests a neutral stance, leaving room for upside movement, while the MACD shows signs of a potential bullish crossover if momentum strengthens. A rebound from this zone could send ETH toward resistance levels at $4,270 and $4,869, whereas a breakdown below $3,539 may delay the rally. Overall, ETH maintains its long-term bullish market structure.

Wrapping it Up!

Ethereum’s long-term outlook remains decisively bullish despite its current price lagging behind Bitcoin. The network’s dominance across stablecoins, DeFi, and institutional adoption, combined with ongoing scalability upgrades, positions ETH as the cornerstone of the next crypto expansion phase. Technically, the price structure continues to show higher lows, suggesting accumulation rather than exhaustion. As macro conditions stabilize and capital flows return to altcoins, Ethereum appears well-positioned to lead the next leg of the bull cycle, potentially reclaiming the $5,000 mark and beyond.

SEI Price Dips Sharply: Is it Time to Accumulate or Cut Losses?

SEI Price Rebounds Sharply, Eyes $0.2545 as Next Target

The post SEI Price Dips Sharply: Is it Time to Accumulate or Cut Losses? appeared first on Coinpedia Fintech News

SEI has entered a crucial phase as price action tests major structural levels following weeks of sustained sell pressure. Despite the broader market showing signs of stabilization, SEI price continues to hover near its yearly lows, sparking debate over its long-term viability. Network fundamentals remain intact, with strong throughput, growing ecosystem integrations, and a focus on high-performance trading infrastructure. Yet, investor confidence appears tested as liquidity thins and speculative momentum fades—leaving the market to decide whether SEI is oversold or losing ground in a competitive Layer-1 landscape.

Top Factors Preventing SEI’s Price From Gaining Momentum

Despite SEI’s strong network fundamentals, several underlying factors continue to limit its price recovery. One major concern is the decline in trading liquidity, as reduced market participation has amplified even minor sell-offs, keeping SEI under consistent pressure. Additionally, ecosystem growth has lagged behind expectations—with relatively few flagship DeFi or NFT projects launching on the network, organic demand for SEI remains subdued.

Another headwind comes from ongoing token unlocks, which introduce new supply into the market and dampen upward momentum. At the same time, investor capital has rotated toward larger, more established assets like Bitcoin, Ethereum, and Solana, leaving mid-cap projects like SEI struggling to attract fresh inflows. Finally, waning investor interest in Layer-1 narratives has contributed to overall fatigue across this segment, forcing SEI to prove its real-world utility before it can regain market attention.

What Could Trigger a Rebound for SEI

While sentiment around SEI has cooled, several developments could shift momentum back in its favor. The first catalyst could come from renewed ecosystem expansion—if the network attracts more liquidity protocols, DEX integrations, or real-world trading platforms, it could reignite interest in SEI’s unique positioning as a trading-focused Layer-1 chain.

Another potential turning point lies in strategic partnerships and developer traction. Increased activity from builders and cross-chain collaborations within the Cosmos ecosystem could strengthen SEI’s long-term value proposition. A clear rise in on-chain usage or TVL would likely validate the project’s technical advantages and help rebuild market confidence.

Lastly, a broader market rotation into high-performance Layer-1s could play to SEI’s strengths. As traders seek faster, more efficient alternatives for decentralized trading, Sei Network’s architecture could emerge as a preferred choice—positioning SEI as one of the few tokens capable of outperforming once liquidity and sentiment return.

Will the SEI Price Rebound to $0.5?

SEI’s price action has entered a critical zone as broader crypto markets consolidate ahead of major macro events. After months of steady decline, the token now trades near its long-term support, sparking debate between bearish exhaustion and early accumulation. Despite strong network fundamentals, investor sentiment remains cautious amid low liquidity and competitive pressures in the Layer-1 space. The coming weeks could be decisive in determining whether SEI’s consolidation signals a bottom or an extended phase of stagnation.

sei price

The weekly chart shows SEI testing the lower band of the Gaussian Channel, indicating an oversold zone where reversals often occur. The RSI hovers near 40, suggesting weakening bearish momentum but not yet signalling a clear recovery. If price rebounds from the channel’s lower boundary, SEI could retest the mid-channel resistance near $0.30, confirming early accumulation. However, a breakdown below the channel with RSI slipping further could reinforce bearish sentiment, potentially driving the token toward the next major support around $0.12.

Collectively, the short-term SEI price weakness reflects market fatigue, while the project’s focus on trading infrastructure and efficiency continues to set it apart in a crowded Layer-1 landscape. If Sei Network succeeds in attracting new dApps, partnerships, and liquidity, current levels could represent an attractive entry for long-term investors. However, sustained ecosystem stagnation may limit upside potential, leaving SEI struggling to reclaim broader market attention.

DOGE Price on the Verge of Breakout—Will Bulls Push It Past $0.215 This Week?

Why Dogecoin (DOGE) Price is Surging Today?

The post DOGE Price on the Verge of Breakout—Will Bulls Push It Past $0.215 This Week? appeared first on Coinpedia Fintech News

Dogecoin (DOGE) price is flashing a major bullish signal as the broader crypto market steadies ahead of this week’s highly anticipated FOMC meeting. Bitcoin (BTC) continues to consolidate around the $113,000 mark, while Ethereum (ETH) holds near $4,000, both awaiting fresh cues from the Federal Reserve’s policy outlook. Amid this cautious sentiment, DOGE has emerged as a standout performer, reclaiming key support levels and showing signs of renewed momentum. 

With rising trading volumes and improving technical structure, analysts believe DOGE could be gearing up for a decisive move toward the $0.215 resistance zone this week. 

On the other hand, the top memecoin is also displaying a bearish divergence, which needs to be considered ahead of the incoming volatility. Ever since the infamous crash fueled by the US-China trade war, the DOGE price has remained stuck within a narrow range. However, the price continued to form constant higher highs and lows, which raised the possibility of securing above the local resistance at $0.21. However, the technicals suggest the price may experience a notable pullback, preventing a rise above this range. 

doge price

The Dogecoin (DOGE/USDT) daily chart reveals a cautious yet potentially bullish setup. After breaking below its ascending trendline, DOGE has entered a consolidation phase near the $0.19 level, maintaining support above the $0.18 zone. The Bollinger Bands show price compression, indicating reduced volatility and a possible buildup for the next move. However, a downward arrow suggests a short-term correction toward the $0.16–$0.17 support range if the current support fails.

The RSI hovers around 42 with a visible descending trendline, reflecting weakening momentum but also hinting at a potential reversal if it breaks above resistance. Sustaining above $0.19 could open the path toward $0.21–$0.215, while rejection may trigger a retest of lower support levels.

In conclusion, Dogecoin’s price action suggests a make-or-break zone near $0.19. A confirmed rebound above this level could trigger a short-term rally toward $0.21 and potentially $0.215. However, failure to hold above the current support may drag the price back toward the $0.17–$0.16 demand zone before any bullish reversal attempts. Overall, DOGE remains range-bound but poised for a decisive breakout in the coming sessions.

Bitcoin Holds Steady Ahead of FOMC Decision—Will BTC Price Ignite a Major Rally Next?

Tucker Carlson

The post Bitcoin Holds Steady Ahead of FOMC Decision—Will BTC Price Ignite a Major Rally Next? appeared first on Coinpedia Fintech News

It’s again an FOMC day, and again Bitcoin prices have begun to consolidate ahead of the meeting, reflecting the prevailing uncertainty within the markets. The selling pressure has piled up during the last trading day, dragging the levels close to $112,000 from the intraday highs above $116,000. Although the bears have not held a tight grip over the rally, the hawkish stance of the Fed chairman could weaken the bulls. This could further cause more harm to the BTC price rally in the short term. 

Bitcoin price has retraced a bit ahead of most of the FOMC meeting, which has largely resulted in a strong breakout. The token recently rebounded before hitting the lower liquidity levels around $111,000, wherein over $100 million in longs were piled up. The trade is still active, suggesting the traders still look out for an entry at this point, while they are unsure above $114,000, as more than $121 million in shorts have already accumulated around this range. 

bitcoin price

The liquidity levels suggest indecisiveness among the traders as the price remains consolidated between the piled longs and shorts. So in this case, how FOMC may impact the prevailing accumulation, as a rise above $114,000 may trigger shorts, while a drop below $111,000 could liquidate the longs. 

Where Will Bitcoin (BTC) Price Head Next? 

Regardless of the FOMC volatility, the BTC price largely remains within a bullish structure, a rising parallel channel. The lower-timeframe chart displays a strong rebound from support after a pullback. However, the result of the upcoming FOMC meeting could have a significant impact on the rally, which may either rise above the average zone of the parallel channel or break the support. 

bitcoin price

Bitcoin is showing immense strength in the hourly chart, validated by the recent rebound, which was much above the pivotal support zone around $110,000. We had some volume spikes, but more importantly, the hourly MACD is about to turn bullish. This suggests the buying volume is slowly superseding the bears. On the other hand, the stochastic RSI just rebounded from the oversold zone, indicating a continued rise for the new hours. 

Final Take: Will FOMC Push the Bitcoin Price Above $115,000?

Bitcoin appears to be consolidating within a rising channel, with price action currently testing mid-range support near $112,500. The chart highlights a potential bounce toward the $115,000–$117,000 zone if bulls hold this level, which also aligns with the mid-channel Fibonacci retracement. However, failure to defend the support trendline and the nearby CME gap could trigger a sharp decline toward $108,000–$106,000, marking a deeper correction. The upcoming FOMC decision will likely determine which scenario unfolds.

Official Trump Token Faces Tug-of-War Between Bulls and Bears— What’s Next for the Price?

TRUMP Coin Price

The post Official Trump Token Faces Tug-of-War Between Bulls and Bears— What’s Next for the Price? appeared first on Coinpedia Fintech News

After a sharp rally that sent the Official Trump (TRUMP) price token soaring in recent sessions, the momentum now appears to be cooling as the market enters a phase of equal bullish and bearish pressure. Traders are closely watching whether the token can sustain its gains or face a short-term correction amid broader market uncertainty. As buying momentum slows, the next few trading sessions could decide whether TRUMP’s price resumes its uptrend or confirms a near-term pullback.

Ecosystem Expansion and Massive Earnings Drive Official Trump Token’s Momentum

The Official Trump (TRUMP) token has captured market attention once again, surging nearly 30% after the announcement that USD1, a Trump-linked stablecoin, will launch on the Enso Chain. The move is seen as a key step in expanding the Trump crypto ecosystem, potentially enhancing TRUMP’s real-world utility and investor confidence. This expansion comes as momentum traders position for further gains, though short-term consolidation remains likely amid rising market volatility.

Adding to the buzz, a Reuters investigation revealed that the Trump Organisation generated approximately $802 million from crypto-related ventures between January and June 2025—surpassing its traditional business income during the same period. Of this, nearly $336 million reportedly originated from the TRUMP token, spotlighting the financial weight of the Trump-backed digital asset. However, the findings have reignited debate over governance, transparency, and political influence in crypto markets, with regulators and investors alike watching closely how the ecosystem evolves in the coming weeks.

TRUMP Price Analysis: Is A Bullish Monthly Close on the Horizon?

The Official Trump (TRUMP) token is showing signs of renewed strength after months of steady decline. Following a sharp rebound from its October lows, the price has broken above a key descending trendline for the first time since May, signalling potential bullish reversal momentum. Trading volume has spiked notably, reflecting increased investor interest. However, with the token now hovering near critical resistance around $7.20–$7.30, traders are watching closely to see if this breakout holds or fades into consolidation.

trump price

The chart shows TRUMP testing a long-term descending resistance trendline, with current price action slightly above the $7.20 resistance zone. The DMI indicator reveals tightening pressure between bulls (DI+) and bears (DI–), suggesting balanced momentum. Meanwhile, the RSI at 57 signals moderate bullish strength but not yet overbought, implying room for upside continuation. A decisive close above $7.30 could confirm a breakout toward $8.50, while rejection here may lead to a retest of the $6.20–$6.40 support region.

Conclusion—Will OFFICIAL TRUMP Reach $10?

The Official Trump (TRUMP) token’s recent rebound above its long-term trendline has re-energized bullish sentiment, but a sustained rally toward $10 will depend on continued ecosystem growth and broader market stability. A confirmed breakout above $7.50 could open the path toward $9.80–$10.00, especially if momentum strengthens alongside renewed buying volume. However, failure to hold above $6.20 may trigger another correction phase. For now, TRUMP stands at a crucial inflexion point—where market conviction will determine whether the next move is a breakout or a fade.

Bittensor (TAO) Price Jumps 10% as Subnet Demand Surges—Can the AI Crypto Rally Sustain?

Bittensor (TAO) Price Surges, Will Bulls Push Above $434 for a New 2025 High

The post Bittensor (TAO) Price Jumps 10% as Subnet Demand Surges—Can the AI Crypto Rally Sustain? appeared first on Coinpedia Fintech News

Bittensor (TAO) price surged over 10% in the past few hours, climbing above the $450 mark as renewed demand for its subnets and rising speculative activity fuelled fresh optimism in the AI crypto sector. The decentralized machine-learning network has seen a sharp spike in trading volumes and open interest, signalling growing investor confidence. As TAO breaks key resistance levels, traders are now eyeing the $500 milestone—raising the question: can this AI-powered blockchain sustain its bullish momentum?

Why Bittensor Price Is Rising?

Bittensor’s sharp rally can be attributed to a confluence of bullish technical and fundamental factors. The most immediate catalyst is the surging demand for Bittensor’s subnets, which recorded an 11% jump in market cap within 24 hours, reflecting growing usage and developer activity. On top of that, futures open interest spiked nearly 19%, signalling strong speculative participation.

Technically, TAO has broken above a long-term descending trendline, marking a key bullish reversal pattern. The breakout has drawn renewed attention from traders who see Bittensor as one of the most promising plays in the AI + crypto narrative, especially with major institutional interest brewing in decentralized machine learning networks.

Bittensor (TAO) Technical Outlook

From a technical standpoint, Bittensor’s breakout above $434 has flipped a crucial resistance level into support, confirming a bullish reversal on both the 4-hour and daily timeframes. The price has consistently formed higher highs and higher lows, signaling sustained buying momentum. Analysts point to $466–$475 as the next critical resistance zone, beyond which TAO could target $500 in the short term.  

tao price

Bittensor (TAO) is showing strong bullish momentum, rebounding from the $280–$300 support zone and now testing the key resistance near $470. The price has surged above both the 50-day and 200-day moving averages, with the two lines converging—hinting at a potential golden cross, a classic bullish signal that often precedes strong upward trends. Rising volume confirms growing momentum, while the RSI near 63 suggests steady buying pressure. A breakout above $470could pave the way toward $500, with support around $360.

Conclusion

Bittensor’s recent price rally underscores growing confidence in both its AI-driven narrative and improving on-chain fundamentals. With rising subnet activity, expanding trading volumes, and a potential golden cross on the horizon, TAO appears technically well-positioned for further upside. However, the $470–$480 range remains a critical barrier that must be cleared for continuation toward $500 and beyond. As momentum builds, traders should watch for sustained volume and confirmation above resistance to validate the next phase of Bittensor’s bullish trend.

Bitcoin Price Extends Gains, But Technical Signals Hint at a Pullback Below $110K—What’s Next?

Will Institutional Buying Push BTC Price USD to New Highs

The post Bitcoin Price Extends Gains, But Technical Signals Hint at a Pullback Below $110K—What’s Next? appeared first on Coinpedia Fintech News

Bitcoin (BTC) price continues to trade with upward momentum, recently reclaiming levels above $113,000 as market sentiment leans cautiously optimistic. The market has followed suit, with speculation of whether this momentum can be sustained amid tightening liquidity and rising volatility. However, several technical indicators now suggest a potential cool-off phase. This raises concerns of a short-term correction below the $110,000 support zone.

Is BTC Price Heading for a Pullback?

After rebounding sharply from lows near $107,800 earlier this week, Bitcoin has steadily reclaimed lost ground, climbing back above the $113,000 mark. This recovery reflects renewed buying pressure around key demand zones, supported by improving market liquidity and increased spot trading activity. However, BTC now faces a crucial test near the $114,500–$115,000 resistance area, where profit-taking has historically intensified. Momentum indicators hint at potential exhaustion, suggesting that if Bitcoin fails to secure a daily close above this range, a corrective drop toward $110,000—or even lower—could soon follow.

Another major reason to be bearish on Bitcoin is the recently formed CME gap with the lower range close to $110,000. 

bitcoin price

Bitcoin’s rebound from the $107,800 lows has lifted prices toward $114,600, yet the move now encounters a key CME gap between $110,700 and $113,500, as highlighted on the chart. This unfilled gap has become a focal point for traders, as Bitcoin often revisits these levels before establishing a sustained trend. The Ichimoku Cloud currently acts as dynamic resistance, with the upper boundary near $115,700 aligning with the gap’s top.

Historically, BTC has tended to “fill” such CME gaps before reversing direction, suggesting a possible short-term rejection if momentum weakens. Meanwhile, the RSI around 51 signals a neutral bias, indicating potential consolidation before the next major move.

Wrapping it Up

The recent rebound in Bitcoin (BTC) price underscores improving short-term sentiment, but the broader market remains cautious amid low volatility and mixed macro cues. A decisive move beyond the $115,700 cloud resistance could reignite bullish momentum across major altcoins, fueling renewed inflows into risk assets. However, failure to clear this zone may keep BTC range-bound, with traders eyeing $110,000 as a key defensive level. With upcoming macro events and ETF flows influencing liquidity, Bitcoin’s next move could set the tone for the entire crypto market heading into November.

❌