A jury in Massachusetts on Tuesday found former New England Patriots wide receiver Stefon Diggs not guilty of felony strangulation or suffocation and misdemeanor assault and battery charges.
The ruling removes a legal concern NFL teams may have for the 32-year-old free agent, whom Norfolk County prosecutors accused of engaging in a physical confrontation with his personal chef, Jamila Adams, during a dispute about her pay at a residence in Dedham, Mass., a suburb of Boston. Diggs was accused of hitting and trying to choke Adams. He denied the allegations, and his attorney, Andrew Kettlewell, raised questions about Adams’ testimony.
Diggs could still face potential NFL discipline under the league’s personal conduct policy, which does not require a criminal conviction and focuses on whether conduct undermines the league’s integrity and reputation. In the wake of the jury verdict, an NFL spokesperson told Sportico, “we have been monitoring all developments in the matter, which remains under review of the personal conduct policy.”
Diggs could also face civil liability—which is based on the preponderance of the evidence standard (more likely than not) rather than the criminal law standard of beyond a reasonable doubt—in potential litigation with Adams.
It also remains to be seen if companies with whom Diggs currently has endorsement deals stick with him. Companies often include “morals clauses” in endorsement deals that permit them to end relationships when an athlete becomes the source of legal controversy.
But Diggs has defeated the threat of the most serious legal consequence: criminal conviction and potential incarceration. He notably declined a plea deal—where he could have pleaded to a lesser offense and perhaps avoided any jail time—and instead took his chances before a jury. The move proved correct.
Diggs was the Patriots’ No. 1 receiver in 2025. He caught 85 passes for 1,013 yards as he and quarterback Drake Maye clicked in offensive coordinator Josh McDaniels’ offense. Like his teammates, Diggs wasn’t as dominant in the playoffs, where he hauled in 14 catches for 110 yards in four games. The Seattle Seahawks defeated the Patriots 29-13 in February’s Super Bowl, with Diggs catching three passes for 37 yards.
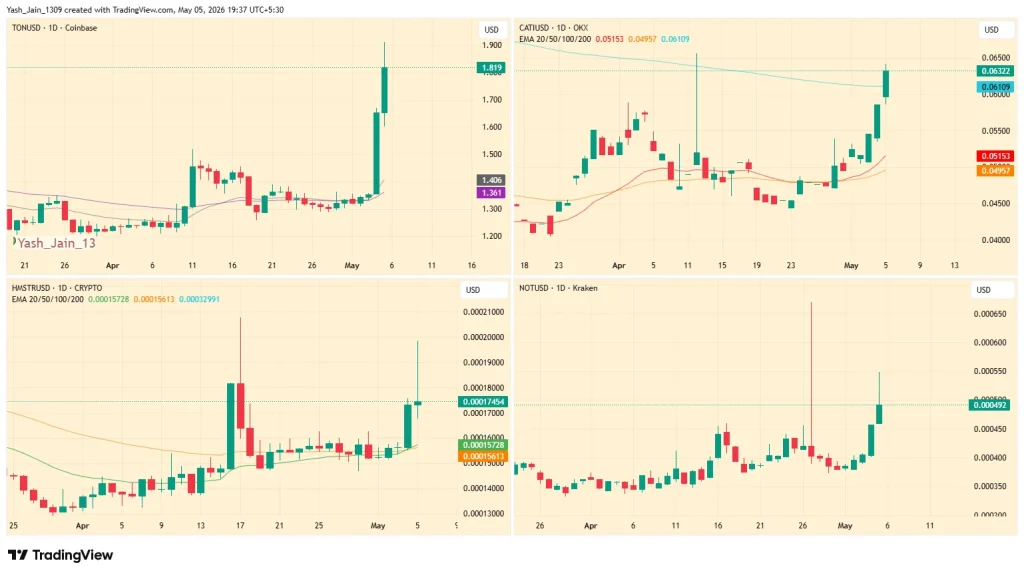
Just when Telegram-based Play-to-Earn (P2E) tokens looked completely written off, they’re suddenly back from the dead and moved fast. The trigger today? A sharp 6x drop in TON blockchain fees, now sitting near zero, per Pavel Durov CEO and founder of Telegram. That single shift flipped sentiment overnight, dragging the entire ecosystem along for the ride.
TON Fee Cuts Spark Sudden Ecosystem Revival
Well, on its ecosystem, lower fees didn’t just improve usability but even they reignited speculation. TON token price itself surged roughly 40% intraday, instantly pulling attention back to a chain many had quietly ignored or acted to forgot.
Now, this move shows that cheap transactions will mean more activity. More activity means more hype. And in crypto, that’s often enough.
P2E Tokens Ride TON’s Explosive Momentum Wave
But, the real fireworks was not only in TON today but showed up in the mini-app tokens running on its blockchain. Catizen (CATI) jumped 27%, Hamster Kombat (HMSTR) climbed 24%, and Notcoin (NOT) ripped 35% higher.
These Telegram-based Play-to-Earn (P2E) tokens thrive on simplicity that’s tap, earn, repeat. Massive user bases were already there, but high friction and fading interest had nearly killed its growth. Now, with near-zero fees, that friction is basically gone. It’s not innovation driving this, it’s accessibility but now will demand follow that’s a question for future which has high odds at this point.
Can TON Break Resistance And Sustain Rally
So, what’s next in TON price action? That’s where things get tricky. TON is now hovering around $1.84, pushing toward a key $2.0 resistance level. Break that cleanly, and momentum could extend.
But fail? And it could unwind just as quickly. For now, Telegram-based Play-to-Earn (P2E) tokens are riding the wave which are proving once again that in this market, one update can turn a graveyard into a gold rush overnight.
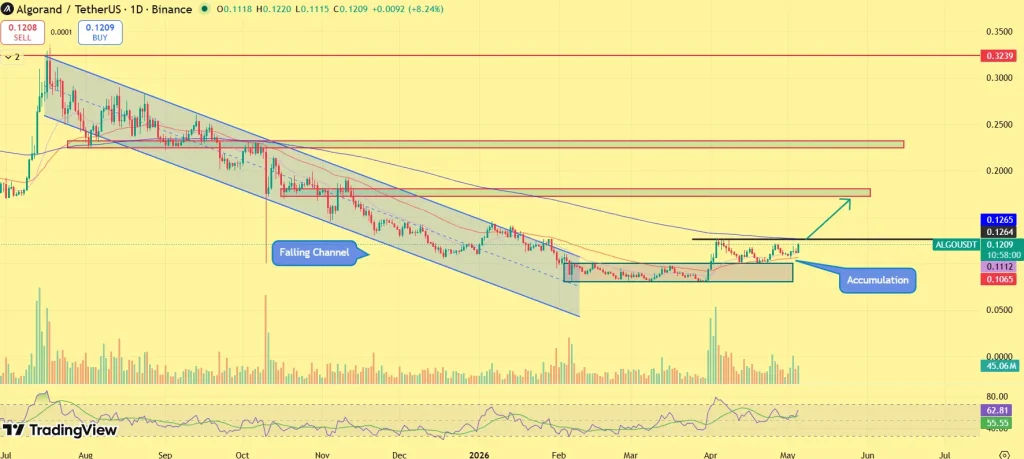
Algorand price has climbed 7% in the last 24 hours, extending its recovery as ALGO price holds firm within an accumulation range formed after its earlier downtrend break. The move signals growing buyer interest, with structure tightening beneath resistance. With ALGO price now approaching the $0.1200 breakout level, the key question is: Can this momentum trigger the next leg higher?
Derivatives Activity Rises as Market Participation Expands
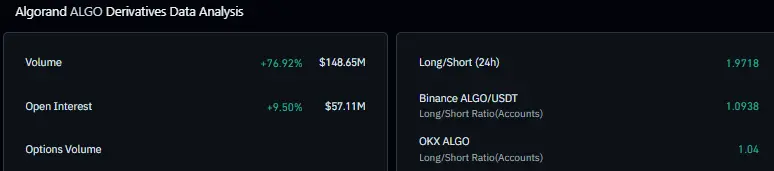
Recent derivatives data highlights a clear increase in market activity. Trading volume has surged by over 76% to around $148 million, while open interest has climbed approximately 9.5% to $57 million. This parallel rise in volume and open interest suggests new capital entering the market, rather than just short-term covering.
It reflects growing conviction among traders as ALGO stabilizes within its current range. Such conditions often precede directional moves, particularly when price compresses beneath resistance while participation expands.
Algorand price is trading within a defined accumulation zone between $0.10 and $0.12, which has acted as a strong base following its earlier breakout from a falling channel. ALGO price action is forming higher lows, indicating that buyers are stepping in at progressively higher levels, a key signal of strengthening demand. At the same time, ALGO token is compressing just below resistance, reflecting a tightening range structure.
The immediate breakout level lies near $0.1200–$0.13, which has capped recent upside attempts. A decisive move above this zone, supported by sustained momentum, could trigger continuation toward $0.16, followed by a broader resistance zone near $0.18. On the downside, holding above $0.10 remains critical to maintain the current structure. As long as this base holds, the setup remains constructive.
Momentum Builds Within Consolidation Phase
The current structure reflects a transition from trend reversal into accumulation, where selling pressure has faded and demand is gradually strengthening. The recent 7% move, combined with rising derivatives activity, suggests that momentum is beginning to build within the range, rather than fading. This phase typically precedes expansion moves, as liquidity accumulates near key levels. With volatility compressing and participation increasing, the setup points toward a market preparing for its next directional move.
What’s Next for ALGO?
Algorand is now approaching a critical level where structure and participation are beginning to align. With ALGO price holding firmly above its accumulation base and buyers steadily stepping in, the setup appears to be building pressure beneath resistance.
The focus remains on $0.1200. A confirmed breakout above this level could unlock momentum toward $0.16–$0.18, signaling continuation of the recovery phase. Until then, ALGO may remain range-bound, but the current setup suggests that the next move is building rather than fading.
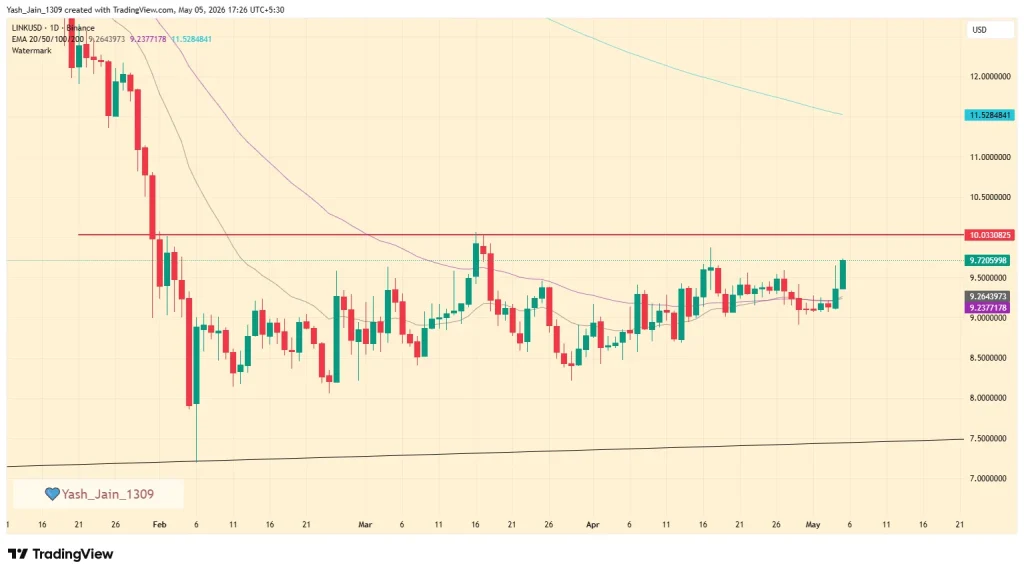
LINK price rose nearly 6% after AWScloud partnership announcement, as this time it was an actual substance. The LINK price reacted quickly after AWScloud officials posted about this team up with Chainlink. Was it a hype, many curious? Sure it is one. But unlike most headlines, this one comes with real infrastructure behind it.
AWScloud Partnership Brings Real Utility To Blockchain
AWScloud is integrating Chainlink’s CRE by utilizing this effectively will be giving its massive developer base tools to connect cloud systems with smart contracts.
Not just theory but this have practical actual use cases. Think custom price feeds, stablecoin reserve verification, and off-chain computation running inside secure environments. It’s enterprise-grade stuff, the kind that institutions usually demand before even pretending to care about blockchain.
Well, Chainlink isn’t just chasing headlines but clearly it’s chasing developers and by locking this deal its after millions of them.
LINK Price Eyes Key Resistance After Recent Push
But, in crypto markets most investors eyes are still glued to charts. The LINK price bump comes alongside a broader tailwind from BTC and ETH, helping it grind higher since February.
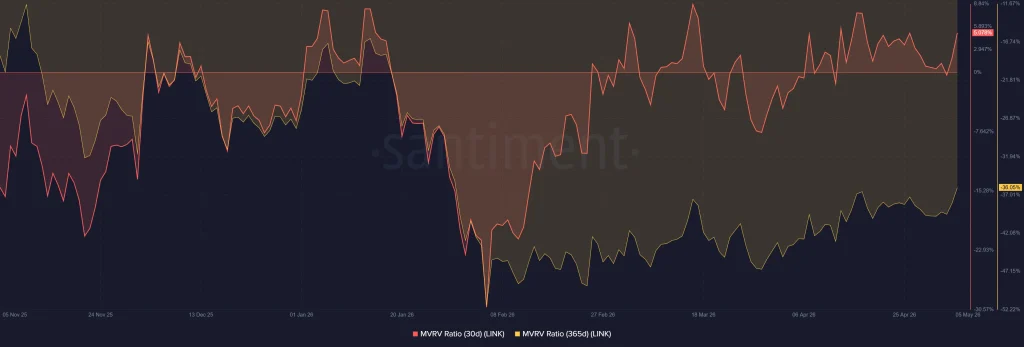
Now, it’s staring directly at the $10 resistance level. Crack that, and the next logical target sits near the 200-day EMA around $11.52. Momentum’s improving too and because of that the 30-day MVRV just flipped above zero, meaning short-term holders are finally seeing profits. Not euphoric. But definitely less painful.
Institutional Demand Builds While Holders Stay Patient
Meanwhile, the long-term crowd isn’t exactly celebrating. The 365-day MVRV still shows holders sitting in the red, even as recovery slowly creeps in.
On the institutional side, though, it’s oddly stable. US spot LINK ETF assets are holding at $107.86 million which is roughly 1.59% of market cap per sosovalues’s data and most importantly with no outflows reported since December 2025. That’s not explosive demand, but it’s consistent.
Add to that reserve activity climbing to 3.44 million LINK by April 30, and you start seeing the bigger picture. Infrastructure is being built. Slowly, deliberately.
So yeah, the LINK price might still be dragging its feet but the groundwork underneath? That’s moving a lot faster than it looks.
Pi Network price is hovering near the $0.18 mark, holding steady despite recent volatility as a mix of event-driven catalysts and improving technical structure builds a case for a push toward the $0.20 resistance. According to data from crypto.news, Pi…
XRP price moved toward the $1.40 resistance on Tuesday as the broader crypto market recovered alongside easing oil prices. According to data from crypto.news, XRP (XRP) price traded near $1.39 at press time, after briefly touching highs around $1.41 earlier…
ONDO is rapidly positioning itself as a standout performer in the current crypto cycle, gaining over 23% this week while much of the altcoin market remains subdued. The move isn’t just technical, it’s being driven by a deeper structural shift as capital rotates into real-world asset (RWA) narratives.
Unlike momentum-driven rallies seen elsewhere, ONDO’s strength is emerging alongside institutional traction, growing liquidity, and expanding real-world integrations. With ONDO price now breaking out of consolidation and fundamentals aligning, the market is beginning to reprice ONDO’s long-term role, raising the key question: Is this just the start of a larger move?
Institutional Momentum Builds: ONDO Expands Beyond Crypto Native Demand
ONDO’s recent rally is closely tied to its growing relevance in bridging traditional finance with blockchain infrastructure. The protocol has secured high-profile integrations that signal real institutional confidence rather than speculative interest.
Fidelity’s involvement in tokenized fund strategies, PayPal’s linkage of its stablecoin ecosystem to ONDO’s yield layer, and Mastercard’s integration into multi-token payment rails collectively highlight a strong adoption curve.
Further backing from major asset managers like Franklin Templeton underscores ONDO’s positioning in tokenizing traditional financial instruments, a sector expected to scale significantly over the coming years. This convergence of TradFi and crypto infrastructure places ONDO at the center of a narrative that is increasingly capital-driven rather than sentiment-driven.
Fundamentals Strengthen: Real Usage Supports Market Expansion
Beyond partnerships, ONDO’s growth is backed by measurable ecosystem expansion. The protocol’s total value locked (TVL) has surged toward $3.5 billion, indicating sustained capital inflows. Revenue generation has also scaled, with multi-million dollar quarterly figures, reflecting actual usage rather than idle liquidity.
Meanwhile, ONDO is estimated to command over 60% of the tokenized equities market, solidifying its leadership in the RWA segment. This combination of dominant market share, growing TVL, and institutional-grade integrations suggests that ONDO is evolving into a core infrastructure layer, not just another altcoin narrative.
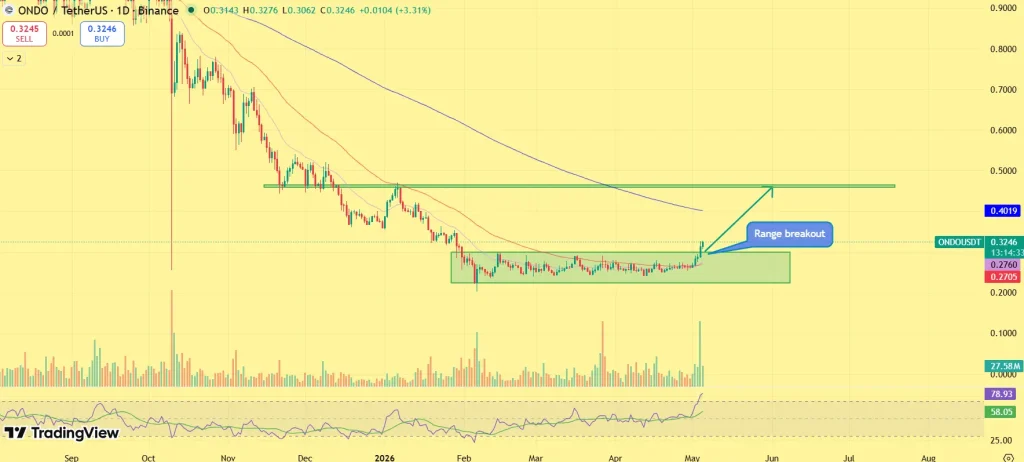
ONDO Price Analysis: Range Breakout Signals Early Expansion Phase
ONDO price has confirmed a breakout above its prolonged consolidation range between $0.27 and $0.32, marking a shift in market structure. The breakout is accompanied by rising momentum and sustained price acceptance above resistance, key indicators that the move is structural rather than short-lived. ONDO price is also holding above short-term moving averages, reinforcing bullish control.
If ONDO maintains strength above the $0.30–$0.32 zone, the next immediate resistance sits near $0.40. A successful move beyond this level could open the path toward $0.50–$0.57, aligning with higher timeframe supply zones. However, failure to hold the breakout region could lead to short-term consolidation, making support retention a critical factor in confirming continuation.
Is ONDO Entering a Sustained Growth Phase?
ONDO’s current trajectory reflects a rare alignment of price strength, institutional validation, and fundamental growth. The breakout suggests that the market is beginning to recognize its expanding role within the RWA ecosystem.
While short-term volatility remains possible after a strong weekly rally, the broader structure points toward early-stage expansion rather than exhaustion. If institutional momentum continues and key levels hold, ONDO could remain at the forefront of the next market leg, driven not by hype, but by real financial integration and scalable infrastructure.
Ethereum price is showing early signs of a confirmed breakout after pushing above a short-term consolidation pattern that had capped gains over the past week. According to data from crypto.news, Ethereum (ETH) climbed around 1% over the past day, trading…
Toncoin (TON) price has staged a sharp 22% rally, snapping out of its consolidation phase and pushing into a critical resistance zone. A deeper structural shift tied to Telegram’s expanding role within the TON ecosystem is beginning to reflect in price action, on-chain activity, and liquidity flows. As volume accelerates and key levels come into play, TON price rally signals more than short-term momentum, it points to a possible revaluation phase driven by real demand expansion.
So what’s really driving this sudden surge in Toncoin (TON), and can the momentum sustain from here?
The core driver behind TON’s rally lies in Telegram’s deepening integration into the ecosystem. Rather than acting as a passive partner, Telegram is increasingly positioning itself as a key infrastructure layer, aligning its massive user base with TON’s blockchain.
TELEGRAM TO REPLACE TON FOUNDATION AS PRIMARY NETWORK OPERATOR
Telegram is officially taking over as the primary driving force behind the $TON network, replacing the independent TON Foundation.
With 900M+ users, Telegram effectively acts as a native distribution engine for TON. Wallet functionality, mini-app ecosystems, and payment rails are being embedded directly into the platform, significantly reducing onboarding friction. This transforms TON from a traditional Layer-1 into a user-integrated network, where adoption is driven organically through existing user behavior. This shift changes demand dynamics. Instead of relying purely on external speculation, TON now benefits from embedded utility, where transactions, interactions, and applications generate consistent on-chain activity.
On-Chain Growth and Liquidity Confirm Expansion
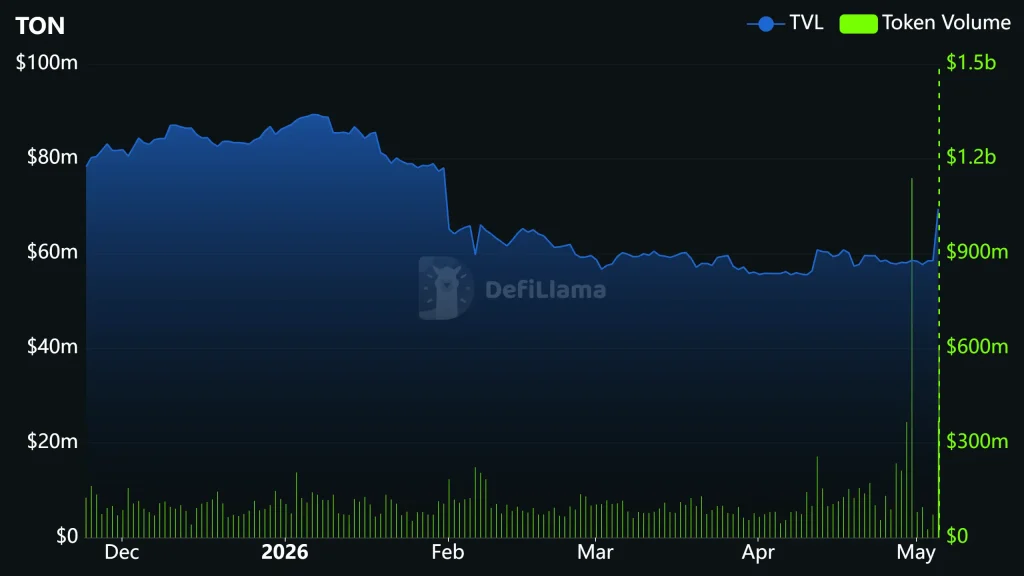
The rally is supported by clear improvements in ecosystem metrics. TON’s Total Value Locked (TVL) has climbed toward ~$69 million, signaling renewed capital inflows into its DeFi layer. At the same time, the stablecoin supply has expanded to around $750M+, strengthening liquidity depth across the network.
Network usage is also picking up pace. Daily DEX volume is holding near $15M, while application-level revenue and fees have shown steady growth, indicating real transactional activity rather than passive holding.
Notably, derivatives activity remains relatively low compared to spot, suggesting that the current rally is being driven more by organic demand than leveraged speculation, a healthier structure for continuation.
Toncoin Price Rally Enters Decision Zone as TON Price Pressures Resistance
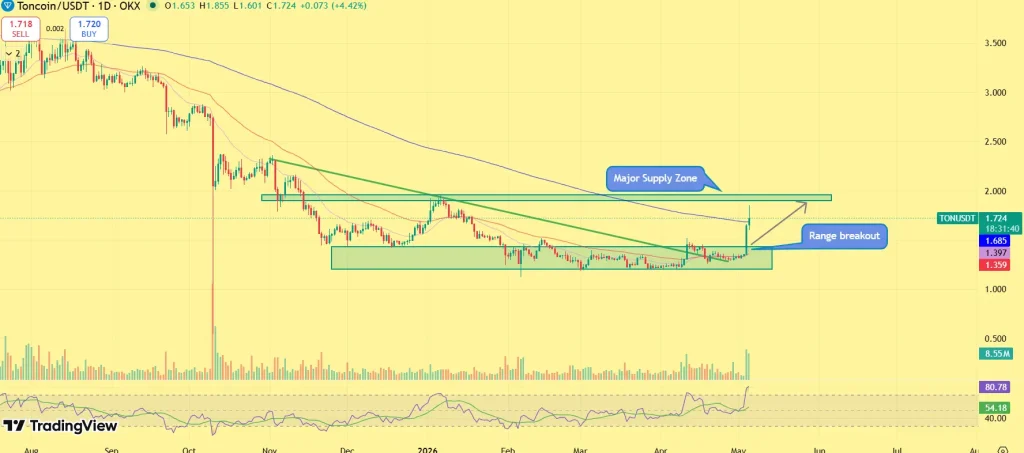
As Toncoin’s price rally gains traction, price is now entering a decisive phase where structure meets resistance. After breaking out of a prolonged consolidation, TON is trading around $1.65–$1.70, signaling a shift from accumulation into early expansion.
The immediate focus is the $1.70–$2.00 resistance band, a prior supply zone that previously capped upside. In the current move, price is compressing just below this level with minimal pullbacks, suggesting that selling pressure is being steadily absorbed as buyers step in at higher levels. Furthermore, volume spike during the breakout reinforces this shift, indicating real participation rather than a low-liquidity spike, while momentum indicators remain supportive of continuation.
A clean break and hold above $2.00 would confirm acceptance and open the path toward $2.50–$3.00, where the next liquidity cluster sits. On the downside, the $1.40–$1.50 range now acts as structural support, keeping the broader bullish setup intact as long as it holds.
What’s Next for Toncoin (TON)?
Toncoin is approaching a decisive moment where narrative and price structure are beginning to align. The $2.00 resistance now stands as the key trigger, clearing it could shift TON from breakout attempt to full expansion, opening room toward $2.50–$3.00.
With Telegram integration steadily building real demand, the current setup suggests more than a short-term rally. However, without confirmation, consolidation remains possible. For now, TON appears to be moving from momentum into a structurally driven growth phase, where the next move will define the trend.
In the last 24 hours, Bitcoin (BTC) has repeatedly broken above the $80,000 psychological level, having abandoned it in January. The burning question in the market now is whether this marks a bullish reversal or simply a fakeout.
How Bitcoin got to $80K
Achieving $80K was triggered by a massive short squeeze. According to crypto market data and analytics platform CoinGlass, short trader liquidations totalled $199.32 million in the past 24 hours,
Another contributory factor is renewed institutional interest in the flagship coin. This was evidenced by $629.8 million in spot Bitcoin ETF inflows on May 1 and $603.14 million on May 4.
Even more, Strive recently acquired 444 BTC, bringing its treasury to 15,000 BTC and making it the 9th largest public corporate Bitcoin holder globally. Meanwhile, Strategy announced a temporary pause in its Bitcoin purchases to remain compliant with regulations ahead of its May 5 Q1 2026 earnings report.
Treasuries & #ETFs Board. Crypto Accumulation and Capital Flows
April closed as the strongest month of 2026, with approximately $1.97B in net #inflows across crypto treasury strategies and ETFs. pic.twitter.com/iWdRs4Eu3H
— CryptoDiffer Analytics (@CryptoDiffer) May 4, 2026
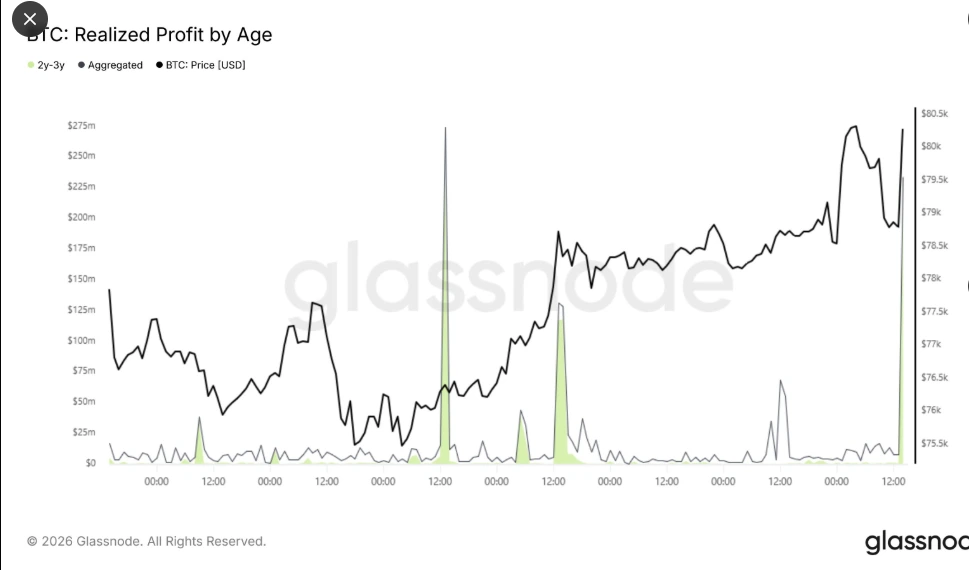
As prices crested at $80K, the 2-3 year BTC holding cohort, or those who accumulated just before the crypto ETF launches, ramped up their profit-taking. According to on-chain intelligence platform Glassnode, this group liquidated $209 million/hr, cashing in profits of 60%-100%.
What BTC needs to confirm the bull market entrance
Still, Bitcoin remains indecisive about maintaining the $80K milestone. Multiple closes above this level could ignite a short squeeze, leading to $84,000-$85,500.
Another sign of a bullish reversal would be BTC forming higher highs while its relative strength index (RSI) forms lower highs. Currently, the RSI reads 65.
Additionally, the 24-hour Bitcoin trading volume rallied to $56.51 billion on May 4, up from $16.76 billion on May 2. While indicating high short-term growth, these trading volumes remain lower than those recorded during previous breakouts. A periststent uptrend would demand even higher volumes, indicating strong institutional conviction and unwavering absorption of overhead supply.
To keep a bullish structure intact, prices must hold above the $72,352 100-day moving average. Defensive zones would be between $73,000 – $75,000, where a fall below this would suggest the upswing was but a bull trap.
Bitcoin price broke above $80,000 on May 4 for the first time since January 31, reaching the level as Consensus 2026 opened in Miami and $630 million in US spot Bitcoin ETF inflows on May 1 gave the move institutional…
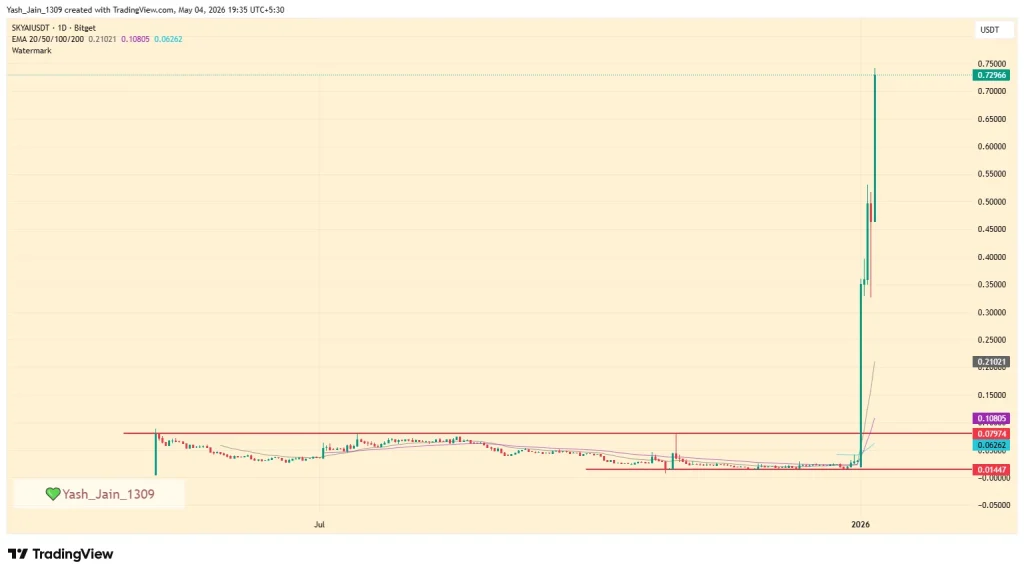
Investors and traders have been staring at the same boring sideways SKYAI chart, but this is bit different. Since May 2025, the SKYAI price was in a range but the recent price action probably gave you a mild heart attack, as it was a sniper rally.
The shock was that for a whole year, this thing was trapped in a depressing range between $0.01447 and $0.07974, basically doing a whole lot of nothing. Then May 2026 hits, and suddenly, we see a sniper parabolic jump that sends the token screaming to $0.72645. We’re talking about a 4100% rally that makes your average “to the moon” tweet look like a joke.
But before you scream “manipulation,” let’s look at the narrative, because this wasn’t just only a leveraged pump. It turns out, people actually care about the AI agent concept, and SKYAI is currently riding that wave like a pro surfer.
AI Agent Narrative Drives Parabolic Growth
Well, the demand is being fueled by actual infrastructure news, not just hot air. On April 30, Bitget listed the pair, which provided the initial spark, but the real gasoline came on May 3rd. The team announced final testing for the SKYAI MCP Hub. This isn’t just another protocol; it’s a routing layer for agents designed to handle multiple MCP servers, dynamic tool routing, and cross-agent sharing.
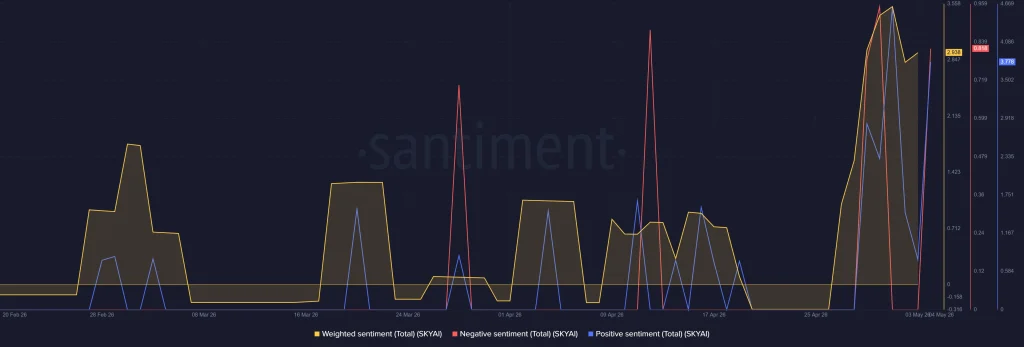
Basically, they’re building the “brain” for agentic orchestration. When you combine a trending narrative with a exchange listing, you get the kind of social sentiment spike that flips weighted sentiment aggressively to the positive side, per onchain data.
Presale Returns And The Long Game
But let’s be real, the “overnight” success of the SKYAI price was actually a year in the making. On May 4th, the team reminded everyone that presale participants who aligned early are now sitting on massive returns.
Now, while many are chasing the 4100% rally this week, the infrastructure has been quietly cooking in the background. So, what’s next? The devs claim returns are just a byproduct of development, but in this market, sentiment is king, and right now, the king is wearing an AI crown.
And about the price it’s at a cautionary stage if it breaks below $0.60034 a dump could be on its way, but holding $0.70380 could keep the trend intact and could stretch towards $1.0 ,if demand keeps up.
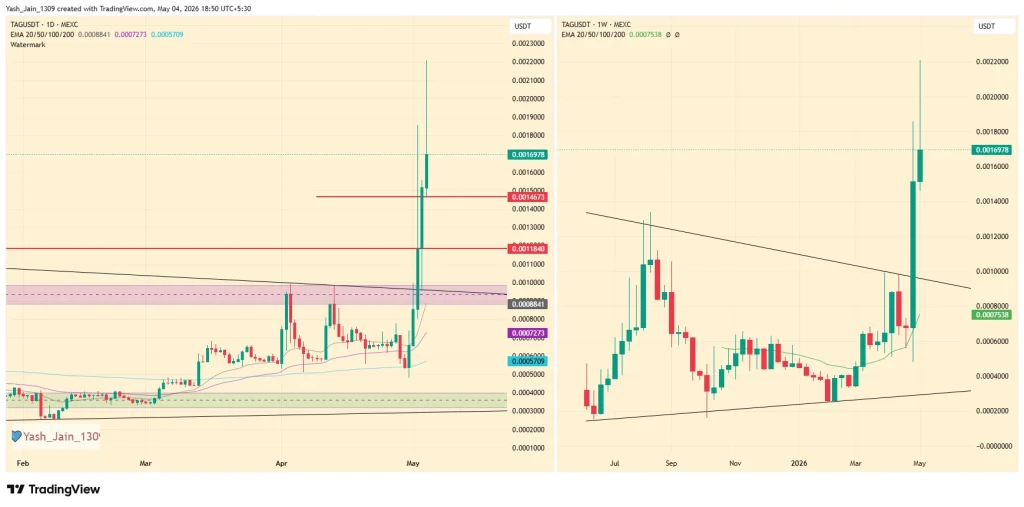
TAG price had a mesmerizing clean breakout rally this week. After months stuck in a tight $0.0003200 to $0.0009700 range, TAG finally snapped out of its cage, ripping all the way to $0.0022000. That’s not just any ordinary rally, it’s a full-blown demand based shift.
TAG Price Breakout Confirms Long-Term Compression Pattern
Here’s the setup. The weekly structure had been coiling inside a symmetrical triangle for months. Classic compression. The kind that doesn’t whisper but then it explodes big, that’s what occurred this time.
A breakout triggered from the 200-day EMA zone support around $0.0005721. Once that level flipped, momentum didn’t hesitate. Buyers piled in, resistance levels got steamrolled, and suddenly TAG price wasn’t range-bound anymore but it was vertical.
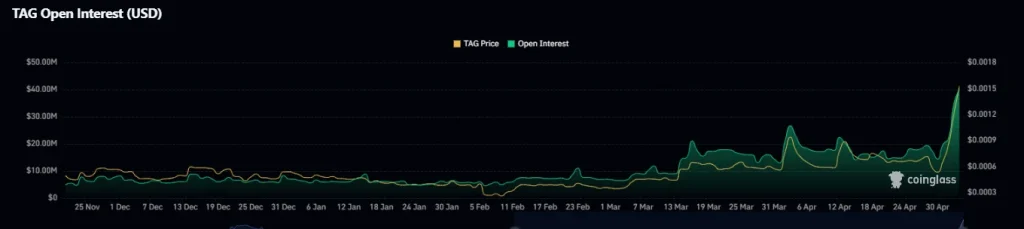
Derivatives Frenzy Fuels Aggressive Short Squeeze Move
But let’s not pretend this was all spot-driven enthusiasm. Futures data tells the real story. Open Interest jumped from roughly $14 million to $40 million. That’s not casual participation that’s leverage entering the chat.
And where there’s leverage, there’s pain. Shorts got squeezed hard. Liquidations stacked up, pushing TAG price even higher as positions were forcibly closed. It’s the loop where price rises parabolically when shorts panics
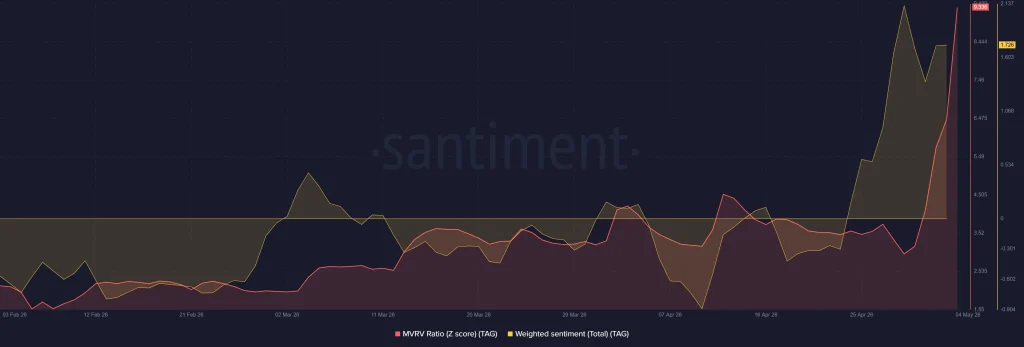
Sentiment Spike And MVRV Flash Warning Signals
Now comes the uncomfortable part. The onchain data like MVRV Z-score has touched ceiling above the zero line, and weighted sentiment has clearly spiked, too. Translation? The market is getting crowded on the optimistic side. That’s usually great until it feels extremely overheated.
Well, when everyone agrees it’s bullish, and optimism breaks the meter then risk quietly builds underneath.
Key Levels That Could Make Or Break Rally
So, what’s next? If this rally is real and not just a hype-driven spike then in that case the TAG price needs to hold above $0.0014673 and $0.0011840. Those are the battlegrounds. Lose them, and things could unwind fast.
And not gently. A breakdown could erase a large chunk of gains just as quickly as they appeared. For now, TAG price is riding momentum. But momentum, as always, has an expiration date.
Dash has suddenly re-entered the spotlight with a sharp double-digit rally, catching traders off guard after weeks of quiet price action. The move has pushed price toward the $50 zone, accompanied by a rapid surge in market participation across trading venues. Key resistance levels have been cleared in a single move, signaling a shift in short-term structure. Such rapid expansions rarely occur without a deeper trigger forming beneath the surface. Here are the key details driving today’s Dash price surge.
What’s Fueling Dash Price Rally?
Dash’s rally is being driven by a combination of fundamental repricing and strong market participation. The Evolution upgrade has expanded Dash’s utility into smart contracts and cross-chain functionality, prompting the market to reassess its valuation. Assets typically see renewed demand when their use case broadens, and Dash is now transitioning from a niche payments narrative into a wider ecosystem play.
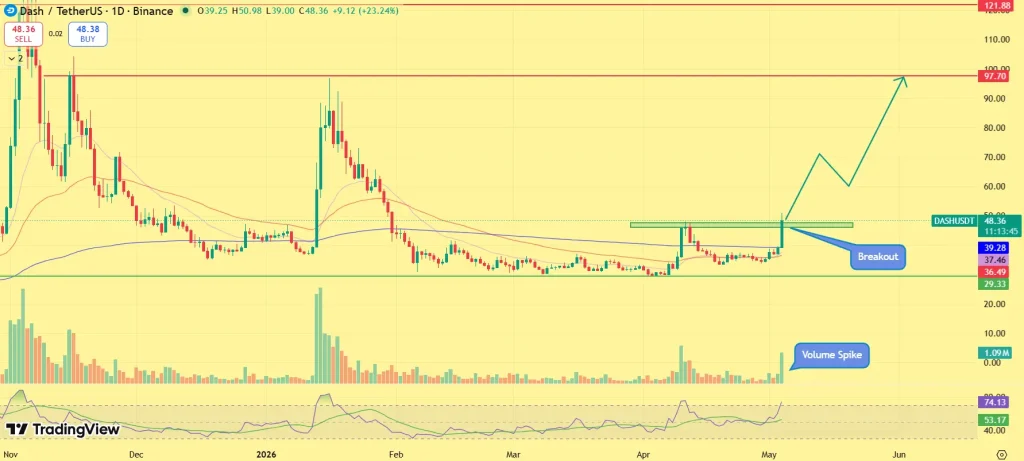
At the same time, the setup was technically primed. DASH spent weeks consolidating between $30 and $38, forming a strong accumulation base. The breakout from this range reflects a shift where demand has absorbed supply, triggering a fresh expansion phase. The speed of the move suggests capital rotation into an asset that had remained relatively underpriced during the broader market recovery.
Dash has delivered a clean and decisive breakout. DASH price has surged toward the $48–$50 resistance zone, a level that had previously rejected multiple upside attempts. This breakout is backed by a strong bullish candle and a visible spike in volume, confirming genuine buying pressure.
The move also aligns with a broader structural transition. After months of sideways action, Dash has shifted from a range-bound market into a trend expansion phase, where higher price discovery toward $70 becomes more likely. The reclaim of key moving averages further strengthens the bullish bias, while momentum indicators show expansion, not exhaustion. As long as price holds above the $45 support zone, the breakout remains valid, and dips are likely to be viewed as continuation opportunities rather than reversals.
Derivatives Data Signals Fresh Long Positioning
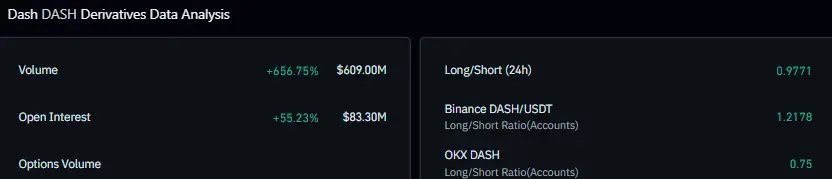
The derivatives market reinforces the strength of this move. Over the last 24 hours, futures volume has surged to around $609 million, while open interest has jumped over 55% to $83 million. This combination is critical. Rising price alongside rising open interest typically signals new capital entering the market, rather than short covering. It reflects traders actively building long exposure in anticipation of further upside.
Positioning data also shows a long bias among top traders, while funding rates remain relatively stable. This indicates that leverage is building in a controlled manner, reducing the risk of an immediate squeeze-driven pullback and supporting the case for continuation.
Will Dash Price Hit $70 in May 2026?
Dash now enters a critical continuation phase. Holding above the $45–$48 breakout zone keeps the structure intact and opens the path toward $55–$60 in the near term. A sustained move beyond this range could bring $70 into focus, aligning with higher timeframe resistance and representing a natural extension of the breakout. However, losing the breakout zone could trigger a pullback toward $38–$40. For now, with volume expansion and rising open interest supporting the move, the bias remains toward upside continuation.
BSB price erupting massively and in barely 48 hours, Blockstreet’s native token has pulled off a near 150% rally, ripping from $0.466 to a fresh all-time high near $1.20. And no, this wasn’t random. The timing lines up almost perfectly with the project finally dropping its long-awaited tokenomics reveal.
Tokenomics Reveal Sparks Sudden Market Frenzy
Most interestingly, the announcement wasn’t just another whitepaper dump but it laid out a full ecosystem vision. Its post said that BSB isn’t just a token; it’s pitched as the backbone of utility access, liquidity participation, staking alignment, and governance across Block Street’s infrastructure.
Utility, staking, governance, it checked all the boxes traders like to hear. Add in structured yield access, fee reductions, and liquidity incentives, and suddenly the narrative writes itself. Since, markets love a clean narrative and BSB gave that.
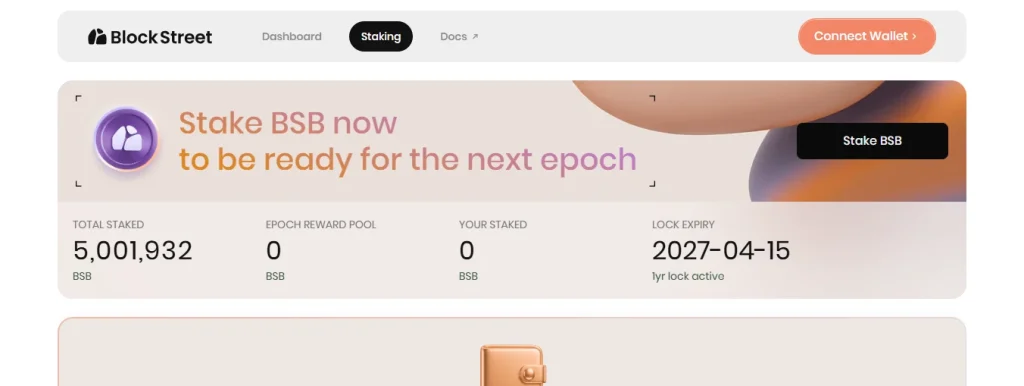
Staking Surge Signals Strong Conviction Shift
But let’s be real price doesn’t move like that on words alone, real participation is needed. The staking data adds another confirmation layer to this engagement. As over 5 million BSB is now locked, signaling something deeper than speculative hype. That’s capital committing, not just rotating.
The messaging around “alignment” and “coordination” clearly hit home. It’s not just yield farming anymore but it’s kind of a positioning within a system that’s trying to look bigger than just another token launch.
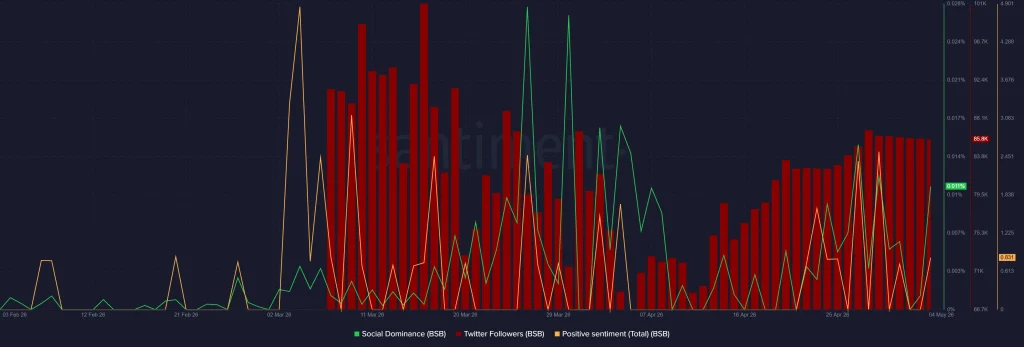
Social Hype Machine Kicks Into Overdrive
Now throw social metrics into the mix. Since April, Twitter followers have been climbing, and social dominance has spiked alongside positive sentiment. That’s usually the fuel phase where awareness turns into momentum.
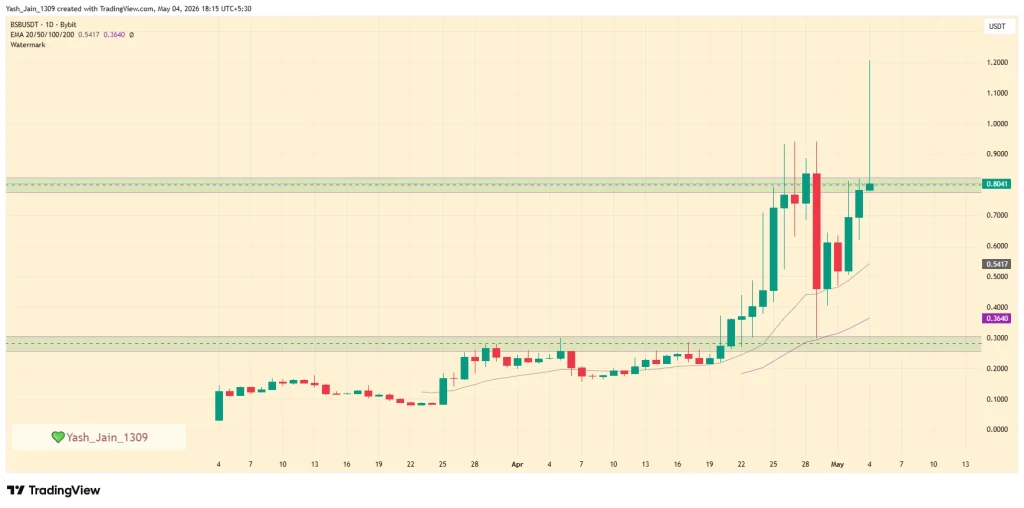
Now, the BSB price now sits in a high-risk zone. Momentum was aggressive, but the spike reduced from $1.20 to around $0.80 support, which has emerged as the line in the sand. Lose that, and the chart opens up quickly with a potential retrace toward $0.30 lurking beneath.
Hold it, though? Different story. Sustained strength could legitimize this breakout as more than just a news-driven spike.
Right now, BSB price action isn’t subtle. It’s loud, fast, and very, very dependent on whether conviction sticks around.
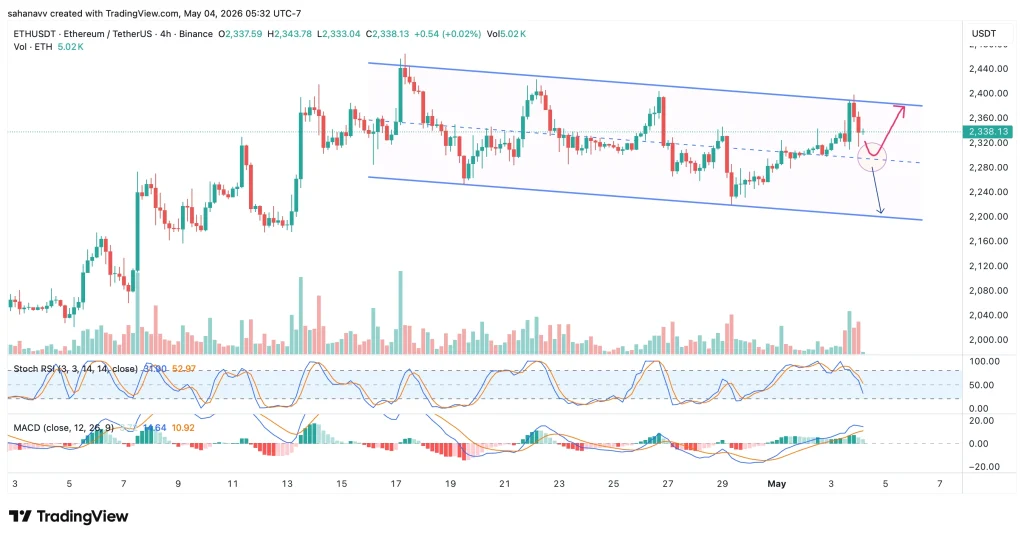
The Ethereum price once again failed to rise above $2,400 as Bitcoin surpassed $80,000 for the first time since February. It continues to respect a descending channel, with price once again rejecting near the upper trendline close to $2,400. This marks another failed breakout attempt, reinforcing the level as strong resistance. Despite multiple pushes higher, ETH has not been able to sustain momentum above this zone, keeping the structure capped in the short term.
At the same time, the price is now hovering around the mid-range, with $2,300 emerging as the key level to watch. This area aligns with the channel’s internal support and has repeatedly acted as a pivot. A clean hold here could trigger another move toward the upper trendline, but a breakdown would likely send the ETH price toward the lower boundary near the $2,200 region.
The stochastic RSI is cooling off from higher levels, suggesting the recent push is losing strength, while the MACD remains slightly bullish but is flattening. This combination reflects a slowdown rather than a reversal—but it increases the probability of a short-term pullback. If ETH holds above $2,300, the structure remains intact, and another attempt at $2,400 becomes likely.
Ethereum is not breaking out, but it’s rejecting and compressing. The repeated failure at $2,400 confirms sellers are still in control at the top of the range, shifting focus to $2,300 as the key decision level. With momentum starting to cool, the structure leans slightly bearish in the short term. Unless the ETH price quickly reclaims strength above the upper trendline, a breakdown below $2,300 becomes the more likely path, opening room toward the $2,200 zone.
Ondo price surged sharply on May 4, as strong fundamentals and rising demand for real-world asset exposure pushed the altcoin higher. According to data from crypto.news, Ondo (ONDO) price jumped nearly 13% over the past day, climbing from an intraday…
Solana price is approaching a critical technical setup as momentum indicators begin to flip positive, raising the possibility of a breakout above the $90 level, where bulls have struggled in recent weeks. According to data from crypto.news, Solana (SOL) price…
Last week, UNC tennis player Reese Brantmeier—the 2025 ACC Player of the Year—and former University of Texas tennis player Maya Joint filed a brief in support of a class action settlement with the NCAA that captures another way college sports is moving away from the longstanding amateurism model and toward money opportunities for young people.
Peggy Wedgworth, Joel Lulla and other attorneys on behalf of the players urge Chief U.S. District Judge Catherine C. Eagles to preliminarily approve a settlement that has played a key role in the NCAA dropping restrictions on athletes’ prize money.
The NCAA’s Division I Cabinet recently voted to allow athletes to accept prize money without losing NCAA eligibility as part of the class action and, an NCAA spokesperson told Sportico, as part of Division I’s “ongoing work to modernize rules to benefit student-athletes.” The NCAA previously prohibited young athletes from accepting more than $10,000 per calendar year in prize money prior to attending college, with allowances for additional prize money not exceeding actual and necessary expenses.
Brantmeier, 21, has earned $152,930 in prize money over her career, but has had to forfeit some of it to maintain her NCAA eligibility. She earned $49,109 as a 16-year-old high school junior, including through her performance at the 2021 U.S. Open, but she could only accept up to $10,000 if she wanted to play college tennis.
Joint, 20, has earned $363,349 in prize money over her career, and, like Brantmeier with UNC, couldn’t keep all of it before she attended UT as a tennis player. In fact, she reportedly forfeited about $140,000 to comply with NCAA rules, but at the end of 2024 announced she was leaving college to pursue professional opportunities.
The class action represents approximately 12,000 student-athletes who have either competed in D-I tennis since March 19, 2020, or who were deemed ineligible to compete due to prize money rules. Court records indicate that around 60 athletes are described as being owed damages on account of voluntarily forfeiting prize money earned in a tennis tournament to comply with NCAA rules.
If approved by Judge Eagles, the settlement would involve the NCAA agreeing to pay a damages amount of $2.02 million along with additional money for attorneys’ fees, costs and other expenses.
The elimination of pre-college prize money restrictions applies to all student-athletes, not just tennis players. The NCAA, per the settlement, also pledges not to reinstate these rules later.
The settlement doesn’t change long-standing NCAA rules that restrict athletes from accepting prize money after collegiate enrollment. Those athletes, however, can earn NIL and revenue-share compensation while in college and remain in compliance with NCAA eligibility rules.
The eligibility of new college athletes who have earned money in their sport has expanded in recent years. This is true of those athletes who earned NIL money in high school, of basketball players who played professionally in the G League and abroad, and of hockey players who earned compensation through playing in the Canadian Hockey League and overseas. The NCAA has held the line on denying eligibility of basketball players who signed NBA contracts, but broadly speaking, there’s a noticeable shift away from college sports populated by true amateurs.
This shift is occurring as more young people in America can earn money in ways that weren’t available to older generations when they were children and teens. Esports and social media influencing, for example, create chances for young people to make money in the same vein as more traditional routes like acting and music.
Whether young people “making money” is a good thing is a question that policymakers and lawmakers will need to tackle. The addictiveness of social media with young people recently led a jury in Los Angeles to find Meta and YouTube negligent for designing their apps in ways that caused children to become addicted, leading to mental health harms. There are also privacy concerns, as Harvard Law School professor Leah Plunkett recently explained on podcast Culture Apothecary, with influencing in sports and entertainment and AI’s use of the accompanying content.
The NCAA’s elimination of pre-enrollment prize money caps will open the door for talented high school athletes to earn compensation without losing the chance for an athletic scholarship to college. In a world where young athletes can earn significant compensation through NIL and revenue share, the NCAA faced conceptual hurdles trying to defend prize money rules. But these shifts in athletics aren’t occurring in a vacuum, as more young people and their parents pursue earning money in contemporary sports and entertainment, the line between “amateur” and “pro” is getting blurrier.
Ethereum’s price action may look stable on the surface, but underneath, a powerful accumulation phase is unfolding. Over $300 million worth of ETH has been absorbed by whales in recent days, while staking queues continue to expand, tightening circulating supply at a rapid pace. Despite this, price remains compressed below a critical resistance zone, suggesting that buyers are building positions rather than chasing breakouts.
Historically, such conditions precede sharp directional moves. With ETH now pressing against a key technical ceiling, the market is watching closely, because a breakout here could quickly shift the narrative toward a $3,000 retest.
Whales Absorb $322M ETH as Smart Money Builds Positions
Ethereum’s on-chain data is sending a clear signal: large players are accumulating aggressively during consolidation. Whale wallets have added over 140,000 ETH (~$322 million) within a short time frame, coinciding with ETH holding firm above the $2,300 level after a brief dip toward $2,260.
ETH WHALES BUY $322M AS PRICE HOLDS $2,300
Onchain data shows $ETH whales accumulated roughly $322M worth of $ETH in the past 48 hours, with price holding firmly above the $2,300 zone after dipping to $2,260 mid-week.
The absence of a sharp price spike despite heavy inflows indicates controlled accumulation, where supply is being steadily absorbed without alerting the broader market. Additional flow data shows that spot order sizes are increasingly dominated by large participants, reinforcing the idea that institutions and high-net-worth players are positioning early.
Historically, such accumulation phases tend to precede volatility expansion, especially when they occur near key technical inflection zones.
Staking Demand Surges, Triggering a Structural Supply Squeeze
Beyond whale activity, Ethereum’s supply dynamics are tightening significantly. Current data shows ~3.48 million ETH queued for staking versus just ~441,000 ETH queued for exit, creating an 8:1 imbalance favoring supply lock-up.
ETH STAKING ENTRIES OUTPACE EXITS BY 8X
There is now some 3,484,960 $ETH waiting to be staked on the @Ethereum network, compared with only 441,450 waiting to be unstaked.
The 3,484,960 figure equates to roughly $8 billion worth of demand, based on current prices.
As more ETH moves into staking contracts, liquid supply across exchanges declines, reducing the available inventory for selling pressure. At the same time, OTC absorption and long-term holder positioning are reinforcing this trend. The result is a market environment where supply is quietly shrinking while demand builds in the background. This kind of imbalance often leads to sharp repricing once resistance levels are cleared, as there is less available supply to cap upside moves.
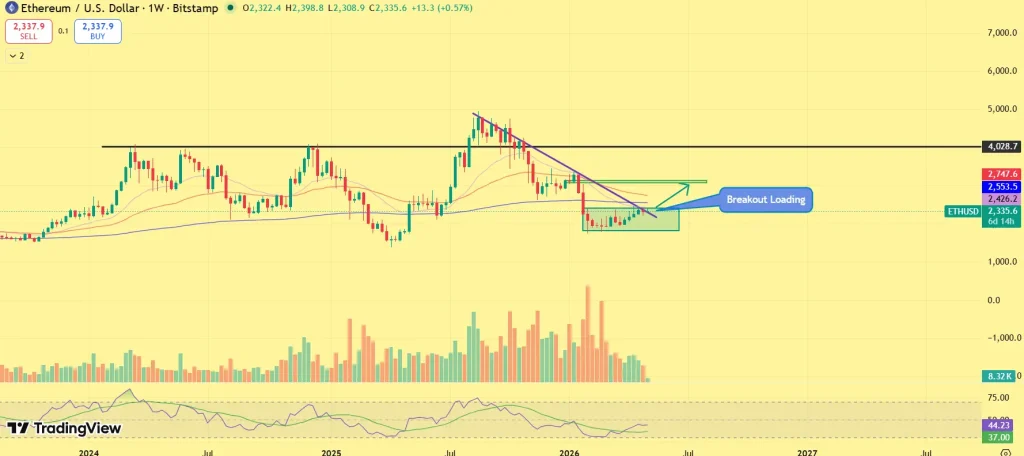
Ethereum price is trading within a well-defined accumulation range between $2,250 and $2,600, following its earlier corrective phase. Price structure within this range has shifted, higher lows are forming, indicating that buyers are gradually gaining control. The key resistance zone lies between $2,600 and $2,750, aligning with a previous breakdown region and higher-timeframe supply. ETH has tested this area multiple times, but recent price action shows tightening consolidation rather than sharp rejection, suggesting that sellers are being absorbed.
This compression beneath resistance is critical. It reflects reduced selling pressure and increasing bullish pressure, often seen before breakout moves. A confirmed daily close above $2,750 would validate a structural breakout, opening the path toward $3,000 as the next psychological and liquidity target. Beyond that, the next resistance cluster sits around $3,300–$3,400, where prior distribution occurred. On the downside, failure to break higher could trigger a pullback toward the $2,200–$2,300 demand zone, which has consistently acted as a strong support base. As long as this zone holds, the broader bullish structure remains intact.
Can Ethereum (ETH) Reach $3K?
Ethereum is approaching a decision point where structure, on-chain data, and supply dynamics are aligning. Whale accumulation, staking-driven supply reduction, and price compression collectively suggest that the market is in the late stages of accumulation. The key trigger now lies at the $2,750–$2,800 breakout zone. A sustained move above this level could accelerate momentum and push ETH toward the $3,000 mark in the near term, especially if broader market sentiment remains supportive.
Ethereum price is eyeing a breakout from the $2,400 resistance, which has capped the token’s gains over the past week. According to data from crypto.news, Ethereum (ETH) price rebounded 3.5% to $2,393 on May 4 before facing rejection at $2,400…
The ROG Equalizer doesn't work as advertised as discovered by Der8auer in his latest demonstration. ROG Equalizer 12V-2x6 Cable Shows Large Current Imbalance On WireView Pro II While Removing the Bridge Improves Balancing It appears that ASUS's recently released ROG Equalizer 12V-2x6 cable might not be the solution for proper load balancing. ASUS explicitly advertised the ROG Equalizer cable as a component that does better load balancing than regular 12V-2x6 cables, but the testing by popular German YouTuber Der8auer reveals something interesting. Der8auer has made two videos on the connector, but his latest video finds out what makes the ROG […]
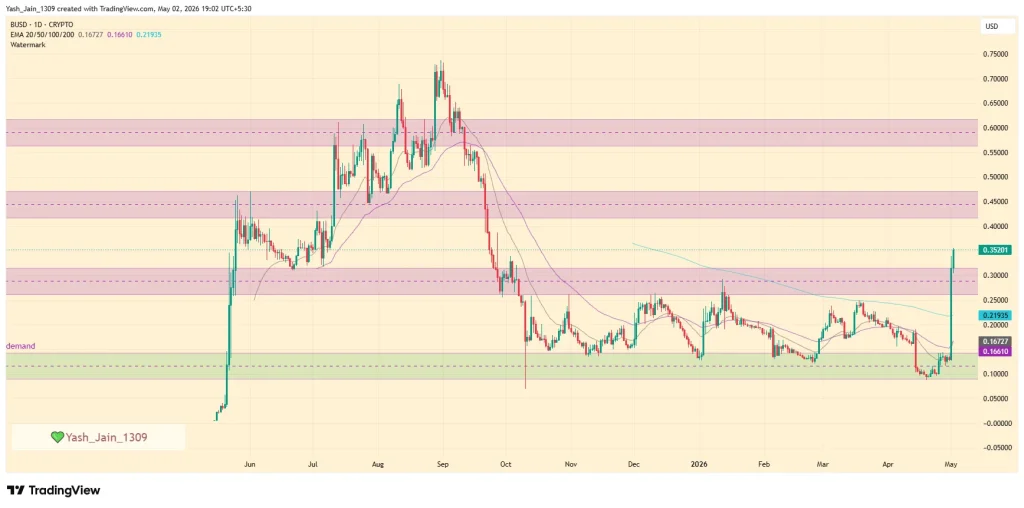
The B crypto price just did what most altcoins only dream about thats by ripping through a major downtrend with a brutal 60% intraday surge, landing near $0.352. No slow grind, no polite breakout. Just a straight-up detonation fueled by a viral social media wave that, oddly enough, involved an animated Donald Trump and a lion mascot.
Really? Yes. But beneath just an meme something more structural just shifted.
B crypto price breakout flips bearish structure completely
For months, B was stuck in a classic downtrend with lower highs, fading interest, the usual slow bleed. Then came the breakout today by a meme post. And which is clearly not a subtle one.
The B crypto price blasted through multiple resistance levels in a single session and, more importantly, reclaimed the 200-day EMA sitting around $0.219. That’s not just a technical milestone, it’s a regime change or kind of change in character. Assets don’t casually reclaim that level unless sentiment flips hard.
Volume backed it up too. This wasn’t thin liquidity pushing candles higher. This was real participation.
So yeah, technically speaking, B just walked out of a bearish phase and into a high-volatility expansion. The kind traders chase and regret later if they’re late.
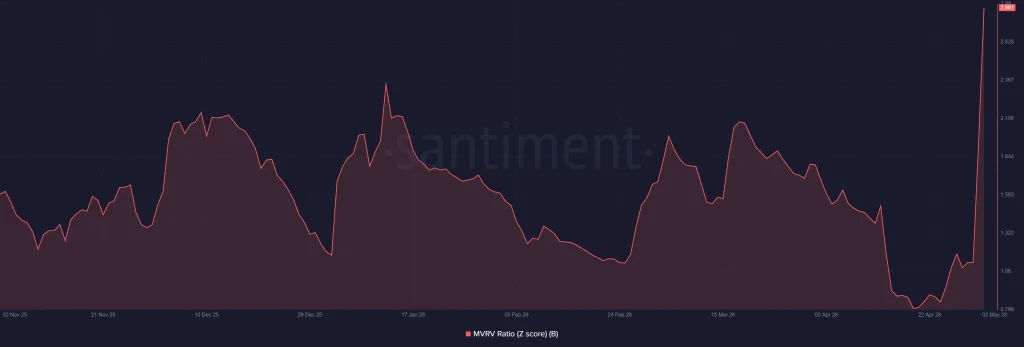
Now, here’s where things get a little less comfortable. Yes, the price run was good but the MVRV Z-score has climbed to around 2.86, too which is pretty high. Translation? The market value is running way ahead of what holders actually paid for the asset.
Historically, this is kind of a “red zone” where profit-taking may start creeping in if demand fails to sustain or push higher. Not always immediately, but the risk builds. The higher it goes, the more tempting it becomes for early buyers to cash out.
So while the rising Z-score confirms strong momentum, it’s also quietly flashing a warning: things might be getting a bit stretched. And markets hate being stretched for too long.
Derivatives explosion and short squeeze fuel rally
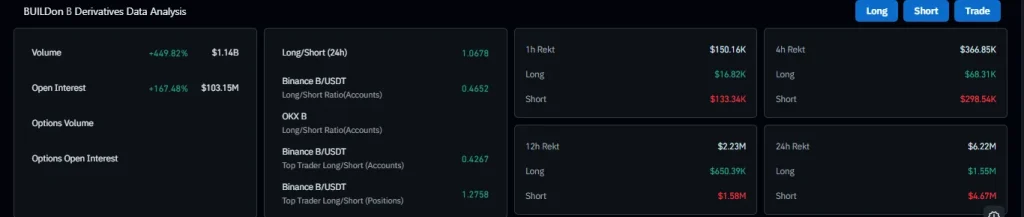
Well, with the move today, the sleeping derivatives activities went absolutely wild. As trading volume surged over 449%, hitting $1.14 billion. Open Interest? Up 167%, now sitting at $103.15 million. That’s not passive interest that’s aggressive positioning.
And then came the squeeze, which perhaps was the major fuel. Data says, over $4.67 million in short positions got wiped out in 24 hours. That’s forced buying pressure, the kind that accelerates moves and creates those vertical spikes everyone screenshots.
But let’s be real, because practically this cuts both ways. Why? Because, high leverage always means high fragility. If sentiment shifts even slightly, then this same structure can unwind just as fast as it built.
So, curious wanna basically want to know what’s next? Everything now hinges on one level: $0.30. Hold it, and the B crypto price might stabilize and build a base for continuation. Lose it, and the market could cool off quickly as profit-taking and leverage unwind kick in.
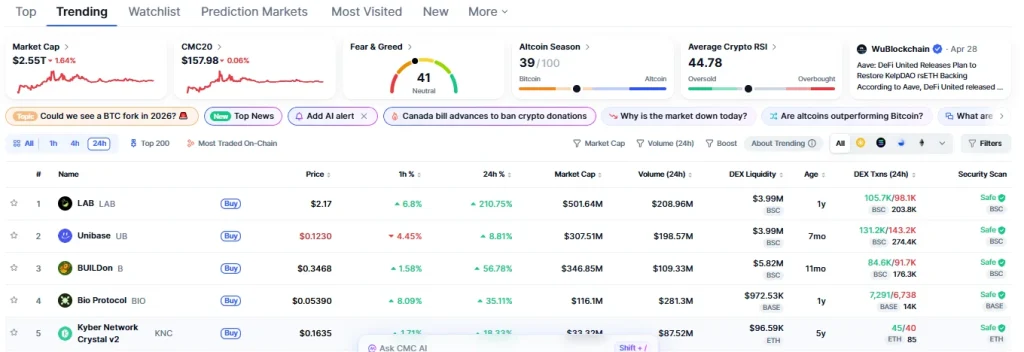
The LAB crypto price didn’t just rally today it detonated. Up over 210% intraday and now sitting with a market cap around $502 million, it has bulldozed its way to the no. 1 trending spot on CoinMarketCap. And no, this isn’t one of those quiet pumps nobody notices. This one came loud, fast, and packed with narrative.
Because apparently, trading isn’t just about reacting anymore but it’s about “understanding why.” That’s the pitch LAB is selling. And right now, the market seems to be buying it.
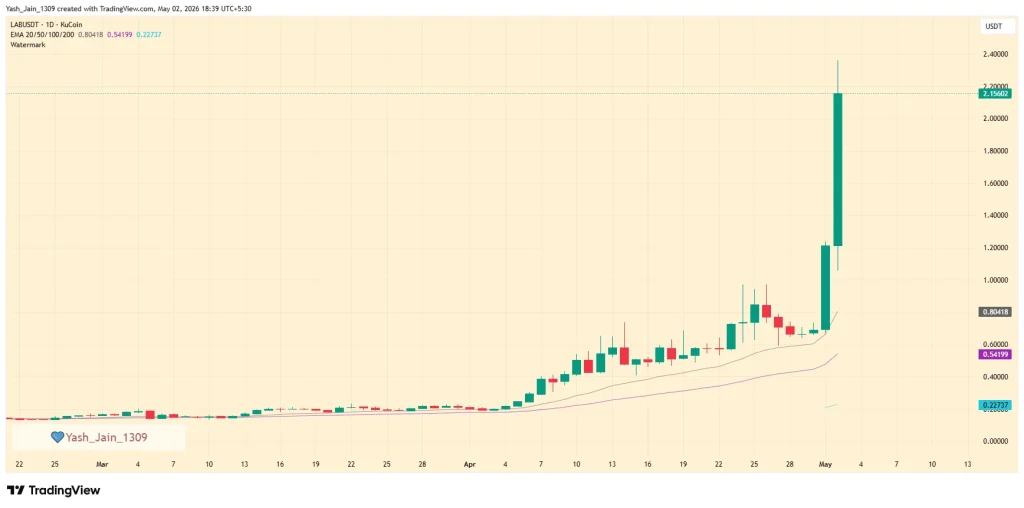
LAB crypto price breakout backed by strong narrative
Let’s rewind for a second. On April 27, the chart printed a clean hammer candle right on the 20-day EMA which clearly a classic signal that sellers were losing grip. Fast forward to today, and the LAB crypto price has blasted past $2 like it was barely there. Coincidence? Probably not.
The project has been actively pushing its core idea that most tools show activity, but LAB claims to connect the dots behind it. It’s a subtle shift in messaging, but clearly, it landed. Add to that the announcement of an upcoming mobile app which is still in its final polishing stage and you’ve got a narrative cocktail that traders love: utility + anticipation.
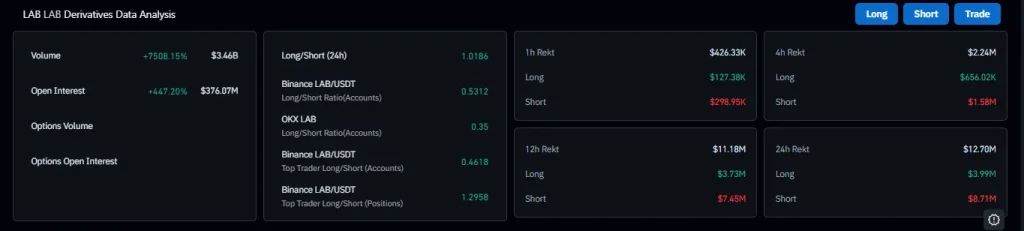
But let’s be real narratives don’t move markets alone. Liquidity does.
Well, here’s where things get wild. The derivatives market didn’t just react but it went into overdrive. Trading volume surged a ridiculous 7,500%, while Open Interest jumped 450%. That’s not organic growth. That’s traders piling in, fast and leveraged.
And then came the squeeze. Liquidation data shows $12.70 million wiped out in the last 24 hours, with $8.71 million of that being short positions. In plain terms? Bears got steamrolled. The kind of move that forces exits, fuels momentum, and creates those vertical candles everyone chases too late.
So yeah, the LAB crypto price didn’t climb it was pushed by leveraged fuel.
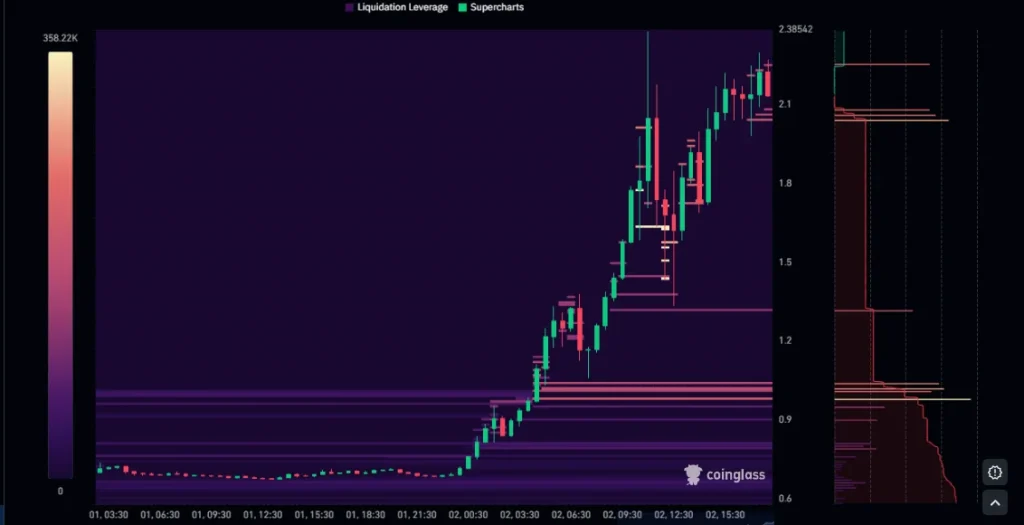
The $2 level now decides everything
Now comes the part nobody likes talking about during a rally and this is possible the downside condition.
The liquidation heatmap paints a pretty clear picture. The $2.00 level isn’t just psychological anymore it’s structural. Lose it, and there’s a gap below. Not a gentle decline. A drop into thin air, with potential targets around $1.31 and even $1.00. That’s the risk.
But flip it around, and things get interesting. If the LAB crypto price holds above $2 and manages a strong weekly close, the upside opens up significantly. We’re talking about a potential extension toward the $4 to $5 range that will be effectively another 100% move from current levels. Sounds crazy? Maybe. But then again, so did a 210% intraday rally.
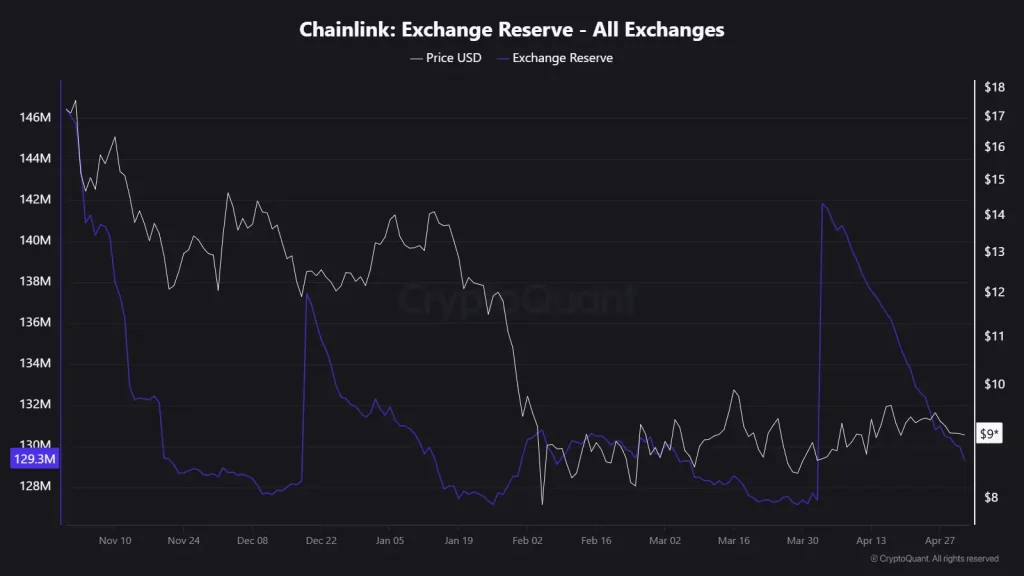
Chainlink (LINK) is flashing early accumulation signals beneath the surface as on-chain metrics begin to turn positive. Despite muted price action, whales are actively accumulating and exchange reserves are declining, pointing to a gradual reduction in sell-side pressure. Netflows have also shifted negative, indicating that more LINK is being withdrawn than deposited, often a sign of long-term positioning.
At the same time, Chainlink price continues to hold near a key demand zone, suggesting that buyers are stepping in to defend lower levels. With structure stabilizing and on-chain activity strengthening, the setup is becoming increasingly constructive: Is LINK positioning for its next breakout?
LINK On-Chain Data Signals Early Accumulation Phase
Chainlink’s on-chain data is beginning to reflect a meaningful shift in market behaviour. Exchange reserves have edged lower to approximately 129.3 million LINK, indicating fewer tokens available for immediate selling. More importantly, netflows have turned negative, with roughly 345K LINK moving off exchanges, a pattern commonly associated with accumulation phases. Investors typically withdraw assets to private wallets when anticipating higher prices, reducing circulating supply.
Network activity is also showing steady improvement, with active addresses rising modestly. This signals consistent participation rather than speculative spikes, reinforcing a healthier demand structure. Together, these metrics point toward a supply absorption phase, where selling pressure weakens while demand gradually strengthens beneath the surface.
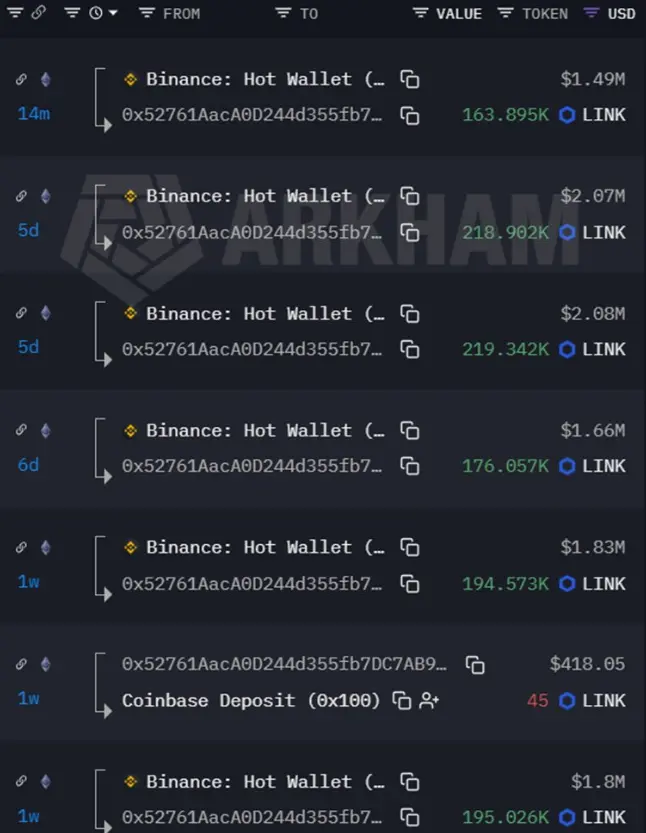
Whale Accumulation Signals Long-Term Positioning
Large holders are reinforcing this trend. A notable wallet holding over $10 million in LINK has continued to withdraw tokens from exchanges, including recent movements exceeding $1.4M, with cumulative outflows surpassing $11M.
Importantly, these assets are being held rather than actively traded, indicating a long-term positioning strategy. Such behavior is often seen during accumulation phases, where smart money builds exposure ahead of broader market participation. This divergence, strong accumulation alongside muted price action, suggests that LINK may be undervalued relative to underlying demand, setting the stage for a potential revaluation.
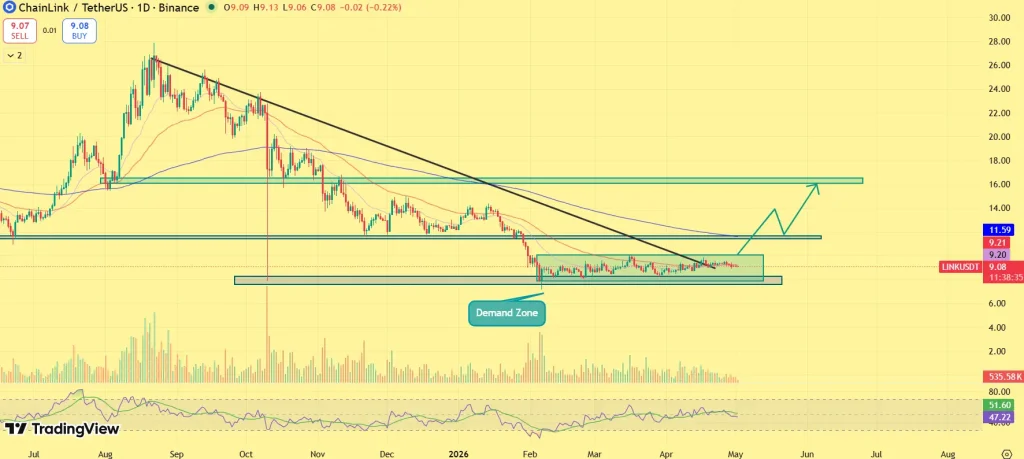
LINK Price Outlook: $12 Emerges as Breakout Level
Chainlink is currently trading within a defined range between $8 and $12, with price holding firmly above the $8–$9 demand zone, which has consistently acted as support. The structure shows higher lows forming, indicating that buyers are stepping in earlier during pullbacks. At the same time, LINK remains compressed below resistance, reflecting a tightening price range.
The key breakout level sits near $11.5–$12, where horizontal resistance aligns with trendline pressure. A sustained move above this zone could trigger momentum toward $14, followed by a broader supply region near $16–$18. As long as LINK holds above its demand zone, the structure remains constructive. The current phase can be viewed as pre-breakout consolidation, where pressure builds ahead of a directional move.
Outlook: What’s Next for LINK?
Chainlink now sits at a decisive juncture, where improving on-chain metrics and stabilizing price structure are beginning to align. With supply tightening and buyers defending the $8–$9 zone, the market appears to be building a base rather than weakening.
The next move hinges on $12, a confirmed breakout could unlock momentum toward higher levels, while failure may keep LINK range-bound. For now, accumulation signals remain strong, suggesting the next directional move is likely approaching rather than fading.
Bitcoin price rose nearly 3% to $78,700 on May 1 as Iran submitted a new peace proposal through Pakistani mediators to the United States, easing oil pressure and improving risk sentiment across global markets for the second time in a…
Bittensor price is showing renewed strength as it climbs above the $260 level, with improving momentum indicators hinting at a potential continuation of the recent recovery trend. According to data from crypto.news, Bittensor (TAO) price was trading around $263.19 at…
Solana price is showing signs of weakness as the MACD forms a bearish crossover, with price hovering just above a key support zone that could determine the next move. According to data from crypto.news, Solana (SOL) price was trading around…
BNB price is consolidating within a descending triangle pattern, with a horizontal support near $600 and a series of lower highs pressing against a downward-sloping resistance trendline, pointing to a potential breakdown. According to data from crypto.news, BNB (BNB) price…