Robinhood has rolled out a “Hood Holidays” countdown event, giving users a chance to share $500,000 worth of Dogecoin by joining an in-app countdown at 8:30 PM ET. Every eligible participant on the countdown screen receives a DOGE reward, turning the promo into a mass airdrop-style giveaway. Alongside Dogecoin, Robinhood is also offering high-end prizes, such as Rolex watches and Apple AirPods, to keep users engaged during the festive campaign.
The live Price of the Maker Dao token is $ 1,454.55988819
MKR could target the $2,800 zone by 2026 if DAI adoption and protocol revenues continue to expand.
By 2030, MKR may hit $12,000 levels if MakerDAO successfully evolves into a sustainable DeFi financial backbone.
Maker (MKR) is the governance token of MakerDAO and the Maker Protocol, both built on the Ethereum blockchain. The platform allows users to create and manage DAI, one of the most widely used decentralized stablecoins in crypto.
As the system behind DAI, Maker plays an important role in lending, borrowing, payments, and on-chain liquidity across the crypto market.
However, Maker’s native token MKR has faced a strong decline in recent months. The ongoing bear phase has pushed the token below the $1,600 level, making recovery difficult despite signs of improvement in the broader market.
With MKR under pressure, investors are now looking ahead to understand what may come next. Let’s take a closer look at Maker (MKR) price predictions for 2026, 2027, and 2030.
Unlike speculative DeFi tokens, MKR derives value from real protocol responsibility. It governs risk parameters, absorbs losses when things go wrong, and benefits when the system generates surplus. This makes MKR closer to an ownership-like asset than a simple utility token.
As 2026 approaches, MKR’s short-term outlook is closely tied to the growth in DAI circulation and Maker’s ongoing protocol restructuring.
Unlike many DeFi tokens, MKR tends to move in response to changes in fundamentals rather than during hype-driven rallies.
Technical Analysis
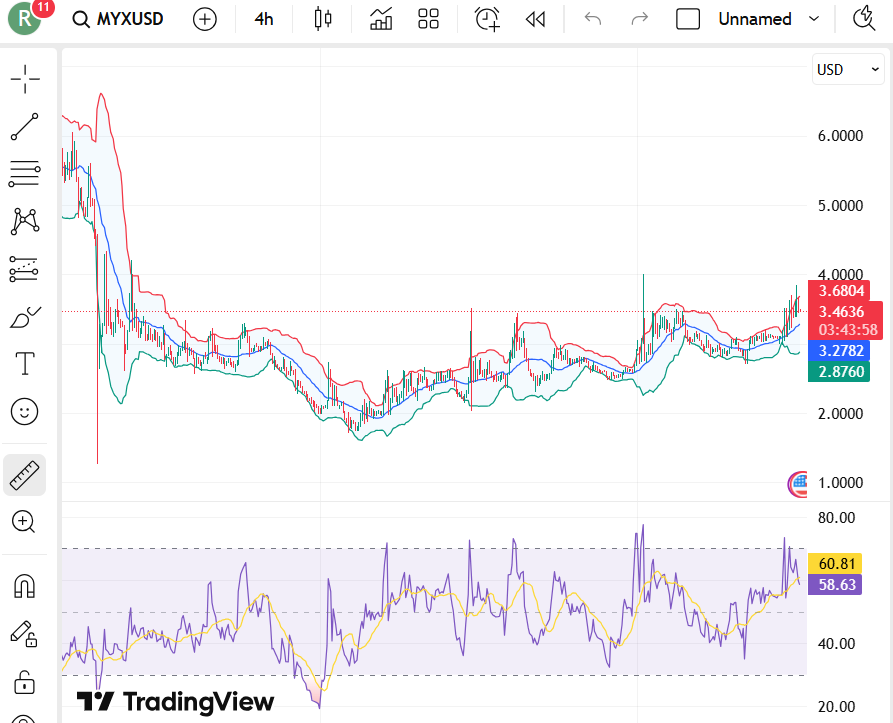
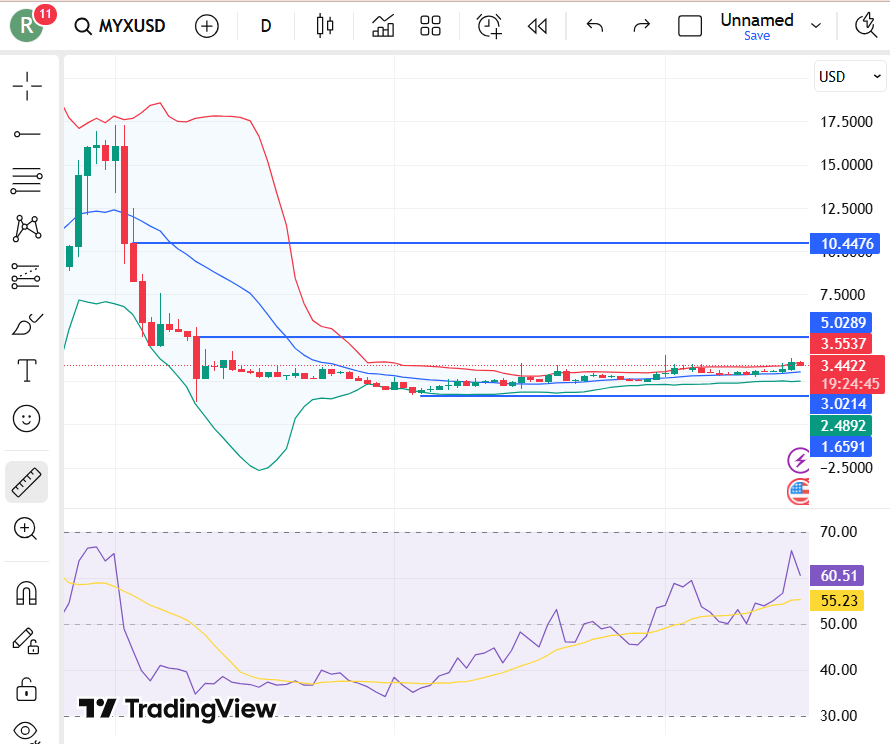
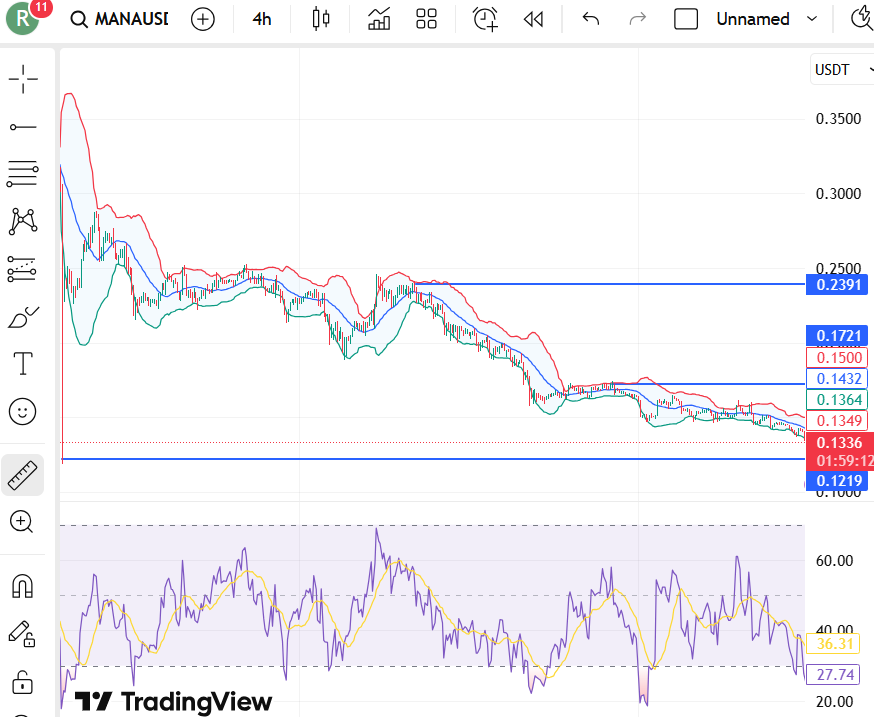
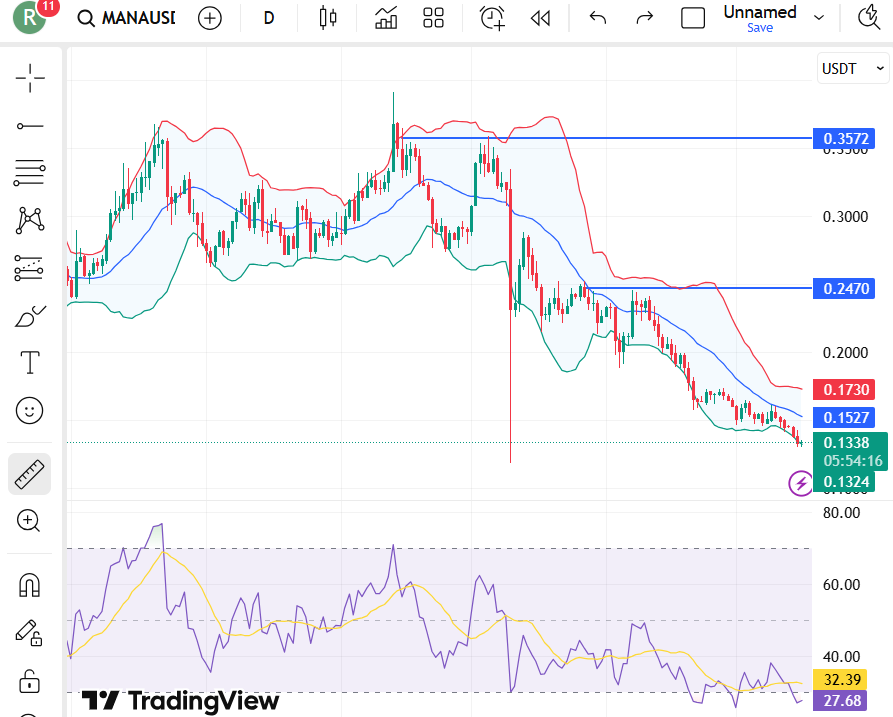
Maker (MKR) is currently trading under pressure after failing to hold above the $1,600 level. On the 4-hour chart, MKR had been moving in an upward channel, but recent candles show rejection near the upper band around $1,620–$1,630.
In the short term, MKR looks weak to neutral. Holding above $1,500 is crucial to avoid a deeper correction. A recovery above $1,580 would improve sentiment, while a breakout above $1,630 could restart an upward move.
The RSI is near 45, below the neutral 50 mark. This shows that momentum is currently tilted toward sellers.
Meanwhile, a breakout above the resistance level will open the door for an upwards rally towards $2470.
Month
Potential Low ($)
Potential Average ($)
Potential High ($)
Maker Crypto Price Prediction January 2026
$1216
$1835
$2470
MakerDAO (MKR) Price Prediction 2026
The year 2026 may mark a transition phase for MakerDAO. The protocol has been gradually shifting toward a more structured and revenue-focused model, emphasizing efficiency, resilience, and long-term sustainability.
Key factors that could influence MKR in 2026 include
Growth in DAI supply across DeFi and payments
Protocol-generated fees and surplus management
Governance participation and risk controls
If Maker continues strengthening its financial foundations, MKR could experience steady appreciation rather than sudden spikes.
Year
Potential Low ($)
Potential Average ($)
Potential High ($)
Maker Price Prediction 2026
$1197
$2050
$2804
Maker Price Prediction 2026 – 2030
Year
Potential Low ($)
Potential Average ($)
Potential High ($)
2026
$1197
$2050
$2803
2027
$1914
$2000
$4762
2028
$2800
$4891
$6700
2029
$3900
$6870
$9326
2030
$4817
$8500
$12000
MKR Price Prediction 2026
In 2026, MKR’s price is expected to reflect measured growth rather than speculation. If MakerDAO maintains strong risk controls while expanding DAI adoption, MKR could approach $2,803.
MKR Price Prediction 2027
By 2027, MakerDAO may benefit from greater institutional and DeFi integration of DAI. Under this scenario, MKR could trade between $1,900 and $4,762.
MKR Price Prediction 2028
As decentralized stablecoins gain wider acceptance, Maker’s role as a trusted issuer could strengthen. This may push MKR toward the $6,700 level.
MKR Price Prediction 2029
In 2029, investors may increasingly value protocols with consistent revenue. If MakerDAO continues generating surplus, MKR could be priced closer to $9,326.
MKR Price Prediction 2030
By 2030, MakerDAO’s success will depend on whether DAI remains competitive against centralized stablecoins. If so, MKR could potentially reach $12,000, reflecting its role as a core DeFi financial layer.
What Does The Market Say?
Year
2026
2027
2030
CoinCodex
$2473
$3805
$5451
CoinChepkup
$3516
$5736
$6715
Mudrex
$2800
$4000
$12000
CoinPedia’s MakerDAO (MKR) Price Prediction
According to CoinPedia analysts, MakerDAO stands apart from most DeFi projects due to its direct link to real on-chain revenue and risk management. While MKR may not deliver explosive short-term rallies, its long-term value proposition remains strong.
CoinPedia analyst suggests that MKR will trade with moderate upside in 2026, targeting a high near $2,800. But long-term projections remain constructive, as experts eye $12000 mark until 2030.
Year
Potential Low ($)
Potential Average ($)
Potential High ($)
2026
$1250
$2050
$2803
Never Miss a Beat in the Crypto World!
Stay ahead with breaking news, expert analysis, and real-time updates on the latest trends in Bitcoin, altcoins, DeFi, NFTs, and more.
FAQs
What is the Maker (MKR) price prediction for 2026?
MKR could trade between $1,200 and $2,800 in 2026, driven by DAI adoption, protocol revenue, and MakerDAO’s focus on long-term sustainability.
Can Maker (MKR) reach $10,000 by 2030?
Yes, MKR may approach or exceed $10,000 by 2030 if DAI remains competitive and MakerDAO continues generating consistent on-chain revenue.
Is Maker (MKR) a good long-term investment?
MKR is considered a long-term asset due to its role in governance, risk management, and value capture from MakerDAO’s real protocol revenues.
What factors influence MKR price the most?
Key drivers include DAI supply growth, protocol fees, governance decisions, risk controls, and overall DeFi and crypto market conditions.
How is MKR different from other DeFi tokens?
Unlike hype-driven tokens, MKR derives value from real responsibility—governing DAI, absorbing losses, and benefiting from MakerDAO’s surplus.
Ripple, the blockchain payments company behind XRP, is once again in the spotlight as reports suggest that it may be preparing for a possible initial public offering (IPO) in 2026.
Industry analysts now rank Ripple among the biggest potential public listings, with valuations estimated near $50 billion
Here’s what Ripple’s leadership is saying about these IPO talks.
Sign Shows Ripple Preparing for a 2026 IPO
According to multiple sources, Ripple is reportedly holding advanced internal discussions around a potential IPO in 2026. These are not rumors or casual considerations, but signs that the company may be actively preparing for a public listing.
The company has also strengthened its internal structure, with better reporting and governance, which are common steps before going public. At the same time, Ripple is expanding bank partnerships and payment services to build steady, real-world revenue.
Indeed, Ripple continues to position XRP as a liquidity tool within its payment system. IPO-ready companies usually highlight utility and long-term value rather than market hype.
Ripple Ranks Among Top IPO Candidates for 2026
Adding to the excitement, market data and industry visuals now place Ripple among the largest potential IPOs heading into 2026. According to recent comparisons, Ripple ranks ninth among top private companies expected to go public, with an estimated valuation of $50 billion.
The list includes major global names such as SpaceX, OpenAI, ByteDance, and Stripe, highlighting just how significant Ripple’s position has become.
Analysts point to strong momentum, improving regulation, and growing global adoption as key reasons Ripple continues to stand out.
Despite growing speculation, Ripple executives have consistently denied IPO rumors. Ripple President Monica Long has said the company has “no plan and no timeline” to go public, stressing that Ripple is well-funded and does not need public markets to raise capital.
Even Ripple CEO Brad Garlinghouse has echoed this view, noting that any IPO discussion would be a long-term consideration, not an immediate move.
Other Crypto Firms Move Closer to IPO
According to recent research reports, public markets are becoming the preferred next step for mature crypto firms. Circle has already gone public, and other major names such as Kraken, Grayscale, and BitGo have filed paperwork or entered advanced talks.
In Asia, Dunamu, the operator of Upbit, is also preparing a public debut through a merger. This broader trend has fueled speculation that Ripple could follow a similar path.
Never Miss a Beat in the Crypto World!
Stay ahead with breaking news, expert analysis, and real-time updates on the latest trends in Bitcoin, altcoins, DeFi, NFTs, and more.
FAQs
Would a Ripple IPO affect how XRP is governed or used?
A Ripple IPO would not change how XRP Ledger operates, since the network is open-source and not owned by Ripple. However, Ripple’s business decisions after an IPO could influence how aggressively it promotes XRP-based payment products.
What regulatory hurdles could still delay or prevent a Ripple IPO?
Ripple would need sustained regulatory clarity in major markets, especially the U.S., where crypto-related disclosures face close scrutiny. Any unresolved legal or compliance issues could slow the timing of a public listing.
Who stands to benefit most if Ripple eventually goes public?
Early private investors and long-term employees with equity would likely see the most direct financial impact. Banks and payment partners could also benefit indirectly from greater transparency and public-market credibility.
What signals should investors watch next regarding Ripple’s IPO plans?
Key indicators include hiring for finance or compliance leadership, audited financial disclosures, or public comments shifting from denial to conditional openness. These steps often precede formal IPO filings.
Ethereum rebounds above $2,700 as liquidation-driven sell-off eases
ETH recovery remains cautious amid ETF outflows and weak market sentiment
The price of Ethereum could reach a high of $15,575 by 2030.
Ethereum is trying to stabilise its price after the market slump, climbing back above the $2,700 mark and showing a bit more confidence than it had last week. The bounce comes after a wave of long liquidations that forced heavy selling and shook traders out of their positions.
Talking about the present scenario, the outflows from ETH-focused ETFs and weak chart signals pressure. This is even as news around a new staking product from a major asset manager tried to uplift the sentiment. With fear still dominating the market, Ethereum’s recovery feels cautious, but it sets the stage for today’s price outlook.
What will be the ETH Price tomorrow?
Based on the current price trend, the ETH price tomorrow could range between $2,894.95 and $2,989.26.
Indicators: RSI at 27.33 signals bearish momentum and oversold market conditions.
Ethereum Price Prediction 2025
A spot-ETH ETF could be the next major milestone. If approved, it may attract billions in capital. On top of that, institutional activity is growing. Layer-2 growth and big firms like State Street and PayPal are also building on Ethereum. The next big step is the Fusaka upgrade, coming in November 2025. Before that, Pectra will roll out in Q4, with long-term changes like Verkle Trees and danksharding ahead. These will make Ethereum faster and cheaper.
Ethereum price has been trading in a symmetric triangle pattern since early 2021, a breakout could lead to the ETH coin price hitting a new all-time high of $9,428.11. Conversely, rising uncertainty or any unfavorable global economic events could pull the ETH price toward its annual low of $3,142.70. That being said, it could average out at around $6,285.41.
Year
Potential Low
Potential Average
Potential High
2025
$3,142.70
$6,285.41
$9,428.11
Ethereum Medium-Term Price Prediction
Year
Potential Low ($)
Potential Average ($)
Potential High ($)
2026
4,714.05
9,428.11
14,142.16
2027
7,071.08
14,142.16
21,213.24
ETH Price Prediction 2026
By 2026, the value of Ethereum is expected to reach a high of $14,142.16. On the other hand, the Ethereum price might drop to $3,142.70, with an average of $6,285.41.
Ethereum Price Forecast 2027
The Ethereum 2027 forecast expects the ETH coin price to make a new all-time high at $21,213.24. However, a correction based on market shortcomings may drive the ETH crypto to $7,071.08, with an average of $14,142.16.
Ethereum Long-Term Price Prediction
Year
Potential Low ($)
Potential Average ($)
Potential High ($)
2028
10,606.62
21,213.24
31,819.86
2029
15,909.93
31,819.86
47,729.79
2030
23,864.90
47,729.79
71,594.69
ETH Price Prediction 2028
In 2028, the chances of Ethereum dominating the crypto market rise as the ETH price potentially makes a new high at $31,819.86. On the other hand, the altcoin might fall to $10,606.62, making an average of $21,213.24.
Ethereum Price Forecast 2029
Approaching its all-time high of $47,729.79 in 2029, the Ethereum price is expected to surpass the psychological barrier of $40,000. In case of a correction, $ETH may reach a low of $15,909.93, with an average price of $31,819.86.
Ethereum Price Prediction 2030
As per our Ethereum Price Prediction 2030, the ETH crypto price is projected to reach a new all-time high of $71,594.69 in 2030, with a potential low of $23,864.90 and an average price of $47,729.79.
Based on the historic market sentiments and trend analysis of the largest altcoin by market capitalization, here are the possible Ethereum price targets for the longer time frames.
Year
Potential Low
Average Price
Potential High
2031
35,797.35
71,594.69
107,392.04
2032
53,696.02
107,392.04
161,088.06
2033
80,544.03
161,088.06
241,632.09
2040
~1,376,550
~2,753,110
~4,128,680
2050
~79,396,500
~158,793,000
~238,189,500
Market Analysis
Firm Name
2025
2026
2030
Changelly
$4,012.41
$5,375
$24,196
Coincodex
$6,540.51
$3,816.62
$6,660.08
Binance
$3,499.54
$3,674.52
$4,466.40
VanEck
$6,000
–
–
*The Ethereum forecast mentioned above is the average targets set by the respective firms.
Never Miss a Beat in the Crypto World!
Stay ahead with breaking news, expert analysis, and real-time updates on the latest trends in Bitcoin, altcoins, DeFi, NFTs, and more.
Key Factors & Risks
Regulatory uncertainty from SEC delays and new global frameworks.
Centralization risk driven by institutional validators and staking growth.
Rapid ecosystem expansion with security token adoption and active staking.
Vulnerability to macroeconomic shifts like Fed policy changes and market sentiment.
Ongoing privacy and censorship risks from stricter compliance protocols.
FAQs
What is Ethereum (ETH) and why is it important?
Ethereum is a blockchain that powers smart contracts, DeFi, NFTs, and dApps, making it a core infrastructure for the broader crypto ecosystem.
What is the Ethereum price prediction for 2026?
Ethereum could trade between $4,700 and $14,100 in 2026, depending on market cycles, network upgrades, and institutional demand.
Can Ethereum really reach over $15,000 by 2030?
Long-term models suggest ETH could exceed $15,000 by 2030 if network upgrades, institutional use, and market growth continue steadily.
Is Ethereum a good long-term investment?
Ethereum’s long-term outlook is supported by network upgrades, institutional adoption, and Layer-2 growth, but it still carries market and regulatory risks.
What are the main risks affecting Ethereum’s price?
Key risks include regulatory uncertainty, macroeconomic changes, centralization concerns in staking, and shifts in overall crypto market sentiment.
Bitcoin is currently trading at: $ 87,603.48024536
Predictions suggest BTC to hit $150K to $250K before 2026 ends.
Long-term forecasts estimate BTC prices could hit $900K by 2030.
The Bitcoin price prediction 2026 is becoming increasingly bullish as the 2025’s second half comes to a close soon, with all-time highs of $125K reached this year as the highest point.
As a wave of bullish momentum sweeps into the market, investors and traders are intrigued by its next stop.
The year was marked by optimism, driven by massive inflows into spot Bitcoin ETFs, skyrocketing institutional adoption, clearer regulations, and unwavering political support. There were several macro downturns, too, that capped BTC’s uptrend, like trade tariffs and wars.
Despite that, BTC holds its level, making it now seen as “a hedge against inflation” more than ever. Major players, including MicroStrategy, Metaplanet, and several other entities, are boldly adding BTC to their balance sheets, signaling unshakable adoption and confidence in its future.
The market enthusiasm is at a fever pitch, investors are buzzing with questions: “Can Bitcoin sustain its meteoric rise?” and “Will it redefine the financial landscape in the next five years?” This Bitcoin price prediction 2026 – 2030 dives deep into the trends driving this historic rally. Read on for the full scoop.
What is the Bitcoin price prediction for today?
The BTC price may range between $86,628.14 and $89,459.43 today.
Firstly, at CoinPedia, we feel optimistic about Bitcoin’s price increase. Hence, we expect the BTC price to create a 2025 high of ~$168,000.
Year
Potential Low
Potential Average
Potential High
2025
$71,827.81
$119,713.02
$167,598.22
Bitcoin Price Analysis 2025
The Bitcoin price performance observed since 2024 has demonstrated an upward trend within a defined upward channel. However, the initial swing low was reached in 2023 at around the $16,000 area.
Since then, a bull market began that reached 2021’s high around $70,000 by early 2024, with a decent pullback rally that continued flipping this high and reached $108,000 in early 2025, and Q3 of 2025 marked an ATH of $126,296.
This advancement marked a huge 675% surge in 1008 days when it reached ATH, but this price action of multi-year was happening inside a broadening ascending wedge. And Q4 2025 is seeing a decline from the upper border of this reliable old pattern.
Even the two-year parallel ascending channel has also confirmed a breakdown from the lower border, suggesting a significant decline is forthcoming.
Since the price action doesn’t fall straight, the year is also about to conclude next month. So, bulls are trying to show a little fight, even FOMC news didn’t generate any momentum. It appears that bears are still influencing BTC’s price action. The current zone of $90K is key; losing it here will let BTC slide back to $80K, and if this fails too. Then the $70K to $75K range would be retested next, where a demand could arise that might trigger a rebound, and the rally could extend to new highs as well.
However, if bulls fail to present a proper fight around the $70,000 to $75,000 support area, then the BTC will become frail and fall further, as it could trigger a price action that traps long buyers, potentially leading to a decline towards $53,489 in the first half of next year, 2026.
Bitcoin Price Prediction December 2025
The Bitcoin price forecast for December 2025 indicated potential for bullish movements that did not materialize. Even the FOMC meeting on the 10th failed to generate any substantial volatility. A noteworthy observation is that the BOJ’s rate hike did not negatively impact Bitcoin’s price, which continues to hold above the $85K mark. Currently, Bitcoin is trading near the upper boundary of a steeply declining channel, yet it remains constrained below the critical $85K horizontal resistance level.
The ongoing lack of new demand is evident in the subdued price action, suggesting that investor sentiment remains cautious, possibly in anticipation of further corrections. There is a distinct possibility that prices could dip lower, creating opportunities for strategic accumulation at more attractive entry points.
Month
Potential Low
Potential Average
Potential High
December 2025
$80,000-$95,000
$100,000 – $108,000
$115,000 – $118,000
Bitcoin AI Price Prediction For December 2025
Source / Platform
Low Price (USD)
Average Price (USD)
High Price (USD)
Gemini (AI-assisted)
$110,000 – $125,000
$130,000 – $150,000
$160,000 – $180,000+
ChatGPT (OpenAI)
$92,000
$117,000
$138,000
BlackBox AI
$100,000
$125,000
$150,000
Bitcoin Price Onchain Outlook
The on-chain data has showed strong accumulation in 2025 and sustained declines in exchange reserves. Crucially, this confirms the elevated institutional commitment, which is evident even in the US Spot ETFs data figures and the corporate adoption also reinforces this trend, with public company holdings nearly doubling since the start of the year.
Ultimately, a Bitcoin price prediction 2025 suggests that the future potential depends strictly on how sustained buying demand remains, as well as geopolitical stability and regulatory clarity.
If the current bullish sentiment persists, the BTC price is expected to reach a cycle high target of $150,000. Conversely, should global uncertainty intensify and sentiment turn negative, the downside risk is projected to find strong support around the $70,000 mark.
The BTC price range in 2026 is expected to be between $150K and $230K.
BTC Price Prediction 2027
Subsequently, the Bitcoin price range can be between $170K to $330K during the year 2027.
Bitcoin Predictions 2028
With the next Bitcoin halving, the price will see another bullish spark in 2028. Specifically, as per our Bitcoin Price Prediction, the potential BTC price range in 2028 is $200K to $450K.
BTC Price 2029
Thereafter, the BTC price for the year 2029 could range between $275K and $640K.
Bitcoin Price Prediction 2030
Finally, in 2030, the price of Bitcoin is predicted to maintain a positive trend. Indeed, the BTC price is expected to reach a new all-time high, ranging between $380K and $900K.
Based on the historic market sentiments and trend analysis of the largest cryptocurrency by market capitalization, here are the possible Bitcoin price targets for the longer time frames.
Year
Potential Low ($)
Potential Average ($)
Potential High ($)
2031
$540,830.43
$901,383.47
$1,261,936.86
2032
$757,162.60
$1,261,936.86
$1,766,711.60
2033
$1,059,945.80
$1,766,711.60
$2,473,477.75
2040
$5,799,454.28
$9,665,757.13
$13,532,059.98
2050
$161,978,188.65
$269,963,647.74
$377,949,106.84
Bitcoin Prediction: Analysts and Influencers’ BTC Price Target
Firm Name
2025
Standard Chartered
$200K
VanECk
$180K
10x Reserach
$122K
Fundstrat
$250K
Blackrock
$700K
As per the Bitcoin price forecast by Blockware Solutions, the price of 1 BTC could hit $400,000
Cathie Wood predicts the price of BTC to achieve the $3.8 million mark by 2030.
Michael Saylor-led MicroStrategy expects Bitcoin to soar beyond $13 million by 2045.
ARK Invest has increased its bullish BTC price target to $2.4 million by 2030.
Never Miss a Beat in the Crypto World!
Stay ahead with breaking news, expert analysis, and real-time updates on the latest trends in Bitcoin, altcoins, DeFi, NFTs, and more.
FAQs
What are the biggest risks to Bitcoin’s price in 2026?
Major risks include global recessions, tighter crypto regulations, declining liquidity, or a sustained breakdown below key support levels.
How much will BTC be worth in 2030?
Bitcoin price forecasts for 2030 range from $380K to $900K, driven by scarcity, long-term adoption, and expanding institutional participation.
What will be the price of Bitcoin in 2050?
While uncertain, many long-term projections suggest Bitcoin could exceed $1 million by 2050 if it becomes a global store of value.
Is Bitcoin still a good hedge against inflation in the long term?
Bitcoin’s fixed supply makes it attractive as an inflation hedge, especially during currency debasement and long-term economic uncertainty.
Bitcoin reached new all-time highs in October, yet Jan3 founder Samson Mow has described the year as a “bear market” and anticipates a major bull run ahead.
Predictions suggest XRP could reach $5.05 by the end of 2025.
Long-term projections show XRP could hit $26.50 by 2030 and $526 by 2050.
XRP price currently stands at $2.99, with a market capitalization of $179.79 billion. Analysts and AI forecasts alike suggest that XRP could reach $5.05 by the end of 2025. Long-term XRP price predictions also place it as high as $26.50 by 2030, with an ultra-bullish target of $526 by 2050.
Ripple (XRP) remains one of the top five crypto assets in the world, gaining traction as institutional adoption ramps up and its prolonged legal battle approaches resolution. Since President Trump’s return to office, XRP has seen a resurgence in on-chain activity, investor sentiment, and even XRP ETF approved turned it into a bluechip asset.
In Q3 2025, XRP marked a new all-time high of $3.66,but in Q4 it fell extensively. Now soon Q4 will conclude and 2026 would begin. Now, making this as most idle time for XRP price prediction 2026-2030 to be in more focus. Read this to know in depth to what’s coming next in XRP.
The recent performance of XRP price USD has reflected a cautious optimism since the FOMC decsiion on 10th, while simultaneously absorbing some of the downward pressure from the Bank of Japan’s recent decisions too, currently settling around $1.80 support area.
The recent actions from the BOJ have brought XRP down to the lower boundary of a falling wedge pattern, with $2.00 emerging as a significant resistance level to watch for in December.
Should the price dip below the support level of $1.80, we may see a potential decline towards $1.63, followed by $1.41. Conversely, a rise beyond the $2.62 mark could open the door to more substantial gains.
Month
Potential Low
Potential Average
Potential High
December 2025
$1.50
$3.00
$4.00
XRP Price Predictions for December 2025 by AI Platforms
Platform
Low Price
Average Price
High Price
Claude
$3.00 – $3.15
$3.50 – $4.00
$7.50 – $8.20
Blackbox
$2.50
$3.50
$5.00
Gemini
$3.00 – $4.00
$4.50 – $6.00
$6.50 – $8.00+
XRP Price Analysis 2025
In the first half of 2025, the XRP price movement transitioned from a period of decline into a phase of consolidation. In Q2, XRP tested the upper boundary of a multi-month descending wedge at $2.65 around mid-May.
However, it failed to hold above a crucial swing low support near $2.10, showing signs of limited upside momentum due to ongoing global tensions at that time.
Investors were optimistic in Q2 about a positive legal catalyst around June 16, expecting a favorable update in the SEC lawsuit. Instead, the court issued a 60-day pause in appeals, leaving market sentiment hanging, which has proven less momentum in price action.
Even matters worsened when, in the first half’s last month, precisely on June 17, the SEC postponed the approval of Franklin Templeton’s XRP spot ETF, due to market instability amid geopolitical concerns.
During the third weekend of June, the U.S. even fired airstrikes on Iranian nuclear facilities, shaking the global markets. Even top assets like BTC, ETH, dropped, and XRP was no exception either, as it also dipped sharply to $1.94, as sentiment deteriorated.
However, positive developments followed: a ceasefire agreement helped markets rebound, and moving to July, the XRP price forecast turned bullish once again.
In July when it surged to an impressive peak of $3.66. However, following this excitement, the price gradually retreated to around $1.80 by November.
As of late November, XRP/USD tested the vital $1.80 support level, showcasing encouraging signs of recovery with a notable 20% increase back above the $2 threshold. But this rise and fall is consistently happening inside a defined channel, which reflects a broader downtrend going on since the July ATH.
December started on a bearish note, retreating from the 20-day EMA band, and it appears to be consolidating at $2.0 support level again. The price action for now may be weak, but the fundamentals are strongly aligned, and it’s a matter of time and a catalyst that will provide new price action for XRP/USD. For December to conclude on the bearish side has more odds at this time, even it missed out santa rally, too.
XRP Price Prediction 2026
To avoid a prolonged decline, XRP price prediction 2026 suggests that it must find stability and must bounce above $2.35 to break the upper border of the channel.
Conversely, if XRP price continues to follow the prevailing downtrend, there is a significant risk that it could experience another substantial decline in the final month of the year, potentially testing lower support levels and impacting overall market sentiment. The upcoming weeks will be crucial for investors and analysts alike to monitor the market dynamics surrounding XRP’s performance.
Year
Potential Low
Potential Average
Potential High
2026
$1.75
$3.45
$5.05
XRP Onchain Outlook
The XRP Ledger: DEX Transaction Count chart indicates a significant bullish divergence starting from May 2025. While the price is consolidating, the activity in decentralised exchanges (DEX) is increasing sharply.
The high transaction volume, which includes both orders placed and cancelled, shows that experienced traders are actively positioning themselves and adding liquidity in anticipation of a future price movement.
As a result, this on-chain metric suggests that the market is preparing for a powerful and sustainable rally in the XRP price ahead.
Also, the biggest fact right now in December is that altcoin liquidity is drying up. Projects securing new liquidity channels like ETFs have a better chance of long-term survival, and since November 14th, the XRP ETF has been seeing positive inflows consistently, despite what price action is, and so far, Cumulative Total Net Inflow has crossed $756 million, while total net assets are worth $723.05 million, by December 1st.
Ripple XRP Price Prediction 2026 – 2030
Year
Potential Low ($)
Potential Average ($)
Potential High ($)
XRP Price Prediction 2026
5.50
6.25
8.50
Ripple Price Prediction 2027
7.00
9.0
13.25
XRP Price Prediction 2028
11.25
13.75
16.00
XRP Price Prediction 2029
14.25
16.50
21.50
XRP Price Prediction 2030
17.00
19.75
26.50
This table, based on historical movements, shows XRP price prediction 2030 to reach $26.50 based on compounding market cap each year. This table provides a framework for understanding the potential XRP price movements. Yet, the actual price will depend on a combination of market dynamics, investor behavior, and external factors influencing the cryptocurrency landscape.
Based on historic price sentiments and XRP’s rising popularity, here are the XRP future price projections beyond 2030, where Ripple price forecasts suggest that it has become more speculative. Therefore, assuming continued adoption and dominance, XRP may see aggressive valuations in the decades ahead.
Year
Potential Low ($)
Potential Average ($)
Potential High ($)
2031
25.00
29.50
35.25
2032
31.50
36.75
41.25
2033
35.75
42.25
47.75
2040
97.50
135.50
179.00
2050
219.25
331.50
526.00
A look at this table, highlights the XRP price prediction 2040 and XRP price prediction 2050 potential high ambitious targets but this reflect a transformative vision for XRP as a dominant global payment player.
Market Analysis
Firm Name
2025
2026
2030
Changelly
$2.05
$3.49
$17.76
Coincodex
$2.38
$1.83
$1.66
Binance
$2.16
$2.27
$2.76
Never Miss a Beat in the Crypto World!
Stay ahead with breaking news, expert analysis, and real-time updates on the latest trends in Bitcoin, altcoins, DeFi, NFTs, and more.
FAQs
Is XRP a good investment for 2025 and beyond?
XRP is seen as a long-term bet on payments and institutional adoption, but its price will depend on market trends, regulation, and real-world usage.
What will XRP be in 2026 price prediction?
XRP price prediction for 2026 ranges between $1.75 and $5.05, depending on market recovery, adoption growth, and overall crypto sentiment.
What are the main risks to XRP’s price outlook?
Major risks include regulatory setbacks, weak market liquidity, competition from other payment-focused blockchains, and prolonged bearish market cycles.
Could XRP really reach triple-digit prices by 2050?
Triple-digit targets assume massive global adoption and long-term dominance in payments, making them highly speculative rather than guaranteed outcomes.
The live price of the Cardano token is $ 0.35353143.
Price prediction suggests potential to reach $2.75 to $3.25 by year-end 2026.
Long-term forecasts indicate ADA could hit $10.25 by 2030.
The Cardano price prediction 2026 is generating significant buzz in the crypto market, as the last quarter is soon to close in few days, boosting interest for the next altcoin. The 2025 for ADA/USD began with numerous fundamental updates strengthening its future, including the transformative Plomin Hard Fork, but 2026 seems even more constructive.
From January to December 2025, the price of Cardano (ADA) has undergone a significant decline, particularly notable after reaching an impressive peak of $1.32 in December 2024.
Upon examining the Cardano price chart, a falling wedge formation has emerged during this downward trend. This pattern often indicates a potential reversal, which could be the next possible move for ADA/USD price action.
However, the macro conditions and cautious interest are the major barriers that prevent ADA from meeting all necessary conditions to shift the trend with a strong catalyst involved. The pattern itself suggests that a bullish trend could follow the current bear market, but 2025 does not appear to be the chosen year for it.
The recent decline followed a short-lived effort to establish a presence above the crucial $1 mark in August 2025. This suggests that the prevailing trend remains in place, and it indicates that demand is not yet solid enough to shift the pattern, raising the possibility that December might close below $0.40.
Cardano AI Price Prediction For December 2025
Source
Low Price
Average Price
High Price
Gemini
$0.85 – $0.95
$1.00 – $1.20
$1.30 – $1.50+
BlackBox
$0.65
$1.00
$1.50
ChatGPT
$0.75
$0.95
$1.25
ADA Price Prediction 2026
The Cardano price prediction 2026 highlights a crucial support level on its weekly chart, a zone that has historically functioned as a solid pivot point for price trends, and gives another rally vibes now.
This support level is known for displaying remarkable resilience over time, suggesting that if Cardano price USD can maintain its position above this threshold once again, it could pave the way for significant price movements in 2026.
Looking back at Cardano’s historical performance on the weekly chart, it reveals an extraordinary rally that occurred in 2020, when the asset experienced staggering gains of nearly 4000%.
During that bullish phase, the Cardano price USD spent an extended period consolidating around the dynamic support trendline, which appears to be a strategic accumulation at discounts from smart money, contributing significantly to its eventual surge.
If the current market sentiment shifts positively, a resurgence in investor confidence could lead to a recovery. Not ambitiously, even modestly, past performance could give a tremendous surge. Last year’s performance was 4000%. If we assume 1/4 of that momentum, it will result in an increase of approximately 1000%, which could potentially elevate Cardano’s price to an estimated $4.50 by 2026.
On the other hand, a more cautious approach yields a realistic price target of around $1.40, reflecting a gain of approximately 300%. This projection remains possible, particularly as it is grounded in fundamental analyses and market trends that are independent of speculative catalysts, such as the potential approval of exchange-traded funds (ETFs).
Furthermore, many analysts suggest that these ETFs could serve as game-changers by increasing institutional investment and enhancing market stability.
In a scenario where ETF approvals are realized and retail investor enthusiasm surges, Cardano’s price could realistically fall within the range of $2.05 to $2.80.
Scenario
Potential Low
Average Price
Potential High
Without ETF Approval
$0.85
$1.10
$1.25
With ETF Approval + Retail Surge
$1.20
$1.65
$2.05
Bullish Breakout (with ETF & macro support)
$1.50
$2.05
$2.80
Cardano (ADA) Price Prediction 2026 – 2030
Price Prediction
Potential Low ($)
Average Price ($)
Potential High ($)
2026
2.75
3.00
3.25
2027
4.50
4.75
5.00
2028
5.25
5.50
5.75
2029
6.75
7.25
7.75
2030
9.00
9.75
10.25
This table, based on historical movements, shows ADA prices to reach $10.25 by 2030 based on compounding market cap each year. This table provides a framework for understanding the potential Cardano price movements. Yet, the actual price will depend on a combination of market dynamics, investor behavior, and external factors influencing the cryptocurrency landscape.
Based on the historic market sentiments and trend analysis of the altcoin, here are the possible Cardano price targets for the longer time frames.
Market Analysis
Firm Name
2025
2026
2030
Changelly
$0.752
$1.18
$6.05
Coincodex
$0.79
$0.53
$0.89
Binance
$0.79
$0.83
$1.01
*The aforementioned targets are the average targets set by the respective firms.
Coinpedia’s Price Analysis provides you with the latest content on the recent market trend that enables you to get closer to the price movements & actions of the various cryptocurrencies.
Never Miss a Beat in the Crypto World!
Stay ahead with breaking news, expert analysis, and real-time updates on the latest trends in Bitcoin, altcoins, DeFi, NFTs, and more.
FAQs
What is Cardano’s (ADA) price prediction for 2026?
Cardano could trade between $2.75 and $3.25 in 2026 if market sentiment improves, adoption grows, and key support levels hold.
Is Cardano a good long-term investment?
Cardano is considered a long-term project due to its research-driven development, scalability upgrades, and focus on decentralization.
What factors could drive ADA’s price higher in the future?
ETF approval, institutional adoption, network upgrades, and improved macro conditions could all positively impact ADA’s price.
Where will ADA be in 5 years?
In five years, ADA could trade between $7 and $10 if Cardano adoption grows, scalability improves, and the crypto market enters a strong cycle.
What will Cardano be worth in 2030?
By 2030, Cardano could be valued around $9 to $10 based on long-term growth, network usage, and sustained investor confidence.
A surge in stablecoins, tokenized RWAs and growing sovereign wealth fund interest could drive a major increase in Ethereum’s TVL in 2026, Sharplink’s co-CEO said.
Coinbase CEO Brian Armstrong said a former customer service agent was arrested in India, months after hackers bribed support staff to gain access to sensitive customer information at the largest U.S.-based crypto exchange.
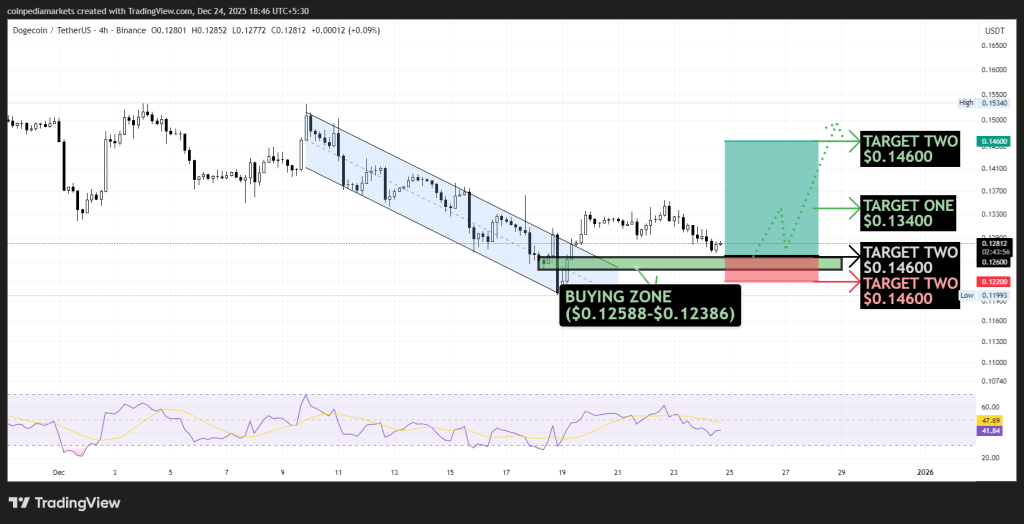
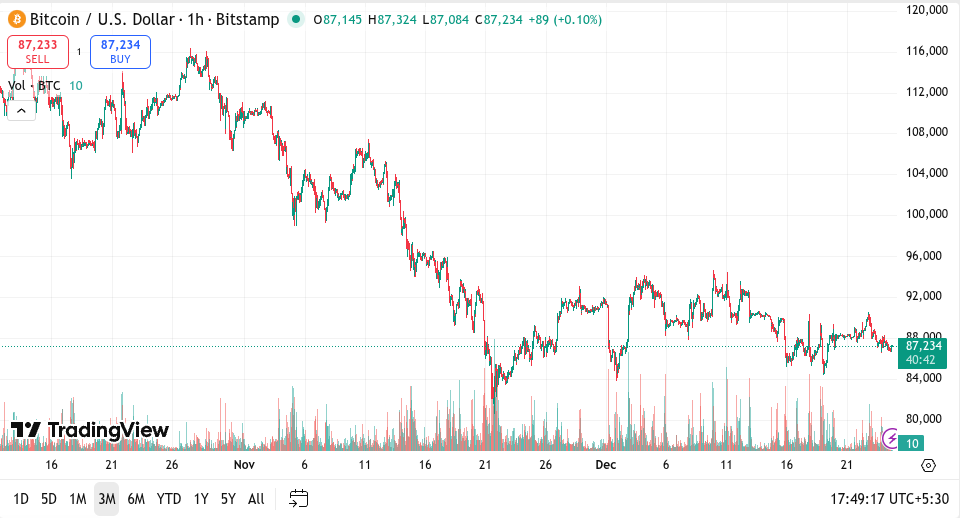
Bitcoin (BTC) price dropped below $87,000, down from the intraday high of $89,000. Similarly, Binance Coin (BNB), Dogecoin (DOGE), and Canton dropped by over 3% in the last 24 hours.
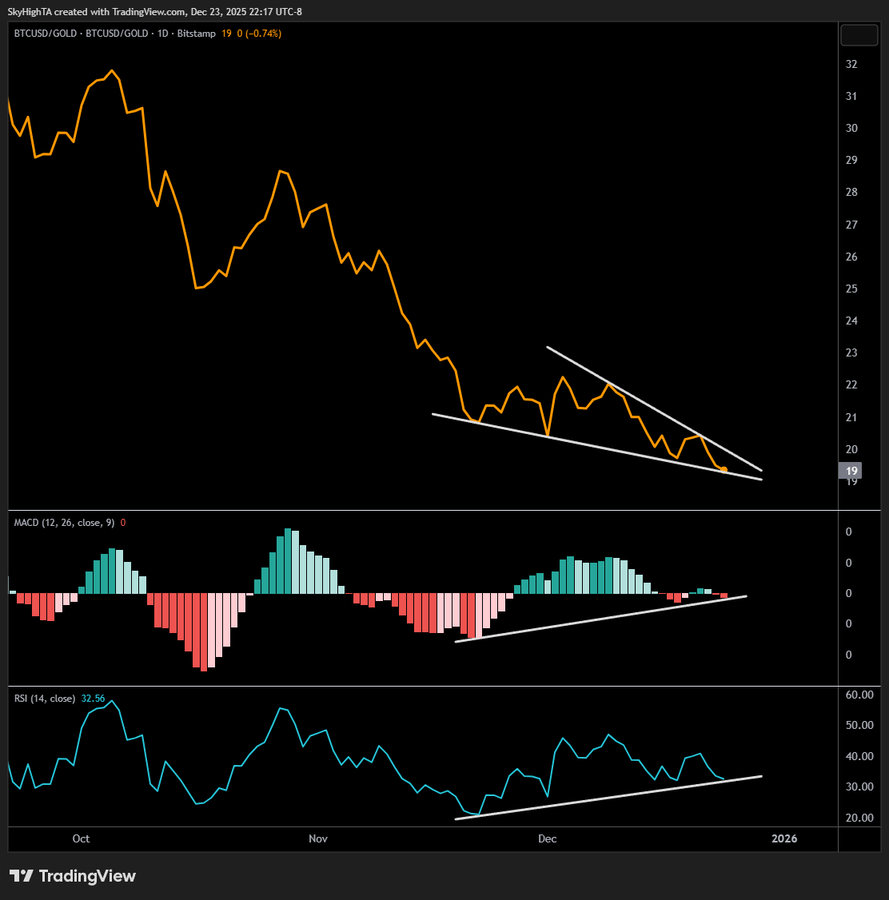
The Bitcoin-silver price ratio highlights the ongoing tug-of-war between digital scarcity and traditional hard assets. While it should not be used in isolation, it provides critical insight into how capital is rotating beneath the surface.
Stani Kulechov's comments followed an uproar in the Aave community about the relationship between the Aave decentralized autonomous organization and Aave Labs.
Bitcoin’s technical and onchain market structure was robust throughout 2025, but ever-shifting macroeconomic conditions eventually put a cap on BTC price. Will the trend shift in 2026?
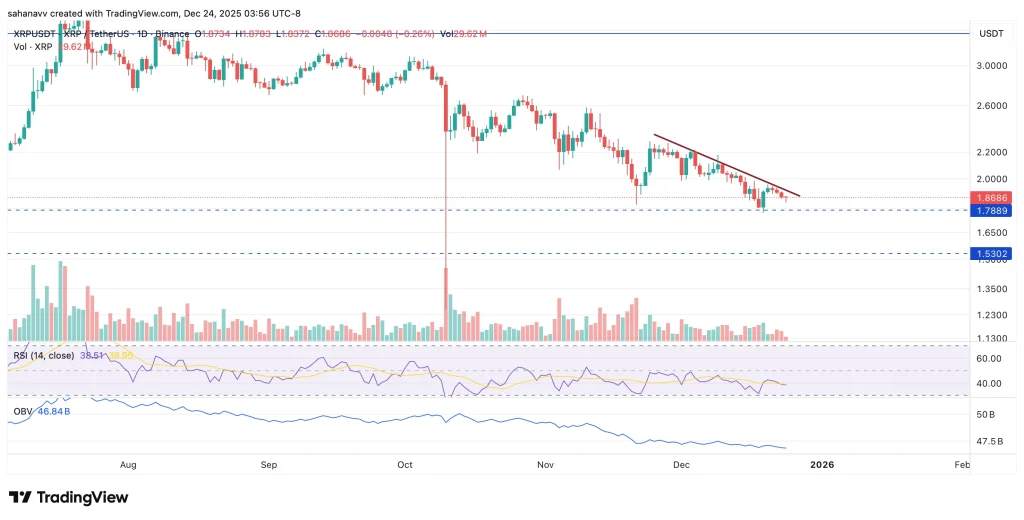
The XRP price dipped into the $1.83 area on December 26, then staged a mild rebound. Although the bounce was a positive sign, it hasn’t completely settled investor nerves. There’s still uncertainty over whether this recovery can last or if…
Bitcoin price remains locked in a tight range between $80,000 and $90,000 as liquidity builds on both sides, increasing the likelihood of a sharp breakout once the balance breaks.
In an exclusive Cointelegraph interview, the crypto analyst pointed to macro headwinds, muted sentiment and cycle dynamics shaping Bitcoin’s path into 2026.
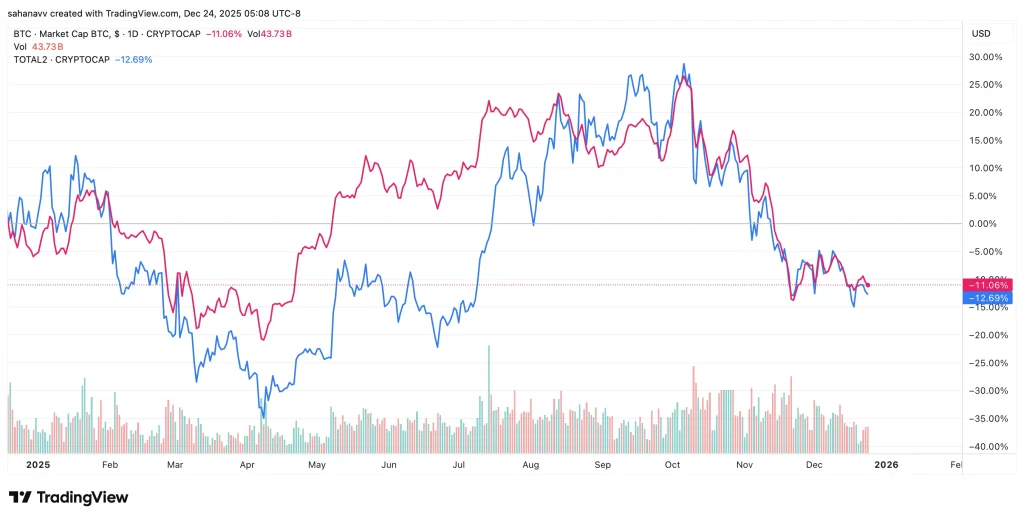
Cryptocurrency prices moved lower as the broader market cooled, even though no major negative news triggered the drop. The total crypto market value slipped to about $2.94 trillion, down roughly 1.5% over the past day.
Bitcoin Pulls Back After Recent Strength
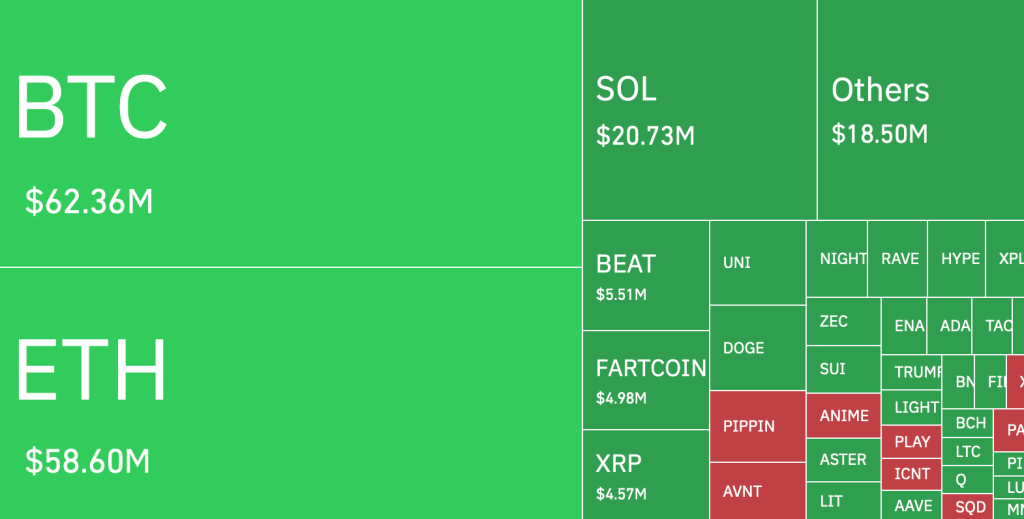
Bitcoin fell to around $87,100, giving up earlier gains. Trading data shows that Bitcoin dropped sharply within a short period, triggering the liquidation of about $66 million in long positions. These forced liquidations can accelerate price declines even without fresh headlines.
Bitcoin has just dropped $2,300 and liquidated $66 million worth of longs in the last 45 minutes.
$60 billion wiped out from the crypto market with no negative news.
Despite the pullback, Bitcoin held up better than many altcoins. According to analysts, large sell-offs often come from leveraged trades being unwound rather than long-term investors exiting.
Ethereum and XRP See Deeper Selling
Ethereum slipped to about $2,925, while XRP fell near $1.83. Both assets had risen quickly in recent weeks, and traders appear to be locking in profits.
When prices rise too fast, corrections tend to follow. As Ethereum and XRP cooled, Bitcoin also dipped, though by a smaller margin.
What Happens Next?
Historically, Bitcoin often stabilizes first after sharp pullbacks, while weaker altcoins struggle to recover. Rather than a fast move back toward record highs, price action so far suggests limited upside or sideways consolidation over the coming days or weeks. This type of pause often follows periods of heavy liquidation and leverage unwinding.
Levels to Watch
On the daily chart, Bitcoin remains stuck in a clear trading range.
Support: $85,000–$86,000
Resistance: $92,000–$94,000
Why $90,000 Matters
Market data shows a buildup of liquidity just below $91,000. Historically, price often moves toward areas with concentrated liquidity, increasing the chances of short-term volatility near that zone.
If Bitcoin fails to clear $90,000, the market may continue to drift sideways. A rejection could reinforce the broader consolidation phase rather than signal a deeper breakdown.
Cardano delivered a less-than-festive gift to investors this Christmas, with price action painting a grim picture as the token remains deep in the red.
Even though the $20,000 ETH call on X turned out to be fake, Tom Lee reacted with just two words, a reminder that his Ethereum treasury holds 4,066,062 ETH and moves by about $4 billion for every $1,000 change in price.
Bitcoin bulls need a strong weekly close this week, back above the $101,000 band, or the death cross setup stays in play and a 25% slide to the meme level of $67,000 keeps getting priced in.
Cardano founder Charles Hoskinson has reignited debate around blockchain infrastructure after commenting on recent moves by traditional finance firms into tokenization. Responding to news around the Canton Network, Hoskinson said legacy finance is trying to recreate systems that XRP and Cardano-linked projects are already building, but at a much smaller scale.
Hoskinson argued that platforms like XRP and Midnight are designed from the ground up for Web3, while traditional institutions are only beginning to experiment. When asked what scale he was referring to, he pointed directly to the real-world asset market, saying the goal is a $10 trillion opportunity.
I love it when I see legacy finance come together with Canton and try to build what XRP and Midnight are already doing at a scale 100x beyond their ambitions.
These guys never learn and don't understand what makes Web3 unique and meaningful.
According to Hoskinson, success in this space requires full end-to-end systems, strong partnerships, and active communities. “You can’t fake Cardano or the XRP community,” he added.
Why the timing matters
Hoskinson’s comments came just as Canton Coin jumped roughly 20% over the past week, clearly outperforming a mostly flat or weaker crypto market. Canton Coin’s rally stood out because it was driven by institutional infrastructure news rather than broad market momentum.
The move followed a December 17 announcement from the Depository Trust & Clearing Corporation, or DTCC, which revealed plans to explore tokenizing a portion of U.S. Treasury securities on the Canton Network. DTCC plays a central role in global finance, processing trillions of dollars in securities transactions every year.
Why DTCC’s move is important
DTCC said the initial focus would be U.S. Treasury securities held through its Depository Trust Company unit. Rather than replacing existing systems, the goal is to see how tokenization can work within current market structures. DTCC’s leadership described the effort as a long-term roadmap that could eventually expand to many other regulated assets.
The total value of tokenized RWAs has grown sharply over the past 12 months, with U.S. Treasurys account for a large share of that expansion.
On one side are legacy financial players adapting blockchain to existing systems. On the other are networks like XRP and Cardano, which he argues were built from the start to handle global-scale tokenization. As institutions push deeper into real-world assets, the race may come down not just to products, but to who controls the infrastructure behind them.
XRP is approaching a moment that could define its next market phase. The token is trading near a long-standing resistance level that, if cleared, would mean a renewed advance in the broader bull cycle.
Chart experts say a sustained move above this zone could open the door to prices in the $7 to $10 range, levels that once seemed unrealistic but are now back in serious discussion.
Some price projections extend well beyond those initial targets. Using long-term wave-based market structure, XRP’s price action continues to point higher before any meaningful correction. On this view, XRP could climb into the $20 to $40 range during the current cycle, followed by a prolonged cooling-off period. The emphasis here is not on short-term catalysts, but on how price has behaved across multiple cycles.
A long history, a changing pattern
XRP’s trading history stretches back more than a decade, giving it one of the longest price records in crypto. That longevity has resulted in extended periods of sideways movement, often mistaken for stagnation. In market terms, however, such behavior can mean deep accumulation, where ownership gradually consolidates ahead of a larger move.
Recent price behavior supports that interpretation. After a sharp rally last year, XRP did not return to its historical median range, as it did in prior cycles. Instead, it established a higher trading floor and has held it for an extended period. This marks a notable shift from earlier bull markets, where gains were quickly erased once momentum faded.
Near-term uncertainty, broader upside
In the short run, XRP remains locked in a wide range as buyers and sellers test each other’s resolve. A temporary retreat toward lower levels cannot be ruled out. Even so, the broader structure remains constructive as long as the price holds above the $1 area. The market appears to be consolidating rather than distributing.
Two broad paths now stand out. One envisions a strong but conventional bull run, with XRP topping out in the $30 to $40 zone. The other, more aggressive scenario hints that if the current cycle extends longer than expected, prices well above $100 become mathematically possible, though far from certain.
For now, XRP’s direction hinges on a single question: whether it can decisively clear resistance. Until that level gives way, the market remains in a holding pattern. If it does, the next phase of XRP’s price history may already be waiting.
Bitcoin could reach $250,000 by 2026, according to Cardano founder Charles Hoskinson, and his reasoning is based more on economics than excitement. The main idea is simple: Bitcoin’s supply is limited, while demand from large investors keeps growing. When demand rises and supply stays tight, prices usually move higher.
Big institutions, corporations, and even some governments are slowly adding Bitcoin to their portfolios. At the same time, traditional finance is making it easier for everyday investors to gain exposure. Morgan Stanley, for example, now allows its private wealth advisers to recommend Bitcoin to clients. Even small allocations from retirement funds and wealth managers can have a large impact on price because Bitcoin’s supply does not change.
Institutional demand is the driver
Hoskinson says the same forces that pushed Bitcoin to six-figure prices are still in place. Institutional buyers tend to invest steadily and for the long term. This creates consistent buying pressure rather than short-term speculation. As more financial products are built around Bitcoin, access improves and demand widens.
Another important development is Bitcoin’s entry into decentralized finance. New systems are being developed that allow Bitcoin holders to earn yield without giving up control of their assets. If these tools succeed, large amounts of Bitcoin value could move into the broader crypto market over time.
What about altcoins and risks?
Hoskinson expects some money to flow from Bitcoin into altcoins, but he warns it may not look like the strong altcoin rally seen in 2021. The global economic picture is less clear today. Regulatory rules in the U.S. are still uncertain, and there are concerns that parts of the technology sector, especially artificial intelligence stocks, may be overvalued.
“I also believe there’s going to be some value leakage from Bitcoin into the altcoin space. Whether it will be proportionate like in 2021, when a $68,000 Bitcoin translated into $3 ADA and an all-time high for Ethereum, is hard to say,” he said.
He points out that companies like Nvidia have reached extremely high market values. If a tech bubble were to burst, crypto markets could also fall, since digital assets often move in the same direction as tech stocks.
XRP price trades near critical $1.80 support as bullish momentum fades, increasing downside risk and raising the possibility of a capitulation move toward lower liquidity zones.
XRP ETF optimism grows as investors turn to BI DeFi for stable returns beyond short-term price rallies today globally up. Recently, some cryptocurrency analysts have made optimistic assessments: with the official launch of the XRP ETF, the price of XRP…
Shiba Inu coin posted a 5,000% liquidation imbalance, an ugly leverage flush that usually drags price lower, yet SHIB price flipped green on Binance and held the margin call heat.
Tokenized commodities are increasing amid growing investor demand for more accessible onchain financial products, following new all-time highs for gold and silver.
From hacks and macro shocks to stablecoin regulation and market-structure upgrades, 2025 reshaped how crypto operates and what mainstream adoption really means.
Japan’s FY2026 tax reform outline proposes reclassifying crypto assets as financial products under the Financial Instruments and Exchange Act, cutting the tax rate on gains from up to 55% to a flat 20.315%. Spot, derivatives, and ETF profits would face separate taxation with up to a three-year loss carryforward, aligning with stocks. Staking, lending, and NFTs likely stay under miscellaneous income at progressive rates, pending 2026 legislation.
Bitcoin is currently going through a calm but tense phase as it faces $23.6 billion in option expiry today. After weeks of heavy selling in October and November, the market is trying to find stability.
According to recent analysis from 10x Research, Bitcoin has triggered a bullish breakout that may signal the start of a multi-week recovery, with upside potential toward $110K if momentum holds.
October Crash and ETF Outflows Weighed Heavily on Bitcoin
According to 10x Research, Bitcoin’s current price structure began with the sharp October 10 crash, when BTC fell from its peak near $98,000, and the broader crypto market saw about $19 billion in liquidations.
Pressure increased after the October 29 Federal Reserve meeting, which delivered a hawkish message. Soon after, spot Bitcoin ETFs recorded heavy selling, with nearly $903 million in net outflows. This drained liquidity and kept Bitcoin stuck under selling pressure.
Even when prices looked attractive, buyers remained cautious. As a result, the downtrend lasted longer than many traders expected.
By late November, selling began to fade as most short-term sellers had exited. However, instead of rebounding, capital shifted to assets like gold and silver, leaving Bitcoin stuck in a slow recovery.
$85,000 Becomes a Strong Support Level
From a chart perspective, Bitcoin recently moved above its descending trendline, signaling potential trend exhaustion. Key support near the $85,000 zone held firm, strengthening buyer confidence. As long as Bitcoin stays above this zone, the market avoids deeper losses.
Even though Bitcoin has tried to move above $92K but failed several times, one major reason is low trading volume, which is common near year-end.
With fewer traders active, price moves lack strength. As a result, recent rises look like short pauses, not a true trend shift.
Resistance Levels Hold the $110000 Level Back
On the upside, Bitcoin faces heavy resistance. The first level to watch is $91,000, which could signal the end of consolidation if broken. The bigger hurdle lies near $94,700, a key level that could shift market sentiment.
If Bitcoin clears these zones, upside targets sit near $100,600, $105,400, and $110,000.
As of now, BTC is trading $88,656, reflecting a jump of 1.5% seen in the last $1.77 trillion.
When Solana traded near $10 in mid-2023, almost nobody believed it could recover, let alone rally toward $294 in early 2025. That move delivered close to a 30x return during a bull run that many traders still describe as chaotic and difficult to time. Looking back, the opportunity was obvious only in hindsight, while confidence was at its lowest.
Missing SOL at $10 does not mean missing the next asymmetric setup. Bear markets are where early positioning happens, not during euphoria. That is exactly where Digitap ($TAP) enters the picture.
With a live banking product, a fast-moving crypto presale, and a full 12 Days of Christmas campaign running, Digitap now stands out as the best crypto to buynow for traders looking for a ground-floor entry into real financial infrastructure rather than hype.
Unlike speculative launches, Digitap combines payments, banking, staking, and deflationary token mechanics into one system. That structure matters more than narratives when liquidity tightens, and risk appetite fades.
What Digitap ($TAP) Actually Is—Banking First, Token Second
Digitap operates as a fully functional financial platform, not a future promise. The app allows users to hold crypto and cash balances in one dashboard, convert assets instantly, and move funds across borders using traditional rails like SEPA and SWIFT.
This matters in a bear market, where users prioritize capital protection and flexibility instead of short-term price spikes.
Privacy sits at the center of the platform. Digitap offers no-KYC wallet access for users who want basic functionality without identity checks, while higher tiers unlock cards and offshore banking services through regulated partners. This tiered structure lets users choose how much information they share, rather than forcing a single model.
The $TAP token ties directly into platform activity. A fixed supply of 2 billion tokens removes inflation risk, while a buyback-and-burn system redirects 50% of Digitap’s profits into purchasing $TAP from the market.
Half of those tokens are burned permanently, reducing supply, while the remaining half funds staking rewards. This creates a loop that many altcoins to buy simply do not have.
Staking adds another layer of stability. Rewards come from a pre-allocated pool, not new minting. Early exit penalties burn unclaimed rewards, reinforcing long-term holding behaviour rather than short-term flipping. In an uncertain market, that structure positions Digitap as one of the best cryptos to buy now rather than a gamble.
Crypto Presale Momentum and the 12 Days of Christmas Campaign
More than 155 million $TAP tokens have already been sold during Digitap’s crypto presale, with total funds raised nearing $3 million. The current presale price sits at $0.0383, the next increase is locked at $0.0399, and the planned listing price remains $0.14. That gap creates a clear pricing framework instead of guesswork.
What sets this phase apart is the holiday campaign that’s now ongoing. The 12 Days of Christmas event turns the presale into a daily experience. Every 12 hours, a new offer unlocks inside the Digitap dashboard, ranging from large $TAP bonuses to free Premium and PRO account upgrades. Some rewards come with limited slots, others expire on a timer, and many will never return.
The structure keeps users engaged twice per day, morning and evening, with each drop lasting only 12 hours. Instead of waiting passively for a listing, participants actively interact with the platform, claim rewards, and lock in benefits as the presale progresses.
This level of engagement is super rare among crypto presale projects and helps explain why demand continues to build during a risk-off environment.
Why Digitap ($TAP) Could Be the Next SOL-Style Opportunity and the Best Altcoin to Buy Now
Solana’s rise from $10 to nearly $300 did not happen because of memes or short-term speculation. It happened because real usage returned, infrastructure matured, and liquidity followed utility. Digitap shows a similar early-stage pattern, but in a different sector: global payments and digital banking.
Even though many altcoins to buy rely on future promises, Digitap already processes real activity through its app. Combined with the rising presale price structure, the setup mirrors what early infrastructure plays looked like before going mainstream.
For traders searching for the best crypto to buy now ahead of 2026, Digitap offers something rare: clarity. The next price increase is scheduled, the listing price is known, and the product already works. With the Christmas campaign in full swing and presale milestones approaching fast, the window for ground-floor positioning continues to narrow.
Missing SOL at $10 was expensive. Missing Digitap at presale prices, with $0.14 set as the launch level, could prove just as costly for those waiting on the sidelines.
Digitap is Live NOW. Learn more about their project here:
BNT could attempt a recovery toward $0.96 by 2026 if protocol upgrades and liquidity participation improve.
By 2030, BNT may revisit the $8, if long-term DeFi adoption grows.
Bancor Network is one of the earliest decentralized finance (DeFi) projects, known for introducing automated market making (AMM) long before it became an industry standard.
Bancor’s core idea was simple but powerful, to allow users to trade tokens directly through smart contracts without relying on traditional order books.
However, as DeFi rapidly evolved, Bancor faced strong competition from newer AMMs and shifting market preferences. Today, with DeFi entering a more mature phase, investors are once again asking whether Bancor’s experience and protocol upgrades could help it regain relevance.
With that in mind, let’s take a closer look at Bancor Network’s native token, BNT, and explore its price outlook for 2026, 2027, and 2030.
As we move closer to 2026, BNT could become more competitive among other altcoins and exchange tokens, supported by its relatively advanced features. The project may focus on new developments and partnerships to further strengthen and expand the platform.
As of now, BNT is trading around $0.4006 with a market cap of $46.1 million. Daily trading volume has slipped about 3% to $3.03 million, indicating a cautious approach from traders in the short term.
Technical Analysis
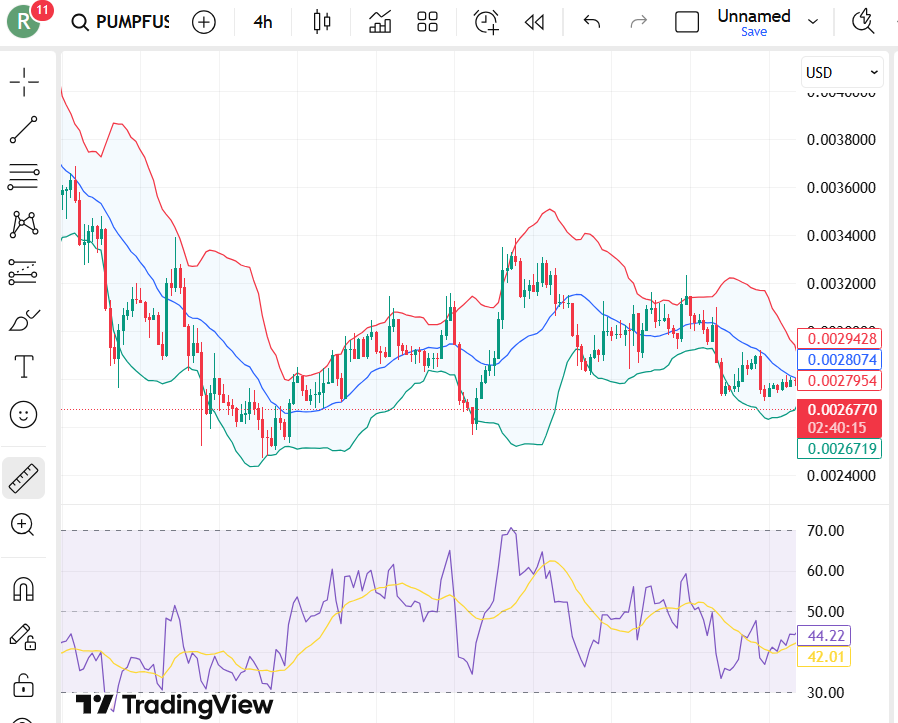
On the 4-hour chart, BNT is clearly in a downtrend, with price moving inside a descending channel. After a sharp drop, the price found support near $0.40, since then, it has been moving sideways.
However, the Bollinger Bands have started to narrow, which usually signals low volatility and a possible big move ahead towards $0.68
Additionally, the RSI is around 46, which is below neutral but not oversold.
Month
Potential Low ($)
Potential Average ($)
Potential High ($)
BNT Crypto Price Prediction January 2026
$0.31
$0.42
$0.68
Bancor Network (BNT) Price Prediction 2026
The year 2026 could be a reset year for Bancor. Rather than chasing aggressive expansion, the protocol appears focused on refining capital efficiency, improving liquidity incentives, and maintaining protocol sustainability.
If Bancor succeeds in positioning itself as a reliable liquidity layer for long-tail assets, BNT demand could slowly improve. Also, if DeFi liquidity improves and Bancor’s protocol upgrades continue to stabilize the ecosystem, BNT could attempt a gradual recovery
However, competition from dominant AMMs may limit rapid upside.
Year
Potential Low ($)
Potential Average ($)
Potential High ($)
EOS Price Prediction 2026
$0.31
$0.55
$0.96
BNT Price Prediction 2026 – 2030
Year
Potential Low ($)
Potential Average ($)
Potential High ($)
2026
$0.31
$0.55
$0.96
2027
$0.48
$1.10
$2.23
2028
$0.85
$1.89
$3.40
2029
$1.17
$2.93
$5.10
2030
$1.90
$4.89
$8.01
BNT Price Prediction 2026
In 2026, Bancor’s performance will depend on whether DeFi users prioritize capital protection and stability over high-risk yield farming. Under steady conditions, BNT could trade between $0.28 and $0.95.
BNT Price Prediction 2027
By 2027, renewed interest in decentralized liquidity infrastructure could benefit early pioneers like Bancor. If protocol usage increases, BNT may approach $2.20.
BNT Price Prediction 2028
In 2028, DeFi platforms with proven longevity may gain investor preference. Bancor’s long operational history could support a move toward $3.40.
BNT Price Prediction 2029
As DeFi matures, revenue-generating protocols may be valued more like businesses. If Bancor sustains fee generation, BNT could climb near $5.10.
BNT Price Prediction 2030
By 2030, Bancor’s long-term value will hinge on whether it remains a trusted liquidity solution. Under favorable conditions, BNT could test levels around $8.01.
What Does The Market Say?
Year
2026
2027
2030
CoinCodex
$0.66
$0.83
$2.07
CoinChepkup
$0.70
$0.82
$4.35
Digitalcoinprice
$0.85
$2.92
$7.2
CoinPedia’s Bancor (BNT) Price Prediction
According to CoinPedia analysts, Bancor remains a high-risk but historically significant DeFi protocol. While short-term growth may remain limited, the project’s focus on sustainable liquidity could support gradual recovery.
CoinPedia expects BNT to trade cautiously in 2026, with a potential high near $0.95, provided DeFi participation improves
Year
Potential Low ($)
Potential Average ($)
Potential High ($)
2026
$0.31
$0.55
$0.96
Never Miss a Beat in the Crypto World!
Stay ahead with breaking news, expert analysis, and real-time updates on the latest trends in Bitcoin, altcoins, DeFi, NFTs, and more.
FAQs
What is Bancor’s price prediction for 2026?
Bancor could trade between $0.31 and $0.96 in 2026, depending on DeFi adoption, liquidity growth, and protocol stability.
What is BNT price forecast for 2028?
BNT could reach around $3.40 in 2028 if Bancor maintains strong DeFi liquidity and adoption grows steadily.
How high can Bancor go by 2030?
With sustained adoption and trust as a liquidity solution, BNT could test $8.01 by 2030.
Is Bancor a good long-term investment?
Bancor may appeal to long-term investors seeking reliable DeFi liquidity solutions, but competition and market risks remain.
What factors affect BNT price long-term?
BNT’s price depends on DeFi adoption, competition from other AMMs, protocol upgrades, and overall market sentiment.
The crypto market is again drawing attention from large Bitcoin holders who closely read crypto charts to spot early-stage opportunities before wider adoption begins. As capital slowly rotates from established assets into high-utility platforms, one presale project is starting to stand out for its structure, timing, and real product roadmap. Mutuum Finance (MUTM) is increasingly being discussed as the best crypto to consider right now among investors who prefer fundamentals over hype and early positioning over late entries.
Presale Momentum That Is Hard to Ignore
Mutuum Finance (MUTM) is currently in presale phase 6, and the numbers already show strong conviction from early participants. The total supply of the token is fixed at 4 billion, and across all presale phases combined, around $19.45 million has already been generated. The current price stands at $0.035, a level that many investors are closely watching while comparing upside scenarios on crypto charts.
This phase alone has seen 98% of its allocated 170 million tokens already sold, leaving only a small portion available before the next phase begins. The growing holder base, now exceeding 18,600 participants across all presale phases, reflects broad interest rather than concentration in a few wallets. Adding to accessibility, besides crypto, Mutuum Finance (MUTM) has introduced card purchases with no limits, removing one of the biggest barriers for new entrants who want quick exposure without complex swaps.
How Mutuum Finance (MUTM) Will Redefine On-Chain Lending
Mutuum Finance (MUTM) is being developed as a decentralized lending and borrowing protocol built around two complementary models designed to balance safety, flexibility, and returns. The first is the Peer-to-Contract model. In this system, lenders will pool assets such as stablecoins including USDT and USDD, alongside major cryptocurrencies like ETH and BTC into audited smart contracts. Borrowers will access this liquidity by providing overcollateralized collateral, ensuring that the system remains solvent.
Interest rates in the Peer-to-Contract pools will dynamically adjust based on utilization. As demand for borrowing rises, rates will increase, encouraging more deposits and discouraging excessive leverage. This feedback loop will help maintain stability while improving capital efficiency. Depositors in this model will receive mtTokens, which will represent their share of the pool and accumulated interest. These mtTokens will also be usable as collateral, creating layered utility from a single deposit. Borrowers will be able to choose between variable rates that respond to market movement or stable rates designed for predictability, depending on eligibility.
For assets that carry higher volatility or lower liquidity, Mutuum Finance (MUTM) will introduce a separate Peer-to-Peer lending model. Tokens such as PEPE, and DOGE will be isolated from the core liquidity pools. In this environment, lenders and borrowers will directly negotiate terms including interest rates and loan durations, with the option for partial fills. This approach will protect the main protocol from undue risk while opening doors to higher-yield opportunities for users willing to take on additional exposure.
Halborn Audit, Protocol Progress and Platform Launch
Security and protocol integrity are central to the project’s roadmap. An independent audit by Halborn Security is underway to thoroughly test the lending and borrowing contracts for vulnerabilities and logic errors. This review will strengthen trust and confirm that the smart contracts meet professional security standards before full deployment.
The first version of the protocol is scheduled to launch on the Sepolia testnet in Q4 2025. This release will include core components such as liquidity pools, mtTokens, debt tokens, and an automated liquidator bot, with ETH and USDT as the initial supported assets for lending, borrowing, and collateral. All loans will require overcollateralization, monitored through a Stability Factor. When collateral values fall below safe thresholds, liquidation mechanisms will activate to protect the system and its users.
Mutuum Finance (MUTM) is also expecting a simultaneous platform launch and token listing. This synchronized debut will ensure that the token enters the market with real functionality from day one. Users will be able to engage with live lending and borrowing modules immediately, giving the token a clear use case rather than speculative waiting. This structure often attracts exchange interest faster, as working products tend to meet listing criteria more efficiently. Increased visibility and trading activity typically follow, reinforcing demand.
As presale supply continues to shrink and development milestones align, attention from serious investors is expected to intensify. For those tracking crypto charts and evaluating the best crypto opportunities before broader exposure, Mutuum Finance (MUTM) is positioning itself as a project where early action matters. With just 1% tokens remaining at the current price of $0.035 and a product-focused launch ahead, the window for early entry is closing faster than many expect.
For more information about Mutuum Finance (MUTM) visit the links below:
Investors in 2025 are moving beyond price speculation and looking for structured, predictable ways to earn long-term returns from major crypto assets. #partnercontent
Investors are shifting away from short-term speculation and toward yield models backed by real assets and transparent mechanisms as the digital asset market matures. #partnercontent
Russia’s largest bank, Sberbank, may soon start offering crypto-backed loans as it plans to collaborate with regulators to build the necessary infrastructure. Anatoly Popov, Sberbank’s Deputy Chairman of the Management Board, has confirmed in a recent interview that the bank…
EOS could attempt a recovery toward $0.89 by 2026 if ecosystem traction improves.
By 2030, EOS may revisit $6.1 levels if long-term network reforms succeed.
EOS is one of the oldest smart contract platforms in crypto. Built as a third-generation blockchain, it focuses on speed, scalability, and near fee-less transactions using its own EOS Virtual Machine and WebAssembly engine. While newer blockchains grabbed headlines in recent years, EOS has continued evolving quietly in the background.
With EOS currently trading near $0.16, down from its 64% from its May high, investors are questioning whether the network can transition from a long consolidation phase into a meaningful recovery.
So, let’s further dive into exploring this EOS price prediction for 2026, 2027, and 2030.
During earlier market cycles, EOS attracted massive attention, but over time, competition from newer networks and governance challenges pushed it out of the spotlight. Now, as the crypto market gradually matures and infrastructure-focused projects regain attention, EOS is once again being closely watched.
EOS is trading around $0.16, while its 24-hour trading volume has surged by nearly 70%, reaching approximately $175.8K. This sudden spike in volume suggests renewed interest, even as price remains range-bound.
Technical Analysis
The price is currently moving sideways, showing no strong trend in either direction. On the 4-hour chart, the asset is trading around $0.164, staying inside a tight range.
Meanwhile, the Bollinger Bands are narrow, which usually means the market is calm and volatility is low. Key support is around $0.160, showing buyers step in here.
The RSI is near 55, which is slightly bullish but not strong. This means buyers have a small advantage, but there is no overbought or oversold condition right now.
If EOS manages a clean breakout above the $0.21 resistance, a short-term move toward $0.38 becomes likely.
Month
Potential Low ($)
Potential Average ($)
Potential High ($)
EOS Crypto Price Prediction January 2026
$0.12
$0.21
$0.38
EOS Price Prediction 2026
Throughout 2024 and 2025, EOS remained under pressure as investors favored faster-growing ecosystems. However, EOS has continued refining its infrastructure, focusing on stability, governance improvements, and developer-friendly tools.
In 2026, EOS’s price movement is likely to depend on whether developers and enterprises begin building meaningful applications on the network.
A sustained recovery above $0.56 could improve sentiment, while rejection at lower levels may keep EOS range-bound.
Year
Potential Low ($)
Potential Average ($)
Potential High ($)
EOS Price Prediction 2026
$0.12
$0.56
$0.92
EOS Price Prediction 2026 – 2030
Year
Potential Low ($)
Potential Average ($)
Potential High ($)
2026
$0.12
$0.56
$0.92
2027
$0.30
$0.77
$2.5
2028
$0.54
$1.40
$3.18
2029
$0.85
$2.10
$3.90
2030
$1.30
$3.25
$6.1
EOS Price Prediction 2026
In 2026, EOS’s focus will be on proving stability. If developers continue shipping updates and users see smoother performance, the price could approach $0.92 by the end of the year.
EOS Price Prediction 2027
By 2027, EOS may benefit from renewed interest in high-throughput chains for gaming, social apps, and enterprise use cases. Under this scenario, EOS could test $2.5.
EOS Price Prediction 2028
As blockchain adoption grows, EOS could benefit from its near-feeless transactions and high throughput. This may push EOS toward $3.18 if adoption continues to strengthen.
EOS Price Prediction 2029
By 2029, investors may prioritize networks with long operational histories. EOS’s survival through multiple market cycles could support prices up to $3.90.
EOS Price Prediction 2030
By 2030, EOS’s fate depends on whether it successfully reinvents itself as a reliable infrastructure chain. If adoption continues to grow steadily, the EOS price would jump to $6.10 by the end of the year.
What Does The Market Say?
Year
2026
2027
2030
CoinCodex
$0.48
$0.82
$1.83
Preicepredictions
$0.037
$1.05
$3.64
Digitalcoinprice
$0.85
$2.92
$7.2
CoinPedia’s EOS Price Prediction
CoinPedia analysts believe EOS is no longer a hype-driven asset, and that may be its biggest strength. The network has already endured its speculative boom and collapse. What remains is infrastructure, experience, and a community focused on long-term rebuilding.
CoinPedia expects EOS to trade cautiously in 2026, with upside toward $0.92, while long-term outcomes remain tied to execution rather than promises.
Year
Potential Low ($)
Potential Average ($)
Potential High ($)
2026
$0.12
$0.56
$0.92
Never Miss a Beat in the Crypto World!
Stay ahead with breaking news, expert analysis, and real-time updates on the latest trends in Bitcoin, altcoins, DeFi, NFTs, and more.
FAQs
What is EOS price prediction for 2026?
EOS may trade between $0.12 and $0.92 in 2026, depending on adoption, developer updates, and market sentiment.
How high can EOS go by 2028?
With increased blockchain adoption and high throughput use, EOS could approach $3.18 by 2028.
Could EOS reach $1 or higher by 2030?
If EOS adoption grows steadily and infrastructure improves, the price could rise toward $6 by 2030.
Is EOS a good long-term investment?
EOS may appeal to long-term investors focused on infrastructure stability, adoption, and resilience through market cycles.
How does EOS compare to other smart contract platforms?
EOS offers fast, near-feeless transactions and high scalability, making it a strong contender for enterprise and app development.
Ethereum co-founder Vitalik Buterin is weighing in on a growing debate surrounding prediction markets, drawing a clear line between what he views as useful and what he considers dangerous.
The discussion unfolded after Buterin defended prediction markets as a better way to measure uncertainty than social media or even traditional financial markets. His core argument: prediction markets reward accuracy, not loud opinions.
“On social media, lots of people talk about ‘THIS WAR WILL DEFINITELY HAPPEN’ and scare people,” Buterin wrote. “With prediction markets, if you make a dumb bet, you lose.”
Why Vitalik Says Prediction Markets Get a Bad Rap
Critics often argue that prediction markets could incentivize harmful behavior by allowing people to profit from disasters. Buterin pushed back, saying those risks already exist, and at much larger scale, in traditional markets.
“Many of the downsides of PMs are replicated by regular stock markets,” he said, noting that equities and other financial instruments offer far more liquidity for anyone trying to profit from chaos.
In contrast, prediction markets force people to back their beliefs with money. Over time, wrong views get filtered out. Prices reflect probabilities, not certainty – something Buterin says helps him personally stay calm when headlines turn sensational.
The debate intensified after a user suggested that highly liquid prediction markets could eventually stop predicting outcomes and start shaping them. With enough capital, they argued, markets could “program reality to follow the market.”
Buterin didn’t agree and said that future worries him.
“I actually consider that one of the danger cases,”he responded.
Where Vitalik Draws the Line
According to Buterin, markets that shape reality tend to benefit large players over small ones. Governments, corporations, and whales can move outcomes, but regular users can’t. That imbalance already exists in traditional finance, and it’s often harmful.
Prediction markets, he argued, are safer precisely because they’re smaller.
Their size limits their influence. Prices stay bounded between 0 and 1, reducing bubbles, manipulation, and “greater fool” dynamics.
“They are much less dominated by reflexivity effects,” he said, calling them “healthier” than regular markets.
Never Miss a Beat in the Crypto World!
Stay ahead with breaking news, expert analysis, and real-time updates on the latest trends in Bitcoin, altcoins, DeFi, NFTs, and more.
FAQs
Could prediction markets still encourage unethical behavior?
While any market can create incentives to profit from negative events, the limited scale of prediction markets means they are less likely to reward widespread harmful actions. Large players like corporations or governments have far more power in traditional markets to exploit such opportunities.
Who benefits most from prediction markets?
Individual users and small-scale traders benefit by accessing a platform where accurate information and careful analysis are rewarded. Unlike in conventional finance, outcomes are less dominated by whales or institutional investors, giving ordinary participants a more level playing field.
What are the potential risks if prediction markets grow significantly?
If a prediction market becomes extremely liquid or large, it could gain the capacity to influence the real world, rather than just forecast it. This scenario could favor those with substantial capital, creating the same power imbalances seen in traditional financial systems.
Solana is trading at a critical turning point after an extended downtrend. Following a sharp sell-off from the November highs, SOL has spent the last several weeks consolidating above the $118–$120 zone. This area has now been defended multiple times, shifting focus to whether the current structure can support a bullish correction or if the SOL price is merely pausing before a continuation lower.
SOL Price Structure: Compression Below Key Resistance
On the 4-hour chart, Solana continues to trade below a descending trendline, keeping the broader structure bearish. However, price action has compressed into a tightening range, forming a reversal wedge pattern. This signals a reduction in downside momentum, even though sellers still control the trend.
Importantly, each dip toward the $118–$120 region has been met with responsive buying. While this does not confirm a reversal, it shows that downside follow-through is weakening—a necessary condition for any corrective bounce to develop.
Momentum Signals Are Improving, but the Trend Is Not Reversed
Momentum indicators are starting to diverge from price. On the 4-hour timeframe, RSI is printing a bullish divergence, suggesting selling pressure is fading despite price remaining capped. On the daily chart, a double-bottom-like structure is forming, adding to the base-building narrative.
That said, these are early signals, not confirmation. Until Solana reclaims key resistance zones, the move should be treated as a counter-trend correction, not the start of a new uptrend.
Key Levels That Will Decide the Next Move
Traders should stay focused on clean, well-defined levels:
Major support: $118–$120
Near-term resistance: $132–$136
Heavy supply zone: $145–$158 → $160
Invalidation: Sustained break below $118
Bearish continuation target: $105 → $100
As long as SOL trades below $145–$160, sellers retain higher-timeframe control. Any rally into this zone should be evaluated carefully for acceptance or rejection.
For a meaningful corrective rally to play out, Solana needs:
A break and acceptance above the descending trendline
Sustained trading above $132 with volume expansion
Momentum is holding firm above the RSI midline
Without these confirmations, upside moves risk becoming lower-high setups rather than structural reversals.
What the Solana Chart Is Signaling Right Now
Solana (SOL) price is showing conditions for a bounce, but not confirmation of a trend shift. The $118–$120 support remains the key line in the sand. Holding it keeps the door open for a corrective move toward $145–$160, while failure would likely reopen the path toward $100.
For traders, this is a reaction zone, not a conviction long. Let price prove strength before assuming the worst is over.
FAQs
Is Solana currently in a bullish or bearish trend?
Solana remains in a broader bearish trend. Current signals suggest a potential short-term correction, not a confirmed trend reversal.
Is this a good time to buy Solana for traders?
This is a reaction zone, not a high-conviction entry. Traders should wait for confirmation above resistance before considering long positions.
What is Solana price prediction for 2026?
SOL potentially ranging between $180–$250 in 2026 if adoption grows, with downside risk toward $120 if market conditions weaken.
Uniswap has entered a new chapter after its community overwhelmingly approved the long-awaited UNIfication proposal. The vote passed with near-unanimous backing, showing strong confidence in reshaping how value flows through the protocol. More than a governance tweak, the decision marks a shift toward tying Uniswap’s growth more directly to the UNI token itself.
At its core, the proposal reflects a belief that Uniswap has matured enough to move beyond experimentation and into a more sustainable, value-driven phase.
Fee Switch Goes Live, UNI Burn Begins
The biggest change under UNIfication is the activation of Uniswap’s long-discussed protocol fee switch. Until now, trading fees on Uniswap flowed entirely to liquidity providers. Going forward, a portion of those fees will be routed to the protocol and used to burn UNI tokens.
This means Uniswap activity will now directly reduce UNI supply. As trading volume grows, more tokens are removed from circulation, reinforcing a long-term scarcity model. Net sequencer fees from Unichain will also be added to this burn mechanism, strengthening the link between protocol usage and token economics.
After a mandatory two-day timelock, Uniswap will execute a one-time burn of 100 million UNI, an estimate of what could have been burned if the fee switch had existed from the start.
Beyond token economics, UNIfication also simplifies Uniswap’s operations. Responsibilities previously split between the Uniswap Foundation and Uniswap Labs will now sit under a single roof. As part of the shift, Uniswap Labs will remove interface, wallet, and API fees, aiming to reduce friction for users and developers.
A recurring UNI-funded growth budget has also been created to support long-term development rather than short-term incentives, signaling a more structured approach to protocol expansion.
Community Reactions Are Split but Engaged
Reaction across crypto has been lively. Crypto user Alexander described the move as a major moment for DeFi, arguing it creates a more level playing field. He noted that liquidity providers unwilling to share a portion of yields now have alternatives like Velodrome and Aerodrome, increasing competition across DeFi.
Others were more skeptical. Another user pushed back on the excitement around token burns, arguing that uncirculated tokens have no real market value and burning them doesn’t meaningfully reduce dilution. In his view, the fee switch is the real story, not the burn headline.
Meanwhile, guto.eth welcomed the change, calling it a defining test for DeFi. He argued that if protocols like Uniswap and Aave can’t turn major upgrades into real value reflected in token prices, the sector risks losing credibility.
Never Miss a Beat in the Crypto World!
Stay ahead with breaking news, expert analysis, and real-time updates on the latest trends in Bitcoin, altcoins, DeFi, NFTs, and more.
FAQs
What is the UNIfication proposal on Uniswap?
UNIfication is a governance upgrade that activates Uniswap’s fee switch, links protocol revenue to UNI burns, and aligns growth more closely with the UNI token.
How does Uniswap’s new fee switch work?
A portion of trading fees now goes to the protocol instead of solely to liquidity providers, and those funds are used to permanently burn and reduce the circulating supply of UNI tokens.
Why is UNIfication important for DeFi overall?
It tests whether major DeFi protocols can convert real usage into sustainable token value, a key step for long-term credibility and growth.
Charles Hoskinson’s latest update on Midnight suggests something bigger is taking shape behind the scenes.
In a tweet posted today, the Cardano founder said he is currently “writing between 80–100 pages a day of technical documents for Midnight” as the team prepares for internal workshops scheduled for January. He described the work pace as intense and made it clear this isn’t a casual effort.
“Midnight is going to be the Manhattan Project of PET, Chain Abstraction, and Smart Compliance,” Hoskinson wrote, adding, “2026’s body is not ready!”
Why Hoskinson Is Raising the Stakes on Midnight
Midnight has often been described as Cardano’s privacy-focused extension, but Hoskinson’s wording signals a shift in how the project is being positioned.
Instead of marketing privacy as a rebellious feature, Midnight is being framed around privacy-enhancing technology (PET) that works alongside smart compliance and chain abstraction. That’s a notable distinction in a sector where many privacy projects struggle with regulatory acceptance.
The reference to January workshops suggests the project is moving into a more structured phase, where internal alignment and technical direction take priority.
“Nobody Sleeping”: Community Reaction Sets the Tone
The replies to Hoskinson’s tweet added another layer to the update. When one community member urged him to rest, Hoskinson responded plainly: “Nobody sleeping. We working. We are going to win.”
In another reply, he confirmed he is also working on a non-technical book titled “The Land of PET: A non-technical guide to privacy enhancing technology,” aimed at Midnight Ambassadors and the broader community.
Community members reacted with optimism, with one noting that “2026 really isn’t ready for this level of revolution.”
Midnight’s rapid rise has sparked questions within the Cardano community, especially as the NIGHT token has seen strong activity. Hoskinson has already addressed these concerns, stating that Midnight is not an ADA replacement, but a privacy extension designed to strengthen Cardano’s ecosystem.
HOSKINSON: NIGHT WILL NOT REPLACE ADA
Charles Hoskinson says the idea of selling ADA for NIGHT misses the point. NIGHT powers Cardano’s Midnight privacy network, but it’s designed to extend ADA’s ecosystem, not replace it. pic.twitter.com/LMT8Jlqgll
For now, the message is clear. Midnight is past the idea stage. The documentation is underway, January is the next milestone, and Cardano’s privacy push is entering a more serious chapter.
Never Miss a Beat in the Crypto World!
Stay ahead with breaking news, expert analysis, and real-time updates on the latest trends in Bitcoin, altcoins, DeFi, NFTs, and more.
FAQs
How might Midnight’s focus on privacy-enhancing technology affect Cardano’s regulatory positioning?
By integrating privacy-enhancing technology (PET) with smart compliance, Midnight could make Cardano more attractive to institutions and regulators. This approach aims to balance user privacy with legal obligations, potentially easing adoption in jurisdictions with strict crypto regulations.
Could Midnight impact existing Cardano users or developers?
Midnight is designed as a privacy extension, so current ADA holders and developers may benefit from enhanced privacy features without needing to switch tokens. Developers could also gain new tools for building privacy-focused applications that comply with regulatory standards.
What might be the long-term implications of Hoskinson’s technical and non-technical publications on Midnight?
Hoskinson’s technical documents and the non-technical book could help standardize understanding of privacy-enhancing technology across the Cardano community. This may accelerate developer engagement, community advocacy, and informed adoption of Midnight’s features over time.
Aave’s $140M‑revenue year is overshadowed by a failed brand‑control vote, a $10M AAVE buy, and a brutal governance rift hammering the token. Aave’s holiday governance drama has flipped into open confrontation, with founder Stani Kulechov now stressing that this year’s…
SXP slides 13% while TWT rebounds 10%, as API3, ACA, BIFI, and LAYER all fade from highs in a thin, sniper‑style Binance spot session. When a mid‑cap payments token dumps 13% in a day while a wallet token rips 10%…
Post-Christmas Friday is bringing liquidity back, but the week ends with three talking points: Hoskinson bashing Canton for XRP, a $24,111 BTC wick on Binance and Dogecoin's "naughty list.".
Today marks the largest crypto options expiry in history, with nearly $28 billion worth of BTC and ETH contracts settling on Deribit. Roughly 267,000 Bitcoin options expire with a put/call ratio of 0.35 and a max pain level near $95,000, while 1.28 million Ethereum options expire with a put/call ratio of 0.45 and max pain around $3,100. Traders have been repositioning ahead of settlement, and quarterly contracts now dominate open interest, highlighting increased derivative influence on price action.
Around $27 billion worth of Bitcoin, Ethereum options expired today on Deribit, one of the world’s largest crypto options exchanges. Bitcoin is trading near $88,000, while Ethereum is hovering close to $2,950, as traders brace for possible volatility.
With such a large amount of contracts settling at once, the expiry could have a massive impact on the crypto market
Bitcoin Faces $23.6 Billion Option Expiry
Bitcoin accounts for the biggest share of today’s expiry, with over $23.6 billion in BTC options rolling off. Data from Deribit shows 268,000 option contracts settled at the same time, clearing a major amount of risk from the market in a single session.
Despite the size of the expiry, trader positioning still leans positive. The put-to-call ratio stands at 0.38, which means more traders were betting on higher prices than lower ones.
The “max pain” level, where most option holders would see losses, was near $96,000. This level often acts like a price magnet around expiry, even if briefly.
Bitcoin Eyeing $100K level
Over the past few weeks, Bitcoin has remained stuck in a tight range, repeatedly testing both sides. Crypto analyst Michael van de Poppe noted that sellers have failed to push BTC below $86.5K, showing strong buyer support.
However, every move above $90K has been rejected, highlighting heavy selling pressure at that level.
Analysts say $90,000 is the key barrier. A clear breakout above it, backed by strong volume, could restore bullish momentum and open the path toward the $100,000 mark.
Ethereum Traders Remain Cautious After Options Expiry
Ethereum is also under the spotlight, with nearly $4 billion in ETH options expiring. Although ETH has seen small price gains, traders remain cautious rather than confident. The max pain level sits near $3,100, keeping pressure on the price.
Ethereum has once again failed to hold above the key $3,000 level, which is worrying traders. Crypto analyst Ted noted that unless ETH clearly moves back above $3,000, the risk of another drop stays high.
If the price falls below $2,800, selling pressure could increase quickly. Below that, the next strong support lies around $2,600, $2,500, where buyers stepped in during earlier sell-offs.
XRP and Solana Show Mixed Signals
XRP options show continued pressure, with traders closely watching the $1.80 support level. A break below this could lead to further downside.
Solana shows a more balanced picture. Options data remains neutral, and SOL has already seen a small recovery around $123.
As 2026 approaches, this option’s expiry could act as an important turning point for the token.
Never Miss a Beat in the Crypto World!
Stay ahead with breaking news, expert analysis, and real-time updates on the latest trends in Bitcoin, altcoins, DeFi, NFTs, and more.
FAQs
What happens when Bitcoin and Ethereum options expire?
When options expire, contracts settle, removing market risk and often causing short-term price volatility in BTC and ETH.
How does a large options expiry affect crypto prices?
A massive expiry clears a large amount of market risk at once, which can increase short-term volatility. The “max pain” price often acts as a temporary magnet, but the overall trend depends on broader market sentiment.
How do crypto option expiries impact other tokens like XRP and Solana?
Large expiries can influence market sentiment, affecting XRP support at $1.80 and Solana’s price recovery around $123.
Lithuania is preparing for one of its toughest crypto enforcement actions yet, signaling a clear shift from regulatory tolerance to strict oversight. Starting January 1, 2026, crypto firms operating without a valid MiCA license will be treated as illegal, exposing hundreds of companies to fines, website blocks, and even criminal liability.
The move places Lithuania at the forefront of Europe’s push to turn MiCA from a framework on paper into active enforcement.
Deadline Set as Transition Period Ends
Lithuania’s central bank, Lietuvos Bankas, has confirmed that the transition period for crypto service providers expires on December 31. From that point onward, any exchange, wallet provider, or crypto platform serving users without MiCA authorization will be operating outside the law.
While more than 370 crypto-related entities are registered in the country, only around 120 are actively operating. Even more concerning for regulators, fewer than 10% of firms, roughly 30 companies, have applied for the required license so far. Authorities have warned that waiting any longer could leave businesses exposed to immediate enforcement action.
Enforcement Will Be Aggressive
Regulators have made it clear that consequences will be serious. Unlicensed firms may face financial penalties, forced shutdowns, website blocking, and, in severe cases, criminal charges carrying prison sentences of up to four years.
Lithuania’s central bank has urged companies that do not plan to seek a license to begin winding down operations immediately. Firms are expected to notify users, return customer funds, and provide clear instructions for transferring assets to other custodians or self-hosted wallets before services are terminated.
Lithuania wants to position itself as a “MiCA gateway” for compliant crypto businesses entering the European Union. Rather than acting as a permissive hub, the country is choosing to attract firms willing to operate under strict transparency, investor protection, and reporting standards.
Officials argue that tighter oversight will reduce fraud, improve trust, and align crypto services with traditional financial regulations. In their view, enforcement is necessary to protect consumers and the integrity of the financial system.
Crypto Market Sentiment Turns Cautious but Strategic
The immediate crypto sentiment around Lithuania’s decision is mixed. Smaller firms and offshore operators see the move as hostile, while regulated exchanges and institutional players largely welcome the clarity. Many in the industry view this as a broader European trend rather than an isolated event. As MiCA enforcement ramps up across the EU, crypto firms are increasingly forced to choose between compliance and exit. The uncertainty phase is ending.
Long-Term Impact on Lithuania’s Crypto Future
In the short term, Lithuania may see a sharp drop in the number of crypto firms operating locally. However, analysts believe the country could benefit long-term by becoming a trusted, regulated crypto jurisdiction.
If successful, Lithuania may attract banks, fintech firms, and institutional investors seeking a stable regulatory environment. While the crackdown may sting today, it could ultimately reshape the country into one of Europe’s most credible crypto hubs under MiCA’s new rulebook.
Never Miss a Beat in the Crypto World!
Stay ahead with breaking news, expert analysis, and real-time updates on the latest trends in Bitcoin, altcoins, DeFi, NFTs, and more.
FAQs
Will this affect crypto users outside Lithuania who use platforms registered there?
Yes. Platforms registered in Lithuania but serving users across the EU may lose the legal right to operate, potentially forcing users to withdraw funds or migrate accounts. Customers could face short-term disruptions even if they are not based in Lithuania.
What happens to customer funds if a platform is forced to shut down?
Funds are expected to be returned or transferred, but timelines and execution depend on each firm’s internal controls. Delays or disputes could arise if a company is already financially strained or poorly governed.
How might this change the type of crypto businesses choosing Lithuania in the future?
Firms focused on compliance, institutional clients, and long-term EU market access are more likely to stay or enter. Speculative, lightly regulated, or short-term operators may shift to non-EU jurisdictions instead.
Russia’s biggest bank is taking a careful step toward crypto.
Sberbank, the country’s largest state-owned lender, has confirmed it is exploring loans secured by cryptocurrency. The idea is that borrowers could get ruble loans while using digital assets as collateral, instead of selling them outright.
Sberbank Deputy Chairman Anatoly Popov said the bank is still in the evaluation phase and will not move ahead without regulators.
“We are currently exploring the possibility of lending secured by cryptocurrency. In Russia, crypto market regulation is still in its infancy, and we are ready to collaborate with the regulator in developing relevant solutions and creating the infrastructure for launching such services. I hope we will be able to announce such deals soon,” Popov said.
The focus would be on ruble lending, with crypto used strictly as collateral. There’s no indication that digital assets would be used as payment or settlement tools.
This Isn’t a Sudden Shift
Sberbank has already been building out its digital asset operations. Since the beginning of the year, the bank has organized more than 160 digital financial asset issues, including Russia’s first tokenized products linked to real estate and oil.
That track record helps explain why crypto-backed loans are now on the table. The bank already operates a licensed digital asset platform, making the move an extension of existing infrastructure rather than a new experiment.
Any rollout would require approval from the Central Bank of Russia, which continues to view crypto as a high-risk asset. Still, the regulatory environment is changing.
Earlier this week, the central bank released details of a broader crypto framework that would classify cryptocurrencies and stablecoins as “currency assets.” The plan also expands access beyond the current experimental regime and allows wider participation over time.
Lawmakers are expected to review the proposed changes, with full approval targeted for July 1, 2026.
Why This Matters
Sberbank’s comments signal something important: crypto is slowly finding a place inside Russia’s traditional financial system.
While no launch date has been set, the message is strong for the industry.
Never Miss a Beat in the Crypto World!
Stay ahead with breaking news, expert analysis, and real-time updates on the latest trends in Bitcoin, altcoins, DeFi, NFTs, and more.
FAQs
How could banks manage price volatility of crypto used as collateral?
Lenders typically protect themselves through overcollateralization, frequent margin checks, and automated liquidation thresholds. These mechanisms reduce credit risk but can expose borrowers to sudden collateral calls during sharp market swings.
What would approval mean for other Russian banks and fintech firms?
If regulators approve Sberbank’s model, it could set a template for the wider banking sector. Smaller banks and licensed digital asset platforms may follow, accelerating the normalization of crypto-linked financial products in Russia.
After maintaining a choppy trade for a few days, the Bitcoin price rose slightly but failed to sustain above $89,000. Meanwhile, due to the pullback, the volatility seems to have risen as the token is heading into the weekend at a sensitive point. Besides, it has moved past the current options expiry after days of consolidation, which is a structural event that quietly changes the price behaviour. With the liquidity thinning over the weekend, it would be interesting to watch how the BTC price rally could unfold ahead of the year-end trade.
Bitcoin Compressing Near Key Levels
Bitcoin’s tight consolidation is largely gamma-driven, not a lack of interest. Nearly $415M of total gamma exposure (about 67%) sits in near-dated expiries, with December 26 alone accounting for roughly $287M. This concentration has kept BTC mechanically pinned, muting follow-through on both breakouts and pullbacks.
As price moves within this window, dealer hedging absorbs momentum, reinforcing range-bound trade. That explains why recent attempts to break key levels have stalled quickly. Once the December 26 expiry passes, this gamma concentration falls sharply, with exposure rolling into much smaller January and March buckets. This unwind does not create selling pressure. Instead, it removes the structural force suppressing volatility.
Post-expiry, Bitcoin shifts from a gamma-pinned environment to a flow-driven one. Range breaks are more likely to extend, but direction will depend on spot demand, volume, and acceptance, not options mechanics.
Bitcoin Price Prediction for Weekend: Can it Reach $90,000?
Bitcoin is entering a decisive phase after a sharp sell-off earlier this month, followed by stabilisation near the $88,000–$90,000 zone. The daily chart shows BTC attempting to base after losing the $100,000 psychological level, with price now moving inside a clearly defined ascending channel. With the December 26 options expiry behind us and weekend liquidity thinning, traders are closely watching whether this consolidation turns into a sustained recovery or another volatility-driven move.
Technically, BTC is trading within an ascending channel, suggesting short-term structural recovery rather than trend reversal. The mid-channel region near $88,500 is acting as a pivot. DMI shows a weakening trend strength, with +DI and -DI converging, pointing to consolidation. Meanwhile, CMF has slipped below zero, indicating cautious capital flows. A daily close above channel resistance could open upside toward $94,000, while a breakdown below channel support risks a drop toward $85,000.
What to Expect From Bitcoin Price Action This Weekend
With Bitcoin trading inside a narrow range and options-related constraints now fading, the weekend is likely to act as a volatility test rather than a trend-defining move. If the BTC price holds above the $88,000–$89,000 support zone and attracts fresh spot volume, the structure favors a gradual push toward $92,000, surpassing $90,000.
However, failure to defend this area could trigger a quick downside sweep, amplified by thin weekend liquidity. With this, the Bitcoin price may remain consolidated within the pattern below the average range of the channel.
Residents can now pay Lugano taxes, fines and city invoices in Bitcoin or USDT, with instant conversion to Swiss francs. On the granite steps outside Lugano’s city hall, the most common question used to be about permit forms or parking…
Changpeng Zhao lays out his 2025 focus on BNB Chain, stablecoin 2.0, prediction markets and AI agents in a post‑pardon, builder‑first reset. Changpeng Zhao’s 2025 could have been a quiet fade‑out. Instead, the pardoned Binance founder is spending his time…
Tether CEO Paolo Ardoino warned that an AI sector correction could spill over into crypto markets in 2026, with some analysts projecting BTC to drop to as low as $65,000.
From McDonald’s to municipal taxes, Lugano is proving that Bitcoin adoption is not about predicting the future; it is about building the infrastructure to handle it today.
The malicious Trust Wallet extension has also been exporting users’ personal information, pointing to potential insider activity, according to cybersecurity company SlowMist.
The failed vote highlights deeper tensions over token value capture, governance power and whether DAO structures can effectively manage protocol identity.
XRP price has formed a bullish reversal pattern as whales continued buying the token. According to data from crypto.news, XRP (XRP) price has dropped by nearly 15% so far in December. Trading at $1.88 at press time, the losses extend…
Hoskinson just gave Midnight a compliance-first privacy twist with a major teaser and pointed to January workshops as the moment the "new ADA" stops being a slogan and turns into a 2026 plan.
Layer 1 and Layer 2 tokens sank in 2025 as users and capital rotated to Bitcoin, Ethereum, BNB Chain and revenue-generating protocols despite strong developer activity. Layer 1 blockchain tokens experienced significant depreciation in 2025, with major assets losing substantial…
Gemini, the third-largest U.S. crypto exchange, has announced the launch of trading and custody support for BNB, the native token of the BNB Chain ecosystem. Originally issued by Binance in 2017, BNB is widely used for paying trading and network fees. With this move, Gemini joins Kraken in supporting BNB, while Coinbase has placed the token on its listing roadmap but has yet to start trading. The listing expands Gemini’s asset offerings amid growing multi-chain adoption.
Lithuania is known as a leading, crypto-friendly EU hub, is sending a clear message to the crypto industry: follow the rules or leave. The country’s central bank has warned that all crypto companies operating in Lithuania must secure a proper license by December 31, 2025, or face serious legal consequences starting next year.
Lithuania Tightens Crypto Rules Under EU Law
According to the Bank of Lithuania, also known as Lietuvos Bankas, every business offering crypto services in the country must hold a valid license under the European Union’s MiCA framework. From January 1, 2026, any platform operating without approval will be considered illegal.
This move is part of the EU-wide rollout of Markets in Crypto-Assets (MiCA) rules, which aim to bring stronger oversight, consumer protection, and transparency to the crypto sector across Europe.
JUST IN: Bank of Lithuania warns crypto firms must get licensed by Dec 31.
From Jan 1, unlicensed platforms operating in Lithuania will be deemed illegal.
The consequences for ignoring the deadline are serious. Regulators say unlicensed crypto firms could face large fines, blocked websites, and even criminal charges. In severe cases, company executives may face up to four years in prison.
Authorities have also advised crypto firms that do not plan to meet the new standards to shut down operations in an orderly way. This includes returning user funds safely and avoiding sudden service disruptions that could harm customers.
9% Lithuanian crypto businesses have applied for a license
Despite the clear deadline, compliance has been slow. Out of more than 370 crypto companies currently registered in Lithuania, only around 30 have applied for a MiCA license so far. This raises concerns that many firms may struggle to meet the requirements in time.
In recent years, Lithuania has become a popular base for crypto companies due to its fast registration process and crypto-friendly stance. However, regulators now say stricter rules are needed to reduce risks like money laundering, fraud, and poor consumer protection.
As the deadline approaches, both crypto companies and users are being urged to prepare for a more regulated crypto environment in Lithuania starting in 2026.
Never Miss a Beat in the Crypto World!
Stay ahead with breaking news, expert analysis, and real-time updates on the latest trends in Bitcoin, altcoins, DeFi, NFTs, and more.
FAQs
What happens if a crypto company operates in Lithuania without a MiCA license?
Unlicensed firms may face heavy fines, blocked websites, forced shutdowns, and in serious cases, criminal charges against executives.
Will crypto users in Lithuania be affected by the new MiCA rules?
Yes. Users may see platforms exit the market, but licensed firms should offer stronger protections, transparency, and safer handling of funds.
Why is Lithuania tightening crypto regulations now?
Lithuania is enforcing EU MiCA rules to reduce fraud, money laundering, and consumer risk while aligning with Europe’s unified crypto framework.
A recent hack on Trust Wallet exposed nearly $7 million in crypto from users. The attack happened just after Christmas, surprising many investors and worrying the crypto community. Although the loss was smaller than some major exchange hacks, the speed and secrecy of the attack caused panic.
User Funds Are “SAFU,” Says Changpeng Zhao
So far, $7m affected by this hack. @TrustWallet will cover. User funds are SAFU. Appreciate your understanding for any inconveniences caused.
The team is still investigating how hackers were able to submit a new version. https://t.co/xdPGwwDU8b
Binance founder Changpeng Zhao (CZ) moved fast to address the situation. He publicly confirmed that Trust Wallet would fully reimburse all affected users and emphasized that user funds remain “SAFU.”
CZ also said the team is actively investigating how the malicious code bypassed internal checks. His quick response helped stabilize sentiment and reassured users, highlighting the importance of strong leadership during crises.
What Went Wrong With Trust Wallet?
A cybersecurity researcher named Akinator found that the latest Trust Wallet browser extension update (version 2.68) contained hidden malicious code. This code secretly sent users’ wallet data to a fake phishing site called metrics-trustwallet.com. The domain had been registered just days before the attack and has since been taken offline.
Trust Wallet later clarified that the breach was limited to the 2.68 browser extension. Mobile users and those running other versions were not affected. Early findings suggest the vulnerability may have been introduced during the update submission process, allowing malicious code to slip through.
Once identified, Trust Wallet urged users to immediately update to version 2.69, which patched the exploit. The limited scope prevented broader losses, but the fact that a compromised update reached users raised concerns about oversight and quality control.
While $7 million is small compared to some historic breaches, the timing and context make the incident significant. According to Chainalysis, crypto thefts have already exceeded $3.14 billion in 2025. Nearly half of those losses came from a single Bybit hack, but a steady stream of smaller wallet and protocol exploits continues to erode trust.
Industry leaders warn that as crypto infrastructure grows, attack surfaces expand.
OKX founder Star Xu summed it up bluntly: security is never “done,” and even mature platforms remain vulnerable.
Community Reaction: Shock, Anger, and Betrayal
User reaction was intense and deeply personal. One victim, Yuna, said she opened her Trust Wallet after Christmas to find over $300,000 gone drained in just four minutes through transactions she never approved. Despite following strict security practices, the exploit shattered her confidence.
What fueled outrage wasn’t just the loss, but the response. Victims reported vague acknowledgments, no immediate public warnings, and little transparency. Yuna claims she identified over 500 affected users within hours, many losing life-changing sums. The incident has intensified calls for accountability, faster disclosures, and stronger protections.
Never Miss a Beat in the Crypto World!
Stay ahead with breaking news, expert analysis, and real-time updates on the latest trends in Bitcoin, altcoins, DeFi, NFTs, and more.
FAQs
How can Trust Wallet users protect their funds after the hack?
Update immediately to version 2.69, enable two-factor authentication, and verify all transactions to secure wallets.
Will affected Trust Wallet users get reimbursed?
Yes, Trust Wallet confirmed full reimbursement for users impacted by the hack, ensuring their funds remain safe.
Is Trust Wallet safe to use after this incident?
Trust Wallet is safe if updated to v2.69. The breach was limited, and the team patched the exploit quickly.
Cardano price has dropped 60% since its October high as its TVL and stablecoin supply weakened. However, it has been forming a bullish reversal pattern which, if confirmed, could lead to a 45% rally ahead. According to data from crypto.news,…
Several users of the Binance-owned Trust Wallet have been affected by a major security issue involving a recent version of its Chrome extension. Former Binance CEO Changpeng Zhao has confirmed that Trust Wallet will compensate affected users. Trust Wallet has…
Bitcoin usually sees strong gains in the year after a halving. This cycle, however, has looked different. Instead of explosive volatility, the price has remained relatively calm, even behaving like a stable asset at times.
Earlier this year, the market experienced what Mow described as the largest liquidation flush ever. Altcoins fell sharply, but Bitcoin only dropped around $20,000.
“Altcoins dropped to the depths, but Bitcoin was largely unaffected,” he said, highlighting the asset’s growing resilience.
This shows that while the market experienced stress, Bitcoin’s price could absorb selling without a major crash.
Multiple Factors Are Limiting the Rally
Mow pointed out several reasons Bitcoin hasn’t surged yet:
Profit-taking: Some investors are taking gains rather than buying more.
Whale rotations: Large holders may be moving Bitcoin around, creating sideways pressure.
ETF flows: Money moving into ETFs can affect how much buying pressure is reflected in the spot market.
Exchange or “paper” Bitcoin selling: There may be selling that doesn’t reflect real Bitcoin demand.
“Maybe it’s paper Bitcoin, maybe it’s ETFs, maybe it’s profit-taking it could be many things,” he said.
Another factor is the earlier rally in altcoins. Ethereum was reaching new highs, and XRP traded near $3.50, which Mow described as unsustainable. When altcoins correct, Bitcoin often dips briefly but then recovers. This rotation of attention and capital can keep Bitcoin from surging even when demand remains strong.
The Calm May Be Temporary
Mow emphasized that Bitcoin’s limited upside so far does not mean the market is exhausted. Supply constraints and continued demand suggest a price move is inevitable.
“It’s impossible that someone ends up with 10% of the supply at these prices,” he said. “The price has to move sooner or later.”
For now, Bitcoin’s post-halving calm reflects a balance between selling pressure, profit-taking, and capital rotation. But according to this view, the quiet is likely just the calm before the next major move.
Never Miss a Beat in the Crypto World!
Stay ahead with breaking news, expert analysis, and real-time updates on the latest trends in Bitcoin, altcoins, DeFi, NFTs, and more.
FAQs
What are the biggest risks to Bitcoin’s price in 2026?
Major risks include global recessions, tighter crypto regulations, declining liquidity, or a sustained breakdown below key support levels.
How much will BTC be worth in 2030?
Bitcoin price forecasts for 2030 range from $380K to $900K, driven by scarcity, long-term adoption, and expanding institutional participation.
What will be the price of Bitcoin in 2050?
While uncertain, many long-term projections suggest Bitcoin could exceed $1 million by 2050 if it becomes a global store of value.
Is Bitcoin still a good hedge against inflation in the long term?
Bitcoin’s fixed supply makes it attractive as an inflation hedge, especially during currency debasement and long-term economic uncertainty.
The two world’s biggest economies, Russia and the United States, are discussing the future of the Zaporizhzhia Nuclear Power Plant, which has been under Russian control since early in the Ukraine conflict.
Meanwhile, reports suggest that the U.S has shown interest in using electricity from Europe’s largest nuclear power plant for Bitcoin mining
U.S. Interest Links Nuclear Energy and Bitcoin Mining
According to a report by Kommersant, President Vladimir Putin revealed that the Zaporizhzhia Nuclear Power Plant is part of ongoing talks between Russia and the United States. One of the ideas raised during these discussions is using the plant’s massive electricity output for Bitcoin mining operations.
Zaporizhzhia is the largest nuclear power plant in Europe, which produces 136.8 gigawatt-hours (GWh) of energy per day than local demand requires.
With such a large and steady energy supply, Bitcoin mining, which requires constant, high-volume electricity, could provide a practical way to use this excess power more efficiently.
According to Kommersant, President Vladimir Putin said Russia is discussing the management of the Zaporizhzhia nuclear power plant with the United States. The report said the U.S. has expressed interest in using the plant’s electricity for Bitcoin mining. Zaporizhzhia is Europe’s…
Bitcoin mining requires stable, low-cost, and continuous electricity. Nuclear power fits this need well, as it provides constant energy without interruptions. In recent years, miners have increasingly turned to alternative energy sources like hydro, wind, and nuclear power to reduce costs and improve sustainability.
Using nuclear energy for Bitcoin mining could also help stabilize power grids by consuming excess electricity that would otherwise go unused. This makes the idea attractive not just for miners, but also for energy planners.
If nuclear-powered Bitcoin mining becomes a reality, it could change how and where Bitcoin is mined globally.
Putin’s comments suggest that Russia is open to joint management of the Zaporizhzhia plant with the U.S., rather than Ukraine. While the talks are still at an early stage, they point to a broader shift where energy infrastructure, geopolitics, and digital assets are becoming closely linked.
If such cooperation moves forward, it would mark one of the first cases where a major nuclear facility is openly discussed in the context of Bitcoin mining.
While no official agreement has been announced, the fact that such talks are happening shows how seriously governments are now viewing Bitcoin mining as an industrial activity tied to energy policy.
After the 2024 halving, miners now earn 3.125 BTC per block, producing roughly 450 new BTC per day. At this pace, the last Bitcoin will be mined around the year 2140, making Bitcoin increasingly scarce over time.
Never Miss a Beat in the Crypto World!
Stay ahead with breaking news, expert analysis, and real-time updates on the latest trends in Bitcoin, altcoins, DeFi, NFTs, and more.
FAQs
Why does Bitcoin mining benefit from nuclear power?
Bitcoin mining needs stable, low-cost, 24/7 electricity. Nuclear power provides uninterrupted energy, helping miners reduce costs and improve efficiency.
How much Bitcoin is left to be mined?
Only about 1.3 million BTC remain, less than 7% of the total 21 million supply. Currently, roughly 450 new Bitcoin are created per day through mining.
When will the last Bitcoin be mined?
At the current mining rate post-2024 halving, the last Bitcoin is projected to be mined around the year 2140 due to the protocol’s built-in gradual reduction of new coins.
Mike Novogratz isn’t convinced that institutional money is what keeps XRP relevant. Instead, the Galaxy Digital CEO believes XRP’s staying power comes from something far less measurable but equally powerful, its community.
Speaking on a recent podcast, Novogratz credited the “XRP Army” for carrying the token through multiple market cycles, even as Wall Street attention remains firmly locked on Bitcoin and its ETFs.
In a market flooded with new tokens, narratives, and short-lived trends, Novogratz sees community belief as a survival mechanism. XRP, in his view, is proof that loyalty can still matter in crypto.
Bitcoin ETFs Now Control the Market’s Pulse
While XRP leans heavily on grassroots support, Bitcoin is being shaped by institutional demand. Novogratz explained that spot Bitcoin ETFs have become a dominant force in market structure, steadily absorbing supply even during volatile periods. Despite Bitcoin’s failure to decisively reclaim the $100,000 level, ETF inflows have continued, preventing deeper downside moves.
He described the $100,000 zone as a psychological and technical wall built from earlier aggressive buying. That demand has since turned into overhead supply, slowing momentum as large holders sell into strength. Still, Novogratz views this phase as consolidation, not exhaustion.
Community as a Competitive Edge for XRP
Novogratz compared XRP to other long-standing crypto assets that survived not through innovation or yield, but through belief. As capital becomes more selective and new projects fight for relevance, maintaining a committed user base has become harder than ever.
XRP’s supporters, however, have remained vocal and engaged. That persistence keeps the asset visible, even without consistent institutional inflows. In today’s market, Novogratz argues, tokens without strong communities risk fading quietly into irrelevance.
ETFs, Supply Shocks, and XRP’s Surprise Factor
The broader ETF narrative isn’t limited to Bitcoin. Legal expert Bill Morgan recently noted that the anticipated “XRP ETF supply shock” has, at least partially, delivered. According to him, developments around XRP-linked investment products have genuinely surprised the market, shifting expectations around supply dynamics and long-term positioning.
Adding to the discussion,Xaif Crypto revisited a point Ripple CTO David Schwartz made back in 2017. As he noted, XRP cannot stay cheap forever without breaking its own economics. Transaction fees on the XRP Ledger are denominated in XRP, not dollars. As XRP’s price rises, fees actually become cheaper in real-world terms, while liquidity and network security improve.
In other words, higher prices don’t undermine XRPL’s utility; they strengthen it.
Macro Risks Can’t Be Ignored
Despite pockets of optimism, Novogratz remains cautious. He warned that a sharp downturn in U.S. equities, particularly the Nasdaq, would likely drag crypto lower. He also flagged AI-driven job displacement as a growing economic wildcard that could pressure all risk assets.
For now, XRP’s relevance appears less about Wall Street and more about belief, and that belief, at least so far, hasn’t broken.
Never Miss a Beat in the Crypto World!
Stay ahead with breaking news, expert analysis, and real-time updates on the latest trends in Bitcoin, altcoins, DeFi, NFTs, and more.
FAQs
What risks could disrupt XRP’s current market position?
Wider macroeconomic downturns, such as a sharp decline in U.S. equities or unexpected shifts in technology-driven labor markets, could pressure risk assets including XRP. Regulatory changes or reduced adoption of the XRP Ledger could also undermine its long-term utility and community-driven stability.
What are the potential risks to XRP despite community strength?
Broader economic downturns, such as sharp declines in U.S. equities or technology sector weakness, could pressure all crypto assets, including XRP. Regulatory developments or sudden liquidity shocks may also temporarily outweigh community-driven support.
Who benefits from XRP’s long-term utility model?
Users of the XRP Ledger benefit as rising XRP prices reduce transaction costs and enhance network security. Exchanges, developers, and businesses relying on XRPL payments may experience more efficient and cost-effective operations as the network grows.
Trust Wallet has confirmed a serious security breach affecting version 2.68 of its browser extension, which hackers exploited to drain funds from hundreds of users’ wallets across Bitcoin, Solana, and EVM networks. Initial on-chain analysis showed losses exceeding $6 million, with total impact around $7 million. Users are urged to disable the compromised extension and upgrade to version 2.69 immediately. Binance founder Changpeng Zhao said Trust Wallet will cover the losses and that user funds are SAFU while the investigation continues.
SBI Group is preparing to test a new cashless payment system in Japan using USDC, a US dollar–linked stablecoin issued by Circle. The pilot project is expected to begin in spring 2026 and will focus on in-store payments using QR codes.
The test will be run by SBI VC Trade, Japan’s only registered operator allowed to handle stablecoins, along with APLUS, a payments company that works with a wide network of retail stores. The goal is to build a simple payment model where customers can pay in USDC and stores receive Japanese yen.
Under the plan, customers holding USDC in private wallets like MetaMask will scan a store’s QR code and pay using USDC. SBI VC Trade will then convert the USDC into yen and send it to APLUS, which will pass the funds on to the merchant.
SBI says the project builds on lessons learned from the Osaka-Kansai Expo, where digital wallets were tested for visitors. The company also hopes the system will be useful for foreign tourists, who may find it easier to pay with dollar-based digital money instead of cash.
Why USDC and Not Ripple’s RLUSD
The announcement has drawn attention because SBI has a long-standing relationship with Ripple, yet the pilot uses USDC instead of Ripple’s own US dollar stablecoin, RLUSD.
Pro-XRP lawyer Bill Morgan reacted to the news, saying the decision likely reflects timing rather than a lack of confidence in Ripple. He noted that when SBI VC Trade became Japan’s first registered stablecoin operator in March 2025, RLUSD was not yet ready for use, while SBI already had an existing partnership with Circle.
A new cashless payment model using USDC not RLUSD despite its parent company’s deep longstanding relationship with Ripple. Reflects that RLUSD was not sufficiently ready in March 2025 when SBI VC Trade became Japan’s first registered Electronic Payment Instruments Exchange… https://t.co/q2XVEu8taO
Morgan added that RLUSD is expected to catch up over time and said Ripple’s decision to launch its own US dollar stablecoin was critical. He also suggested that Ripple may have moved earlier if not for delays caused by its long legal battle with the US Securities and Exchange Commission.
What Comes Next
If the trial is successful, SBI and APLUS plan to expand the system to more stores and explore wider use of stablecoin payments across Japan.
With innovation in cross-chain derivatives and rising on-chain activity, MYX could reach $30 by 2026 and up to $50 by 2030 if similar momentum continues.
MYX surged over 20,000% from June lows to September highs, making it one of the year’s best performers.
MYX Finance is positioning itself as a next-generation decentralized perpetual futures exchange, targeting traders who want on-chain transparency without sacrificing leverage and execution speed.
As centralized exchanges face increasing regulatory pressure, perpetual DEXs like MYX are attracting users looking for non-custodial alternatives.
While the overall cryptocurrency market is under pressure, MYX Finance’s native token (MYX) is moving in the opposite direction. The token jumped around 15% in the last 24 hours, trading near $3.5, even as Bitcoin, Ethereum, and most altcoins slipped lower.
At a time when overall market sentiment remains weak, MYX’s strong price action has turned heads. Making investors curious about the token growth, wondering what the future will be for these tokens.
With that in mind, let’s take a closer look at our MYX Finance (MYX) price outlook for 2026 to 2030.
Fundamental Growth and Ecosystem Strength Stay Unaffected
With the October crash, many are thinking MYX is done for, but it’s the exact opposite because the price action might not be supporting now due to macro factors, but fundamentals have never been better.
As MYX Finance’s explosive growth is firmly rooted in robust on-chain fundamentals, moving beyond mere speculation. The platform has demonstrated consistent and significant expansion in user activity, evidenced by its surging monthly trading volume. This volume more than doubled during the year, climbing from $51 billion in January 2025 to $125.46 billion by early December.
MYX Price Targets For January 2026
Unlike traditional platforms, MYX offers a chain-abstracted wallet that lets users trade across blockchains without manual bridging. Its two-layer account model keeps funds in user custody while enabling gasless trades.
With up to 50x leverage and zero slippage, MYX gained attention, leading to major listings like WLFI in September.
This volume more than doubled during the year, climbing from $51 billion in January 2025 to $123.18 billion by early December. Also, Earnings have more than doubled in the same period, jumping from $18 million to $54.83 million.
The recent uptick suggests improving confidence, but sustained momentum will depend on whether volume growth follows price.
Technical Analysis
Looking at the MYX/USD 4-hour chart, the price is trading around the middle Bollinger Band near $3.27, which is acting as a short-term support zone.
The lower Bollinger Band, at around $2.87, marks the key downside support and has held well during recent pullbacks. On the upside, the upper Bollinger Band near $3.65–$3.68 is acting as immediate resistance. A clear break above this level could open the door towards $4.3, then further to near $5.
Technical indicators, such as the RSI, are currently around 60, indicating mild bullish momentum. This suggests buyers are active, but the price is not yet overbought.
Month
Potential Low ($)
Potential Average ($)
Potential High ($)
MYX Crypto Price Prediction January 2026
$1.74
$3.60
$5
MYX Finance (MYX) Price Prediction 2026
The year 2026 may act as a stress test for MYX Finance. By this stage, traders will judge the platform based on execution reliability during volatile markets, liquidation efficiency, and fee competitiveness.
If MYX succeeds in maintaining tight spreads and predictable funding rates while onboarding new traders from centralized exchanges, its valuation could expand steadily.
Looking ahead, 2026 could decide whether PUMP.fun grows beyond a viral trend into a platform users return to regularly.
However, aggressive competition from other perpetual DEXs could limit upside if differentiation remains weak.
Year
Potential Low ($)
Potential Average ($)
Potential High ($)
MYX Finance Price Prediction 2026
$2.80
$5.2
$10.44
MYX Finance Price Prediction 2026 – 2030
Year
Potential Low ($)
Potential Average ($)
Potential High ($)
2026
$2.80
$5.2
$10.44
2027
$3.90
$11.5
$18.9
2028
$9.56
$17.2
$27.3
2029
$16.7
$25.4
$38.9
2030
$21.5
$36.32
$48.7
MYX Finance Price Prediction 2026
In 2026, MYX’s price will be influenced primarily by trader retention. Metrics such as daily active traders, average leverage usage, and liquidation fairness will determine whether users remain loyal during volatile cycles.
MYX Finance Price Prediction 2027
By 2027, MYX’s growth may depend on product sophistication. Features such as cross-margining, advanced risk controls, or institutional-grade APIs could attract professional traders seeking decentralized alternatives.
MYX Finance Price Prediction 2028
The 2028 outlook relies on market structure evolution. If decentralized derivatives capture a larger share of global futures volume, MYX could benefit significantly, particularly if centralized exchange restrictions tighten further, pushing its price to around $27.3.
MYX Finance Price Prediction 2029
In 2029, MYX may transition from an emerging DEX to an established infrastructure. At this stage, valuation would be supported by consistent protocol revenue, governance participation, and integration with broader DeFi ecosystems.
MYX Finance Price Prediction 2030
By 2030, MYX’s relevance will depend on its ability to remain competitive amid rapid innovation. If it becomes a core liquidity venue for on-chain derivatives, long-term valuation could jump to nearly $47, assuming sustained demand.
What Does The Market Say?
Year
2026
2027
2030
CoinCodex
$9.50
$14.99
$40.87
Pricepredictions
$6.3
$11.8
$28.09
DigitalCoinPrice
$7.41
$18.71
$37.75
CoinPedia’s MYX Finance Price Prediction
After thorough analysis, Coinpedia believes MYX Finance’s long-term outlook depends less on hype and more on execution quality and trader trust.
If the protocol consistently delivers reliable performance during high-volatility events, MYX could outperform many speculative DeFi assets
Year
Potential Low ($)
Potential Average ($)
Potential High ($)
2026
$21.5
$36.32
$48.7
Never Miss a Beat in the Crypto World!
Stay ahead with breaking news, expert analysis, and real-time updates on the latest trends in Bitcoin, altcoins, DeFi, NFTs, and more.
FAQs
What is MYX Finance and how does it work?
MYX Finance is a decentralized perpetual futures exchange offering up to 50x leverage, gasless trades, and non-custodial accounts across blockchains.
Is MYX Finance a good long-term investment?
MYX’s long-term potential depends on trader adoption, platform reliability, and growth of decentralized derivatives markets through 2026–2030.
What is the MYX price prediction for 2026?
For 2026, MYX is projected to trade between $2.8 and $10.44, depending on user growth, market conditions, and protocol performance.
Can MYX reach $40 or higher by 2030?
If MYX becomes a major on-chain derivatives platform with strong liquidity and revenue, long-term forecasts suggest prices near $40–$48 by 2030.
Predictions suggest PUMP could reach $0.01 in Q1 2026.
Long-term forecast sees PUMP reaching $0.22 by 2030 in a moderate scenario.
PUMP.fun (PUMP), a utility coin launch platform for launching Solana-based memecoins with its viral “no-code” model that makes token creation easy for everyday users.
By making token launches easy and viral, it has disrupted how traditional Web2 social platforms work. At the same time, lower costs and fewer technical barriers have attracted many first-time users who were earlier unable to experiment on-chain.
As memecoin launches continue to rise, investors are now asking whether PUMP.fun can move beyond hype and become a lasting part of the crypto ecosystem.
With that in mind, let’s take a closer look at our PUMP. fun (PUMP) price outlook for 2026 to 2030.
Major Developments That Fueled PUMP’s Rally in 2025
Q3 saw many altcoins rally, including PUMP. This surge was triggered by a Binance US listing, which turned out to be a major catalyst for the sharp rise in PUMP’s price. The momentum was further supported by a 350-million PUMP reward campaign that caught traders’ attention. In September alone, PUMP gained over 180%, reaching $0.00899 and marking a new all-time high (ATH) before undergoing a pullback.
Meanwhile, Pump.fun has been using more than 98% of its platform revenue to buy back tokens, directly supporting price action. This aggressive strategy has turned Pump.fun into one of the most profitable DeFi projects on Solana, significantly boosting trader confidence.
However, the final quarter has capped this development, as macroeconomic factors have taken bearish control, pushing PUMP/USD sharply downward.
PUMP Price Analysis 2025
From a technical perspective focused on the short term, the PUMP price chart has shown considerable strength in Q3 but weakness in Q4. After reaching an all-time high of $0.0089, we observed a phase of profit-taking that intensified dramatically, ultimately driving the price down to July’s swing low support.
While this area had previously exhibited strong demand, expectations for a rebound were crumbled when, starting mid-December, it broke through that support level and marked a new all-time low of $0.0018.
This scenario clearly indicates a bearish outlook, and caution surrounding the PUMP price is rising. The odds of a December rebound are extremely low, and it appears highly likely that the year will close below the crucial support level of $0.0025.
PUMP.fun Price Targets For January 2026
PUMP.fun isn’t just another memecoin; it reflects a change in how everyday users interact with crypto markets.
PUMP.fun’s native token, PUMP, is trading around $0.002710, down 2.28%, with a market capitalization of $975.38 million. Meanwhile, 24-hour trading volume has dropped to $58.65 million, indicating a pause in speculative intensity rather than a collapse in platform usage.
If user activity stabilizes, PUMP.fun could reclaim its last month’s higher levels of $0.00427 as new token launches regain traction.
Perhaps, if users lose interest, the price could drop further and test the $0.00228 support level.
Technical Analysis
Looking at the PUMP.fun 4-hour price chart: PUMP token is holding close to its 20-period moving average at $0.00280, which is acting as short-term resistance.
Meanwhile, the lower Bollinger Band near $0.00267–$0.00260 is providing support and helping limit further downside. And the upper Bollinger Band sits around $0.00320, marking the next key resistance zone.
Technical Indicators like the RSI are sitting near 44, showing neutral momentum. This suggests selling pressure is slowing, and the token has room to move higher if buying interest improves.
Month
Potential Low ($)
Potential Average ($)
Potential High ($)
PUMP.fun Crypto Price Prediction January 2026
$0.021
$0.0033
$0.0042
PUMP Price Prediction 2026
In 2025, the price movement led to the formation of a falling wedge pattern, characterized by converging upper and lower boundaries that gap have notably narrowed. Recently, the price has declined to test the lower boundary of this wedge, indicating a critical point of support.
This technical setup suggests that if the price establishes a solid footing in December, it could initiate a significant upward movement, tapping into December as a crucial launchpad for the first quarter of 2026.
If the price successfully breaks out of the falling wedge pattern during Q1 2026, it will be important to closely monitor the $0.0034 level. For a sustainable bullish trend to commence, this price point should ideally transition from a resistance level to a support level. A successful move above this level may draw in additional buyers and could lead to a more robust upward trajectory, thereby enhancing overall market sentiment in PUMP.
Amidst market fluctuations, Pump.fun is actively reinvesting a substantial portion of its platform revenue to repurchase PUMP tokens each day. To date, this commitment has led to the buyback of an impressive $213.41 million worth of PUMP tokens, resulting in a meaningful reduction of 14.75% in the total circulating supply.
Despite recent market volatility, its dedication to daily buybacks has remained in the 95-106% range compared to the previous day’s purchases. This consistent reduction in available supply lays a solid foundation for potential price appreciation.
As market sentiment begins to shift positively, we anticipate that the decreased supply will significantly enhance the forthcoming wave of FOMO, which may propel the PUMP price to new heights.
PUMP.fun Price Prediction 2026 – 2030
Year
Potential Low ($)
Potential Average ($)
Potential High ($)
2026
$0.0019
$0.0036
$0.0053
2027
$0.0026
$0.0050
$0.0091
2028
$0.0039
$0.0075
$0.0142
2029
$0.0056
$0.0134
$0.0259
2030
$0.0088
$0.0260
$0.0430
PUMP.fun Price Prediction 2026
In 2026, market participants will assess whether PUMP.fun can maintain relevance without constant viral amplification. Price action will be driven by platform stickiness, not meme velocity. If the price surges, it could stabilize near $0.0053.
PUMP.fun Price Prediction 2027
By 2027, PUMP.fun could introduce creator monetization tools, improved token analytics, or DAO-driven curation systems. Such upgrades may reduce low-quality launches and improve investor confidence, potentially pushing the price toward $0.0091.
PUMP.fun Price Prediction 2028
The 2028 outlook depends heavily on regulatory adaptation. If PUMP.fun adapts successfully, institutional-grade tooling or integrations with Solana DeFi protocols could drive average prices above $0.0142.
PUMP.fun Price Prediction 2029
In 2029, the platform may be judged as infrastructure rather than entertainment. As Web3 user acquisition matures, PUMP.fun could evolve into a standardized memecoin infrastructure layer.
PUMP.fun Price Prediction 2030
By 2030, PUMP.fun’s success depends on cultural persistence. If it becomes the default experimentation engine for retail crypto, prices may approach $0.0430, assuming sustained demand.
What Does The Market Say?
Year
2026
2027
2030
CoinCodex
$0.0061
$0.0037
$0.0072
pricepredictions
$0.0075
$0.0109
$0.0236
Suncrypto
$0.0035
$0.0065
$0.0350
CoinPedia’s PUMP.fun Price Prediction
After careful analysis, Coinpedia believes PUMP.fun’s long-term value depends more on steady creator activity than short-term hype. If the platform grows from a viral trend into a well-structured launch ecosystem, the token could perform better than expected.
If memecoin interest continues to rise, the PUMP token could climb above $0.0430 by 2030.
Year
Potential Low ($)
Potential Average ($)
Potential High ($)
2026
$0.0019
$0.0036
$0.0053
Never Miss a Beat in the Crypto World!
Stay ahead with breaking news, expert analysis, and real-time updates on the latest trends in Bitcoin, altcoins, DeFi, NFTs, and more.
FAQs
What is PUMP.fun and how does it work?
PUMP.fun is a no-code Solana platform that lets anyone launch memecoins easily, making token creation fast, low-cost, and accessible to first-time users.
Is PUMP.fun (PUMP) a memecoin or a utility token?
PUMP is a utility token tied to the PUMP.fun platform, benefiting from user activity, token launches, and buyback mechanisms rather than pure meme hype.
Can PUMP.fun reach $0.04 or higher by 2030?
It’s possible if PUMP.fun becomes a lasting memecoin infrastructure platform with steady demand, strong revenues, and sustained retail adoption.
Is PUMP.fun a good long-term investment?
PUMP.fun may suit high-risk, long-term investors who believe in creator-driven crypto platforms, but price depends on real usage, not short-term hype.
Price prediction for 2026 targets $0.85, with potential highs of $3.50.
The Pi coin price forecast for 2030 highlights a price target as high as of $22.00
Pi Network’s vision of mobile-based crypto mining attracted millions worldwide, making it a standout community-driven project. However, its lack of exchange listings, limited liquidity, and minimal real-world integration now challenge its sustainability.
As the broader crypto landscape shifts toward utility-based projects and DeFi innovation, Pi Coin struggles to maintain relevance. As a reason, the PI price faced a seamless fall. While social and Google search curiosity still remains high, especially with growing searches like “1 Pi to INR” and “1 Pi to PKR,” the absence of strong fundamentals keeps Pi price recovery uncertain.
This is leaving investors questioning whether this once-hyped token can ever reclaim its lost glory. As a result, the current period aligns perfectly with the current year’s calendar to change soon, making people intrigued towards the PI price prediction for 2026-2030.
Since October, through November, and now into the majority of December, the price of PI has remained stagnant within a defined trading range. With only about 10 days left in the month, it appears that the entire cryptocurrency sector is poised to miss out on the anticipated “Santa Rally” this year.
At present, the price of PI appears to be situated within a defined range. While there is some potential for a minor catalyst to emerge, it seems more likely that any upward movement may only enable the PI/USD pair to approach the resistance level at $0.2816, which represents the upper boundary of its current trading range.
Considering the prevailing market sentiment, it seems more probable that December will conclude with PI continuing to fluctuate within this established range rather than experiencing a significant breakout.
Month
Potential Low ($)
Potential Average ($)
Potential High ($)
Pi Crypto Price Forecast December 2025
$0.10
$0.25
$0.81
Pi Network (PI) Price Analysis 2025
The Pi Network has once again caught the market’s attention after an initial breakout earlier this year, where its price surged to $1.65 in Q2 2025 amid strong hype and expectations of major exchange listings.
This early optimism, fueled by rumors of CEX listings and rising global adoption, briefly positioned Pi Coin as one of the most closely watched tokens in the cryptocurrency market.
However, the excitement faded rapidly once these rumors proved false. From June onward, bearish sentiment took control, sending the token into a steep decline – first to $0.40, then to $0.344 in August, $0.1851 in September, and finally to a new low of $0.1529 in October.
Retail investors are losing confidence, and institutional participation is nearly nonexistent. Pi’s momentum seemed like a vanished project. The investor community reflects this poor performance, with social sentiment for the PI crypto trending negatively. As a result of sustained losses, a “domino effect” of profit-taking was observed, with many investors exiting positions on any minor gains.
Yet, despite the fall, global search interest still continues to rise as users cling to hopes of recovery, anda few developments occurred final quarter of the year that have stopped PI/USD making further lows and started consolidating in a range of $0.19 to $0.28, where a faint rally was witnessed that tested the upper border of this range by late november, which wasn’t strong enough to breakthrough and collapsed again in december and aimed to test lower border of this range.
PI Price Prediction 2026: Potential Scenarios for a Reversal
Pi’s price is firmly positioned within its current consolidation range of $0.19-$0.28, but PI Price prediction 2026 indicates a strong potential for a turnaround ahead.
Despite the challenges faced in December 2025, where the bear market suppressed the momentum across the entire crypto sector, we’ve observed that no altcoin has managed to stage a rally as anticipated. This was largely due to a lack of liquidity, with new investors still remaining cautious following the significant market downturn on October 10, 2025, which has understandably left many feeling apprehensive about the power of the bears.
However, the outlook as we approach the new year is optimistic. Confidence is building for Q1 2026, and many anticipate a substantial rally to manifest during this period. Current trends suggest that the Pi price could even surge past the 200-day EMA band, which is now around $0.4102.
Pi Coin Price Targets 2026 – 2030
Year
Potential Low ($)
Potential Average ($)
Potential High ($)
2026
$0.85
$2.25
$3.50
2027
$1.25
$3.25
$5.25
2028
$2.00
$5.50
$8.50
2029
$3.50
$8.50
$13.75
2030
$5.50
$13.75
$22.00
Pi Crypto Price Forecast 2026
The Pi crypto prediction for the year 2026 could range between $0.85 to $3.50. Considering the buying and selling pressure, the average price could be around $2.25 for that year.
Pi Coin Price Prediction 2027
During 2027, the Pi network value could reach a maximum trading value of $5.25 with a potential low of $1.25. Evaluating the market sentiments, the average price of this altcoin could settle at around $3.25.
Pi Token Price Projection 2028
By 2028, the value of a single Pi coin price could reach a maximum of $8.50 with a potential low of $2.00. With this, the average price could land at around the $5.50 mark.
Pi Network Price Analysis 2029
Looking forward to 2029, the Pi coin Price may range between $3.50 and $13.75, and a potential average value of around $8.50.
Pi Network Price Prediction 2030
As per our Pi Coin Price Prediction 2030, the Pi coin value in 2030 could reach a high of $22.00. However, the viral altcoin could record a low of $5.50 and an average price of $13.75, if the crypto market turns bearish.
Market Analysis
Firm Name
2025
2026
2030
CoinCodex
$ 2.08
$ 1.48
$ 2.63
priceprediction.net
$1.08
$1.61
$6.74
DigitalCoinPrice
$107.98
$125.57
$265.95
*The aforementioned targets are the average targets set by the respective firms.
Conclusion
The Pi Network’s recent developments—from major token accumulation and Banxa integration to Binance listing rumors—are clear indicators that Pi is no longer just a test project. As market conditions turn favorable and institutional interest grows, Pi Coin is entering a new phase of maturity.
Never Miss a Beat in the Crypto World!
Stay ahead with breaking news, expert analysis, and real-time updates on the latest trends in Bitcoin, altcoins, DeFi, NFTs, and more.
FAQs
Will Pi Network price recover in 2026?
Pi may recover in 2026 if liquidity improves, exchange listings expand, and overall crypto market sentiment turns bullish.
What is the Pi price prediction for 2026?
Pi price prediction for 2026 suggests a range between $0.85 and $3.50, depending on adoption progress and market momentum.
Can Pi Coin reach $1 again?
Yes, Pi can reach $1 if buying demand strengthens and the token breaks out of its long-term consolidation range.
What is the Pi Network price prediction for 2030?
Pi Network price prediction for 2030 targets a potential high near $22.00 if ecosystem growth and real-world utility improve.
Is Pi Coin a good long-term investment?
Pi carries high risk due to limited utility and listings, but long-term upside depends on successful integration and network adoption.
The live price of the Near Protocol token is $ 1.55062501.
Price predictions for 2026 range from $3.70 to $11.80.
NEAR price may reach a high of $71.78 by 2030.
As altcoin momentum intensifies, Near Protocol (NEAR) is rapidly emerging as a standout contender in the crypto space. Fueled by strong fundamentals and recent bullish market trends, NEAR’s rise has caught the attention of both retail and institutional investors.
With NEAR now bridging to Solana and TON via Chain Signatures, the future looks promising. Wondering where it’s headed next? Dive into our in-depth NEAR Price Prediction 2026 – 2030 to uncover the possibilities.
NEAR/USD is currently experiencing a notable decline, trading below $2.00, with robust support anticipated around the $1.05 level. Given the current downward trend, it’s highly probable that the price will approach $1.05.
This price point has historically been a strong demand zone, as evidenced by a rally that occurred from this level in late 2024. Therefore, we can expect December to continue this downward movement until it stabilizes, likely concluding around the $1.05 mark.
Month
Potential Low ($)
Potential Average ($)
Potential High ($)
NEAR Crypto Price Prediction December 2025
1.0
2.75
3.50
NEAR Price Analysis 2025
The NEAR Protocol has undergone a notable evolution over the past two years, highlighted by a remarkable peak price of $9 in early 2024. Following this peak, the asset saw a significant retracement to support level around $3.50. However, during early 2025, a sell-off worsened resulting in a decline to $2.00.
The latter half of 2025 showed limited positive movement, too after the muted H1, as the NEAR/USD pair demonstrated only resilience by consolidating within a defined range of $1.90 to $3.40, though a strong demand for recovery was not evident.
Unfortunately, the situation took a downturn again as the December led another breach to downside, and it breached the long-standing support area of $1.90 to $2.00 and is now approaching lower support levels around $1.05. As a result, the outlook for December appears to lean more towards bearish sentiments.
NEAR Price Prediction 2026
If demand begins to materialize in the NEAR protocol price around the $1.05 support level, which has shown signs of stabilization, followed by a rally in late 2024. This zone lets us predict, based on this hypothesis, that the first quarter of 2026 may present a compelling opportunity for investors.
This price point serves as a significant technical level that correlates with the robust past rally; therefore, when market sentiment shifts decisively in favor of bullish trends, this asset is likely to rise.
Investors who enter at this juncture could potentially capitalize on a favorable market trajectory, should the underlying conditions remain promisingly bullish by then.
Year
Potential Low
Potential Average
Potential High
2025
$1.95
$4.34
$9.00
NEAR Price Targets December 2025
NEAR/USD is currently experiencing a notable decline, trading below $2.00, with robust support anticipated around the $1.05 level. Given the current downward trend, it’s highly probable that the price will approach $1.05.
This price point has historically been a strong demand zone, as evidenced by a rally that occurred from this level in late 2024. Therefore, we can expect December to continue this downward movement until it stabilizes, likely concluding around the $1.05 mark.
Month
Potential Low ($)
Potential Average ($)
NEAR Crypto Price Prediction December 2025
1.0
2.75
Near Protocol Price Prediction 2026 – 2030
Year
Potential Low ($)
Potential Average ($)
Potential High ($)
2026
3.70
7.75
11.80
2027
5.32
11.80
18.28
2028
7.91
18.28
28.65
2029
12.06
28.65
45.24
2030
18.70
45.24
71.78
NEAR Crypto Price Prediction 2026
According to our analysts, Near Protocol’s price projection, the price could range between $3.70 and $11.80, with an average trading price of around $7.75.
Near Protocol (NEAR) Price Prediction 2027
Looking forward to 2027, NEAR’s price could range between $5.32 and $18.28, and an average forecast price of $11.80.
Near Protocol Crypto Price Prediction 2028
In 2028, the price of a single Near Protocol token could range between $7.91 and $28.65, with an average price of $18.28.
NEAR Price Prediction 2029
By the end of 2029, NEAR’s price could range between $12.06 as its low and $45.24 as its high, with an average trading price of $28.65.
Near Protocol Price Prediction 2030
In 2030, Near Protocol price may touch its lowest price at $18.70, hitting a high of $71.78 and an average price of $45.24.
What Does The Market Say?
Firm Name
2025
2026
2030
Wallet Investor
$3.19
$4.40
$22.30
priceprediction.net
$3.98
$5.92
$28.62
DigitalCoinPrice
$5.95
$6.93
$14.80
*The targets mentioned above are the average targets set by the respective firms.
CoinPedia’s NEAR Price Prediction
In the long run, we at Coinpedia expect the NEAR to outperform its current rally. With rising bullish sentiment, the Near Protocol coin may hit its potential high of $6.75 this year. In contrast, the digital token might stumble down to the low of $1.69.
Year
Potential Low
Potential Average
Potential High
2025
$1.69
$4.22
$6.75
Never Miss a Beat in the Crypto World!
Stay ahead with breaking news, expert analysis, and real-time updates on the latest trends in Bitcoin, altcoins, DeFi, NFTs, and more.
FAQs
What Is Near Protocol?
The protocol promotes the network of computers running a platform for developers to create and launch dApps.
How much is 1 Near Protocol Coin worth?
At the time of writing, the price of 1 NEAR was $ 1.55031861.
What is the NEAR price prediction for 2026?
NEAR price forecasts for 2026 suggest a range between $3.70 and $11.80, depending on adoption growth and market momentum.
What is the NEAR Protocol price prediction for 2030?
NEAR Protocol price prediction for 2030 points to a potential high near $71.78 if long-term adoption and ecosystem growth continue.
Is NEAR Protocol a good long-term investment?
NEAR offers long-term potential due to its scalable design, developer adoption, and cross-chain expansion, but price volatility remains.
What factors influence NEAR price the most?
NEAR price is driven by ecosystem growth, network activity, market liquidity, investor sentiment, and overall crypto market trends.
The live price of the MANA crypto token is $ 0.11957751.
Price predictions for 2026 range from $0.247 – $0.40.
By 2030, the MANA price could surge toward $4.90 due to growing trader activity.
Decentraland (MANA) is one of the earliest and most recognizable names in the metaverse sector. Built on Ethereum, Decentraland allows users to own virtual land, create experiences, and participate in a digital space using its native token, MANA.
While the overall metaverse narrative has cooled since its 2021 peak, Decentraland continues to maintain an active ecosystem focused on virtual events, social experiences, and creator-led development.
If you’re curious about Decentraland’s future and wondering whether MANA is a good investment, this MANA price prediction 2026–2030 will walk you through its potential growth and long-term outlook.
The Decentraland (MANA) price has navigated a bearaish path, tumbling down to a concerning low of $0.1903 on April 6, 2025. This dip raised alarms among investors and market analysts, indicating a period of uncertainty within the cryptocurrency space.
However, it tried demonstrating resilience, as Decentraland showed a comeback spike, with the price surging to $0.3935 by mid-May.
Unfortunately, this wave of optimism proved to be fleeting and remained brief. As May progressed into June, the MANA price encountered substantial headwinds. The cryptocurrency experienced a sharp decline, plummeting nearly 38% from its mid-May high of $0.40.
This downturn reflects broader market trends and possibly the influence of external factors such as regulatory developments and shifts in market sentiment, leaving investors to grapple with volatility in the crypto market. The days are very few that remains to close this year and most people expect to windup bearish.
MANA Price Prediction December 2025
Throughout this year, the price of MANA has experienced a challenging and volatile trajectory, resulting in significant disappointment among many investors and traders.
As we approach the final days of 2025, the market sentiment remains pessimistic, with MANA potentially continuing its downward trend if the current lack of buying strength persists.
Analysts have noted a significant decline in trading volume, which suggests that investor confidence is waning. Without a resurgence in demand or positive market catalysts, MANA/USD may struggle to recover in December.
MANA Price Targets For January 2026
Throughout this year, MANA has faced strong selling pressure, leaving many traders disappointed. After peaking near $0.59 in early 2025, the price has fallen by over 70%, reaching a low of $0.159 by late November.
As we approach 2026, MANA’s recovery will depend on user activity, virtual land demand, and content creation within Decentraland.
Strong on-chain activity could support a slow rebound, while weak user growth may keep prices under pressure.
Technical Analysis
Looking at the MANA/USDT 4-hour chart, the price is trading near $0.134, staying below key moving averages and the middle Bollinger Band, which confirms sellers remain in control.
On the upside, the upper Bollinger Band near $0.15 is acting as strong resistance. A clear move above $0.15 is could open the door for MANA to hit $0.23 by the end of jan 2026.
On the downside, immediate support lies around $0.13. If this level breaks, the price could slide further toward $0.110, a key demand zone.
The RSI sits near 27, indicating oversold conditions. While this may allow a short-term bounce, a real trend change will require stronger buying volume.
Month
Potential Low ($)
Potential Average ($)
Potential High ($)
MANA Crypto Price Prediction January 2026
$0.110
$0.172
$0.239
Decentraland (MANA) Price Prediction 2026
The year 2026 may be pivotal for Decentraland as the platform competes with newer immersive ecosystems and Web3 gaming environments.
MANA’s valuation will depend on whether Decentraland can expand beyond virtual land speculation into consistent user engagement, such as branded experiences, concerts, conferences, and creator monetization tools
If these changes translate into higher engagement, MANA could target a yearly high around $0.35–$0.40, representing a recovery move while still trading far below its 2021 peak of $5.90.
Year
Potential Low ($)
Potential Average ($)
Potential High ($)
Decentraland (MANA) Price Prediction 2026
$0.110
$0.247
$0.40
Decentraland MANA Price Prediction 2026 – 2030
Year
Potential Low ($)
Potential Average ($)
Potential High ($)
2026
$0.110
$0.247
$0.40
2027
$0.160
$0.372
$0.75
2028
$0.314
$0.820
$1.41
2029
$0.0.561
$1.37
$2.8
2030
$0.849
$2.38
$4.92
MANA Price Prediction 2026
In 2026, MANA’s price will primarily depend on the level of activity in Decentraland. If the platform improves its design, runs more events, and attracts more users, demand for MANA could rise, pushing its price towards $0.40
MANA Price Prediction 2027
By 2027, more companies and people may use virtual spaces for meetings, events, and work. If Decentraland becomes useful for these purposes, MANA could see stronger demand. In this case, the price may rise to around $0.75.
MANA Price Prediction 2028
In 2028, growth may come from gaming and creator tools. If Decentraland adds better games, rewards creators, and connects with other Web3 projects, more users may join. If adoption improves, the price may rise to $1.41.
MANA Price Prediction 2029
By 2029, better AR and VR technology could bring new interest to virtual worlds. If Decentraland keeps building and users stay active, MANA could climb higher towards $2.8.
MANA Price Prediction 2030
In 2030, MANA’s future depends on whether virtual worlds become part of daily life. If people use them for social, work, and business needs, demand for MANA could grow strongly.
What Does The Market Say?
Year
2026
2027
2030
CoinCodex
$0.26
$0.39
$0.67
Tokenmetrics
$0.78
$1.41
$2.11
DigitalCoinPrice
$0.33
$0.61
$3.32
CoinPedia’s Decentraland (MANA) Price Prediction
Decentraland’s future depends on real user engagement rather than speculative land demand. If the platform evolves alongside advancements in AR/VR and digital commerce, MANA could outperform conservative expectations over the long term.
As per Coinpedia’s formulated price prediction, the MANA crypto price could hit a potential high of $0.40 in 2026.
Year
Potential Low ($)
Potential Average ($)
Potential High ($)
2026
$0.110
$0.247
$0.40
Never Miss a Beat in the Crypto World!
Stay ahead with breaking news, expert analysis, and real-time updates on the latest trends in Bitcoin, altcoins, DeFi, NFTs, and more.
FAQs
What is Decentraland (MANA) and how does it work?
Decentraland is a virtual world on Ethereum where users buy land, create experiences, and trade using the MANA token.
How much could MANA be worth by 2026?
MANA may range from $0.11 to $0.40 in 2026, depending on platform adoption, events, and user engagement.
What drives the price of MANA?
MANA’s price is influenced by virtual land demand, user growth, creator tools, and on-chain activity in Decentraland.
Can Decentraland compete with other metaverse projects?
Yes, if Decentraland expands events, gaming, and creator tools, it could attract more users and remain a top metaverse platform.
James Howells, who accidentally had his hard drive containing 8,000 Bitcoin thrown away, offered his advice to industry newcomers, veterans and skeptics in 2026.
The Crypto Fear & Greed Index is hovering at levels lower than during the shock FTX collapse in late 2022, despite Bitcoin trading at roughly five times the price.
Price predictions for 2025 range from $1.10 to $4.18.
Long-term forecasts suggest potential highs of $35.60 by 2030.
WLD price was almost $12 ATH but went crashing to $0.50 in the last remaining days of 2025. This has raised concerns among investors and traders about WLD’s future, and as a result, the Worldcoin price prediction 2026 has become a topic of significant discussion, with many being intrigued about its prospects in the coming year.
Its prolonged period of downtrend has left many wondering if the project’s initial buzz was fading. But, behind the scenes, Worldcoin is still quietly building its platform. Now, experts view Q1 2026 as a potential turning point where renewed momentum could be observed.
So many are now asking a crucial question: is this the start of a new chapter for Worldcoin? Will the project’s focus on decentralized identity and its connection to the AI sector be enough to fuel a powerful comeback and reclaim its spot in the market spotlight?
Let’s delve into the anticipated Worldcoin price predictions 2026 to 2030 and the years to come.
As per Coinpedia’s Worldcoin Price Prediction, marketers’ optimism and the involvement of high-profile figures could significantly boost Worldcoin’s potential value.
Further, this credibility and backing, combined with a potential increase in trading volume, could drive the price of WLD Coin to an impressive $5.89by the end of 2025.
If the market faces external pressures, then it could potentially drive the price down to a low of $1.61.
Price Prediction
Potential Low ($)
Average Price ($)
Potential High ($)
2025
1.61
3.25
5.89
WLD Price Target December 2025
The analysis of Worldcoin’s price indicates that the asset is currently encountering significant challenges and is undergoing a period of consolidation. This situation persists despite the recent announcement of a 0.25% basis point rate cut on December 10th, which did not result in a corresponding price increase. Additionally, the brief period of pessimism regarding a Bank of Japan rate hike has not contributed any major drawdown to the market sentiment, as well.
This indicates that any potential appreciation of the WLD price is contingent upon genuine demand from investors, which has yet to recover from previous declines. Currently, the likelihood of any momentum resurgence occurring in December appears minimal; however, the probability of WLD/USD remaining around the $0.50 mark seems considerably high.
Month
Potential Low ($)
Average Price ($)
Potential High ($)
Worldcoin Price Forecast December 2025
0.57-1.00
1.60
2.50
Worldcoin Price Analysis 2025
Over the past two years, Worldcoin (WLD) has faced a challenging period characterized by declining price action on its weekly chart. However, this downward momentum ceased around mid-2025 as the token stopped establishing new lows. By September 2025, WLD even attempted to break the long-term bearish trend by briefly moving past the $2.12 level, but ultimately failed to sustain the move.
The beginning of the new quarter was marked by a pessimistic atmosphere, characterized by a massive market-wide liquidation event. This shock sent the WLD price plummeting to its lowest support area, dropping dramatically to $0.27.
However, the price did not stay at this low level for long; it was quickly bought by investors who saw it as a significant discount. On the chart, this behavior strongly indicates a “shake-out” of weaker investors.
However, despite this, WLD failed to maintain its bullish momentum and continued to decline in November. As the FOMC cut rates with uncertainty for December, and this time in December, they also cut rates by maintaining the uncertainty, despite the year coming to a close.
This prevented its price from gaining any momentum, but it has led to a reversal, pushing its price back to the lower border of the long-term falling wedge pattern. It seems 2025 would close consolidating at this lower border.
Worldcoin Price Prediction 2026
Based on its current consolidation, the falling wedge is on track to establish a strong position in December, likely setting the stage for a substantial boost in Q1 2026.
When it breaks the upper boundary of the falling wedge, coinciding with resistance around $1.32, we can expect a powerful rally to unfold. If it surpasses $1.32 in Q1 2026 and firmly breaks the $2.21 level, turning it into confirmed support, it will signal a significant “Change of Character” (ChoCh) in the long-term bearish trend. This confirmed ChoCh will pave the way for a remarkable price surge, targeting a retest of the $4.18 level by the end of 2026.
Price Prediction
Potential Low ($)
Average Price ($)
Potential High ($
2026
0.57-1.00
2.12
4.18
WLD Price Forecast 2026 – 2030
Year
Potential Low ($)
Average Price ($)
Potential High ($)
2026
2.50
6.00
9.50
2027
7.00
11.25
15.70
2028
10.75
15.95
21.15
2029
15.65
21.60
27.50
2030
19.75
27.75
35.60
This table, based on historical movements, shows Worldcoin price to reach $35.60 by 2030 based on compounding market cap each year. This table provides a framework for understanding the potential Worldcoin price movements. Yet, the actual price will depend on a combination of market dynamics, investor behavior, and external factors influencing the cryptocurrency landscape.
Market Analysis
Firm Name
2025
2026
2030
Swapspace
$0.85
$1.30
$2.07
coincodex
$3.36
$2.40
$4.30
DigitalCoinPrice
$2.57
$3.02
$4.06
*The targets mentioned above are the average targets set by the respective firms.
Never Miss a Beat in the Crypto World!
Stay ahead with breaking news, expert analysis, and real-time updates on the latest trends in Bitcoin, altcoins, DeFi, NFTs, and more.
FAQs
What is Worldcoin?
Worldcoin is a cryptocurrency project aiming to distribute digital assets to a global audience through a unique identity-verification system.
What is the current price of 1 Worldcoin?
At the time of writing, the price of one WLD token was $ 0.00349731.
What is the Worldcoin price prediction for 2026?
WLD price forecasts for 2026 suggest a potential range between $2.50 and $9.50, depending on market recovery and technical breakouts.
Is Worldcoin a good long-term investment?
Worldcoin offers long-term potential due to its focus on decentralized identity and AI, but it remains volatile and requires risk awareness.
What factors influence WLD price the most?
WLD price is driven by AI narrative strength, user adoption, token supply dynamics, market sentiment, and overall crypto market trends.
The live price of The Graph crypto is $ 0.03623114.
Price predictions for 2026 range from $0.05 to $1.75.
In 2030, GRT may hit a high of $3.55, reflecting long-term growth.
AI may be taking center stage in today’s tech revolution, but behind every smart application lies the challenge of accessing and organizing reliable data. That’s where The Graph (GRT) steps in—an innovative indexing protocol transforming how blockchain data is queried.
As interest in The Graph surges, especially after its major 2025 upgrades and the launch of substreams-powered subgraphs, the question on everyone’s mind is: Can GRT price reach $1? In this article, we break down its technical potential, rising developer adoption, and market sentiment in our detailed The Graph Price Prediction 2026–2030.
The Graph (GRT) Analysis 2025 Displays Muted Price Action
The Graph Network has recently improved its fundamental growth, yet this strength is sharply diverging from its prolonged bearish GRT price action.
The network, is majorly used by developers and data consumers who pay to query data, is flourishing, per onchain. yet, the GRT remains significantly suppressed, presenting a notable contrast that is at the heart of its current analysis.
Why On-Chain Hints Flourishing Network and Ecosystem Growth In “The Graph”?
As per the data onchain, the performance of The Graph Network can be directly assessed by the growing “volume of queries” and the “accrual of query fees”.
In this context, the data reveals that over the last six months, its query volume has impressively reached 11.6 billion, which displays a clear sign of robust developer adoption that has been particularly fast since the network’s migration to Arbitrum.
Similarly, the query fees generated by data consumers on Arbitrum have also reached an all-time high of $8.11 million in August.
This success is supported by a large community of over 167,000 delegators and 7,204 active curators, all contributing to the network’s health.
In addition, the growing ecosystem is also in the spotlight by recent integrations with major brands like Tron, pointing to a strengthening on a fundamental level.
GRT Price Chart History (2021-2025)
Despite having strong fundamentals holding its ground, the Graph (GRT) token has seen a muted price journey. It’s currently down more than 80% from its 2024 peak and over 95% from its all-time high in 2021. This disconnect between its price and its core strength is a key point of technical analysis.
Since the 2021 crash, GRT has been declining on its monthly chart and reached $0.055 by 2022 end. Then in the beginning of 2023 started rising and reached $0.49 in March 2024. Since then, the price of GRT has continued a multi-month correction.
Currently, GRT is in a prolonged downtrend that has lasted several months on the weekly chart from the last seen high of $0.49 in early 2024. But, the expectations were strong when it hit the late 2022 support area. It was expected that with a weekly consolidation, the price could rise, as prices often respond to previous demand areas, but it has lost this level in December, making things worse for GRT price action
GRT Price Prediction 2025 December
In 2025, the GRT/USD pair has experienced a decline, yet it has approached a significant dynamic support trendline on the weekly chart for GRT. Nevertheless, demand remains insufficient, which raises the possibility of continued trading along this support level.
This situation is largely attributed to unfavorable macroeconomic conditions and a prevailing atmosphere of excessive caution within the market, which has contributed to the suppression of GRT prices.
The price prediction for GRT in 2025 indicates that it is likely to conclude the year below $0.040.
GRT Price Prediction 2026
Moreover, the challenges faced in 2025 were significant, yet the trajectory for the future is becoming clearer as we move into 2026.
A detailed analysis of market patterns reveals that it is strategically sidestepping major demand areas. This suggests a deliberate approach to liquidate a larger number of long positions, paving the way for an upcoming future rally.
This presents an exciting opportunity for a substantial upward movement in prices, likely to materialize in Q1 of 2026. The potential for a strong reversal is high, with expectations of retesting critical levels around $0.20 or even reaching $0.34 early in Q1 2026.
Year
Potential Low ($)
Potential Average ($)
Potential High ($)
2026(weak demand case)
0.05
0.20
0.34
2026(strong demand case)
1.05
1.20
1.75
GRT Coin Price Prediction 2026-2030
Year
Potential Low ($)
Potential Average ($)
Potential High ($)
2026
1.05
1.20
1.75
2027
1.55
1.70
2.15
2028
2.15
2.20
2.65
2029
2.25
2.70
3.25
2030
3.15
3.20
3.55
What Does The Market Say?
Firm Name
2026
2030
Changelly
$0.320
$1.89
priceprediction.net
$0.493
$2.26
DigitalCoinPrice
$0.27
$0.58
Never Miss a Beat in the Crypto World!
Stay ahead with breaking news, expert analysis, and real-time updates on the latest trends in Bitcoin, altcoins, DeFi, NFTs, and more.
FAQs
What is the price of 1 GRT Token?
At the time of writing, the price of 1 The Graph Token was $ 0.03623114
What is the price prediction for GRT in 2026?
GRT price in 2026 may range from $0.05 in weak demand to $1.75 in strong demand, with an average target near $1.20.
What could The Graph (GRT) be worth in 2030?
By 2030, GRT could trade between $3.15 and $3.55 if adoption continues and the protocol becomes a core data layer for Web3.
Is The Graph (GRT) a good long-term investment?
GRT has strong fundamentals, growing developer adoption, and real utility, making it a promising long-term project, though price volatility remains high.
Can GRT reach $1?
Yes, based on network growth and adoption, some projections suggest GRT could reach between $1.05 and $1.75 by 2026, though market conditions will ultimately determine its price path.
The live price of the Polygon coin is $ 0.21819891.
POL price predictions for 2026 suggest potential highs of $0.7548.
Long-term forecasts indicate POL could reach $4.94 by 2030.
Polygon (POL) has a mind-blowing Layer-2 scaling solution project for Ethereum, which is primarily designed to address slow speeds and the network’s high transaction fees.
As a result, Polygon is seen as a revolutionary framework for developers and users, as it attracts by offering a more efficient Ethereum experience, which is the reason contributing to POL’s price value, too.
Through, POL, which is its native token (formerly MATIC), is utilized for transaction fees and network governance, in the framework of interconnected Ethereum-compatible blockchain networks.
Its use case makes it an attractive altcoin, and even its token POL price is attracting attention. The coin is expected to show a surge in the coming sessions, but it would require a technical eye to understand.
Therefore, if you are curious about whether the POL price can rebound to $1. Will Polygon go up? And is Polygon a good investment? We bring our Polygon Price Prediction for 2025 – 2030 to explore the POL price prediction.
Polygon price outlook December 2025 (POL) has demonstrated significant volatility. The bullish momentum that built up prior to the FOMC meeting on December 10th was abruptly halted. Even with the bearish news from Bank of Japan’s announced 0.25% rate hike, which was initially a cause for concern, the market absorbed the news without any major immediate bearish reaction.
However, the ongoing lack of improvements in liquidity is hindering any substantial price movement. This extended period of stagnation is negatively affecting investor sentiment and leading to heightened caution within the market.
If the current trend in the market continue as they have, it’s important for investors and stakeholders to prepare for the possibility of further downward pressure on prices. It suggests that we may witness a continued decline, which raises concerns about the overall stability as whole for the asset.
Specifically, projections indicate that by December 2025, prices could potentially dive down to around the $0.10 mark. This estimation is based on ongoing analysis of market behaviors, economic indicators, and external influences that could further worsen volatility.
Month
Potential Low ($)
Potential Average ($)
Potential High ($)
Polygon Price Action December 2025
$0.10
$0.20
$0.40
POL Token Analysis 2025
Throughout 2025, the POL token (formerly known as MATIC) has faced a dramatic decline, plummeting over 80% from its peak of $0.76. This significant downturn has been largely attributed to a range of broader macroeconomic factors that has created cautious investor sentiment towards cryptocurrencies.
This pessimistic period marked POL’s steepest losses of the year, particularly worsened by negative news cycles and regulatory developments affecting the crypto market.
Despite initial bullish sentiments and optimistic forecasts for the third quarter, which fueled hopes of a potential recovery, the price trajectory shifted dramatically. Starting in mid-September, POL/USD began to see sharp declines that effectively dashed hopes for a rebound.
As of December, the token has entered a low-momentum phase characterized by a very narrow downward channel, indicating persistent bearish pressure. Current market conditions suggest that this downward trend may continue, as analysts remain cautious about potential external shocks and ongoing volatility in the crypto landscape. Investors are left to speculate whether a turnaround is feasible in the near future, or if further declines are on the horizon in most of December, especially.
Polygon Price Prediction 2026
The POL/USD trading pair is currently at a critical juncture. If the current downward trend continues, prices may face significant further declines. However, there is still a potential opportunity for a rebound, which could allow POL to climb back above the crucial $0.15 threshold. This upward movement is contingent on the breaking of the falling wedge pattern.
As we approach the end of December and Q1 2026 will begin, the importance of this moment cannot be overstated. Traders and analysts will be closely monitoring market sentiment, volume indicators, and key support levels to assess the likelihood of a breakout.
A successful breach of the falling wedge could signify renewed buying interest and may set the stage for a more robust recovery in prices, making this period pivotal for future momentum in the market.
Polygon Price Prediction 2026 – 2030
Year
Potential Low ($)
Potential Average ($)
Potential High ($)
Polygon Price Action 2026
$0.18870
$0.47179
$0.75488
POL Price Prediction 2027
$0.30194
$0.75488
$1.20782
Polygon Crypto Price Forecast 2028
$0.48311
$1.20782
$1.93252
POL Coin Price Projection 2029
$0.77297
$1.93252
$3.09205
Polygon Price Prediction 2030
$1.23676
$3.09205
$4.94729
This table, based on historical movements, shows POL price to reach $4.94 by 2030 based on compounding market cap each year. This table provides a framework for understanding the potential POL price movements. Yet, the actual price will depend on a combination of market dynamics, investor behavior, and external factors influencing the cryptocurrency landscape.
Polygon Price Action 2026
Anticipating further expansion, MATIC’s potential high for 2026 is projected to be $0.75488, while the potential low is estimated at $0.18870, resulting in an average price of $0.47179.
POL Price Prediction 2027
MATIC crypto can make a potential high of $1.20782 in 2027, with a potential low of $0.30194, leading to an average price of $0.75488.
Polygon Crypto Price Forecast 2028
As the POL price progresses, the potential high price for 2028 is projected to be $1.93252, with a potential low of $0.48311, resulting in an average price of $1.20782.
MATIC Coin Price Projection 2029
Polygon coin price potential high for 2029 could be $3.09205, while a potential low of $0.77297, with an average price of $1.93252.
Polygon Price Prediction 2030
With an established position in the market, POL’s potential high for 2030 is projected to be $4.94729. On the flip side, a potential low of $1.23676 will result in an average price of $3.09205.
Market Analysis
Firm Name
2025
2026
2030
CoinCodex
$ 0.71
$ 0.50
$ 0.90
Binance
$0.24
$0.26
$0.31
Flitpay
$6.25
$4
$10.4
Never Miss a Beat in the Crypto World!
Stay ahead with breaking news, expert analysis, and real-time updates on the latest trends in Bitcoin, altcoins, DeFi, NFTs, and more.
FAQs
Is Polygon (POL) a good long-term investment?
Polygon is considered a strong long-term project due to its Ethereum scaling role, active development, and growing ecosystem, but it still carries market risk.
What is the Polygon price prediction for 2026?
For 2026, POL price forecasts suggest a potential range between $0.10 and $0.75, depending on market recovery and technical breakout patterns.
Can Polygon reach $5 by 2030?
Some long-term projections indicate POL could approach $4–$5 by 2030 if adoption accelerates and the crypto market enters a sustained growth cycle.
What factors affect Polygon (POL) price the most?
POL price is influenced by Ethereum demand, network usage, market liquidity, macroeconomic trends, and overall investor sentiment in crypto markets.
A security issue in the Trust Wallet browser extension has led to the loss of nearly $6 million in crypto, raising serious concerns among users during the Christmas period.
The problem affects Trust Wallet Browser Extension version 2.68 only, according to an official statement from Trust Wallet. Mobile app users and people using other extension versions are not affected.
What Happened?
On December 24, a flaw was discovered in version 2.68 of the Trust Wallet browser extension. By December 25, on-chain data showed that funds were being drained from multiple wallets across Bitcoin, Ethereum, and Solana networks.
Yes $6M+ stolen at minimum from hundreds of Trust Wallet users.
Hopefully they will offer compensation to everyone if it’s determined they’re at fault for the incident.
It’s difficult to map out since there’s many theft addresses.
Blockchain investigator ZachXBT reported receiving messages from hundreds of users who said their wallet balances suddenly dropped. Community researchers later found suspicious code in the extension that appeared to send wallet data to a fake website, allowing attackers to access funds.
Trust Wallet Confirms the Issue
Trust Wallet confirmed the security incident and said the issue is limited to version 2.68 of the browser extension. The company asked users to stop using that version immediately and upgrade to version 2.69, which it says is safe.
Trust Wallet also said its support team is already contacting affected users and investigating what happened. So far, there has been no official confirmation about compensation, though impacted users are being guided through next steps.
What To Do If You Are Affected
If you use the Trust Wallet browser extension, here’s what you should do right away:
1. Do not open the Trust Wallet extension on your desktop. This helps prevent further risk.
2. Disable the extension immediately. Go to your Chrome extensions page and switch Trust Wallet off.
3. Update to version 2.69 only from the official Chrome Web Store. After updating, check the version number to confirm it shows 2.69.
4. Contact Trust Wallet support. If your funds are missing, reach out to Trust Wallet’s official support page and report the issue.
Why This Matters
This incident shows the risks of browser-based crypto wallets, especially when malicious code slips into updates. Even trusted tools can become targets, and small delays in updating can lead to big losses.
Trust Wallet says it will share more updates as they become available.
Prediction markets are moving into crypto’s mainstream as Crypto.com’s in-house market maker raises fairness questions and Coinbase doubles down on growth.
Cardano founder Charles Hoskinson has shared his thoughts on how Ethereum and Solana may perform as the crypto market moves toward 2026. His comments show the different strengths and challenges facing both blockchains.
Hoskinson said that Solana has better growth potential in the short term. He explained that Solana can move faster when it comes to adopting new technology and making upgrades. This is partly because its leadership structure allows quicker decision-making.
Solana has focused heavily on speed and scalability, which has helped it handle a large number of transactions. Today, it leads many blockchains in daily transaction volume, showing strong network activity and user demand.
Where Solana Still Lags Behind Ethereum
Despite its speed, Solana still trails Ethereum in important areas. Hoskinson pointed out that Solana’s total value locked (TVL) and stablecoin usage are far smaller than Ethereum’s. In fact, Solana is estimated to have only about one-tenth of Ethereum’s size in these categories.
This means that while Solana is growing quickly, it still has significant ground to cover before it can match Ethereum’s broader financial ecosystem.
Ethereum’s Long-Term Vision and Research Focus
Hoskinson described Ethereum as a platform that has become a victim of its own success. Because it supports a massive ecosystem, making changes takes more time. However, Ethereum continues to invest heavily in research, especially in areas like zero-knowledge proofs and advanced scaling solutions.
He said Ethereum is working toward a future where blockchains rely more on cryptographic proofs instead of simple transaction checks. This would allow Ethereum to act as a global verification layer for many networks, including Layer 2 solutions.
A Slower Path, But a Stronger Long-Term Direction
While Ethereum may need to adjust its strategy again, Hoskinson believes its overall direction is correct. He compared this to past upgrades that took longer than expected but eventually strengthened the network.
In the long run, he sees Ethereum’s proof-based model as a better solution for building systems that can scale to internet-level demand.
Final Take: Speed vs Strategy
Hoskinson summed it up by saying Solana may have the advantage in the short term due to speed and flexibility. Ethereum, on the other hand, could win over the long term because of its research-driven approach and long-range vision.
Both networks remain major players, each taking a different path as the blockchain industry continues to grow.
Bitcoin has seen very little movement in the past 24 hours, with prices trading in a narrow range as the holiday season keeps activity low. Market conditions remain calm, and there have been no major breakouts so far.
At the time of writing, Bitcoin is holding above an important short-term support zone near $85,500. As long as the price stays above this level, the overall short-term outlook remains stable. Another level to watch is $84,400, which marked a recent low earlier this month. A drop below that level could weaken the current recovery attempt.
Holiday trading is typically slow, and analysts are not expecting strong price action through Christmas and into the weekend. With Friday, Saturday, and Sunday often seeing lower volumes, Bitcoin may continue to move sideways in the near term.
For signs of strength, experts are looking whether whether Bitcoin can move above $88,350, which was the last short-term high. A clear break above that level would suggest growing buying interest. The next major resistance sits around $90,550. If Bitcoin manages to climb above both levels, attention would likely shift to higher resistance near $96,900.
For now, the advantage of the current market setup is clarity. Support and resistance levels are well defined, making it easier for traders to manage risk. While there is still a chance Bitcoin could briefly dip lower, the fact that prices are holding above the current support range keeps the short-term outlook constructive.
Overall, Bitcoin appears to be in a waiting phase. Bigger moves may not arrive until after the holidays, when trading volumes return and market participation increases. Until then, experts are closely watching whether support continues to hold and whether Bitcoin can slowly build momentum into the final days of the year.
Ethereum is preparing for major network upgrades in 2026 that could transform how the blockchain works. According to recent developer roadmap updates shared in late 2025, Ethereum is planning two major protocol upgrades in 2026, the Glamsterdam fork and the Heze-Bogota fork.
These upgrades target faster transactions, stronger privacy, and better decentralization, helping the ETH token price rally ahead.
Glamsterdam Fork Targets Speed and Higher Gas Limits
One of the key upgrades expected in 2026 is the Glamsterdam fork, which focuses on performance. This upgrade introduces parallel transaction processing, enabling Ethereum to handle multiple tasks simultaneously instead of processing them one by one.
Along with this, Ethereum’s gas limit is expected to rise sharply to 200 million, up from the current 60 million. This would allow far more transactions to fit into each block, reducing congestion during busy periods.
Another important change is how validators operate. Instead of validating full transaction data, validators will move toward checking zero-knowledge (ZK) proofs. This reduces workload while keeping the network secure.
With these improvements combined, Ethereum’s main network could eventually reach up to 10,000 transactions per second, a major jump from today’s levels.
If Vitalik spent more time looksmaxxing and less time on infrastructure
Heze-Bogota Fork Focuses on Privacy and Censorship Resistance
Alongside Glamsterdam upgrades, which focus on speed, Ethereum is also addressing concerns around privacy and decentralization. The planned Heze-Bogota fork will concentrate on strengthening user privacy and improving censorship resistance.
This upgrade aims to reduce reliance on centralized infrastructure and make it harder for any single party to block transactions.
Developers see this as a key step toward keeping Ethereum open, neutral, and permissionless as global adoption grows.
Why These Ethereum Upgrades Matter
Ethereum already powers much of today’s DeFi, NFT, and stablecoin activity, but high fees and overcrowding remain challenging. The 2026 upgrades aim to fix these issues at the base layer.
By combining higher speed, ZK-based validation, and stronger decentralization, Ethereum is positioning itself for long-term growth. If successful, these upgrades could help Ethereum remain competitive while staying true to its core values of openness and security.
Ethereum Price Outlook
On-chain data shows more ETH moving onto exchanges in December, with reserves rising from about 16.2 million to nearly 16.6 million ETH. This means around 400,000 ETH has been added to exchange balances, increasing short-term supply
At the same time, Ethereum network activity has jumped sharply. Active addresses nearly doubled in just one week, rising from around 496,000 to 800,000, showing growing user participation.
Ethereum $ETH network activity has nearly doubled in a week, with active addresses rising from 496,000 to 800,000. pic.twitter.com/c0espgmwr9
Looking at the Ethereum price, ETH is trading just below $2,955 with a market cap hitting $356.7billion. However, the ETH price has stabilized after dipping toward $2,850 but remains in a corrective phase.
Looking ahead, traders believe that if market conditions improve, ETH could attempt a recovery toward the $3,390 zone.
With the holidays draining liquidity and uncertainty still in the air, the crypto market is clearly moving more cautiously. Bitcoin has managed to remain stable, but rising ETF outflows and slowing momentum are difficult to ignore. At this point, it’s…
Emerging markets are finally accessing finance, with a $310-billion stablecoin market showing that adoption is not hype. Here is what this milestone actually means.
XRP turned green on Christmas after a dip-and-rebound near $1.87, as CoinGlass showed shorts getting squeezed, and the setup now points at an optimistic December close above $2.
Shiba Inu's burn rate jumped 505% on Christmas, but SHIB price stayed muted as meme coin holders were left guessing whether the spike was real or just a holiday anomaly hitting the counter.
HOLYMining offers secure, transparent cloud mining for BTC and DOGE, enabling users to mine without hardware easy today. HOLYMining is a global cloud mining service platform focused on providing users with secure, stable, and transparent cloud mining solutions. The platform…
ADA is back near $0.35 right now, as founder-sale talk returns, but Cardano's main man, Charles Hoskinson, denies dumping into the top and says repetition is not proof.
Stablecoins are starting to matter for something more useful than trading alone. The big idea heading into 2026 is simple: money that keeps a steady value needs real ways to move, settle, and spend.
That is why projects like Remittix (RTX) are gaining visibility around cross-border payment narratives, and Digitap ($TAP) is being framed as a presale built around stablecoin-era spending and everyday money tools.
In a market where hype fades fast, the project that already works in real life tends to separate itself from concepts still waiting to launch.
Stablecoins Are Turning Into “Spendable Dollars”
Stablecoin supply has continued to grow even as broader crypto markets remain volatile, and usage is expanding beyond trading into payments and settlement. That shift makes infrastructure, not speculation, the more important variable heading into 2026.
Total stablecoin market capitalization continues to rise even as Bitcoin price action remains volatile, reinforcing the shift toward stablecoin-based payments and settlement. Source: Coinglass
Stablecoins are designed to hold a steady value, usually by tracking the U.S. dollar. That stability makes them useful for payments, transfers, and remittances, not just price speculation. The World Bank has reported a global average cost of 6.4% to send $200, far above the 3% target.This is the core thesis for 2026: stablecoins keep growing, and the next wave is spending infrastructure.
Remittix: A Cross-Border Payments Narrative Built Around Crypto
Remittix presents itself as a project aimed at improving cross-border payments, with messaging focused on faster transfers and lower fees, plus the ability to pay with crypto broadly.
Much of Remittix’s thesis depends on future rollout, integration, and adoption, with public market-tracker listings still reflecting an early, pre-launch footprint, and stablecoin rails can improve speed and reduce friction in some corridors.
The real question is execution: how much of the payment stack is already live, how settlement is handled, and how quickly real adoption can happen.
Digitap ($TAP): The Spend-and-Settle Angle, Packaged as a Presale
Digitap’s presale is a practical money system with ongoing promotions, including a publicly advertised $250,000 giveaway tied to $TAP.
There is also third-party audit visibility. SolidProof hosts a project page for DigiTap that references a security analysis of the token contract, with the standard reminder that only specific contracts may be audited and that functional testing may not be included.
The Digitap story is built around the claim that stablecoin-style money should be spendable, settle cleanly, and reward users through token mechanics during a weak market, placing it among crypto presales with real utility rather than concept-led launches.
That framing also leans into protection. Digitap’s materials and third-party coverage describe a fixed token supply model alongside a buy-back-and-burn mechanism linked to platform activity, positioning $TAP as a deflationary asset rather than one exposed to ongoing dilution. In weak markets, that structure is designed to reduce supply pressure rather than add to it.
Digitap also emphasizes user choice around privacy. The platform outlines tiered account options, ranging from a no-KYC wallet setup to higher-limit accounts that require verification handled through third-party providers aligned with regional compliance requirements. That structure is positioned as a balance between access, control, and compliance rather than a one-size-fits-all model, which helps lower barriers for those investing in crypto for beginners without abandoning regulatory realities.
Side-by-Side: What the Comparison Really Comes Down To
This comparison is less about slogans and more about where each project sits on the roadmap-to-reality spectrum.
Category
Remittix (RTX)
Digitap ($TAP)
Core theme
Cross-border payments narrative
Stablecoin-era spending and money tools narrative
Public status signals
Preview-style public listing signals on major trackers
Active presale funnel and promotional activity
Trust signals
Project site messaging and early ecosystem signals
Public audit page visibility via SolidProof
2026 thesis fit
The Payments angle depends on rollout and adoption
Spend/settle framing reinforced by presale momentum messaging
A payments thesis needs working rails, compliance clarity, and user habit formation. The closer a project is to daily use, the more that thesis can compound.
Presale Math and Momentum Signals
The presale segment is where the difference becomes measurable.
Digitap presale signals. Recent coverage references the current presale price at $0.0383, with a programmed increase to $0.0399. Reported traction figures in coverage (raised amount and tokens sold vary by outlet and timing)
Remittix, by contrast, currently presents more like a concept-led payments pitch in public-facing materials, with market tracker pages still showing a preview-style footprint.
That difference matters in a cautious cycle, as staged pricing, visible traction, and recurring engagement increasingly define the best crypto presales 2025 for risk-aware investors.
Digitap’s Holiday Campaign as a Short-Term Attention Engine
A seasonal overlay can matter when markets are quiet. In December 2025, Digitap is running a Christmas sale with rotating offers framed like a digital advent calendar, designed to reward repeat check-ins during the presale window.
This does not replace fundamentals, but it functions as a short-term engagement layer, encouraging repeat check-ins during a quieter part of the market calendar.
Where the Stablecoin Spending Thesis Points in 2026
Stablecoin growth is increasingly treated as structural. In that environment, the more persuasive presale thesis is not the next big coin. It is the next system people actually use. Cross-border payments can be part of that system, but the stablecoin era rewards platforms that cover the full loop: holding, converting, settling, and spending.
Digitap’s positioning leans directly into that loop, supported by visible presale mechanics, audit-page visibility, and an engagement-heavy seasonal campaign in late 2025. Digitap’s materials reference access to traditional banking rails and card infrastructure through partner integrations, and a growing base of connected wallets as part of its credibility narrative.
Why Digitap ($TAP) Reads as the Cleaner 2026 Presale Thesis
Remittix captures a real problem: moving value across borders cheaply and quickly.The core risk is timing and delivery. When public tracking still resembles a preview footprint, the payments thesis rests heavily on future rollout and adoption curves.
Digitap’s pitch is built around stablecoin spending becoming normal, with presale mechanics and public campaign messaging that keep the project in front of retail attention heading into 2026.That combination aligns with the current market mood: utility-first narratives, a defensive token design language, and systems that can perform well even in a weak cycle.
Digitap is Live NOW. Learn more about their project here:
As crypto prices continue to swing between optimism and caution, many investors are already positioning themselves ahead of the next bearish phase. History has shown that the strongest gains are often secured before market sentiment turns defensive. In this environment, identifying a new crypto coin that combines structured growth, real utility, and disciplined token economics becomes a priority. Mutuum Finance (MUTM) is emerging as a notable contender, especially while it remains in its presale Phase 6, offering what many see as a strategic entry before broader market pressure returns.
Mutuum Finance (MUTM): Presale Momentum and Early-Stage Pricing Advantage
Mutuum Finance (MUTM)’s presale structure has been designed to reward early participants through a stepped pricing model. The token has already progressed from an initial price of $0.01 in earlier phases to $0.035 in Phase 6, reflecting a 250% increase during the presale journey. This progression has reinforced confidence among participants who recognize the advantage of entering before public market exposure.
The project has also outlined a planned launch price of $0.06, reinforcing the narrative that presale participants are positioning themselves well ahead of broader market discovery. Phase 6 is currently reported to be 98% sold out, signaling tightening availability at the current rate. This stage is widely viewed as the final opportunity to access MUTM at $0.035, as the next phase will introduce a confirmed 15% price increase, moving the token to $0.040.
Phase 7 is expected to intensify demand further, not only due to reduced allocation but also because pricing dynamics will continue to favor those who acted early. Adding to accessibility, Mutuum Finance (MUTM) has introduced card purchases with no limits, removing friction for participants who want immediate exposure without navigating complex on-chain swaps. As bearish conditions often pressure liquidity later, securing positions during structured presales has historically been a favoured approach among disciplined investors.
Utility-Driven Design and Long-Term Value Mechanics
Mutuum Finance (MUTM) is being built around a dual lending framework that blends automation with flexibility. The Peer-to-Contract (P2C) model will allow users to lock stablecoins such as USDT into smart contract-backed liquidity pools. This structure will provide an automated and efficient way to earn passive income, supported by transparent on-chain logic and predefined parameters.
Alongside this, the Peer-to-Peer (P2P) model will enable direct lending agreements between users without intermediaries. This approach will support customized loan terms and enhanced confidentiality, appealing to participants who value control over their financial arrangements. Together, these two systems will broaden the platform’s appeal, serving both yield-focused participants and those seeking tailored lending solutions.
Development progress has further strengthened confidence in the protocol. Phase 1 of the roadmap has already been completed, while more than half of Phase 2 has been achieved. The remaining goals in this phase include the implementation of advanced features, refined risk parameters, and the development of advanced analytics tools. The updated whitepaper now reflects these advancements, signaling that Mutuum Finance (MUTM) is actively evolving rather than relying on static promises.
The project plans to launch its platform and list the MUTM token simultaneously. This synchronized rollout will ensure that traders and lenders will engage with a fully functional product from day one. Unlike many presales where tokens circulate without immediate utility, Mutuum Finance (MUTM) will introduce live lending and borrowing modules at launch, reinforcing real demand from the outset. This structure is also expected to align well with Tier-1 and Tier-2 exchange requirements, enhancing visibility and liquidity once listed.
Another defining element of the ecosystem will be its buy-and-distribute mechanism. A portion of protocol revenue generated from borrowing fees and platform activity will be used to buy back MUTM tokens from the open market. These tokens will then be distributed to users who stake their mtTokens, creating a cycle that rewards long-term participation while applying consistent buy-back pressure. As platform usage grows, this mechanism will directly link adoption with token demand.
Looking ahead, Mutuum Finance (MUTM) has confirmed that the first version of its protocol will launch on the Sepolia Testnet in Q4 2025. This release will introduce core infrastructure, including liquidity pools, mtToken and debt-token models, and an automated liquidator bot designed to manage collateral risk. Early testnet participation will allow users to engage with lending and borrowing using ETH or USDT, fostering transparency and community feedback ahead of the mainnet rollout.
Final Thoughts Before the Market Turns
As bearish seasons approach, investors often reassess where value is most effectively positioned. Mutuum Finance (MUTM) stands out as a new crypto coin that combines presale pricing discipline, real utility, and structured incentives designed for long-term engagement. With crypto prices historically rewarding early conviction, Phase 6 represents a narrowing window of opportunity.
Adding to the momentum, Mutuum Finance (MUTM) is also running an ongoing $100K giveaway aimed at strengthening community growth. Ten winners will receive $10,000 worth of MUTM tokens each, rewarding early believers who align with the project’s vision from the start.
With Phase 6 already 98% sold out and a confirmed 15% price increase coming in the next phase, this moment is widely seen as the last chance to secure MUTM at $0.035 before it moves to $0.040. For those preparing ahead of the next market downturn, Mutuum Finance (MUTM) is increasingly being viewed as one of the best cryptocurrency coins to buy before bearish conditions return.
For more information about Mutuum Finance (MUTM) visit the links below:
Quantum computing won’t break Bitcoin in 2026, but the growing practice of “harvest now, decrypt later” is pushing the crypto industry to prepare sooner rather than later.
The coming year will see perfect parallel processing, big increases in the gas limit and number of data blobs, and 10% of Ethereum’s network switching to ZK.
Crypto derivatives trading surged to $86 trillion in 2025, averaging $265 billion per day, as Binance captured almost 30% of global volume, CoinGlass reported.
Zhao urged the blockchain industry to adopt new security measures, including scam address blacklist, after an investor lost $50 million to an address poisoning scheme.
A $1k split across Bitcoin, Solana, Ethereum, and Avalanche at the start of 2025 would now be below breakeven, even as Scaramucci frames the basket as a multi-year bet A hypothetical $1,000 investment based on Anthony Scaramucci’s publicly stated cryptocurrency…
Gold-backed stablecoins have surged to about $4b in 2025, led by two tokens holding nearly 90% of supply as rising gold prices and a major issuer’s vault push tokenized bullion into the spotlight. Gold-backed stablecoins have reached approximately $4 billion…
Data suggests neobanks will expand from roughly $149b in 2024 to $4.4t by 2034 as more services run fully on-chain, replacing slow cross-border systems with software rails. The global neobanking industry is projected to experience significant expansion over the next…
Exodus will launch a fully reserved, MoonPay-issued digital dollar in early 2026 using M0, powering Exodus Pay and a broader wallet–card payments stack under recent acquisitions. Exodus Movement, a self-custody wallet provider, will partner with MoonPay and M0 to launch…
India’s ED raided 21 sites tied to 4th Bloc Consultants, alleging a decade-long fake crypto-platform Ponzi that laundered funds via wallets, shell firms, hawala and foreign accounts. India’s Enforcement Directorate (ED) conducted coordinated raids at 21 locations across Karnataka, Maharashtra…
Bitcoin price continued to remain under pressure on Thursday as U.S. spot Bitcoin exchange-traded funds recorded net outflows for a fifth consecutive day. According to data from SoSoValue, the 12 spot Bitcoin ETFs recorded $175.29 million in net outflows on…
OAK Research says 2025 punished undifferentiated L1 and L2 tokens as users rotated, MAUs fell 25%, and revenue pooled in stablecoins while dev activity stayed resilient. Layer 1 blockchain tokens experienced significant declines in 2025, with major assets losing substantial…
Data shows BitMart posting consistently deeper Bitcoin and Ethereum perpetual order books than peers over the observed period, supporting tighter spreads and lower slippage. BitMart demonstrated deeper order book liquidity than competing cryptocurrency exchanges in Bitcoin (BTC) and Ethereum (ETH)…
Christmas morning brought a weird gift as Binance's BTC/USD1 pair flashed $24,111 before snapping back near $87,000, while XRP flirts with a death cross and Cardano token eyes bullish January stats.
Christmas-season market activity is fueling renewed interest in on-chain participation, with unusual XRP fund flows bringing M DeFi into focus. #partnercontent
Caroline Ellison will exit federal custody on Jan. 21, 2026, after broad cooperation in the FTX case, a 10-year industry ban, and ongoing post-release supervision. Caroline Ellison, former chief executive officer of Alameda Research, is scheduled for release from federal…
Obyte marks its ninth anniversary with new governance, DeFi apps, and a virtual city built on its DAG-based, fully decentralized crypto network. Obyte, a decentralized cryptocurrency network, reached its ninth anniversary on December 25, 2025, marking nine years since its…
AMLBOT data shows Tether froze about $3.3b vs Circle’s $109m between 2023–2025, exposing stark differences in how the two largest stablecoin issuers police funds. Tether and Circle demonstrated significantly different approaches to freezing stablecoin addresses between 2023 and 2025, with…
Florida’s pension fund adds MicroStrategy shares, extending a broader shift by U.S. public funds toward Bitcoin-linked equity as BTC and MSTR test key 2025 lows. Florida’s pension fund expanded its exposure to Bitcoin through an investment in MicroStrategy stock, according…
Bitwise files for a spot SUI ETF with Coinbase Custody, extending the race to launch regulated exposure to the Sui Layer 1 token in U.S. markets. Bitwise Asset Management has submitted a filing to the U.S. Securities and Exchange Commission…
Binance founder Zhao dropped a Christmas Day message in his own style, revealing when the "perfect" Bitcoin buys are being made right as the price of BTC is slipping below $90,000.
A new report by blockchain analytics firm AMLBot has revealed major differences in how the two largest stablecoin issuers, Tether and Circle, handle the freezing of crypto assets linked to illegal activity.
According to the report, between 2023 and 2025, Tether froze around $3.3 billion worth of USDT, while Circle froze about $109 million in USDC. This means Tether froze nearly 30 times more funds than Circle over the same period.
The report shows that Tether blacklisted 7,268 wallet addresses across multiple blockchains, including Ethereum and Tron. More than 2,800 of these freezes were coordinated with U.S. law enforcement agencies. A large portion of the frozen funds—over 53% of total USDT freezes—was found on the Tron network, which is commonly used for fast and low-cost stablecoin transfers.
One big difference highlighted in the report is Tether’s ability to burn and reissue tokens. In some cases, frozen USDT linked to scams or criminal activity was permanently destroyed, and new tokens were issued to return funds to victims or authorities. AMLBot reported that this process has been used in several large enforcement cases over the past two years.
Circle, which issues the USDC stablecoin, follows a more cautious and legally driven approach. During the same period, Circle blacklisted 372 addresses holding a total of $109 million. Circle only freezes funds when required by court orders, regulatory rules, or sanctions, and it does not burn or reissue tokens. Once frozen, USDC remains locked until legal approval is given to release it.
AMLBot explained that these differences reflect two very different enforcement philosophies. Tether works closely with law enforcement agencies and may freeze funds early in investigations to limit further losses. Circle limits its actions strictly to formal legal instructions.
The report also points out that while Tether’s proactive approach has helped recover funds tied to fraud, trafficking, and scams, it has raised concerns about centralized control and user rights. Circle’s model, while slower, is seen as offering clearer legal safeguards.
Overall, the findings show that stablecoins operate at the intersection of blockchain technology and traditional law enforcement, with each issuer choosing a different balance between speed, control, and legal certainty.
PENGU price bucked the crypto market lull and rallied against the market after the Pudgy Penguins brand made an appearance on the famous Las Vegas Sphere. PENGU price has been on a downtrend since Dec. 10, and is down over…
Zcash price rebounded 10% after bulls managed to defend the $400 support level on Wednesday. It is now eyeing a breakout from a bullish triangle pattern that could lead to gains of nearly 45% if momentum holds. After falling nearly…
KGST, a stablecoin pegged to Kyrgyzstan’s local currency, the Kyrgyzstani som, has been listed on Binance. Kyrgyzstan President Sadyr Japarov announced the development on Dec. 24, framing the listing as “landmark news.” “It is especially encouraging that KGST has become…
Crypto hackers took social engineering to a whole other level this year, and advances in artificial intelligence mean scams are about to get even harder to detect.
The number of crypto deals reportedly skyrocketed this year and hit a record total value of $8.6 billion, led by Coinbase’s record-breaking acquisition of Deribit.
Blockchain tokenization is radically expanding the definition of money, enabling anyone to trade, save and spend in virtually any asset they like, says Kraken’s Mark Greenberg.
The potential of on-chain equity trading is enormous, but only if the custodial, liquidity, and legal protections are carried forward from public markets.
Venture partners such as Pantera, Hash3 and Variant look back on a year of regulatory shifts and uneven markets, outlining crypto’s biggest winners and losers in 2025.
The listing follows Kyrgyzstan’s passage of crypto legislation, the launch of a new US dollar–pegged stablecoin backed by physical gold and plans to build a national crypto reserve.
Bitcoin options markets remain tilted toward bears despite US investors’ expectations of economic stimulus injections and semi-bullish outlook for 2026.
As crypto, governments and Big Tech converge on digital identity, selective disclosure and zero-knowledge proofs are emerging as a privacy-first alternative to surveillance systems.
Shiba Inu has flipped Bitcoin and XRP in futures activity, as its open interest volume shows an impressive 3.42% surge, while other major cryptocurrencies stayed in the red.
SBI Ripple Asia has signed an agreement with Doppler Finance to explore new financial products built on the XRP Ledger. The two companies will look into XRP-based yield options and the tokenization of real-world assets such as traditional financial products.
The agreement, signed as a memorandum of understanding, is the first time SBI Ripple Asia has partnered with a project that is built directly on the XRP Ledger. The move shows growing interest from large financial firms in using XRPL for regulated and transparent financial activity.
As part of the plan, SBI Digital Markets, a digital asset company regulated in Singapore, will act as the institutional custodian. This means client assets will be stored separately and securely, reducing risks linked to exchanges.
For Doppler Finance, the partnership helps expand its reach in Japan, one of Asia’s key financial markets. SBI Ripple Asia is a joint venture between Ripple and Japan’s SBI Holdings, a major financial group.
Doppler Finance focuses on providing yield infrastructure for institutions using blockchain technology. Its platform is already used by some institutional players and supported by exchanges and digital wallets.
Both companies said they want to support secure and compliant financial products on the XRP Ledger. They will study how XRP can be used not just for payments, but also for generating yield and supporting real-world asset tokenization.
No new products have been launched yet, but the agreement sets the stage for future developments as traditional finance and blockchain technology continue to move closer together.
“By collaborating with Doppler Finance, we aim to accelerate the development of secure and transparent yield infrastructure on the XRP Ledger,” SBI Ripple Asia spokesperson said.
Christmas week is here, and Bitcoin investors are waiting to see if the market delivers a late push before the year ends.
With market fear falling and liquidity slowly improving, some analysts say Bitcoin could see a short-term bounce, even though the overall market remains mixed.
Low Market Fear Could Help Bitcoin
One positive sign for Bitcoin is the sharp drop in market volatility. The VIX, often called the fear index, has fallen to its lowest level of 2025. When fear is low, investors are usually more willing to take risks.
Ben Emons, Founder and CEO of FedWatch Advisors, says this environment could support a short-term rally in Bitcoin.
“Toward the end of the year, if liquidity comes back into the system, Bitcoin usually performs better,” Emons said.
Bitcoin Has Fallen Behind Gold
While Bitcoin has struggled in recent weeks, gold has moved to fresh record highs. This gap is one reason some analysts think Bitcoin has room to catch up.
According to Emons, Bitcoin has underperformed compared to gold, which could create an opportunity for a late-year move higher if market sentiment improves.
Fed Liquidity Is the Key Factor
The Federal Reserve remains a major driver of market direction. Recent U.S. data showed strong economic growth, while inflation came in near 2.9 percent.
Because inflation is still elevated, the Fed is expected to move cautiously with interest rate cuts. Even so, Emons believes the central bank will eventually deliver multiple cuts next year, which could help risk assets like Bitcoin.
In the short term, uncertainty around Fed policy could cause some hesitation, especially in bond markets.
Can Bitcoin Really Rally This Christmas?
A full breakout may be difficult, but analysts say a modest Santa rally is still possible if liquidity improves and buying pressure returns. With fear low and investors watching for year-end opportunities, Bitcoin could surprise the market in the final days of the year.
For now, all hopes are on whether Santa brings Bitcoin bulls a late Christmas gift, or if the crypto market stays quiet into the new year.
As 2025 comes to an end, the crypto market looks very different from last year.
In late 2024, Bitcoin and altcoins were rallying strongly, thanks to President Donald Trump and expectations of easier regulations. This year, however, the mood is much calmer. Bitcoin is trading below its all-time high, and many altcoins, including XRP, have struggled to move higher.
Despite strong progress on the ETF front, XRP price remains stuck below $2.
World’s Highest IQ Holder Predicts XRP at $10+
YoungHoon Kim, who holds the world’s highest IQ at 276, recently said that XRP could reach $10 in 2026. His comment quickly spread across social media, especially among XRP supporters.
While this is not financial advice, it has brought back an old debate in the crypto world: Can XRP really go past $10?
Why Some Say XRP Can’t Reach $10
Critics often point to XRP’s large supply. Their argument is simple: If XRP’s price rises too high, its total market value would become unrealistically large.
They usually compare XRP to Bitcoin and say that if XRP hit $10, its market cap would be too big to make sense.
XRP Price Currently Under Pressure
After touching $1.77, XRP moved slightly higher and is now trying to hold above the $1.85 area, which has become a short-term support level. As long as XRP stays above this zone, the chances of a further bounce remain open.
However, the recovery so far has been weak. For XRP to show real strength, buyers need to push the price higher from this support area. A move toward $2.10 would be an important sign that momentum is improving.
Market activity is expected to remain slow in the final days of the year. While a bounce may be starting, large price moves are unlikely in the short term.
So, Can XRP Hit $10 in 2026?
The truth lies somewhere in between.
Supporters believe XRP’s utility in global finance could eventually justify much higher prices. Skeptics argue that markets care more about results than ideas, and so far, XRP’s price has lagged.
Whether XRP reaches $10 will not be decided by predictions or opinions. It will depend on actual adoption by banks, institutions, and global payment systems.
As of December 24, crypto is looking a bit Grinch-like, with most major coins slipping lower. The recent rally is losing momentum, and traders appear to be dialing back risk ahead of the holidays.
Ethereum (ETH) token declined to a low of $2,900, much lower than the year-to-date high of $4,960. This drop has coincided with the broader industry's performance.
Offchain Labs increased its ARB holdings, signaling long-term conviction in Arbitrum as governance token prices slump and layer-2 competition intensifies.
The former Alameda Research CEO, subject to intense public scrutiny for her role in FTX's collapse and association with Sam Bankman-Fried, will be released in January.
Whales have accumulated over $2 billion in Ether, as derivatives positioning skewed 70% net long with leverage at record highs. When will ETH price break out?
XRP social sentiment hits extreme fear levels, a setup that has sparked sharp rebounds in the past, but XRP faces stiff resistance in its recovery path.
BlackRock may be attempting to sell Bitcoin and Ethereum again as crypto wallets associated with its ETFs have deposited over $428 million worth of both assets.
Shiba Inu (SHIB) bulls finally obtained rare hope on Christmas Eve, with $0 long liquidations in the past hour, while shorts were the only ones who paid.
XRP is ending December down hard, yet it is still sitting on the monthly Bollinger midband near $1.82 with seven days left. Hold that close, and $3.60 remains the main scenario.
Avalanche’s AVAX token is trading at $12.24, marking a more than 60% drop in value over the past year. The weakness reflects both its network’s progress and ongoing market skepticism despite its reputation as one of the most technologically advanced blockchain networks.
As investor frustration in AVAX and other layer-1s is merely compounding heading into 2026, investors are rotating into crypto presale projects in search of fresh starts. Digitap ($TAP) is a newcomer offering a live crypto banking app that blends traditional fiat services as well as crypto. It is in the middle of its presale and rapidly gaining momentum despite the ongoing bearish market as a top altcoin to buy for 2026.
How Digitap’s Super-App Turns Crypto and Fiat into One Bank
Digitap isn’t another base blockchain; rather, it offers a working fintech product. Digitap’s live super-app for finance lets users handle all of their day-to-day and long-term banking needs. Services include global money transfers, savings accounts, offshore foreign exchange accounts, crypto wallets that support more than 100 digital assets, and more.
Essentially, a user in Europe can not only hold USD, Bitcoin, and stablecoins in the same account but also transact with them. Global money remitters are notorious for overcharging consumers with an industry average fee of 6.2%. But Digitap’s ability to leverage the strengths of fiat and crypto means users can transfer funds to each other globally within seconds for less than 1%.
This is a game-changer for usability as Digitap created a future-proof fintech banking app that is supercharged with crypto integration. This narrative was solidified with the recent inclusion of a Visa debit card, where users preload the card with either fiat or crypto and then spend their money anywhere Visa cards are accepted.
By offering a tangible fintech and banking service that plugs directly into everyday commerce, Digitap differentiates itself from L1 tokens like AVAX, which mostly sit behind the scenes.
Digitap’s $TAP Structure Strengthens Its Best Crypto to Buy Case
Digitap’s crypto presale of its native $TAP token kicked off in late summer during the peak of the bull run. But the presale gained momentum throughout the crypto market selloff due to the unique structure of its raise. $TAP is sold in tiers, with the token value increasing after each round is completed or sold out.
$TAP was first offered for sale at $0.0125 and has since risen to $0.0383, giving early investors a more than 200% paper profit. To date, Digitap has raised more than $2.8 million from a combination of retail investors drawn by the app’s features to crypto whales who recognize early value when they see it.
Digitap’s tokenomics represents another compelling narrative that makes $TAP a top altcoin to buy for 2026. Half of the platform’s profits are allocated toward buyback and burn initiatives and funding stakers. The token’s value is directly correlated with the platform’s growth profile. By contrast, tokens like AVAX trade more on sentiment and future expectations despite showing a seven-fold increase in daily transactions in 2025.
To reward both new and old investors, Digitap is celebrating the Christmas season with a festive giveaway event. The project is offering investors daily deals through January 2 that include a bonus $TAP, platform rebates, free upgrades, and more. Investors can find the time-sensitive deals in the $TAP presale widget. But they need to act fast, as once a deal expires, it is gone forever.
Why Avalanche’s Strong Usage Hasn’t Helped AVAX at $12.24
Avalanche’s token peaked just below $150 during the late 2021 bull market but now finds itself struggling to even break above the $15 level. The current price of $12.24 comes despite notable network achievements, prompting some to speculate a large gap between network usage and investor optimism.
Throughout 2025, the platform consistently recorded over 2.5 million daily transactions, up from 500,000 in January. Avalanche has seen notable growth from its ability to carve out a niche within the tokenized real-world asset market. Its RWA sector reached nearly $1 billion in tokenized assets, making it the second-largest RWA ecosystem after Ethereum.
Meanwhile, the network’s Warp Messaging upgrade and subnet expansions have attracted strong enterprise and institutional interest. Yet despite what seems like a strong year, the token has taken a beating. With a cautious investor sentiment, Avalanche needs to compete against many other networks not only for market share but for mindshare.
Many investors are trimming their crypto exposure and becoming selective in what they invest. The top cryptos to buy are those that offer tangible products, real-world adoption, and built-in utility that is in high demand regardless of market sentiment.
Many investors are trimming their crypto exposure and becoming selective in what they invest. The top altcoins to buy are those that offer tangible products, real-world adoption, and built-in utility that is in high demand regardless of market sentiment.
By contrast, $TAP is the better crypto to buy, despite its status as a crypto presale, because its value is accrual-based and built in. More platform usage translates to more revenue and immediate token buybacks and burns. In other words, $TAP holders have a more straightforward claim on the platform’s success through indirect investor-friendly revenue sharing.
Digitap’s business model of burning is also agnostic to market cycles, meaning even in a bear market, if $TAP comes under selling pressure, the platform is still reducing token supply using real cash flow to create support. This means Digitap’s banking utility beats Avalanche’s L1 speculation—Digitap has the agility and direct utility to outperform Avalanche in 2026, even if the bear market persists.
Discover how Digitap is unifying cash and crypto by checking out their project here:
In crypto markets, price does not always move in smooth trends. It often jumps in steps. These steps usually happen when supply conditions change or when a project moves closer to real usage. Right now, one new crypto at $0.035 is entering what many investors describe as a repricing window. This is the stage where the next price level starts to matter more than the current one. Mutuum Finance is increasingly mentioned in this context as its structure, timing, and supply dynamics begin to align.
Mutuum Finance (MUTM) Presale Progress and Core Vision
Mutuum Finance is an Ethereum based DeFi crypto focused on decentralized lending. The protocol is designed to connect lenders and borrowers through structured markets that rely on clear rules rather than hype. Users supply assets to earn yield, while borrowers access liquidity under defined conditions. Interest paid by borrowers becomes the engine that supports the system.
The token, MUTM, is currently priced at $0.035 and is in Phase 6 of its release structure. The presale began in early 2025 and has progressed through multiple stages, each introducing a higher price. Since the first phase, the token has appreciated by roughly 250%.
This gradual increase reflects controlled distribution rather than sudden spikes. Over $19 million has been raised so far, with more than 18,600 holders participating. These figures suggest broad distribution, which is often viewed as a healthier base for long term growth.
Security Framework and First Price Scenario
One of the key reasons investors are watching Mutuum Finance closely is the upcoming V1 launch. According to official statements shared on X, the first version of the protocol is scheduled to go live in Q4 2025. V1 represents the shift from development to active usage. This is the moment when lending and borrowing begin to generate real on chain activity.
Security has been treated as a priority ahead of this milestone. Mutuum Finance has completed a CertiK token scan, achieving a strong score that reflects sound token design. In parallel, Halborn Security is reviewing the core smart contracts that power the lending logic. A $50,000 bug bounty program adds another layer of protection by encouraging continuous testing.
Based on this setup, some analysts outline a conservative first price scenario tied to the V1 transition. Rather than assuming extreme moves, this model looks at historical behavior of early DeFi lending protocols. In that context, a 3x to 4x increase from current levels is often associated with the initial shift into live usage, assuming steady adoption and no major disruptions.
mtTokens and Buy and Distribute
Beyond launch timing, Mutuum Finance introduces mechanics that can influence long term demand. When users supply assets to the protocol, they receive mtTokens. These tokens represent their position and grow in value as interest is paid back by borrowers. This creates a direct link between protocol usage and user rewards.
Another important mechanism is the buy and distribute model. A portion of protocol revenue is used to purchase MUTM tokens from the open market. These tokens are then distributed to mtToken holders. This process introduces consistent buy pressure that is tied to activity rather than speculation.
The live 24 hour leaderboard adds transparency to participation. It shows which wallets are most active, creating a visible signal of demand and competition. When combined, these elements support a second price scenario that assumes growing participation after launch. Under this model, analysts point to a possible 5x move over time, driven by usage based demand rather than attention cycles.
Layer Two Expansion
Looking further ahead, Mutuum Finance has outlined plans that extend beyond the initial lending markets. A native stablecoin is part of the roadmap, designed to be backed by borrowing demand within the protocol. Stable assets often play a key role in lending platforms by increasing capital efficiency and reducing volatility for borrowers.
Layer two expansion is another planned step. By moving parts of the protocol onto scalable networks, transaction costs can be reduced and speeds improved. This makes smaller positions more viable and opens the door to a broader user base. Oracle integrations are also planned to ensure accurate pricing, which is essential for safe lending and liquidation processes.
When these elements are combined, analysts model a longer term scenario that stretches into 2026 and beyond. In this view, sustained usage, deeper liquidity, and revenue driven buy pressure could support a 500% or greater increase from current levels. This scenario is not framed as a guarantee, but as a range based on adoption and execution.
Whale Activity and Why Timing Matters
Phase 6 is now close to full allocation. With each stage, available supply becomes more limited, and the next price level moves closer. This is why the current period is often described as a repricing window. Investors are positioning not just for the current price, but for the next step up.
Recent whale allocations, including purchases above $100,000, highlight this behavior. Larger participants often move during periods when supply tightens and visibility increases. Card payment support has also lowered friction for new participants, which can accelerate late stage demand.
At this point in the presale, the balance shifts. Supply is shrinking, infrastructure is nearly ready, and the roadmap is clearly defined. For many, this combination explains why Mutuum Finance is increasingly viewed as the next crypto to watch. The focus is no longer on what the project might build, but on how soon its systems begin to operate and reprice the token accordingly.
For more information about Mutuum Finance (MUTM) visit the links below:
As investors look ahead to 2026, many are asking a basic question: Which altcoins have the best chance to perform well over the next cycle? One expert has grouped the strongest opportunities into four big narratives. Each category includes two altcoins, making a total of eight coins to watch for 2026.
Compliance-Ready Crypto Projects
Regulation is expected to improve over the next year, especially in the United States. Clear rules can reduce legal risks, attract big investors, and bring more money into crypto markets.
Chainlink (LINK)
Chainlink stands out for its strong connections with policymakers and financial institutions. Its founder has spoken with U.S. lawmakers, attended Federal Reserve events, and met key political figures.
Chainlink plays a major role in connecting traditional finance with blockchain systems. Many investors believe it could benefit once regulation becomes clearer.
Aave (AAVE)
Aave is a leading DeFi lending platform. Its founder has met with officials from the White House, the SEC, and the Federal Reserve.
While Aave is currently facing internal governance issues, the platform still generates strong revenue. Its token price has fallen sharply, which some investors see as a long-term opportunity if the project stabilizes.
Artificial Intelligence Coins
AI is becoming one of the most important sectors in technology. Governments and institutions are investing heavily, and crypto projects linked to AI are gaining attention.
Bittensor (TAO)
Bittensor combines AI with Bitcoin-like token economics. It has a fixed supply and recently completed its first halving event, which reduces new token issuance.
Bitcoin halvings have historically been followed by strong price moves. Supporters say TAO could benefit from a similar narrative, especially with AI demand growing.
Virtuals Protocol (VIRTUAL)
Virtuals focuses on AI agents and currently leads its category in revenue. According to DeFi data, it has little competition in its niche.
Its price is near crucial support levels, and the project already generates real income. This makes it one of the most talked-about AI-focused crypto projects for 2026.
Revenue-Generating Crypto Projects
Investors are paying more attention to crypto projects that earn real money from users. Revenue adds stability, especially during market downturns.
Hyperliquid (HYPE)
Hyperliquid is a decentralized trading platform that has become one of the top revenue generators in crypto. It directs most of its earnings toward buying back its own token.
Despite strong fundamentals, its price has pulled back recently. Some analysts believe this could offer a good entry point if trading activity continues to grow.
Jupiter (JUP)
Jupiter is a major decentralized exchange aggregator on Solana. It earns millions of dollars each month but has seen its token price fall sharply.
Token unlocks have added selling pressure, but upcoming upgrades and a planned stablecoin launch could help improve sentiment over time.
DePIN and Infrastructure Projects
DePIN stands for decentralized physical infrastructure networks. These projects support real-world services like wireless networks, computing power, and data storage.
As AI infrastructure expands, demand for these networks could rise.
Helium (HNT)
Helium focuses on decentralized wireless connectivity. Its revenue has grown over the past year, and the token has become deflationary.
The network is also expanding into new markets like Brazil, which could boost adoption and usage.
Solana (SOL)
Solana is not a DePIN project itself, but it hosts many of the largest DePIN platforms. It remains the leading blockchain for infrastructure-based crypto projects.
After a long correction, experts say Solana is closer to the end of its downturn and could benefit from its ecosystem growth.
Christmas Eve got a ghost-wallet headline as a 2,000 ETH stash awoke after 10.4 years with nearly 1,000,000% profit as Ethereum trades around $2,930 in thin holiday books.
Hong Kong’s FSTB and SFC will introduce licensing requirements for virtual asset dealing and custody firms, expanding the city’s policy push that already includes a stablecoin licensing blueprint and tokenization guidance.
Aave founder Stani Kulechov is facing criticism after a $10 million AAVE purchase ahead of a key DAO vote, as critics raise concerns over voting power concentration.
Token swaps let users trade crypto directly via DeFi smart contracts and AMMs, tapping liquidity pools for instant, permissionless access to assets and yields. Token swaps represent a decentralized finance (DeFi) mechanism that allows users to exchange one cryptocurrency token…
Followed by a swift uptick, the memecoin price is now at its yearly low.
DOGE lost $0.13, a crucial zone.
Doge USDT 4 hour chart shows a reclaim power pattern above $0.13 and higher.
Dogecoin, the 9th largest crypto by marketcap if 21.5B USD, is currently driving in a crucial zone. Currently trading at $0.1282, the memecoin has fallen to nearly 60% in a year and records lows in the weekly and daily time frames, too.
The crypto was in the concern zone after losing its position below $0.13 amid huge volume spot selling. This level needs to be reclaimed for the coin to stay in the right zone of recovery, else we may see it crossing below its last summer figures.
DOGEUSDT 4h Chart Is All Bullish
The price movement here shows basic bullish acceleration above $0.12600, a positive sign for the buyer. A purchase can be considered as long as the price remains above $0.1250.
RSI at 42 shows growing interest of buyers, and a breakthrough of RSI will boost momentum into the resistance of $0.134. A surge above this zone will lead the DOGE price to $0.14.
In the event of invalidation of the trend, the crypto will move below the $0.12 zone, which becomes riskier.
The derivatives surge is a sign for Doge?
The Dogecoin futures are showing high volatility, with a volume surge of 53,000% to $260 million. This came even before the recent stability of Dogecoin. The Dogecoin ETF and the derivatives surge remain the catalyst for this and the upcoming trend reversal.
December has been a hopeful month for the crypto markets, as the trend tends to turn bullish, which further transforms into a strong ascending trend or bull run too. Unfortunately, the cycle seems to have changed this time, as Bitcoin recorded one of the worst Q4 since 2018, which is raising concern for the upcoming price action. However, the BTC price seems to be stuck within a tight range, displaying some strength, while the altcoins, like Ethereum, are stuck below $3000, XRP flashes the possibility of heading to $1.5, and Chainlink is losing support.
With this, it becomes quite evident that the Bitcoin price is absorbing the selling pressure while the altcoins are failing to hold ground. Does this suggest traders have shifted their focus back to Bitcoin?
Bitcoin Is Absorbing Selling Pressure While Altcoins Underperform
Over the past 48 hours, Bitcoin has declined roughly 3–4%, while many large-cap altcoins have fallen 8–15% over the same period. This divergence reflects capital rotation rather than broad risk exit. Bitcoin continues to capture defensive flows due to its deeper liquidity and stronger spot participation. BTC spot volumes remain 20–25% higher than the combined volume of the top alt pairs, helping absorb derivatives-led selling.
The market cap gap between Bitcoin and the altcoins substantiates the claim, as both levels have diverged from each other in the past few days. Besides, altcoins lack this buffer. Order-book depth in major alts is down 30%+ compared to last week, meaning smaller sell orders are pushing prices lower. With many altcoins trading below key resistance and failing to reclaim structure, traders are selling rallies instead of adding exposure. This imbalance explains why Bitcoin is stabilising while altcoins continue to bleed.
BTC Dominance Is Quietly Rising
The Bitcoin dominance chart shows BTC dominance climbing toward 59%, marking a clear series of higher lows and higher highs over recent months. This confirms a sustained rotation into Bitcoin rather than a short-term spike. Importantly, dominance is holding above the 55% breakout zone, which previously acted as resistance and has now flipped into support.
From a technical perspective, this structure signals trend continuation. As long as BTC dominance remains above 56–57%, capital flow favors Bitcoin over altcoins. The declining share of “Others,” or altcoins, is now near 28%, which reinforces that altcoins are losing relative market share faster than Bitcoin during pullbacks.
Historically, phases where BTC dominance grinds higher like this coincide with altcoin underperformance and selective risk-taking, not broad market expansion. Until dominance shows rejection near the 60–62% zone, the path of least resistance remains skewed toward Bitcoin relative strength, keeping pressure on the altcoin complex.
What This Means for Traders
Rising Bitcoin dominance near 59% signals that capital is prioritising liquidity and safety over beta. In this phase, Bitcoin tends to absorb selling pressure while altcoins continue to underperform, making selective exposure more important than broad participation. Traders should expect rallies in altcoins to face supply unless BTC dominance stalls or reverses below the 56–57% zone. Until that happens, trading Bitcoin or staying defensive offers a better risk-reward than chasing oversold alt setups.
Crypto market volatility is slowly gaining strength, as the prices of tokens have been ranging within a predefined range. Currently, the markets are experiencing significant upward pressure while top cryptos like Bitcoin remain accumulated within a range, and Ethereum is failing to sustain above $3000. Meanwhile, the top fifth crypto, XRP price, has also maintained a steep bearish trend and is likely to find lows below $1.8 in the coming days.
With XRP showing signs of weakness after failing to hold above key support levels, is this just a slip of momentum, as the price does not appear to be gearing for a sharp breakdown? If yes, then there is an increased risk of a deeper pullback if support continues to weaken.
Is XRP Price Heading to $1.5?
On the daily chart, XRP price is trading within a clear descending channel, marked by lower highs and steady selling pressure. Each bounce attempt has stalled below the descending trendline, showing that sellers remain active on rallies. This type of structure usually signals continuation rather than reversal, especially when price struggles to reclaim previous support zones.
The $1.78–$1.80 range has emerged as an important near-term support. XRP is currently hovering just above this level, but the reaction has been weak. There is no strong expansion in volume, suggesting buyers are cautious rather than aggressive.
Momentum indicators are also flashing caution. The RSI is hovering near the 40 level, which typically reflects weak momentum rather than oversold conditions. This suggests there is still room for downside before buyers feel forced to step in. At the same time, On-Balance Volume (OBV) continues to trend lower, indicating sustained distribution. This shows that capital is slowly exiting rather than accumulating at current prices.
If XRP loses the $1.78 support, the next major demand zone sits near $1.50. This level previously acted as a strong base and could attract buyers again if tested. A move toward $1.50 would not signal panic but rather a continuation of the current corrective trend.
Here’s When the XRP Price Could Trigger a Rebound
XRP is not breaking down aggressively, but it is losing ground slowly. That is often more dangerous for late buyers than sudden volatility. Until price reclaims structure, the chart favors caution rather than dip-buying. For any meaningful trend reversal, XRP must reclaim the $2.00–$2.10 zone and hold above the descending trendline. This move would need to be supported by rising volume and improving momentum indicators.
Bitcoin is struggling to regain momentum this Christmas, trading below the $90,000 mark despite the festive mood in the market. There are hopes for a holiday rally amid the bearish price action.
At the time of writing, Bitcoin closed near $86,935, slightly lower after failing to hold recent gains. Thin holiday trading volumes, ETF outflows, and a large options expiry have all added pressure on the world’s largest cryptocurrency.
How Bitcoin Performed at Christmas in Recent Years
Bitcoin’s Christmas performance has varied sharply over the past three years:
2023: $43,665
2024: $94,120
Last year’s Christmas rally to above $94,000 set a high bar. This year, Bitcoin is well below that level, raising questions about whether another festive breakout is possible.
Why Bitcoin Is Stuck Below $90,000
Bitcoin has been consolidating in a tight range between $85,000 and $90,000 throughout December. Analysts say low liquidity during the holidays has reduced strong price moves in either direction.
ETF-related selling and a major options expiry have also limited upside momentum. However, from a technical perspective, signals are mixed.
On the weekly chart, Bitcoin is still showing signs of a broader correction. A bearish divergence remains active, showing weakness could continue unless the trend changes.
However, shorter timeframes tell a slightly more positive story. On the three-day chart, a small bullish divergence has formed. This often means a short-term bounce or sideways movement rather than a strong rally.
Source: TradingView
Bitcoin continues to bounce between clear levels:
Support: $85,000 to $86,000
Resistance: $92,000 to $94,000
The $90,000 level has now turned into strong resistance, with multiple rejections over the past week.
Can Bitcoin Rally During Christmas?
Bitcoin looks oversold in the short term and could attempt a move back toward $90,000 to $91,000, where liquidity is building. If buying pressure increases, a brief Christmas bounce is possible.
However, failure to hold current support could send Bitcoin down toward $82,000, especially if broader market sentiment weakens.
As market volatility and liquidity fragmentation persist, OTC desks are increasingly used by large traders to execute crypto transactions without disrupting public markets.
Macro analyst and institutional crypto veteran Dan Tapiero stated Bitcoin remains in the middle stage of its current bull market cycle, according to a recent market update. Tapiero indicated Bitcoin (BTC) will likely catch up to the significant gains posted…
Unusual whale movements on the XRP network ahead of Christmas have heightened volatility and pushed investors to reconsider longer-term participation models such as cloud mining. #partnercontent
ChatGPT-based analysis says Bitcoin will likely consolidate in 2026, with ETFs and macro conditions driving a wide but structurally supported trading range. Financial analysis platform Finbold consulted OpenAI’s ChatGPT artificial intelligence model for Bitcoin price projections in 2026 as the…
India’s CCI clears Coinbase’s minority stake in CoinDCX, cementing the US exchange’s return to India and strengthening the local platform’s position in a top crypto adoption market. India’s antitrust regulator approved Coinbase Global Inc.’s acquisition of a minority stake in…
Hyper Foundation confirms HYPE in the Assistance Fund 0xfefe address is permanently burned after an 85% stake-weighted validator vote, removing tokens from total and circulating supply. The Hyper Foundation has confirmed that HYPE (HYPE) tokens sent to the Assistance Fund…
With Christmas tomorrow, XRP crowd is buzzing over mysterious and legendary $589 tease, Shiba Inu coin sees 51,231,999,673 SHIB land on Upbit and Bitcoin's monthly Bollinger map points at $52,000.
Crypto access in the Philippines is getting tighter, and this time, even major global exchanges aren’t spared.
As of Tuesday, Coinbase and Gemini are no longer accessible across several Philippine internet service providers, according to user reports and independent confirmations. The blocks follow a government order tied to a wider push against unlicensed crypto platforms operating in the country.
Coinbase, Gemini Blocked
The move came after the National Telecommunications Commission (NTC) directed ISPs to restrict access to around 50 online trading platforms flagged by the Bangko Sentral ng Pilipinas (BSP) for operating without authorization.
In its statement, the NTC said the directive followed a formal request from the central bank to disable websites and applications of unlicensed Virtual Asset Service Providers. The BSP did not release a full list of affected platforms, but regulators made it clear the goal is enforcement, not warnings.
Officials say the action is meant to protect users and ensure financial stability, citing Section 902-N of the Manual of Regulations for Non-bank Financial Institutions, updated under BSP Circular No. 1206.
Binance Was the First – Now the Net Is Wider
Coinbase and Gemini aren’t the first exchanges caught in the crackdown.
In December 2023, Philippine regulators gave Binance a 90-day compliance window to meet local requirements. When that period expired, the NTC ordered ISPs to block Binance on March 25, 2024. The country’s Securities and Exchange Commission later asked Apple and Google to remove Binance’s app from their stores.
After the ban, the SEC said it could not endorse ways for Filipinos to retrieve their funds.
More recently, the SEC identified 10 unlicensed exchanges, including OKX, Bybit, and KuCoin, as operating without approval.
Regulated Platforms Move In as Rules Tighten
While access to unlicensed exchanges shrinks, regulated players are expanding.
Local exchange PDAX recently partnered with payroll firm Toku, allowing remote workers to receive salaries in stablecoins and convert them to pesos without wire fees.
Meanwhile, digital bank GoTyme, working with U.S. fintech Alpaca, has rolled out in-app crypto services covering 11 digital assets.
The crypto markets are becoming choppy nowadays as the prices of most of the tokens are heading towards their local support range. Meanwhile, the Chainlink (LINK) price is trading near the $12 zone, extending a broader downtrend that has been in place since October. While volatility has cooled, the chart shows that LINK is not stabilising yet. Instead, price action suggests sellers remain in control, with rallies failing to reclaim key resistance levels. The market is now approaching a critical decision point that could define LINK’s next move.
Why LINK Price is Hovering Around $12.5?
On the daily chart, LINK continues to print lower highs and lower lows, a classic bearish structure. Every rebound attempt over the past two months has stalled below prior support zones, which have now turned into resistance. This behaviour signals distribution rather than accumulation.
The sharp breakdown in October was followed by weak recovery attempts, showing that buyers have not stepped in aggressively. Until this structure changes, the broader trend remains tilted to the downside.
The $12–$12.20 area is the most important level on the chart right now. Volume has remained relatively low, suggesting a lack of strong demand. If buyers were in control, the chart would show stronger bounces and follow-through. Instead, price is compressing near the level, increasing the risk of a breakdown.
What happens next?
A clean daily close below $12 would likely trigger another leg lower rather than a temporary dip. Below this level, the next demand zone sits near $11.90–$11.50, where buyers previously stepped in. Such a move would not indicate panic but a continuation of the existing trend. In weak market conditions, altcoins like LINK tend to follow momentum rather than reverse abruptly.
Besides, to invalidate the bearish setup, the price must reclaim $12.80–$13.30 and hold above it. This zone marks previous support that repeatedly capped recent rallies. A breakout above it, supported by rising volume, would signal that sellers are losing control.
Without this reclaim, upside moves are likely to be sold into rather than extended.
Why Is LINK Underperforming Right Now and What’s Next?
LINK’s weakness also reflects broader market conditions. With Bitcoin and Ethereum consolidating and liquidity thinning, capital is rotating away from higher-beta altcoins. In such phases, tokens with weaker structure tend to underperform until market confidence returns. This makes patience critical for traders, as early dip-buying often leads to poor risk-reward setups.
Collectively, Chainlink is not collapsing, but it is clearly failing to reclaim structure. The $12 level is acting as a pressure point, and the lack of strong buying interest keeps downside risks elevated. Until the LINK price reclaims key resistance at $15 with volume growth, the trend may remain sideways to lower.
U.S. regulators have cracked down on a large crypto scam that used social media and messaging apps to lure unsuspecting investors. The Securities and Exchange Commission (SEC) has charged seven entities for allegedly running a coordinated scheme that siphoned more than $14 million from retail investors across the United States.
According to the SEC, the operation wasn’t built around real crypto trading at all. Instead, it relied on trust-building tactics, fake platforms, and misleading promises designed to exploit people looking for investment opportunities online.
How the Scam Reached Victims
The scheme reportedly ran from early 2024 through January 2025 and began with targeted ads on popular social media platforms. These ads encouraged users to join exclusive “investment clubs” that promised education, AI-powered trading strategies, and consistent returns.
Once users joined, communication shifted to WhatsApp group chats. Inside these groups, scammers posed as experienced financial professionals, gradually building credibility and confidence. Members were shown polished messages and so-called AI-generated trading tips, creating the illusion that the group had access to advanced investment tools.
Fake Platforms and False Profits
As trust grew, victims were instructed to open accounts on what appeared to be legitimate crypto trading platforms named Morocoin, Berge, and Cirkor. The SEC says these platforms were completely fake. No real trading activity ever took place, despite claims that the services were licensed and government-approved.
To deepen the deception, the groups promoted bogus security token offerings linked to fictitious companies. Investors believed they were participating in early-stage crypto opportunities when, in reality, their money was simply being funneled away.
Problems surfaced when investors tried to withdraw their funds. Instead of processing withdrawals, the scammers demanded additional “fees” or charges, claiming they were required to unlock profits or complete transactions. These extra payments only increased investor losses, with no chance of recovery.
The SEC alleges that the stolen funds were moved overseas through a network of bank accounts and crypto wallets, making recovery even more difficult.
SEC Warns of a Growing Trend
The regulator described the case as a textbook example of an “investment confidence scam,” a tactic that is becoming increasingly common in the digital asset space. SEC officials emphasized that fraudsters are exploiting social media, private group chats, and the hype around AI and crypto to appear legitimate.
Alongside the charges, the SEC issued a fresh warning urging investors to be cautious of unsolicited investment advice, especially in messaging apps. The agency advises verifying anyone offering investment opportunities through official channels like Investor.gov.
The case serves as a reminder that if an investment opportunity relies heavily on private chats, guarantees quick profits, or asks for extra fees to access funds, it’s often a major red flag.
Never Miss a Beat in the Crypto World!
Stay ahead with breaking news, expert analysis, and real-time updates on the latest trends in Bitcoin, altcoins, DeFi, NFTs, and more.
FAQs
What is an investment confidence scam in crypto?
It’s a scam where fraudsters build trust over time using fake success stories and guidance, then persuade victims to invest on bogus platforms.
Are legitimate crypto investments promoted through private group chats?
Rarely. Legitimate firms don’t rely on WhatsApp or Telegram groups for investments or pressure users with time-limited offers.
What are common red flags of fake crypto platforms?
Guaranteed returns, no verifiable license, withdrawal fees, unclear ownership, and pressure to reinvest are strong warning signs.
What should investors do if they suspect a crypto scam?
Stop sending funds immediately, document all interactions, and report the case to regulators or cybercrime authorities promptly.
Despite tighter liquidity and a more selective market environment, HashKey Capital has just made an interesting move.
The Asia-based digital asset investment firm has announced the first close of its fourth fund at $250 million.
Here’s everything to know.
HashKey Capital Raises $250M
The fund, officially named HashKey Fintech Multi-Strategy Fund IV, exceeded expectations at its first close and is targeting a final size of $500 million. HashKey said the commitments came from a mix of global institutions, family offices, and high-net-worth individuals, though specific investors were not disclosed.
The timing stands out. Market makers have pulled back since October’s major liquidation event, and on-chain data shows continued outflows from Bitcoin and Ether ETFs. While short-term capital is retreating, HashKey’s latest fund suggests institutions are still backing crypto’s long-term infrastructure story.
“With $250 million in new capital, we are uniquely positioned to capture the massive growth occurring in emerging markets,” said Deng Chao, CEO of HashKey Capital. “These regions are the true testing grounds for blockchain’s real world applications.”
Fund IV will follow a multi-strategy investment approach, combining public-market exposure with liquidity-generating crossover opportunities and selective private investments.
The focus will be on blockchain infrastructure, scalable platforms, and projects built for mass adoption.
HashKey’s track record adds weight to the raise. Since launching in 2018, the firm has grown to manage over $1 billion in assets and has invested in more than 400 blockchain projects globally. Its first fund delivered a distributed-to-paid-in ratio of over 10x, reflecting strong historical returns.
What’s Next for HashKey?
HashKey Capital’s fund announcement also comes just days after HashKey Holdings made its trading debut on the Hong Kong Stock Exchange (HKEX) following a $206 million initial public offering.
Looking ahead, HashKey’s leadership sees the next phase already forming.
“As we look toward 2026, the convergence of AI, blockchain, and institutional finance is creating unprecedented opportunities,” said Dr. Xiao Feng, Founder of HashKey Group.
Never Miss a Beat in the Crypto World!
Stay ahead with breaking news, expert analysis, and real-time updates on the latest trends in Bitcoin, altcoins, DeFi, NFTs, and more.
FAQs
How could this fund raise affect crypto startups and builders in Asia and emerging markets?
It increases the pool of patient capital available for teams building core infrastructure rather than short-term token projects. This can extend runway, support scaling, and reduce reliance on speculative funding cycles.
Does this development have any regulatory or market credibility implications?
Yes. HashKey’s alignment with regulated markets, including Hong Kong’s evolving digital asset framework, reinforces the perception that compliant crypto investment vehicles are gaining traction.
What should the market watch next after this first close?
Attention will likely shift to how quickly HashKey reaches its $500 million target and where initial capital is deployed. Early investments may signal which sectors institutions see as most resilient through 2026.
Spain is stepping firmly into the spotlight as one of Europe’s most proactive crypto jurisdictions. While global regulators continue to debate how to oversee digital assets, Spain has locked in a clear timeline to implement two major European frameworks, MiCA and DAC8, signaling that regulatory clarity, not delay, is its priority. At a time when crypto adoption is expanding globally, Spain’s approach highlights a widening gap between Europe’s regulatory momentum and the U.S. hesitation.
Why Crypto Matters to Spain Right Now
Crypto has grown far beyond a niche investment in Spain, with rising retail participation, fintech innovation, and growing interest from institutional players. Spanish regulators appear focused on ensuring this growth happens within a transparent and structured framework. By committing early to EU-wide standards, Spain aims to reduce legal uncertainty, attract compliant crypto businesses, and align digital assets with traditional financial oversight.
MiCA Brings Market Structure and Legal Clarity
Spain plans to fully roll out the EU’s Markets in Crypto-Assets Regulation (MiCA) by mid-2026. While MiCA has technically applied across the EU since late 2024, Spain chose to extend a transition period for existing crypto firms until July 1, 2026. This gives businesses time to adapt without disrupting operations.
MiCA introduces consistent licensing rules, consumer protections, and operational standards for crypto service providers. For investors, it reduces regulatory ambiguity. For companies, it creates a predictable environment to scale across Europe under a single framework.
DAC8 Ends Anonymity and Tightens Tax Oversight
Alongside MiCA, spain crypto regulation will enforce DAC8 starting January 1, 2026. This tax-focused directive requires crypto platforms to automatically report user balances, transactions, and asset movements to EU tax authorities. The message is clear: crypto transactions will be treated with the same transparency as traditional financial activity.
While this marks the end of anonymity, it also strengthens legitimacy, making crypto more accessible to banks and institutional investors wary of compliance risks.
While Spain moves decisively, the U.S. remains stuck in legislative limbo. The long-awaited market structure bill has passed the House but continues to stall in the Senate, leaving U.S. crypto firms operating in a regulatory gray zone. This uncertainty contrasts sharply with Europe’s rule-based approach and raises concerns about capital and innovation drifting overseas.
What Next?
As Spain executes MiCA and DAC8, Europe is positioning itself as a regulated, institution-friendly crypto hub. Meanwhile, U.S. lawmakers hint at renewed discussions in 2026. Until clarity emerges stateside, Spain’s strategy underscores a key shift in global crypto policy: clear rules are becoming a competitive advantage, not a constraint.
Never Miss a Beat in the Crypto World!
Stay ahead with breaking news, expert analysis, and real-time updates on the latest trends in Bitcoin, altcoins, DeFi, NFTs, and more.
FAQs
When will Spain fully implement MiCA crypto regulations?
Spain will fully enforce MiCA by July 1, 2026, after a transition period that gives existing crypto firms time to meet licensing and compliance rules.
How will MiCA benefit crypto investors and companies in Spain?
MiCA brings clear rules, consumer protections, and EU-wide licensing, reducing legal risk for investors and helping crypto firms scale across Europe.
Will Spain’s crypto rules impact retail crypto traders?
Yes. Retail users will face more transparency and reporting, but also gain stronger protections, clearer disclosures, and safer regulated platforms.
Why is Europe ahead of the U.S. in crypto regulation?
Europe has adopted unified frameworks like MiCA and DAC8, while U.S. lawmakers remain divided, leaving firms uncertain about long-term rules.
XRP Ledger is already testing quantum-resistant transactions on its network, while Bitcoin developers warn a full upgrade could take years, which may set up a rare tech gap between the two chains.
Gold has jumped more than 70% this year and is now trading near a new record high of $4,406. The rally is being driven by expected interest rate cuts and rising global tensions. At the same time, Bitcoin has been falling compared to gold. Bitcoin is now trading below $87,000, almost 29% down from its recent peak.
This growing gap has left many traders wondering whether Bitcoin can recover and eventually move ahead of gold again.
Gold Still Dominates Safe-Haven Status
For centuries, gold has been the top choice to store value. Recently, many countries and large institutions have rushed to buy gold as global tensions rise, inflation fears grow, and investors expect interest rate cuts.
Gold is widely seen as a safe place to park money during uncertain times. Because of this strong demand, gold prices have surged more than 70% this year, reaching new record levels above $4,400 per ounce.
In contrast, Bitcoin has faced more selling pressure, with its value down roughly 29% from its peak and trading range-bound for weeks.
Why Bitcoin’s Supply Works Differently Than Gold
Gold supply increases slowly each year. When gold prices rise, miners are encouraged to dig deeper, use more machines, and extract more gold. This extra supply slowly enters the market and helps cool prices over time.
Bitcoin works in a completely different way.
Bitcoin has a fixed supply of only 21 million coins. No matter how high the price goes, no new Bitcoin can be created beyond this limit. Every four years, Bitcoin goes through a halving event that cuts the number of new coins entering the market in half. This makes Bitcoin harder to obtain as time passes.
Because of this design, rising demand does not increase Bitcoin’s supply.
Bitcoin could hit $1.5 million in 18 years
Meanwhile, a crypto researcher, David, offers a mathematical calculator using very conservative assumptions:
Gold grows about 2% per year
Bitcoin’s market value doubles every four years
Under these slow estimates, Bitcoin could match gold’s total value in about 18 years. That would place Bitcoin near a $30 trillion market cap, or roughly $1.5 million per coin.
This is not hype. It is basic math based on supply rules.
The Bitcoin-to-gold ratio chart shows how Bitcoin performs compared to gold over time. Right now, this ratio is moving inside a falling wedge pattern, which is often seen before a trend reversal.
Even more important, momentum indicators like RSI and MACD are showing bullish divergence. This means selling pressure is slowing, even though prices remain low. In simple terms, Bitcoin is losing strength less quickly against gold, which often happens before a rebound.
This setup suggests Bitcoin may be forming a base rather than collapsing further.
Never Miss a Beat in the Crypto World!
Stay ahead with breaking news, expert analysis, and real-time updates on the latest trends in Bitcoin, altcoins, DeFi, NFTs, and more.
FAQs
Why is gold outperforming Bitcoin right now?
Gold benefits from rate-cut expectations and geopolitical risk, while Bitcoin faces short-term selling pressure and weaker demand from risk-averse investors.
Can Bitcoin still overtake gold in the long term?
Yes. Bitcoin’s fixed 21 million supply and halving cycles mean long-term demand growth could eventually push its value beyond gold’s market cap.
What does the Bitcoin-to-gold ratio indicate for investors?
The ratio shows Bitcoin’s performance versus gold. Current chart patterns suggest Bitcoin may be stabilizing and preparing for a potential rebound.
The crypto market has come under pressure today, with Bitcoin, Ethereum, and major altcoins like XRP experiencing bearish pressure. While the price action may look concerning, this decline is not being driven by panic or bad news. Instead, market data points to a technical reset driven by leverage, liquidity conditions, and short-term positioning. The pullback comes at a time when Gold made a remarkable rise to $4500 while the S&P 500 closed above 9000 for the first time in history.
Understanding these factors is crucial in determining whether this move signals a deeper weakness or a temporary pullback.
Leverage Unwind Is Driving the Sell-Off
Over the last 24 hours, more than $180–$220 million in leveraged positions were liquidated across the crypto market, with Bitcoin and Ethereum accounting for over 60% of the total. BTC alone saw roughly $65–75 million in liquidations as the price slipped below short-term support. Funding rates, which were holding +0.015% to +0.02% on perpetuals earlier, have started compressing toward neutral. This confirms the move is driven by crowded long positioning getting flushed, not aggressive new short selling.
Spot market data shows declining follow-through. Bitcoin spot volumes are down roughly 25–30% week-on-week, while exchange net flows remain neutral rather than strongly positive or negative. ETF-related inflows have slowed compared to last week, reducing passive bid support. This means the derivatives selling pressure is not being absorbed quickly by spot buyers. When leverage dominates volume and spot participation fades, price typically drifts lower until forced selling exhausts itself.
What’s Next for the Bitcoin Price & Crypto Markets?
Crypto markets are pulling back at a time when Gold and the S&P 500 are printing or holding near all-time highs, and that contrast matters. Traditional markets are pricing in macro stability and controlled easing, while crypto is still digesting excess leverage from the recent rally. In other words, risk is being rewarded in slower-moving assets, while high-beta crypto is forced to reset positioning first.
With U.S. initial jobless claims due in the next few hours, traders are reducing exposure rather than pressing fresh longs. Any upside surprise in claims could reinforce recession fears and tighten risk appetite further, keeping crypto under pressure. Until macro data removes uncertainty and leverage fully resets, crypto remains in consolidation mode, not trend acceleration.
FAQs
Why is the crypto market falling today?
The drop is mainly due to leveraged traders being forced out of positions. It’s a technical reset, not panic selling or negative fundamentals.
Are Bitcoin and Ethereum crashes or healthy pullbacks?
Current price action looks like a normal pullback driven by leverage unwinding. There’s no clear sign yet of a deeper bearish trend forming.
Why is crypto falling while gold and stocks are rising?
Gold and stocks benefit from macro stability and lower volatility. Crypto, being higher risk, often resets leverage before resuming trends.
What should investors watch next in the crypto market?
Watch funding rates, spot buying strength, and macro data. A return of spot demand usually signals that the pullback is ending.
Major cryptocurrency prices are trading sideways this Wednesday as investors exercise caution. This market stagnation is driven by light holiday trading volumes, anticipation of upcoming U.S. economic reports, and a record options expiry this week. According to data from CoinGecko,…
Bitcoin and gold posted nearly identical 2-year returns, but with starkly different volatility, paths, and risk profiles for long-term store-of-value investors. Bitcoin and gold have delivered virtually identical returns over the past two years, despite following markedly different price trajectories…
Buffett’s Berkshire cuts Apple to a 21% weighting and builds a new Alphabet stake, reallocating its tech exposure toward AI, cloud, and digital ads. Warren Buffett’s Berkshire Hathaway Inc. reduced its holdings in Apple Inc. and purchased shares of Alphabet…
Bitcoin is on track for a rare fourth red year as October 10’s record leverage wipeout, weak liquidity, and shaken sentiment weigh on prices and altcoins. Bitcoin is currently trading below its year-to-date starting value, putting the cryptocurrency on track…
Trump urges faster Fed rate cuts after 4.3% GDP growth, with Kevin Hassett citing AI-driven productivity gains as proof inflation risks remain contained. President Donald Trump has called for interest rate cuts following stronger-than-expected U.S. economic growth, arguing that robust…
IMF hails El Salvador’s stronger growth and fiscal discipline even as the country keeps accumulating Bitcoin and restructures its crypto policies. The International Monetary Fund has acknowledged El Salvador’s improving economic outlook and stronger fiscal discipline, marking a shift in…
Pi Network price has formed a bearish setup just as roughly 9 million tokens are set to be unlocked on Thursday, Dec. 25. This could lead to renewed selling pressure on the token. After hitting a November high of $0.279,…
With Washington flipping the script on digital assets, crypto companies struck $8.6 billion in deals in 2025, notching the industry’s busiest mergers and acquisitions year to date. According to a Financial Times report citing PitchBook data, 267 deals were recorded…
Gnosis Chain, which plays a key infrastructural role in Balancer’s ecosystem, has executed a hard fork to recover a portion of funds that were frozen during the $116 million early November exploit of the protocol. According to an official announcement,…
Grayscale has taken another step toward launching a spot Avalanche ETF by filing an updated S-1 registration statement with the U.S. SEC. The amended filing signals ongoing engagement with regulators and keeps Avalanche firmly in the ETF conversation alongside other major layer-1 assets.
This latest move focuses less on headline announcements and more on regulatory fine-tuning, a pattern often seen as ETF applications move deeper into the SEC review process.
What Changed in the Updated Filing?
The revised S-1 introduces adjustments across several technical areas, including in-kind creation and redemption mechanics, expanded risk disclosures, updated tax treatment language, and refreshed financial information. While Grayscale did not disclose management or staking fees in this amendment, it clarified its structure by naming Grayscale Investments Sponsors LLC as the sole sponsor of the trust.
These changes appear designed to directly address SEC feedback rather than introduce new product features, suggesting the process is progressing methodically rather than stalling.
How does this compare to the current Avalanche Trust?
Grayscale’s goal is to convert its existing Avalanche Trust into a spot ETF that would trade on Nasdaq under the ticker “GAVX.” Currently, shares of the trust trade over-the-counter under the symbol AVAXFUN. Approval would mark a significant upgrade in accessibility and visibility for Avalanche exposure among institutional and retail investors.
The filing also arrives shortly after VanEck revealed details for its own Avalanche ETF, including a 0.30% management fee and Coinbase as its staking partner, increasing competition in the AVAX ETF race.
AVAX Price Reacts, Then Cools Off
AVAX has climbed more than 9% over the past week on ETF-related optimism, though the momentum has cooled slightly, with the token slipping over 2% in the past 24 hours. Trading volumes and derivatives data point to fading short-term enthusiasm, with futures open interest declining across major exchanges.
Does this mean SEC approval is guaranteed?
Looking at the current scenario, the chances are less. While the updated filing is a positive signal, SEC approval is not assured. The process can still take time, and additional amendments may be required.
Never Miss a Beat in the Crypto World!
Stay ahead with breaking news, expert analysis, and real-time updates on the latest trends in Bitcoin, altcoins, DeFi, NFTs, and more.
FAQs
What is Grayscale’s Avalanche spot ETF?
Grayscale’s Avalanche spot ETF aims to convert its existing trust into a Nasdaq-listed ETF under the ticker GAVX, increasing accessibility for investors.
How has AVAX price reacted to ETF news?
AVAX surged over 9% recently on ETF optimism but cooled slightly, reflecting fading short-term enthusiasm in trading and derivatives markets.
Is SEC approval for the Avalanche ETF guaranteed?
No, approval is not guaranteed. The updated filing shows progress, but the SEC may request further changes before final authorization.
With the Bitcoin price hovering within a tight range, the Ethereum price is also displaying a similar trend. For over few weeks, the price has been trading close to the $3000 mark, leaving traders unsure about the next major move. Although the spot market has been maintaining calmness, the derivative markets are preparing to increase the volatility. The options data suggest traders are not positioning for an immediate breakout or breakdown, which hints towards an extended consolidation within the current range.
Now the question arises-When will the ETH price break out from the structure between $3000 and $3200?
The Market Is Gearing up for Later, But Not for Now
Ethereum options activity is increasingly concentrated in late-2025 and 2026 expiries, while short-dated contracts remain relatively quiet. This shift usually signals rollover behavior, where traders extend exposure instead of betting on immediate price moves.
Historically, similar patterns have appeared during periods of market uncertainty, such as mid-2023 and early 2024, when ETH spent weeks consolidating before trending later.
Recent options data shows a clear increase in activity in late-2025 and 2026 expiries, while near-term contracts remain relatively light. This usually indicates rollover activity rather than fresh short-term bets. When traders expect a sharp price move, demand for short-dated options typically rises. That is not happening with the Ethereum price right now.
This positioning suggests traders are comfortable holding exposure for the longer term but see limited urgency in the near future. In simple terms, the market is preparing for later, not for now.
Strike Price Data Points to a Defined Trading Range
The distribution of options by strike price adds more context. Most call interest is concentrated between $3,000 and $3,300, while put positioning remains modest. The current put-to-call ratio of around 0.63 shows a bullish bias, but not extreme optimism.
Because of this positioning, the $3,000–$3,200 zone has become a natural trading range. The $3,000 level acts as a psychological support and a major options strike, while $3,200 marks the area where call interest starts to thin. This creates a “pinning” effect, where price tends to stay trapped between these levels unless fresh demand enters the market.
What Could Break Ethereum Price Out of This Range?
Ethereum is currently compressing between rising support near $2,900 and resistance around $3,200–$3,250. This price structure suggests pressure is building, not that the trend has already changed. A bullish breakout requires ETH to reclaim $3,200 and hold above it with strong spot volume.
The ETH price has been maintaining an ascending structure since mid-November and bouncing off the ascending support. Bears have been restricting the rally below $3000 for a few days, while the volume has dropped notably. The volume compression usually results in a stronger breakout, and if this materialises, a rise to $3,200 could be imminent. However, breaking out from the resistance zone between $3225 and $3300 could require more buying volume.
Conclusion
Ethereum is not stuck—it is being deliberately positioned. Options traders are pushing risk into 2026, signalling confidence in higher prices later, but little urgency right now. That positioning aligns with the current price behaviour, where ETH continues to respect the $3,000 floor while failing to attract follow-through above $3,200. Until short-dated options activity and spot volume return, the ETH price is more likely to trade sideways than trend aggressively.
FAQs
Is Ethereum likely to trend immediately or stay sideways?
Ethereum is more likely to trade sideways for now, as volume compression and longer-term positioning suggest a delayed move.
How much will Ethereum be in 2026?
Traders targeting 2026 expect ETH could reach $5,000–$6,000 if adoption and network activity grow steadily.
How much will 1 Ethereum be worth in 2030?
Long-term, ETH could hit $8,000–$10,000 by 2030 if DeFi, NFTs, and institutional adoption keep accelerating.
Will ETH ever hit $10,000?
Yes, ETH could reach $10,000 in a bullish scenario, but it would likely require breaking $6,000–$7,000 first and strong market momentum.
Spain is preparing for a major change in how cryptocurrencies are handled across the country. Starting in 2026, the government will fully enforce new crypto rules that will change how digital asset companies operate and how users are monitored.
Spain’s decision follows the European Union’s broader crypto framework known as MiCA (Markets in Crypto-Assets), which aims to create common crypto rules across all EU countries.
Crypto Firms Will Need Full Licenses
Under the new rules, all crypto companies offering services in Spain will be required to obtain full licenses. This includes crypto exchanges, wallet providers, and platforms that allow users to trade or store digital assets.
Spain has now confirmed clear dates to apply these rules at the national level. From July 1, 2026, only fully licensed crypto firms will be allowed to operate in Spain.
Firms that do not meet the licensing requirements may be forced to stop operating in the country. The goal is to ensure that only regulated and accountable businesses are allowed to serve Spanish users.
Transaction Reporting to Tax Authorities
Another major change affects crypto users directly. From 2026, crypto platforms will automatically report user transaction data to tax authorities. This includes trading history, balances, and fund movements.
The data will also be shared between EU countries, making it harder to hide crypto income across borders. Even small transactions may be reported, giving tax officials far more visibility than before.
Spanish regulators believe this step will help reduce tax evasion and improve financial transparency. It also brings crypto closer to traditional financial systems, where banks already report similar data.
For crypto users, the changes may bring more safety and fewer scams, but also less privacy and higher tax responsibility. Investors will need to be more careful with reporting and compliance.
Crypto companies, especially smaller ones, may face higher costs due to stricter rules. However, larger and regulated firms could benefit from increased trust and long-term stability.
Meanwhile, self-custody wallets are not directly covered by automatic reporting. However, experts warn that once funds move through exchanges, authorities can still track activity and take action if taxes are unpaid.
As 2026 approaches, both users and companies will need to prepare for a more regulated crypto future in Spain.
Never Miss a Beat in the Crypto World!
Stay ahead with breaking news, expert analysis, and real-time updates on the latest trends in Bitcoin, altcoins, DeFi, NFTs, and more.
FAQs
Will existing crypto firms in Spain need to reapply for licenses, or are current approvals sufficient
Existing crypto companies will likely need to ensure their licenses fully comply with the new 2026 regulations. Firms that currently operate under temporary or partial approvals may need to submit updated applications or meet additional requirements to continue operating legally.
Could smaller crypto startups be forced out of the Spanish market?
Yes, smaller firms may struggle with the costs and administrative burden of full licensing and compliance. This could result in some startups exiting Spain or consolidating with larger, regulated companies.
Are self-custody wallet users completely exempt from these rules?
Self-custody wallets themselves are not automatically reported, but any funds moved through exchanges or regulated platforms will be visible to authorities. Users must still comply with tax obligations when transferring assets to or from these platforms.
The cryptocurrency markets are moving through another period of uncertainty as investors worldwide are reevaluating how they generate income from their digital assets. Crypto price appreciation remains the long-term goal for many. However, the cryptocurrency investors’ attention is shifting toward staking coins like Bitcoin, major altcoins, and stablecoins, as a way to earn a steady income without relying solely on market timing.
This crypto market shift reflects a broader change in crypto investor behaviour. Investors are weighing on, rather than keeping assets idle during consolidation phases; crypto holders are increasingly exploring structured models that have lower exposure to short-term volatility. Platforms like the Funds Coin are getting the crypto holders’ attention for offering effortless staking to its users. Staking has therefore emerged as a practical alternative for making passive income, designed to balance income generation today with potential growth tomorrow.
How Funds Coin Is Positioning Staking Yields as a Structured Passive Income Option
For many crypto investors today, simply holding digital assets isn’t enough; instead, of let their crypto sit idle. As markets are moving sideways and crypto price gains are becoming unpredictable, more people are exploring ways to make their crypto work for them instead of just letting it sit idly in a wallet. Funds Coin is a staking platform that has come into focus by showcasing real-time deposit and withdrawal activity, a feature that signals ongoing engagement from users across the globe.
One of the elements tied to this model is the VIP program. Funds Coin’s VIP programs reward users who commit larger investment capital or maintain longer participation in the program. VIP programs are designed to create a tiered experience where higher engagement may lead to enhanced benefits, in essence, rewarding loyalty and deeper involvement.
Funds Coin has an Affiliate programs that offer 7% commission, 3% commission, and 1% commission on level 1 to level 3 referrals, respectively. The Affiliate program generally allows users to earn rewards or commissions when they refer others to the platform, which offers a way of turning community growth into another form of passive income.
Staking and How it Works Within the Funds Coin Ecosystem
Staking is similar to earning interest on a savings account by locking up your funds, and over time, you receive “yield.” Typically, more of the same cryptocurrency is offered as compensation for helping support a network or a platform’s earning model.
In public view, Funds Coin’s platform highlights ongoing user activity and offers ways for participants to put assets into earning cycles.
Stable income- Funds Coin offers a stable income that is automatically deposited into users’ accounts.
Fast and Regular Payouts- Withdrawal requests are automatically processed by the system in a short time, making Funds Coin a reliable source of earnings.
Users’ Funds Security- Users’ funds are safely stored in offline, cold wallet storage like McAfee® SECURE and Cloudflare® SECURE, to maximise protection of funds.
Seamless staking- the platform is easier to use, hence no technical setup is required. All users have to do is sign up, choose a plan, and start earning.
24/7 customer Support- Funds Coin offers 24-hour customer support for its users, allowing them to get assistance within a short period of time. This makes the platform a go-to choice for everyone.
Finally, Tap Into The Leading Money-Making Opportunity
The cryptocurrency investors are opting for crypto staking models that offer simplicity in use, consistency in giving returns, and security of users’ documentation and funds. These features place Funds Coin among platforms offering structured staking options. Some investors may consider platforms like this as part of a broader long-term crypto strategy. Ready to explore passive income strategies tied to Bitcoin, altcoins, or stablecoins? platforms like Funds Coin highlight how structured staking can fit into a broader crypto investment approach.
Crypto veteran Arthur Hayes has deposited another 682 $ETH ($2M) into Binance, continuing his strategy of selling Ethereum to invest in high-quality DeFi tokens. Over the past week, Hayes sold a total of 1,871 $ETH ($5.53M) and acquired 1.22M $ENA ($257.5K), 137,117 $PENDLE ($259K), and 132,730 $ETHFI ($93K), signaling a strong shift toward DeFi opportunities.
Spain will fully enforce key EU crypto rules, MiCA and DAC8, in 2026 to boost oversight and transparency. From January 1, 2026, crypto platforms must collect detailed transaction, balance, and fund‑flow data and report it under DAC8 to EU tax authorities, with exchanges exchanging information by September 2027. Under MiCA, all crypto-asset service providers must obtain full CNMV authorization by July 1, 2026, or cease operations. Spain’s tax authorities can act on tax debts, but self‑custody wallets remain outside reporting rules.
The U.S. economy is flashing resilience, but economist Peter Schiff sees something far more troubling beneath the surface. As fresh macro data paints a picture of strength, Schiff continues to warn that the dollar, Treasuries, and broader financial system are nearing a breaking point. The divide between data-driven optimism and long-term structural fears has never been wider.
U.S. Economy Signals Strength
Recent U.S. GDP data delivered a major surprise, with growth coming in at 4.3% versus expectations of 3.3%. This isn’t a marginal beat; it suggests that economic momentum remains intact despite high interest rates and persistent concerns about inflation. Strong GDP growth typically feeds into improving ISM readings, a key indicator of economic expansion.
Historically, periods of economic strength have been constructive for risk assets. Both major crypto bull cycles in 2017 and 2021 began when ISM stayed firmly above 55, signaling robust economic activity. A strong economy reduces recession fears, improves capital confidence, and encourages investors to rotate into higher-risk assets like equities and crypto. While short-term volatility often follows strong GDP prints, Bitcoin has historically seen brief pullbacks of 4–5%; the medium-term trend has tended to recover and push higher.
Peter Schiff’s Warning: Strength Is an Illusion
Peter Schiff strongly disagrees with this optimistic interpretation. He argues that rising GDP and asset prices mask deeper structural problems, particularly the erosion of confidence in the U.S. dollar. According to Schiff, the surge in gold and silver prices signals a quiet but growing rejection of fiat stability.
Schiff believes the dollar’s safe-haven status is fading, pointing to rising debt levels, weak savings, and increasing reliance on foreign capital. In his view, higher gold prices reflect investors choosing protection over yield, even at the cost of Treasury interest. He warns that once confidence breaks, the dollar could face a sharp selloff, forcing higher interest rates, crashing bond prices, and lowering living standards.
Crypto sits at the crossroads of these opposing narratives. On one side, a strong U.S. economy historically supports risk-on behavior, benefiting Bitcoin and altcoins once short-term volatility fades. On the other hand, Schiff’s thesis frames Bitcoin as a byproduct of monetary instability, thriving only because traditional systems are failing.
Ironically, even as Schiff criticizes Bitcoin, his warnings about currency debasement and loss of trust continue to strengthen the case for scarce, decentralized assets.
Market Implications
Schiff believes a loss of trust in the dollar would not stop at currency markets. U.S. Treasuries could face selling pressure, pushing yields higher and weighing on bond prices. Equity markets may also feel the impact as tighter financial conditions and weaker consumer purchasing power hurt corporate earnings. For everyday Americans, the result could be a noticeable decline in living standards as essentials become more expensive.
Never Miss a Beat in the Crypto World!
Stay ahead with breaking news, expert analysis, and real-time updates on the latest trends in Bitcoin, altcoins, DeFi, NFTs, and more.
FAQs
How might higher Treasury yields affect everyday Americans?
Rising Treasury yields generally translate into higher borrowing costs for mortgages, car loans, and credit cards. This can reduce disposable income and slow consumer spending, potentially lowering living standards even if the broader economy appears strong.
Why could cryptocurrencies perform differently under these conflicting economic narratives?
In a robust economy, cryptocurrencies often act as high-risk investments, attracting capital during bullish sentiment. Conversely, if fiat currency stability weakens, cryptocurrencies may serve as a hedge against inflation or dollar depreciation, drawing interest from those seeking alternative stores of value.
Who would be most directly impacted if confidence in the dollar declines sharply?
Investors holding U.S. Treasuries, large financial institutions, and international partners reliant on dollar-denominated trade could face significant losses. Ordinary Americans might experience higher inflation and reduced purchasing power, while corporations could see borrowing costs rise, affecting profits and hiring.
According to Grayscale Investments, the global push to tokenize real-world assets is only beginning, and Chainlink could become one of the key technologies driving that expansion.
In an interview on the Thinking Crypto podcast, Grayscale Head of Research Zach Pandl said that just a small portion of global assets are currently on blockchain networks, but adoption could accelerate significantly over the next five to ten years as traditional finance moves on-chain.
Chainlink’s Role in Bridging Crypto and Traditional Finance
Grayscale recently launched a Chainlink ETF, converting its existing Chainlink investment vehicle into an exchange-traded fund. Pandl said the ETF structure makes it easier for investors to gain exposure to what he described as one of the most important projects in the crypto ecosystem.
According to Pandl, Chainlink acts as a bridge between blockchains and traditional finance by providing reliable data, compliance tools, and integrations needed for tokenized assets, stablecoins, and decentralized finance to function at scale.
“Chainlink is really the connective tissue between the crypto ecosystem and traditional finance,” he said. “It’s not a bet on one blockchain, but exposure to where the entire industry is going
ETFs Expand Beyond Bitcoin and Ethereum
Pandl also highlighted Grayscale’s expanding lineup of crypto ETFs, including products tied to XRP, Solana, Dogecoin, and Chainlink. He said regulatory clarity has accelerated the pace at which new crypto ETFs are coming to market, following the long approval process for Bitcoin and Ethereum ETFs.
XRP, originally built for payments, is now expanding into broader use cases, while Solana continues to attract activity due to its speed and low costs. Dogecoin, Pandl noted, represents a different segment of the market but reflects the growing diversity of investor interest.
Grayscale has also shown interest in privacy-focused assets such as Zcash, which Pandl said addresses a major gap in public blockchain systems.
“If public blockchains are going to transform finance, they must support privacy,” Pandl said. “Institutions will not operate on systems where payrolls, balances, and transactions are fully visible.”
Market Pullback Seen as Typical, Not a Cycle Top
Addressing recent market weakness, Pandl said Bitcoin’s roughly 30% decline from its recent highs may feel severe but is consistent with past bull markets.
He emphasized that Bitcoin frequently experiences multiple pullbacks of 10% to 30% during strong cycles and that Grayscale does not see signs of a major, long-term downturn.
“A 30% pullback is actually about an average drawdown for Bitcoin,” Pandl said. “We do not believe we are on the cusp of a larger multi-year decline.”
Pandl said two forces continue to support crypto markets: rising demand for alternative stores of value amid growing debt and inflation risks, and increased institutional access driven by clearer regulations.
He added that capital continues to flow into crypto through ETFs, platforms, and institutional products as regulatory barriers ease.
Tokenization Could Grow 1,000x
Pandl said tokenized assets currently total around $30–35 billion, which represents just a tiny fraction of global equity and bond markets worth roughly $300 trillion.
He believes tokenized assets could grow by as much as 1,000 times over the next five years as traditional financial instruments move on-chain.
Tokenization, he said, could allow markets to operate around the clock, speed up settlement times, and unlock new financial services such as on-chain lending and collateralization.
Grayscale sees platforms like Ethereum as likely hosts for tokenized assets, while infrastructure providers like Chainlink enable the data and connectivity required for adoption.
Volatility Likely to Remain, But Diversification Value Stays
Pandl said crypto’s correlation with equities has increased as the market has grown, but it still behaves more like a commodity than a stock index.
Bitcoin and other large digital assets may move with equities at times, he said, but often follow their own fundamentals, making them useful portfolio diversifiers.
While acknowledging the risks and volatility involved in crypto investing, Pandl said current prices may offer long-term investors a chance to build positions.
“If you’re optimistic about the long-term vision, a lower price is an opportunity,” he said. “From our perspective, this is a good time to begin accumulating the asset class.”
Grayscale remains optimistic about crypto’s long-term outlook, citing continued innovation, growing institutional interest, and steady progress toward regulatory clarity in the United States.
Never Miss a Beat in the Crypto World!
Stay ahead with breaking news, expert analysis, and real-time updates on the latest trends in Bitcoin, altcoins, DeFi, NFTs, and more.
FAQs
How could tokenization impact traditional financial markets?
Tokenization allows traditional assets such as stocks, bonds, and real estate to exist on blockchain networks, which could significantly increase market efficiency. It may reduce settlement times, enable 24/7 trading, and allow new financial products like on-chain lending and collateralization. Over time, this could change how investors access and interact with conventional markets.
Who benefits most from the growth of crypto ETFs?
Institutional and retail investors stand to gain easier, regulated exposure to a broader range of digital assets through ETFs. These products reduce the complexity and custody risks of holding cryptocurrencies directly, while allowing investors to diversify across assets such as Chainlink, Solana, and XRP.
Crypto assets are still influenced by speculative trading, regulatory developments, and technological shifts, so significant price swings are expected even as adoption increases. However, their fundamental drivers—such as tokenization growth and demand for alternative stores of value—can provide long-term stability and diversification benefits for investors.
Bitcoin price slipped today below $87,000, falling nearly 1%, as multiple pressures hit the market at the same time. After weeks of moving sideways between $85,000 and $90,000, Bitcoin is struggling to find strong support, leaving traders cautious.
China’s Mining Crackdown Triggers Supply Pressure
One of the biggest reasons behind today’s drop is China’s renewed crackdown on Bitcoin mining. Reports show that authorities shut down large mining operations in Xinjiang earlier this month. As a result, an estimated 400,000 miners went offline in a very short period.
This sudden disruption caused Bitcoin’s network hashrate to fall by around 8%, signaling a real operational shock. When miners are forced offline, their income stops instantly.
Many then face relocation and setup costs, which often lead them to sell Bitcoin to cover expenses. This creates real selling pressure, not speculation.
ETF Outflows Signal Institutional Rotation
At the same time, institutional demand has weakened. Spot Bitcoin ETFs have now recorded three straight weeks of outflows. On December 23 alone, ETFs saw $186.6 million leave the market. BlackRock led the withdrawals with $157.3 million, followed by Fidelity and Grayscale.
This trend suggests institutions are rotating funds away from Bitcoin, at least temporarily.
Many analysts believe that money is moving into gold, which recently hit a fresh all-time high above $4,400, strengthening the safe-haven trade.
Adding more pressure is the largest Bitcoin options expiry in history. Over $23.6 billion worth of BTC options expired on Deribit, involving nearly 268,000 contracts.
Such large expiries often cause sharp moves, especially during low-liquidity holiday weeks. Traders usually see choppy price action before expiry, followed by a clearer move afterward.
What Comes Next for Bitcoin?
Despite weak sentiment, some technical signs remain hopeful. Bitcoin has printed multiple golden crosses this month, and historically, BTC rarely closes two years in a row in the red.
Still, analysts at CryptoQuant warn that if pressure continues, Bitcoin could retest the $70,000 to $56,000 range in the coming months before a stronger recovery begins.
For now, Bitcoin’s drop looks driven by policy shocks, institutional rotation, and market mechanics, not a collapse in long-term demand.
Never Miss a Beat in the Crypto World!
Stay ahead with breaking news, expert analysis, and real-time updates on the latest trends in Bitcoin, altcoins, DeFi, NFTs, and more.
FAQs
How does China’s mining crackdown affect Bitcoin?
Shutting down miners lowers the network hashrate and forces some to sell Bitcoin to cover costs, creating real selling pressure.
Are institutions selling Bitcoin ETFs right now?
Yes, spot Bitcoin ETFs have seen three straight weeks of outflows, suggesting some funds are temporarily rotating into safer assets.
Could Bitcoin fall further in the coming months?
If selling pressure continues, Bitcoin might retest $70,000–$56,000, though long-term demand remains strong.
Ripple is back in the spotlight after moving a large amount of XRP off its wallet, reigniting debate around the token’s short-term outlook. Blockchain tracker Whale Alert flagged a transfer of 65 million XRP, valued at roughly $121 million, from a Ripple-linked address to an unknown wallet. The transaction arrived during a fragile market phase, immediately drawing attention from traders and analysts alike.
The XRP Dump? Timing Raises Eyebrows
The transfer occurred as the broader cryptocurrency market was already under pressure. XRP itself was trading in the red, struggling to regain momentum after recent volatility. Because the funds were sent to an unidentified address in a single transaction, speculation quickly followed. Some market participants questioned whether Ripple was preparing for a sell-off or repositioning liquidity amid uncertain conditions.
That said, large XRP movements from Ripple are not unprecedented. The company has historically shifted tokens for operational reasons, including treasury management, partnerships, and supporting its payment infrastructure. Without further clarification, the intent behind this transfer remains unclear.
The crypto community appears split on what this move means. On one side, short-term traders worry that such a transfer could add selling pressure, especially as XRP continues to trade below key psychological levels. On the other hand, several observers argue the transaction may be linked to Ripple’s ongoing business activities rather than an outright dump.
Ripple has regularly moved XRP to support institutional clients and expand its cross-border payment services. Given the firm’s growing engagement with financial institutions, the transfer could reflect backend activity rather than a bearish signal.
XRP Price Still Under Pressure
Despite signs of steady institutional interest, XRP’s price action remains weak. Since the sharp market correction earlier this cycle, the token has struggled to hold higher levels. After briefly showing signs of recovery, XRP has slipped back into negative territory.
Crypto user, DeFi Peniel highlights a sharp divergence in XRP’s current setup, noting that while overall sentiment around the token has turned strongly bearish, capital flows tell a different story. He points out that XRP is still holding a key demand zone between roughly $1.82 and $1.98, suggesting the price is being defended despite lackluster action.
At the same time, XRP-linked investment products recorded nearly $44 million in net inflows on December 22, indicating institutional money is stepping in quietly. According to Peniel, this contrast between negative social sentiment and steady inflows is often seen during accumulation phases, where weaker hands have already exited, and larger players absorb supply before a potential shift in trend.
Never Miss a Beat in the Crypto World!
Stay ahead with breaking news, expert analysis, and real-time updates on the latest trends in Bitcoin, altcoins, DeFi, NFTs, and more.
FAQs
Why do transfers to “unknown wallets” often worry crypto traders?
Unknown wallets create uncertainty because they are not immediately linked to exchanges, custodians, or known partners. Traders fear such transfers could later move to exchanges and increase sell-side liquidity, even though many ultimately remain inactive or belong to institutional custody setups.
Does a large token transfer automatically affect XRP’s circulating supply?
No. Moving XRP between wallets does not change the circulating supply unless the tokens are sold into the open market. The actual market impact depends on whether those funds eventually reach exchanges and are converted into trades.
Who is most exposed to the short-term impact of such movements?
Short-term traders and leveraged positions are typically the most affected, as sudden sentiment shifts can increase volatility. Long-term holders and institutions are generally less sensitive unless on-chain data later shows sustained distribution or structural changes in liquidity.
Gold and silver continue to draw defensive inflows as investors seek stability amid macro uncertainty, reinforcing their role as preferred safe-haven assets.
Russia’s central bank plans to let non-qualified investors buy the most liquid cryptocurrencies after passing a knowledge test, with annual purchases capped at 300,000 rubles ($3,800).
Holiday periods often mean lower volume and calmer price action, even though some assets try to bounce. Sadly for Ripple fans, the XRP price isn’t showing much holiday spirit.
Binance Coin price has dropped by 40% from its highest point this year and is at risk of forming a death cross pattern that will lead to more downside.
ETCMining focuses on green, high-stability computing infrastructure for compliant crypto mining. The formal entry of XRP algorithmic trading into the U.S. retirement market signifies that cryptocurrency investment is moving towards compliance and systematization. Investors can now utilize strategies from Digital…
Ripple (XRP) token dropped to $1.8800, its lowest level since Dec. 19, and ~50% below its highest point this year. This decline mirrored the performance of Bitcoin (BTC) and other altcoins.
Solana (SOL) token was trading at $124.50, and could be at risk of more downside after forming bearish chart patterns on the daily chart. Some of its most important metrics have also dropped in the past few weeks.
Hedera (HBAR) price continues to trade under sustained downside pressure, with technical signals pointing to an elevated risk of capitulation if key support levels fail to hold.
Cardano just drew 69% of Binance's top traders to the long side as "new ADA" Midnight ripped to a $1.25 billion valuation, turning the network's quiet December into its loudest comeback signal in months.
Bloomberg’s Mike McGlone says Bitcoin’s real fight is against gold, not the dollar, and the BTC/gold ratio could slide toward 10x in 2026, costing another full 50%.
Half a billion dollars in Bitcoin just left Coinbase for an unlabeled wallet, and after the transfer the address went dark with zero explanation, and all eyes on the chain.
A crypto crash is underway today, Dec. 23, with Bitcoin and most altcoins being in the red, and the market capitalization of all coins falling by 2.45% to $2.95 trillion.
Tron price stabilizes at key $0.27 support as a bullish three drives pattern forms, signaling potential downside exhaustion and a possible rotation toward higher resistance levels.
Data-driven crypto investing accelerates as Investor Hash delivers AI-powered, blockchain-based asset management globally. The crypto investment market is quickly moving towards formalized, data-driven investment. Because volatility is one of the characteristics of digital assets, more investors are focusing on intelligence,…
As Solana narrows the revenue gap with Ethereum, investors are shifting focus from chain rivalry to structured yield strategies that keep crypto assets productive during volatile markets. #partnercontent
Record $23B Bitcoin options expire Dec. 26, with max pain near current ranges and liquidity thin, setting the stage for sharp BTC volatility. A record $23 billion in Bitcoin options contracts are scheduled to expire on Friday, December 26, representing…
Payment processor Shift4 now lets hundreds of thousands of merchants settle via stablecoins on Polygon, a shift that could support Polygon price and reduce banking frictions. Payment processor Shift4 now offers stablecoin settlement on the Polygon blockchain, giving hundreds of…
XRP printed $0 in short liquidations, even as total crypto liquidations hit $227,930,000 and the next price push trapped bulls again on the breakout try.
A Justin Sun‑linked WLFI wallet remains blacklisted, freezing tens of millions in tokens as WLFI’s price weakens and investors question governance and “decentralized” control. A cryptocurrency wallet linked to entrepreneur Justin Sun remains blacklisted by World Liberty Financial’s WLFI token…
Loyal Miner has launched its Christmas Power Week, offering limited-time hashpower bonuses and cashback incentives for users looking to earn through cloud mining during the holidays. #partnercontent
The crypto market today, including Bitcoin and Ethereum and majors are range‑bound with leverage drained and sentiment fragile, leaving the next US GDP print to decide if volatility returns or fades. The crypto market today heads into the US GDP…
The crypto market today, including Bitcoin and Ethereum and majors are range‑bound with leverage drained and sentiment fragile, leaving the next US GDP print
Tuesday opens with Brandt saying Bitcoin's -80% crashes are part of the deal, XRP takes volume back from Cardano's new privacy token and SHIB slides toward its Black Friday floor.
Michael Selig, ex‑SEC Crypto Task Force counsel, becomes the 16th CFTC chair as Caroline Pham departs for MoonPay, inheriting crypto pilots and looming DA legislation. Michael Selig was sworn in Sunday as the 16th chairman of the Commodity Futures Trading…
Michael Selig, ex‑SEC Crypto Task Force counsel, becomes the 16th CFTC chair as Caroline Pham departs for MoonPay, inheriting crypto pilots and looming DA
Bitcoin price has traded below its two-year bull market channel for six weeks, with a 2021-style rounded top and VanEck’s hashrate drop data framing a pivotal retest of resistance. Bitcoin price is currently trading below its long-term bull market channel…
BNB price is eyeing a retest of a key support trendline as it continues to remain in a downtrend. A break below the said pattern could trigger a 15% drop in BNB price ahead. According to data from crypto.news, BNB…
Monero price slid on heavy selling into nearby support after multiple failed rebounds, with weak bounce volume and neutral RSI leaving room for further volatility in the short term. Current Monero price is hovering around $440–465, with recent daily closes clustered…
As crypto volatility continues to test investors’ nerves, some are turning to cloud mining platforms like HOLYMining to reduce risk and build steadier, long-term returns. #partnercontent
BlackRock names its spot Bitcoin ETF a top 2025 theme alongside cash-like Treasuries and U.S. blue chips after $25b of inflows, signaling BTC’s place in core portfolios. BlackRock, the world’s largest asset manager, has designated its spot Bitcoin ETF as…
BlackRock names its spot Bitcoin ETF a top 2025 theme alongside cash-like Treasuries and U.S. blue chips after $25b of inflows, signaling BTC's place in core
XRP, the cross-border payment token, fell below a key support level after failing to break through resistance at the start of the week, according to market data. The digital asset recorded minor gains on Monday but subsequently declined following the…
The digital asset recorded minor gains on Monday but subsequently declined following the rejection at the resistance level, mirroring broader cryptocurrency
Aave Labs and the Aave DAO battle over CoW Swap fee flows, with delegates pushing to move all Aave IP, brand and frontend assets under direct tokenholder control. A governance dispute has emerged within the Aave protocol ecosystem, pitting the…
Hong Kong’s insurance regulator drafts first Asian framework letting insurers hold crypto under a 100% risk charge while stablecoins track fiat-based capital rules. The Hong Kong Insurance Authority has published draft regulations enabling insurers to invest in cryptocurrencies with a…
Hong Kong's insurance regulator drafts first Asian framework letting insurers hold crypto under a 100% risk charge while stablecoins track fiat-based capital.
Chainlink price has been in a strong downtrend since late August and is now close to confirming a bearish double top pattern. In the meantime, whales have started offloading significant amounts of LINK, which could trigger further downside ahead. According…
El Salvador and the International Monetary Fund have made notable progress in their ongoing negotiations over Bitcoin policy and economic reforms, as the country looks to access a $1.4 billion loan package. According to an official statement published on Dec.…
The world’s largest corporate holder of Ethereum, Bitmine Immersion Technologies, now holds over 4 million ETH after its latest buy. “Bitmine continues to add steadily to its ETH holdings, adding 98,852 ETH in the past week, and Bitmine holdings now…
MetaMask adds native Bitcoin, SegWit support and multichain swaps as Consensys advances Linea, rewards and broader Bitcoin L2 ecosystem plans. MetaMask has added native Bitcoin support to its cryptocurrency wallet platform, enabling users to purchase Bitcoin with fiat currency, transfer…
Crypto prices today were largely flat as traders stayed defensive ahead of a record options expiry later this week. The total crypto market cap slipped 0.8% to $3.07 trillion. Bitcoin traded at $88,088 at press time, down 0.7% over the…
Curve Finance has moved back into the spotlight, not because of hype, but due to where users are actually paying fees on Ethereum. While DAO discussions continue in the background, on-chain data now shows Curve sitting at the center of…
Bitcoin’s network activity is flashing a signal that has often appeared near market lows. The latest data shows pressure across miners, traders, and short-term holders, even as long-term conviction stays intact. Bitcoin’s network hashrate fell about 4% over the past…
Kalshi has launched an in-house research unit and released data showing its inflation forecasts beat Wall Street. Kalshi is taking a step beyond trading. The U.S.-regulated prediction market has launched a dedicated research arm aimed at turning its data into…
Domains, social media accounts and other key access points should be controlled by the Aave DAO, BGD Labs' Ernesto Boado says. Aave's founder clapped back
XRP sentiment just flipped negative really fast on social media, and the price history shows that this kind of crowd doubt often comes right before a rebound, not after it.
XRP continues to rally as large holders continue to move the token in large quantities. However, the latest of such a move has sparked curiosity as to its purpose.
Top traders on Binance just flipped bullish on Shiba Inu (SHIB) today, with accounts now 62.3% long, and the price of SHIB coin holds near $0.0000073 as bulls eye a breakout.
Peter Brandt says Bitcoin's chart right now is basically a continuation head-and-shoulders, and BTC proved how tricky this range is by tagging a weekly high at $90,000.
XRP just became the only big winner in CoinShares' flows this week, with $62.9 million in, up 34% from last week, while crypto funds bled $952 million amid Clarity Act delays.
BlackRock-tagged wallets just pushed about $270 million in BTC and ETH into Coinbase Prime, and with ETF flows turning red, it is no surprise that market participants now treat every new tranche-like potential sell supply.
On Monday, the crypto market kicked off, with XRP getting a public boost from Solana's founder, SHIB dipping closer to zero and Bitcoin making a massive comeback after a sudden leverage reset.
XRP just got a self-proclaimed chief executive officer on X this week, and it is not from Ripple; it is a man who calls himself the holder of the world's highest IQ, slapping the "XRP CEO" label on himself.
A possibility of a recovery is certainly there, but the lack of upside on the bullish side of the market is what's making a proper momentum increase impossible.
Selling Bitcoin (BTC) in January can be the most expensive "safe" move traders make, because the calendar has a habit of turning sellers into late buyers.
XRP is pressing BNB for the top-three non-stablecoin slot right now, with market caps split by about $1.35 billion, so one hard session can flip the ranking and rewrite the narrative.
Cardano's founder Charles Hoskinson has hinted that "a storm is coming," fueling talk that the "new ADA" project Midnight could be entering its next phase after 40% growth in a week.
Sunday close on the crypto market is about how XRP still defends its Bollinger mid band, keeping $3.60 on the map, while Midnight (NIGHT) logs a +40% week and Vitalik Buterin swaps out BNB into crypto winter again.
XRP might beat every major chain to quantum safety with a new XRPL proposal that introduces single-use keys that rotate every transaction, turning "quantum panic" into real on-chain defense.
The mind that could be theoretically capable of solving cold fusion or decoding the Voynich manuscript is using that massive processing power to... post about XRP.
XRP long traders have gone completely silent in the last hourly liquidation session as only short traders suffered the overall wipe-off that happened during the event.
Shiba Inu netflow has dipped hard as a key metric prints a bullish signal with over 125 billion SHIB marking the difference between tokens flowing in and out of exchanges.
Brian Armstrong has promised to find all crypto scammers targeting the funds of its customers after recently joining efforts with the Brooklyn District Attorney's Office to fight bad actors.
Crypto market today: SBI Group is now a massive institutional partner of Ripple; SHIB whale resurfaces after year-long silence; Ethereum whale multisig drained for $27.3 million.
XRP may still end 2025 with a close above $2, but the Bollinger Bands keep it brutally honest, warning that the window is as open as it is narrow and pricey.
BitMine’s Ethereum treasury continues to grow, as the firm will not stop stacking Ethereum in large quantities despite unstable crypto market conditions.
RLUSD just cut supply by 500,000 tokens via a burn to Ethereum's null address, as Ripple teams up with Wormhole to bring the stablecoin to Optimism, Base and Unichain.
Popular meme coin Shiba Inu nears January 2026 after 10 red months in 2025, with $0.00000678 as the floor - hold it and a rebound can breathe, lose it and the year’s sell-off will stay in control.
YoungHoon Kim, the "IQ 276" figure, suddenly dropped three aggressively bullish XRP calls in one day, not only framing the token as a capital rail but also saying that $2 is "nearly free" for it.
Friday's bounce comes with weekend nerves: Ripple's CEO checks Coinbase on XRPL basics, SHIB pops 5% and traders whisper "fakeout," while $444 million in BTC hits Binance for a deposit.
Ripple just invested in regulated broker TJM, with digital-asset coverage confirmed in the coming months, and of course, the crypto market's first question is what this all means to XRP.
XRP continues to witness strong institutional demand, as all its ETFs have not recorded any outflow yet, maintaining steady capital intake for over one month.
Almost one trillion SHIB woke up after two years, and these Shiba Inu coins did not stay private as the on-chain trail ran into the OKX wallet, putting a sleeping whale back on every meme coin holder's radar.
Whale multisig was drained for $27.3 million after a private key compromise, with 4,100 ETH already pushed through Tornado Cash and the attacker still controlling the wallet.
XRP just printed a 122,680% liquidation imbalance in under 24 hours, and it was not shorts getting hit, but the long side that got crushed, right before the price made a pivot.
Thursday's crypto check with Ripple CTO dropping a "Wow!" on an XRPL Payment Engine milestone, SHIB drifted to its "Black Friday" floor and Bollinger Bands still point to $52,250 for Bitcoin.
Need to know what happened in crypto today? Here is the latest news on daily trends and events impacting Bitcoin price, blockchain, DeFi, NFTs, Web3 and crypto regulation.


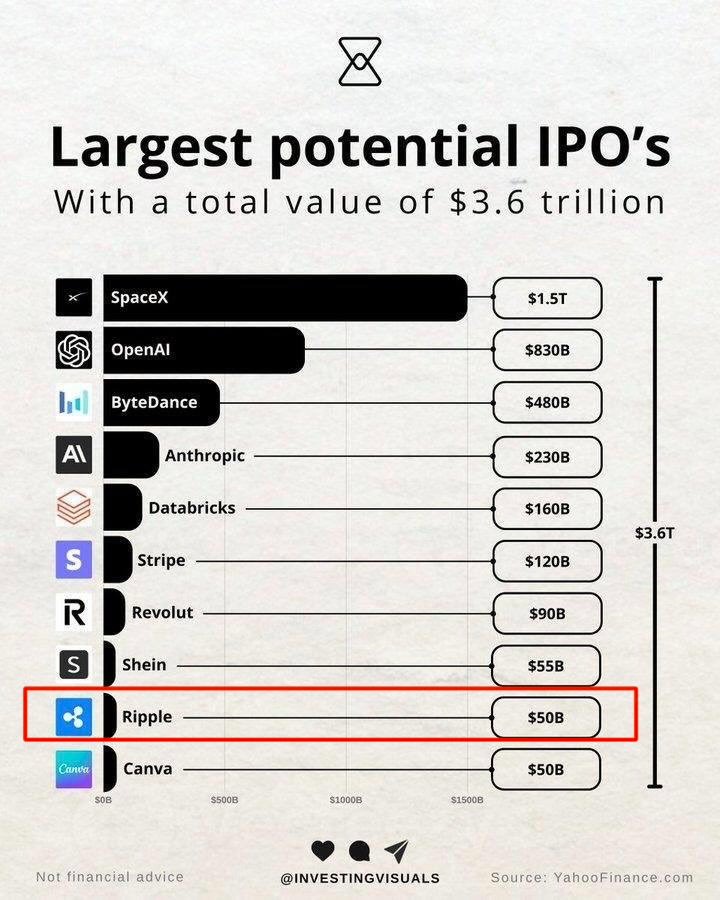

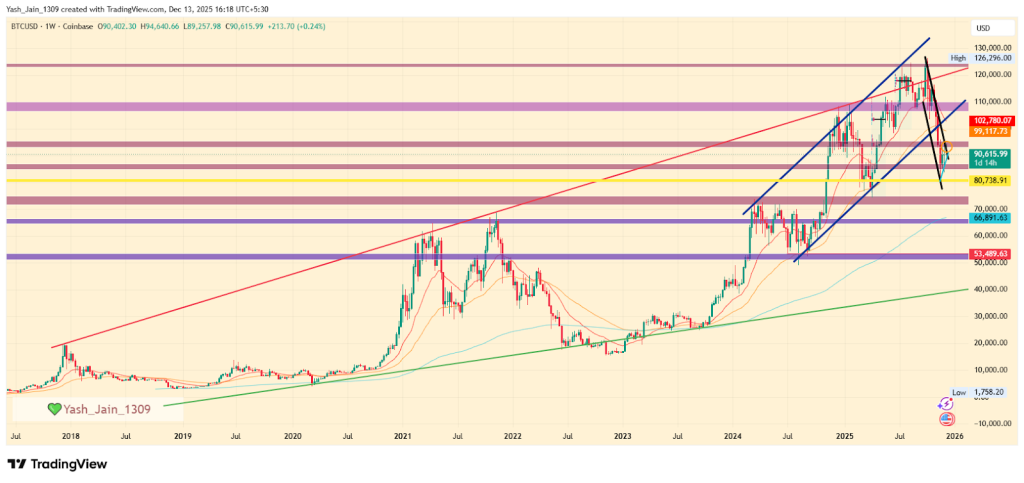
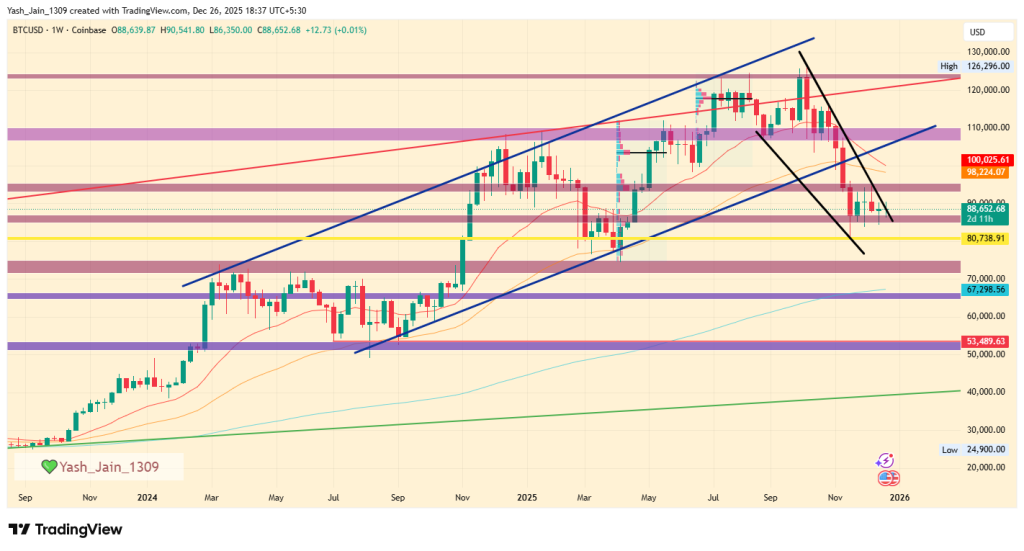
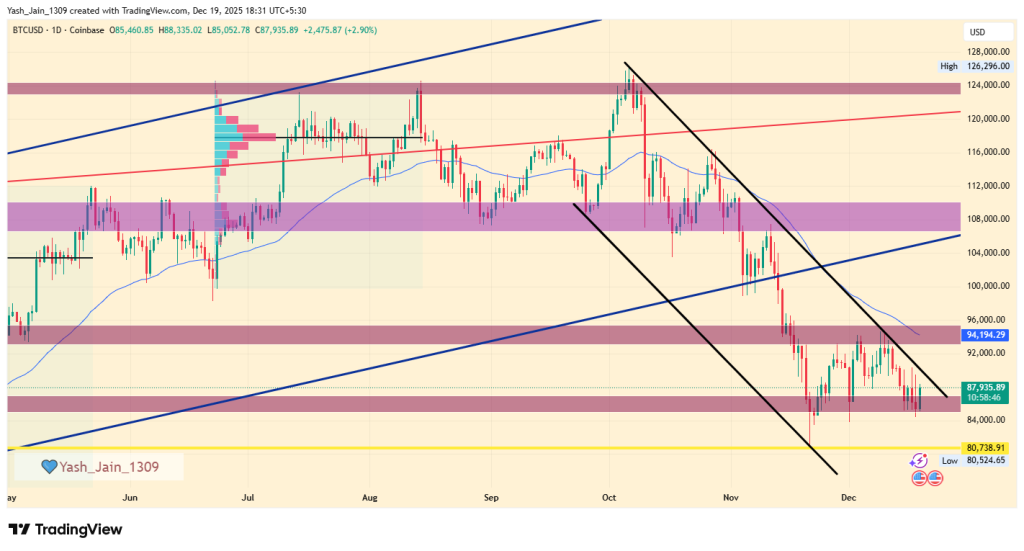


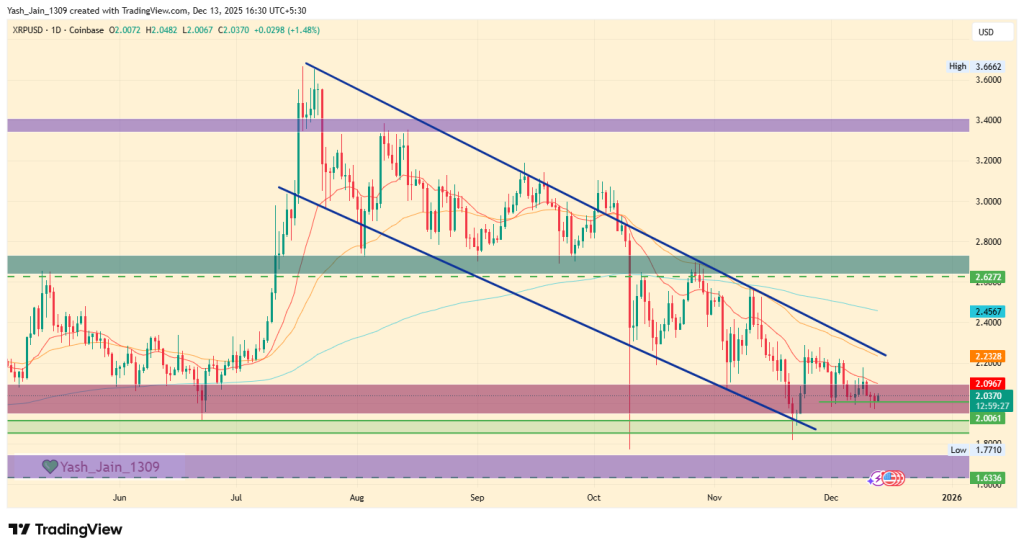
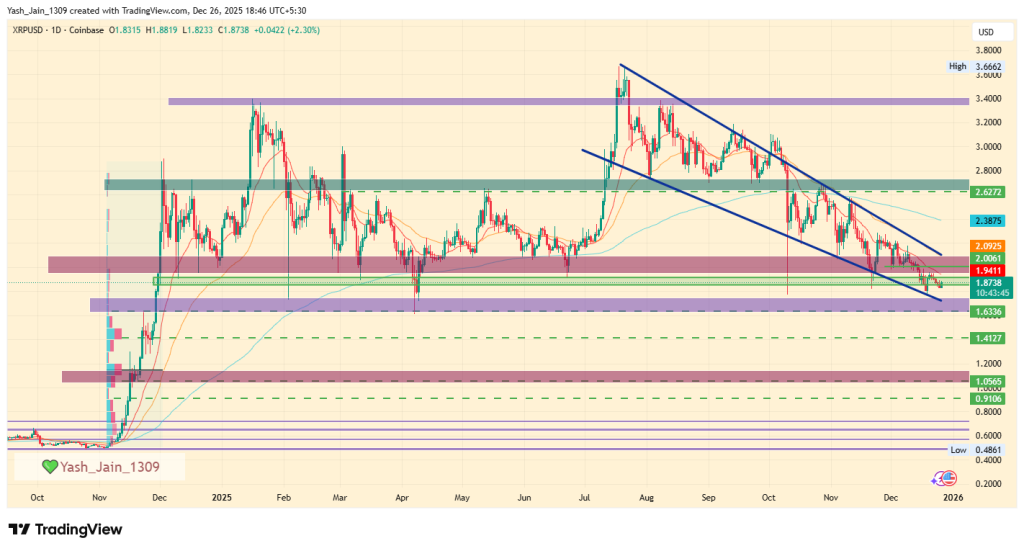
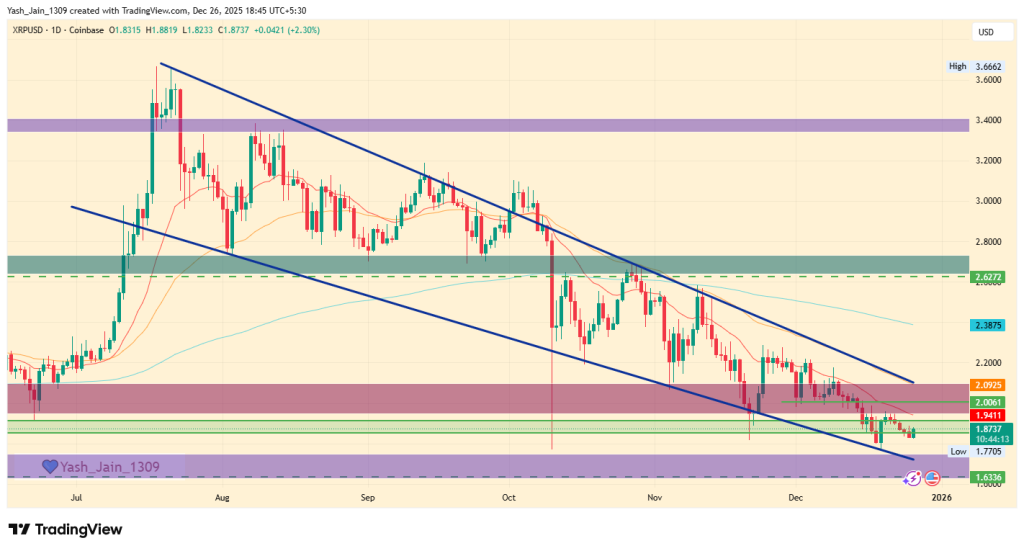

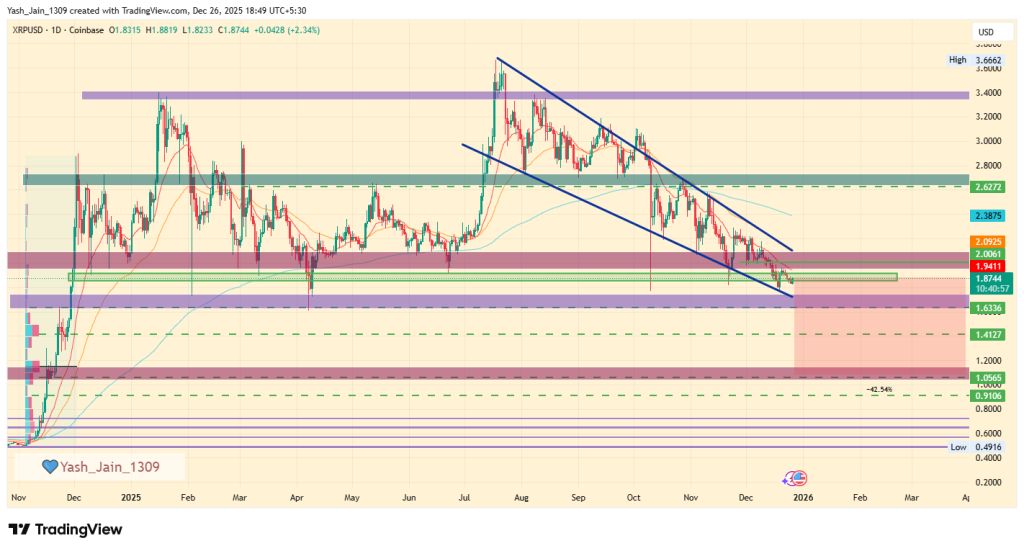
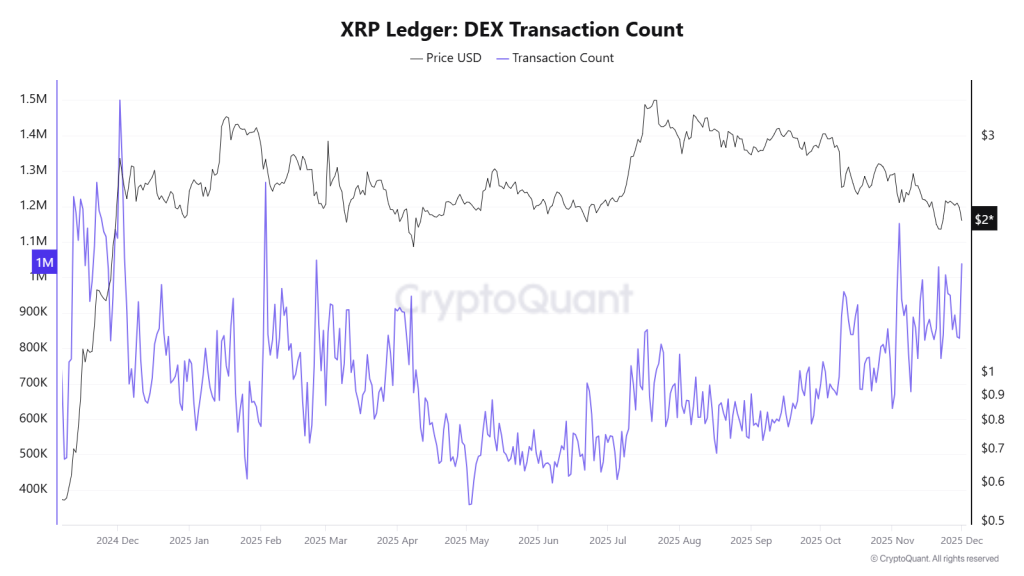
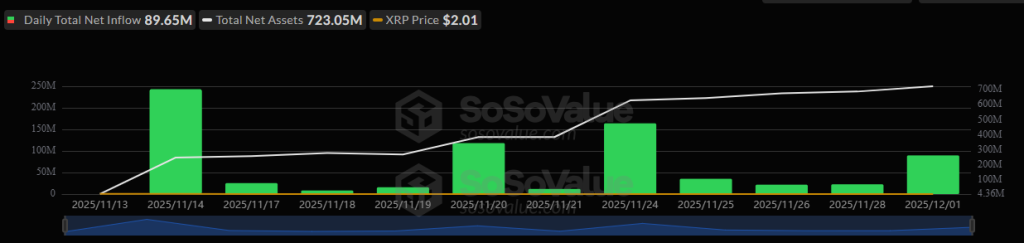

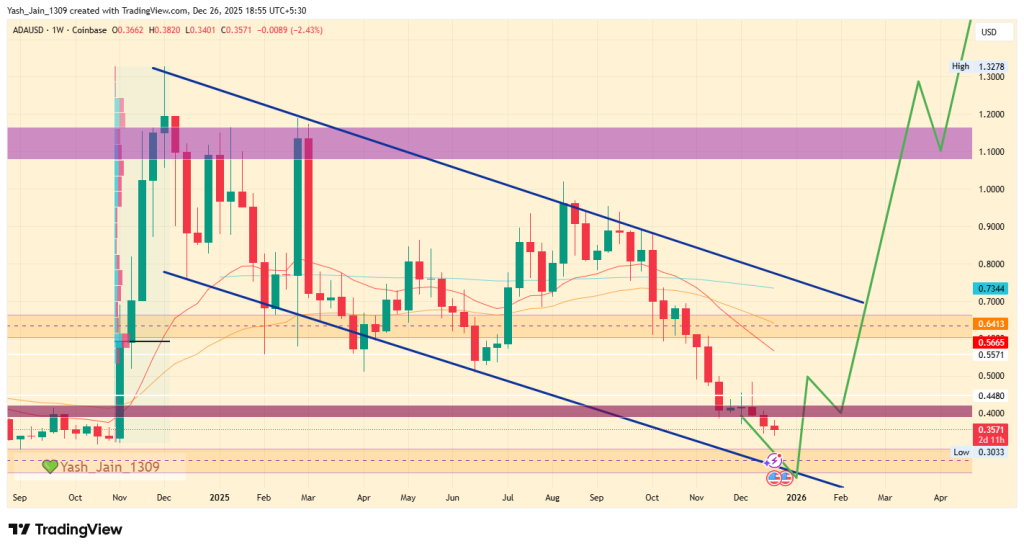
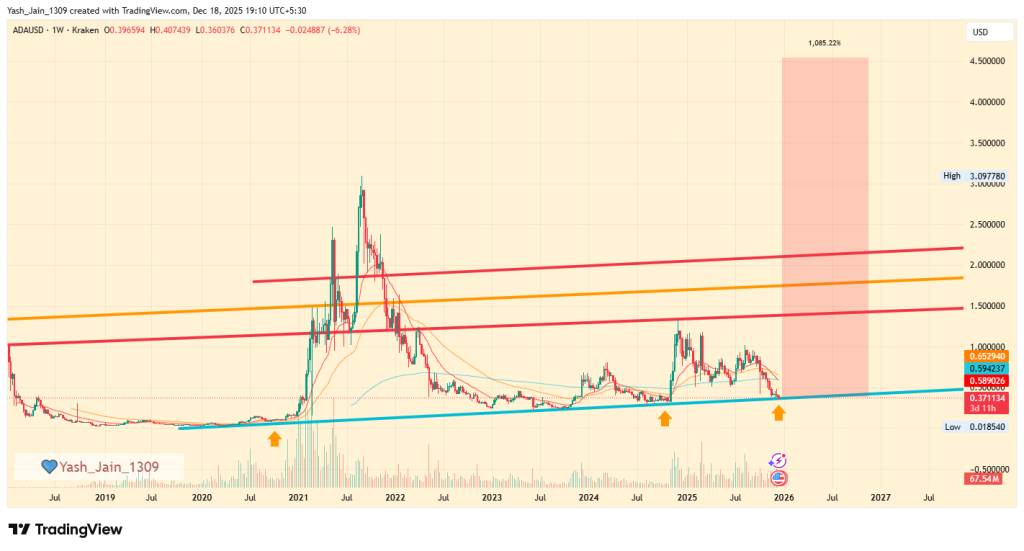


 Bitcoin has just dropped $2,300 and liquidated $66 million worth of longs in the last 45 minutes.


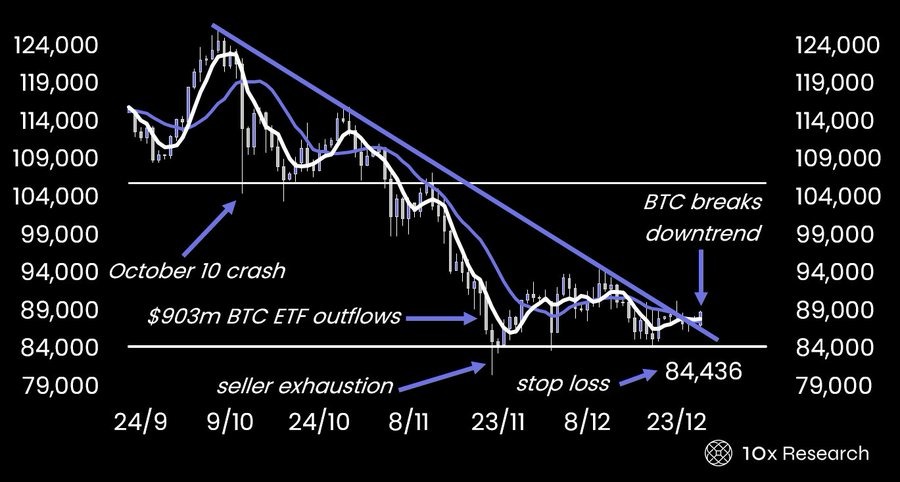
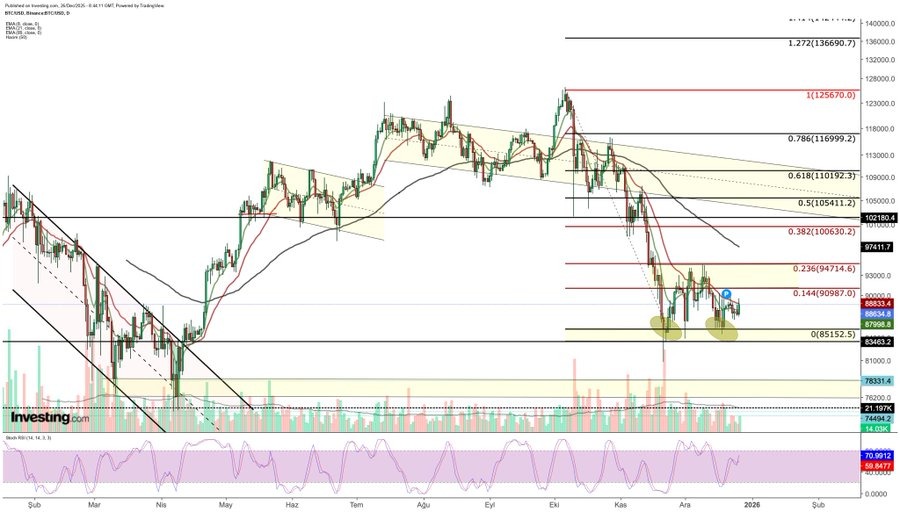

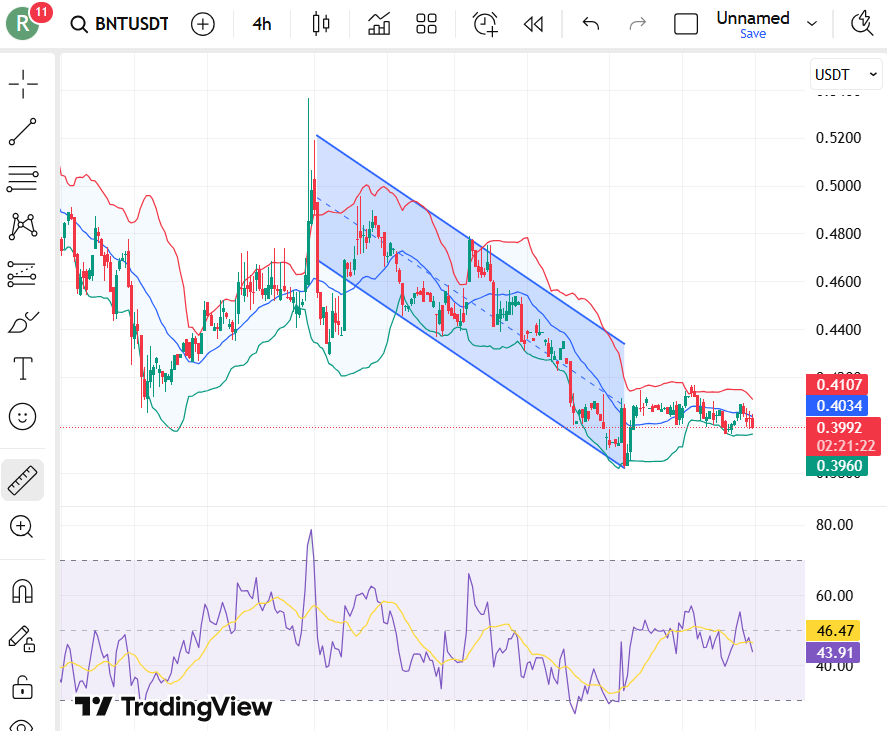


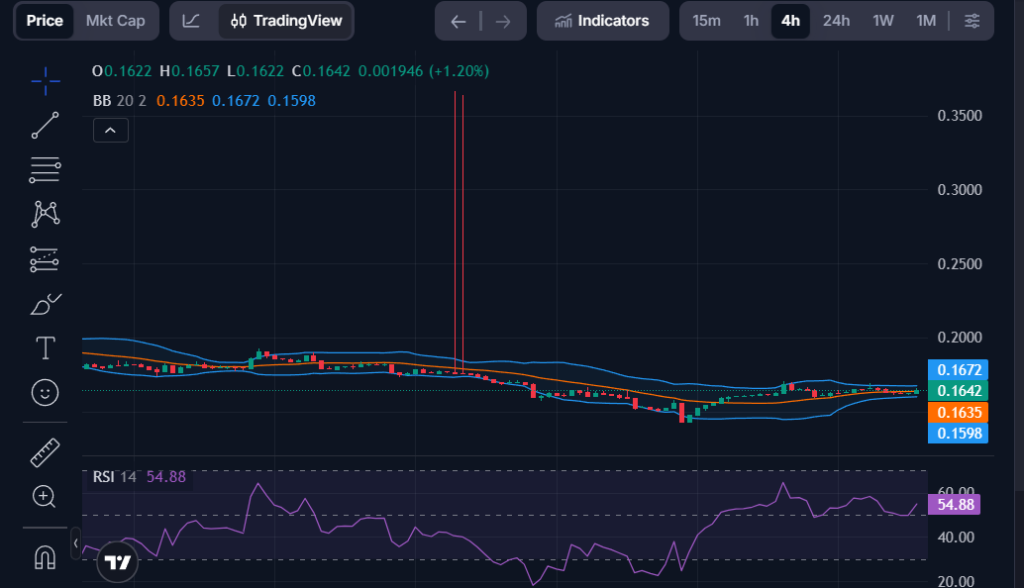

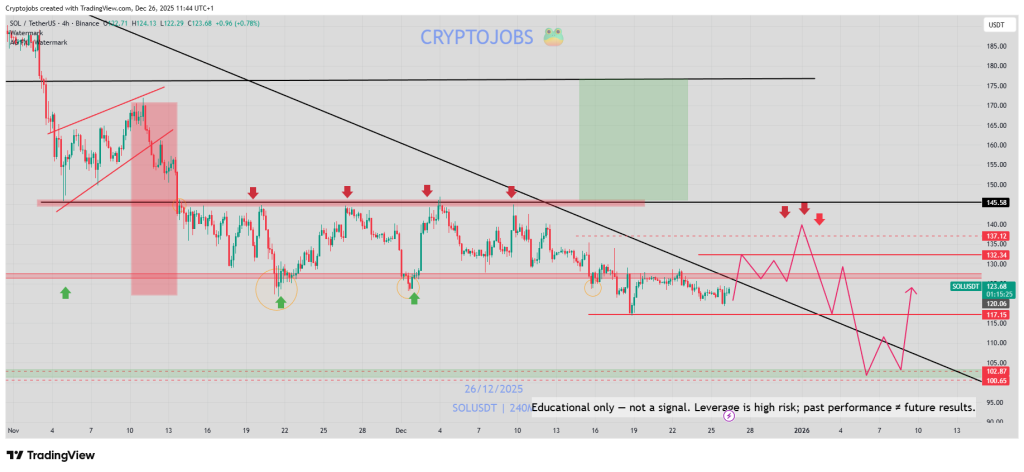
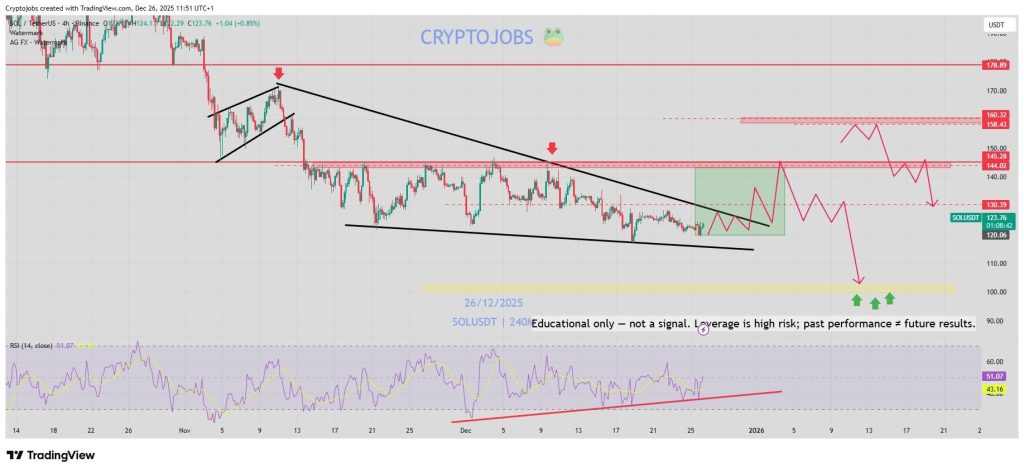


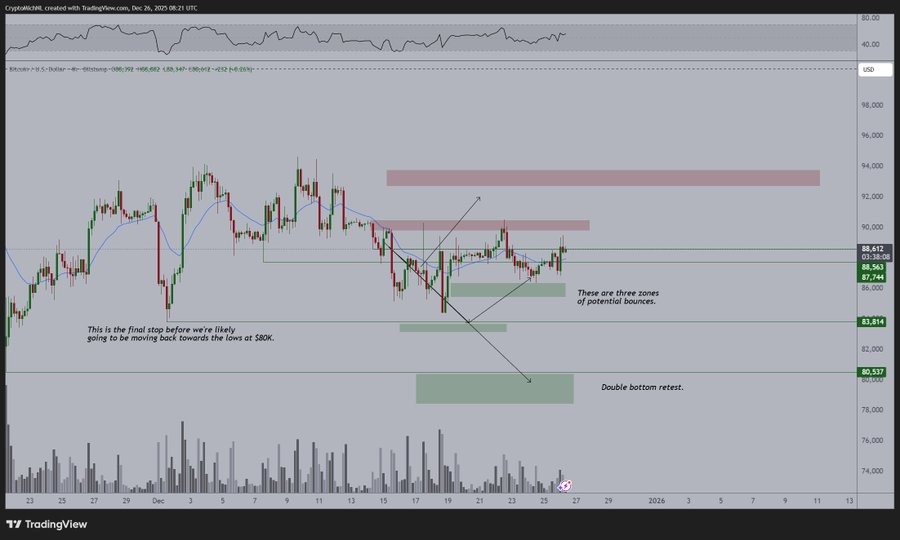
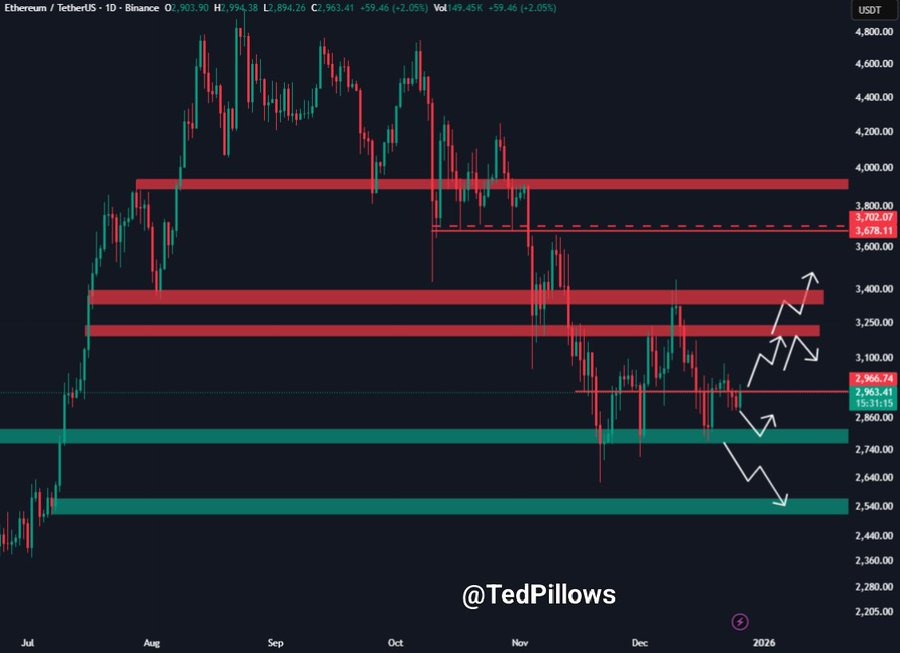

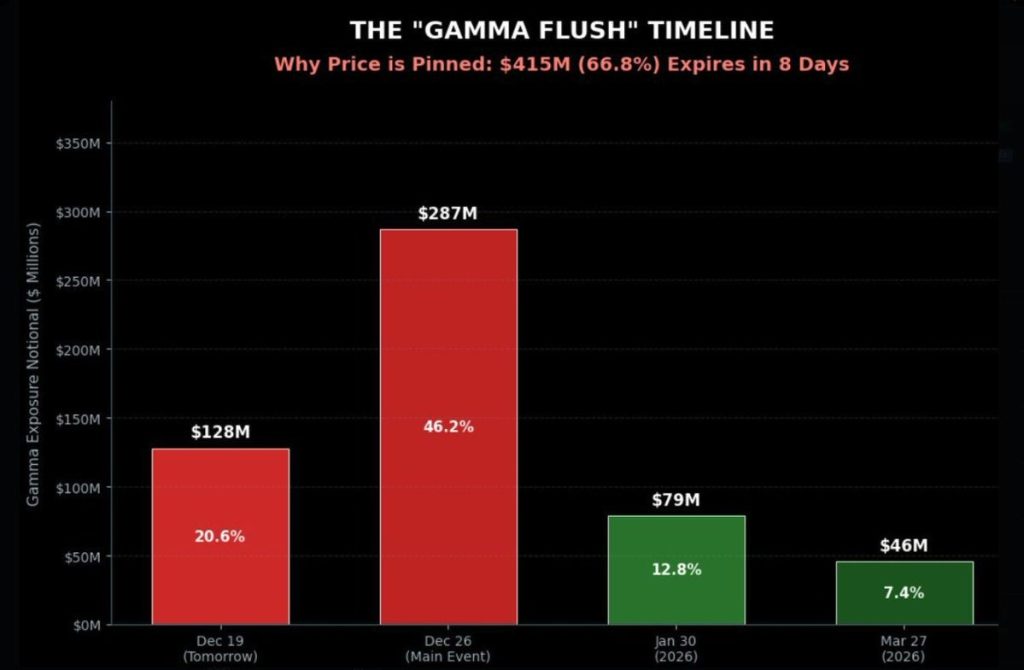
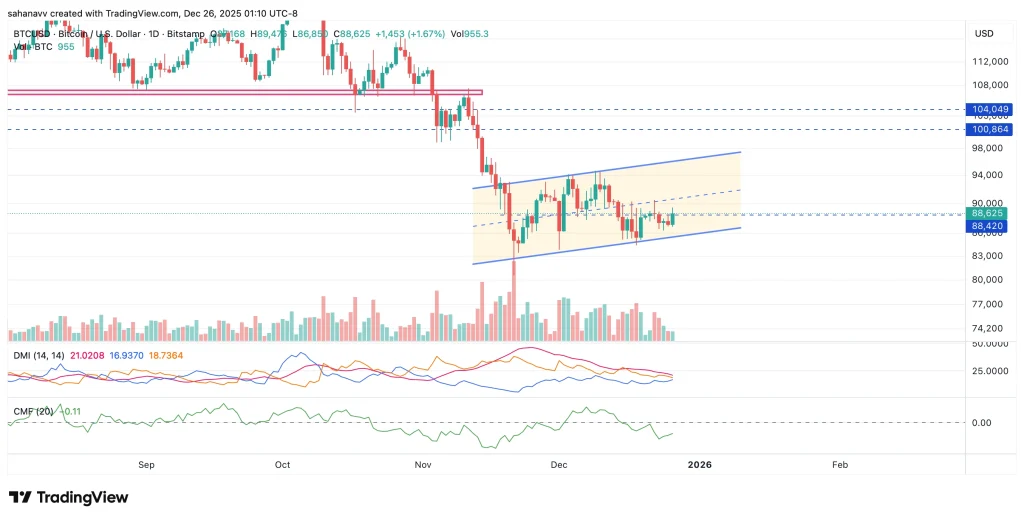


 Bank of Lithuania warns crypto firms must get licensed by Dec 31.

 BNB (@cz_binance)