How to Analyze On-Chain Data for Market Trends in 2025
On-chain data refers to all the data that is written straight onto the blockchain. This data includes all the activities of users, such as transactions, wallet movements, gas fees, and circulation of tokens across the network. It is transparent, anyone can access it, and it is a tool for analyzing the virtual currency market.
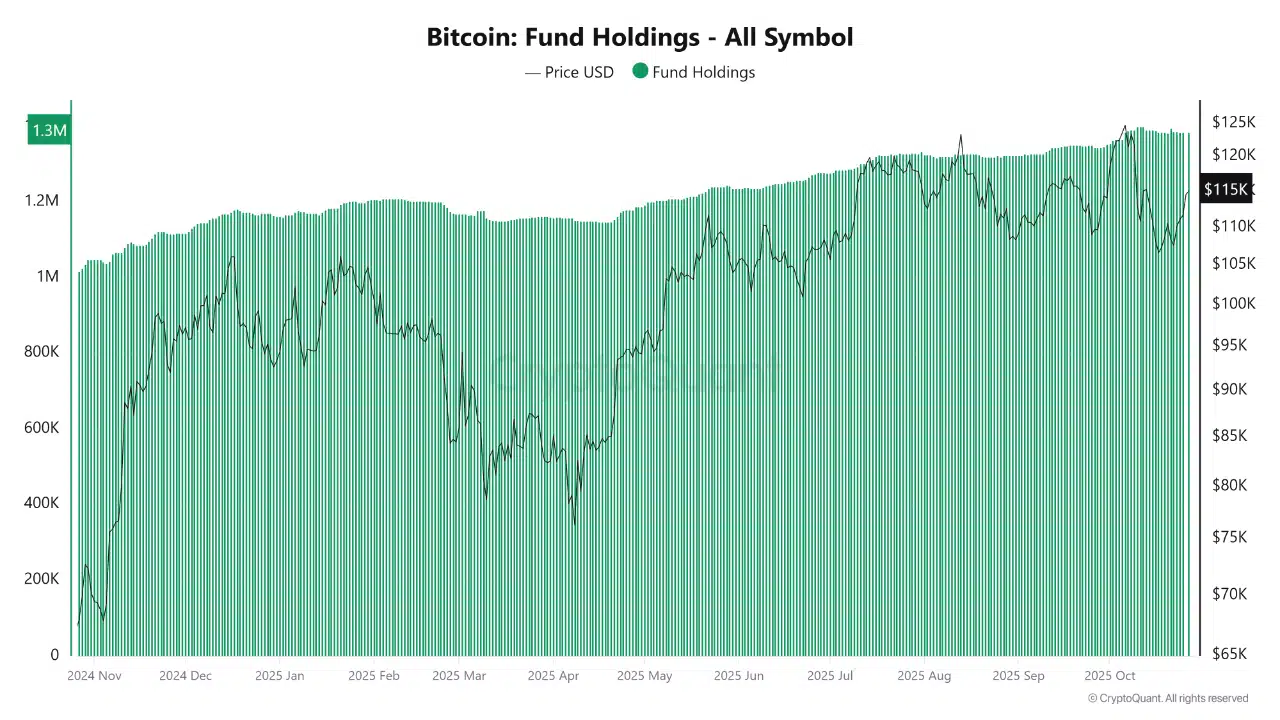
The data that is on-chain, analyzed by the experts, reveals people’s behavior through the patterns that they are making. For instance, if there are many wallets that are moving Bitcoin to exchanges, then it could be interpreted that soon people will be selling. However, if there is a trend of wallets moving Bitcoin off the exchanges, this could be taken as an indication that people plan to hold it for a longer time.
This kind of data gives early signals before prices move sharply. That is why both small investors and large institutions rely on on-chain data today. It’s like reading the heartbeat of a blockchain network.
It’s also important because unlike traditional financial systems, blockchain doesn’t hide its numbers. Everything is open, recorded, and verified by code. That makes on-chain data one of the most powerful tools for understanding real market behavior without needing insider info or rumors.
What Is On-Chain Data and Why It Matters
On-chain data is all the information that comes directly from the blockchain ledger. It includes transfers, wallet counts, token supply, staking activity, and even validator participation. This data tells the real story of what is happening under the surface of market prices.
Off-chain data is different. It comes from exchanges, social media, or news websites. Off-chain data can change or be hidden, but on-chain data stays forever in the blockchain.
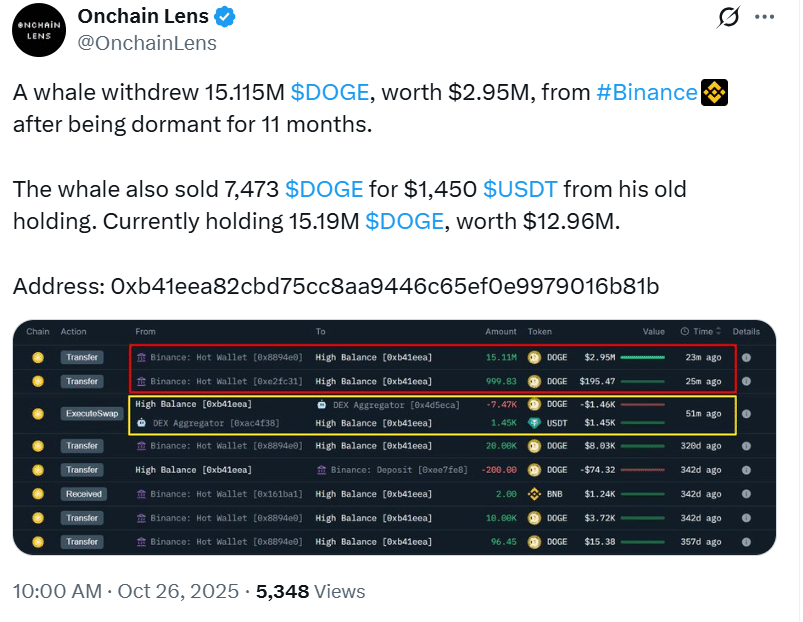
Understanding on-chain activity can tell how investors behave. For example, when large investors, also called whales, start accumulating tokens quietly, prices often rise later. The same way, when exchange inflows increase, it usually means selling pressure is building.
Let’s take Bitcoin as an example. When the number of coins held in wallets that don’t move for 6 months or more increases, it’s a sign of long-term accumulation. During early 2021, before Bitcoin hit its record highs, this trend was already visible in on-chain data.
Key Types of On-Chain Metrics
On-chain metrics are like the vital signs of a blockchain, indicating its health and the number of users interacting with it. These figures reveal the actual strength of the network and the user activities.
The active addresses, transaction volume, exchange, and whale activities are some of the main metrics to mention. They do the job of revealing the market’s real situation very well, almost like turning the price chart upside down.
To illustrate, the constant rise in active wallets usually indicates the growing acceptance of the crypto. The outflow of coins from the exchanges might suggest that the investors are getting ready for a long-term lock-up of their assets.
Every metric reveals a different fraction of the pie. They do not operate in isolation; rather, their collective contribution enables one to grasp the market trend and the level of investor confidence more easily.
Active Addresses and Transaction Volume
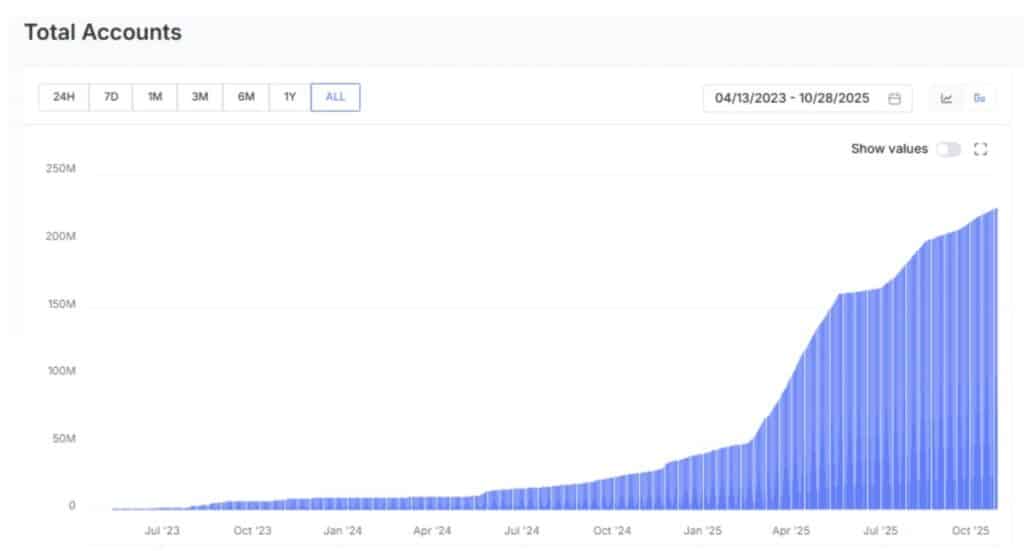
Active addresses provide a count of the wallets that are involved in the token transactions (sending or receiving) over a given time period. An increasing counter indicates that there are more users on the network. In case of blockchains like Ethereum and Solana, active address growth is a signal of higher user demand which together with price movement, affects the overall flux in prices.
Transaction volume represents the measure of value being transferred on the blockchain. As a case, if daily transactions of Bitcoin amounting to billions of dollars are being made, it may indicate strong market activity.
The year 2021 was remarkable for Ethereum in terms of getting more active addresses because of DeFi popularity. Besides, this growth led to an enormous price surge. The connection between on-chain activity and price has been noticed several times during different crypto phases.
Nevertheless, not all activities are for the good. Occasionally, transaction spikes might be due to spam or bots, hence, it is crucial to determine that the volume increase is real.
Exchange Inflows and Outflows
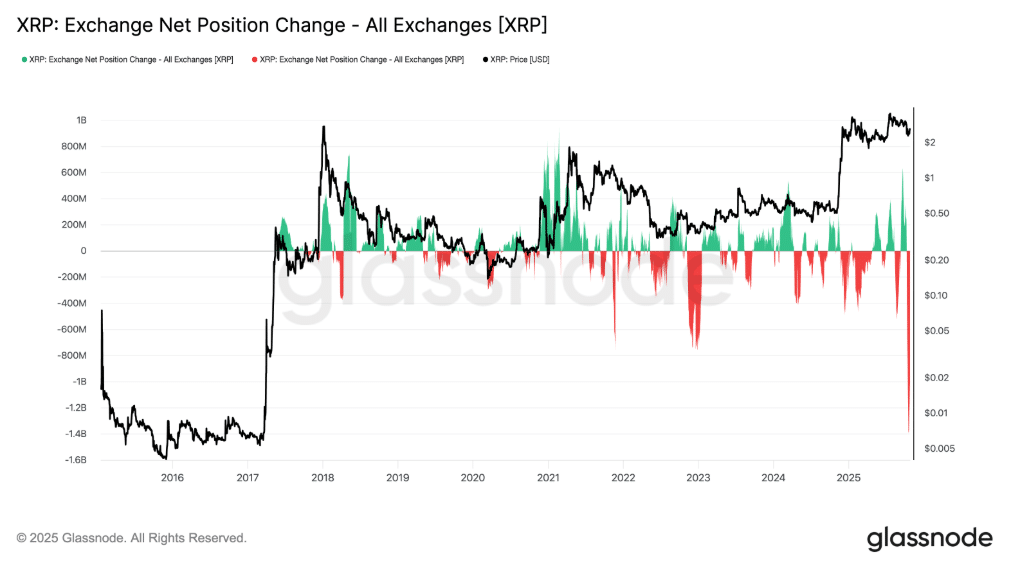
Exchange inflow means how much crypto is being sent to exchanges. When inflows increase, it often shows that investors might be planning to sell. Exchange outflows mean tokens are being withdrawn from exchanges to private wallets, which usually shows a desire to hold long-term.
If Bitcoin outflows grow suddenly, it can mean confidence in the market is increasing. That happened many times before bull runs. On the other hand, when inflows spike, it might signal fear or panic selling.
This data helps analysts predict the next moves of traders. Many top investors track this information daily because it provides hints of what will happen next before price action even begins.
| Metric | What It Shows | Market Signal |
| Active Addresses | Number of wallets used in transactions | Growth = higher demand |
| Exchange Inflow | Coins moved to exchanges | Higher inflow = possible sell-off |
| Exchange Outflow | Coins leaving exchanges | Higher outflow = holding sentiment |
| Transaction Volume | Total tokens moved | High = strong network usage |
How On-Chain Data Helps Identify Market Trends
On-chain data helps in recognizing how the crypto market moves through its different stages. These stages often repeat, forming market cycles. Analysts use this data to understand if the market is in accumulation, expansion, or distribution.
For example, when large wallets begin buying quietly after a long bear market, that usually marks the start of an accumulation phase. When transaction activity rises and exchange outflows grow, it’s a hint that smart investors expect prices to rise.
Similarly, when the market becomes too active with huge inflows and profits being realized, it can mean the market is near a top. On-chain data, in this way, acts like an early alarm.
By studying it carefully, analysts can identify when fear or greed controls the market. This helps avoid entering at the wrong time or exiting too early. It’s one of the main reasons why on-chain metrics have become a key part of professional crypto trading strategies.
Accumulation and Distribution Patterns
Every crypto bull or bear market has certain signals that appear again and again. During accumulation, wallet balances increase, especially among long-term holders. Exchange outflows also rise, and the total supply on exchanges goes down.
During distribution, which happens near market peaks, the opposite occurs. More coins move to exchanges as traders prepare to sell. This pattern has been seen in multiple bull markets for Bitcoin, Ethereum, and other large-cap coins.
It’s not perfect science, but combining wallet and flow data gives strong clues. By watching these patterns, analysts can guess where the market might be heading next.
Important On-Chain Tools and Platforms
On-chain data is open for everyone, but reading raw blockchain data is not easy. That’s where analysis platforms come in. These platforms collect the data, organize it, and show it with charts that make it easier to understand.
The crypto analytics field has seen the rise of many successful platforms over the years. There are data sources like Glassnode, Nansen, Santiment, and IntoTheBlock that allow even non-tech-savvy persons to monitor and analyze wallet transfers, currency movement between exchanges, and one big investor’s activity among others, all without coding.
For the basic data, some of these applications are free of charge, while others are relied upon for deeper insights through the paid versions. Mostly, analysts refer to these tools’ signals in conjunction, thus zekerheid splitting and market trend confirming.
The main concept is easy to grasp: data visualization leads the way to uncovering patterns. For instance, if Glassnode reports decreased exchange balances while Nansen follows the main traders buying tokens, then, perhaps, this situation might imply accumulation.
| Platform | Features | Free Access |
| Glassnode | Exchange flows, network metrics | Partial |
| Nansen | Wallet tracking, whale alerts | Partial |
| Santiment | Combines social and on-chain data | Yes |
| IntoTheBlock | Multi-chain metrics and predictions | Yes |
Case Studies: How On-Chain Data Predicted Market Movements
Many times, on-chain data has predicted major market events before they happened. Looking at historical examples helps prove how powerful it can be.
Bitcoin in 2020 Halving
Before Bitcoin’s halving in May 2020, exchange outflows started rising while the supply on exchanges fell to its lowest level in years. This pattern hinted that holders were preparing for a long-term bull market. After the halving, Bitcoin’s price began its climb from $9,000 to over $60,000 within a year.
Ethereum During DeFi Boom
In early 2021, Ethereum saw a huge rise in gas fees and daily transactions. On-chain activity was showing growth even before mainstream media noticed. This trend signaled a new wave of demand from decentralized applications and token swaps.
Solana and High-Volume Periods
Solana’s daily transactions began rising months before its price breakout in 2021. Analysts tracking this data identified that adoption was spreading rapidly across NFT and gaming ecosystems.
Each of these cases proves that by watching wallet behavior, exchange flows, and network usage, it’s possible to see trends that charts alone might miss.
Mistakes to Avoid When Reading On-Chain Data
On-chain data is powerful but can also be confusing if not used correctly. The biggest mistake analysts make is focusing on one metric while ignoring the bigger picture.
For example, seeing a rise in active addresses doesn’t always mean adoption. It might be caused by bots or spam activity. Similarly, high transaction volume could be from large internal transfers between exchanges, not new users joining.
Another mistake is ignoring macro events like regulations or global financial news. Even if on-chain data looks positive, external shocks can change everything.
The best way to read data is by combining multiple sources and comparing different metrics. Cross-checking exchange flows, address activity, and sentiment gives a clearer signal than any single number.
Finally, analysts should remember that blockchain data is still young. New networks like Layer 2 chains or sidechains can distort older models. It’s better to stay flexible and adjust methods as technology evolves.
How to Start Practicing On-Chain Analysis
On-chain analysis is an area that does not need sophisticated programming skills or hefty investments to get into. A plethora of tools provide free dashboards and basic visualizations.
Beginners can start by tracking only a few basic parameters, such as exchange balances, active addresses, and major coins transaction volume, etc. Gradually adding more complicated ratios, such as NVT and MVRV, can assist in obtaining stronger insights over time.
Moreover, it is very crucial to observe patterns over time instead of just taking notice of daily spikes. Changes in the market happen slowly and thus consistency shows the trends more clearly.
Participation in online communities, studying the research of such platforms as Glassnode and Nansen, and sharing insights with others are all ways to enhance knowledge.
Ultimately, the goal is not to foresee the price but rather to draw the possible direction of the market. On-chain data forms the basis for that understanding.
The Future of On-Chain Market Analysis
On-chain analytics is anticipated to have a bright future since the invention of more sophisticated data analysis tools. The new sophisticated systems use AI and machine learning for the detection of such intricate patterns which the human eye cannot see at all. These technologies can analyze years of blockchain transactions, spot trends, and even foretell the shifts in the market, all done automatically.
With the introduction of new blockchains, on-chain data has now gone beyond Bitcoin and Ethereum. The Layer 2 chains, multi-chain environments, and cross-chain bridges have all led to the growing of data even more. Analysts now have the ability to see the flow of money not only within one network but through several networks at once.
On the other hand, the use of on-chain data has been adopted by the institutions as well. Hedge funds and research firms are utilizing blockchain metrics in the same manner they used stock market data. This leads to a higher level of precision in the forecasts and makes on-chain analysis an important aspect of financial research.
In the near future, on-chain instruments will also be more graphical and interactive. The platforms might present 3D maps or dashboards indicating the live movement of tokens. This not only helps the novices but also the experts to comprehend the complicated data very easily.
The rise of AI-powered predictive analytics will make it possible to identify signals even before human analysts notice them. In short, the next phase of crypto research will be data-driven, transparent, and automated.
Frequently Asked Questions
What is on-chain data analysis?
On-chain data analysis means studying information stored directly on the blockchain to understand how investors behave. It looks at wallet activity, transaction volume, and token flows to identify patterns and market trends.
How can on-chain data predict crypto prices?
It helps by showing real investor activity before price movements happen. For example, large withdrawals from exchanges often mean holding sentiment, while high inflows can mean upcoming selling.
Which tools are best for beginners?
Glassnode, Nansen, and IntoTheBlock are great options. They have easy dashboards and free access to basic data.
Glossary
On-Chain Data:
Information stored directly on a blockchain, such as transactions, wallet balances, and block creation times.
Whale Activity:
Actions by large holders of a cryptocurrency that can move the market due to the size of their trades.
MVRV Ratio:
A metric comparing the current market value of a coin to the average price of coins when they last moved. Helps spot market tops or bottoms.
NVT Ratio:
The Network Value to Transactions ratio compares a network’s total value to its transaction volume, like a P/E ratio for crypto.
Accumulation Phase:
A market period where investors are buying and holding coins quietly before an uptrend begins.
Summary
On-chain data is one of the most powerful tools in crypto research today. It allows anyone to look directly at blockchain activity and understand what investors are doing in real time. Unlike traditional finance, where much data stays hidden, blockchains give full access to every movement of coins and tokens.
By studying metrics like active addresses, exchange inflows, and whale transactions, analysts can see patterns that show when the market is heating up or cooling down. Platforms like Glassnode and Nansen make this information easy to read even for beginners.
The data can reveal when investors are quietly accumulating, when they are taking profits, or when they are afraid. Each of these moments leaves a digital footprint on the blockchain. Combining that data with human sentiment and global events gives a complete view of market health.
On-chain analysis is not perfect, but it gives a big advantage to anyone trying to understand crypto markets. As technology advances and more AI tools appear, on-chain data will become even more powerful in shaping how investors read and react to the market.
Read More: How to Analyze On-Chain Data for Market Trends in 2025">How to Analyze On-Chain Data for Market Trends in 2025


