How Bayesian testing lets Google measure incrementality with $5,000
Incrementality testing in Google Ads is suddenly within reach for far more advertisers than before.
Google has lowered the barriers to running these tests, making lift measurement possible even without enterprise-level budgets, as recently reported in Search Engine Land.
That shift naturally raises a question: How is Google able to measure incrementality with so much less data?
For years, reliable lift measurement was assumed to require large budgets, long test windows, and a tolerance for inconclusive results.
So when Google claims it can now deliver more accurate results with as little as $5,000 in media spend, it understandably sounds like marketing spin.
But it’s not. It’s math.
Behind this change is a fundamentally different testing methodology that prioritizes probability over certainty and learning over rigid proof.
Understanding how this approach works is essential to interpreting these new incrementality results correctly – and turning them into smarter PPC decisions.
Glossary: Bayesian terms for search marketers
Before we dive in, here are some definitions to refresh your memory from Stats 101.
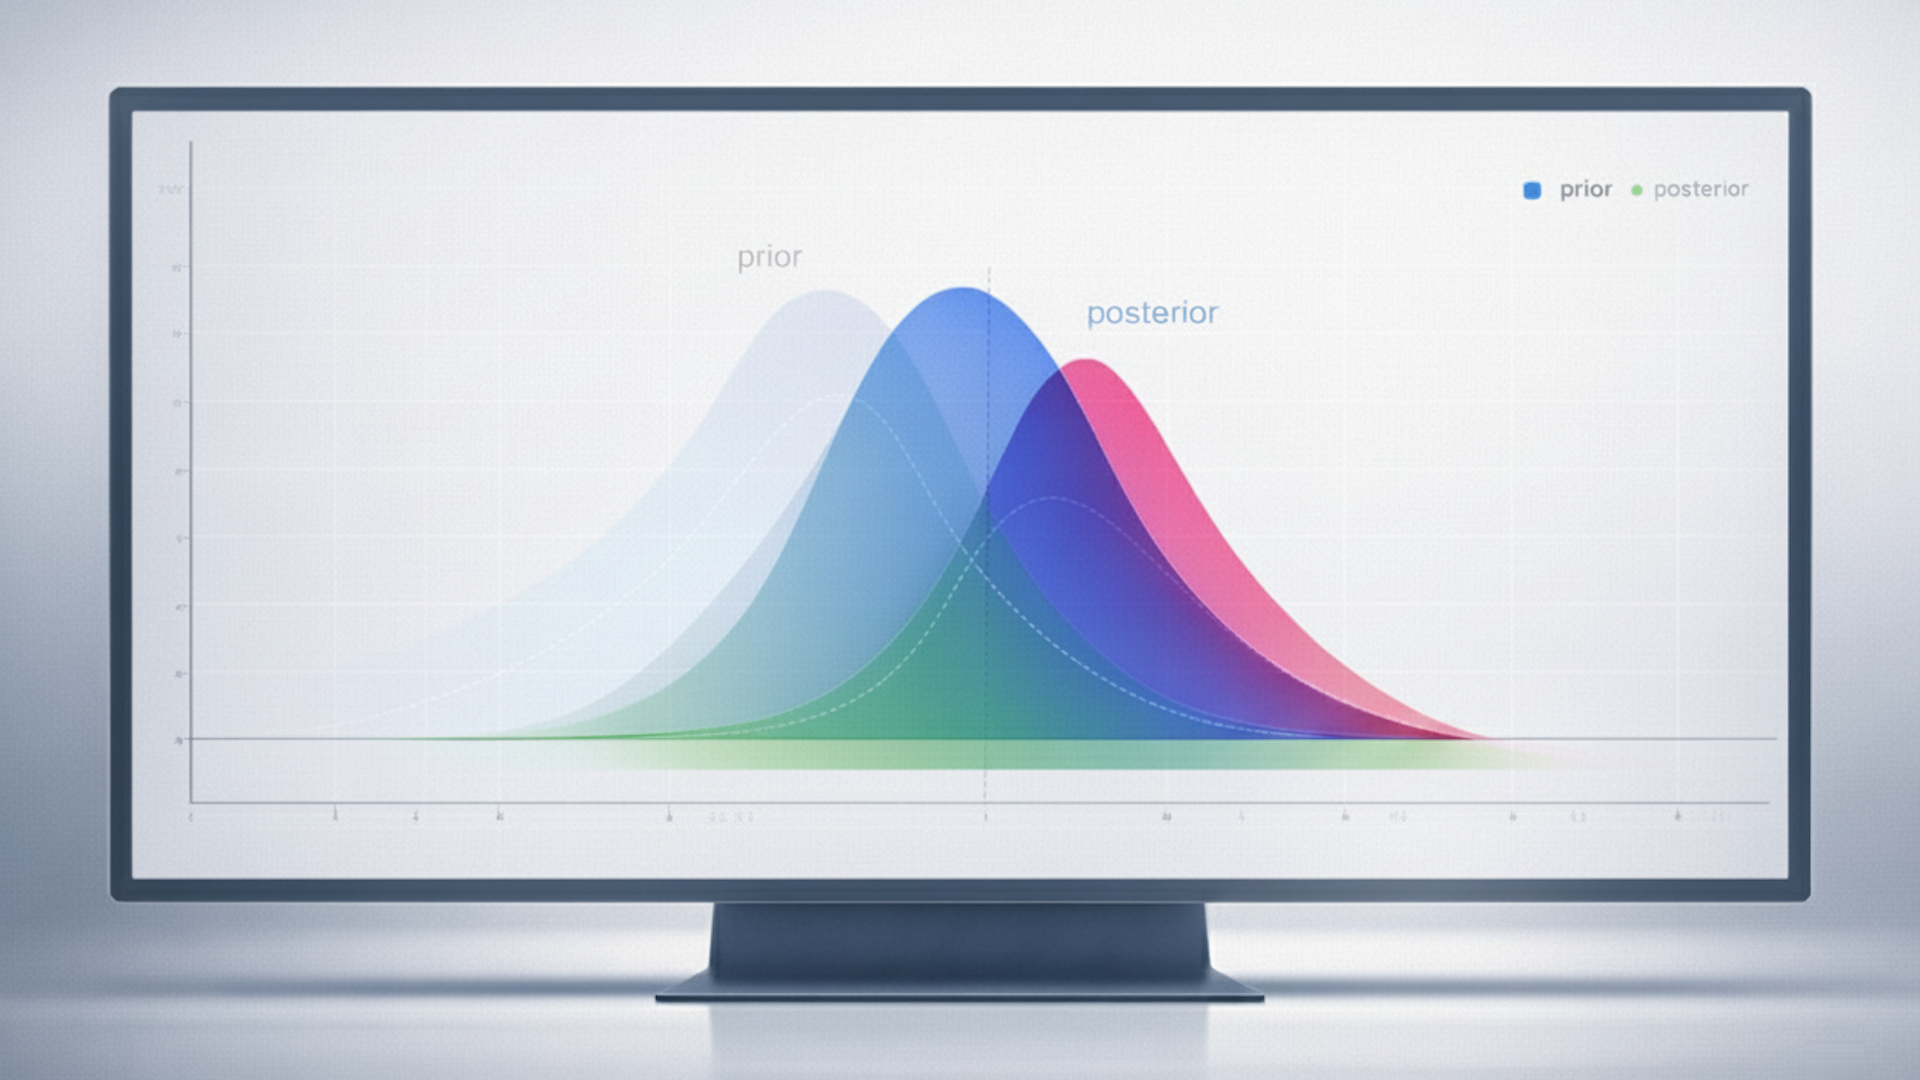
- Prior: What the system believes before the test.
- Posterior: Updated belief after observing data.
- Credible interval: Where the result likely falls (Bayesian).
- P-value: Probability of observing this result if nothing changed (Frequentist).
Why traditional A/B testing fails modern marketers
Most PPC advertisers are already familiar with frequentist statistics, even if they’ve never heard the term.
Any classic A/B test that asks “Did this change reach statistical significance?” and relies on p-values and fixed sample sizes to answer that question is using a frequentist framework.
It’s the model that underpins most experimentation platforms and has shaped how marketers have been taught to evaluate tests for decades.
Let’s look at what that means for a realistic, smaller-budget test.
For simplicity, assume a click-based experiment with equal exposure to both variants.
- Total test budget: $5,000.
- Split: 50/50 → $2,500 per variant.
- Average CPC: $2.
- Clicks per variant: 1,250.
- CPA target: ~$100.
Observed results
- Control: 1,250 clicks → 25 conversions → 2.00% conversion rate.
- Treatment: 1,250 clicks → 30 conversions → 2.40% conversion rate.
- Observed lift: 20% more conversions, ~16.7% lower CPA.
On paper, that looks promising: better conversion rate and lower CPA for the treatment.
But when you run a standard two-proportion z-test on those rates, the result tells a very different story.
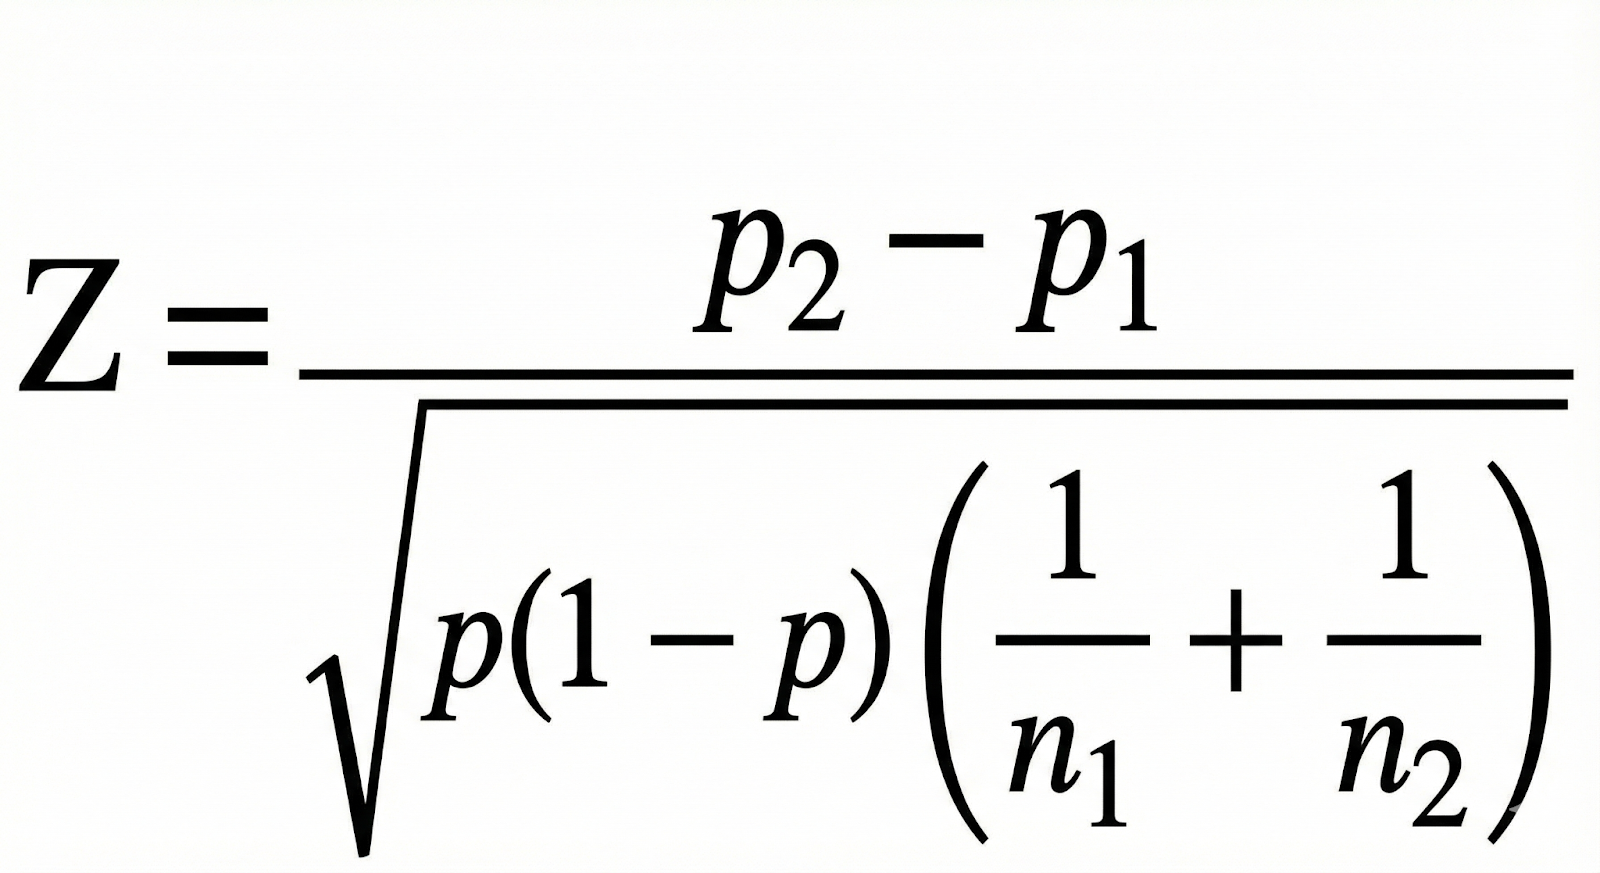
The output looks like this:
- Z ≈ 0.68
- One-tailed p ≈ 0.25
- Two-tailed p ≈ 0.50
In other words, under a traditional frequentist framework, this test is not statistically significant.
A 20% lift and a visibly better CPA are still treated as “could easily be noise.”
The advertiser has spent $5,000, seen encouraging numbers, but can’t claim a clear winner.
At the budget levels many advertisers can realistically afford, the old-style incrementality tests, which are frequentist in nature, often fail to produce conclusive results.
That’s the gap Google is trying to close with its newer, Bayesian-style incrementality methods: keeping tests useful even when the budget is closer to $5,000 than $100,000.
Here’s why a different approach to the test significantly reduces the required budget.
Dig deeper: Why incrementality is the only metric that proves marketing’s real impact
Bayesian testing: What matters is likelihood, not certainty
Bayesian models ask different – and often more decision-useful – questions.
Instead of asking whether a result is statistically significant, they ask a more practical question:
- Given what we already know, how likely is this to be true?
Now let’s apply that framing to the same $5,000 budget example that produced an inconclusive frequentist result.
Using a simple Bayesian model with flat priors (Beta(1,1)):
- Control: 25 conversions out of 1,250 clicks → Beta(26, 1226)
- Treatment: 30 conversions out of 1,250 clicks → Beta(31, 1221)
From these posterior distributions, we can compute:
- Mean lift: ~18–20%
- 95% credible interval: roughly spans negative to positive lift (wide, as expected with small data)
- Probability that lift > 0: ~75–80%
A traditional A/B test looked at the same data and said:
- “Inconclusive. Could be noise. Come back with a bigger budget.”
But a Bayesian read says something more nuanced and infinitely more practical:
- “There’s about an 80% chance the treatment really is better.”
It’s not proof, but it may be enough to guide the next step, like extending the test, replicating it, or making a small allocation shift.
Bayesian methods don’t magically create signal where none exists. So what is the magic then, and why does this work?
So, how does Google make $5,000 tests work?
Short answer: priors + scale.
Frequentist methods only look at observed test data.
Bayesian models allow you to bring prior knowledge to the table.
And guess which company has a ton of data about online ad campaigns? This, indeed, is Google’s advantage.
Google doesn’t evaluate your test entirely in isolation. Instead, it draws on:
- Informative priors (large volumes of historical campaign data).
- Hierarchical modeling (grouping your test with similar campaigns).
- Probabilistic outputs (replacing p-values with likelihoods).
Google explains these concepts in their Meridian MMM documentation.
Here’s an example:
| Test type | Posterior lift | Prob(lift > 0) | Interpretation |
| No prior | +0.7% | 54% | Inconclusive |
| Prior (~10% lift) | +20.5% | 76% | Directionally confident |
The prior belief, in the example above, that similar campaigns often see ~10% lift, stabilizes the result enough to support real decisions.
Dig deeper: Exploring Meridian, Google’s new open-source marketing mix model
Smart Bidding already works this way
Should we trust this new approach that uses prior knowledge?
We should, because it underpins a different system from Google Ads that advertisers are happy with – Smart Bidding.
Consider how Smart Bidding establishes expectations for a new campaign. It doesn’t start from scratch.
It uses device-level, location-level, time-of-day, vertical, and historical performance data to form an initial expectation and updates those expectations as new data arrives.
Google applies the same principle to incrementality testing.
Your $5,000 test inherits learnings from campaigns similar to yours, and that’s what makes insight possible before spending six figures.
That’s the “memory” behind the math.
Why frequentist thinking leaves marketers stuck
Let’s put Bayesian and frequentist methods side by side:
| Aspect | Frequentist | Bayesian |
| Output | P-value | Probability of lift |
| Sample size | Large | Smaller if priors are strong |
| Flexibility | Binary | Probabilistic |
| Real-world relevance | Limited | High |
| Handles uncertainty | Poorly | Explicitly |
Marketers don’t make decisions in black-and-white terms.
Bayesian outputs speak the language of uncertainty, risk, and trade-offs, which is how budget decisions are actually made.
Google’s data advantage
Google doesn’t guess at priors. They’re informed by:
- Historical campaign performance.
- Cross-campaign learning.
- Attribution modeling (including data-driven attribution and modeled conversions).
Then priors are downweighted as test data accumulates, a core principle of Bayesian statistics and one that’s especially relevant for advertisers concerned about bias or “baked-in” assumptions.

At the start of a test, when data is sparse and noisy, prior information plays an important stabilizing role.
It provides a reasonable starting point based on how similar campaigns have performed in the past, preventing early results from swinging wildly based on a handful of conversions.
But as more data is observed, something important happens.
The information coming from the test itself, the likelihood becomes sharper and more informative.
Each additional conversion adds clarity, narrowing the range of plausible outcomes.
Over time, that growing body of evidence naturally outweighs the influence of the prior.
In practical terms, this means Bayesian tests don’t stay anchored to their starting assumptions. They evolve.
Initially, the model relies on historical patterns to interpret limited data.
Later, it increasingly trusts what actually happened in your campaign.
Eventually, with enough volume, the results are driven almost entirely by the observed data, much like a traditional experiment.
This dynamic is what makes Google’s approach viable at both ends of the spectrum.
It allows small tests to produce usable directional insight without overreacting to noise, while still ensuring that large, data-rich tests converge on conclusions driven by real performance rather than inherited assumptions.
What advertisers should watch for
The system is powerful, but not perfectly transparent. Important open questions remain:
- Are priors fully removed once enough test data exists?
- Can advertisers inspect or validate priors?
- What safeguards prevent irrelevant priors from influencing results?
Google has indicated that priors diminish as data grows, but advertisers still need to apply judgment when interpreting results.
Dig deeper: How causal impact studies work and when to use them in PPC
Stop chasing significance, start reducing uncertainty
Statistical significance is a blunt instrument in a world that demands nuance.
Bayesian testing offers a more practical way to measure impact, especially when budgets are limited and decisions can’t wait.
The next time Google shows you a lift estimate from a $5,000 test, don’t dismiss it.
It’s not smoke and mirrors.
It’s math with all the benefits of Google’s massive knowledge about the performance of ad campaigns that have come before yours.
And it’s a welcome new capability from Google Ads for all advertisers who want to make better data-driven optimization decisions.