Reading view

Bitcoin And Crypto Market Set To Bounce As Rate Cut Probabilities Touch 98.3%

The next Federal Open Market Committee (FOMC) meeting is fast approaching, and the bets are already pouring in as to what it would mean for the Bitcoin and crypto industry. The last FOMC meeting took place in September, when the Federal Reserve ended up cutting rates down to 4-4.25% after months of no rate cuts. With this setting the tone, the expectations that another rate cut could be on the way are getting louder, with the FedWatch Tool showing a high percentage.

Market Expects Another Rate Cut To 3.75-4%

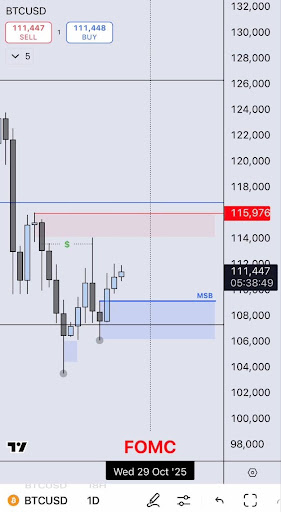
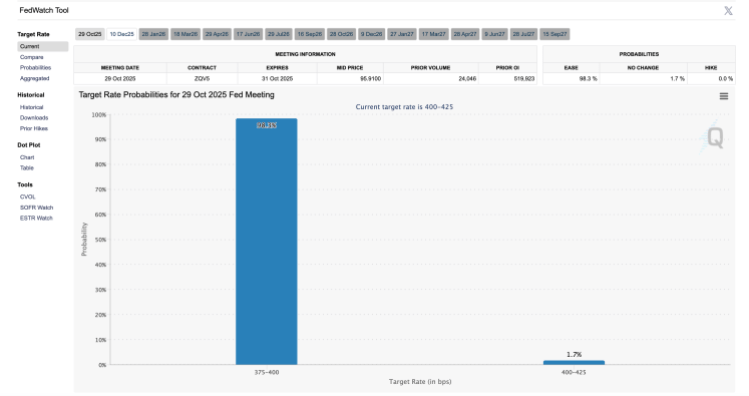
The next FOMC meeting is scheduled for Wednesday, October 29, 2025, and there is already a major clamor around what the Fed is planning on doing. The current market headwinds point to a favorable outcome for risk assets such as Bitcoin and other cryptocurrencies, with expected rate cuts.

Currently, the CME FedWatch Tool is showing that the probability of a rate cut has risen to 98.3% as of the time of this writing. This leaves only a 1.7% chance that the Federal Reserve will actually leave rates at their current levels, and there is zero chance that there will be a rate hike.

Fed FOMC

A reduction in the rate cuts is good for businesses all around, as lower interest rates mean better loan terms and increased spending and borrowing. Thus, it will increase the participation in the markets, from consumer goods to the stock market, and then make its way into newer markets such as Bitcoin and crypto.

Expectations For Bitcoin And Crypto Are Getting Higher

A rate cut by the Federal Reserve aligns with the more pro-crypto stance that the United States has been moving in since President Donald Trump was elected. Last week, the president pardoned the Founder and former CEO of the Binance crypto exchange, Changpeng Zhao, after he previously pled guilty to money laundering violations back in 2024. Zhao has since served a 4-month stint before the pardon from Trump came.

With the US embracing Bitcoin and crypto again, a rate cut will only further the ascent, allowing more investors to get into the market as liquidity frees up. The initial announcement has been known to trigger a rapid increase in the market. But as the news settles, the crypto market is expected to continue to rise in response.

However, nothing is certain until the FOMC meeting is complete and the announcement is made. For the Bitcoin and crypto market to remain bullish, inflation will also have to be reduced, as an increase could trigger more conservative stances from investors.

Bitcoin price chart from Tradingview.com (crypto)

Bitcoin Buzz: Michael Saylor Drops ‘Orange Dot Day’ Hint

Bitcoin edged higher on Sunday as signs of easing US-China trade tensions lifted risk assets, while Strategy’s founder hinted the company kept adding to its Bitcoin holdings.

Strategy Keeps Buying

Michael Saylor posted a chart on October 26 that uses orange dots to mark recent purchases. The visual cue has become his shorthand for new buys.

Based on reports, Strategy added 387 BTC between October 13 and October 20, bringing its total to 640,418 BTC. That number is striking on its own. It shows a steady, deliberate approach to buying even when prices are volatile.

Strategy’s disclosed average cost for its Bitcoin stands at $74,010. The company’s moves lately have been small compared with September, when it took in more than 7,000 BTC across several large transactions. The size of any fresh purchases this week has not been publicly revealed.

At the same time, Bitcoin’s market moves were influenced by broader news. The price of Bitcoin rose about 1.6% on Sunday, while Ethereum gained roughly 2.8%. Short-term swings appear driven more by headlines than by a single company’s actions.

It’s Orange Dot Day. pic.twitter.com/5FSGmxwoNS

— Michael Saylor (@saylor) October 26, 2025

Bitcoin

Holdings, Valuation And Track Record

Based on reports, at prices a little over $115,000 per BTC, Strategy’s Bitcoin stash is valued at around $72 billion. That valuation implies a paper gain of more than $25 billion over a total cost basis of about $47.4 billion since the program began in 2020.

Reports have logged 83 separate purchase events in that time, a pattern that has left investors with a clear view of the firm’s playbook: buy repeatedly and report afterward.

Some of the buying was concentrated in September, when the firm added thousands of coins in a few large moves. Recently, however, allocations have looked smaller and more frequent. That shift suggests a preference for steady accumulation rather than single big bets.

Buying Behavior And Market Response

Strategy shares have been trading above the company’s net asset value. That fact suggests investors are comfortable owning MSTR as a way to gain Bitcoin exposure without buying the token directly. The company’s method — announce purchases after the fact and let the market reflect the holdings — has been consistent and predictable.

Geopolitical Headlines Drive Volatility

Meanwhile, officials from the US and China signaled progress in trade talks, and that helped calm some investors. According to reports, Scott Bessent told CBS News he expected the threat of 100% tariffs and an immediate export control regime to have receded.

Earlier in October, China announced tighter limits on rare earth exports used in chip manufacturing. On October 11, US President Donald Trump said he would impose an additional 100% tariff on Chinese goods and planned export controls on certain software to take effect on November 1.

Those days of sharp rhetoric caused heavy losses across markets and triggered one of the largest liquidation events in crypto this year.

Featured image from Gemini, chart from TradingView

Bitcoin Trades Sideways — Consolidation Above Support Could Fuel Next Upside

Bitcoin price is consolidating gains above $113,500. BTC could rise further if there is a clear move above the $115,750 resistance.

  • Bitcoin started a fresh upward move above the $114,000 resistance level.
  • The price is trading above $114,200 and the 100 hourly Simple moving average.
  • There is a bullish trend line forming with support at $113,900 on the hourly chart of the BTC/USD pair (data feed from Kraken).
  • The pair might continue to move up if it trades above the $115,750 zone.

Bitcoin Price Starts Consolidation

Bitcoin price formed a base and started a fresh increase above the $112,500 zone. BTC gained pace for a move above the main hurdle at $113,500.

It opened the doors for a move above $115,000 and the 100 hourly Simple moving average. Finally, the price spiked above $116,000 and is currently consolidating gains above the 23.6% Fib retracement level of the recent wave from the $106,718 swing low to the $116,309 high.

Besides, there is a bullish trend line forming with support at $113,900 on the hourly chart of the BTC/USD pair. Bitcoin is now trading above $114,000 and the 100 hourly Simple moving average.

Bitcoin Price

Immediate resistance on the upside is near the $115,000 level. The first key resistance is near the $115,500 level. The next resistance could be $115,750. A close above the $115,750 resistance might send the price further higher. In the stated case, the price could rise and test the $116,300 resistance. Any more gains might send the price toward the $117,500 level. The next barrier for the bulls could be $118,000.

Another Pullback In BTC?

If Bitcoin fails to rise above the $115,500 resistance zone, it could start a fresh decline. Immediate support is near the $114,000 level. The first major support is near the $113,500 level or the trend line.

The next support is now near the $111,000 zone. Any more losses might send the price toward the $110,500 support in the near term. The main support sits at $108,500, below which BTC might struggle to recover in the short term.

Technical indicators:

Hourly MACD – The MACD is now gaining pace in the bullish zone.

Hourly RSI (Relative Strength Index) – The RSI for BTC/USD is now above the 50 level.

Major Support Levels – $114,000, followed by $113,500.

Major Resistance Levels – $115,500 and $116,500.

Bitcoin Price Could See A New All-Time High Above $126,000 If It Breaks This Critical Level

The Bitcoin price is positioning for a potentially explosive move that could take it well beyond its previous all-time highs. Analysts are closely watching a critical resistance level near $116,000, which may serve as the final hurdle before BTC catapults into uncharted territory above $126,000. 

Analyst Predicts New Bitcoin Price All-Time High

Crypto analyst Donny Dicey revealed in an X social media post this week that the $116,000 price level is the decisive zone Bitcoin must breach to confirm a breakout toward a new all-time high. His technical analysis suggests that once BTC achieves a clean break above this resistance area, momentum could swiftly carry it above $126,000. 

Notably, Bitcoin set a new ATH on October 6, 2025, after breaking through its previous record above $124,000 and climbing past $126,000. Since achieving this level, the price of BTC has fallen dramatically to $115,000. Dicey’s accompanying chart shows the market steadily recovering after testing support near $108,000, marked as a “market structure break” region, with bullish price action consolidating above $109,000. 

The analyst has emphasized that each day Bitcoin maintains a close above $109,000 strengthens the probability of a strong upward swing as the market heads into November. This period coincides with the Federal Open Market Committee’s (FOMC) next meeting, where investors are anticipating dovish signals such as rate cuts or the formal end of Quantitative Tightening (QT).

Bitcoin

Dicey also notes that bullish S&P 500 earnings, easing global trade tensions from a potential agreement between US President Donald Trump and China’s President Xi Jinping, and improving ISM manufacturing data point to a macro environment supportive of risk assets. A community member commented that whales may have underestimated how much BTC’s demand tends to persist during these conditions. Dicey responded that the same whales might become “exit liquidity” as Bitcoin accelerates higher, possibly missing out on the strongest phase of this cycle. 

Consolidation Above January Highs Signal Unbreakable Strength

In a follow-up analysis, Dicey highlighted Bitcoin’s remarkable stability above its January highs, describing its price structure as “unbreakable” amid global macroeconomic uncertainty. He pointed to several converging factors that reinforce BTC’s resilience, including ongoing fiscal and monetary expansion, a weakening US dollar, and renewed confidence in the global business cycle. 

The analyst also emphasized that geopolitical tensions tied to US-China relations appear to be subsiding. At the same time, ETF inflows and exponential growth in the Artificial Intelligence (AI) sector contribute to acting as tailwinds for digital assets. He disclosed that despite strong underlying fundamentals, skepticism remains widespread in the market.

According to him, many still believe in the traditional four-year cycle narrative, while retail enthusiasm has not fully returned. Furthermore, the Russell 2000 index has yet to breakout, and rotation from traditional assets, such as the S&P 500 and gold, into Bitcoin remains limited. With these developments subduing broader market participation, Dicey suggests it creates the perfect setup for a powerful rally in BTC once sentiment shifts decisively.

Bitcoin

Forget Inflation: Bitcoin Rallies When The Dollar Falls, Study Finds

According to NYDIG research, Bitcoin’s price moves are driven more by the strength of the US dollar and broad liquidity conditions than by direct ties to inflation.

Greg Cipolaro, NYDIG’s global head of research, said the data show weak and inconsistent links between inflation measures and Bitcoin. That view shifts attention away from the old narrative that Bitcoin is mainly an inflation hedge.

Inflation Link Weak

Cipolaro argued that expectations for inflation are a slightly better signal than headline inflation readings, but still not a tight predictor of Bitcoin’s price.

Instead, Bitcoin and gold both tend to gain when the US dollar weakens. While gold’s inverse relation with the dollar is long established, Bitcoin’s opposite movement to the dollar is newer but visible.

Gold And Bitcoin React To Dollar Moves

Based on reports, gold has historically climbed as the dollar falls. Bitcoin is following that pattern, though its correlation is less steady than gold’s.

As Bitcoin becomes more connected with mainstream finance, NYDIG expects that its inverse relationship with the dollar will likely strengthen.

This makes sense to traders who price everything in dollars and seek alternatives when the greenback loses purchasing power.

Interest Rates And Money Supply

Cipolaro highlighted interest rates and money supply as the two major macro levers that move both gold and Bitcoin.

Lower interest rates and looser monetary policy have tended to support higher prices for these assets.

In simple terms: when borrowing costs drop and liquidity rises, Bitcoin often benefits. The note framed gold as more of a real-rate hedge, while Bitcoin is described as acting like a gauge of market liquidity — a subtle but important distinction for investors.

Illiquid Supply Drops, Selling Pressure Returns

On-chain data show signs of renewed selling. Reports say illiquid Bitcoin — coins held in long-dormant wallets — fell from 14.38 million earlier in October to 14.300 million on the 23rd of October.

That change means roughly 62,000 BTC, worth about $6.8 billion at recent prices, moved back into circulation. In the past, large inflows did exert price pressure. In January 2024, a substantial sum of coins came available that caused the price momentum to soften.

According to Glassnode data, there has been a consistent selloff from wallets holding from 0.1 to 100 BTC, and first-time buyer supply has contracted down to ~213,000 BTC.

The overall assessment from a macro perspective and on-chain metrics is not favorable. Demand from new buyers appears to be lighter, momentum traders appear to have stepped aside, and more coins are now available to trade. This combination can blunt rallies or deepen pullbacks until liquidity conditions improve or the dollar weakens.

Featured image from Gemini, chart from TradingView

100% Of Bitcoin Bull Market Peak Indicators Remain Untouched, Is There Still Room To Run?

Over the years, a number of indicators have emerged that have often helped to pinpoint the Bitcoin bull market peak. These indicators have been triggered in previous cycles, and their triggers have often been a signal that it was time to get out of the market, as a new bear market is underway. However, this time around, even with the Bitcoin price hitting multiple new all-time highs, none of these cycle peak indicators have been triggered, suggesting that the market top has yet to be reached.

0 Out Of 30 Bull Market Peak Indicators Triggered

The Bull Market Peak Indicator tracker on the Coinglass website follows a total of 30 indicators that follow 30 indicators that show the progress of the Bitcoin bull market toward reaching a top. Some major ones include the Bitcoin Bubble Index, the Puell Multiple, the Bitcoin Rainbow Chart, and the Altcoin Season Index, among others.

Usually, these indicators are tracked on a scale of 0-100%, with 0% meaning that it is far from being triggered and 100% showing that an indicator has been triggered. If only a few of these get to the 100% mark and are triggered, it usually doesn’t mean that the Bitcoin peak has been reached.

However, even now, not one of these indicators has been triggered. Most continue to remain quite low, while the likes of the Bitcoin dominance are high, but still have not been triggered. For there to be a definite progress toward the Bitcoin market peak, at least half of these would have to be triggered.

Bitcoin bull market peak indicator 1

What This Means For Investors

Since none of the bull market peak indicators have been triggered, it means that the Bitcoin price might actually be far away from its all-time high. With the score still being 0 out of 30, it points to this being a time to hold, despite the declines that the market has suffered recently.

According to a previous report from Bitcoinist, this was the case a few months ago, and now two months later, the tracker remains the same. Thus, it could be that $126,000 is not the all-time high for Bitcoin, and that the market could end up getting an altcoin season after all.

In the case that more than half of the bull market peak indicators do get triggered, then it means that the top of the market is getting close. Once it gets to 30/30, then it signals the start of the next bear market, and this is when selling is at its highest in the market, leading to rapid price declines across the board.

Bitcoin price chart from Tradingview.com

Bitcoin Accelerates Higher As Bulls Target Break Above $115,500 Resistance

Bitcoin price is attempting to recover above $113,500. BTC could rise further if there is a clear move above the $115,500 resistance.

  • Bitcoin started a fresh recovery wave above the $113,500 resistance level.
  • The price is trading above $114,000 and the 100 hourly Simple moving average.
  • There is a bullish trend line forming with support at $113,350 on the hourly chart of the BTC/USD pair (data feed from Kraken).
  • The pair might continue to move up if it trades above the $115,500 zone.

Bitcoin Price Starts Fresh Increase

Bitcoin price declined again below the $108,000 level. BTC tested the $106,720 zone and recently started a fresh increase. There was a move above the $112,000 resistance level.

The bulls were able to pump the price above $113,500 and the 100 hourly Simple moving average. Finally, the price spiked above $115,000 and is currently consolidating gains above the 23.6% Fib retracement level of the recent wave from the $106,718 swing low to the $115,400 high.

Besides, there is a bullish trend line forming with support at $113,350 on the hourly chart of the BTC/USD pair. Bitcoin is now trading above $114,000 and the 100 hourly Simple moving average.

Bitcoin Price

Immediate resistance on the upside is near the $115,250 level. The first key resistance is near the $115,500 level. The next resistance could be $116,200. A close above the $116,200 resistance might send the price further higher. In the stated case, the price could rise and test the $117,000 resistance. Any more gains might send the price toward the $118,000 level. The next barrier for the bulls could be $118,800.

Another Pullback In BTC?

If Bitcoin fails to rise above the $115,500 resistance zone, it could start a fresh decline. Immediate support is near the $114,000 level. The first major support is near the $113,500 level or the trend line.

The next support is now near the $111,000 zone. Any more losses might send the price toward the $110,500 support in the near term. The main support sits at $108,500, below which BTC might struggle to recover in the short term.

Technical indicators:

Hourly MACD – The MACD is now gaining pace in the bullish zone.

Hourly RSI (Relative Strength Index) – The RSI for BTC/USD is now above the 50 level.

Major Support Levels – $114,000, followed by $113,500.

Major Resistance Levels – $115,500 and $116,500.

❌