Normal view

Yesterday — 28 October 2025Main stream

Bitcoin Surges as U.S.-China Trade Breakthrough Sparks Market Rally

28 October 2025 at 21:00

This article was first published on The Bit Journal. Bitcoin surged past $116,000 on Monday morning after U.S. Treasury Secretary Scott Bessent announced a “very substantial framework” for a trade agreement between Washington and Beijing. 

Although a video of 79-year-old President Donald Trump dancing when he landed in Malaysia caught social media attention throughout the weekend, it was the words of Bessent that led to the optimistic reaction of global markets and investors, which boosted both stocks and cryptocurrencies.

Bitcoin Surge Mirrors Global Market Optimism

The Bitcoin surge was accompanied by an increase in traditional markets, as stocks also opened higher in Asia and the U.S, reflecting renewed optimism on reducing trade tensions between the two largest economies in the world.

Trump arrived in Kuala Lumpur on Sunday to pay a visit to the 47 th Association of Southeast Asian Nations (ASEAN) summit where his delegation is said to have assisted in brokering a peace deal between Cambodia and Thailand. Bessent, in the meantime, had signed various memorandums of understanding (MOUs) with Asian collaborators on rare earth mineral cooperation the strategic victory at a time of continued global realignments of supply chains.

U.S.-China Talks Spark Global Market Optimism

Nevertheless, the greatest achievement was the behind-the-scenes talks made by Bessent with the Chinese officials, which led to a tentative framework of trade that sought to end months of trade stalemate. Bessent said during an interview on NBC:

“We’ve created a framework for the two leaders to discuss on Thursday in Korea.I think it will be fantastic for U.S. citizens, for U.S. farmers, and for our country in general.”

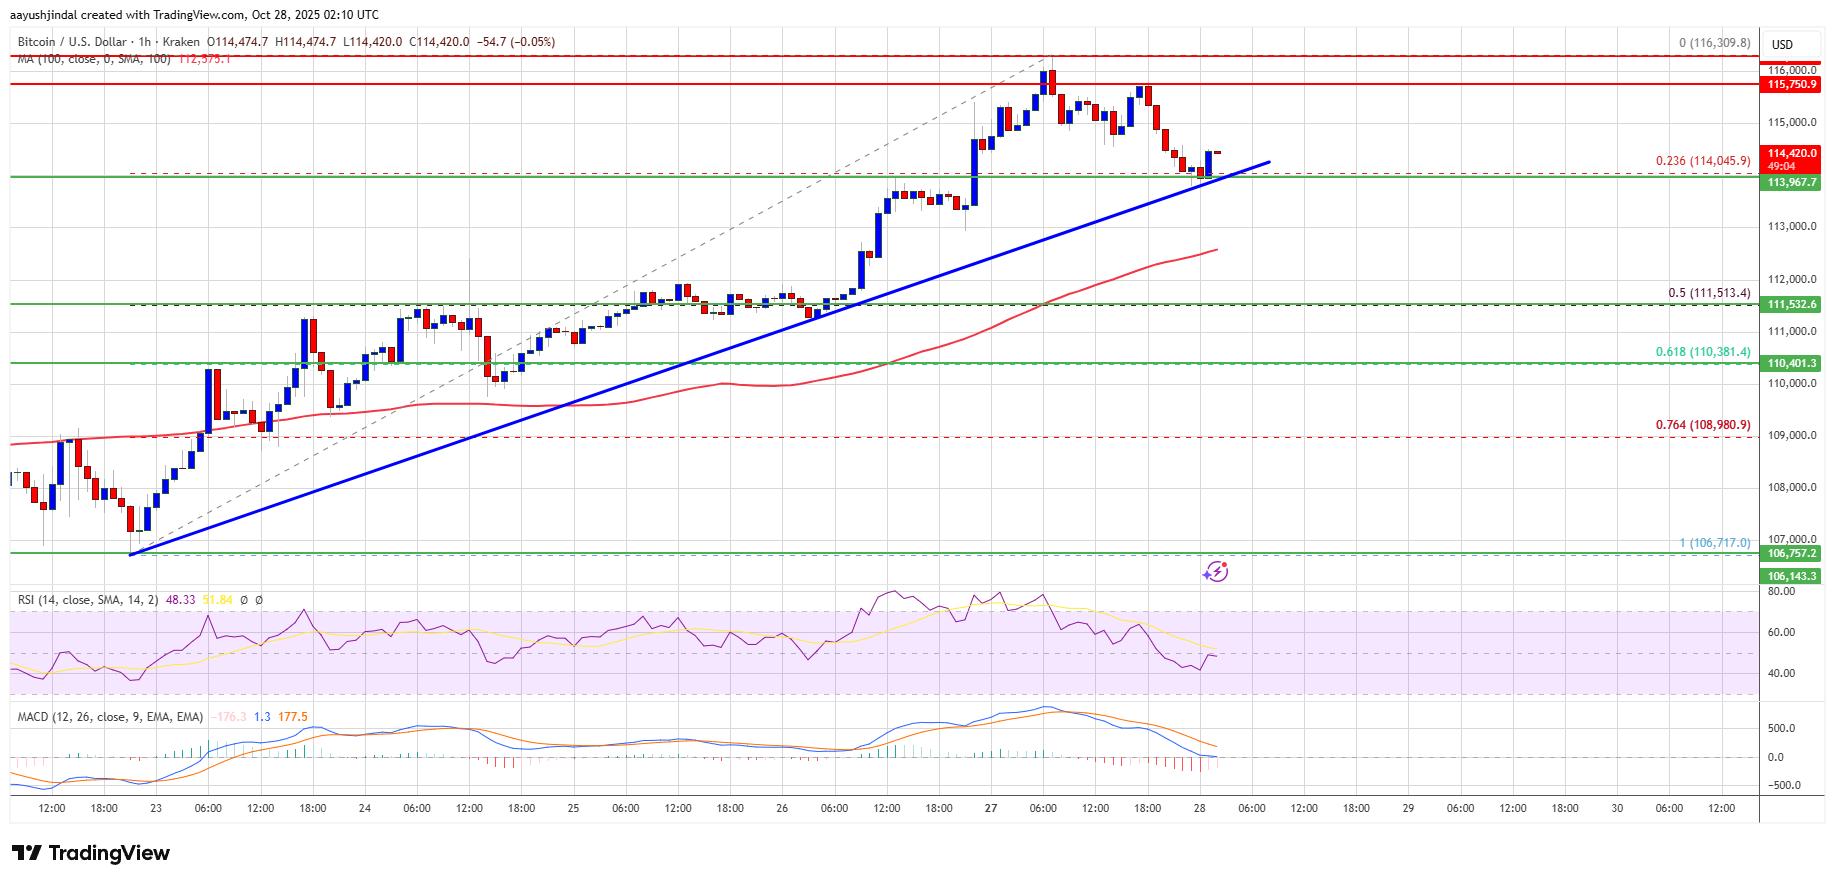
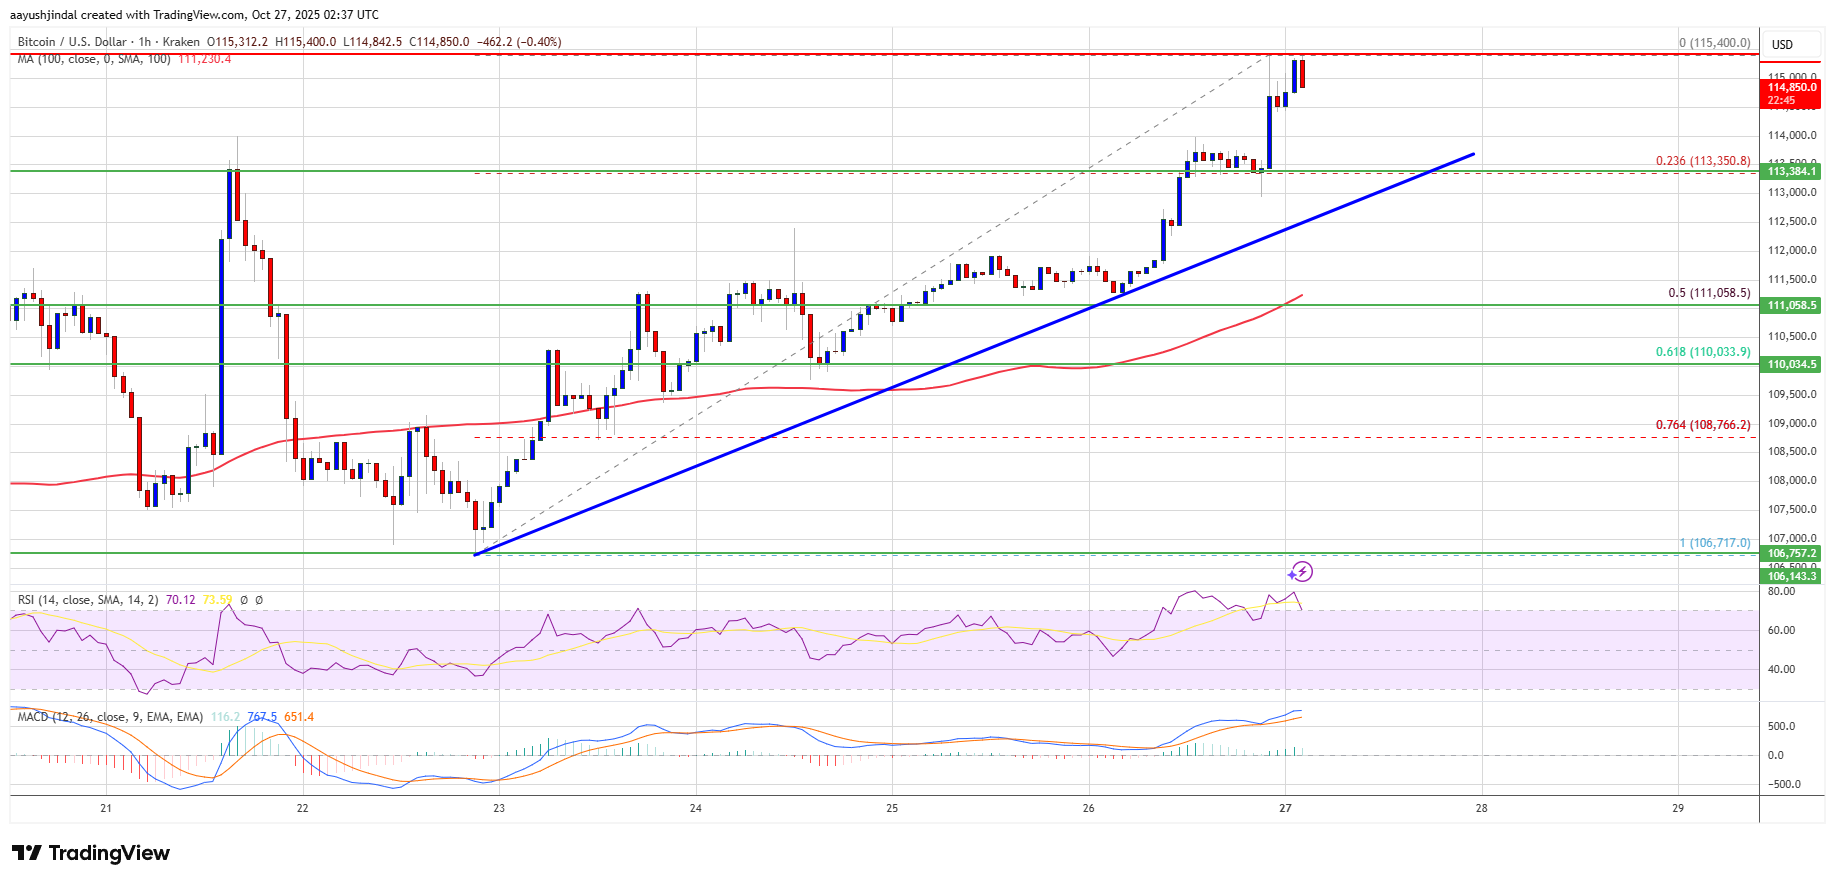
The markets reacted quickly to the announcement. Bitcoin surge momentum drove the price to $114,217.55 at the time of writing, a 1.93 percent rise on the last day and 4.73 percent on the week, respectively. The cryptocurrency has been ranging between $113,015.30 and $116,273.31 since Sunday, which is one of the most stable and bullish weekends of the cryptocurrency in the last several months.

Bitcoin Surge Fuels Derivatives Market Expansion

Trade activity increased accordingly. The 24-hour trading volume of Bitcoin increased by 87.11 percent to reach $62.55 billion, and market capitalization increased by 1.95 percent. The crypto market dominance of the asset did not significantly change at 59.63, increasing by a small margin of 0.01%.

The enthusiasm was reflected in derivatives markets. According to Coinglass data, open interest in Bitcoin futures rose 3.05 to $76.18 billion and total liquidations reached $140.97 million. Bitcoin surge had a big impact on short positions where they sustained a loss of $123.30 million and long traders suffered a relatively small loss of $17.67 million.

Bitcoin Surge Momentum Builds Ahead APEC

The most recent Bitcoin boom, analysts argue, highlights the extent to which cryptocurrency markets are following macroeconomic trends and geopolitical changes. The recent surge of Bitcoin demonstrates how vulnerable the digital goods are to conventional market drivers such as trade policy and diplomatic co-operation, according to one Singapore-based trader.

The following week may be a key one. On Thursday, Donald Trump and Chinese President Xi Jinping will hold an initial meeting on the Asia Pacific Economic Cooperation (APEC) summit in South Korea where both the leaders are likely to agree on the specifics of the proposed trade setup.

Should the discussions lead to tangible gains, analysts foresee the potential further increase of the Bitcoin surge and even new all-time highs by early November.

Conclusion 

As global markets ride a wave of optimism, all eyes now turn to Thursday’s APEC summit in South Korea. The anticipated Trump–Xi meeting could determine whether the current Bitcoin surge and stock market rally evolve into sustained economic momentum or fade with unmet expectations.

Follow us on Twitter and LinkedIn, and join our Telegram channel to be instantly informed about breaking news!

Summary

  • Bessent announced a major U.S.-China trade framework during Trump’s ASEAN visit.
  • The news sparked a Bitcoin surge past $116,000 and boosted global stocks.
  • Bitcoin trading volume jumped 87%, with futures and market cap rising.
  • Focus shifts to the APEC summit for Trump–Xi trade discussions.

Glossary of Key Terms

Bitcoin Surge:  Rapid rise in Bitcoin’s price.

Scott Bessent:  U.S. Treasury Secretary behind the trade deal news.

Trade Framework:  Initial U.S.-China trade agreement plan.

Donald Trump:  U.S. President attending ASEAN and APEC summits.

U.S.-China Trade Deal:  Agreement easing economic tensions.

ASEAN Summit:  Meeting of Southeast Asian nations.

APEC Summit:  Asia-Pacific trade summit for U.S.-China talks.

Derivatives Market:  Trading based on asset value changes.

Open Interest:  Active futures contracts in the market.

Geopolitical Factors:  Global political events affecting markets.

Frequently Asked Questions the Bitcoin Surge

1. Why did Bitcoin surge?

It rose after the U.S. announced a major trade framework with China.

2. What did Trump do in Malaysia?

He attended the ASEAN summit and helped broker a peace deal.

3. How did markets react?

Stocks and crypto surged on renewed trade optimism.

4. What’s next for Bitcoin?

All eyes are on the APEC summit for further trade progress.

Read More: Bitcoin Surges as U.S.-China Trade Breakthrough Sparks Market Rally">Bitcoin Surges as U.S.-China Trade Breakthrough Sparks Market Rally

Bitcoin Surges as U.S.-China Trade Breakthrough Sparks Market Rally

Bitcoin Price Volatility Hits Record Lows

Bitcoin Magazine

Bitcoin Price Volatility Hits Record Lows

Bitcoin price is once again testing the patience of traders, moving within one of the tightest percentile price ranges in its history. For more than four months, BTC has traded between roughly $106,000 and $123,000. This period of quiet has pushed volatility to its lowest level ever recorded on six-month metrics. Each time in the past that volatility has fallen to similar depths, it has been followed by a major trending move.

Bitcoin Price Volatility Compression

The current lull stands out even compared to previous phases of consolidation in this cycle. Despite occasional liquidations and sharp wicks, the broader price structure has barely shifted since June. One of the most telling metrics is the weekly Bollinger Band Width — the indicator has now reached its lowest weekly reading ever. In every past instance that Bitcoin’s bands have squeezed to this degree, bitcoin price volatility expansion followed shortly after.

When Bitcoin Price Volatility Returns

Periods of ultra-low volatility have never lasted long. In this cycle alone, there have already been five examples where similar consolidations ended with significant moves exceeding 65% gains within 100 days. Averaging those historical fractals to today’s setup would imply a potential bitcoin price target between $170,000 and $180,000 by 2026 if the next expansion phase mirrors prior behavior.

However, bitcoin price volatility compression does not guarantee immediate upside. Previous examples have shown that these low-volatility periods can extend for several months before a breakout occurs. Bitcoin could continue to trade sideways through late Q1 2026, oscillating within the current range before direction is decided.

Macro Catalysts for Bitcoin Price Volatility

Several macro factors could serve as a catalyst for renewed bitcoin price volatility. The Federal Reserve is expected to announce another rate cut, which markets currently price at near-certainty. Gold’s recent reversal after setting new highs also hints at potential capital rotation. If even a small fraction of that capital migrates toward Bitcoin amid falling rates and renewed risk appetite, the effect could amplify any breakout once volatility expands.

Conclusion: The Next Big Bitcoin Price Move

Volatility naturally declines as Bitcoin matures from a multi-billion to a multi-trillion-dollar asset, but the cyclical nature of expansion and contraction remains. The current compression phase has lasted unusually long, and historically such conditions have preceded powerful multi-month trends.

The final months of 2025 and early 2026 may test this pattern once again. With bitcoin price volatility metrics at record lows, macro conditions turning supportive, and market sentiment subdued, Bitcoin appears poised on the edge of its next major move.

For a more in-depth look into this topic, watch our most recent YouTube video here: Bitcoin Is About To Surprise Everyone.


For deeper data, charts, and professional insights into bitcoin price trends, visit BitcoinMagazinePro.com.

Subscribe to Bitcoin Magazine Pro on YouTube for more expert market insights and analysis!


Bitcoin Magazine Pro

Disclaimer: This article is for informational purposes only and should not be considered financial advice. Always do your own research before making any investment decisions.

This post Bitcoin Price Volatility Hits Record Lows first appeared on Bitcoin Magazine and is written by Matt Crosby.

November Preview: Will Bitcoin Break The Cycle Or Repeat It?

28 October 2025 at 20:00

A widely shared seasonality snapshot is making the rounds ahead of month-end: a Coinglass heat map of Bitcoin’s monthly returns, reposted by trader Daan Crypto Trades. The table spans 2013–2025 and shows November as the statistical outlier in Bitcoin’s calendar—both for eye-popping gains and for sharp drawdowns in certain years.

Bitcoin November Preview

“November is Bitcoin’s best month based on historical performance. By far,” Daan wrote on X, pointing to an average November change of +46.02% across the dataset. That figure is visibly distorted by November 2013’s +449.35% surge, the single largest monthly move on the board. He added: “The average gain over all these months is +46.02%. But this is heavily skewed by a single monthly gain in November 2013. Bitcoin went up +449.35%!! that month.”

The raw counts back up the reputation without the hyperbole. Out of the 12 Novembers listed (2013–2024), 8 finished green—2013 (+449.35%), 2014 (+12.82%), 2015 (+19.27%), 2016 (+5.42%), 2017 (+53.48%), 2020 (+42.95%), 2023 (+8.81%), and 2024 (+37.29%)—while 4 were negative—2018 (-36.57%), 2019 (-17.27%), 2021 (-7.11%), and 2022 (-16.23%).

The median November change sits at +10.82%, a more conservative central tendency that dampens the 2013 effect. Excluding 2013 entirely, the simple average for November drops to roughly +9.35% across the remaining 11 years, underscoring how one month can skew mean-based seasonality.

Bitcoin seasonality

Context from the broader table matters. November’s average is the highest of any month on Coinglass’s grid, ahead of October’s +20.30% average, while December shows a far more mixed profile with a +4.75% average but a -3.22% median—an imbalance consistent with outlier-driven months.

September, long maligned by traders, retains a negative average (-3.08%) over the full period. The 2024 row itself captures the push-and-pull of this cycle’s narrative: double-digit gains in February, March, May, October, and November, offset by meaningful drawdowns in April, June, and August, and a negative December print to close the year (-2.85%).

Lessons From Prior Cycles

Daan’s framing extends beyond simple seasonality. “November & December is when the 2013, 2017 & 2021 cycles topped out. It’s also where the 2018 & 2022 cycles bottomed out,” he noted. That observation lines up with the historical inflection points most market participants remember: the late-2013 mania and subsequent crash, the December 2017 peak, the November 2021 all-time high, and the December 2018 and November 2022 washouts.

The Coinglass grid cannot timestamp intramonth highs or lows, but the clustering of major pivots into the final two months of the year is consistent with the market’s folklore and with the returns pattern that shows both exceptionally strong up months and some of the cycle’s most punishing down months in this window.

The practical takeaway—again in Daan’s words—is not categorical bullishness, but regime risk: “All in all, an eventful last 2 months of the year generally speaking. Whether it’s on the bullish or bearish side, volatility and big market pivots have been the theme into the end of the year.” The heat map supports that characterization.

November’s distribution spans the widest extremes on record—from +449.35% at the top to -36.57% on the downside—with a two-thirds hit rate for green months and a median gain in the low double digits. December, by contrast, has produced both cycle tops and cycle bottoms despite a modest average, a reminder that average and median statistics can obscure the path risk that defines Bitcoin’s fourth quarter.

Seasonality is not destiny, and the sample is limited. Still, the data-backed message is clear: as November approaches, Bitcoin’s historical pattern has been less about quiet trend continuation and more about variance—the kind that has marked both euphoric blow-offs and capitulation lows.

At press time, BTC traded at $114,487.

Bitcoin price

Bitcoin Obsession Costs Saylor — S&P Tags Strategy As ‘Junk’

28 October 2025 at 17:30

Strategy Inc., the company led by Michael Saylor that rebranded from MicroStrategy, was hit with a junk credit grade on Monday as S&P Global Ratings flagged its heavy concentration in Bitcoin and weak dollar liquidity.

According to S&P, the firm’s balance sheet is tied closely to the price of Bitcoin and carries risks that traditional ratings models find hard to treat as stable collateral.

Bitcoin Holdings Drive The Score

Based on reports, Strategy’s Bitcoin stack is enormous — about 640,808 BTC on its books — worth roughly $73 billion to $74 billion at recent prices.

S&P said that while the company owns a large digital-asset hoard, the volatility of that asset and the company’s limited cash flow make it risky under S&P’s credit rules.

S&P assigned a B- issuer credit rating and kept the outlook stable. That B- places the company squarely in non-investment-grade territory, signaling a higher chance of stress if markets turn against it.

S&P Global Ratings has assigned Strategy Inc a ‘B-‘ Issuer Credit Rating (Outlook Stable) — the first-ever rating of a Bitcoin Treasury Company by a major credit rating agency. https://t.co/WLMkFqkkCb

— Michael Saylor (@saylor) October 27, 2025

Currency Mismatch And Debt Pressure

Reports have disclosed that S&P was particularly concerned about a mismatch: most obligations are owed in US dollars, but most of the company’s value sits in Bitcoin. This gap can force the sale of Bitcoin to meet dollar payments if prices slide.

Analysts and commentators pointed to sizable convertible securities and preferred-stock commitments that add cash demands on the company. According to filings and market write-ups, the firm faces billions of dollars in convertible and preferred obligations spread over coming years.

Saylor and Strategy have made repeat purchases of Bitcoin as part of their stated plan. Those buys have created big unrealized gains on paper, but S&P’s methodology largely treats the token differently from traditional equity when measuring risk-adjusted capital.

Liquidity, Access To Markets

S&P noted that, for now, Strategy still has access to capital markets, which is why its outlook is stable rather than immediately negative.

But the rating agency warned that a sharp drop in Bitcoin’s price or any sudden tightening of funding channels could trigger a further downgrade.

Market participants will watch funding costs, preferred dividend payments and convertible notes for signs of stress.

Investors reacted with mixed signals in early trading. Some buyers treated the downgrade as a formal recognition of a known risk, while others judged the move as a calibration that won’t stop Saylor’s accumulation strategy if markets stay calm.

Trading volume and price swings in both Strategy shares and Bitcoin may rise as traders reassess odds.

Featured image from Gemini, chart from TradingView

Bitcoin And Crypto Market Set To Bounce As Rate Cut Probabilities Touch 98.3%

28 October 2025 at 14:30

The next Federal Open Market Committee (FOMC) meeting is fast approaching, and the bets are already pouring in as to what it would mean for the Bitcoin and crypto industry. The last FOMC meeting took place in September, when the Federal Reserve ended up cutting rates down to 4-4.25% after months of no rate cuts. With this setting the tone, the expectations that another rate cut could be on the way are getting louder, with the FedWatch Tool showing a high percentage.

Market Expects Another Rate Cut To 3.75-4%

The next FOMC meeting is scheduled for Wednesday, October 29, 2025, and there is already a major clamor around what the Fed is planning on doing. The current market headwinds point to a favorable outcome for risk assets such as Bitcoin and other cryptocurrencies, with expected rate cuts.

Currently, the CME FedWatch Tool is showing that the probability of a rate cut has risen to 98.3% as of the time of this writing. This leaves only a 1.7% chance that the Federal Reserve will actually leave rates at their current levels, and there is zero chance that there will be a rate hike.

Fed FOMC

A reduction in the rate cuts is good for businesses all around, as lower interest rates mean better loan terms and increased spending and borrowing. Thus, it will increase the participation in the markets, from consumer goods to the stock market, and then make its way into newer markets such as Bitcoin and crypto.

Expectations For Bitcoin And Crypto Are Getting Higher

A rate cut by the Federal Reserve aligns with the more pro-crypto stance that the United States has been moving in since President Donald Trump was elected. Last week, the president pardoned the Founder and former CEO of the Binance crypto exchange, Changpeng Zhao, after he previously pled guilty to money laundering violations back in 2024. Zhao has since served a 4-month stint before the pardon from Trump came.

With the US embracing Bitcoin and crypto again, a rate cut will only further the ascent, allowing more investors to get into the market as liquidity frees up. The initial announcement has been known to trigger a rapid increase in the market. But as the news settles, the crypto market is expected to continue to rise in response.

However, nothing is certain until the FOMC meeting is complete and the announcement is made. For the Bitcoin and crypto market to remain bullish, inflation will also have to be reduced, as an increase could trigger more conservative stances from investors.

Bitcoin price chart from Tradingview.com (crypto)

Bitcoin Fear & Greed Index Returns To Neutral As BTC Breaks $115,000

28 October 2025 at 10:00

Data shows the Bitcoin Fear & Greed Index has surged back into the neutral zone after the recovery rally in the cryptocurrency’s price.

Bitcoin Fear & Greed Index Now Has A Value Of 51

The “Fear & Greed Index” refers to an indicator created by Alternative that measures the average sentiment present among traders in the Bitcoin and wider cryptocurrency markets. The metric uses the data of the following five factors to determine the investor mentality: trading volume, market cap dominance, volatility, social media sentiment, and Google Trends.

The index uses a numerical scale running from zero to hundred for representing this sentiment. All values above 53 correspond to greed among the investors, while those below 47 to fear. The region between the two cutoffs naturally corresponds to a net neutral mentality.

Now, here is how the current Bitcoin market sentiment is like, according to the Fear & Greed Index:

Bitcoin Neutral Sentiment

As is visible above, the indicator has a value of 51, which suggests the trader sentiment is almost exactly in the balance right now. This is a notable change in market mood compared to just a few days ago.

Bitcoin Fear & Greed Index

As displayed in the chart, the Fear & Greed Index was inside the fear zone during the past few days. The despair among the traders was a result of the bearish price action that BTC had recently faced.

At one point, the indicator even fell to a low of 22, reflecting a state of “extreme fear.” This zone, which occurs below 25, corresponds to investors being the most bearish toward the market. There is a similar region for the greed side as well, called the “extreme greed,” situated above 75.

Historically, the extreme sentiments have been quite significant for Bitcoin and other cryptocurrencies, as they are where major tops and bottoms have tended to form. The relationship has been an inverse one, however, meaning extreme fear is where bottoms form, while extreme greed facilitates tops.

Since the extreme fear low earlier in the month, BTC has been on the way up, a potential indication that the contrarian signal of the sentiment may once again be in action.

The cryptocurrency has extended its recovery in a sharp manner during the last couple of days, which may be a potential reason why the Fear & Greed Index has surged back to the neutral territory now.

Though, for now, Bitcoin traders are still undecided on whether bullish action will follow next. It now remains to be seen whether they will embrace greed, or continue to be hesitant about the recovery.

BTC Price

At the time of writing, Bitcoin is floating around $114,900, up 3.6% over the last seven days.

Bitcoin Price Chart

Dogecoin (DOGE) Cools Off — Buyers Struggle To Sustain Recovery Above Key Levels

28 October 2025 at 09:48

Dogecoin struggled to rise above $0.210 and corrected some gains against the US Dollar. DOGE is now consolidating and might decline below $0.1980.

  • DOGE price started a fresh downside correction below $0.2035.
  • The price is trading below the $0.20 level and the 100-hourly simple moving average.
  • There was a break below a contracting triangle with support at $0.20 on the hourly chart of the DOGE/USD pair (data source from Kraken).
  • The price could aim for a fresh increase if it remains stable above $0.1940.

Dogecoin Price Starts Another Pullback

Dogecoin price started a fresh increase after it settled above $0.1920, like Bitcoin and Ethereum. DOGE climbed above the $0.20 resistance to enter a positive zone.

The bulls were able to push the price above $0.2020 and $0.2050. A high was formed at $0.2094 and the price is now correcting gains. There was a move below the 23.6% Fib retracement level of the upward move from the $0.1843 swing low to the $0.2094 high.

Besides, there was a break below a contracting triangle with support at $0.20 on the hourly chart of the DOGE/USD pair. Dogecoin price is now trading below the $0.20 level and the 100-hourly simple moving average.

Dogecoin Price

If there is another increase, immediate resistance on the upside is near the $0.2020 level. The first major resistance for the bulls could be near the $0.2050 level. The next major resistance is near the $0.210 level. A close above the $0.210 resistance might send the price toward $0.2150. Any more gains might send the price toward $0.2250. The next major stop for the bulls might be $0.2320.

More Losses In DOGE?

If DOGE’s price fails to climb above the $0.2020 level, it could start a downside correction. Initial support on the downside is near the $0.1970 level and the 50% Fib retracement level of the upward move from the $0.1843 swing low to the $0.2094 high. The next major support is near the $0.1935 level.

The main support sits at $0.190. If there is a downside break below the $0.190 support, the price could decline further. In the stated case, the price might slide toward the $0.1840 level or even $0.1780 in the near term.

Technical Indicators

Hourly MACD – The MACD for DOGE/USD is now gaining momentum in the bearish zone.

Hourly RSI (Relative Strength Index) – The RSI for DOGE/USD is now below the 50 level.

Major Support Levels – $0.1970 and $0.1935.

Major Resistance Levels – $0.2020 and $0.2050.

XRP Price Prediction: Consolidation Persists — Bulls Need Fresh Push For Breakout

28 October 2025 at 08:28

XRP price started a fresh increase above $2.50. The price is now showing positive signs and might rise further if it clears the $2.6880 resistance.

  • XRP price gained pace for a move above $2.50 and $2.550.
  • The price is now trading above $2.50 and the 100-hourly Simple Moving Average.
  • There is a bullish trend line forming with support at $2.60 on the hourly chart of the XRP/USD pair (data source from Kraken).
  • The pair could start a fresh increase if it clears the $2.6880 resistance.

XRP Price Holds Support

XRP price started a fresh increase after it settled above $2.40, like Bitcoin and Ethereum. The price surpassed the $2.420 and $2.50 resistance levels.

The bulls were able to push the price above $2.550 and $2.65. A high was formed at $2.6972 and the price is now consolidating gains above the 23.6% Fib retracement level of the recent move from the $2.327 swing low to the $2.6972 high.

The price is now trading below $2.60 and the 100-hourly Simple Moving Average. There is a bullish trend line forming with support at $2.60 on the hourly chart of the XRP/USD pair.

XRP Price

If there is a fresh upward move, the price might face resistance near the $2.650 level. The first major resistance is near the $2.6880 level, above which the price could rise and test $2.70. A clear move above the $2.70 resistance might send the price toward the $2.7650 resistance. Any more gains might send the price toward the $2.80 resistance. The next major hurdle for the bulls might be near $2.880.

Downside Correction?

If XRP fails to clear the $2.6880 resistance zone, it could start a fresh decline. Initial support on the downside is near the $2.60 level. The next major support is near the $2.5650 level.

If there is a downside break and a close below the $2.5650 level, the price might continue to decline toward $2.5120 or the 50% Fib retracement level of the recent move from the $2.327 swing low to the $2.6972 high. The next major support sits near the $2.4680 zone, below which the price could continue lower toward $2.420.

Technical Indicators

Hourly MACD – The MACD for XRP/USD is now losing pace in the bullish zone.

Hourly RSI (Relative Strength Index) – The RSI for XRP/USD is now above the 50 level.

Major Support Levels – $2.60 and $2.580.

Major Resistance Levels – $2.650 and $2.6880.

Ethereum Supported On Dips — Buyers Build Strength For Next Leg Higher

28 October 2025 at 07:08

Ethereum price started a decent increase above $4,000. ETH is consolidating gains and could aim for more gains above the $4,220 resistance.

  • Ethereum started a fresh upward move above $4,000 and $4,120.
  • The price is trading above $4,080 and the 100-hourly Simple Moving Average.
  • There is a bullish trend line forming with support at $4,055 on the hourly chart of ETH/USD (data feed via Kraken).
  • The pair could continue to move up if it trades above $4,200.

Ethereum Price Holds Gains

Ethereum price started a steady upward move above the $3,880 zone, like Bitcoin. ETH price surpassed the $4,000 and $4,120 levels to enter a short-term positive zone.

The price even spiked above $4,200. A high was formed at $4,252 and the price is now consolidating gains. There was a minor decline below the 23.6% Fib retracement level of the recent wave from the $3,708 swing low to the $4,252 high.

Ethereum price is now trading above $4,080 and the 100-hourly Simple Moving Average. Besides, there is a bullish trend line forming with support at $4,055 on the hourly chart of ETH/USD.

Ethereum Price

On the upside, the price could face resistance near the $4,180 level. The next key resistance is near the $4,200 level. The first major resistance is near the $4,250 level. A clear move above the $4,250 resistance might send the price toward the $4,320 resistance. An upside break above the $4,320 region might call for more gains in the coming sessions. In the stated case, Ether could rise toward the $4,480 resistance zone or even $4,500 in the near term.

Another Pullback In ETH?

If Ethereum fails to clear the $4,200 resistance, it could start a fresh decline. Initial support on the downside is near the $4,080 level. The first major support sits near the $4,050 zone and the trend line.

A clear move below the $4,050 support might push the price toward the $3,980 support or the 50% Fib retracement level of the recent wave from the $3,708 swing low to the $4,252 high. Any more losses might send the price toward the $3,840 region in the near term. The next key support sits at $3,780.

Technical Indicators

Hourly MACDThe MACD for ETH/USD is losing momentum in the bullish zone.

Hourly RSIThe RSI for ETH/USD is now below the 50 zone.

Major Support Level – $4,050

Major Resistance Level – $4,200

Bitcoin Buzz: Michael Saylor Drops ‘Orange Dot Day’ Hint

28 October 2025 at 07:00

Bitcoin edged higher on Sunday as signs of easing US-China trade tensions lifted risk assets, while Strategy’s founder hinted the company kept adding to its Bitcoin holdings.

Strategy Keeps Buying

Michael Saylor posted a chart on October 26 that uses orange dots to mark recent purchases. The visual cue has become his shorthand for new buys.

Based on reports, Strategy added 387 BTC between October 13 and October 20, bringing its total to 640,418 BTC. That number is striking on its own. It shows a steady, deliberate approach to buying even when prices are volatile.

Strategy’s disclosed average cost for its Bitcoin stands at $74,010. The company’s moves lately have been small compared with September, when it took in more than 7,000 BTC across several large transactions. The size of any fresh purchases this week has not been publicly revealed.

At the same time, Bitcoin’s market moves were influenced by broader news. The price of Bitcoin rose about 1.6% on Sunday, while Ethereum gained roughly 2.8%. Short-term swings appear driven more by headlines than by a single company’s actions.

It’s Orange Dot Day. pic.twitter.com/5FSGmxwoNS

— Michael Saylor (@saylor) October 26, 2025

Bitcoin

Holdings, Valuation And Track Record

Based on reports, at prices a little over $115,000 per BTC, Strategy’s Bitcoin stash is valued at around $72 billion. That valuation implies a paper gain of more than $25 billion over a total cost basis of about $47.4 billion since the program began in 2020.

Reports have logged 83 separate purchase events in that time, a pattern that has left investors with a clear view of the firm’s playbook: buy repeatedly and report afterward.

Some of the buying was concentrated in September, when the firm added thousands of coins in a few large moves. Recently, however, allocations have looked smaller and more frequent. That shift suggests a preference for steady accumulation rather than single big bets.

Buying Behavior And Market Response

Strategy shares have been trading above the company’s net asset value. That fact suggests investors are comfortable owning MSTR as a way to gain Bitcoin exposure without buying the token directly. The company’s method — announce purchases after the fact and let the market reflect the holdings — has been consistent and predictable.

Geopolitical Headlines Drive Volatility

Meanwhile, officials from the US and China signaled progress in trade talks, and that helped calm some investors. According to reports, Scott Bessent told CBS News he expected the threat of 100% tariffs and an immediate export control regime to have receded.

Earlier in October, China announced tighter limits on rare earth exports used in chip manufacturing. On October 11, US President Donald Trump said he would impose an additional 100% tariff on Chinese goods and planned export controls on certain software to take effect on November 1.

Those days of sharp rhetoric caused heavy losses across markets and triggered one of the largest liquidation events in crypto this year.

Featured image from Gemini, chart from TradingView

Bitcoin Trades Sideways — Consolidation Above Support Could Fuel Next Upside

28 October 2025 at 06:17

Bitcoin price is consolidating gains above $113,500. BTC could rise further if there is a clear move above the $115,750 resistance.

  • Bitcoin started a fresh upward move above the $114,000 resistance level.
  • The price is trading above $114,200 and the 100 hourly Simple moving average.
  • There is a bullish trend line forming with support at $113,900 on the hourly chart of the BTC/USD pair (data feed from Kraken).
  • The pair might continue to move up if it trades above the $115,750 zone.

Bitcoin Price Starts Consolidation

Bitcoin price formed a base and started a fresh increase above the $112,500 zone. BTC gained pace for a move above the main hurdle at $113,500.

It opened the doors for a move above $115,000 and the 100 hourly Simple moving average. Finally, the price spiked above $116,000 and is currently consolidating gains above the 23.6% Fib retracement level of the recent wave from the $106,718 swing low to the $116,309 high.

Besides, there is a bullish trend line forming with support at $113,900 on the hourly chart of the BTC/USD pair. Bitcoin is now trading above $114,000 and the 100 hourly Simple moving average.

Bitcoin Price

Immediate resistance on the upside is near the $115,000 level. The first key resistance is near the $115,500 level. The next resistance could be $115,750. A close above the $115,750 resistance might send the price further higher. In the stated case, the price could rise and test the $116,300 resistance. Any more gains might send the price toward the $117,500 level. The next barrier for the bulls could be $118,000.

Another Pullback In BTC?

If Bitcoin fails to rise above the $115,500 resistance zone, it could start a fresh decline. Immediate support is near the $114,000 level. The first major support is near the $113,500 level or the trend line.

The next support is now near the $111,000 zone. Any more losses might send the price toward the $110,500 support in the near term. The main support sits at $108,500, below which BTC might struggle to recover in the short term.

Technical indicators:

Hourly MACD – The MACD is now gaining pace in the bullish zone.

Hourly RSI (Relative Strength Index) – The RSI for BTC/USD is now above the 50 level.

Major Support Levels – $114,000, followed by $113,500.

Major Resistance Levels – $115,500 and $116,500.

Nearly $360M In Crypto Shorts Squeezed As Bitcoin Recovers To $116,000

28 October 2025 at 06:00

Data shows cryptocurrency short investors have suffered large liquidations during the past day as Bitcoin and altcoins have made a recovery.

Bitcoin, Ethereum Have Surged In The Last 24 Hours

Bitcoin and other cryptocurrencies have witnessed a rally during the past day, breaking away from the slump the market had earlier fallen into. At the height of this surge, Bitcoin broke past $116,000, while Ethereum touched $4,250.

The assets have since seen a small retracement. The chart below shows how BTC’s latest trajectory has looked.

Bitcoin Price Chart

At its current price of $115,400, Bitcoin is up about 4% on the weekly timeframe. Similarly, Ethereum at $4,160 is in a profit of 3.4%. Most other digital assets have seen similarly positive returns, although there are some outliers like Tron, which is down more than 7%. The market-wide recovery during the past day has meant that a large amount of short liquidations have piled up on the derivatives exchanges.

Crypto Market Liquidations Have Totaled At $467 Million

According to data from CoinGlass, about $467 million in cryptocurrency-related derivatives contracts have been liquidated over the last 24 hours. A contract is said to be “liquidated” when its platform forcibly shuts it down after it accumulates losses of a certain degree (as defined by the exchange).

Given that coins across the board have rebounded, the contracts crossing this threshold would mostly be the short ones. And indeed, the data would confirm so.

Bitcoin & Crypto Liquidations

As is visible above, liquidations related to bearish cryptocurrency bets have reached $358 million in this window, representing 76.6% of the total flush in the sector. Bitcoin led the liquidations with $177 million in contracts involved, while Ethereum contributed the second most with $130 million in contracts. Out of the rest, Solana witnessed the largest flush at $34 million.

Bitcoin & Other Cryptos

In some other news, Bitcoin spot exchange-traded funds (ETFs) have observed a notable amount of inflows over the past month, as CryptoQuant community analyst Maartunn has pointed out in an X post.

Spot ETFs refer to investment vehicles that allow investors to gain exposure to an asset without having to directly own it. The US SEC approved BTC spot ETFs in January of 2024. Here is the chart shared by the analyst that shows how the 30-day netflow for these vehicles has fluctuated since:

Bitcoin Vs Ethereum Spot ETFs

As displayed in the above graph, Bitcoin spot ETFs have seen inflows of $4.7 billion during the past month. Ethereum spot ETFs, which gained approval in mid-2024, have also enjoyed inflows in this period, although their value of $983 million is significantly less than BTC’s.

Asia Morning Briefing: Crypto Markets Brace for a Pivotal Week as Trump–Xi Talks and Fed Decision Loom

Traders are betting on a Trump–Xi breakthrough and a dovish Fed pivot to revive “Uptober,” though markets remain wary that rare-earth restrictions and the U.S. shutdown could spoil the rally.

Bitcoin Supply In Profit Rises To 83.6% – Market Momentum Building Again

28 October 2025 at 03:00

Bitcoin (BTC) is showing renewed strength, reclaiming the $115,000 level after weeks of volatility and uncertainty. Bulls are attempting to build momentum for a potential impulse move higher, aiming to confirm a sustained bullish structure after the recent consolidation phase.

On-chain data continues to reveal a clear and repeating pattern tied to investor behavior and market cycles. Historically, when the percentage of Bitcoin supply in profit climbs above 95%, the market tends to enter an overheated phase, often leading to sharp corrections. These pullbacks serve as natural cooling periods, resetting sentiment and liquidity before the next major leg up.

Interestingly, each correction cycle has shown consistent bottoming zones around the 75% threshold, where long-term holders reaccumulate and market confidence begins to rebuild. More specifically, data highlights profit supply lows of 73% in September 2024, 76% in April 2024, and a recent rebound from 81%, signaling a potential mid-cycle recovery phase.

Bitcoin Supply in Profit Rises to 83.6% — Momentum Rebuilds Ahead of Key Threshold

According to top analyst Darkfost, the percentage of Bitcoin supply in profit has started to climb again, currently standing at 83.6%. This steady rise indicates that a growing share of Bitcoin holders are once again sitting on unrealized gains — a trend that often reflects improving sentiment and renewed market confidence.

Bitcoin Percent Supply in Profit | Source: CryptoQuant

Darkfost notes that this level can be interpreted as encouraging, suggesting that investors are willing to hold their BTC instead of realizing profits, anticipating further upside in the near term. Historically, such behavior has been characteristic of mid-cycle recovery phases, when fear starts to fade and accumulation resumes across both retail and institutional segments.

This stage of the cycle is considered healthy for rebuilding momentum, as it allows the market to stabilize after large corrections. Holders who previously capitulated often reenter at this stage, while long-term participants strengthen their positions, creating a more resilient market structure.

However, Darkfost cautions that once the supply in profit surpasses 95%, it typically signals overheated market conditions — a point where euphoria tends to replace rational conviction. In such phases, Bitcoin historically faces increased volatility and sharp corrections as overleveraged traders and short-term speculators take profits.

BTC Retests $115K Resistance: Bulls Regain Momentum

Bitcoin (BTC) is showing renewed bullish momentum, trading around $115,443 and successfully reclaiming key short-term support levels after weeks of consolidation. The daily chart highlights a strong recovery structure, with BTC breaking above both the 50-day and 100-day moving averages, signaling a shift in short-term market sentiment.

BTC testing key level | Source: BTCUSDT chart on TradingView

The next critical test lies at $117,500, a historical resistance zone that previously rejected multiple attempts in September and early October. A clear breakout and daily close above this level would likely confirm an impulse continuation toward $120K–$125K, opening the door for a more sustained uptrend.

Momentum indicators suggest strengthening buying pressure, while the recent bounce from the 200-day moving average near $107K underscores the market’s resilience. This level acted as a springboard for the current rally, aligning with the broader pattern of accumulation seen on-chain, where investor profitability is rising steadily.

However, BTC remains within a range-bound structure, and rejection at $117.5K could trigger short-term consolidation back toward $111K–$112K. Overall, Bitcoin’s technical outlook appears constructive — if the bulls can sustain above $115K and confirm strength above $117.5K, the market could transition into a new bullish leg, supported by improving investor sentiment and on-chain health.

Featured image from ChatGPT, chart from TradingView.com

Bitcoin Price Could See A New All-Time High Above $126,000 If It Breaks This Critical Level

28 October 2025 at 02:00

The Bitcoin price is positioning for a potentially explosive move that could take it well beyond its previous all-time highs. Analysts are closely watching a critical resistance level near $116,000, which may serve as the final hurdle before BTC catapults into uncharted territory above $126,000. 

Analyst Predicts New Bitcoin Price All-Time High

Crypto analyst Donny Dicey revealed in an X social media post this week that the $116,000 price level is the decisive zone Bitcoin must breach to confirm a breakout toward a new all-time high. His technical analysis suggests that once BTC achieves a clean break above this resistance area, momentum could swiftly carry it above $126,000. 

Notably, Bitcoin set a new ATH on October 6, 2025, after breaking through its previous record above $124,000 and climbing past $126,000. Since achieving this level, the price of BTC has fallen dramatically to $115,000. Dicey’s accompanying chart shows the market steadily recovering after testing support near $108,000, marked as a “market structure break” region, with bullish price action consolidating above $109,000. 

The analyst has emphasized that each day Bitcoin maintains a close above $109,000 strengthens the probability of a strong upward swing as the market heads into November. This period coincides with the Federal Open Market Committee’s (FOMC) next meeting, where investors are anticipating dovish signals such as rate cuts or the formal end of Quantitative Tightening (QT).

Bitcoin

Dicey also notes that bullish S&P 500 earnings, easing global trade tensions from a potential agreement between US President Donald Trump and China’s President Xi Jinping, and improving ISM manufacturing data point to a macro environment supportive of risk assets. A community member commented that whales may have underestimated how much BTC’s demand tends to persist during these conditions. Dicey responded that the same whales might become “exit liquidity” as Bitcoin accelerates higher, possibly missing out on the strongest phase of this cycle. 

Consolidation Above January Highs Signal Unbreakable Strength

In a follow-up analysis, Dicey highlighted Bitcoin’s remarkable stability above its January highs, describing its price structure as “unbreakable” amid global macroeconomic uncertainty. He pointed to several converging factors that reinforce BTC’s resilience, including ongoing fiscal and monetary expansion, a weakening US dollar, and renewed confidence in the global business cycle. 

The analyst also emphasized that geopolitical tensions tied to US-China relations appear to be subsiding. At the same time, ETF inflows and exponential growth in the Artificial Intelligence (AI) sector contribute to acting as tailwinds for digital assets. He disclosed that despite strong underlying fundamentals, skepticism remains widespread in the market.

According to him, many still believe in the traditional four-year cycle narrative, while retail enthusiasm has not fully returned. Furthermore, the Russell 2000 index has yet to breakout, and rotation from traditional assets, such as the S&P 500 and gold, into Bitcoin remains limited. With these developments subduing broader market participation, Dicey suggests it creates the perfect setup for a powerful rally in BTC once sentiment shifts decisively.

Bitcoin

Before yesterdayMain stream

Forget Inflation: Bitcoin Rallies When The Dollar Falls, Study Finds

27 October 2025 at 12:30

According to NYDIG research, Bitcoin’s price moves are driven more by the strength of the US dollar and broad liquidity conditions than by direct ties to inflation.

Greg Cipolaro, NYDIG’s global head of research, said the data show weak and inconsistent links between inflation measures and Bitcoin. That view shifts attention away from the old narrative that Bitcoin is mainly an inflation hedge.

Inflation Link Weak

Cipolaro argued that expectations for inflation are a slightly better signal than headline inflation readings, but still not a tight predictor of Bitcoin’s price.

Instead, Bitcoin and gold both tend to gain when the US dollar weakens. While gold’s inverse relation with the dollar is long established, Bitcoin’s opposite movement to the dollar is newer but visible.

Gold And Bitcoin React To Dollar Moves

Based on reports, gold has historically climbed as the dollar falls. Bitcoin is following that pattern, though its correlation is less steady than gold’s.

As Bitcoin becomes more connected with mainstream finance, NYDIG expects that its inverse relationship with the dollar will likely strengthen.

This makes sense to traders who price everything in dollars and seek alternatives when the greenback loses purchasing power.

Interest Rates And Money Supply

Cipolaro highlighted interest rates and money supply as the two major macro levers that move both gold and Bitcoin.

Lower interest rates and looser monetary policy have tended to support higher prices for these assets.

In simple terms: when borrowing costs drop and liquidity rises, Bitcoin often benefits. The note framed gold as more of a real-rate hedge, while Bitcoin is described as acting like a gauge of market liquidity — a subtle but important distinction for investors.

Illiquid Supply Drops, Selling Pressure Returns

On-chain data show signs of renewed selling. Reports say illiquid Bitcoin — coins held in long-dormant wallets — fell from 14.38 million earlier in October to 14.300 million on the 23rd of October.

That change means roughly 62,000 BTC, worth about $6.8 billion at recent prices, moved back into circulation. In the past, large inflows did exert price pressure. In January 2024, a substantial sum of coins came available that caused the price momentum to soften.

According to Glassnode data, there has been a consistent selloff from wallets holding from 0.1 to 100 BTC, and first-time buyer supply has contracted down to ~213,000 BTC.

The overall assessment from a macro perspective and on-chain metrics is not favorable. Demand from new buyers appears to be lighter, momentum traders appear to have stepped aside, and more coins are now available to trade. This combination can blunt rallies or deepen pullbacks until liquidity conditions improve or the dollar weakens.

Featured image from Gemini, chart from TradingView

100% Of Bitcoin Bull Market Peak Indicators Remain Untouched, Is There Still Room To Run?

27 October 2025 at 11:00

Over the years, a number of indicators have emerged that have often helped to pinpoint the Bitcoin bull market peak. These indicators have been triggered in previous cycles, and their triggers have often been a signal that it was time to get out of the market, as a new bear market is underway. However, this time around, even with the Bitcoin price hitting multiple new all-time highs, none of these cycle peak indicators have been triggered, suggesting that the market top has yet to be reached.

0 Out Of 30 Bull Market Peak Indicators Triggered

The Bull Market Peak Indicator tracker on the Coinglass website follows a total of 30 indicators that follow 30 indicators that show the progress of the Bitcoin bull market toward reaching a top. Some major ones include the Bitcoin Bubble Index, the Puell Multiple, the Bitcoin Rainbow Chart, and the Altcoin Season Index, among others.

Usually, these indicators are tracked on a scale of 0-100%, with 0% meaning that it is far from being triggered and 100% showing that an indicator has been triggered. If only a few of these get to the 100% mark and are triggered, it usually doesn’t mean that the Bitcoin peak has been reached.

However, even now, not one of these indicators has been triggered. Most continue to remain quite low, while the likes of the Bitcoin dominance are high, but still have not been triggered. For there to be a definite progress toward the Bitcoin market peak, at least half of these would have to be triggered.

Bitcoin bull market peak indicator 1

What This Means For Investors

Since none of the bull market peak indicators have been triggered, it means that the Bitcoin price might actually be far away from its all-time high. With the score still being 0 out of 30, it points to this being a time to hold, despite the declines that the market has suffered recently.

According to a previous report from Bitcoinist, this was the case a few months ago, and now two months later, the tracker remains the same. Thus, it could be that $126,000 is not the all-time high for Bitcoin, and that the market could end up getting an altcoin season after all.

In the case that more than half of the bull market peak indicators do get triggered, then it means that the top of the market is getting close. Once it gets to 30/30, then it signals the start of the next bear market, and this is when selling is at its highest in the market, leading to rapid price declines across the board.

Bitcoin price chart from Tradingview.com

Solana (SOL) Strengthens — Gradual Gains Indicate Renewed Demand From Buyers

27 October 2025 at 09:48

Solana started a fresh increase above the $200 zone. SOL price is now consolidating above $200 and might aim for more gains above the $208 zone.

  • SOL price started a fresh upward move above the $188 and $195 levels against the US Dollar.
  • The price is now trading above $200 and the 100-hourly simple moving average.
  • There is a bullish trend line forming with support at $198 on the hourly chart of the SOL/USD pair (data source from Kraken).
  • The pair could extend gains if it clears the $208 resistance zone.

Solana Price Jumps Again Above $200

Solana price started a decent increase after it settled above the $180 zone, like Bitcoin and Ethereum. SOL climbed above the $188 level to enter a short-term positive zone.

The price even smashed the $198 resistance. The bulls were able to push the price above $200. The price is now consolidating gains above the 23.6% Fib retracement level of the recent upward move from the $177 swing low to the $204 high.

Solana is now trading above $200 and the 100-hourly simple moving average. Besides, there is a bullish trend line forming with support at $198 on the hourly chart of the SOL/USD pair.

Solana Price

On the upside, the price is facing resistance near the $205. The next major resistance is near the $208 level. The main resistance could be $212. A successful close above the $212 resistance zone could set the pace for another steady increase. The next key resistance is $225. Any more gains might send the price toward the $232 level.

Another Pullback In SOL?

If SOL fails to rise above the $205 resistance, it could start another decline. Initial support on the downside is near the $198 zone and the trend line. The first major support is near the $192 level and the 50% Fib retracement level of the recent upward move from the $177 swing low to the $204 high.

A break below the $192 level might send the price toward the $184 support zone. If there is a close below the $184 support, the price could decline toward the $180 support in the near term.

Technical Indicators

Hourly MACD – The MACD for SOL/USD is gaining pace in the bullish zone.

Hourly Hours RSI (Relative Strength Index) – The RSI for SOL/USD is above the 50 level.

Major Support Levels – $198 and $184.

Major Resistance Levels – $205 and $208.

XRP Price Gains Traction — Buyers Pile In Ahead Of Key Technical Breakout

27 October 2025 at 09:08

XRP price started a fresh increase above $2.45. The price is now showing positive signs and might rise further if it clears the $2.680 resistance.

  • XRP price is attempting a fresh increase above the $2.50 zone.
  • The price is now trading above $2.50 and the 100-hourly Simple Moving Average.
  • There is a bullish trend line forming with support at $2.580 on the hourly chart of the XRP/USD pair (data source from Kraken).
  • The pair could start a fresh increase if it clears the $2.680 resistance.

XRP Price Eyes Steady Increase

XRP price formed a base above $2.320 and started a fresh increase, like Bitcoin and Ethereum. The price surpassed the $2.380 and $2.450 resistance levels.

The bulls were able to push the price above $2.50 and $2.55. A high was formed at $2.668 and the price is now consolidating gains above the 23.6% Fib retracement level of the recent wave from the $2.327 swing low to the $2.668 high.

The price is now trading below $2.50 and the 100-hourly Simple Moving Average. There is a bullish trend line forming with support at $2.580 on the hourly chart of the XRP/USD pair.

XRP Price

If there is a fresh upward move, the price might face resistance near the $2.660 level. The first major resistance is near the $2.680 level, above which the price could rise and test $2.750. A clear move above the $2.750 resistance might send the price toward the $2.80 resistance. Any more gains might send the price toward the $2.920 resistance. The next major hurdle for the bulls might be near $2.950.

Are Dips Supported?

If XRP fails to clear the $2.680 resistance zone, it could start a fresh decline. Initial support on the downside is near the $2.60 level. The next major support is near the $2.580 level.

If there is a downside break and a close below the $2.580 level, the price might continue to decline toward $2.50 or the 50% Fib retracement level of the recent wave from the $2.327 swing low to the $2.668 high. The next major support sits near the $2.450 zone, below which the price could continue lower toward $2.40.

Technical Indicators

Hourly MACD – The MACD for XRP/USD is now gaining pace in the bullish zone.

Hourly RSI (Relative Strength Index) – The RSI for XRP/USD is now above the 50 level.

Major Support Levels – $2.60 and $2.580.

Major Resistance Levels – $2.660 and $2.680.

Ethereum Moves Higher — Buyers Strengthen Grip Amid Renewed Market Optimism

27 October 2025 at 08:08

Ethereum price started a recovery wave above $4,000. ETH is moving higher but faces a couple of key hurdles near $4,220 and $4,250.

  • Ethereum started a fresh recovery above $4,000 and $4,120.
  • The price is trading above $4,120 and the 100-hourly Simple Moving Average.
  • There is a bullish trend line forming with support at $4,050 on the hourly chart of ETH/USD (data feed via Kraken).
  • The pair could continue to move up if it trades above $4,220.

Ethereum Price Eyes Steady Gains

Ethereum price started a minor recovery wave above the $3,880 zone, like Bitcoin. ETH price surpassed the $4,000 and $4,050 levels to enter a short-term positive zone.

The price even spiked above $4,220. A high was formed at $4,225 and the price is now consolidating gains. The price is stable above the 23.6% Fib retracement level of the recent increase from the $3,708 swing low to the $4,225 high.

Ethereum price is now trading above $4,150 and the 100-hourly Simple Moving Average. Besides, there is a bullish trend line forming with support at $4,050 on the hourly chart of ETH/USD.

Ethereum Price

On the upside, the price could face resistance near the $4,220 level. The next key resistance is near the $4,250 level. The first major resistance is near the $4,320 level. A clear move above the $4,320 resistance might send the price toward the $4,450 resistance. An upside break above the $4,450 region might call for more gains in the coming sessions. In the stated case, Ether could rise toward the $4,500 resistance zone or even $4,550 in the near term.

Another Decline In ETH?

If Ethereum fails to clear the $4,220 resistance, it could start a fresh decline. Initial support on the downside is near the $4,150 level. The first major support sits near the $4,120 zone.

A clear move below the $4,120 support might push the price toward the $4,050 support. Any more losses might send the price toward the $4,000 region in the near term. The next key support sits at $3,880.

Technical Indicators

Hourly MACDThe MACD for ETH/USD is gaining momentum in the bullish zone.

Hourly RSIThe RSI for ETH/USD is now above the 50 zone.

Major Support Level – $4,120

Major Resistance Level – $4,220

Bitcoin Accelerates Higher As Bulls Target Break Above $115,500 Resistance

27 October 2025 at 06:49

Bitcoin price is attempting to recover above $113,500. BTC could rise further if there is a clear move above the $115,500 resistance.

  • Bitcoin started a fresh recovery wave above the $113,500 resistance level.
  • The price is trading above $114,000 and the 100 hourly Simple moving average.
  • There is a bullish trend line forming with support at $113,350 on the hourly chart of the BTC/USD pair (data feed from Kraken).
  • The pair might continue to move up if it trades above the $115,500 zone.

Bitcoin Price Starts Fresh Increase

Bitcoin price declined again below the $108,000 level. BTC tested the $106,720 zone and recently started a fresh increase. There was a move above the $112,000 resistance level.

The bulls were able to pump the price above $113,500 and the 100 hourly Simple moving average. Finally, the price spiked above $115,000 and is currently consolidating gains above the 23.6% Fib retracement level of the recent wave from the $106,718 swing low to the $115,400 high.

Besides, there is a bullish trend line forming with support at $113,350 on the hourly chart of the BTC/USD pair. Bitcoin is now trading above $114,000 and the 100 hourly Simple moving average.

Bitcoin Price

Immediate resistance on the upside is near the $115,250 level. The first key resistance is near the $115,500 level. The next resistance could be $116,200. A close above the $116,200 resistance might send the price further higher. In the stated case, the price could rise and test the $117,000 resistance. Any more gains might send the price toward the $118,000 level. The next barrier for the bulls could be $118,800.

Another Pullback In BTC?

If Bitcoin fails to rise above the $115,500 resistance zone, it could start a fresh decline. Immediate support is near the $114,000 level. The first major support is near the $113,500 level or the trend line.

The next support is now near the $111,000 zone. Any more losses might send the price toward the $110,500 support in the near term. The main support sits at $108,500, below which BTC might struggle to recover in the short term.

Technical indicators:

Hourly MACD – The MACD is now gaining pace in the bullish zone.

Hourly RSI (Relative Strength Index) – The RSI for BTC/USD is now above the 50 level.

Major Support Levels – $114,000, followed by $113,500.

Major Resistance Levels – $115,500 and $116,500.

Asia Morning Briefing: Bitcoin Holds Above $114K as Whales Absorb Supply and Shorts Rebalance

On-chain data shows roughly 62,000 BTC have moved out of long-term storage since mid-October, softening one of this cycle’s strongest tailwinds. But steady whale accumulation and a moderate short-side cleanup helped prices stabilize near $114K.

XRP/BTC Retests Six-Year Breakout Trendline, Analyst Calls For A Decoupling

27 October 2025 at 01:00

The XRP/BTC monthly chart has finally snapped the long diagonal that’s capped XRP since 2018, and one analyst on X thinks that shift could rewrite the pecking order. Posting under the handle X Finance Bull (XFB), the analyst argued that XRP will soon start to outperform Bitcoin. 

This is because the XRP/BTC pair has not only broken out but also retested the trendline as support, and this has certified the start of a new buildup of momentum.

Retest Of A Six-Year Breakout Trendline

The mid-October flash crash that rippled through the crypto market left a visible mark on the XRP/BTC chart, creating a deep downward wick that momentarily dipped below the long-standing resistance trendline. However, as Bitcoin started to recover to above $110,000, XRP struggled to keep up and lost ground relative to Bitcoin. 

Interestingly, price action shows that this move was short-lived, and XRP has started to recover against Bitcoin in recent trading sessions. As shown on the monthly candlestick timeframe chart below, the wick fell to the exact level of the breakout retest, a point where former resistance turned into new support.

This breakout occurred in late 2024/early 2025, when XRP outperformed Bitcoin for three consecutive months. From there, the XRP/Bitcoin pair was able to break out of a downward-sloping resistance trendline of lower highs spanning over six years. 

Since then, however, 2025 has been characterized by more months of Bitcoin outperforming XRP than months of XRP outperforming Bitcoin, with October falling into the former group of months. Particularly, during the flash crash, the XRP/BTC pair plunged to around 0.000007 before rebounding almost immediately, a move that, according to XFB, represents the long-awaited retest of the broken trendline.

XRP/Bitcoin 1M chart. Source: @Xfinancebull

Since that retest, XRP has recovered impressively, with the pair maintaining a monthly close above the diagonal that once acted as a ceiling. This technical confirmation signals the completion of the breakout from the 2018 to 2024 downtrend that had defined XRP’s multi-year underperformance against Bitcoin. The monthly structure is now displaying the early signs of an upward shift, with the pair trading around 0.00002258 BTC.

XRP To Decouple And Outperform Bitcoin?

According to the analyst, XRP is about to undergo a rally that massively outperforms Bitcoin and melts the face of many Bitcoin maximalists. XFB’s chart outlines two target zones ahead for XRP: 0.00014688 BTC and 0.00023009 BTC. The first target corresponds to the consolidation area seen between 2018 and 2019, while the second represents a major resistance cluster from the earlier phase of XRP’s creation. If XRP/BTC rallies to those levels, it would amount to approximately a 6x and 10x gain relative to Bitcoin, respectively.

The analyst also connects the technical setup to Ripple’s growing institutional ecosystem. He pointed to Ripple Prime, GTreasury, Metaco, Standard Custody, and Rail as part of the infrastructure that’s setting up XRP as a bridge asset for global finance. These partnerships give XRP an edge heading into the coming months, as it moves into real institutional utility and starts outperforming Bitcoin.

If these developments continue, the incoming decoupling of the XRP/BTC pair could become one of the most significant events for XRP. At the time of writing, XRP is trading at $3.63, up by 3.5% in the past 24 hours.

Featured image from Unsplash, chart from TradingView

❌
❌