The next Federal Open Market Committee (FOMC) meeting is fast approaching, and the bets are already pouring in as to what it would mean for the Bitcoin and crypto industry. The last FOMC meeting took place in September, when the Federal Reserve ended up cutting rates down to 4-4.25% after months of no rate cuts. With this setting the tone, the expectations that another rate cut could be on the way are getting louder, with the FedWatch Tool showing a high percentage.
Market Expects Another Rate Cut To 3.75-4%
The next FOMC meeting is scheduled for Wednesday, October 29, 2025, and there is already a major clamor around what the Fed is planning on doing. The current market headwinds point to a favorable outcome for risk assets such as Bitcoin and other cryptocurrencies, with expected rate cuts.
Currently, the CME FedWatch Tool is showing that the probability of a rate cut has risen to 98.3% as of the time of this writing. This leaves only a 1.7% chance that the Federal Reserve will actually leave rates at their current levels, and there is zero chance that there will be a rate hike.
A reduction in the rate cuts is good for businesses all around, as lower interest rates mean better loan terms and increased spending and borrowing. Thus, it will increase the participation in the markets, from consumer goods to the stock market, and then make its way into newer markets such as Bitcoin and crypto.
Expectations For Bitcoin And Crypto Are Getting Higher
A rate cut by the Federal Reserve aligns with the more pro-crypto stance that the United States has been moving in since President Donald Trump was elected. Last week, the president pardoned the Founder and former CEO of the Binance crypto exchange, Changpeng Zhao, after he previously pled guilty to money laundering violations back in 2024. Zhao has since served a 4-month stint before the pardon from Trump came.
With the US embracing Bitcoin and crypto again, a rate cut will only further the ascent, allowing more investors to get into the market as liquidity frees up. The initial announcement has been known to trigger a rapid increase in the market. But as the news settles, the crypto market is expected to continue to rise in response.
However, nothing is certain until the FOMC meeting is complete and the announcement is made. For the Bitcoin and crypto market to remain bullish, inflation will also have to be reduced, as an increase could trigger more conservative stances from investors.
Bitcoin price surged to $115,000 on Monday, rising more than 1% in 24 hours, as optimism over easing U.S.–China trade tensions and renewed investor appetite for risk assets lifted global markets.
According to Geoffrey Kendrick, Head of Digital Asset Research at Standard Chartered Bank, Bitcoin price may “never fall below $100,000 again” if this week’s macro tailwinds continue.
In a note to clients, Kendrick said that improving trade relations between Washington and Beijing have flipped last week’s market fear into “hope.”
U.S. Treasury Secretary Scott Bessent’s weekend statement that restrictions on China’s rare earth exports could be postponed for a year, combined with reports that Beijing plans to buy large quantities of U.S. soybeans, sparked a relief rally across equities, commodities, and crypto.
China, U.S trade deals and FOMC rate cuts
The agreement, expected to be finalized after the upcoming Trump–Xi summit in South Korea, has renewed risk appetite and pushed the bitcoin-to-gold ratio back above pre-October 10 levels — the date when 100% tariff threats sent markets tumbling.
Kendrick pointed to fresh inflows into spot bitcoin ETFs as another key signal of strength. Over $2 billion exited U.S. gold ETFs late last week, and if even half of that re-enters bitcoin funds, he said, it would mark a major vote of confidence.
The analyst also highlighted macro tailwinds, including expectations for a 25-basis-point rate cut at Wednesday’s Federal Open Market Committee (FOMC) meeting — a move widely seen as bullish for bitcoin.
Meanwhile, investors are watching a packed earnings calendar from both tech and crypto heavyweights. Microsoft, Meta, and Google are set to report on Wednesday, followed by Apple, Amazon, Coinbase, and Strategy (formerly MicroStrategy) later in the week.
“If this week goes well — bitcoin may never fall below $100,000 again,” Kendrick said.
Bitcoin price outlook
While bulls have made modest progress with Bitcoin, stronger resistance remains overhead at $117,600 and $122,000, leaving bears largely in control.
If Bitcoin manages to surpass $122,000, professionals note the next target could be the upper boundary of a broadening wedge pattern at $128,000.
Support levels remain critical for maintaining bullish momentum. The key short-term support at $106,900 held throughout last week, helping stabilize the market.
Falling below this level could open the path toward the $105,000–$102,000 support zone, which has already been tested twice, with a third test raising the likelihood of a breakdown.
Beyond that, $96,000 represents a crucial long-term support level for the broader bull market, acting as a do-or-die floor if prices decline further.
As of press time, bitcoin was trading at $115,041, up 1.22% over the past 24 hours.
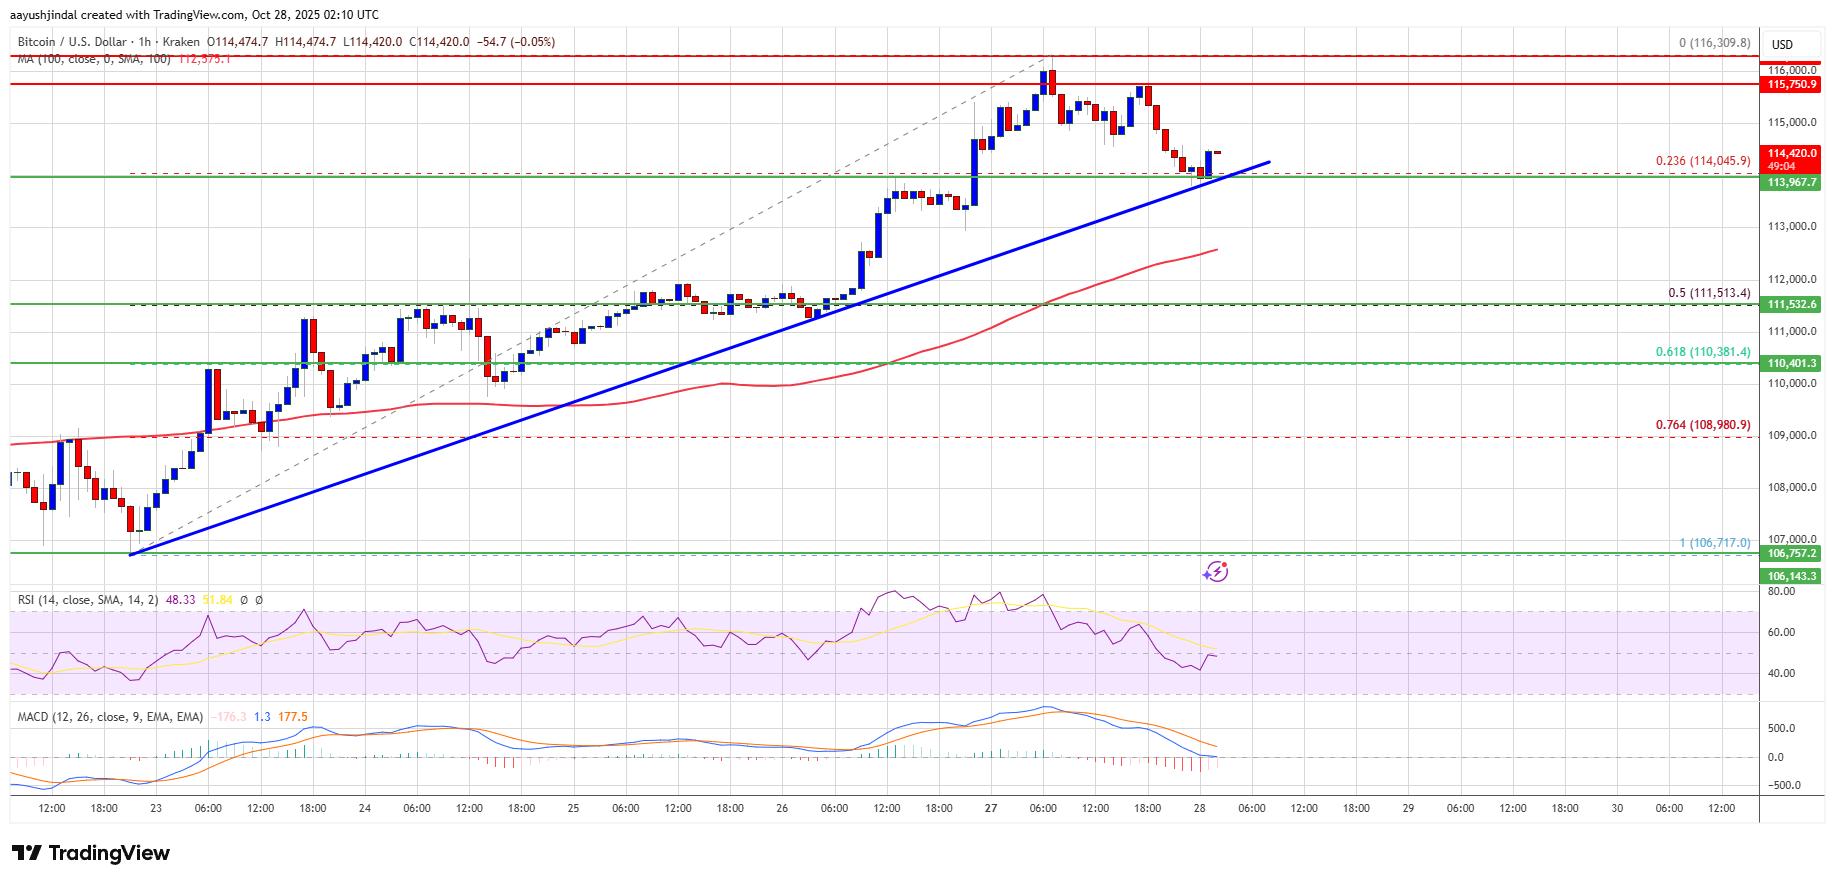
Bitcoin price is consolidating gains above $113,500. BTC could rise further if there is a clear move above the $115,750 resistance.
Bitcoin started a fresh upward move above the $114,000 resistance level.
The price is trading above $114,200 and the 100 hourly Simple moving average.
There is a bullish trend line forming with support at $113,900 on the hourly chart of the BTC/USD pair (data feed from Kraken).
The pair might continue to move up if it trades above the $115,750 zone.
Bitcoin Price Starts Consolidation
Bitcoin price formed a base and started a fresh increase above the $112,500 zone. BTC gained pace for a move above the main hurdle at $113,500.
It opened the doors for a move above $115,000 and the 100 hourly Simple moving average. Finally, the price spiked above $116,000 and is currently consolidating gains above the 23.6% Fib retracement level of the recent wave from the $106,718 swing low to the $116,309 high.
Besides, there is a bullish trend line forming with support at $113,900 on the hourly chart of the BTC/USD pair. Bitcoin is now trading above $114,000 and the 100 hourly Simple moving average.
Immediate resistance on the upside is near the $115,000 level. The first key resistance is near the $115,500 level. The next resistance could be $115,750. A close above the $115,750 resistance might send the price further higher. In the stated case, the price could rise and test the $116,300 resistance. Any more gains might send the price toward the $117,500 level. The next barrier for the bulls could be $118,000.
Another Pullback In BTC?
If Bitcoin fails to rise above the $115,500 resistance zone, it could start a fresh decline. Immediate support is near the $114,000 level. The first major support is near the $113,500 level or the trend line.
The next support is now near the $111,000 zone. Any more losses might send the price toward the $110,500 support in the near term. The main support sits at $108,500, below which BTC might struggle to recover in the short term.
Technical indicators:
Hourly MACD – The MACD is now gaining pace in the bullish zone.
Hourly RSI (Relative Strength Index) – The RSI for BTC/USD is now above the 50 level.
Major Support Levels – $114,000, followed by $113,500.
The Bitcoin price is positioning for a potentially explosive move that could take it well beyond its previous all-time highs. Analysts are closely watching a critical resistance level near $116,000, which may serve as the final hurdle before BTC catapults into uncharted territory above $126,000.
Analyst Predicts New Bitcoin Price All-Time High
Crypto analyst Donny Dicey revealed in an X social media post this week that the $116,000 price level is the decisive zone Bitcoin must breach to confirm a breakout toward a new all-time high. His technical analysis suggests that once BTC achieves a clean break above this resistance area, momentum could swiftly carry it above $126,000.
Notably, Bitcoin set a new ATH on October 6, 2025, after breaking through its previous record above $124,000 and climbing past $126,000. Since achieving this level, the price of BTC has fallen dramatically to $115,000. Dicey’s accompanying chart shows the market steadily recovering after testing support near $108,000, marked as a “market structure break” region, with bullish price action consolidating above $109,000.
The analyst has emphasized that each day Bitcoin maintains a close above $109,000 strengthens the probability of a strong upward swing as the market heads into November. This period coincides with the Federal Open Market Committee’s (FOMC) next meeting, where investors are anticipating dovish signals such as rate cuts or the formal end of Quantitative Tightening (QT).
Dicey also notes that bullish S&P 500 earnings, easing global trade tensions from a potential agreement between US President Donald Trump and China’s President Xi Jinping, and improving ISM manufacturing data point to a macro environment supportive of risk assets. A community member commented that whales may have underestimated how much BTC’s demand tends to persist during these conditions. Dicey responded that the same whales might become “exit liquidity” as Bitcoin accelerates higher, possibly missing out on the strongest phase of this cycle.
Consolidation Above January Highs Signal Unbreakable Strength
In a follow-up analysis, Dicey highlighted Bitcoin’s remarkable stability above its January highs, describing its price structure as “unbreakable” amid global macroeconomic uncertainty. He pointed to several converging factors that reinforce BTC’s resilience, including ongoing fiscal and monetary expansion, a weakening US dollar, and renewed confidence in the global business cycle.
The analyst also emphasized that geopolitical tensions tied to US-China relations appear to be subsiding. At the same time, ETF inflows and exponential growth in the Artificial Intelligence (AI) sector contribute to acting as tailwinds for digital assets. He disclosed that despite strong underlying fundamentals, skepticism remains widespread in the market.
According to him, many still believe in the traditional four-year cycle narrative, while retail enthusiasm has not fully returned. Furthermore, the Russell 2000 index has yet to breakout, and rotation from traditional assets, such as the S&P 500 and gold, into Bitcoin remains limited. With these developments subduing broader market participation, Dicey suggests it creates the perfect setup for a powerful rally in BTC once sentiment shifts decisively.
American Bitcoin Corp. (Nasdaq: ABTC), a Trump family–backed mining platform, has expanded its Bitcoin holdings to 3,865 bitcoin, adding 1,414 bitcoin since September through a combination of mining production and secondary market purchases.
The Miami-based firm, which describes itself as “America’s Bitcoin infrastructure backbone,” said the latest accumulation includes coins held in custody and those pledged for miner purchases under its ongoing procurement deal with Bitmain.
The update continues a rapid expansion trajectory that began earlier this year when Hut 8 spun out its U.S. mining arm as a separate, publicly traded entity.
American Bitcoin initially held around 500 BTC at the time of the carve-out, then purchased another 1,726 BTC between July and August for approximately $205 million.
Those holdings were pledged to Bitmain as collateral for a $314 million order of 16,299 Antminer U3S21EXPH units — nearly the full 15 EH/s option under the companies’ strategic supply agreement. Most of those machines will be hosted at Hut 8’s new Vega site in Texas, a 400-megawatt facility central to American Bitcoin’s push toward 25 EH/s of proprietary hashrate.
“We believe one of the most important measures of success for a Bitcoin accumulation platform is how much Bitcoin backs each share,” said Eric Trump, co-founder and chief strategy officer. “As part of that conviction, we are focused on providing transparent updates as we aim to increase our holdings.”
JUST IN: Trump Family-backed BTC miner American Bitcoin acquires 1,414 Bitcoin.
Executive Chairman Asher Genoot added that American Bitcoin’s integrated mining model allows it to lower its average cost per Bitcoin compared with treasury-style vehicles that buy on the open market.
“That structural advantage allows us to compound Bitcoin value per share more efficiently for our investors,” he said.
Shares of ABTC have been volatile since their September debut, rising 11% on Friday to close at $5.62 after recovering from midweek lows below $5.
The company, valued around $5.1 billion, remains one of the most closely watched plays in the sector — both for its aggressive expansion plans and its deep ties to the Trump family.
At the time of writing, the stock is trading at $5.83 and Bitcoin is trading at $115,000 after a couple of tumultuous weeks.
Gryphon, American Bitcoin merger
Earlier this year, Gryphon Digital Mining merged with American Bitcoin Corp., the Trump family–backed subsidiary of Hut 8, to form what they claim could become the most efficient pure-play Bitcoin miner in the industry.
The all-stock merger saw Gryphon shareholders own about 2% of the combined entity and American Bitcoin stakeholders hold 98%.
The merger, now finalized, provides American Bitcoin with a faster route to public markets and combines Gryphon’s mining technology with American Bitcoin’s capital strength and large-scale reserve strategy.
Bitcoin’s price surged above $115,000 on Monday as Strategy, the largest corporate holder of Bitcoin, announced another significant purchase of Bitcoin. The business intelligence firm acquired 390 BTC between October 20 and October 26, spending approximately $43.4 million at an average price of $111,053 per Bitcoin.
According to a Form 8-K filing released today, Strategy’s total Bitcoin holdings have now reached 640,808 BTC, with an aggregate purchase price of $47.44 billion. The company’s average purchase price stands at $74,032 per Bitcoin, including fees and expenses.
The latest acquisition was funded through proceeds from Strategy’s At-The-Market (ATM) equity programs, specifically through the issuance of preferred shares under its STRF, STRK, and STRD ATM programs. The company raised a combined total of $43.4 million during the period to finance these purchases.
The announcement comes amid a growing trend of companies adopting Bitcoin treasury strategies. Recent data indicates that publicly traded companies now hold over $110 billion worth of Bitcoin, with Strategy alone accounting for approximately $74 billion of that total.
The emergence of Bitcoin treasury companies has accelerated notably in 2025, with Germany’s aifinyo AG recently announcing plans to accumulate 10,000 BTC by 2027. This follows similar moves by companies across Europe and Asia, signaling a broader institutional acceptance of Bitcoin as a treasury reserve asset.
The Bitcoin treasury model has moved from experimental to established corporate strategy. We’re seeing new companies enter this space almost weekly, recognizing Bitcoin as the ultimate treasury reserve asset.
Bitcoin’s price responded positively to Strategy’s announcement, trading above $115,000 as of press time. Bitcoin has shown strong momentum in recent days, supported by growing institutional adoption and the approaching 2026 halving.
Strategy’s stock (MSTR) has also shown positive movement, rising 3% in pre-market. Recent regulatory developments have further supported the Bitcoin treasury trend. Strategy recently received favorable guidance from the IRS and Treasury regarding the treatment of unrealized crypto gains in Corporate Alternative Minimum Tax (CAMT) calculations, eliminating concerns about potential tax liabilities for long-term Bitcoin holdings.
As more companies adopt Bitcoin treasury strategies and regulatory frameworks become clearer, the trend appears poised to continue. With Strategy leading the way and new entrants like aifinyo AG joining the space, corporate Bitcoin adoption is increasingly becoming a global phenomenon, spanning various industries and regions.
Over the years, a number of indicators have emerged that have often helped to pinpoint the Bitcoin bull market peak. These indicators have been triggered in previous cycles, and their triggers have often been a signal that it was time to get out of the market, as a new bear market is underway. However, this time around, even with the Bitcoin price hitting multiple new all-time highs, none of these cycle peak indicators have been triggered, suggesting that the market top has yet to be reached.
0 Out Of 30 Bull Market Peak Indicators Triggered
The Bull Market Peak Indicator tracker on the Coinglass website follows a total of 30 indicators that follow 30 indicators that show the progress of the Bitcoin bull market toward reaching a top. Some major ones include the Bitcoin Bubble Index, the Puell Multiple, the Bitcoin Rainbow Chart, and the Altcoin Season Index, among others.
Usually, these indicators are tracked on a scale of 0-100%, with 0% meaning that it is far from being triggered and 100% showing that an indicator has been triggered. If only a few of these get to the 100% mark and are triggered, it usually doesn’t mean that the Bitcoin peak has been reached.
However, even now, not one of these indicators has been triggered. Most continue to remain quite low, while the likes of the Bitcoin dominance are high, but still have not been triggered. For there to be a definite progress toward the Bitcoin market peak, at least half of these would have to be triggered.
What This Means For Investors
Since none of the bull market peak indicators have been triggered, it means that the Bitcoin price might actually be far away from its all-time high. With the score still being 0 out of 30, it points to this being a time to hold, despite the declines that the market has suffered recently.
According to a previous report from Bitcoinist, this was the case a few months ago, and now two months later, the tracker remains the same. Thus, it could be that $126,000 is not the all-time high for Bitcoin, and that the market could end up getting an altcoin season after all.
In the case that more than half of the bull market peak indicators do get triggered, then it means that the top of the market is getting close. Once it gets to 30/30, then it signals the start of the next bear market, and this is when selling is at its highest in the market, leading to rapid price declines across the board.
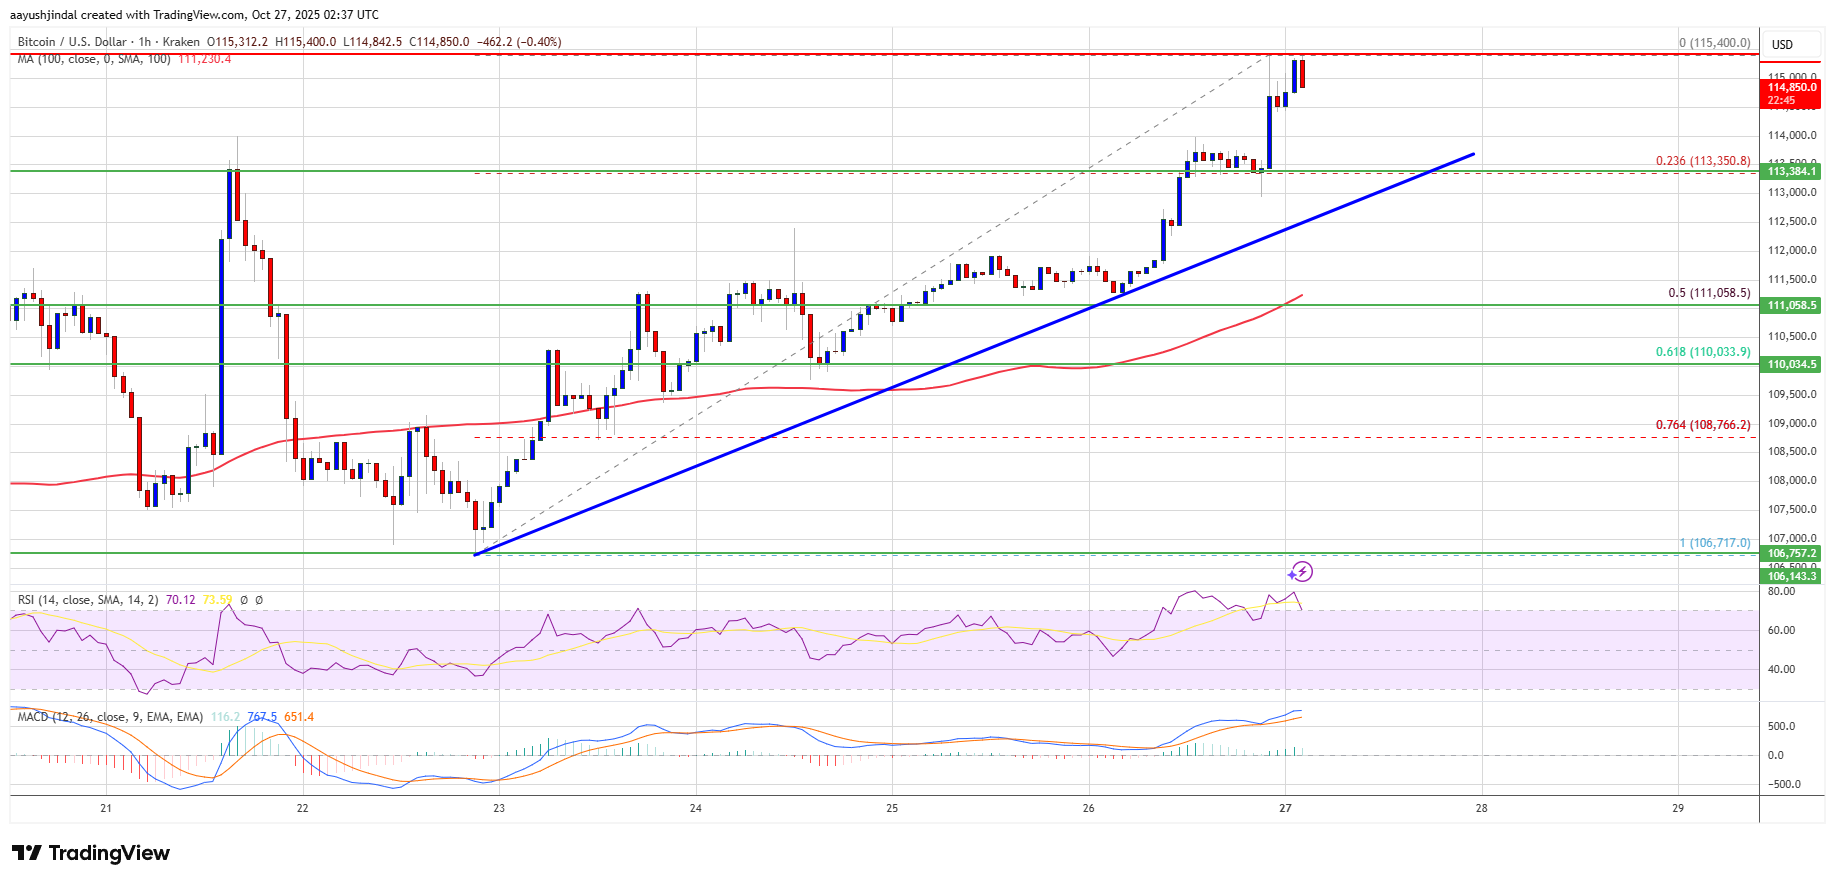
Bitcoin price is attempting to recover above $113,500. BTC could rise further if there is a clear move above the $115,500 resistance.
Bitcoin started a fresh recovery wave above the $113,500 resistance level.
The price is trading above $114,000 and the 100 hourly Simple moving average.
There is a bullish trend line forming with support at $113,350 on the hourly chart of the BTC/USD pair (data feed from Kraken).
The pair might continue to move up if it trades above the $115,500 zone.
Bitcoin Price Starts Fresh Increase
Bitcoin price declined again below the $108,000 level. BTC tested the $106,720 zone and recently started a fresh increase. There was a move above the $112,000 resistance level.
The bulls were able to pump the price above $113,500 and the 100 hourly Simple moving average. Finally, the price spiked above $115,000 and is currently consolidating gains above the 23.6% Fib retracement level of the recent wave from the $106,718 swing low to the $115,400 high.
Besides, there is a bullish trend line forming with support at $113,350 on the hourly chart of the BTC/USD pair. Bitcoin is now trading above $114,000 and the 100 hourly Simple moving average.
Immediate resistance on the upside is near the $115,250 level. The first key resistance is near the $115,500 level. The next resistance could be $116,200. A close above the $116,200 resistance might send the price further higher. In the stated case, the price could rise and test the $117,000 resistance. Any more gains might send the price toward the $118,000 level. The next barrier for the bulls could be $118,800.
Another Pullback In BTC?
If Bitcoin fails to rise above the $115,500 resistance zone, it could start a fresh decline. Immediate support is near the $114,000 level. The first major support is near the $113,500 level or the trend line.
The next support is now near the $111,000 zone. Any more losses might send the price toward the $110,500 support in the near term. The main support sits at $108,500, below which BTC might struggle to recover in the short term.
Technical indicators:
Hourly MACD – The MACD is now gaining pace in the bullish zone.
Hourly RSI (Relative Strength Index) – The RSI for BTC/USD is now above the 50 level.
Major Support Levels – $114,000, followed by $113,500.
The XRP/BTC monthly chart has finally snapped the long diagonal that’s capped XRP since 2018, and one analyst on X thinks that shift could rewrite the pecking order. Posting under the handle X Finance Bull (XFB), the analyst argued that XRP will soon start to outperform Bitcoin.
This is because the XRP/BTC pair has not only broken out but also retested the trendline as support, and this has certified the start of a new buildup of momentum.
Retest Of A Six-Year Breakout Trendline
The mid-October flash crash that rippled through the crypto market left a visible mark on the XRP/BTC chart, creating a deep downward wick that momentarily dipped below the long-standing resistance trendline. However, as Bitcoin started to recover to above $110,000, XRP struggled to keep up and lost ground relative to Bitcoin.
Interestingly, price action shows that this move was short-lived, and XRP has started to recover against Bitcoin in recent trading sessions. As shown on the monthly candlestick timeframe chart below, the wick fell to the exact level of the breakout retest, a point where former resistance turned into new support.
This breakout occurred in late 2024/early 2025, when XRP outperformed Bitcoin for three consecutive months. From there, the XRP/Bitcoin pair was able to break out of a downward-sloping resistance trendline of lower highs spanning over six years.
Since then, however, 2025 has been characterized by more months of Bitcoin outperforming XRP than months of XRP outperforming Bitcoin, with October falling into the former group of months. Particularly, during the flash crash, the XRP/BTC pair plunged to around 0.000007 before rebounding almost immediately, a move that, according to XFB, represents the long-awaited retest of the broken trendline.
Since that retest, XRP has recovered impressively, with the pair maintaining a monthly close above the diagonal that once acted as a ceiling. This technical confirmation signals the completion of the breakout from the 2018 to 2024 downtrend that had defined XRP’s multi-year underperformance against Bitcoin. The monthly structure is now displaying the early signs of an upward shift, with the pair trading around 0.00002258 BTC.
XRP To Decouple And Outperform Bitcoin?
According to the analyst, XRP is about to undergo a rally that massively outperforms Bitcoin and melts the face of many Bitcoin maximalists. XFB’s chart outlines two target zones ahead for XRP: 0.00014688 BTC and 0.00023009 BTC. The first target corresponds to the consolidation area seen between 2018 and 2019, while the second represents a major resistance cluster from the earlier phase of XRP’s creation. If XRP/BTC rallies to those levels, it would amount to approximately a 6x and 10x gain relative to Bitcoin, respectively.
The analyst also connects the technical setup to Ripple’s growing institutional ecosystem. He pointed to Ripple Prime, GTreasury, Metaco, Standard Custody, and Rail as part of the infrastructure that’s setting up XRP as a bridge asset for global finance. These partnerships give XRP an edge heading into the coming months, as it moves into real institutional utility and starts outperforming Bitcoin.
If these developments continue, the incoming decoupling of the XRP/BTC pair could become one of the most significant events for XRP. At the time of writing, XRP is trading at $3.63, up by 3.5% in the past 24 hours.
Featured image from Unsplash, chart from TradingView
CryptoWzrd, in his latest daily technical outlook, noted that Bitcoin managed to close in the green, but the candle remains indecisive, signaling that a clear reversal is yet to form. He added that more healthy bullish candles are needed to confirm a shift in momentum. For now, his attention is on the lower timeframes, where he plans to look for the next long opportunity once the current position is secured.
Indecisive Daily Close Reflects Market Uncertainty After CPI Data
Crypto analyst CryptoWzrd began his analysis by noting the ambiguity in recent price action, stating that the daily Bitcoin candle closed indecisively, although it was green. The primary focus of the past week was the traditional weekly candle close following the release of the US CPI data. Meanwhile, the weekly candle also closed without a clear direction, leaving the overall market structure ambiguous.
The analyst defined a clear condition for the rally to continue. BTC’s ability to push higher is entirely dependent upon holding above the $110,500 resistance level. Maintaining this key floor should generate enough positive momentum to boost the market further upside, targeting the major resistance at $120,000 and potentially higher if conviction remains strong.
However, if the price fails to hold $110,500, the market is at risk of declining further. In this scenario, the analyst targets the key technical support level located at $100,000 as the likely floor for the ensuing correction.
Regardless of whether Bitcoin executes a bullish or bearish move, the analyst issued a warning regarding the broader market. During the weekend, most altcoins will not forge their own paths but will instead simply mirror the outcome of Bitcoin’s price action.
The health of the altcoin market is directly linked to Bitcoin Dominance (BTCD), which the analyst observes as neutral on the daily chart. For altcoins to break free of Bitcoin’s gravitational pull and remain positive, the market requires more structural weakness in BTC.D.
On Choppy Price Action & Ongoing Uncertainty
CryptoWzrd concluded the analysis by noting that the intraday chart activity had been “somewhat choppy” throughout the day, suggesting a lack of clear directional momentum in the short term. Despite this recent consolidation, the underlying expectation remains bullish.
Looking ahead, the analyst predicts a further upside move towards the $115,300 resistance in the near future. At this stage, the market has performed its necessary moves, and the next step is simply to wait for the market to play out and confirm the push toward the pivotal $120,000 resistance target.
The US stock market has just achieved a historic milestone, closing at its highest weekly levels ever recorded. The S&P 500 finished the week at 6,791.68 while the US 100 Index reached 25,358.15, both setting new all-time highs.
Easing inflation data, strong corporate earnings, and expectations of Federal Reserve rate cuts have all combined to keep investor sentiment bullish. Amid this record-setting environment, crypto analyst Ash Crypto posted an observation on X that asks the question of how high Bitcoin would trade when it finally catches up to the US stock market.
US Stock Market’s Record-Breaking Momentum
The S&P 500’s record-breaking climb represents a continuation of the stock market’s steady ascent through the second half of the year, which has been boosted by the Fed rate cut in September, expectations of further rate cuts, and confidence in corporate performance.
The tech-heavy US 100 Index led the charge, climbing past 25,000 for the first time ever this week as large-cap technology stocks posted strong quarterly results. This trend means that the long-running bull trend in traditional markets is intact.
However, what is really compelling is the contrast between Wall Street’s all-time highs and Bitcoin’s relative stagnation. After starting October in a breakout move to new all-time highs above $126,000, the leading cryptocurrency went on a flash crash that took many traders by surprise. At the time of writing, Bitcoin is consolidating around $111,000 despite other asset classes showing strength.
Ash Crypto’s post argues that Bitcoin’s price is being artificially held back compared to how stocks have responded to the same macro backdrop. If Bitcoin had followed the percentage gains of the S&P 500 or US 100 Index, it could already be trading between $140,000 and $150,000.
When Bitcoin Finally Catches Up
The first surge of liquidity always appears in the stock market whenever the Fed begins to slow quantitative tightening (QT) or hints at loosening conditions. This is because the stock market is where the deepest capital pools and institutional participation exist. Equities react first because that’s where the credit channels are most established.
Bitcoin is still positioned outside the traditional financial system, and hence, tends to lag this initial move. But once the excess liquidity starts spilling into other assets, Bitcoin’s price has always increased at a much faster pace than stocks. According to Ash Crypto, Bitcoin will catch up soon and hit at least $130,000.
Notably, Bitcoin’s on-chain data is already showing signs of the impending surge. For instance, recent figures show that available sell-side liquidity (the total amount of Bitcoin sitting on exchanges ready to be sold) has dropped to just 3.12 million BTC, its lowest point in seven years. Furthermore, data shows that long-term investors have bought 373,700 BTC in the past 30 days.
At the time of writing, Bitcoin is trading at $111,600.
The Bitcoin price action has been somewhat impressive in 2025, as the flagship cryptocurrency ascended from around $93,300 in early January to its current all-time-high price of $126,000 this month. While the digital asset saw a couple of resets along the way, it continued to put in new highs, reflecting the magnitude of confidence held by its long-term investors.
However, the recent correction seen this October seems to be shaking that confidence, raising questions about the sustainability of Bitcoin’s bull cycle, and if the long-feared bear market is imminent. However, recent on-chain data points to an interestingly brighter outlook than what is currently being experienced by market participants.
Some Relevant BTC On-Chain Levels
In an October 24 post on the X platform, pseudonymous on-chain analyst Arch Physicist highlighted what could be encouraging news for Bitcoin market participants.
The crypto pundit’s analysis was based on the Value Coin-Days Destroyed (VCDD) to Spent Output Profit Ratio (SOPR) metric, which measures the amount of coins that are moved on the blockchain in relation to the potential profits based on their movements. Essentially, this metric is used to locate price zones that can serve as support or resistance.
Arch Physicist highlighted four important readings from the metric, thereafter explaining on the underlying functions of each of them.
The analyst noted:
‘Gamma + Epsilon’ is used to determine structural highs formed due to Long-Term Holder (LTH) profit-taking, with its current value being around $147,937; ‘Delta + Epsilon’ represents support formed by Short-Term Holder (STH) entry opportunities, currently valued at approximately $92,902. Epsilon, on its part, is used to represent potential price floors.
LTH Support Holds As Bitcoin Puts In Highs
Arch Physicist further explained that the metric’s functions are in tandem with Bitcoin’s historical price action. “Bitcoin’s price has broken above the structural high (Gamma + Epsilon) and reached ATHs near Beta during bull runs. It has also historically made ATLs very close to Epsilon,” the analyst said.
Interestingly, the Bitcoin price in this cycle has consistently traded within the support zones established by its LTHs, and the ones by its STHs. However, price seems to be heading towards the lower support zone, which, if breached, could signal the beginning of a bear market. On the other hand, the sustained integrity of the upper support could also be indicating that the bull run has not even started.
As of this writing, the price of BTC stands at approximately $11,890, with no significant movement in the past 24 hours.
Has the bitcoin price finally broken away from its four-year cycle pattern, or is this bull market already entering exhaustion? By studying historical growth rates, liquidity data, and macroeconomic correlations, we can better understand whether the current cycle has truly diverged, and what that means for investors in the months ahead.
Bitcoin Price Cycle Duration
Analyzing BTC Growth Since Cycle Lows, we can see that Bitcoin has now officially surpassed the elapsed time from cycle low to cycle high seen in previous bull markets. The 2018–2022 cycle peaked 1,059 days after its prior bear market low, and the current cycle has now moved beyond that duration. If we average the elapsed time across the last two full market cycles, Bitcoin has already exceeded the historical mean and is on the verge of surpassing even the 2017 cycle length in the coming days.
Figure 1: BTC Growth Since Cycle Lows illustrates that the duration of the current cycle is surpassing the previous two 4-year cycles.View Live Chart
Diminishing Impact on Bitcoin Price
Historically, Bitcoin’s four-year cycle was rooted in its halving events, where the block reward, and thus the inflation rate, was cut in half. Each halving triggered a sharp supply shock, driving major bull markets. However, this cycle has behaved differently. Following the most recent halving, Bitcoin experienced five months of sideways consolidation rather than the explosive post-halving rallies seen previously. While price has since made notable gains, momentum has been weaker, leading many to ask whether the halving has lost its influence.
Figure 2: Bitcoin’s Circulating Supply and the diminishing marginal inflation impact.View Live Chart
With the current Circulating Supply already exceeding 95% of the 21 million ultimate total supply of Bitcoin, the marginal supply reduction may no longer be as significant. Today, miners distribute roughly 450 newly created BTC per day, an amount easily absorbed by a handful of institutional buyers or ETFs. That means the halving alone may no longer be the dominant driver of Bitcoin’s market cycles.
Global Liquidity Cycles Driving the Bitcoin Price
When we view Global M2 Money Supply versus BTC on a year-on-year basis, a clear pattern emerges. Each major Bitcoin bottom has aligned almost perfectly with the trough of Global M2 liquidity growth.
Figure 3: Global M2 versus BTC (YoY) has historically aligned practically perfectly.View Live Chart
If we map the Bitcoin halvings and the M2 troughs side by side, we see that halvings typically lag the liquidity cycle, suggesting that liquidity expansion, not halving events, may be the true catalyst for Bitcoin’s rallies. This isn’t unique to Bitcoin. Gold has shown the same behavior for decades, with its price performance closely mirroring the rate of Global M2 expansion or contraction.
Inverse Correlations Shaping Bitcoin Price Trends
A key part of this liquidity story lies in the U.S. Dollar Strength Index (DXY). Historically, BTC versus DXY on a year-on-year basis has been almost perfectly inversely correlated. When the dollar strengthens year-on-year, Bitcoin tends to enter bear market conditions. When the dollar weakens, Bitcoin begins a new bull market. This inverse relationship also holds true for Gold and equity markets, underscoring the broader debasement cycle thesis that as fiat currencies lose purchasing power, hard assets rapidly appreciate.
Figure 4: BTC vs. DXY (YoY) and the strong inverse correlation with major market turns.View Live Chart
Currently, the DXY has been in a short-term uptrend, coinciding with Bitcoin’s recent consolidation. However, the index is now approaching a key historical resistance zone, one that has previously marked major turning points and preceded prolonged DXY declines. If this pattern holds, the next major drop in dollar strength could trigger a renewed upcycle for Bitcoin.
Quantitative Tightening and the Bitcoin Price
Comments from Federal Reserve Chair Jerome Powell recently hinted that the era of balance sheet contraction (quantitative tightening) may be nearing an end. Looking at the Fed Balance Sheet versus BTC, the start of balance sheet expansion and renewed quantitative easing has historically coincided with major upward moves in Bitcoin and equity markets alike.
Figure 5: Fed Balance Sheet inflection points historically align with Bitcoin bull cycle expansions.View Live Chart
During the two years following previous Fed balance sheet expansions, the S&P 500 averaged a 47% return, more than five times the average two-year performance during neutral periods. If we are indeed entering a new easing phase, it could not only prolong Bitcoin’s current cycle but also set the stage for a liquidity-driven melt-up across risk assets.
Conclusion: The Evolving Bitcoin Price Cycle
Bitcoin has now outlasted the timeframes of its previous two cycles, leading many to question whether the four-year rhythm still applies. But when we step back, a different narrative emerges, one driven not by programmed scarcity, but by Global liquidity, fiat debasement, and macro capital flow. The “four-year cycle” may not be broken, but it may have simply evolved.
If the U.S. Dollar weakens, the Fed pauses tightening, and Global M2 growth accelerates, then Bitcoin likely still has room to run. For now, as always, the best approach remains the same: react, don’t predict. Stay data-driven, stay patient, and keep your eyes on liquidity.
Disclaimer: This article is for informational purposes only and should not be considered financial advice. Always do your own research before making any investment decisions.
Cryptocurrencies including Bitcoin, Ethereum, BNB, Solana, and XRP traded higher and then pared gains.
Sentiment improved with the release of the US Consumer Price Index (CPI) report, but prices failed to rally.
Analysts say the CPI data makes a Federal Reserve rate cut on October 29 “highly probable”.
Major cryptocurrencies including Bitcoin, Ethereum, BNB, Solana, and XRP have maintained steady prices despite Wall Street’s robust reaction to a key economic data release.
As such, the cryptocurrency market was largely muted on Friday October 24, 2025, with an initial price spike following the release of the US Consumer Price Index (CPI) report failing to flip into notable gains.
While several coins traded in the green, the subdued action meant the global crypto market capitalization, per CoinGecko, remained at $3.81 trillion.
Sentiment was still largely negative as the Fear & Greed index hovered at 32 and was in fear territory.
Meanwhile, global daily trading volume slipped to $153 billion.
Bitcoin, Ethereum prices as investors react to CPI data
The Bureau of Labor Statistics released the US CPI inflation report for September on Friday.
Data showed inflation was cooler than expected, with headline CPI at 0.3% and core inflation at 0.2%.
Meanwhile, both year-over-year measures for headline and core came in at 3%.
Economist Mohamed El-Erian commented on what the data says:
“This report makes a Federal Reserve rate cut next week highly probable. What happens beyond that, however, will depend on subsequent data, primarily confirmation of a softening labor market and continued disinflation.”
Stocks however, soared amid the report and a host of other bullish factors.
Bitcoin traded to highs of $111,842 before quickly retreating to $110,500.
Ethereum on the other hand, rose slightly to near $4,000 before revisiting $3,870 and settling just above $3,900.
Despite the cooling inflation data, analysts see a 99% likelihood of a Federal Reserve rate cut on October 29.
This will feed into risk asset appeal and both BTC and ETH could rally past key supply walls around $115k and $4,250.
BNB steady after Changpeng Zhao pardon
BNB, the native token of Binance, has maintained its price at $1,106, with negligible movement post-CPI.
The token is benefiting from Binance’s dominance in spot trading, and the news of President Donald Trump’s pardon of founder Changpeng Zhao buoyed the broader market.
Congratulations to my friend @cz_binance. Trump has corrected a grave injustice. The weaponization of the justice department against our industry and its entrepreneurs should have never happened. It was and still is a deep wound that will take a long time to heal https://t.co/OirXN3fSZC