Bitcoin priceis once again testing the patience of traders, moving within one of the tightest percentile price ranges in its history. For more than four months, BTC has traded between roughly $106,000 and $123,000. This period of quiet has pushed volatility to its lowest level ever recorded on six-month metrics. Each time in the past that volatility has fallen to similar depths, it has been followed by a major trending move.
Bitcoin Price Volatility Compression
The current lull stands out even compared to previous phases of consolidation in this cycle. Despite occasional liquidations and sharp wicks, the broader price structure has barely shifted since June. One of the most telling metrics is the weekly Bollinger Band Width — the indicator has now reached its lowest weekly reading ever. In every past instance that Bitcoin’s bands have squeezed to this degree, bitcoin price volatility expansion followed shortly after.
When Bitcoin Price Volatility Returns
Periods of ultra-low volatility have never lasted long. In this cycle alone, there have already been five examples where similar consolidations ended with significant moves exceeding 65% gains within 100 days. Averaging those historical fractals to today’s setup would imply a potential bitcoin price target between $170,000 and $180,000 by 2026 if the next expansion phase mirrors prior behavior.
However, bitcoin price volatility compression does not guarantee immediate upside. Previous examples have shown that these low-volatility periods can extend for several months before a breakout occurs. Bitcoin could continue to trade sideways through late Q1 2026, oscillating within the current range before direction is decided.
Macro Catalysts for Bitcoin Price Volatility
Several macro factors could serve as a catalyst for renewed bitcoin price volatility. The Federal Reserve is expected to announce another rate cut, which markets currently price at near-certainty. Gold’s recent reversal after setting new highs also hints at potential capital rotation. If even a small fraction of that capital migrates toward Bitcoin amid falling rates and renewed risk appetite, the effect could amplify any breakout once volatility expands.
Conclusion: The Next Big Bitcoin Price Move
Volatility naturally declines as Bitcoin matures from a multi-billion to a multi-trillion-dollar asset, but the cyclical nature of expansion and contraction remains. The current compression phase has lasted unusually long, and historically such conditions have preceded powerful multi-month trends.
The final months of 2025 and early 2026 may test this pattern once again. With bitcoin price volatility metrics at record lows, macro conditions turning supportive, and market sentiment subdued, Bitcoin appears poised on the edge of its next major move.
Disclaimer: This article is for informational purposes only and should not be considered financial advice. Always do your own research before making any investment decisions.
A widely shared seasonality snapshot is making the rounds ahead of month-end: a Coinglass heat map of Bitcoin’s monthly returns, reposted by trader Daan Crypto Trades. The table spans 2013–2025 and shows November as the statistical outlier in Bitcoin’s calendar—both for eye-popping gains and for sharp drawdowns in certain years.
Bitcoin November Preview
“November is Bitcoin’s best month based on historical performance. By far,” Daan wrote on X, pointing to an average November change of +46.02% across the dataset. That figure is visibly distorted by November 2013’s +449.35% surge, the single largest monthly move on the board. He added: “The average gain over all these months is +46.02%. But this is heavily skewed by a single monthly gain in November 2013. Bitcoin went up +449.35%!! that month.”
The raw counts back up the reputation without the hyperbole. Out of the 12 Novembers listed (2013–2024), 8 finished green—2013 (+449.35%), 2014 (+12.82%), 2015 (+19.27%), 2016 (+5.42%), 2017 (+53.48%), 2020 (+42.95%), 2023 (+8.81%), and 2024 (+37.29%)—while 4 were negative—2018 (-36.57%), 2019 (-17.27%), 2021 (-7.11%), and 2022 (-16.23%).
The median November change sits at +10.82%, a more conservative central tendency that dampens the 2013 effect. Excluding 2013 entirely, the simple average for November drops to roughly +9.35% across the remaining 11 years, underscoring how one month can skew mean-based seasonality.
Context from the broader table matters. November’s average is the highest of any month on Coinglass’s grid, ahead of October’s +20.30% average, while December shows a far more mixed profile with a +4.75% average but a -3.22% median—an imbalance consistent with outlier-driven months.
September, long maligned by traders, retains a negative average (-3.08%) over the full period. The 2024 row itself captures the push-and-pull of this cycle’s narrative: double-digit gains in February, March, May, October, and November, offset by meaningful drawdowns in April, June, and August, and a negative December print to close the year (-2.85%).
Lessons From Prior Cycles
Daan’s framing extends beyond simple seasonality. “November & December is when the 2013, 2017 & 2021 cycles topped out. It’s also where the 2018 & 2022 cycles bottomed out,” he noted. That observation lines up with the historical inflection points most market participants remember: the late-2013 mania and subsequent crash, the December 2017 peak, the November 2021 all-time high, and the December 2018 and November 2022 washouts.
The Coinglass grid cannot timestamp intramonth highs or lows, but the clustering of major pivots into the final two months of the year is consistent with the market’s folklore and with the returns pattern that shows both exceptionally strong up months and some of the cycle’s most punishing down months in this window.
The practical takeaway—again in Daan’s words—is not categorical bullishness, but regime risk: “All in all, an eventful last 2 months of the year generally speaking. Whether it’s on the bullish or bearish side, volatility and big market pivots have been the theme into the end of the year.” The heat map supports that characterization.
November’s distribution spans the widest extremes on record—from +449.35% at the top to -36.57% on the downside—with a two-thirds hit rate for green months and a median gain in the low double digits. December, by contrast, has produced both cycle tops and cycle bottoms despite a modest average, a reminder that average and median statistics can obscure the path risk that defines Bitcoin’s fourth quarter.
Seasonality is not destiny, and the sample is limited. Still, the data-backed message is clear: as November approaches, Bitcoin’s historical pattern has been less about quiet trend continuation and more about variance—the kind that has marked both euphoric blow-offs and capitulation lows.
Crypto analyst CasiTrades has predicted that the XRP price could still crash to $1.4 in the final wave of this downtrend. This comes despite bullish catalysts such as the Fed rate cut, which could lift the altcoin to new highs.
Analyst Predicts XRP Price Crash To $1.4
In an X post, CasiTrades stated that exchanges are aligning toward their .618 retracements, with Binance showing a crash to between $1.35 and $1.46 for the XRP price. She noted that this next wave down would complete the macro Wave 2 correction, setting the stage for the next Wave 3 impulse that could send XRP toward $6.50 or $10.
This came as the analyst remarked that the XRP price was at a major decision point, with the price continuing to test the Wave 4 highs. She noted that this resistance is making another wave down a possibility. To invalidate the move down, CasiTrades stated that XRP needs to break and hold above $2.82 on Binance.
However, so far, the XRP price hasn’t done so, with CasiTrades noting that the price is still ranging between support and resistance. She explained that this leans toward this being a Wave 4, with the altcoin one final move lower before the next macro impulse. The analyst ruled out a V-shaped recovery, noting that price typically breaks through resistance immediately and decisively, which is not happening with the current price action.
She further remarked that the hesitation suggests that selling pressure isn’t fully exhausted for the XRP price. However, CasiTrades assured that the deeper support levels aren’t a reason to panic, as they are high conviction accumulation zones. Meanwhile, the analyst highlighted a discrepancy in the price action on different exchanges.
She noted that the XRP price on Binance wicked to $0.77 during the $19 billion liquidation event, while on Coinbase, XRP never reached its .618 retracement level. CasiTrades then reiterated that until $2.82 breaks, the price action favors one final wave down before the next major move up.
XRP’s Bull Run Isn’t Over
Crypto analyst Egrag Crypto has assured that the bull run isn’t over for the XRP price, despite predictions that the top may be in. He stated that as long as XRP holds above $2.20 and $1.97 as monthly closes, then there is no structural break. He also believes that the altcoin and other risk assets are about to “roar.”
Egrag Crypto noted that quantitative tightening is still active and that Fed rate cuts are just beginning. In line with this, he declared that the last leg up is still waiting to play out. He claimed that cycles don’t end when 50% of traders are cautious, but do when everyone is “drunk on euphoria.”
At the time of writing, the XRP price is trading at around $2.6, down in the last 24 hours, according to data from CoinMarketCap.
XRP closed October with a mixed tape, yet the setup for November looks constructive. A repeatable price pattern, a genuine supply squeeze on exchanges, and a new institutional treasury building a billion dollar position all point to one thing: higher probability of topside tests.
A recent analysis mapped a close above 2.77 as the trigger that can open Fibonacci targets in the 2.75 to 3.00 area, with stretch room if momentum accelerates.
XRP price November outlook: upside paths, downside traps
For search clarity and reader intent, the XRP price November discussion starts with levels. The first inflection is 2.77 on a daily close. Hold above that pivot and the classic 0.5 to 0.618 retracement zone lines up around 2.75 to 3.00, where sellers usually test the bid.
If liquidity thins and momentum runs hot, prior impulses have reached into the low 3s, which keeps 3.20 to 3.40 alive as a secondary path. The baseline case is more modest, but still positive, because the structure respects higher lows and a tightening range into that 2.77 gate.
The XRP price November story is not only technical. On chain flows set the tone. Data aggregators tracked one of the largest two day exchange outflow events on record around Oct. 19 to Oct. 20, with more than 2.6 billion XRP leaving centralized venues. Heavy withdrawals reduce near term sell supply and often precede relief rallies when bids reappear. The signal is not perfect, but combined with price holding support, it tilts odds toward upside follow-through.
XRP price November
A billion-dollar buyer changes the conversation
New corporate demand shapes the XRP price November narrative as well. A Ripple-affiliated venture called Evernorth plans to become the largest publicly traded XRP treasury via a listing that aims to raise more than 1 billion dollars for accumulation.
The rationale is simple to understand and hard to ignore. A permanent buyer with a mandate to add on weakness can smooth drawdowns and intensify rallies. Reuters reported that the deal is expected to close in the first quarter of 2026, with strategic backers across crypto finance.
The team has been vocal in public.
“I am proud to share that we have launched Evernorth, a first of its kind institutional vehicle built to accelerate XRP adoption,” said CEO Asheesh Birla in a post on X, linking to the treasury’s introduction video. In a later update he added, “We are combining institutional discipline with on chain innovation to grow XRP per share and redefine what a digital asset treasury can be.”
Both messages underline a long horizon and an intent to keep accumulating.
XRP price November: Source, X
Crypto market strategists have weighed in on flows across assets. “Inflows into altcoins seem to be confined to SOL and XRP at present,” wrote a leading European research head in a public thread, echoing a broader rotation into higher liquidity names while smaller tokens lag. Stronger breadth in these flows would further support the XRP price November case, but concentration in the leaders often comes first.
What the indicators actually say
Good price calls do not rely on one data point. The XRP price November framework tracks several inputs. Exchange reserves trended lower into late October, consistent with those outflows. If reserves keep falling while open interest rises at a measured pace, price can pop on relatively small buy programs. If open interest spikes too quickly, unwinds can wash out gains.
Funding remains the real-time compass. Modest positive funding with rising spot volume is healthy. Aggressive positive funding without spot confirmation often precedes a shakeout. For short-term traders, derivative heat maps show a pocket of resting short-side liquidity just below the first resistance cluster, which can create a fast move if price rips through overhead levels.
Macro still matters. Digital asset products drew hefty weekly inflows in late October, a sign that investors continue to add exposure even after sharp swings. A sustained bid across the complex would support the XRP price November roadmap, especially if the pace of inflows persists as policy clarity improves. If flows stall, risk assets can slip back into chop.
XRP price November
Scenario planning for editors and investors
Map three paths. In the base case, the XRP price November move respects the 2.77 trigger, grinds into 2.90 to 3.00, and consolidates while funding stays contained. In the bullish case, spot demand from treasuries and advisors aligns with falling exchange supply, extending the push toward 3.20 and possibly 3.40 if breadth improves.
In the risk case, a failed breakout below 2.77 meets a burst of positive funding and crowded longs, knocking price back toward the mid 2s. None of these paths require perfection. They require discipline about levels and respect for the data in front of the market.
Public voices will continue to influence tone. One high-profile trader on X said, “New all-time highs in November,” summarizing the current optimism in a single line. Whether that proves prescient or just enthusiastic color matters less than the sequence of daily closes and the behavior of flows. Long term holders look at the broader adoption arc and the entry of corporate treasuries. Short-term traders watch the gate at 2.77. Either way, the XRP price November discussion is now in the driver’s seat.
Conclusion
The market likes simple stories. The XRP price November story blends a familiar breakout pattern with tangible supply dynamics and a new corporate accumulator. It will not be a straight climb. It rarely is. But if price clears 2.77 and the outflows persist while institutional demand scales, higher prints are reasonable. If those conditions fade, the trade becomes range bound again. Clarity lives in the data. The next daily closes will tell the tale.
Frequently Asked Questions
What is the key level to confirm momentum in November? Analysts watch a daily close above 2.77 to validate upside targets in the 2.75 to 3.00 band derived from the 0.5 to 0.618 retracement.
Why do exchange outflows matter for price? Large withdrawals reduce immediate sell supply. The Oct. 19 to Oct. 20 window saw more than 2.6 billion XRP leave exchanges, which historically improves the odds of relief rallies.
How does Evernorth influence market structure? A dedicated treasury with a mandate to accumulate creates steady bid support. The initiative targets more than 1 billion dollars for XRP purchases as it prepares a public listing.
Are fund flows supportive into November? Yes, late October showed sizeable inflows into digital asset products, which helps overall risk appetite if sustained.
Glossary of key terms
Exchange reserve depletion A trend where coins move from exchanges to self custody or treasuries, shrinking near term sell pressure and often tightening available liquidity for spot buyers.
Fibonacci retracement zone A technical range, commonly the 0.5 to 0.618 band of a prior move, used to estimate probable resistance and profit taking zones after a rebound. In this case it aligns with 2.75 to 3.00.
Institutional crypto treasury A publicly traded or regulated vehicle that accumulates a specific digital asset as a balance sheet holding, potentially buying on weakness and influencing market microstructure over time.
Derivative liquidation pocket A cluster on heat maps where forced buy or sell orders may trigger if price touches certain levels, often accelerating moves and creating slippage in thin conditions.
Cantonese Cat used his October 28 video to zero in on the Dogecoin market structure, arguing that the meme-coin is nearing the end of a multi-year accumulation phase—and that the recent washout was a feature, not a bug, of that process. While he declined to publish numeric price targets in the video, he made the case that DOGE’s setup is maturing in lockstep with broader “risk-on” signals, with a familiar lag to Ethereum that historically precedes Dogecoin’s larger moves.
When Will Dogecoin Rally Again?
On structure, he was explicit. “Just looking at Doge here, you can see how […] Doge has been forming a cup over here for close to four and a half, five years now […] it’s just been building a big giant base.” In his read, the rounded bottom is the defining pattern of this cycle for DOGE, and it remains intact despite recent volatility.
He framed the sharp drawdown two weeks ago as necessary positioning rather than a break in trend: “You just had a great deleveraging event […] I’m not going to look at a lower low and think the trend is broken […] These are very healthy deleveraging before the next move up as far as I’m concerned.” He highlighted “a big giant wick” and “a lot of demand down below,” pointing to what he sees as resilient spot support through the base.
Timing, not targets, was the centerpiece. He reiterated that Dogecoin typically follows Ethereum with a delay once ETH clears its own major resistance bands. “Whenever we get closer to the end of the rounded bottom […] that’s when Ethereum breaks out above the resistance zone and goes up a lot higher. Thus, Doge runs together with Ethereum,” he said, adding: “There is a lag. I would say the lag is probably maybe a couple months between Ethereum breaking up and Doge finally breaking above this rounded bottom here and going up.”
He made a similar observation using risk proxies, noting that DOGE moves have historically trailed small-cap-led risk cycles by several months, though he cautioned that the exact interval can vary. Via X, he added “DOGE lags behind IWM [iShares Russell 2000 ETF] all-time-high breakout by about 2 to 4 months before it takes off.”
Cantonese Cat also pushed back on the view that a sequence of lower lows automatically invalidates the DOGE setup, arguing that this occurred in prior cycles just before outsized rallies. “A lot of people look at this, ‘that’s a lower low […] the cycle is over.’ Well, it doesn’t work that way. That’s a lower low right there. Next thing you know, it just went a lot higher,” he said, tying the observation to the current “healthy deleveraging” and the persistence of the rounded-bottom structure.
If the video offered the structural blueprint, his same-day post on X clarified his stance on headline targets. “I realize that it’s stupid to call for DOGE to $2 or $4 when price is at 20 cents. If I was smart like others, I should just call for DOGE to $2 or $4 when it’s $2 or $4.” The comment is consistent with his prior price predictions.
Inside the video update, the analyst instead emphasized the sequence he expects to matter—ETH strength first, DOGE follow-through second, with the magnitude determined by how far the broader risk cycle runs once momentum rotates.
The next Federal Open Market Committee (FOMC) meeting is fast approaching, and the bets are already pouring in as to what it would mean for the Bitcoin and crypto industry. The last FOMC meeting took place in September, when the Federal Reserve ended up cutting rates down to 4-4.25% after months of no rate cuts. With this setting the tone, the expectations that another rate cut could be on the way are getting louder, with the FedWatch Tool showing a high percentage.
Market Expects Another Rate Cut To 3.75-4%
The next FOMC meeting is scheduled for Wednesday, October 29, 2025, and there is already a major clamor around what the Fed is planning on doing. The current market headwinds point to a favorable outcome for risk assets such as Bitcoin and other cryptocurrencies, with expected rate cuts.
Currently, the CME FedWatch Tool is showing that the probability of a rate cut has risen to 98.3% as of the time of this writing. This leaves only a 1.7% chance that the Federal Reserve will actually leave rates at their current levels, and there is zero chance that there will be a rate hike.
A reduction in the rate cuts is good for businesses all around, as lower interest rates mean better loan terms and increased spending and borrowing. Thus, it will increase the participation in the markets, from consumer goods to the stock market, and then make its way into newer markets such as Bitcoin and crypto.
Expectations For Bitcoin And Crypto Are Getting Higher
A rate cut by the Federal Reserve aligns with the more pro-crypto stance that the United States has been moving in since President Donald Trump was elected. Last week, the president pardoned the Founder and former CEO of the Binance crypto exchange, Changpeng Zhao, after he previously pled guilty to money laundering violations back in 2024. Zhao has since served a 4-month stint before the pardon from Trump came.
With the US embracing Bitcoin and crypto again, a rate cut will only further the ascent, allowing more investors to get into the market as liquidity frees up. The initial announcement has been known to trigger a rapid increase in the market. But as the news settles, the crypto market is expected to continue to rise in response.
However, nothing is certain until the FOMC meeting is complete and the announcement is made. For the Bitcoin and crypto market to remain bullish, inflation will also have to be reduced, as an increase could trigger more conservative stances from investors.
Solana ETFs’ launch has boosted institutional interest and market optimism.
Bulls target $230 as SOL holds strong above the key $200 support zone.
Technical analysis shows rising momentum with resistance near $216–$227.
The long-awaited Solana ETFs have finally been approved, sparking renewed optimism across the crypto market.
The ETFs’ approval has reignited bullish momentum, with analysts believing that the Solana price could soon rally toward $230 and beyond.
Solana ETFs debut fuels optimism
Bitwise and Canary Capital have confirmed that their individual Solana ETFs officially begin trading on October 28 after weeks of regulatory uncertainty.
Bitwise’s product, launched under the ticker BSOL, serves as a gateway for institutional exposure to Solana, featuring staking powered by Helius Labs and a temporary management fee waiver.
– First U.S. ETP to have 100% direct exposure to spot SOL – Maximizing Solana’s 7%+ average staking reward rate* – Targeting 100% of assets staked – Staking through Bitwise Onchain Solutions, powered by… pic.twitter.com/Vo8Ko0qOCn
Grayscale has also moved swiftly, converting its Solana Trust (GSOL) into an ETF holding over $105 million worth of SOL.
Meanwhile, VanEck has also filed its sixth S-1/A amendment, with its Solana ETF status officially changed to “effective” and a 0.3% management fee established.
Adding to the growing momentum, Hong Kong’s first Solana ETF also began trading on Monday, marking Asia’s initial entry into the Solana ETF landscape.
Despite this wave of institutional activity, retail demand for Solana remains subdued.
Futures open interest sits near $9.75 billion — up slightly from the previous day but still below the $10 billion mark — indicating that traders are cautious amid market volatility.
Even so, analysts believe the ETF launches signal a critical turning point for Solana, reinforcing its legitimacy as an institutional-grade digital asset and providing the foundation for its steady hold above $200.
Bulls take charge as momentum builds
While retail demand for Solana remains unresponsive, the Solana price has been climbing steadily from $190 to $205, with short positions fading quickly.
Analysts note that bearish volume profiles are weakening while liquidity accumulates at higher price levels.
This shift has tilted momentum firmly in favour of buyers, with several technical indicators confirming the strength of the ongoing rally.
On the 4-hour chart, Solana trades above both its 50-day and 200-day moving averages, reinforcing the bullish setup.
The Ichimoku Cloud analysis shows a clear breakout, with price holding above key support between $197 and $201 — a signal that often precedes extended upward moves.
The Relative Strength Index (RSI) also hovers near 62, leaving room for additional gains before overbought conditions emerge.
Analysts now eye resistance zones between $204 and $208, followed by key hurdles at $216, $227, and $230.
Notably, a confirmed close above $205 could trigger a sustained rally toward these upper levels.
If momentum continues, higher targets around $237 and $253 come into view, aligning with Fibonacci retracement levels that mark previous swing highs.
Technical patterns hint at a repeat of 2023
Market observers have compared the current structure of Solana’s price chart to its 2023 breakout phase.
Analysts such as GalaxyBTC point to an ascending triangle pattern forming on the weekly chart, defined by a series of higher lows that indicate strong accumulation.
The critical support at $188 remains intact, representing the network’s largest volume cluster where many long-term holders entered the market.
A successful breakout above $200 would confirm the pattern and potentially lead to a test of $215 and $225, echoing the bullish behaviour seen two years ago.
The broader macro picture also appears supportive.
Some traders suggest that if the US Federal Reserve signals an end to quantitative tightening, it could inject much-needed liquidity into the market — providing another tailwind for Solana’s next leg higher.
Long-term outlook stays bullish
Even as short-term traders monitor resistance near $230, long-term analysts remain optimistic about Solana’s broader trajectory.
The asset has maintained a pattern of higher lows since early 2023, and its market structure mirrors the accumulation phase that preceded its previous bull run.
Projections place potential mid- to long-term targets around $300, $390, and even $520 if momentum and institutional demand persist.
In the near term, maintaining support between $198 and $200 is crucial.
If buyers continue to defend this zone, the Solana price could strengthen further, confirming its leadership among major altcoins.
As the first wave of Solana ETFs begins trading, the market’s sentiment has clearly shifted — bears are losing ground, and bulls now have their eyes fixed firmly on the $230 milestone.
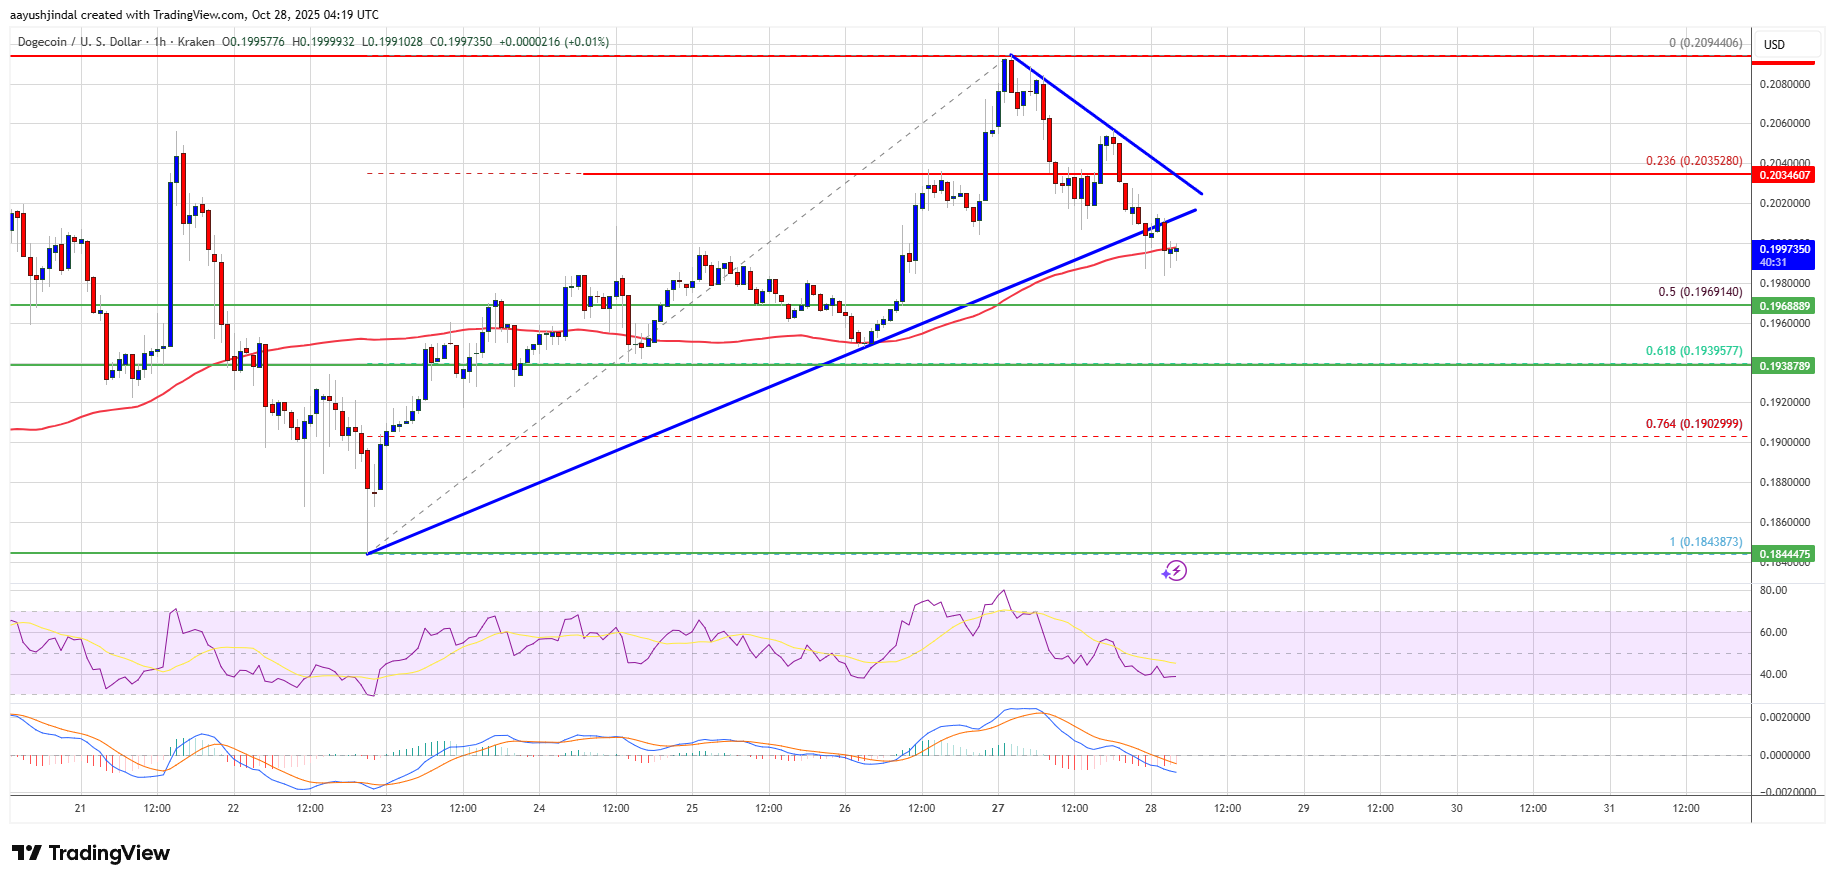
Dogecoin struggled to rise above $0.210 and corrected some gains against the US Dollar. DOGE is now consolidating and might decline below $0.1980.
DOGE price started a fresh downside correction below $0.2035.
The price is trading below the $0.20 level and the 100-hourly simple moving average.
There was a break below a contracting triangle with support at $0.20 on the hourly chart of the DOGE/USD pair (data source from Kraken).
The price could aim for a fresh increase if it remains stable above $0.1940.
Dogecoin Price Starts Another Pullback
Dogecoin price started a fresh increase after it settled above $0.1920, like Bitcoin and Ethereum. DOGE climbed above the $0.20 resistance to enter a positive zone.
The bulls were able to push the price above $0.2020 and $0.2050. A high was formed at $0.2094 and the price is now correcting gains. There was a move below the 23.6% Fib retracement level of the upward move from the $0.1843 swing low to the $0.2094 high.
Besides, there was a break below a contracting triangle with support at $0.20 on the hourly chart of the DOGE/USD pair. Dogecoin price is now trading below the $0.20 level and the 100-hourly simple moving average.
If there is another increase, immediate resistance on the upside is near the $0.2020 level. The first major resistance for the bulls could be near the $0.2050 level. The next major resistance is near the $0.210 level. A close above the $0.210 resistance might send the price toward $0.2150. Any more gains might send the price toward $0.2250. The next major stop for the bulls might be $0.2320.
More Losses In DOGE?
If DOGE’s price fails to climb above the $0.2020 level, it could start a downside correction. Initial support on the downside is near the $0.1970 level and the 50% Fib retracement level of the upward move from the $0.1843 swing low to the $0.2094 high. The next major support is near the $0.1935 level.
The main support sits at $0.190. If there is a downside break below the $0.190 support, the price could decline further. In the stated case, the price might slide toward the $0.1840 level or even $0.1780 in the near term.
Technical Indicators
Hourly MACD – The MACD for DOGE/USD is now gaining momentum in the bearish zone.
Hourly RSI (Relative Strength Index) – The RSI for DOGE/USD is now below the 50 level.
Bitcoin price surged to $115,000 on Monday, rising more than 1% in 24 hours, as optimism over easing U.S.–China trade tensions and renewed investor appetite for risk assets lifted global markets.
According to Geoffrey Kendrick, Head of Digital Asset Research at Standard Chartered Bank, Bitcoin price may “never fall below $100,000 again” if this week’s macro tailwinds continue.
In a note to clients, Kendrick said that improving trade relations between Washington and Beijing have flipped last week’s market fear into “hope.”
U.S. Treasury Secretary Scott Bessent’s weekend statement that restrictions on China’s rare earth exports could be postponed for a year, combined with reports that Beijing plans to buy large quantities of U.S. soybeans, sparked a relief rally across equities, commodities, and crypto.
China, U.S trade deals and FOMC rate cuts
The agreement, expected to be finalized after the upcoming Trump–Xi summit in South Korea, has renewed risk appetite and pushed the bitcoin-to-gold ratio back above pre-October 10 levels — the date when 100% tariff threats sent markets tumbling.
Kendrick pointed to fresh inflows into spot bitcoin ETFs as another key signal of strength. Over $2 billion exited U.S. gold ETFs late last week, and if even half of that re-enters bitcoin funds, he said, it would mark a major vote of confidence.
The analyst also highlighted macro tailwinds, including expectations for a 25-basis-point rate cut at Wednesday’s Federal Open Market Committee (FOMC) meeting — a move widely seen as bullish for bitcoin.
Meanwhile, investors are watching a packed earnings calendar from both tech and crypto heavyweights. Microsoft, Meta, and Google are set to report on Wednesday, followed by Apple, Amazon, Coinbase, and Strategy (formerly MicroStrategy) later in the week.
“If this week goes well — bitcoin may never fall below $100,000 again,” Kendrick said.
Bitcoin price outlook
While bulls have made modest progress with Bitcoin, stronger resistance remains overhead at $117,600 and $122,000, leaving bears largely in control.
If Bitcoin manages to surpass $122,000, professionals note the next target could be the upper boundary of a broadening wedge pattern at $128,000.
Support levels remain critical for maintaining bullish momentum. The key short-term support at $106,900 held throughout last week, helping stabilize the market.
Falling below this level could open the path toward the $105,000–$102,000 support zone, which has already been tested twice, with a third test raising the likelihood of a breakdown.
Beyond that, $96,000 represents a crucial long-term support level for the broader bull market, acting as a do-or-die floor if prices decline further.
As of press time, bitcoin was trading at $115,041, up 1.22% over the past 24 hours.
The Cardano weekly chart is still looking strongly bullish according to independent technician Charting Guy (@ChartingGuy on X) who resurfaced his long-running Fibonacci roadmap and channel study.
Can Cardano Top $6 This Cycle?
His latest post on X on October 26 noted that “ADA is fine as long as uptrend holds,” a view that is anchored in a multi-year rising channel that has contained price action since the 2018–2019 base. The channel features a lower rail now passing through roughly the $0.33–$0.35 area, a midline that has behaved as a recurring pivot since 2020, and overhead parallels that intersect with Fibonacci extension targets later in the cycle.
The chart history mapped on his visuals is orderly. The 2021–2022 bear trend, drawn as a steep descending line from the prior peak, ended into the channel’s lower support and resolved through a series of falling trendline breakouts during 2023 and early 2024. Since Q4 2023, the chart has shown a series of higher highs and higher lows. Currently, the ADA price is again guided by a falling trendline.
Everything in the layout revolves around the Fibonacci ladder. The retracement set on the right margin—derived from the 2021 peak to the cycle low—marks 0% at $0.23488, then $0.33360 (0.136), $0.43180 (0.236), $0.62932 (0.382), a mid-range 0.5 at $0.85, $1.15694 (0.618), $1.43911 (0.702), $1.78464 (0.786), $2.32189 (0.888), and $3.09981 (1.000). Above that stack, the cycle extensions are plotted at $6.25325 (1.272), $9.00941 (1.414) and $15.26831 (1.618).
Those numbers are consistent with how the analyst framed the market earlier in the year. On April 27 he wrote that “ADA fibs are very important here. The 0.618 is a STRONG resistance… the 0.382 MUST hold… neutral until one of these breaks on a weekly close.” That roadmap has aged intact.
Rallies through spring and summer repeatedly stalled in the 0.500–0.618 zone, with the 0.618 level at $1.15694 capping advances. Pullbacks, in turn, have found bids near the 0.382 pivot at $0.62932.
On September 18, after that rejection, he updated that “ADA higher low … higher high pending… still targeting 1.272 fib this cycle,” tying the price structure back to the extension grid. The implication is not casual moon-math; it is geometric. If ADA continues to defend the uptrend defined by the channel’s lower rail and, crucially, converts the 0.618 retracement at $1.15694 into support on weekly closes, the path reopens into the upper retracement shelf—$1.43911 at 0.702 and $1.78464 at 0.786—before confronting the 0.888 marker at $2.32189.
A yellow waypoint for a higher high (on the main chart) sits near ~$2.30, deliberately aligning with that 0.888 level to flag a logical checkpoint for the next impulsive leg beneath the full retrace at $3.09981.
Only beyond that zone does the headline question come into play. The analyst’s cycle objective is the 1.272 extension at $6.25325. On his canvas, that target is not an orphaned price label; it intersects with the upper parallels of the multi-year rising channel further out in time, which means the extension is technically consistent with the same structure that has governed ADA since the last cycle’s base.
The risk management side of the ledger remains equally explicit: lose the 0.382 at $0.62932 on a weekly closing basis and the neutral-to-constructive stance is impaired, pushing focus back to $0.43180 and $0.33360, with the 0% anchor at $0.23488 defining the absolute boundary of the cycle floor inside the channel’s lower third.
As the latest candles on the charts show, ADA sits mid-channel with the higher low confirmed and the range unresolved beneath descending trendline supply. The triggers are unchanged and numerically clear. A sustained weekly close above $1.15694 would validate an attempt toward $1.44, $1.78, and $2.32, with $3.10 the final retrace before extension math takes over.
A failure through $0.62932 would flatten the uptrend call. Between those guardrails, the analyst’s October 26 message reads less like bravado and more like a conditional statement embedded in the chart itself: Cardano can still reach $6.25 this cycle—but only if the uptrend continues to hold and the 0.618 ceiling finally gives way.
The XRP market is bracing for a new phase of intense volatility, with anticipation growing around key legal, regulatory, and institutional developments. Ripple CEO Brad Garlinghouse has recently addressed the XRP community, offering guidance and setting expectations for what is to come.
XRP Unusual Stability May Be Setting Up A Major Move
The cryptocurrency world is buzzing with increased anticipation for XRP, following a series of strategic announcements from Ripple and compelling technical analysis. Popular crypto news source CryptosRus has highlighted on X that the altcoin is poised for a sharp move, as Ripple CEO Brad Garlinghouse has mentioned that investors should be prepared for a substantial shift.
At the core of this move, Ripple has just launched Ripple Prime, a new global prime brokerage service tailored for institutional clients. According to the company, Ripple Prime will be powered by Ripple’s foundational digital asset infrastructure, encompassing its robust solutions for payments, crypto custody, and stablecoin capabilities, alongside XRP.
However, CEO Brad Garlinghouse called this move another step toward building the internet of value, emphasizing that the XRP sits at the center of everything Ripple does. CryptosRus noted that the altcoin has recently bounced off a key support level at $2.33. This technical indicator is signaling a potential 30% rally, with an initial target of $3.45 or even higher, as market momentum continues to build.
An analyst known as TylerHillYT, who is also the president of FluenceGlobal and Co-Founder of the CSS, has also stated that the XRP price comeback is showing structural strength. In just a day, the token burn rate spiked 29%, mirroring its 29% price surge, signaling a synchronized increase in both on-chain demand and heightened investor activity.
This Ripple’s deeper expansion into traditional finance and the recent launch of Ripple Prime have caused the network usage to ramp up again. TylerHillYT emphasized that at the accelerated pace, XRP is not just riding a wave of market momentum, but it’s rebuilding its long-term narrative. However, the burn acceleration with renewed institutional traction could be the early signs of a sustained upward trajectory, pushing the token structurally toward the $3.00 mark.
Connecting Market Surge To Foundational Growth
While the digital asset market is vibrating with renewed excitement surrounding XRP, a prominent crypto influencer and creator on Binance and CMC, Jack, has revealed that the bulls have firmly smashed through the critical $2.55 resistance level with conviction. This decisive breakout has now set the immediate sights of traders on $2.80 and beyond.
Jack mentioned that whale activity is back, and the Open Interest (OI) is climbing steadily, while sentiment is flipping fast. If this powerful momentum holds, the next significant pit stop for XRP could be the $3.00 mark and beyond.
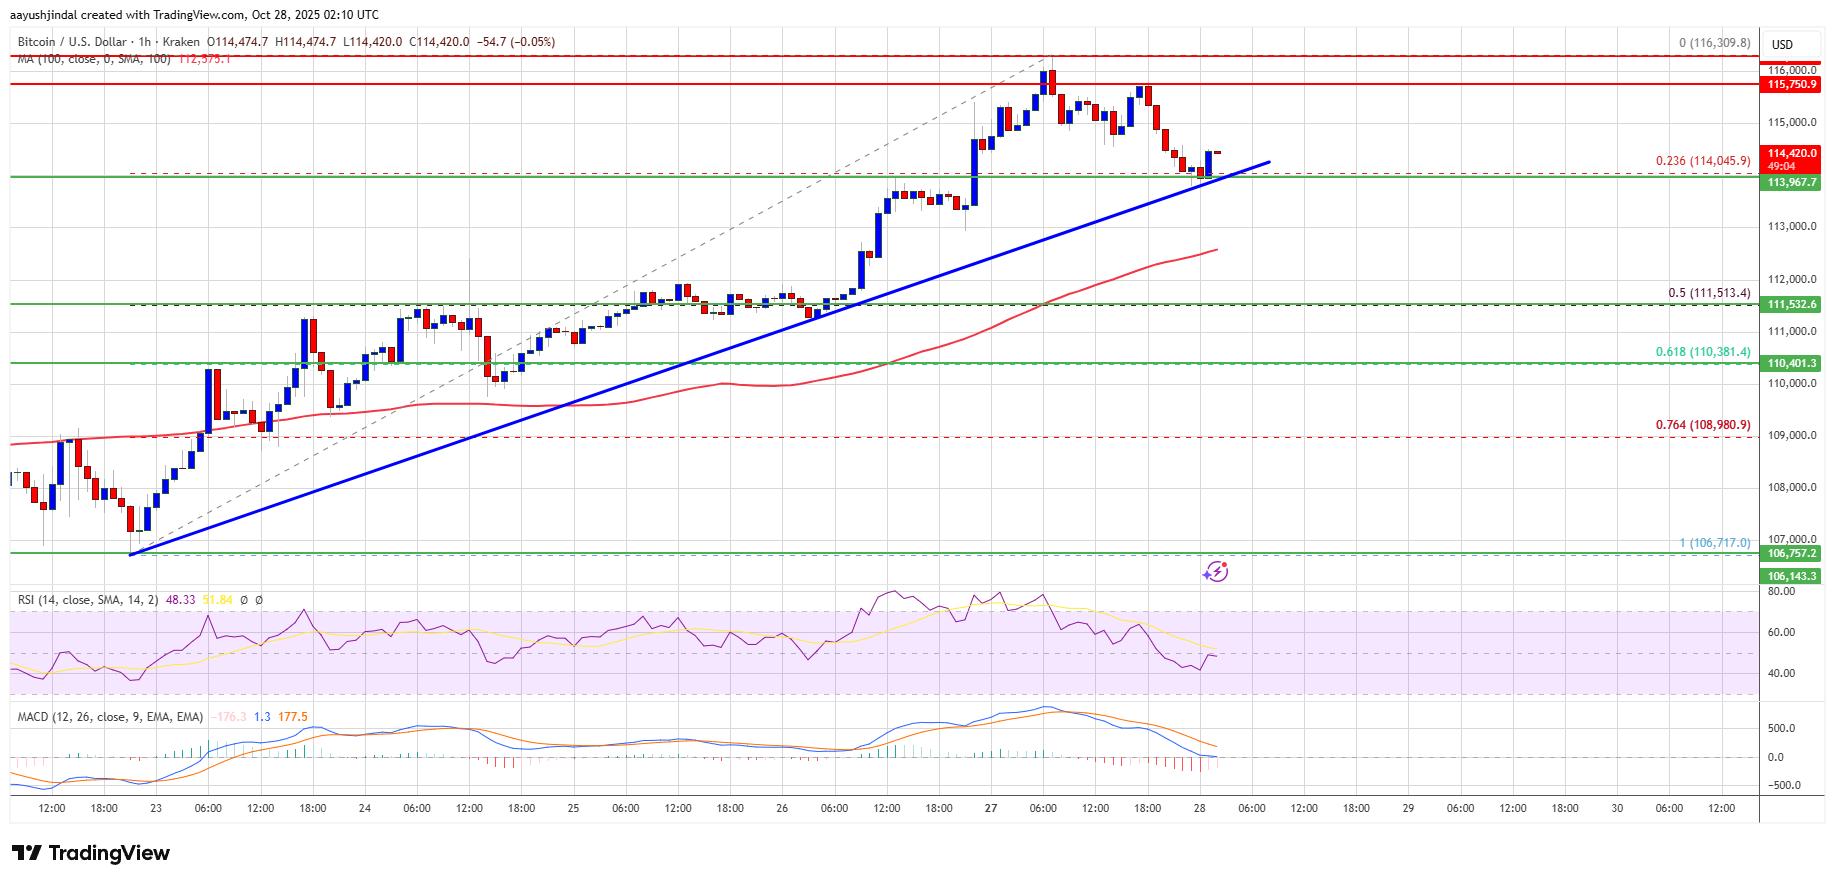
Bitcoin price is consolidating gains above $113,500. BTC could rise further if there is a clear move above the $115,750 resistance.
Bitcoin started a fresh upward move above the $114,000 resistance level.
The price is trading above $114,200 and the 100 hourly Simple moving average.
There is a bullish trend line forming with support at $113,900 on the hourly chart of the BTC/USD pair (data feed from Kraken).
The pair might continue to move up if it trades above the $115,750 zone.
Bitcoin Price Starts Consolidation
Bitcoin price formed a base and started a fresh increase above the $112,500 zone. BTC gained pace for a move above the main hurdle at $113,500.
It opened the doors for a move above $115,000 and the 100 hourly Simple moving average. Finally, the price spiked above $116,000 and is currently consolidating gains above the 23.6% Fib retracement level of the recent wave from the $106,718 swing low to the $116,309 high.
Besides, there is a bullish trend line forming with support at $113,900 on the hourly chart of the BTC/USD pair. Bitcoin is now trading above $114,000 and the 100 hourly Simple moving average.
Immediate resistance on the upside is near the $115,000 level. The first key resistance is near the $115,500 level. The next resistance could be $115,750. A close above the $115,750 resistance might send the price further higher. In the stated case, the price could rise and test the $116,300 resistance. Any more gains might send the price toward the $117,500 level. The next barrier for the bulls could be $118,000.
Another Pullback In BTC?
If Bitcoin fails to rise above the $115,500 resistance zone, it could start a fresh decline. Immediate support is near the $114,000 level. The first major support is near the $113,500 level or the trend line.
The next support is now near the $111,000 zone. Any more losses might send the price toward the $110,500 support in the near term. The main support sits at $108,500, below which BTC might struggle to recover in the short term.
Technical indicators:
Hourly MACD – The MACD is now gaining pace in the bullish zone.
Hourly RSI (Relative Strength Index) – The RSI for BTC/USD is now above the 50 level.
Major Support Levels – $114,000, followed by $113,500.
Zcash (ZEC) has exploded in value past $350, clearing its 2021 high and igniting a wave of renewed optimism across the digital assets ecosystem. A surge in demand tied to privacy, cross-chain integration and bold market calls are pushing ZEC into the spotlight.
Rally Driven by Privacy Narrative and Major Price Call
Zcash’s recent rally is nothing short of dramatic. In the past month, ZEC’s price surged roughly 380 % and smashed through its May 2021 closing level of around US$319.
This breakout has drawn fresh attention to the coin’s core value proposition, transaction anonymity, at a time when regulatory scrutiny and surveillance concerns are rising globally.
Adding fuel to the fire, Arthur Hayes, co-founder and former CEO of BitMEX, publicly predicted that ZEC could ultimately reach US$10,000. Markets responded swiftly; within 24 hours of Hayes’s “vibe check” post on X, ZEC jumped over 30 %. The privacy-coin resurgence appears well underway.
Meanwhile, technical analysts argue the rise is more than hype. ZEC’s chart now showcases breakout patterns, rising volumes, and a shift in smart-money positioning. However, caution remains. Many analysts note that although the price is reflecting a strong narrative, actual usage of shielded transactions remains limited.
Zcash (ZEC) Ecosystem Integrations Add Strength
Behind the price action lies concrete ecosystem development. Zcash integration into other chains, such as its wrapped version on Solana, is reviving interest, while new solutions seek to restore ZEC’s full privacy features across cross-chain networks.
For example, the project Encifher is enabling encrypted versions of ZEC (eZEC) using fully homomorphic encryption on Solana so that users can transact privately while still engaging with DeFi.
Other catalysts include the anticipated halving event, which is due to cut miner rewards in mid-November, tightening supply. Added to that, institutional frameworks such as the debut of a trust vehicle for ZEC are reportedly expanding exposure. All told, these structural shifts support the narrative.
Nevertheless, even with infrastructure rising, the risk remains that price is racing ahead of real adoption. Analysts warn of a “sell the news” scenario if new integrations or usage metrics fail to materialize.
Cover image from ChatGPT, ZECUSD chart from Tradingview
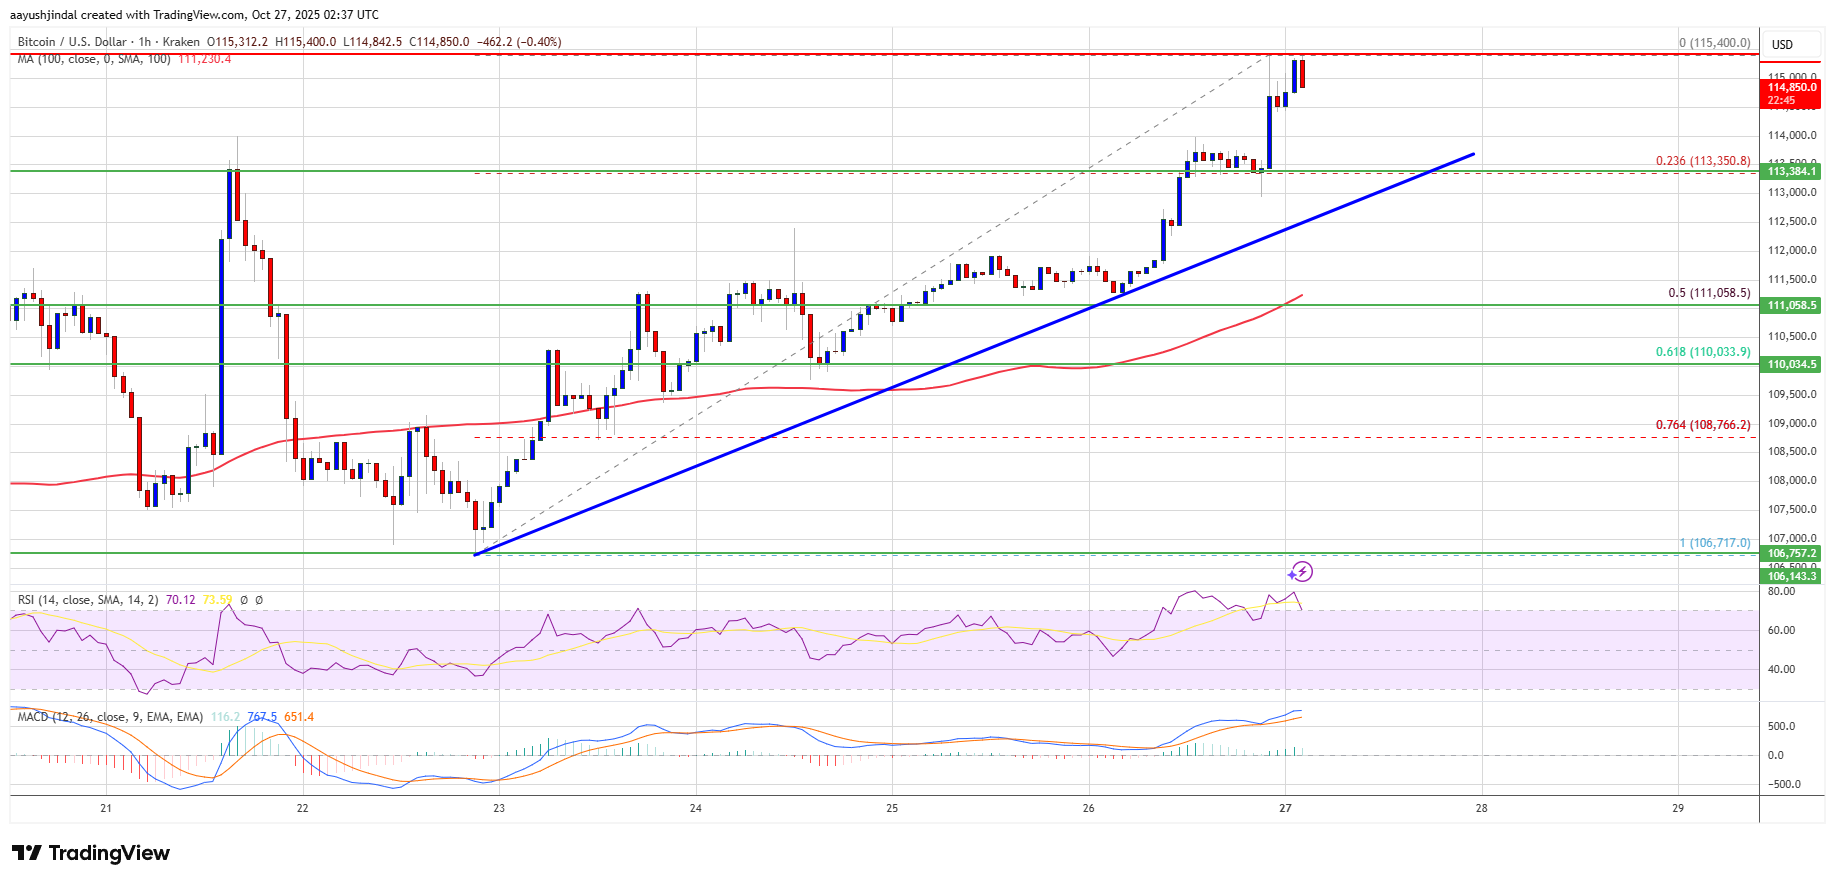
The Bitcoin price is positioning for a potentially explosive move that could take it well beyond its previous all-time highs. Analysts are closely watching a critical resistance level near $116,000, which may serve as the final hurdle before BTC catapults into uncharted territory above $126,000.
Analyst Predicts New Bitcoin Price All-Time High
Crypto analyst Donny Dicey revealed in an X social media post this week that the $116,000 price level is the decisive zone Bitcoin must breach to confirm a breakout toward a new all-time high. His technical analysis suggests that once BTC achieves a clean break above this resistance area, momentum could swiftly carry it above $126,000.
Notably, Bitcoin set a new ATH on October 6, 2025, after breaking through its previous record above $124,000 and climbing past $126,000. Since achieving this level, the price of BTC has fallen dramatically to $115,000. Dicey’s accompanying chart shows the market steadily recovering after testing support near $108,000, marked as a “market structure break” region, with bullish price action consolidating above $109,000.
The analyst has emphasized that each day Bitcoin maintains a close above $109,000 strengthens the probability of a strong upward swing as the market heads into November. This period coincides with the Federal Open Market Committee’s (FOMC) next meeting, where investors are anticipating dovish signals such as rate cuts or the formal end of Quantitative Tightening (QT).
Dicey also notes that bullish S&P 500 earnings, easing global trade tensions from a potential agreement between US President Donald Trump and China’s President Xi Jinping, and improving ISM manufacturing data point to a macro environment supportive of risk assets. A community member commented that whales may have underestimated how much BTC’s demand tends to persist during these conditions. Dicey responded that the same whales might become “exit liquidity” as Bitcoin accelerates higher, possibly missing out on the strongest phase of this cycle.
Consolidation Above January Highs Signal Unbreakable Strength
In a follow-up analysis, Dicey highlighted Bitcoin’s remarkable stability above its January highs, describing its price structure as “unbreakable” amid global macroeconomic uncertainty. He pointed to several converging factors that reinforce BTC’s resilience, including ongoing fiscal and monetary expansion, a weakening US dollar, and renewed confidence in the global business cycle.
The analyst also emphasized that geopolitical tensions tied to US-China relations appear to be subsiding. At the same time, ETF inflows and exponential growth in the Artificial Intelligence (AI) sector contribute to acting as tailwinds for digital assets. He disclosed that despite strong underlying fundamentals, skepticism remains widespread in the market.
According to him, many still believe in the traditional four-year cycle narrative, while retail enthusiasm has not fully returned. Furthermore, the Russell 2000 index has yet to breakout, and rotation from traditional assets, such as the S&P 500 and gold, into Bitcoin remains limited. With these developments subduing broader market participation, Dicey suggests it creates the perfect setup for a powerful rally in BTC once sentiment shifts decisively.
Investor sentiment, as shown by trading volume and flows on exchanges, has turned optimistic amidst the recovery. Now that Ethereum’s price action is starting to turn bullish again, a new technical analysis shared by crypto analyst Freedomby40 on the social media platform X suggests that the current rally could be far from over, projecting a possible long-term climb to $16,000.
Wave Count Structure Points To A Continuation Phase
Freedomby40’s analysis, which is based on the Elliott Wave structure, presents Ethereum as currently positioned in an extended bullish sequence that began forming in late 2022. Posting the technical analysis on X, the analyst noted that Ethereum’s price action looks great for a continuation.
His chart shows that the asset has just completed a corrective phase and is entering a renewed impulse wave, with support established between $3,225 and $3,563 at the 0.5 and 0.382 Fibonacci retracement zones, respectively. The analyst labels this zone as the ideal accumulation area for the next leg up, consistent with previous cycle structures seen in 2017 and 2021.
The Elliott Wave projection in his analysis presents a multi-layered confluence of impulse waves extending to the third degree. It illustrates that Ethereum is currently unfolding its fifth major impulse wave in a structure that traces back to mid-2022.
The internal structure of this wave sequence also reveals a C wave in motion, which itself contains smaller sub-impulse waves. Within that C wave, Ethereum appears to be entering its own fifth sub-wave, which is known to be a decisively bullish wave.
Based on this setup, the analyst outlined two potential target zones on the chart: a green box representing the realistic price range for this wave cycle and a red box depicting the higher, more extended scenario that could push Ethereum’s market cap into the trillion-dollar level.
Fibonacci Extensions Predict Targets Of $9,000, $11,000, And $16,000
Freedomby40’s analysis identifies multiple price levels based on Fibonacci extensions from the current price action. The first price target is at $6,303, which is based on the 1.0 Fibonacci extension. This initial price target will see the Ethereum price break above its current all-time high, but this is the first of many.
The next target, the 1.236 extension, is positioned around $9,013. These two price targets ($6,303 and $9,013) were described by the analyst as very realistic. Possible extensions are at the 1.382 and 1.618 Fibonacci extension levels, corresponding to $11,210 and $16,077, respectively.
At the time of writing, Ethereum is trading at $4,160, up by 5.2% in the past 24 hours. Freedomby40’s outlook joins a growing list of ultra-bullish Ethereum price forecasts from institutional research desks and top analysts. Standard Chartered Bank recently raised its 2025 price target for Ethereum to $7,500, while projecting a potential long-term path to $25,000 by 2028.
Crypto analyst Bobby A is warning that the XRP price may face trouble soon. He says the large monthly chart is showing weak signs, and this could mean the market is turning bearish again. The analyst thinks the price might need to drop further before it can move higher.
Bearish Signals Showing On The XRP Price Monthly Chart
Bobby A says the big XRP chart does not look healthy right now. He explains that many important monthly indicators are crossing bearishly. He says XRP is trading below the 1.618 level, and the price action there looks like a rejection rather than a breakout. He thinks this rejection is happening at a terrible time for XRP, noting that the monthly candle is closing near the BMSB line, another dangerous sign for the price.
Bobby A reminds traders that when the Bressert indicator crosses bearish on the monthly chart, history shows it has never been good for XRP. He believes that history could repeat itself, and these bearish signals are evident on the chart right now, suggesting the mid-term trend may not be strong. His analysis says that in six days, XRP will be facing the monthly candle close again, and facing it while price action is weak is usually not a good sign. He is worried because the chart’s overall structure shows more weakness than strength at this time.
He explains that when a chart shows this kind of technical damage, the smart move is to stay alert. He says traders must focus on risk control during times when the big charts start to flash warning signs. He shares this because he has trusted his chart study before when XRP was under $0.30, and now he needs to trust what he sees again with XRP above $2. He says the market can change very fast, and traders must be ready for those changes.
XRP May Drop To Lower Support Before Moving Up Again
Right now, XRP is already making a small move downward. Bobby A says this retracement is happening in real time. He warns that XRP could roll over again and retest lower price support levels. If this happens, the token price could fall under $1 to find more substantial support before it tries to recover. He believes there is a real and present risk that the price will crash below $1 if sellers keep pushing it down.
He advises traders to protect their money and manage their trades carefully. He says capital safety must come first in times like these. Even though he still believes in XRP’s long-term future and remains a strong supporter of the project, he feels the odds right now point to lower prices in the mid-term. He says this is because the latest market signs are not strong enough to support a big bullish move yet.
Bitcoin’s price action was rather subdued last week, keeping traders guessing whether or not we would see another large drop in price entering the weekend. Price held above the lows, however, slowly plodding a little bit higher to close out the week at $114,530. Bulls should not be overly disappointed with this price action, as they did reclaim the $112,200 resistance level, and are now closing in on conquering the next resistance level at $115,500. The bears are still sitting comfortably in control, though, with stronger resistance levels hanging overhead that the bulls have yet to challenge. This may be an interesting and volatile week ahead, with the FOMC meeting on Wednesday and a slough of large companies reporting third-quarter earnings.
Key Support and Resistance Levels Now
Nothing has materially changed from last week’s resistance levels as the bulls have made little progress. Heavy resistance is still sitting at $117,600 and $122,000 above there, so the bears aren’t feeling any real pressure yet. If by chance this week gets above $122,000, we will look to the upper boundary of our broadening wedge pattern at $128,000.
Holding above the prior week’s low is a positive sign for the bulls, while they managed to maintain price above the key short-term support of $106,900 last week as well. This level must hold going forward, as closing below $106,900 opens the door back down to the $105,000 to $102,000 support zone that has already been tested twice. A third test of this support zone would be more likely to break it than to hold it. $96,000 is the long-term bull market support below here, a do-or-die support level if the price were to slide down and test it.
Outlook For This Week
Expect significant volatility this week, especially on Wednesday, as we have the Federal Reserve’s interest rate decision and ensuing Powell speech, followed by major earnings reports from Microsoft, Meta, and Google after market close. Bulls will look to hold $109,000 as a floor into this week, as doing so would position them to maintain upward momentum. Looking at the Momentum Reversal Indicator, we are currently sitting on an 8-count entering Monday. This is a warning candle that we may see momentum begin to fade. Tuesday should bring the 9-count at which point we should expect at least a pause on upward momentum and a 1 to 4 day correction in price. So if bulls can push price up to the 0.618 Fibonacci Retracement at $117,600 by Monday night or Tuesday morning, we should expect to see a rejection ther,e and we can re-assess after Wednesday’s FOMC and earnings reports play out.
Market mood: Bearish – While the bulls gained some ground last week, the bears remain stoic and strong. The bulls must push the price past $122,000 to take back control.
The next few weeks If bulls can manage to survive through this week, there are still some potential headwinds on the horizon. The US-China tariff dispute may or may not be resolved by the end of next week; a negative outcome will likely send all markets lower. Additionally, the US courts’ ruling on the legality of Trump’s tariffs is expected by November 5th. If these tariffs are reinstated, we should expect markets to head lower to price this impact in.
Terminology Guide:
Bulls/Bullish: Buyers or investors expecting the price to go higher.
Bears/Bearish: Sellers or investors expecting the price to go lower.
Support or support level: A level at which the price should hold for the asset, at least initially. The more touches on support, the weaker it gets and the more likely it is to fail to hold the price.
Resistance or resistance level: Opposite of support. The level that is likely to reject the price, at least initially. The more touches at resistance, the weaker it gets and the more likely it is to fail to hold back the price.
Fibonacci Retracements and Extensions: Ratios based on what is known as the golden ratio, a universal ratio pertaining to growth and decay cycles in nature. The golden ratio is based on the constants Phi (1.618) and phi (0.618).
Broadening Wedge: A chart pattern consisting of an upper trend line acting as resistance and a lower trend line acting as support. These trend lines must diverge away from each other in order to validate the pattern. This pattern is a result of expanding price volatility, typically resulting in higher highs and lower lows.
Momentum Reversal Indicator (MRI): A proprietary indicator created by Tone Vays. The MRI indicator tracks buyer and seller momentum and exhaustion, providing signals to indicate when to expect momentum to fade and accelerate.
American Bitcoin Corp. (Nasdaq: ABTC), a Trump family–backed mining platform, has expanded its Bitcoin holdings to 3,865 bitcoin, adding 1,414 bitcoin since September through a combination of mining production and secondary market purchases.
The Miami-based firm, which describes itself as “America’s Bitcoin infrastructure backbone,” said the latest accumulation includes coins held in custody and those pledged for miner purchases under its ongoing procurement deal with Bitmain.
The update continues a rapid expansion trajectory that began earlier this year when Hut 8 spun out its U.S. mining arm as a separate, publicly traded entity.
American Bitcoin initially held around 500 BTC at the time of the carve-out, then purchased another 1,726 BTC between July and August for approximately $205 million.
Those holdings were pledged to Bitmain as collateral for a $314 million order of 16,299 Antminer U3S21EXPH units — nearly the full 15 EH/s option under the companies’ strategic supply agreement. Most of those machines will be hosted at Hut 8’s new Vega site in Texas, a 400-megawatt facility central to American Bitcoin’s push toward 25 EH/s of proprietary hashrate.
“We believe one of the most important measures of success for a Bitcoin accumulation platform is how much Bitcoin backs each share,” said Eric Trump, co-founder and chief strategy officer. “As part of that conviction, we are focused on providing transparent updates as we aim to increase our holdings.”
JUST IN: Trump Family-backed BTC miner American Bitcoin acquires 1,414 Bitcoin.
Executive Chairman Asher Genoot added that American Bitcoin’s integrated mining model allows it to lower its average cost per Bitcoin compared with treasury-style vehicles that buy on the open market.
“That structural advantage allows us to compound Bitcoin value per share more efficiently for our investors,” he said.
Shares of ABTC have been volatile since their September debut, rising 11% on Friday to close at $5.62 after recovering from midweek lows below $5.
The company, valued around $5.1 billion, remains one of the most closely watched plays in the sector — both for its aggressive expansion plans and its deep ties to the Trump family.
At the time of writing, the stock is trading at $5.83 and Bitcoin is trading at $115,000 after a couple of tumultuous weeks.
Gryphon, American Bitcoin merger
Earlier this year, Gryphon Digital Mining merged with American Bitcoin Corp., the Trump family–backed subsidiary of Hut 8, to form what they claim could become the most efficient pure-play Bitcoin miner in the industry.
The all-stock merger saw Gryphon shareholders own about 2% of the combined entity and American Bitcoin stakeholders hold 98%.
The merger, now finalized, provides American Bitcoin with a faster route to public markets and combines Gryphon’s mining technology with American Bitcoin’s capital strength and large-scale reserve strategy.
Bitcoin’s price surged above $115,000 on Monday as Strategy, the largest corporate holder of Bitcoin, announced another significant purchase of Bitcoin. The business intelligence firm acquired 390 BTC between October 20 and October 26, spending approximately $43.4 million at an average price of $111,053 per Bitcoin.
According to a Form 8-K filing released today, Strategy’s total Bitcoin holdings have now reached 640,808 BTC, with an aggregate purchase price of $47.44 billion. The company’s average purchase price stands at $74,032 per Bitcoin, including fees and expenses.
The latest acquisition was funded through proceeds from Strategy’s At-The-Market (ATM) equity programs, specifically through the issuance of preferred shares under its STRF, STRK, and STRD ATM programs. The company raised a combined total of $43.4 million during the period to finance these purchases.
The announcement comes amid a growing trend of companies adopting Bitcoin treasury strategies. Recent data indicates that publicly traded companies now hold over $110 billion worth of Bitcoin, with Strategy alone accounting for approximately $74 billion of that total.
The emergence of Bitcoin treasury companies has accelerated notably in 2025, with Germany’s aifinyo AG recently announcing plans to accumulate 10,000 BTC by 2027. This follows similar moves by companies across Europe and Asia, signaling a broader institutional acceptance of Bitcoin as a treasury reserve asset.
The Bitcoin treasury model has moved from experimental to established corporate strategy. We’re seeing new companies enter this space almost weekly, recognizing Bitcoin as the ultimate treasury reserve asset.
Bitcoin’s price responded positively to Strategy’s announcement, trading above $115,000 as of press time. Bitcoin has shown strong momentum in recent days, supported by growing institutional adoption and the approaching 2026 halving.
Strategy’s stock (MSTR) has also shown positive movement, rising 3% in pre-market. Recent regulatory developments have further supported the Bitcoin treasury trend. Strategy recently received favorable guidance from the IRS and Treasury regarding the treatment of unrealized crypto gains in Corporate Alternative Minimum Tax (CAMT) calculations, eliminating concerns about potential tax liabilities for long-term Bitcoin holdings.
As more companies adopt Bitcoin treasury strategies and regulatory frameworks become clearer, the trend appears poised to continue. With Strategy leading the way and new entrants like aifinyo AG joining the space, corporate Bitcoin adoption is increasingly becoming a global phenomenon, spanning various industries and regions.
Popular technician Charting Guy (@ChartingGuy) calls Shiba Inu “weak and choppy” and suggests the token may not break out until late in the current crypto cycle. Sharing a weekly Shiba Inu chart, he wrote on Oct. 26, 2025: “SHIB has been weak and choppy all cycle. Won’t do anything until the end imo.”
How High Can Shiba Inu Price Go?
The below TradingView chart is a weekly SHIB/USD study anchored to a Fibonacci ladder. The price marker on the right rail reads $0.000010205, placing SHIB fractionally below the 0.236 retracement band annotated at $0.000011043.
Above that, the chart maps successive overhead levels at 0.382 near $0.000016434, 0.5 around $0.000022661, 0.618 near $0.000031247 and 0.786 at about $0.000049369. The red 1 line flags $0.000088410, with higher extension markers plotted at 1.272 ≈ $0.000185406, 1.414 ≈ $0.000272917 and a terminal 1.618 ≈ $0.000475605.
A stylized projection trace on the chart depicts a late-cycle, near-vertical advance that only materializes after a prolonged base and then stalls inside the 1.0–1.272 cluster before breaking above the 1.272 Fib extension and topping below the 1.414 Fib extension roughly at $0.000022; the path visually reinforces the author’s contention that SHIB underperforms until the “end.”
In a separate post on Oct. 24, Charting Guy ranked market structures across majors and large-cap altcoins, explicitly placing SHIB in his “Bad Looking Charts” bucket while labeling Bitcoin, Ether, XRP, Solana, BNB and Stellar as “Good Looking Charts.” His list read, in part: “Good Looking Charts: BTC, ETH, XRP, SOL, BNB, XLM … Decent Looking Charts: XDC, DOGE, PENGU, ADA, ONDO, SUI, AAVE, LTC … Eh Looking Charts: PEPE, FLOKI, FLR, LINK, BCH … Bad Looking Charts: SHIB, WIF, ETC, AVAX, FET, RENDER, INJ, CRV, ALGO, SOLO, COREUM, NEAR, VET, COMP, DOT, IOTA, FIL, ATOM, And many more.”
What To Expect
The technical message is unambiguous: on a weekly timeframe, SHIB remains capped beneath early Fibonacci thresholds that many chartists treat as momentum gates. Remaining below 0.236 typically signals that price has yet to reclaim even the shallowest retracement of the prior cycle; clearing it often opens room to test the 0.382–0.5 midpoint zone where trends either accelerate or fail.
In Charting Guy’s map, structurally meaningful inflection areas stack tightly from roughly $0.000016 to $0.000031, with the 0.618 level near $0.000031 attributed the role of a trend-confirmation threshold. The cycle-top roadmap he drew concentrates risk and reward into the higher cluster around $0.000088 to $0.000185, a range often watched by Fibonacci practitioners for exhaustion and distribution in late-stage moves. However, a rise to $0.00022 could still mean an incredible upside for SHIB of around 2,055.81%—a roughly 20.56-fold increase.
Contextually, his relative-strength table is just as important as the levels. By grouping SHIB with other “bad looking” structures while upgrading Bitcoin, Ether, XRP, Solana and BNB, he is signaling an expectation that market breadth will remain narrow and quality-led before any speculative rotation into meme-beta like SHIB. That framework aligns with his succinct call that SHIB “won’t do anything until the end,” implying a sequencing view rather than a categorical dismissal.
Crypto analyst CryptosRus has drawn attention to the open interest reset for XRP. The analyst also explained why this development could spark a major price surge for the altcoin.
XRP’s Open Interest Drops To New Lows
In an X post, CryptosRus revealed that XRP’s open interest on Binance has dropped back to the same lows that were seen in May 2025. The analyst noted that back then, the liquidation flush sparked a massive rally for the altcoin, which pushed it to $3.50. He added that this time around, the open interest is at the floor again, but the price is holding around $2.6.
CryptosRus stated that this means that leverage is gone while the strong hands are still holding XRP. The analyst predicted that if new liquidity enters, this setup could signal the next leg up for the altcoin. He added that rallies usually start when leverage is low, spot demand is strong, and shorts are trapped.
Notably, XRP has witnessed new demand with the launch of the largest XRP treasury company, Evernorth. The company has already accumulated up to $1 billion in XRP with Ripple’s backing and has revealed plans to continue accumulating more, using gains from its DeFi activities. Notably, the company stated that it will purchase XRP on the open market, which is expected to impact the altcoin’s price.
Meanwhile, the SEC is expected to approve the spot XRP ETFs once the U.S. government shutdown ends. This could drive new liquidity into the altcoin, boosting its price. Moreover, experts such as Canary Capital’s CEO Steven McClurg have predicted that the XRP ETFs could see more inflows in their first month than the Ethereum ETFs did.
XRP Is Gearing Up For A ‘Face Melting’ Rally
Crypto analyst Ether stated that XRP is quietly gearing up to melt faces and that most aren’t even aware or ready for what is coming. This came as the analyst alluded to an earlier analysis, in which he revealed that a similar scenario from a previous cycle was playing out for the altcoin.
Ethere stated that XRP’s cyclical structure is showing a striking similarity again. After the altcoin’s rally in 2017, its price was rejected from the 2013 all-time high (ATH) level and then retested the 2014 ATH level, which had previously acted as resistance. XRP then began its parabolic run after it accumulated strength in that range.
Now, this same XRP price action is playing out again, according to Ether. He noted that after the strong surge in 2024, the altcoin’s price was rejected at the 2017 ATH level and retested the 2021 ATH level, which had previously acted as resistance. The analyst added that the power accumulation phase is now underway in this region and that once it is complete, the next parabolic run will be inevitable.
At the time of writing, the XRP price is trading at around $2.63, up in the last 24 hours, according to data from CoinMarketCap.
The Dogecoin price shows quiet strength as retail sentiment stays weak. Dormant whales accumulated 15.1 million DOGE, worth about $2.95 million, signaling renewed long-term confidence.
The move contrasts sharply with soft trading activity among small investors. Many retail holders continue to sell into every minor rally, showing limited confidence in short-term gains. The cautious behavior reflects broader market uncertainty and hesitation to buy at current levels.
Whales Reactivate as DOGE Accumulation Rises
On-chain data reveals a steady accumulation of DOGE by high-value wallets. One whale address reactivated after months of dormancy, adding 15.1 million DOGE to its holdings.
It later sold 7,473 DOGE for about $1,450, leaving 15.19 million DOGE valued near $12.96 million. Analysts view this as a strong signal that institutional or early adopters are positioning ahead of the next market phase.
While retail traders appear cautious, large wallets are quietly adding exposure. This split in behavior highlights an ongoing tug-of-war between speculative exit and long-term accumulation.
Whale Accumulation Signals Faith
Dormant whale accumulation often precedes renewed confidence among experienced holders. These “smart money” actors typically buy when the Dogecoin price trades near historical support zones. Their activity indicates belief in a medium- to long-term recovery, even when short-term metrics appear bearish.
Whale wallets moving after long silence also suggest that value recognition is returning to the meme-coin sector. Despite a weak broader market, their actions may mark early groundwork for the next uptrend.
Weak Retail Sentiment Persists
Despite whale optimism, retail traders are doing the opposite. CryptoQuant data shows that the Spot Taker CVD remained negative through October, signaling sustained selling pressure. This metric reveals that most traders continue to execute aggressive sell orders rather than buy into dips.
SourceL CryptoQuant
Supporting this, Coinalyze data reports a persistent negative Buy–Sell Delta. Over the past 30 days, Dogecoin recorded 156.67 million in sell volume versus 154.88 million in buy volume — a net negative of 1.79 million DOGE. This imbalance confirms that retail enthusiasm has yet to return.
Source: Coinalyze
Technical Setup Remains Bearish
The DOGE USD price is still hovering below the main moving averages. It is bellow the 20,50,100 and 200 EMA lines which are pointing down. The Directional Movement Index supports this view, as the Positive Index is very close to 12 and the Negative was near 39.
Month
Minimum Price
Average Price
Maximum Price
Potential ROI
October
$0.192
$0.195
$0.198
-2.6%
November
$0.224
$0.237
$0.250
23%
December
$0.225
$0.232
$0.238
17.1%
Buyers need to break more than $0.20 (20 EMA level) for the Dogecoin price trend to become bullish. A follow-through recovery back above the 50–100 EMA zone.
Source: TradingView
Around $0.21 is likely to pave the way for an extension of the up-move towards the $0.22 intermediate hurdle in the near-term. If it does not, the price can remain range-bound between $0.17 and $0.20 for an extended period.
Market Momentum Building Slowly
Despite the present soft performance, Dogecoin price exhibits superior resilience when compared to larger altcoins. It was up more than 2% this week compared with the CD5 index. Trading volume was 9.8% above the seven-day average, a sign of institutional participation.
The pattern suggests “early-cycle momentum building,” says market strategist Rishi Patel of Bluepool Digital. “DOGE’s resilience while Bitcoin and Ethereum consolidate suggests rotation flows are returning to higher-beta assets,” Patel said.
Chart Indicators Show Stability
Technical charts indicate that dogecoin is supported by an uptrendline, drawn from $0.1949 low on the hourly chart. Steady re-tests at $0.2060–$0.2070 support indicate buyers remain in the market daily. RSI is sitting at around 58 on the 4-hour — just like you’d expect early in a trend.
The MACD indicator remains in the positive area but starts to narrow, indicating light consolidation following an attempt to break out. This action suggests re-accumulation, not exhaustion, analysts said. The bias remains bullish with sustained closes above $0.2085.
What Lies Ahead for Dogecoin Price
But if buyers take over, Dogecoin price may rise towards $0.22 and then at the end of this week or next, to $0.25 ahead of new conditions next month. But an inability to take out the resistance levels may extend sluggishness.
Although most long-term holders still talk about DOGE as a speculative — yet resiliently decentralized– digital asset. Its strong community and growing whale interest keeps its story running even in slow markets.
Conclusion
The Dogecoin price narrative today is emblematic of the quiet confidence beneath the surface. Whales that were previously dormant are accruing millions, while retail traders are even hopping out.
Technicals are still cautious, momentum indicates slow-building recovery. If DOGE can break above $0.20 and maintain, that will signify its next leg. For the time being, the whales seemed to be gambling that patience would pay.
Whale: A name for someone holding a large quantity of cryptocurrency who is able to manipulate the market.
Dormant Wallet: A cryptocurrency or blockchain wallet that has gone dormant, and is either empty or contains an insignificant sum of cryptocurrency.
On-Chain Data: Information written to a blockchain itself, which can be utilized to track wallet movements, transactions and the general health of network.
Retail Traders: Small, individual investors usually trading in small quantities who generally follow the short-term market favourite.
Spot Taker CVD: A measure of trading that compares volumes of buying and selling in the spot market, with negative values indicating pressure to sell.
Frequently Asked Questions About Dogecoin Price
1- Is the Dogecoin price bullish or bearish?
Short-term signals remain bearish, but whale accumulation hints at early bullish positioning.
2- Why are whales buying Dogecoin?
Dormant wallets suggest long-term investors see value at current levels and expect gradual recovery.
3- What price levels should traders watch?
Key resistance sits at $0.20 and $0.21. A breakout above $0.2085 could confirm new upside momentum.
4- Are retail traders supporting the move?
Not yet. Retail sentiment remains weak, with net selling pressure persisting for most of October.
ETH is up 5.5% in the last 24 hours and is now trading above $4,100.
The coin could rally towards the $4,500 resistance level soon.
Ether hits $4,200 as the bullish trend returns
Ether, the second-largest cryptocurrency by market cap, is up by more than 5% in the last 24 hours. The rally allowed the coin to briefly hit the $4,200 level before retracing to now trade at around $4,160 per coin.
This latest development comes as Bitcoin and the broader cryptocurrency market recorded an excellent weekend. Bitcoin is trading above $115k once again after adding 3.5% to its value.
With Bitcoin, Ether, and other leading altcoins recording gains, the total cryptocurrency market cap now stands at $3.91 trillion. Ether could rally higher in the near term, with the technical indicators suggesting further buying pressure.
Ethereum could surge to $4,500 amid bullish indicators
The ETH/USD 4-hour chart is bearish and efficient despite Ether adding 5% to its value in the last 24 hours. The technical indicators suggest that Ether could face further buying pressure thanks to its rally.
Ether’s price surged by 5% last week, closing the weekly candle above the 50-day EMA at $4,129 on Sunday. It briefly climbed to $4,206 on Monday before retracing to now trading around $4,160.
The RSI of 67 shows a bullish momentum, with the MACD lines flashing a buying signal in the last few days. If Ether breaks and closes above its daily resistance of $4,232, it could continue its rally towards the next major resistance and TLQ level at $4,529. An extended bullish run could allow Ether to reclaim its recent high above $4,700.
However, if Ether faces a correction following its recent run, it could dip towards the major support level at $3,593.
The Dogecoin weekly chart is flashing a cluster of technically constructive signals, according to crypto analyst Cantonese Cat (@cantonmeow), who published a four-panel weekly read on DOGE on Oct. 27. Price is currently hovering near $0.208 on Binance spot, and the setup he highlights pivots on four independent checks: the cycle-high anchored VWAP, Ichimoku “Katana” support, a 0.5 log-scale Fibonacci hold, and conspicuously light sell-side volume during the recent drawdown.
4 Reason To Be Bullish On Dogecoin
In his post, Cantonese Cat wrote: “Attempting to reclaim cycle high AVWAP as support. Claiming Ichimoku Tenkan + Kijun fusion (blue and red lines fused together), AKA Katana, as support so far. Holding 0.5 log fib from cycle high–cycle low as support so far. There’s been no volume so far during this downturn on multiple exchanges including Coinbase and Binance, and all it takes is just some volume to come in and we could reverse any downtrend in a hurry.”
On the anchored VWAP chart, the teal line measured from Dogecoin’s cycle peak tracks the market’s volume-weighted cost basis since the 2021 top. DOGE is pressing that band from above/at parity, attempting to convert it into support after a failed breakdown earlier this month.
On a weekly basis, closing and subsequently holding above the cycle-high AVWAP tilts risk-reward positively because it implies the marginal participant who bought since the peak is no longer underwater. Notably, the most recent weekly wick that probed below the band—printing a sharp stab toward the low-$0.09s—was retraced swiftly, with subsequent candles clustering back around ~$0.21. That rejection of lower prices right at the anchored VWAP argues against sustained distribution at current levels.
The Ichimoku frame reinforces the same idea. Tenkan-sen and Kijun-sen are fused around ~$0.2009 on the weekly (a configuration the analyst labels “Katana”), and price is currently riding that confluence as support. The cloud (Senkou span) remains red and overhead, spanning roughly the $0.24s into the ~$0.29 region, which defines the near-term supply zone that would need to be cleared on a weekly close to confirm trend resumption.
Until then, the Katana acting as a shelf at ~$0.20 is the near line in the sand; lose it decisively and the bias flips back to testing deeper supports, but sustain it and the path of least resistance shifts to re-engaging the cloud’s lower boundary.
Fibonacci context adds precision to those levels. Measured log-scale from the cycle high to the cycle low, DOGE has so far defended the 0.5 retracement at $0.19070 on multiple weekly closes.
That 50% line is the pivot of the current structure: a confirmed weekly close and acceptance below would hand momentum to bears toward the 0.382 at $0.13847, while continued defense keeps the market pointed at successive retracement ceilings overhead—the 0.618 at $0.26261, the 0.707 at $0.33430, the 0.786 at $0.41416, and the 0.886 at $0.54318—before the full retrace to the cycle high marker around $0.73995.
Price has been oscillating in a broad $0.16–$0.27 corridor for months; sitting above the 0.5 while probing the AVWAP strengthens the case that the mid-$0.20s could be revisited if buyers can reclaim momentum.
Volume is the wild card—and the fourth reason the analyst cites for optimism. The weekly histogram across multiple years shows that persistent selloffs have been accompanied by contracting volume, with downward arrows on the chart denoting successive periods of declining activity into lows.
By contrast, the last major impulsive advance in late 2024 printed the cycle’s heaviest weekly turnover. The current downturn lacks that distribution signature; bins on Coinbase and Binance have thinned rather than expanded. In market-structure terms, falling volume on pullbacks is textbook corrective behavior, and it leaves the door open for a sharp reversal if/when demand returns.
Put together, the four lenses describe a market sitting on top of a stacked support cluster: the cycle-high AVWAP roughly at the current price, the Ichimoku Katana fused near ~$0.2009, and the 0.5 log Fibonacci at $0.19070 just below. The invalidation path is clear enough—a decisive weekly loss of the $0.19 handle would expose the $0.13847 (0.382) shelf—while the upside path is equally mapped: first reclaim the lower edge of the cloud in the low-$0.20s, then test $0.26261 (0.618), with any weekly close through that level shifting focus to $0.33430 and beyond.
Over the years, a number of indicators have emerged that have often helped to pinpoint the Bitcoin bull market peak. These indicators have been triggered in previous cycles, and their triggers have often been a signal that it was time to get out of the market, as a new bear market is underway. However, this time around, even with the Bitcoin price hitting multiple new all-time highs, none of these cycle peak indicators have been triggered, suggesting that the market top has yet to be reached.
0 Out Of 30 Bull Market Peak Indicators Triggered
The Bull Market Peak Indicator tracker on the Coinglass website follows a total of 30 indicators that follow 30 indicators that show the progress of the Bitcoin bull market toward reaching a top. Some major ones include the Bitcoin Bubble Index, the Puell Multiple, the Bitcoin Rainbow Chart, and the Altcoin Season Index, among others.
Usually, these indicators are tracked on a scale of 0-100%, with 0% meaning that it is far from being triggered and 100% showing that an indicator has been triggered. If only a few of these get to the 100% mark and are triggered, it usually doesn’t mean that the Bitcoin peak has been reached.
However, even now, not one of these indicators has been triggered. Most continue to remain quite low, while the likes of the Bitcoin dominance are high, but still have not been triggered. For there to be a definite progress toward the Bitcoin market peak, at least half of these would have to be triggered.
What This Means For Investors
Since none of the bull market peak indicators have been triggered, it means that the Bitcoin price might actually be far away from its all-time high. With the score still being 0 out of 30, it points to this being a time to hold, despite the declines that the market has suffered recently.
According to a previous report from Bitcoinist, this was the case a few months ago, and now two months later, the tracker remains the same. Thus, it could be that $126,000 is not the all-time high for Bitcoin, and that the market could end up getting an altcoin season after all.
In the case that more than half of the bull market peak indicators do get triggered, then it means that the top of the market is getting close. Once it gets to 30/30, then it signals the start of the next bear market, and this is when selling is at its highest in the market, leading to rapid price declines across the board.
Bitcoin price is attempting to recover above $113,500. BTC could rise further if there is a clear move above the $115,500 resistance.
Bitcoin started a fresh recovery wave above the $113,500 resistance level.
The price is trading above $114,000 and the 100 hourly Simple moving average.
There is a bullish trend line forming with support at $113,350 on the hourly chart of the BTC/USD pair (data feed from Kraken).
The pair might continue to move up if it trades above the $115,500 zone.
Bitcoin Price Starts Fresh Increase
Bitcoin price declined again below the $108,000 level. BTC tested the $106,720 zone and recently started a fresh increase. There was a move above the $112,000 resistance level.
The bulls were able to pump the price above $113,500 and the 100 hourly Simple moving average. Finally, the price spiked above $115,000 and is currently consolidating gains above the 23.6% Fib retracement level of the recent wave from the $106,718 swing low to the $115,400 high.
Besides, there is a bullish trend line forming with support at $113,350 on the hourly chart of the BTC/USD pair. Bitcoin is now trading above $114,000 and the 100 hourly Simple moving average.
Immediate resistance on the upside is near the $115,250 level. The first key resistance is near the $115,500 level. The next resistance could be $116,200. A close above the $116,200 resistance might send the price further higher. In the stated case, the price could rise and test the $117,000 resistance. Any more gains might send the price toward the $118,000 level. The next barrier for the bulls could be $118,800.
Another Pullback In BTC?
If Bitcoin fails to rise above the $115,500 resistance zone, it could start a fresh decline. Immediate support is near the $114,000 level. The first major support is near the $113,500 level or the trend line.
The next support is now near the $111,000 zone. Any more losses might send the price toward the $110,500 support in the near term. The main support sits at $108,500, below which BTC might struggle to recover in the short term.
Technical indicators:
Hourly MACD – The MACD is now gaining pace in the bullish zone.
Hourly RSI (Relative Strength Index) – The RSI for BTC/USD is now above the 50 level.
Major Support Levels – $114,000, followed by $113,500.
The XRP/BTC monthly chart has finally snapped the long diagonal that’s capped XRP since 2018, and one analyst on X thinks that shift could rewrite the pecking order. Posting under the handle X Finance Bull (XFB), the analyst argued that XRP will soon start to outperform Bitcoin.
This is because the XRP/BTC pair has not only broken out but also retested the trendline as support, and this has certified the start of a new buildup of momentum.
Retest Of A Six-Year Breakout Trendline
The mid-October flash crash that rippled through the crypto market left a visible mark on the XRP/BTC chart, creating a deep downward wick that momentarily dipped below the long-standing resistance trendline. However, as Bitcoin started to recover to above $110,000, XRP struggled to keep up and lost ground relative to Bitcoin.
Interestingly, price action shows that this move was short-lived, and XRP has started to recover against Bitcoin in recent trading sessions. As shown on the monthly candlestick timeframe chart below, the wick fell to the exact level of the breakout retest, a point where former resistance turned into new support.
This breakout occurred in late 2024/early 2025, when XRP outperformed Bitcoin for three consecutive months. From there, the XRP/Bitcoin pair was able to break out of a downward-sloping resistance trendline of lower highs spanning over six years.
Since then, however, 2025 has been characterized by more months of Bitcoin outperforming XRP than months of XRP outperforming Bitcoin, with October falling into the former group of months. Particularly, during the flash crash, the XRP/BTC pair plunged to around 0.000007 before rebounding almost immediately, a move that, according to XFB, represents the long-awaited retest of the broken trendline.
Since that retest, XRP has recovered impressively, with the pair maintaining a monthly close above the diagonal that once acted as a ceiling. This technical confirmation signals the completion of the breakout from the 2018 to 2024 downtrend that had defined XRP’s multi-year underperformance against Bitcoin. The monthly structure is now displaying the early signs of an upward shift, with the pair trading around 0.00002258 BTC.
XRP To Decouple And Outperform Bitcoin?
According to the analyst, XRP is about to undergo a rally that massively outperforms Bitcoin and melts the face of many Bitcoin maximalists. XFB’s chart outlines two target zones ahead for XRP: 0.00014688 BTC and 0.00023009 BTC. The first target corresponds to the consolidation area seen between 2018 and 2019, while the second represents a major resistance cluster from the earlier phase of XRP’s creation. If XRP/BTC rallies to those levels, it would amount to approximately a 6x and 10x gain relative to Bitcoin, respectively.
The analyst also connects the technical setup to Ripple’s growing institutional ecosystem. He pointed to Ripple Prime, GTreasury, Metaco, Standard Custody, and Rail as part of the infrastructure that’s setting up XRP as a bridge asset for global finance. These partnerships give XRP an edge heading into the coming months, as it moves into real institutional utility and starts outperforming Bitcoin.
If these developments continue, the incoming decoupling of the XRP/BTC pair could become one of the most significant events for XRP. At the time of writing, XRP is trading at $3.63, up by 3.5% in the past 24 hours.
Featured image from Unsplash, chart from TradingView
Ethereum’s largest non-exchange holders are tiptoeing back into accumulation. On-chain analytics platform Santiment reported that wallets holding between 100 and 10,000 ETH, also known as whales and sharks, have begun to rebuild positions after unloading roughly 1.36 million ETH between October 5 and 16.
Notably, the Ethereum collective holdings chart shows that nearly one-sixth of those coins have already been clawed back, as some confidence starts to return to the second-largest crypto asset.
Whales Reverse Course After Early-October Capitulation
The first half of October was highlighted by one of Ethereum’s most pronounced periods of capitulation this year. Macroeconomic fears due to US tariffs saw the Bitcoin price undergo a flash crash that dragged many altcoins to the downside. During this move, Ethereum’s price also fell very quickly, dropping from highs around $4,740 on October 7 to as low as $3,680 on October 11.
Interestingly, on-chain data shows that the selling pressure from large holders amplified this move, as the chart from Santiment shows a steep decline in their cumulative holdings from about 24.5 million ETH to roughly 22.6 million ETH. This 1.9 million ETH drop reflected clear risk-off behavior among whales and sharks, who had been net buyers since August.
However, once selling momentum began to fade, accumulation started to return. Institutional inflows started to return into Spot Ethereum ETFs, and whale/shark trades started accumulating Ethereum. Since October 16, the same cohort that contributed to the liquidation has begun adding back to their positions. Santiment noted that these holders are finally showing some signs of confidence, demonstrating an incoming extended recovery phase following the shakeout.
218,470 ETH Added In Last 7 Days
According to Santiment’s data, the collective holdings of addresses with 100 to 10,000 ETH have rebounded to approximately 23.05 million ETH after bottoming out in mid-October. A highlighted annotation on the chart shows that 218,470 ETH were accumulated in just the past week, signaling a tangible shift in on-chain behavior.
This increase represents roughly one-sixth of the coins previously dumped, a sign that major investors are gradually re-entering the market after what appeared to be an exhaustion phase. Similar accumulation trends have often preceded a broader recovery in Ethereum’s price, especially when accompanied by stabilization in the ETH/BTC trading pair.
As it stands, the Ethereum price appears to be building a firmer base for the next phase of its recovery heading into November. When whale wallets accumulate, it reduces the circulating supply available on exchanges and reduces selling pressure.
At the time of writing, Ethereum is trading at $3,940 and is on track to break and close above $4,000 again. Both Ethereum and Bitcoin have risen a bit in recent days after inflation report showed US inflation cooling to 3% in September, below the 3.1% forecasted by economists.
Featured image from Unsplash, chart from TradingView
According to the latest on-chain data, XRP’s open interest has returned to a low similar to the one seen in May 2025. Below is the potential implication for the XRP price.
Derivatives Activity Sees Significant Dip — What This Means
In a Quicktake post on the CryptoQuant platform, on-chain analyst PelinayPA delved into the underlying activity within the XRP derivatives market and how it could affect the altcoin’s price in the coming weeks.
The analyst’s report revolved around results obtained from the Open Interest metric, which tracks the total amount in USD of derivatives contracts of a cryptocurrency (XRP, in this case) that are open and have not been settled at a given time.
According to PelinayPA, the Open Interest metric has fallen to a level as low as that seen in May 2025. Interestingly, this latest dip in OI coincides with the XRP price being around $2.50, which is a much higher valuation than was held during the previous OI nosedive.
Usually, a decline in a cryptocurrency’s Open Interest indicates the forceful removal of over-leveraged or speculative positions from the market, leaving only the stronger hands to rule the market.
After the OI bottomed in May 2025, there was a significant increase in trading volume, which pushed the price to as high as $3.50. As the open interest has fallen to a level similar to that of May, history could very well repeat itself, and the XRP price could begin yet another upward rally.
XRP Key Zones To Watch Out For
For hopes of an XRP rally to remain within realistic possibilities, PelinayPA directed attention towards a couple of important price ranges to monitor. Firstly, the analyst started with the important support zone, which is the $2.20-$2.40 price range. According to the analyst, this support zone serves as a short-term buy zone, which will be crucial in keeping the token in an uptrend.
A breach of the $2.20-$2.40 support could cause a short-term sell to as low as $1.85, where the next major support for the XRP price lies. In the scenario where this “key support” fails, the altcoin could plummet to as low as its major psychological floor of $0.60-$0.70.
Looking towards the more probable bullish scenario, a condition would have to be met for the XRP price to see a surge. First, a sustained open interest increase of around 25% for several days would confirm the start of a new move.
If this happens, investors could witness a breakout above the first resistance within the $2.80-$3.00 range, strengthening bullish momentum. Also, a breakout above $3.30-$3.50 could trigger a price discovery phase, where the XRP price surges towards $4.20-$4.50.
As of this writing, XRP holds a valuation of about $2.61, reflecting an over 2% jump in the past day.
The SUI price has had quite a disappointing performance in 2025, despite having started the year with a red-hot streak. The cryptocurrency’s price rode this new year’s momentum to a new all-time high of $5.35 as early as January 4, 2025.
However, the SUI price currently sits more than 53% away from this record price, putting the altcoin’s struggles into perspective. According to a popular analyst on the social media platform X, the price of SUI could be gearing up for a run-up to a new all-time high.
SUI To Surge 260% If It Breaks Out Of This Pattern
In a recent post on X, market pundit Ali Martinez put forward a $9 target for the SUI price over the next few months. The crypto analyst identified four reasons why the altcoin’s price could be on its way to a new all-time high.
Firstly, Martinez highlighted the current technical setup of the SUI token, which is trading within a symmetrical triangle on the 2-day timeframe. For context, the symmetrical triangle is a technical analysis pattern characterized by a diagonal falling upper trendline and a rising lower trendline.
The asset’s price typically narrows and moves towards the apex of the triangle pattern, either breaching the upper trendline for a breakout or the lower trendline for a breakdown. In essence, this symmetrical triangle formation often serves as a continuation or reversal pattern depending on the direction of the price break.
Given that this technical pattern tends to be a continuation signal, Martinez expects the SUI price to break above the upper trendline, resuming its initial upward movement before entering the triangle. According to the analyst, the token could go as high as $9 if there is a sustained close above this upper boundary at the $3.6 mark
As of this writing, the SUI price stands at around $2.51, reflecting an over 1% jump in the past day. And a move to around $9 would represent an over 260% surge from the current price point.
On-Chain Catalysts For SUI Price
To support this bullish technical structure, Martinez also highlighted three positive on-chain developments in recent weeks. Firstly, the crypto analyst mentioned that the total value locked (TVL) on SUI just hit a new all-time high of $2.6 billion, indicating strong capital inflow on the blockchain.
Meanwhile, the volume of decentralized exchange (DEX) activity on SUI has also been on the rise, reaching a new record high $20.33 billion in October. According to Martinez, this recent spike was driven by real network activity, and not just incentives.
The third on-chain development highlighted is the stablecoin market cap on SUI, which has now climbed to $1.15 billion. Martinez noted that this surge in stablecoin volume underscores the network’s steady growth and strong demand. Ultimately, these positive on-chain fundamentals add to the bullish case of the SUI price.
Ethereum is showing renewed strength after rebounding from its Bull Market Support Band, a key zone that has historically served as a launchpad for major uptrends. The bounce signals a possible shift in momentum, but the real test now lies ahead. With the price approaching the crucial golden pocket resistance, a breakthrough is likely to confirm a sustained bullish phase.
ETH Bounces Back From Weekly Bull Market Support Band
In his recent update on ETH, Luca, a crypto analyst on X, noted that the asset has once again found solid footing at a familiar support area. According to Luca, the price has successfully bounced off the Weekly Bull Market Support Band. This rebound also aligns perfectly with the high-timeframe support range highlighted in his previous PAT updates, reaffirming the technical strength of this level.
He emphasized that this move was largely anticipated, as the support zone has repeatedly proven to be a reliable area for bullish reactions whenever ETH enters a corrective phase. The recent bounce signals that buyers are still active and willing to defend key levels, which could set the stage for renewed momentum if sustained.
However, Luca urged caution in the short term, pointing out that ETH is now approaching a major resistance zone. This zone corresponds with the golden pocket area between the 0.5 and 0.618 Fibonacci levels, where Ethereum previously encountered selling pressure. A failure to break above this region could result in sideways movement or a minor pullback before any decisive trend shift occurs.
ETH Eyes High-Timeframe Resistance Range For Next Leg Up
The analyst further explained that if Ethereum manages to break above the current resistance range, it would signal a decisive shift in market structure. Such a move would confirm renewed bullish momentum, paving the way for a mid-term uptrend toward the high-timeframe resistance zone marked in red.
He added that as long as ETH holds above the “golden pocket” zone after a breakout, the most likely outcome remains further upward. Sustaining momentum above this key area would reinforce the bullish narrative, suggesting that Ethereum could continue climbing toward higher resistance levels without facing major corrections.
However, until that breakout occurs, the analyst expects a period of consolidation around the current support band. According to the analyst, this phase would likely serve as a base for a more durable upside reversal in the future. At this time, patience remains essential, as the ongoing structure hints that Ethereum is preparing for a stronger, more sustained rally once the market confirms direction.
CryptoWzrd, in his latest daily technical outlook, noted that Bitcoin managed to close in the green, but the candle remains indecisive, signaling that a clear reversal is yet to form. He added that more healthy bullish candles are needed to confirm a shift in momentum. For now, his attention is on the lower timeframes, where he plans to look for the next long opportunity once the current position is secured.
Indecisive Daily Close Reflects Market Uncertainty After CPI Data
Crypto analyst CryptoWzrd began his analysis by noting the ambiguity in recent price action, stating that the daily Bitcoin candle closed indecisively, although it was green. The primary focus of the past week was the traditional weekly candle close following the release of the US CPI data. Meanwhile, the weekly candle also closed without a clear direction, leaving the overall market structure ambiguous.
The analyst defined a clear condition for the rally to continue. BTC’s ability to push higher is entirely dependent upon holding above the $110,500 resistance level. Maintaining this key floor should generate enough positive momentum to boost the market further upside, targeting the major resistance at $120,000 and potentially higher if conviction remains strong.
However, if the price fails to hold $110,500, the market is at risk of declining further. In this scenario, the analyst targets the key technical support level located at $100,000 as the likely floor for the ensuing correction.
Regardless of whether Bitcoin executes a bullish or bearish move, the analyst issued a warning regarding the broader market. During the weekend, most altcoins will not forge their own paths but will instead simply mirror the outcome of Bitcoin’s price action.
The health of the altcoin market is directly linked to Bitcoin Dominance (BTCD), which the analyst observes as neutral on the daily chart. For altcoins to break free of Bitcoin’s gravitational pull and remain positive, the market requires more structural weakness in BTC.D.
On Choppy Price Action & Ongoing Uncertainty
CryptoWzrd concluded the analysis by noting that the intraday chart activity had been “somewhat choppy” throughout the day, suggesting a lack of clear directional momentum in the short term. Despite this recent consolidation, the underlying expectation remains bullish.
Looking ahead, the analyst predicts a further upside move towards the $115,300 resistance in the near future. At this stage, the market has performed its necessary moves, and the next step is simply to wait for the market to play out and confirm the push toward the pivotal $120,000 resistance target.
The US stock market has just achieved a historic milestone, closing at its highest weekly levels ever recorded. The S&P 500 finished the week at 6,791.68 while the US 100 Index reached 25,358.15, both setting new all-time highs.
Easing inflation data, strong corporate earnings, and expectations of Federal Reserve rate cuts have all combined to keep investor sentiment bullish. Amid this record-setting environment, crypto analyst Ash Crypto posted an observation on X that asks the question of how high Bitcoin would trade when it finally catches up to the US stock market.
US Stock Market’s Record-Breaking Momentum
The S&P 500’s record-breaking climb represents a continuation of the stock market’s steady ascent through the second half of the year, which has been boosted by the Fed rate cut in September, expectations of further rate cuts, and confidence in corporate performance.
The tech-heavy US 100 Index led the charge, climbing past 25,000 for the first time ever this week as large-cap technology stocks posted strong quarterly results. This trend means that the long-running bull trend in traditional markets is intact.
However, what is really compelling is the contrast between Wall Street’s all-time highs and Bitcoin’s relative stagnation. After starting October in a breakout move to new all-time highs above $126,000, the leading cryptocurrency went on a flash crash that took many traders by surprise. At the time of writing, Bitcoin is consolidating around $111,000 despite other asset classes showing strength.
Ash Crypto’s post argues that Bitcoin’s price is being artificially held back compared to how stocks have responded to the same macro backdrop. If Bitcoin had followed the percentage gains of the S&P 500 or US 100 Index, it could already be trading between $140,000 and $150,000.
When Bitcoin Finally Catches Up
The first surge of liquidity always appears in the stock market whenever the Fed begins to slow quantitative tightening (QT) or hints at loosening conditions. This is because the stock market is where the deepest capital pools and institutional participation exist. Equities react first because that’s where the credit channels are most established.
Bitcoin is still positioned outside the traditional financial system, and hence, tends to lag this initial move. But once the excess liquidity starts spilling into other assets, Bitcoin’s price has always increased at a much faster pace than stocks. According to Ash Crypto, Bitcoin will catch up soon and hit at least $130,000.
Notably, Bitcoin’s on-chain data is already showing signs of the impending surge. For instance, recent figures show that available sell-side liquidity (the total amount of Bitcoin sitting on exchanges ready to be sold) has dropped to just 3.12 million BTC, its lowest point in seven years. Furthermore, data shows that long-term investors have bought 373,700 BTC in the past 30 days.
At the time of writing, Bitcoin is trading at $111,600.
The Bitcoin price action has been somewhat impressive in 2025, as the flagship cryptocurrency ascended from around $93,300 in early January to its current all-time-high price of $126,000 this month. While the digital asset saw a couple of resets along the way, it continued to put in new highs, reflecting the magnitude of confidence held by its long-term investors.
However, the recent correction seen this October seems to be shaking that confidence, raising questions about the sustainability of Bitcoin’s bull cycle, and if the long-feared bear market is imminent. However, recent on-chain data points to an interestingly brighter outlook than what is currently being experienced by market participants.
Some Relevant BTC On-Chain Levels
In an October 24 post on the X platform, pseudonymous on-chain analyst Arch Physicist highlighted what could be encouraging news for Bitcoin market participants.
The crypto pundit’s analysis was based on the Value Coin-Days Destroyed (VCDD) to Spent Output Profit Ratio (SOPR) metric, which measures the amount of coins that are moved on the blockchain in relation to the potential profits based on their movements. Essentially, this metric is used to locate price zones that can serve as support or resistance.
Arch Physicist highlighted four important readings from the metric, thereafter explaining on the underlying functions of each of them.
The analyst noted:
‘Gamma + Epsilon’ is used to determine structural highs formed due to Long-Term Holder (LTH) profit-taking, with its current value being around $147,937; ‘Delta + Epsilon’ represents support formed by Short-Term Holder (STH) entry opportunities, currently valued at approximately $92,902. Epsilon, on its part, is used to represent potential price floors.
LTH Support Holds As Bitcoin Puts In Highs
Arch Physicist further explained that the metric’s functions are in tandem with Bitcoin’s historical price action. “Bitcoin’s price has broken above the structural high (Gamma + Epsilon) and reached ATHs near Beta during bull runs. It has also historically made ATLs very close to Epsilon,” the analyst said.
Interestingly, the Bitcoin price in this cycle has consistently traded within the support zones established by its LTHs, and the ones by its STHs. However, price seems to be heading towards the lower support zone, which, if breached, could signal the beginning of a bear market. On the other hand, the sustained integrity of the upper support could also be indicating that the bull run has not even started.
As of this writing, the price of BTC stands at approximately $11,890, with no significant movement in the past 24 hours.
Crypto analyst Hov has stated that the macro target for the Dogecoin price remains unchanged despite the recent crypto market crash. This comes as DOGE looks to reclaim the psychological $0.2 level, which could spark a significant rebound for the meme coin.
Macro Target For The Dogecoin Price Remains Above $2
In an X post, the crypto analyst stated that he still has the same macro target for the Dogecoin price. His accompanying chart showed DOGE could rally to $3 by next year, which would mark a new all-time high (ATH) for the altcoin. However, there is the possibility that the meme coin could keep trading sideways till the end of the year.
Meanwhile, Hov noted that the Dogecoin price action had played out as expected, with DOGE correcting off the low and crashing by over 50%. He added that the move did not quite make it into the lower support level, but that so far, the move off the low looks pretty corrective. The meme coin had crashed from a high of around $0.30 last month, recently touching $0.11 amid the crash that followed Trump’s announcement of 100% tariffs on China.
Hov also stated that the focus will be on how the Dogecoin price action develops over the next week to see whether the C-wave corrective move is in. DOGE is currently looking to rebound and reclaim the psychological $0.2 level. This has been sparked by optimism regarding a potential trade deal between the U.S. and China.
The White House has confirmed that U.S. President Donald Trump will meet China’s President Xi Jinping on October 30 at the APEC Summit. Meanwhile, the September CPI, which dropped yesterday, came in lower than expectations, which also contributed to a bounce in the Dogecoin price.
DOGE’s 3rd Bull Wave On The Horizon
Crypto analyst Ether revealed in an X post that the 3rd bull wave is on the horizon for the Dogecoin price. He noted that DOGE experienced two major bull waves in 2017 and 2021 and that another bull wave is now loading. The analyst broke down the current price action, which points to another bull wave.
Ether revealed that the long downtrend has been broken, with the retest now complete. He further remarked that the 25MA on the higher time frame is back at support. Meanwhile, the Dogecoin price is said to be gathering strength in the lower band of a years-long ascending channel. The analyst added that all technical indicators are “whispering” the start of a new cycle. As such, he believes the 3rd bull wave is a matter of when, not if.
At the time of writing, the Dogecoin price is trading at around $0.19, up in the last 24 hours, according to data from CoinMarketCap.
The cryptocurrency market has not had its typical “Uptober” performance so far this month, with most large-cap assets falling to new local lows in the past few months. The Ethereum price, which was on the verge of hitting $5,000 a few weeks ago, is now languishing below the $4,000 mark.
While the “king of altcoins” had a stop-start performance over the past week, its price seems to be in a better place than it was seven days ago. However, an interesting outlook has emerged for the Ethereum price, with the altcoin believed to have already reached its peak in this cycle.
How Feasible Is A Double Top For ETH Price?
Popular crypto analyst Ali Martinez recently took to the social media platform X to share insights into the current setup of the Ethereum price. According to the market pundit, the second-largest cryptocurrency could be in for an extended bearish period over the next few weeks.
This evaluation revolves around the potential formation of the “double top” pattern on the 3-day timeframe of the Ethereum chart. For context, the double top formation is a technical analysis pattern suggesting a possible bearish trend reversal after an asset’s price touches a resistance level without breaking through.
As observed in the chart above, the initial top came around late 2021 during the altcoin season when the price of ETH rose to the then-all-time high of above $4,800. This price peak was followed by a market crash, which saw the value of Ethereum drop to around the $1,000 mark by mid-2026.
Meanwhile, the purported second top of this Ethereum price setup is the current all-time high of $4,946, reached earlier in August 2025. According to data from CoinGecko, the altcoin’s value is currently more than 20% adrift from this record high.
While the two tops (nearly four years) look somewhat identical, the price action between them makes it tricky to definitively call them a “double top” pattern. Moreover, the double top can only be confirmed when the price drops below the support level, which typically is the lowest point between the two peaks. This support level would then be at around $1,000, which is a significant distance from the current price point.
Nevertheless, it is important to pay attention to the price movement of ETH over the next few weeks, as it could provide insight into the coin’s future relative to this setup.
Ethereum Price At A Glance
As of this writing, the price of ETH stands at around $3,983, reflecting an almost 3% jump in the past 24 hours.
Unlike Bitcoin, the Ethereum price has struggled to hold up, and even after the crypto market recovery, the price remains below $4,000, which is a major psychological level. Given this, it seems that the cryptocurrency is set to close the month of October in the red, losing almost 5% of its value already this month. However, with the month of November quickly rolling by, the Ethereum price might be in for a bounce, as November has historically been green for the market.
November Could Hold The Key For Ethereum Price
Looking at the historical price data for Ethereum on the CryptoRank website, there seems to be a balance between years when the month was red and years when it was green. In a decade, there have been five years where the Ethereum price has seen gains in November and five years where there have been losses.
However, there seems to be a rather bullish pattern: the years when the month was green saw double-digit gains, eventually resulting in higher gains than losses. As a result, the average return for the month is 6.93%, and the median return, while low, also remains positive at 1.42%.
Given the fact that there is no clear trend to pinpoint where the price is headed, the bears and the bulls look to have equal chances. But if it does turn out to be in the green, it is likely that the Ethereum price will witness a double-digit surge. Such a move would help it clear the $4,000 resistance with momentum.
Q4 Still Has Potential
Quarterly returns for the Ethereum price have not exactly been the best in the last quarter of the year, but that has not changed the fact that the altcoin tends to perform quite well overall. There is also the trend of Q4 ending in the green if the previous Q2 and Q3 were in the green, which is the case right now.
In Q2 of 2025, the Ethereum price ended with an average positive return of 36.5% and in Q3, it followed with a 66.7% return, the highest so far. With October trending low, there is already a 4.83% decline this year, but with more than 2 months to go, there is still time for things to change.
Only one year in history has the Ethereum price closed Q4 in the red after Q2 and Q3 ended in the green, and that was nine years ago in 2016. Since then, the trend has always seen the ETH price continuing the rally. This was the case back in 2017, and then again in 2020 and 2021.
Since then, this trend has not returned, and 2025 is the first time in four years that the Ethereum price has ended both Q2 and Q3 in the green. If the historical performance holds, the Ethereum price could see an average of a 50% increase, or even double, like it did back in 2017 and 2020, before the year is over.
The popular meme-coin Dogecoin (DOGE) is under mounting stress after a 30 % drop from its September highs, yet a contrarian technical setup suggests that a rebound to the $1 level might still be in play.
While the current environment is dominated by selling pressure and low institutional interest, some chart patterns deserve a closer look.
From Crash to Compression: Dogecoin Under Pressure
Dogecoin’s price tumbled from around $0.3066 to approximately $0.198, marking a dramatic 30 % decline that has shaken short-term holders. On the technical front, DOGE broke below a consolidating upward wedge, and a “death cross” is looming as the 50-day EMA approaches a crossover beneath the 200-day.
Analysts warn this structure has historically signaled deeper losses. Support at $0.1515 is under watch (about 22 % below current levels), while a breakdown under $0.0570 could open the door to an extreme risk scenario (-90 %) riding on a bearish flag on the weekly chart.
Adding to the pressure, the recently-launched DOGE ETF saw only around $30.7 million in assets, far below rival products and suggesting weak institutional demand. The steep 1.5 % expense ratio further dampens its appeal.
Technical Setup: Danger Ahead, But Also Hope
Despite the gloom, Dogecoin exhibits some intriguing longer-term patterns that hint at the possibility of reversal. On one hand, momentum indicators, like MACD and MFI, point to weakening buying strength and growing dominance of sellers. This supports the near-term bearish case.
On the other hand, a long-term ascending channel since 2021 shows DOGE trading near its lower boundary, with the Stochastic RSI at historically low levels, similar to prior pre-rallies.
Analysts highlight that if DOGE can hold key support around $0.19 and break above resistance near $0.30, the path toward $0.50–$1 becomes more plausible. A key resistance point lies near $0.21, often referred to as a “supply wall” due to heavy prior accumulation.
Each time DOGE approaches the resistance level, selling pressure typically increases, causing repeated rejections. Thus, for DOGE to flip the narrative, a clean breakout above $0.21 coupled with volume would be critical.
What Comes Next? Cautiously Optimistic Outlook
In the short term, Dogecoin faces more likely downside or sideways action unless fresh buyer momentum emerges. But if support holds and a breakout occurs, the long-term technical structure suggests upside potential toward the $1 mark.
The scenario isn’t guaranteed, it requires a confirmed reversal, rising volume, and a shift in sentiment. For traders using the 15-minute and 5-minute timeframes (as you focus on), this means watching for a higher-timeframe close above $0.30, plus intra-day volume spikes. Absent that, caution remains justified.
Cover image from ChatGPT, DOGEUSD chart from Tradingview
Cardano (ADA) appears to be preparing for a major rally, as bullish technical signals and network milestones spark renewed optimism among traders.
After months of consolidation, ADA’s price action is forming what analysts describe as a “textbook breakout setup.” The token currently trades around $0.65, below key moving averages, but with indicators pointing toward an imminent reversal.
Cardano’s fundamentals continue to strengthen. The network recently surpassed 115 million transactions, signaling steady ecosystem growth despite broader market weakness. This achievement, combined with the rollout of Cardano domain names and anticipation for the Ouroboros Leios upgrade, builds more confidence.
Technical Indicators Flash Buy as Bulls Regain Control
Technically, ADA is nearing a decisive point. Chart analysts note a falling wedge pattern forming on the daily timeframe, a historically bullish setup that often precedes explosive moves. A break above the $0.79–$0.80 resistance could pave the way for a swift rally toward $1.10, and eventually, the projected $2.50 target.
Momentum oscillators are beginning to turn upward, while futures market open interest is climbing, an indication that institutional traders are re-entering positions.
Golden-cross signals between shorter and longer-term moving averages further validate the bullish bias, suggesting that accumulation is taking place at current levels.
Ecosystem Growth and Institutional Interest Add Momentum
Beyond the charts, Cardano’s ecosystem expansion continues to attract institutional and developer attention.The RWA (Real-World Asset) initiative, valued at over $10 million, and privacy-focused Midnight sidechain airdrops are driving renewed engagement.
Meanwhile, analysts argue that ADA’s low gas fees and ongoing DeFi integrations position it as a strong alternative to Ethereum for scalable applications.
Experts predict that if ADA breaks through resistance levels and maintains momentum, the path toward $2.50 or even $3.00 could unfold over the next market cycle.
While short-term volatility may persist, the combination of strong fundamentals, bullish technicals, and growing institutional confidence make Cardano one of the most stable assets in the crypto space in Q4 2025.
The financial world is witnessing an unprecedented shift, as Ethereum solidifies its position as the sole asset capable of becoming a multi-trillion-dollar institutional store of value. ETH is the only one currently demonstrating the scale, utility, and institutional acceptance to command and securely hold multi-trillion-dollar allocations, fundamentally redefining the future of global wealth preservation and growth.
Why Ethereum Is The Foundational Role For Institutional Capital
Ethereum has quietly become the final form of digital trust for institutions to store trillions of dollars. A market expert and entrepreneur, partnering with OKX and MEXC, Ted Pillows, has stated on the social media platform X that ETH decentralization is nearly impossible to replicate, a network that was largely community-funded, not VC-funded, and forged through proof-of-work (PoW).
Furthermore, the reliability of ETH has been 100% uptime over 10 years of flawless operation and 16 successful upgrades. The ETH Layer 1 and Layer 2 architectures are designed to offer regulatory safety, where institutions can deploy compliant solutions. Meanwhile, the KYC-enabled Layer 2s do not compromise on the fundamental decentralization or security of the leading ETH blockchain.
Maintaining A Buffer For Market Opportunities
While Ethereum is a safe place for institutional investors to store trillions of dollars, analyst Luca has noted that the ETH price has shown strength as it bounced off the Weekly Bull Market Support Band, which has previously acted as a strong reversal over several weeks. This level also aligns with the high-timeframe support area marked in green, the same zone that served as a major resistance throughout most of 2024.
Luca believes that due to this confluence, and as long as the price holds above this range, the broader market structure will continue to favor the upside. However, ETH still faces a critical test ahead. Until it breaks above the golden pocket between the 0.5 and 0.618 Fibonacci retracement Point of Interest (POIs), the same zone that triggered the last rejection, the analyst highlighted that the best approach is to stay somewhat cautious. He also added that investors should be ready for further consolidation within the high-timeframe accumulation range.
As Luca has highlighted, the priority now is risk management. Avoid unnecessary leverage, don’t overexpose on short-term setups, and maintain a diversified portfolio with moderate exposure to defensive sectors. This will help ride out the volatility as ETH moves closer to the top of the cycle. While advocating for a cash buffer, the expert noted that if ETH breaks below the Weekly Bull Market Support Band, it would signal a potential deeper downside and justify hedging part of spot holdings to mitigate short-term risk.
Ethereum is struggling to push above the $4,000 level, as market sentiment remains uncertain and volatility keeps investors cautious. Despite several attempts, bulls have failed to sustain momentum, suggesting hesitation at key resistance levels. However, new on-chain data is drawing attention to potentially large-scale liquidity moves that could influence Ethereum’s next direction.
According to Lookonchain, an Ethereum OG holding 736,316 ETH (worth approximately $2.89 billion) recently deposited $500 million USDT into the vaults launched by ConcreteXYZ and Stable, just before their official announcement. This has sparked significant curiosity across the crypto community, as the transaction appears strategically timed and could signal preparation for major yield or liquidity activity.
ConcreteXYZ is a next-generation liquidity protocol designed to connect institutional and DeFi capital through tokenized vaults. It allows users to allocate stablecoins and crypto assets into yield-bearing strategies while maintaining full transparency and composability within the Ethereum ecosystem.
The whale’s massive deposit — preceding the public reveal — suggests potential insider positioning or high-conviction participation in these vaults. Such large inflows often act as early indicators of shifting liquidity dynamics, particularly when aligned with projects positioned at the intersection of DeFi infrastructure and institutional finance.
Whale Dominance in Aave and Stablecoin Vaults Raises Strategic Questions
According to Lookonchain, the same Ethereum OG who recently interacted with ConcreteXYZ and Stable deposited 300,000 ETH into Aave and borrowed $500 million USDT. Out of the total $775 million USDT deposited across the new vaults, this single whale accounted for 64.5% of the total liquidity, underscoring their dominant role in this sudden market activity.
This move represents a sophisticated on-chain strategy often seen among experienced whales. By supplying ETH as collateral on Aave — one of the largest decentralized lending protocols — and borrowing USDT against it, the whale effectively unlocks liquidity without selling their Ethereum holdings. This allows them to deploy large sums into yield opportunities, such as the newly launched ConcreteXYZ vaults, while retaining exposure to ETH’s long-term upside.
Such a concentration of liquidity from one entity can have several implications for the broader market. On one hand, it highlights growing confidence among deep-pocketed players in the DeFi ecosystem’s stability and profitability. On the other hand, it raises questions about market influence and systemic risk, since a single participant holds such a large portion of capital inflows.
If this borrowed liquidity is used for yield farming or strategic positioning rather than short-term speculation, it could reinforce Ethereum’s ecosystem fundamentals by increasing DeFi activity and on-chain engagement. However, if market conditions deteriorate and collateral values fall, liquidations could amplify volatility.
In essence, this massive Aave–ConcreteXYZ transaction demonstrates how whales leverage DeFi infrastructure to maintain dominance, optimize liquidity, and influence ecosystem-wide capital flows — making this one of the most significant on-chain moves of the quarter.
Ethereum Rebounds but Faces Resistance Near $4,000
Ethereum’s price is currently trading around $3,964, showing signs of a modest rebound after recent volatility. The daily chart indicates that ETH has been attempting to recover from its October lows. But remains trapped below key resistance at $4,000–$4,200, where both the 50-day and 100-day moving averages converge. This is a zone that often acts as a strong rejection area during consolidation phases.
Despite short-term gains, Ethereum’s broader structure still reflects uncertainty. The 200-day moving average, sitting near $3,200, continues to provide strong dynamic support, preventing a deeper breakdown. However, the inability to break above $4,000 has left the asset vulnerable to renewed selling pressure if momentum weakens.
Volume patterns suggest limited conviction among buyers, as each rally attempt has been met with fading strength. To regain a sustainable bullish outlook, Ethereum needs a decisive close above $4,200. This would signal a potential continuation toward $4,500 and higher. Conversely, failure to reclaim that range could lead to a retest of $3,600–$3,500.
Featured image from ChatGPT, chart from TradingView.com
Dogecoin is once again under pressure as bears tighten their hold, keeping the price pinned below key resistance levels. Despite the ongoing consolidation, one crucial support zone is beginning to show signs of strength, hinting that a potential reversal could be on the horizon if buyers step in at the right moment.
Momentum Hinges On RSI and BTC Dominance Levels
Umair Crypto, in his latest update on Dogecoin, noted that the meme coin is currently consolidating just beneath the 200-day Simple Moving Average (SMA), forming what appears to be a clear bearish setup. According to Umair, the structure suggests that the price could soon face rejection from this critical moving average, a move that may trigger a decline toward the $0.15 region, or potentially even lower if selling pressure intensifies.
Despite the bearish tone, Umair highlighted that the $0.15 zone remains a crucial area of interest for buyers. He explained that this region could act as a strong bounce zone if the expected rejection occurs, offering the bulls a chance to defend the key support and potentially ignite a recovery from oversold conditions.
On a more optimistic note, Umair pointed out that a recovery above the daily RSI trendline could change the short-term outlook for DOGE and fuel a move above the 200-day SMA, opening the door for renewed bullish momentum. However, Umair maintained a cautious stance for now until there’s a confirmed decline in Bitcoin dominance (BTC.D) below 59%. This shift would likely mark the beginning of a more sustainable upward phase, including Dogecoin.
Dogecoin Regains Stability After Recent Correction
In a more recent market update, BitGuru highlighted that Dogecoin is starting to display early signs of a potential recovery following its recent correction phase. After facing sustained downward pressure, the popular meme coin seems to be regaining some stability as its price action begins to level out.
BitGuru pointed out that DOGE has managed to hold firmly near a key support level despite recent volatility. This steady price action near the base suggests that buyers are gradually stepping back in, showing confidence in the asset’s long-term potential. The chart structure is beginning to curve upward, which often precedes a breakout or a notable shift in market sentiment
He further explained that if this early momentum continues to develop, Dogecoin could be preparing for a breakout toward the $0.22–$0.25 range. A successful move in that direction would mark a meaningful recovery from its previous decline and could spark renewed interest from traders.
Despite the slow momentum, a technical analysis shared by the crypto analyst known as ChartNerd on X suggests that XRP could be preparing for a massive breakout that could take it from current levels toward a long-term target above $27. The analysis is supported by a chart showing multiple confluences aligning in favor of such a large-scale move.
XRP Technical Analysis Points To Rally
According to ChartNerd’s chart, XRP has now completed a symmetrical triangle breakout pattern that has been forming for several years. This breakout is occurring above a multi-year ascending support line that dates back to 2017. The chart also shows an important resistance block that previously capped XRP’s price during earlier bull runs in 2017 and 2021.
XRP broke above this resistance block months ago, but recently retested it during last week’s flash crash. Its rebound from this resistance block reinforces the idea that XRP is about to bounce massively. The breakout from this long-term consolidation zone, combined with the multi-year ascending trendline, provides the technical foundation for a potential move toward much higher price targets.
Another important confirmation that occurred during the flash crash was the successful retest of the 3-month 10 EMA. This retest serves as a validation point for the recent breakout, showing that XRP is maintaining its structure on higher timeframes. Furthermore, the analysis shows that XRP has reclaimed the Gaussian Channel upper regression line, which represents long-term trend momentum.
This alignment of the EMA retest with the Gaussian Channel suggests strong bullish momentum is beginning to build. ChartNerd refers to this convergence of multiple indicators as a “confluence zone.”
Fibonacci Extension Targets From $8 To $27
The analysis concludes with a clearly defined Fibonacci extension roadmap that outlines XRP’s next price objectives. ChartNerd’s Fibonacci levels place the first major target at $8.47, corresponding to the 1.272 extension, followed by $13.78 at the 1.414 level, and finally the 1.618 extension at $27.70.
This sequence implies a full technical replication of XRP’s bull run in 2017, scaled to its current breakout structure. Back then, XRP hit all three Fibonacci extensions from the previous low after breaking above a similar resistance block.
If these projections materialize, XRP could experience its most significant rally in years. The move toward $27 could unfold in one of two ways: either through a strong, near-vertical surge similar to the explosive rally of 2017 or through a series of measured advances highlighted by corrections at each resistance level. Nonetheless, both scenarios have the same bullish structure.
At the time of writing, XRP is trading at $2.44, up by 1.4% in the past 24 hours.
Has the bitcoin price finally broken away from its four-year cycle pattern, or is this bull market already entering exhaustion? By studying historical growth rates, liquidity data, and macroeconomic correlations, we can better understand whether the current cycle has truly diverged, and what that means for investors in the months ahead.
Bitcoin Price Cycle Duration
Analyzing BTC Growth Since Cycle Lows, we can see that Bitcoin has now officially surpassed the elapsed time from cycle low to cycle high seen in previous bull markets. The 2018–2022 cycle peaked 1,059 days after its prior bear market low, and the current cycle has now moved beyond that duration. If we average the elapsed time across the last two full market cycles, Bitcoin has already exceeded the historical mean and is on the verge of surpassing even the 2017 cycle length in the coming days.
Figure 1: BTC Growth Since Cycle Lows illustrates that the duration of the current cycle is surpassing the previous two 4-year cycles.View Live Chart
Diminishing Impact on Bitcoin Price
Historically, Bitcoin’s four-year cycle was rooted in its halving events, where the block reward, and thus the inflation rate, was cut in half. Each halving triggered a sharp supply shock, driving major bull markets. However, this cycle has behaved differently. Following the most recent halving, Bitcoin experienced five months of sideways consolidation rather than the explosive post-halving rallies seen previously. While price has since made notable gains, momentum has been weaker, leading many to ask whether the halving has lost its influence.
Figure 2: Bitcoin’s Circulating Supply and the diminishing marginal inflation impact.View Live Chart
With the current Circulating Supply already exceeding 95% of the 21 million ultimate total supply of Bitcoin, the marginal supply reduction may no longer be as significant. Today, miners distribute roughly 450 newly created BTC per day, an amount easily absorbed by a handful of institutional buyers or ETFs. That means the halving alone may no longer be the dominant driver of Bitcoin’s market cycles.
Global Liquidity Cycles Driving the Bitcoin Price
When we view Global M2 Money Supply versus BTC on a year-on-year basis, a clear pattern emerges. Each major Bitcoin bottom has aligned almost perfectly with the trough of Global M2 liquidity growth.
Figure 3: Global M2 versus BTC (YoY) has historically aligned practically perfectly.View Live Chart
If we map the Bitcoin halvings and the M2 troughs side by side, we see that halvings typically lag the liquidity cycle, suggesting that liquidity expansion, not halving events, may be the true catalyst for Bitcoin’s rallies. This isn’t unique to Bitcoin. Gold has shown the same behavior for decades, with its price performance closely mirroring the rate of Global M2 expansion or contraction.
Inverse Correlations Shaping Bitcoin Price Trends
A key part of this liquidity story lies in the U.S. Dollar Strength Index (DXY). Historically, BTC versus DXY on a year-on-year basis has been almost perfectly inversely correlated. When the dollar strengthens year-on-year, Bitcoin tends to enter bear market conditions. When the dollar weakens, Bitcoin begins a new bull market. This inverse relationship also holds true for Gold and equity markets, underscoring the broader debasement cycle thesis that as fiat currencies lose purchasing power, hard assets rapidly appreciate.
Figure 4: BTC vs. DXY (YoY) and the strong inverse correlation with major market turns.View Live Chart
Currently, the DXY has been in a short-term uptrend, coinciding with Bitcoin’s recent consolidation. However, the index is now approaching a key historical resistance zone, one that has previously marked major turning points and preceded prolonged DXY declines. If this pattern holds, the next major drop in dollar strength could trigger a renewed upcycle for Bitcoin.
Quantitative Tightening and the Bitcoin Price
Comments from Federal Reserve Chair Jerome Powell recently hinted that the era of balance sheet contraction (quantitative tightening) may be nearing an end. Looking at the Fed Balance Sheet versus BTC, the start of balance sheet expansion and renewed quantitative easing has historically coincided with major upward moves in Bitcoin and equity markets alike.
Figure 5: Fed Balance Sheet inflection points historically align with Bitcoin bull cycle expansions.View Live Chart
During the two years following previous Fed balance sheet expansions, the S&P 500 averaged a 47% return, more than five times the average two-year performance during neutral periods. If we are indeed entering a new easing phase, it could not only prolong Bitcoin’s current cycle but also set the stage for a liquidity-driven melt-up across risk assets.
Conclusion: The Evolving Bitcoin Price Cycle
Bitcoin has now outlasted the timeframes of its previous two cycles, leading many to question whether the four-year rhythm still applies. But when we step back, a different narrative emerges, one driven not by programmed scarcity, but by Global liquidity, fiat debasement, and macro capital flow. The “four-year cycle” may not be broken, but it may have simply evolved.
If the U.S. Dollar weakens, the Fed pauses tightening, and Global M2 growth accelerates, then Bitcoin likely still has room to run. For now, as always, the best approach remains the same: react, don’t predict. Stay data-driven, stay patient, and keep your eyes on liquidity.
Disclaimer: This article is for informational purposes only and should not be considered financial advice. Always do your own research before making any investment decisions.
Cryptocurrencies including Bitcoin, Ethereum, BNB, Solana, and XRP traded higher and then pared gains.
Sentiment improved with the release of the US Consumer Price Index (CPI) report, but prices failed to rally.
Analysts say the CPI data makes a Federal Reserve rate cut on October 29 “highly probable”.
Major cryptocurrencies including Bitcoin, Ethereum, BNB, Solana, and XRP have maintained steady prices despite Wall Street’s robust reaction to a key economic data release.
As such, the cryptocurrency market was largely muted on Friday October 24, 2025, with an initial price spike following the release of the US Consumer Price Index (CPI) report failing to flip into notable gains.
While several coins traded in the green, the subdued action meant the global crypto market capitalization, per CoinGecko, remained at $3.81 trillion.
Sentiment was still largely negative as the Fear & Greed index hovered at 32 and was in fear territory.
Meanwhile, global daily trading volume slipped to $153 billion.
Bitcoin, Ethereum prices as investors react to CPI data
The Bureau of Labor Statistics released the US CPI inflation report for September on Friday.
Data showed inflation was cooler than expected, with headline CPI at 0.3% and core inflation at 0.2%.
Meanwhile, both year-over-year measures for headline and core came in at 3%.
Economist Mohamed El-Erian commented on what the data says:
“This report makes a Federal Reserve rate cut next week highly probable. What happens beyond that, however, will depend on subsequent data, primarily confirmation of a softening labor market and continued disinflation.”
Stocks however, soared amid the report and a host of other bullish factors.
Bitcoin traded to highs of $111,842 before quickly retreating to $110,500.
Ethereum on the other hand, rose slightly to near $4,000 before revisiting $3,870 and settling just above $3,900.
Despite the cooling inflation data, analysts see a 99% likelihood of a Federal Reserve rate cut on October 29.
This will feed into risk asset appeal and both BTC and ETH could rally past key supply walls around $115k and $4,250.
BNB steady after Changpeng Zhao pardon
BNB, the native token of Binance, has maintained its price at $1,106, with negligible movement post-CPI.
The token is benefiting from Binance’s dominance in spot trading, and the news of President Donald Trump’s pardon of founder Changpeng Zhao buoyed the broader market.
Congratulations to my friend @cz_binance. Trump has corrected a grave injustice. The weaponization of the justice department against our industry and its entrepreneurs should have never happened. It was and still is a deep wound that will take a long time to heal https://t.co/OirXN3fSZC