❌

Reading view

Dogecoin (DOGE) Cools Off β€” Buyers Struggle To Sustain Recovery Above Key Levels

Dogecoin struggled to rise above $0.210 and corrected some gains against the US Dollar. DOGE is now consolidating and might decline below $0.1980.

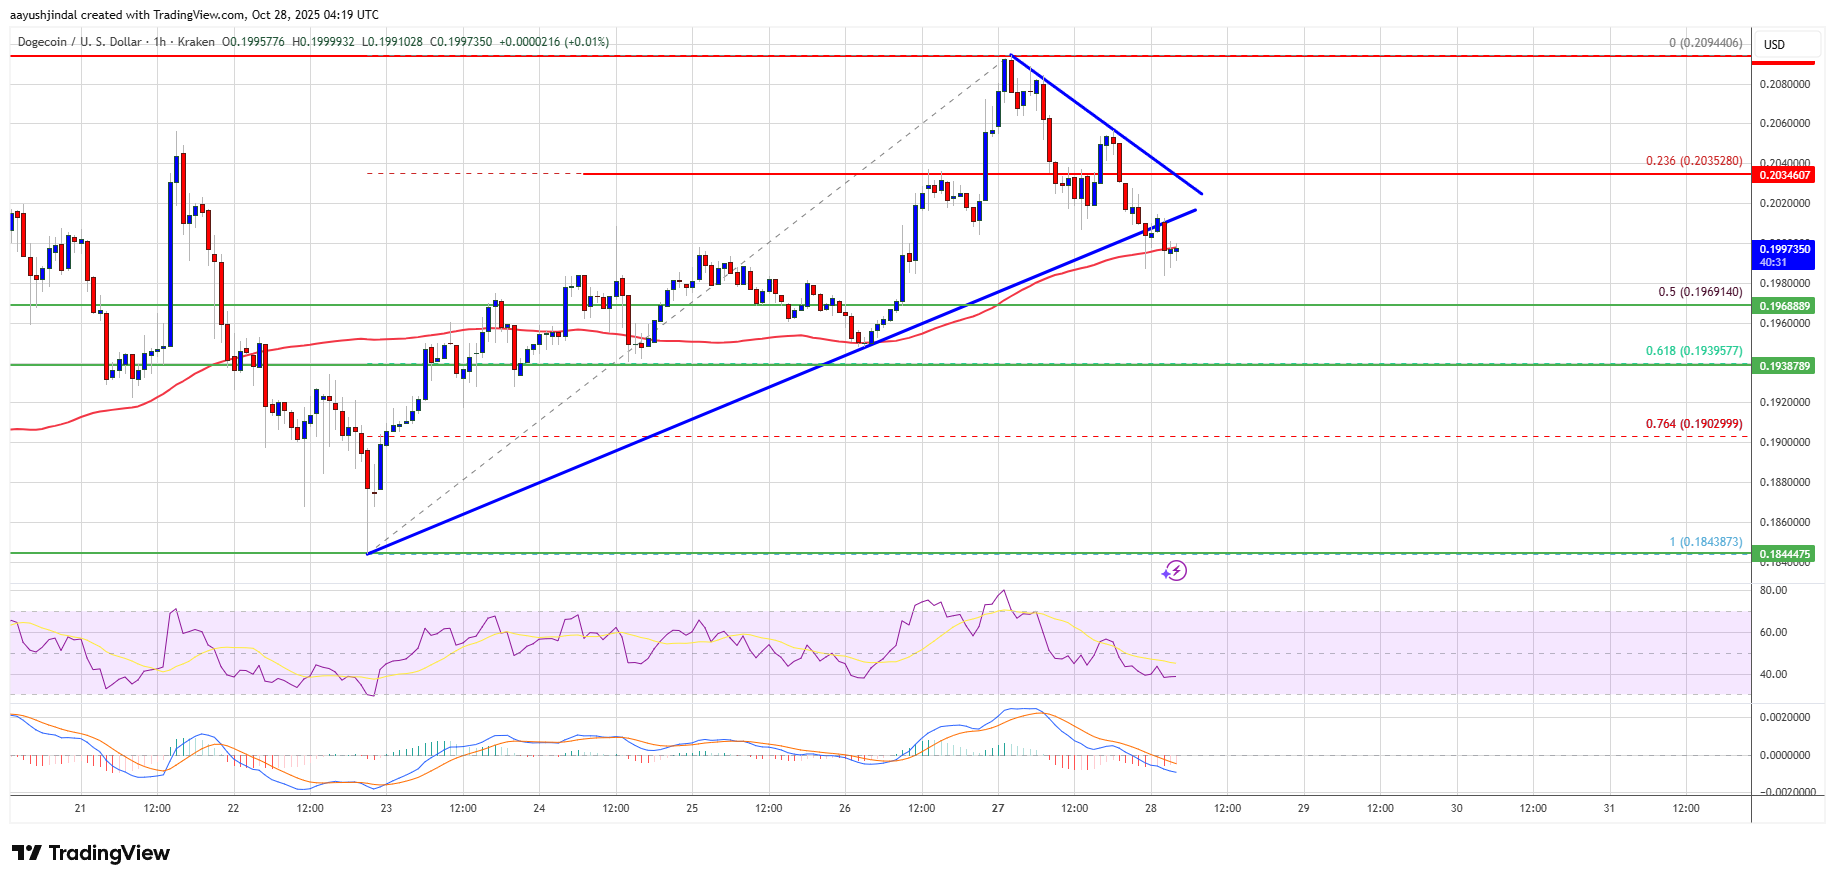
  • DOGE price started a fresh downside correction below $0.2035.
  • The price is trading below the $0.20 level and the 100-hourly simple moving average.
  • There was a break below a contracting triangle with support at $0.20 on the hourly chart of the DOGE/USD pair (data source from Kraken).
  • The price could aim for a fresh increase if it remains stable above $0.1940.

Dogecoin Price Starts Another Pullback

Dogecoin price started a fresh increase after it settled above $0.1920, like Bitcoin and Ethereum. DOGE climbed above the $0.20 resistance to enter a positive zone.

The bulls were able to push the price above $0.2020 and $0.2050. A high was formed at $0.2094 and the price is now correcting gains. There was a move below the 23.6% Fib retracement level of the upward move from the $0.1843 swing low to the $0.2094 high.

Besides, there was a break below a contracting triangle with support at $0.20 on the hourly chart of the DOGE/USD pair. Dogecoin price is now trading below the $0.20 level and the 100-hourly simple moving average.

Dogecoin Price

If there is another increase, immediate resistance on the upside is near the $0.2020 level. The first major resistance for the bulls could be near the $0.2050 level. The next major resistance is near the $0.210 level. A close above the $0.210 resistance might send the price toward $0.2150. Any more gains might send the price toward $0.2250. The next major stop for the bulls might be $0.2320.

More Losses In DOGE?

If DOGE’s price fails to climb above the $0.2020 level, it could start a downside correction. Initial support on the downside is near the $0.1970 level and the 50% Fib retracement level of the upward move from the $0.1843 swing low to the $0.2094 high. The next major support is near the $0.1935 level.

The main support sits at $0.190. If there is a downside break below the $0.190 support, the price could decline further. In the stated case, the price might slide toward the $0.1840 level or even $0.1780 in the near term.

Technical Indicators

Hourly MACD – The MACD for DOGE/USD is now gaining momentum in the bearish zone.

Hourly RSI (Relative Strength Index) – The RSI for DOGE/USD is now below the 50 level.

Major Support Levels – $0.1970 and $0.1935.

Major Resistance Levels – $0.2020 and $0.2050.

XRP Price Prediction: Consolidation Persists β€” Bulls Need Fresh Push For Breakout

XRP price started a fresh increase above $2.50. The price is now showing positive signs and might rise further if it clears the $2.6880 resistance.

  • XRP price gained pace for a move above $2.50 and $2.550.
  • The price is now trading above $2.50 and the 100-hourly Simple Moving Average.
  • There is a bullish trend line forming with support at $2.60 on the hourly chart of the XRP/USD pair (data source from Kraken).
  • The pair could start a fresh increase if it clears the $2.6880 resistance.

XRP Price Holds Support

XRP price started a fresh increase after it settled above $2.40, like Bitcoin and Ethereum. The price surpassed the $2.420 and $2.50 resistance levels.

The bulls were able to push the price above $2.550 and $2.65. A high was formed at $2.6972 and the price is now consolidating gains above the 23.6% Fib retracement level of the recent move from the $2.327 swing low to the $2.6972 high.

The price is now trading below $2.60 and the 100-hourly Simple Moving Average. There is a bullish trend line forming with support at $2.60 on the hourly chart of the XRP/USD pair.

XRP Price

If there is a fresh upward move, the price might face resistance near the $2.650 level. The first major resistance is near the $2.6880 level, above which the price could rise and test $2.70. A clear move above the $2.70 resistance might send the price toward the $2.7650 resistance. Any more gains might send the price toward the $2.80 resistance. The next major hurdle for the bulls might be near $2.880.

Downside Correction?

If XRP fails to clear the $2.6880 resistance zone, it could start a fresh decline. Initial support on the downside is near the $2.60 level. The next major support is near the $2.5650 level.

If there is a downside break and a close below the $2.5650 level, the price might continue to decline toward $2.5120 or the 50% Fib retracement level of the recent move from the $2.327 swing low to the $2.6972 high. The next major support sits near the $2.4680 zone, below which the price could continue lower toward $2.420.

Technical Indicators

Hourly MACD – The MACD for XRP/USD is now losing pace in the bullish zone.

Hourly RSI (Relative Strength Index) – The RSI for XRP/USD is now above the 50 level.

Major Support Levels – $2.60 and $2.580.

Major Resistance Levels – $2.650 and $2.6880.

Ethereum Supported On Dips β€” Buyers Build Strength For Next Leg Higher

Ethereum price started a decent increase above $4,000. ETH is consolidating gains and could aim for more gains above the $4,220 resistance.

  • Ethereum started a fresh upward move above $4,000 and $4,120.
  • The price is trading above $4,080 and the 100-hourly Simple Moving Average.
  • There is a bullish trend line forming with support at $4,055 on the hourly chart of ETH/USD (data feed via Kraken).
  • The pair could continue to move up if it trades above $4,200.

Ethereum Price Holds Gains

Ethereum price started a steady upward move above the $3,880 zone, like Bitcoin. ETH price surpassed the $4,000 and $4,120 levels to enter a short-term positive zone.

The price even spiked above $4,200. A high was formed at $4,252 and the price is now consolidating gains. There was a minor decline below the 23.6% Fib retracement level of the recent wave from the $3,708 swing low to the $4,252 high.

Ethereum price is now trading above $4,080 and the 100-hourly Simple Moving Average. Besides, there is a bullish trend line forming with support at $4,055 on the hourly chart of ETH/USD.

Ethereum Price

On the upside, the price could face resistance near the $4,180 level. The next key resistance is near the $4,200 level. The first major resistance is near the $4,250 level. A clear move above the $4,250 resistance might send the price toward the $4,320 resistance. An upside break above the $4,320 region might call for more gains in the coming sessions. In the stated case, Ether could rise toward the $4,480 resistance zone or even $4,500 in the near term.

Another Pullback In ETH?

If Ethereum fails to clear the $4,200 resistance, it could start a fresh decline. Initial support on the downside is near the $4,080 level. The first major support sits near the $4,050 zone and the trend line.

A clear move below the $4,050 support might push the price toward the $3,980 support or the 50% Fib retracement level of the recent wave from the $3,708 swing low to the $4,252 high. Any more losses might send the price toward the $3,840 region in the near term. The next key support sits at $3,780.

Technical Indicators

Hourly MACD – The MACD for ETH/USD is losing momentum in the bullish zone.

Hourly RSI – The RSI for ETH/USD is now below the 50 zone.

Major Support Level – $4,050

Major Resistance Level – $4,200

Bitcoin Trades Sideways β€” Consolidation Above Support Could Fuel Next Upside

Bitcoin price is consolidating gains above $113,500. BTC could rise further if there is a clear move above the $115,750 resistance.

  • Bitcoin started a fresh upward move above the $114,000 resistance level.
  • The price is trading above $114,200 and the 100 hourly Simple moving average.
  • There is a bullish trend line forming with support at $113,900 on the hourly chart of the BTC/USD pair (data feed from Kraken).
  • The pair might continue to move up if it trades above the $115,750 zone.

Bitcoin Price Starts Consolidation

Bitcoin price formed a base and started a fresh increase above the $112,500 zone. BTC gained pace for a move above the main hurdle at $113,500.

It opened the doors for a move above $115,000 and the 100 hourly Simple moving average. Finally, the price spiked above $116,000 and is currently consolidating gains above the 23.6% Fib retracement level of the recent wave from the $106,718 swing low to the $116,309 high.

Besides, there is a bullish trend line forming with support at $113,900 on the hourly chart of the BTC/USD pair. Bitcoin is now trading above $114,000 and the 100 hourly Simple moving average.

Bitcoin Price

Immediate resistance on the upside is near the $115,000 level. The first key resistance is near the $115,500 level. The next resistance could be $115,750. A close above the $115,750 resistance might send the price further higher. In the stated case, the price could rise and test the $116,300 resistance. Any more gains might send the price toward the $117,500 level. The next barrier for the bulls could be $118,000.

Another Pullback In BTC?

If Bitcoin fails to rise above the $115,500 resistance zone, it could start a fresh decline. Immediate support is near the $114,000 level. The first major support is near the $113,500 level or the trend line.

The next support is now near the $111,000 zone. Any more losses might send the price toward the $110,500 support in the near term. The main support sits at $108,500, below which BTC might struggle to recover in the short term.

Technical indicators:

Hourly MACD – The MACD is now gaining pace in the bullish zone.

Hourly RSI (Relative Strength Index) – The RSI for BTC/USD is now above the 50 level.

Major Support Levels – $114,000, followed by $113,500.

Major Resistance Levels – $115,500 and $116,500.

Solana (SOL) Strengthens β€” Gradual Gains Indicate Renewed Demand From Buyers

Solana started a fresh increase above the $200 zone. SOL price is now consolidating above $200 and might aim for more gains above the $208 zone.

  • SOL price started a fresh upward move above the $188 and $195 levels against the US Dollar.
  • The price is now trading above $200 and the 100-hourly simple moving average.
  • There is a bullish trend line forming with support at $198 on the hourly chart of the SOL/USD pair (data source from Kraken).
  • The pair could extend gains if it clears the $208 resistance zone.

Solana Price Jumps Again Above $200

Solana price started a decent increase after it settled above the $180 zone, like Bitcoin and Ethereum. SOL climbed above the $188 level to enter a short-term positive zone.

The price even smashed the $198 resistance. The bulls were able to push the price above $200. The price is now consolidating gains above the 23.6% Fib retracement level of the recent upward move from the $177 swing low to the $204 high.

Solana is now trading above $200 and the 100-hourly simple moving average. Besides, there is a bullish trend line forming with support at $198 on the hourly chart of the SOL/USD pair.

Solana Price

On the upside, the price is facing resistance near the $205. The next major resistance is near the $208 level. The main resistance could be $212. A successful close above the $212 resistance zone could set the pace for another steady increase. The next key resistance is $225. Any more gains might send the price toward the $232 level.

Another Pullback In SOL?

If SOL fails to rise above the $205 resistance, it could start another decline. Initial support on the downside is near the $198 zone and the trend line. The first major support is near the $192 level and the 50% Fib retracement level of the recent upward move from the $177 swing low to the $204 high.

A break below the $192 level might send the price toward the $184 support zone. If there is a close below the $184 support, the price could decline toward the $180 support in the near term.

Technical Indicators

Hourly MACD – The MACD for SOL/USD is gaining pace in the bullish zone.

Hourly Hours RSI (Relative Strength Index) – The RSI for SOL/USD is above the 50 level.

Major Support Levels – $198 and $184.

Major Resistance Levels – $205 and $208.

XRP Price Gains Traction β€” Buyers Pile In Ahead Of Key Technical Breakout

XRP price started a fresh increase above $2.45. The price is now showing positive signs and might rise further if it clears the $2.680 resistance.

  • XRP price is attempting a fresh increase above the $2.50 zone.
  • The price is now trading above $2.50 and the 100-hourly Simple Moving Average.
  • There is a bullish trend line forming with support at $2.580 on the hourly chart of the XRP/USD pair (data source from Kraken).
  • The pair could start a fresh increase if it clears the $2.680 resistance.

XRP Price Eyes Steady Increase

XRP price formed a base above $2.320 and started a fresh increase, like Bitcoin and Ethereum. The price surpassed the $2.380 and $2.450 resistance levels.

The bulls were able to push the price above $2.50 and $2.55. A high was formed at $2.668 and the price is now consolidating gains above the 23.6% Fib retracement level of the recent wave from the $2.327 swing low to the $2.668 high.

The price is now trading below $2.50 and the 100-hourly Simple Moving Average. There is a bullish trend line forming with support at $2.580 on the hourly chart of the XRP/USD pair.

XRP Price

If there is a fresh upward move, the price might face resistance near the $2.660 level. The first major resistance is near the $2.680 level, above which the price could rise and test $2.750. A clear move above the $2.750 resistance might send the price toward the $2.80 resistance. Any more gains might send the price toward the $2.920 resistance. The next major hurdle for the bulls might be near $2.950.

Are Dips Supported?

If XRP fails to clear the $2.680 resistance zone, it could start a fresh decline. Initial support on the downside is near the $2.60 level. The next major support is near the $2.580 level.

If there is a downside break and a close below the $2.580 level, the price might continue to decline toward $2.50 or the 50% Fib retracement level of the recent wave from the $2.327 swing low to the $2.668 high. The next major support sits near the $2.450 zone, below which the price could continue lower toward $2.40.

Technical Indicators

Hourly MACD – The MACD for XRP/USD is now gaining pace in the bullish zone.

Hourly RSI (Relative Strength Index) – The RSI for XRP/USD is now above the 50 level.

Major Support Levels – $2.60 and $2.580.

Major Resistance Levels – $2.660 and $2.680.

Ethereum Moves Higher β€” Buyers Strengthen Grip Amid Renewed Market Optimism

Ethereum price started a recovery wave above $4,000. ETH is moving higher but faces a couple of key hurdles near $4,220 and $4,250.

  • Ethereum started a fresh recovery above $4,000 and $4,120.
  • The price is trading above $4,120 and the 100-hourly Simple Moving Average.
  • There is a bullish trend line forming with support at $4,050 on the hourly chart of ETH/USD (data feed via Kraken).
  • The pair could continue to move up if it trades above $4,220.

Ethereum Price Eyes Steady Gains

Ethereum price started a minor recovery wave above the $3,880 zone, like Bitcoin. ETH price surpassed the $4,000 and $4,050 levels to enter a short-term positive zone.

The price even spiked above $4,220. A high was formed at $4,225 and the price is now consolidating gains. The price is stable above the 23.6% Fib retracement level of the recent increase from the $3,708 swing low to the $4,225 high.

Ethereum price is now trading above $4,150 and the 100-hourly Simple Moving Average. Besides, there is a bullish trend line forming with support at $4,050 on the hourly chart of ETH/USD.

Ethereum Price

On the upside, the price could face resistance near the $4,220 level. The next key resistance is near the $4,250 level. The first major resistance is near the $4,320 level. A clear move above the $4,320 resistance might send the price toward the $4,450 resistance. An upside break above the $4,450 region might call for more gains in the coming sessions. In the stated case, Ether could rise toward the $4,500 resistance zone or even $4,550 in the near term.

Another Decline In ETH?

If Ethereum fails to clear the $4,220 resistance, it could start a fresh decline. Initial support on the downside is near the $4,150 level. The first major support sits near the $4,120 zone.

A clear move below the $4,120 support might push the price toward the $4,050 support. Any more losses might send the price toward the $4,000 region in the near term. The next key support sits at $3,880.

Technical Indicators

Hourly MACD – The MACD for ETH/USD is gaining momentum in the bullish zone.

Hourly RSI – The RSI for ETH/USD is now above the 50 zone.

Major Support Level – $4,120

Major Resistance Level – $4,220

Bitcoin Accelerates Higher As Bulls Target Break Above $115,500 Resistance

Bitcoin price is attempting to recover above $113,500. BTC could rise further if there is a clear move above the $115,500 resistance.

  • Bitcoin started a fresh recovery wave above the $113,500 resistance level.
  • The price is trading above $114,000 and the 100 hourly Simple moving average.
  • There is a bullish trend line forming with support at $113,350 on the hourly chart of the BTC/USD pair (data feed from Kraken).
  • The pair might continue to move up if it trades above the $115,500 zone.

Bitcoin Price Starts Fresh Increase

Bitcoin price declined again below the $108,000 level. BTC tested the $106,720 zone and recently started a fresh increase. There was a move above the $112,000 resistance level.

The bulls were able to pump the price above $113,500 and the 100 hourly Simple moving average. Finally, the price spiked above $115,000 and is currently consolidating gains above the 23.6% Fib retracement level of the recent wave from the $106,718 swing low to the $115,400 high.

Besides, there is a bullish trend line forming with support at $113,350 on the hourly chart of the BTC/USD pair. Bitcoin is now trading above $114,000 and the 100 hourly Simple moving average.

Bitcoin Price

Immediate resistance on the upside is near the $115,250 level. The first key resistance is near the $115,500 level. The next resistance could be $116,200. A close above the $116,200 resistance might send the price further higher. In the stated case, the price could rise and test the $117,000 resistance. Any more gains might send the price toward the $118,000 level. The next barrier for the bulls could be $118,800.

Another Pullback In BTC?

If Bitcoin fails to rise above the $115,500 resistance zone, it could start a fresh decline. Immediate support is near the $114,000 level. The first major support is near the $113,500 level or the trend line.

The next support is now near the $111,000 zone. Any more losses might send the price toward the $110,500 support in the near term. The main support sits at $108,500, below which BTC might struggle to recover in the short term.

Technical indicators:

Hourly MACD – The MACD is now gaining pace in the bullish zone.

Hourly RSI (Relative Strength Index) – The RSI for BTC/USD is now above the 50 level.

Major Support Levels – $114,000, followed by $113,500.

Major Resistance Levels – $115,500 and $116,500.

❌