Reading view

Here’s What Happens To The Dogecoin Price After The Consolidation Phase Ends

Dogecoin has spent the past several days locked in a tight decline that has seen it push lower. The meme coin has struggled to break above $0.19, slipping between $0.17 and $0.18 in what could be described as another consolidation phase. 

This movement follows a series of attempts to recover losses in October, which failed with a rejection at $0.205. The current chart setup has attracted interest among traders who believe a major rally move is close. A technical analysis posted on the social media platform X highlights what could happen once this slow decline period comes to an end.

Dogecoin Holds Its Ground In A Tight Range

Technical analysis shows that Dogecoin’s price action has been fluctuating within a narrow corridor for weeks, forming a horizontal support zone between $0.17 and $0.19. Each time the price tested the lower boundary, buyers have managed to absorb the selling pressure to prevent a deeper correction. This price action shows accumulation behavior where investors quietly build positions when there’s a lack of bullish momentum. The same pattern appeared in late September and early October when Dogecoin consolidated before briefly spiking to $0.26.

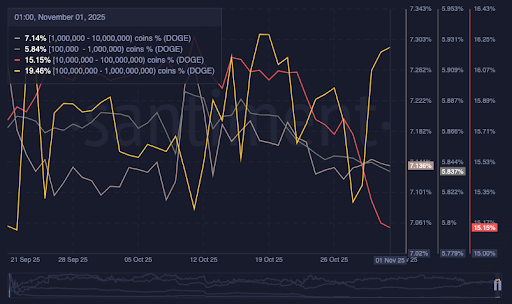
The chart below shows that Dogecoin has been consolidating since October 10, with several attempted short-lived recoveries during this period, but each one stalled below the resistance range. The last week of October was characterized by a further Dogeocin price breakdown that ended at $0.17 before picking up a little steam to $0.18.

Analysts always interpret these movements as signs that buyers are gradually regaining control. The repeated defense of the $0.17 area has become a psychological level that traders are closely watching. If the support continues to hold, it means that Dogecoin is getting ready for another bounce at this level. Some buyers are already positioning early for that outcome. As noted by crypto analyst BitGuru on X, “buyers are showing signs of stepping in again.” 

Dogecoin

Possible Upside Short-Term Targets Above $0.22

If Dogecoin manages to exit this consolidation zone, the analysis projects a potential rally above $0.20 and into the mid-$0.20s range. This projection, although short-term, aligns with the rally witnessed by Dogecoin in early October.

The scenario is for Dogecoin to break above $0.2 in a swift move and return to its early October level. The price target in this case is around $0.27, and Dogecoin could break out further from here to test psychological resistance at $0.3.

 The most important factors for such a move would be a bullish bounce around $0.17 and a confirmed daily close above $0.20, accompanied by rising trading volume. At the time of writing, Dogecoin is trading at $0.1735 and is looking like it is about to retest the $0.17 support.

Dogecoin

Pundit Elaborates On Ripple/SWIFT Theory That Will Send The XRP Price To $1,000

A prominent crypto commentator known as Remi Relief has expanded on theories linking Ripple, SWIFT, and the global banking system to the long-term valuation of XRP. 

His post on the social media platform X came in response to a discussion initiated by well-known analyst Paul Barron, who questioned whether Ripple’s strategy has always been to bridge the increasingly fragmented world of bank-issued stablecoins. The idea brings attention to XRP’s utility in facilitating liquidity between institutional networks, with Remi Relief noting that this could push the XRP price to $1,000.

The Ripple/SWIFT Dual-System Theories

Remi Relief proposed that the global payment structure could split into two interconnected systems where both ultimately rely on XRP for settlement and support the cryptocurrency’s price at $1,000. The first theory proposes a revamped version of SWIFT that would retain much of its existing framework but incorporate blockchain-based assets such as XRP, XDC, HBAR, and Chainlink to achieve faster transaction speeds and improved efficiency. Despite these upgrades, it would still face skepticism from some financial institutions due to it being weaponized in the past.

The second theory is the setup of a new Ripple-based network built in collaboration with Thunes, which would function as a more trusted and independent channel for cross-border payments. This system would be much quicker, much cheaper and more trusted by countries.

In Remi’s view, both models would coexist for a time, giving banks and governments the freedom to choose based on transaction scale, cost, and reliability. However, he believes that the Ripple-Thunes system will later gain dominance and overtake SWIFT as more and more banks use that system. 

Regardless of which of the two theories prevails, Remi Relief pointed out that both have the potential to lead to a $1,000 XRP more quickly than most people think.

Paul Barron’s Perspective On Institutional Stablecoins

Paul Barron’s initial post that prompted Remi Relief’s response is based on the growing race among major banks to issue their own stablecoins. He pointed out that while SWIFT continues to promote neutral rails, banks like JPMorgan, Bank of America, Citi, and Wells Fargo are developing US-based consortium stablecoins. Similarly, European institutions such as ING and Deutsche Bank plan to launch euro-denominated versions by 2026. 

Barron warned that this trend toward proprietary stablecoin systems would fragment the global financial network even further and create walled gardens where each bank’s stablecoin operates in isolation.

In his view, such fragmentation will bring out the original purpose of XRP, and this might have been the plan of Ripple CEO Brad Garlinghouse all along. The plan has always been to use XRP as a bridge asset capable of allowing interoperability between otherwise disconnected financial ecosystems. This function aligns with Ripple’s long-standing vision for the XRP Ledger as a neutral settlement layer for easy cross-border value transfer between different digital and fiat systems.

At the time of writing, XRP is trading at $2.41 and is a long way away from trading at $1,000.

Ripple

Litecoin 2M Bollinger Band Width Hits New Lows, CMT-Certified Analyst Reveals What It Means

Certified market analyst Tony Severino has revealed that the Litecoin 2M Bollinger band width has hit new lows. He explained what this means and how it provides a bullish outlook for the altcoin. 

Litecoin’s 2M Bollinger Band Hits New Record Lows

In an X post, Severino stated that the Litecoin 2M Bollinger Band Width has continued to set new record lows, representing the tightest volatility in LTCUSD history. The expert further revealed that the 2M candle closed as a Hammer above the Bollinger Band basis despite the wick to the downside. 

He explained that this gives the technical picture a bullish bias for Litecoin. The analyst added that a close above $120 at the end of 2025 would trigger a buy signal for LTC. From a fundamentals angle, LTC just got its first spot ETF in the U.S., which provides a bullish outlook for the altcoin. However, it is worth noting that the ETF is currently lagging behind the Solana and Hedera ETFs in terms of inflows. 

Litecoin

Meanwhile, Severino had also painted a bullish picture for Litecoin, drawing comparisons between the LTC and ZCash charts. That suggested that LTC could witness a similar parabolic rally to ZEC’s, which has recorded a 10x rally from its low of around $40. This was around the time when the analyst revealed that LTC was at the |final boss resistance” based on the monthly SuperTrend. 

Crypto analyst Hal also recently provided a bullish outlook for Litecoin, predicting a 300x rally. However, the analyst stated that a drop to around $30 was likely before LTC’s parabolic rally. He urged investors to take advantage of such a dip, as they could enjoy massive gains when LTC breaks out to the upside after this long period of consolidation. 

99% Chance Of A Rally Above $300

Crypto analyst XForce stated that Litecoin has a 99% chance of rallying above $300 as it is now approaching nine years of accumulation. His accompanying chart showed that LTC could reach $345 on this projected uptrend, which is expected to happen sometime next year. Meanwhile, a drop below $39 could invalidate this prediction. 

Meanwhile, crypto analyst Bitcoinsensus stated that Litecoin is gearing up for its biggest macro move. Based on the technicals, the analyst remarked that LTC could rally to between $1,000 and $2,000 in this market cycle. Bitcoinsensus noted that the altcoin has already seen six years of sideways consolidation, suggesting that it was well primed for this projected parabolic rally to the upside. The analyst’s accompanying chart showed that LTC could reach these targets next year. 

At the time of writing, the Litecoin price is trading at around $94, down over 5% in the last 24 hours, according to data from CoinMarketCap.

Litecoin

XRP Price Performance In November: History Says It’s The Most Bullish Month In History

The XRP price performance in the month of November has historically been more bullish than not, confirming higher returns than any other month in the year. Given this trend, it is possible that the XRP price could be headed for a rapid increase this new month. However, there is also the fact that the price had closed in the red back in October, and this performance could have an impact on how the cryptocurrency turns out in November.

Looking At XRP Price Performances In November

According to data from CryptoRank, the XRP price has seen an equal number of green and red closes over the last 12 years when it comes to the month of November. However, while the months of red closes have been significant, climbing into the double-digits, the green months have more than made up for it.

When it comes to the XRP price, the month of November has the most number of triple-digit closes than any other in history. Its first year of existence actually saw a 531.9% increase in the month of November, and this initial bullishness has mostly carried on into the later years.

On average, the monthly returns for November are the highest for the cryptocurrency, coming in at 81.2%. This is much higher than December’s 69.6%, making it the most profitable month for XRP investors. Thus, when it comes to rapid price increases, the digital asset is likely to experience it in November.

Moving into the more recent years, the market saw a 281.7% close back in November 2024, triggering its 600% price increase. This came after a 16.7% decline in the prior month, suggesting that a negative close to the month of October might not always translate into November.

XRP Price

Factors Point To Recovery

Amid the uncertainty, the XRP price could very well stage another recovery from here. One pointer is the fact that the XRP open interest is trending quite low from here, Coinglass data shows. The open interest had peaked above $10 billion earlier in the year. But since then, an over 50% crash has rocked this metric and is now trending below $5 billion at the time of writing.

This is similar to what happened back in 2024, when the XRP open interest was trending low below $1 billion at the start of November. However, momentum had picked up toward the middle of the month as the price began to rally.

If this trend holds, then the XRP price could see a small climb to start before hitting resistance. But if the resistance is surmounted, then the next rally could push it toward a triple-digit rise, which would mean a new all-time high for the altcoin.

XRP price chart from Tradingview.com

Dogecoin RSI Returns To Pre-Launch Levels, Analyst Says Next Major Surge Is Close

Dogecoin’s latest two-week chart analysis suggests the cryptocurrency could be gearing up for a new explosive rally. According to trader and market analyst Trader Tardigrade, the Relative Strength Index (RSI) for Dogecoin has settled at levels similar to those seen before price rallies in the past two years or so. 

This technical observation is based on Dogecoin’s steady uptrend along a long-standing support line since 2023 and points to its price action currently being in a possible early stage of accumulation before another leg upward.

Dogecoin RSI Now Showing Pre-Breakout Signals

The RSI is an indicator that has consistently aligned with Dogecoin’s strongest rallies in this cycle. According to the current 2-week candlestick setup shared by Trader Tardigrade, the RSI is currently trading stable within the same low range that has preceded Dogecoin’s previous upward rises since 2023. 

Each of the three major RSI dips, as shown on the price chart below, has coincided with price retests of the red ascending trendline. This event is notable because the first two dips were followed by significant upward movements in the Dogecoin price. Right now, the present RSI position is at its third dip, and it can be inferred that the meme coin may once again be approaching a launch point similar to those that led to past price surges.

The long-term support trendline drawn from mid-2023 has acted as a reliable price base for Dogecoin’s recovery cycles. Price action has tested this line multiple times without breaking below it, and this has led to the creation of higher highs and higher lows. 

Dogecoin 2W Candlestick Price Chart. Source: Trader Tardigrade On X

Although Dogecoin broke below the trendline in the middle of October, this breakdown was very brief with a long wick. Based on Dogecoin’s price action in October, the most recent interaction with this trendline is just above $0.17. This latest interaction has been highlighted with stability above this price level, and this is another early sign of technical strength.

What To Expect If The Pattern Holds

If this recurring structure between RSI and price maintains its consistency, Dogecoin could be about to embark on its third notable bullish run since early 2024. The most possible scenario is another rally that plays out over multiple weeks, as seen in the past two rallies.

The last rally saw the Dogecoin price just around $0.5 in December 2024. Therefore, another rally from this point will see the creation of another higher high above $0.5 at least. The projection within the analyst’s chart, which is based on how the last rally plays out, points to a target around $0.8.

At the time of writing, Dogecoin is trading at $0.1877, up by 0.5% in the past 24 hours. Reaching $0.8 will translate to new all-time highs and a 228% increase from the current price level. 

As long as the RSI holds its current base and the price stays above the ascending support, the sentiment surrounding Dogecoin may gradually shift from consolidation to rally alongside the rest of the crypto market.

Featured image from Unsplash, chart from TradingView

Billions In Bitcoin And Ethereum Leave Exchanges: Is Selling Pressure Easing?

A new trend is taking shape across the crypto market with investors pulling large amounts of Bitcoin and Ethereum from centralized exchanges. Data from on-chain analytics platform Sentora, formerly known as IntoTheBlock, shows that exchange balances for both leading cryptocurrencies have dropped notably over the past week. Prices are holding steady without much bullish momentum, but these massive withdrawals may hint at a subtle change in investor sentiment going into November.

Bitcoin And Ethereum Witness Billions Of Outflows From Exchanges

According to data from Sentora, Bitcoin recorded more than $2 billion in outflows from centralized exchanges over the course of the week. This is interesting, as it is one of the largest weekly movements of Bitcoin from exchanges so far this quarter. Furthermore, this trend is interesting because it is coming off an unfavorable month for the crypto industry in general, considering the crash that happened in the middle of the month. 

The outflow numbers can be interpreted as a sign of confidence among whale addresses choosing long-term storage over trading. On-chain data from whale transaction tracker Lookonchain supports this trend, showing two newly created wallets withdrawing 2,000 BTC worth about $260 million from crypto exchange Binance toward the end of the week.

Ethereum also witnessed a similar trend to Bitcoin. Data from Sentora shows that the leading altcoin saw major outflows during the week, coming to a total of about $600 million. 

Bitcoin and Ethereum Weekly Key Metrics. Source: Sentora

What Could This Signal For Bitcoin And Ethereum?

The massive exchange outflows are somewhat confusing, considering the fact that both Bitcoin and Ethereum ended October with negative monthly closes and broke the long-running Uptober trend that has shaped the crypto market for years. 

For six straight years, October had been one of Bitcoin’s most dependable bullish months that set the stage for strong year-end rallies. That streak has now ended with Bitcoin closing October 2025 about 4% below its monthly open, its first red October since 2018. Ethereum also followed a similar path and recorded a more notable monthly close of about 7.15% below its open.

Data from Sentora, as shown above, points to reduced activity in these blockchains that suggests the required bullish activity may not be there yet. The total fees on the Bitcoin blockchain come out to be $2.03 million, an 8.6% reduction from the previous week. The Ethereum network also saw a 13.2% fall in fees, coming out to $5.05 million.

Nonetheless, the outflows from exchanges are a bullish place to start. It eases selling pressure in the market, as fewer coins on exchanges mean fewer assets immediately available for sale. This, in turn, can tighten supply and gradually build a foundation for higher prices leading up to November. Whale traders might already be positioning themselves for the possibility of a bullish November.

Featured image from Pexels, chart from TradingView

Dogecoin Whales Are Offloading Hundreds Of Millions Of DOGE, Here Are The Facts

Dogecoin whales are now back in the spotlight as recent on-chain metrics reveal a major move involving hundreds of millions of DOGE. The latest data shows 440 million DOGE being offloaded as selling pressures intensify. Amidst this sharp decline in whale holdings, the meme coin’s price has experienced significant volatility, falling to $0.18 after recording weeks-long losses

Dogecoin Whales Trim DOGE Holdings En Masse

According to on-chain data from crypto analytics platform Santiment, wallets holding between 10,000,000 and 100,000,000 DOGE have sold off roughly 440 million tokens within 72 hours. This large-scale distribution marks one of the most significant short-term liquidations from mid-level whale wallets in recent weeks. 

Notably, on Thursday, October 29, these wallets accounted for approximately 15.51% of the total DOGE supply, but that figure dropped to 15.31% the following day. Moreover, it declined again on October 31 to 15.17%, and now stands at a low of 15.15%, at the time of writing. As whales abruptly reduced their exposure, the market also responded quickly. Data from CoinMarketCap shows that Dogecoin’s price plummeted about 5.76% this last week, following its 27% crash over the past month.  

Dogecoin

As selling pressure increases for Dogecoin, Santiment’s data further reveals that whale transaction counts for holders managing DOGE worth $100,000 and above spiked to 119 transactions on October 30, before plunging to 15 at the time of writing. This sharp decline suggests a rapid transition from distribution to dormancy among short-term high-volume traders. 

Interestingly, there have been signs of a redistribution, indicating that not all large holders are exiting the market. Santiment reports that whales with holdings exceeding 100,000,000 DOGE have increased their balances from 19.28% to 19.46% over the same period, implying accumulation from even larger players. Meanwhile, investors with holdings between 100,000 and 10,000,000 DOGE have maintained a steady position, signaling a neutral stance amid market uncertainty.    

Analysts Eye $0.33 And Beyond As Technical Patterns Align

Despite widespread whale dumping, analysts remain optimistic about Dogecoin’s medium to long-term price trajectory. Crypto market expert Ali Martinez identified Dogecoin’s current price at $0.18 as a critical support level. Based on his analysis, maintaining this price floor could spark a recovery wave targeting $0.26 and potentially $0.33. His chart illustrating Dogecoin’s ongoing consolidation within an Ascending Channel highlights a potential upward break aligning with previous recovery phases.  

Adding to the bullish outlook, Bitcoinsensus has released a long-term projection, suggesting an explosive continuation of DOGE’s cyclical uptrend. The analysis compares past rallies, showing gains of 300% and 500%, and now points toward a potential 800% surge that could propel the meme coin to approximately $1.70 in the current market cycle. The accompanying chart reflects a pattern of expanding momentum phases, supported by ascending trendlines from 2023. 

Dogecoin

Analyst Reveals How Litecoin Can Turn $3,700 Into $1 Million For Investors

Crypto analyst Hal has revealed how investors can make up to $1 million by investing in Litecoin. This comes as another analyst has predicted that LTC could soon break out of its current consolidation phase to reach a four-figure price target. 

How Litecoin Can Turn A $3,700 Investment Into $1 Million

In an X post, Hal stated that investors can make $1 million from about $3,700 if they bid the low $30 range on Litecoin and sell when the altcoin reaches $9,000. The analyst is confident that the LTC price can still drop to around this level, providing investors another opportunity to take this investment advice. 

 He noted that Litecoin never saw the 5th wave down in the Wave C corrective move, which he claimed means the altcoin is still going to drop below $41. Hal’s accompanying chart also showed that LTC could still drop to as low as $30 before its next parabolic rally to the upside. The analyst remarked that the altcoin could fall below the projected $30 range, but that it looks unlikely. 

Litecoin

Meanwhile, Hal declared that Litecoin is the “clearest and most confident” 250x to 300x play he sees in the market. He added that he has been waiting a long time for this last drop to $30 and that it is coming soon. He urged investors not to miss it, seeing as he projects that they could make millions on their LTC investment. 

Hal’s prediction comes amid the launch of the first spot Litecoin ETF by Canary Capital. This is expected to attract institutional inflows into the LTC ecosystem, which could be a positive for the altcoin’s price. However, the LTC hasn’t had the best of starts and is currently lagging behind the Solana and Hedera ETFs, which also just launched, in terms of inflows. 

Why LTC Could Easily Record This Parabolic Rally

Hal noted that Litecoin has one of the longest, oldest, and largest accumulation channels in existence among altcoins against its Bitcoin pair. He revealed that the LTC/BTC chart looks similar to the DOGE/BTC chart just before the Dogecoin price broke out and did a 663x in the 2021 bull cycle. This is why the analyst is confident that LTC’s price can record a 300x gain from the next low when it reaches the top of the next altcoin run. 

Meanwhile, crypto analyst CoinsKid stated that Litecoin has been in consolidation mode since the 2018 cycle top. He added that compression leads to expansion, predicting that LTC can reach $4,000 if it breaks the upper resistance just above $200.  CoinsKid noted how this would put LTC just shy of Ethereum’s market cap

At the time of writing, the Litecoin price is trading at around $96, up almost 2% in the last 24 hours, according to data from CoinMarketCap.

Litecoin

XRP’s 100 Billion Supply Is By Design – Insider Reveals Why

A discussion has surfaced within the crypto community regarding the reasoning behind XRP’s fixed supply of 100 billion tokens. For years, enthusiasts and investors have questioned why Ripple opted for such a large figure when most cryptocurrencies operate with far smaller caps. Ripple’s Chief Technology Officer, David Schwartz, recently addressed the question on the social platform X, shedding light on the considerations that guided the early design of the XRP Ledger.

Technical Foundations Behind XRP’s 100 Billion Supply

David Schwartz was one of the original architects behind XRP and the XRP Ledger in 2012, and as such, he possesses unmatched insight into the cryptocurrency’s tokenomics and the rationale that shaped its design. His response to the question regarding XRP’s 100 billion supply design revealed that the decision was rooted in technical precision and deliberate effort to balance the functionality of the token’s architecture.

The first layer of reasoning behind XRP’s supply lies in its technical design. According to Schwartz, the developers of the Ledger sought a number that would provide adequate divisibility for the token. This level of divisibility allows XRP to be functional across both high-value institutional payments and smaller, everyday transactions.

Equally important was the need for the total supply to fit cleanly within a 64-bit integer, a standard data type used in computing to store numerical values efficiently. This decision minimizes the risk of overflow errors or arithmetic inconsistencies in the ledger’s codebase. A supply as large as 100 billion allows the system to handle every transaction amount accurately while preserving performance and compatibility with conventional software frameworks.

Usability And Design Simplicity

Aside from the technical justifications, the choice of 100 billion was also made with human usability in mind. As noted by Schwartz, the third reason for XRP’s 100 billion circulating supply is that the number is easy for humans to remember. 

Ripple’s architects wanted a total supply that was easy to communicate, recognize, and remember. A round, memorable number like 100 billion conveys clarity to users and traders.

Although XRP has a maximum supply of 100 billion tokens, not every token is currently in circulation. At the time of writing, XRP has a circulating supply of 60.1 billion tokens.

At the launch of the Ledger, a total supply of 100 billion XRP was pre-mined and fixed. Of this amount, approximately 55 billion XRP were placed into escrow contracts controlled by Ripple to control how many tokens enter the market over time.

At the time of writing, about 35 billion XRP tokens are currently locked in escrow and waiting to be released into circulation. Each month, up to 1 billion XRP is released, and any unused portion (about 70% to 80%) is typically placed back into escrow. As part of the schedule, Ripple is going to unlock another 1 billion XRP from escrow on November 1. At the time of writing, XRP is trading at $2.51, up by 0.9% in the past 24 hours.

XRP

Ethereum Price Could Crash Below $3,400 After Rejection From 0.618 Fibonacci Level

The recent Ethereum price rejection that pushed it back below the $4,000 level has created a concerning trend that could send the price spiraling. The major point of interest lies at the 0.618 Fibonacci retracement level, where the last rejection occurred. Given this, it is likely that the Ethereum price could see more declines in the coming days, although there is still the possibility of the bulls taking over and invalidating the entire bearish setup.

Ethereum Price Is Showing A Lot Of Weakness

The rejection from the 0.618 Fibonacci retracement level marked the start of the decline from the $4,200 level during the last recovery. This rejection resulted in the formation of a lower high on the 4-hour timeframe, and historically, such lower high formations mean that there is more selling pressure piling up for the digital asset.

As the bullish momentum looks to be fading, it puts the Ethereum price in a precarious position. Crypto analyst The Alchemist Trader explains that the rejection had come with increased bearish volume as investors offloaded their holdings on the market, putting bears in charge once again.

Following this development, the Ethereum price has continued to struggle around $3,900, where the next local support lies. The cryptocurrency has maintained a tentative hold at best on this local support, suggesting that the bulls could indeed be losing ground at this level.

If this corrective phase continues, then the Ethereum price decline is far from over. The current local weakness has put a strain on the support, and if $3,900 fails completely, the next major support lies below $3,400, more specifically at $3,385. This will serve as the next stronghold for the bulls to make their move.

“From a structural perspective, Ethereum’s inability to sustain momentum signals growing bearish pressure across lower timeframes,” the crypto analyst explained.

Ethereum price

The Case For ETH Bulls

Despite the mounting bearish pressure, there is still the possibility that the Ethereum price could break out of this downtrend. Just like with the bearish case, the key lies at the $3,900 support and how well it holds.

In the case that bulls are able to reclaim and hold this support with momentum, then it could invalidate the bearish setup that has emerged. In this case, the crypto analyst believes that the Ethereum price could resume its uptrend above the 0.618 Fibonacci retracement level.

Ethereum price chart from Tradingview.com

❌