Reading view

Bitcoin Remains ‘Fully Bearish’ Until This Price Level Is Reclaimed: Veteran Analyst

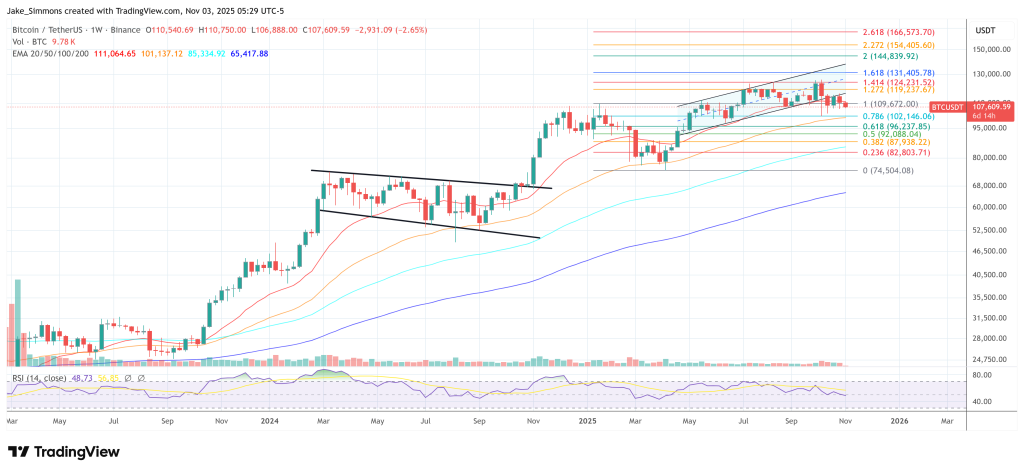
Bitcoin’s technical structure remains decisively negative and will stay that way “until” a key resistance level is reclaimed, according to veteran analyst Josh Olszewicz in his latest video published today. Pointing to the Ichimoku Cloud and a stack of trend signals, Olszewicz said, “Below the cloud we’re bearish, above we’re bullish. We are currently below… [and] fully bearish on price and the expectation is lower lows.”

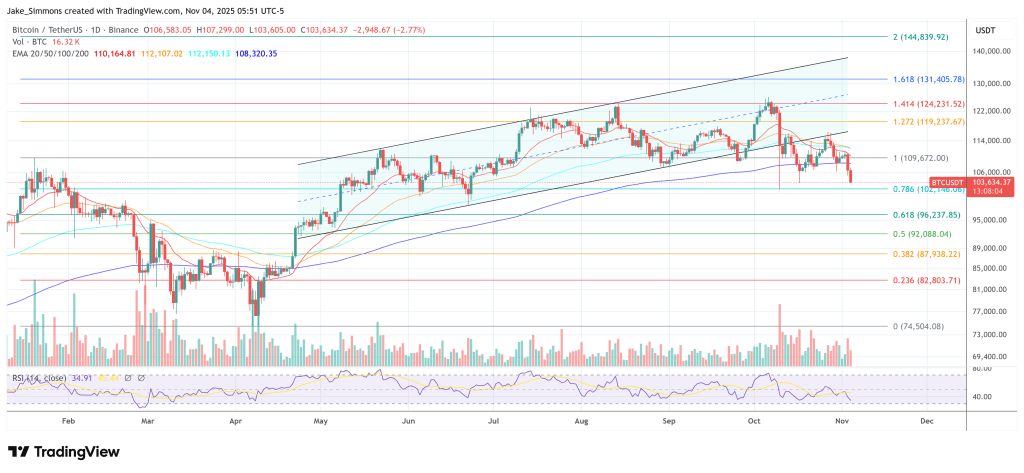
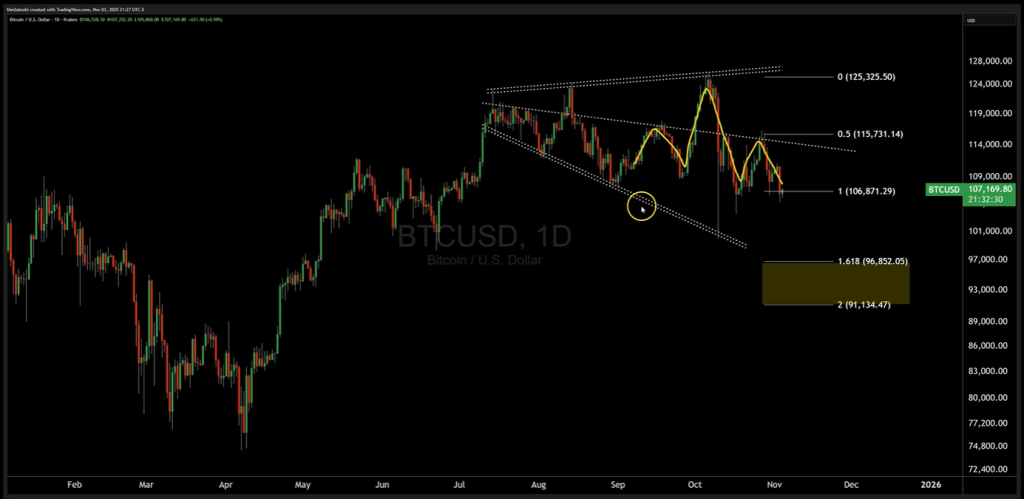
The fulcrum, in his view, is a reclaim of roughly $115,000. “I don’t really have anything bullish to say here at all until we’re back above $115,000 on BTC and $4,200 on ETH,” he said, adding that Ethereum’s setup is comparatively less negative—trading “in the cloud,” with what he still characterizes as “certainly not a long entry signal.”

Bitcoin price analysis

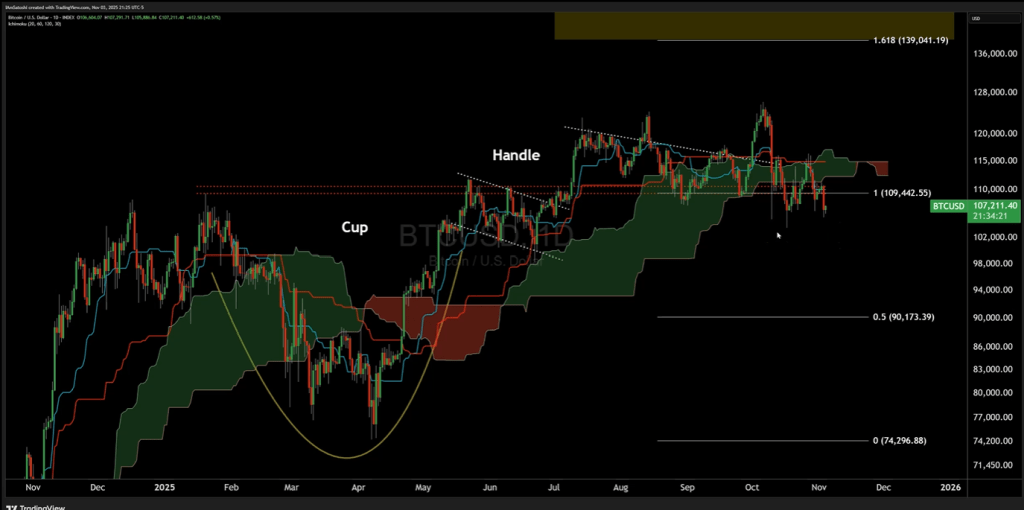
For Bitcoin, he flagged a confluence of bearish cues: a bearish Chikou span on the weekly, moving-average crosses to the downside, and head-and-shoulders patterns both at larger and smaller scales. While he acknowledged a possible “falling channel” and even a broader “megaphone” that could complicate pattern reads, Olszewicz underscored directional risk in the near term: “If I were to randomly wake up and see price at $103k, $102k, that would not surprise me here,” even warning that “it’s possible we flirt with… below $100,000.”

Bitcoin megaphone pattern

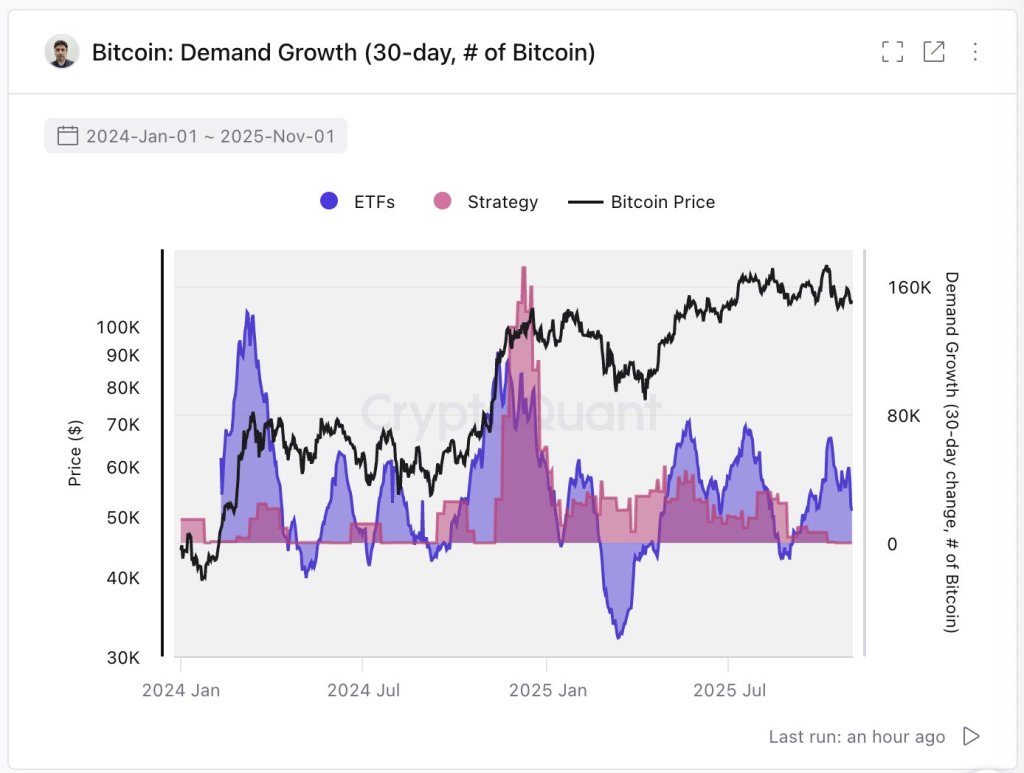
The deterioration in derivatives premia underscores that message, he argued. “If you look at the basis on CME we are making multi-month lows here… you go to ETH [and it’s] also making significant lows. So there’s certainly no froth in this market based on premiums.” Spot flow doesn’t help either: “On BTC we’ve still got people sending hundreds of millions to exchanges seemingly every day… my guess is they are [selling] because you don’t send coins to an exchange for fun.”

Macro Headwinds For Bitcoin

Beyond crypto-native signals, Olszewicz tied the setup to a macro regime shift that has turned unhelpful at the margins. He highlighted a still-ongoing US government shutdown as a potential kink in liquidity transmission—“maybe when the government comes back… the pipes start moving again”—and warned of rising near-term volatility around a data drought: “We do have ADP employment on Wednesday… very, very closely paid attention to because there is a data drought on employment numbers.”

Since last week’s FOMC, he noted, rate-cut odds tightened materially “after Powell mentioned a comment about the fog. Got to slow down on the fog, he says,” with risk assets reacting poorly: “Equities didn’t like that… crypto certainly didn’t like that.”

He also flagged the inflation now-casting mix as a swing factor. “Trueflation [is] ticking higher consistently… you don’t want to be in this position where we are cutting into rising inflation,” he cautioned, while contrasting that with the Fed’s nowcast, which “doesn’t look as dire.”

A CPI headline beginning with a ‘3’ would be problematic in his view: “I suspect if we do get a three handle on headline CPI, markets aren’t going to like that.” Under the hood, he pointed to falling gasoline and used-car prints and easing rents as disinflationary, but called out sticky components like insurance.

Liquidity optics remain mixed: the reverse repo facility has seen periodic end-month spikes yet is “running on fumes,” and, crucially, the long-observed link between global liquidity gauges and BTC “has not reconnected in any regard since May, June, July.”

Dollar strength is an additional pressure point. “The dollar continues to look good, continues to push higher… and this chart looks phenomenal… a real problem” for Bitcoin if that uptrend persists, he said. In classic cross-asset contrast, he described the 60/40 US bonds/equity mix as technically constructive—“above the cloud, bullish TK cross, bullish cloud”—and noted that risk proxies like high-yield credit are diverging from the S&P 500, which he reads as consistent with crypto’s underperformance: “With BTC struggling, you see riskier parts of the market also pulling back to a greater degree than equities.”

Equities Need To Remain Strong

In equities, he argued there is “nothing to short” on the major indices right now—“SPY… looks great,” with the Nasdaq and semis echoing the same message—creating an awkward asymmetry for BTC: “If Bitcoin can’t find its way when the SPY and the Q’s look like this, we’re certainly in trouble because if this does reverse, that’s going to take BTC with it almost certainly.”

On crypto-equity linkages, Olszewicz observed that miners have outperformed for reasons outside of Bitcoin’s fundamentals: “If you look at the Bitcoin miners, those have been bullish. Why? Because of AI and not because of Bitcoin… anybody following that story has done very well this year.” He extended the caution to other high-beta tech themes—quantum names “look very tired… more and more like a head and shoulders”—while acknowledging individual standouts like Palantir, which he said is “breaking out of its own cup and handle,” even if near-term price action was choppy after hours.

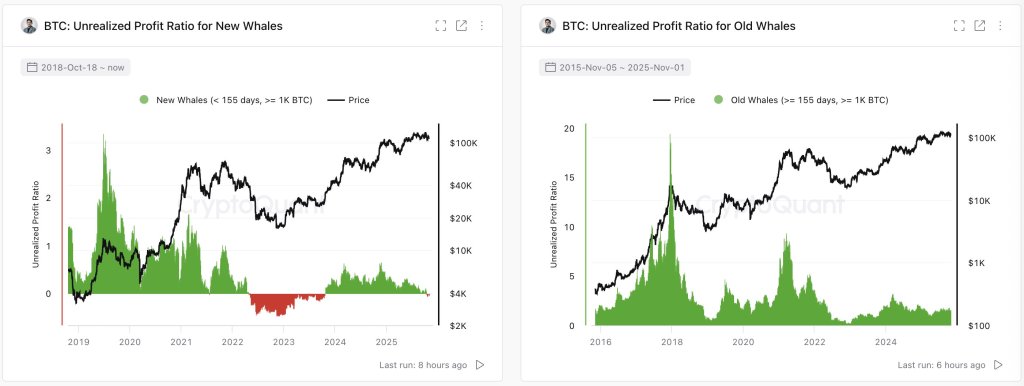
The broader market psychology, in his view, is shaped by cycle age and wealth preservation. “A thousand days from the bottom, more and more people are just saying, okay, this is enough… if they’re rich, they want to stay that way… it makes some sense to take a little bit off the table.” Until the technicals change, he sees no reason to force trades: “Honestly, not much, probably just sit around and collect some cash. Wait for those A-plus setups to emerge.”

The trigger for a regime shift is unambiguous in his framework. As he put it at the outset, “Below the cloud we’re bearish… not a bullish expectation.” The condition for flipping that view is equally clear: “Back above $115,000 on BTC and 4,200 on ETH,” or, in this headline terms, reclaim the level—or remain “fully bearish.”

At press time, BTC traded at $103,634.

Bitcoin price

Here’s Why The Bitcoin, Ethereum, And Dogecoin Prices Are Crashing Again

The cryptocurrency market has been struck by another wave of red candles, plunging 4.1% in the past 24 hours. Bitcoin, Ethereum, and Dogecoin have all suffered notable declines, with all large market-cap cryptocurrencies falling below support levels that held last week. 

The downturn gained momentum after claims surfaced on X suggesting that Wintermute, one of the industry’s largest market makers, was preparing to sue Binance over alleged issues linked to the October 10 crash.

Rumors Of A Lawsuit Against Binance Add To Anxiety

Market unease deepened after rumors circulated on X claiming that Wintermute, one of the industry’s leading market makers, was preparing to sue Binance over losses incurred during the October 10 crash. The speculation began when a user known as WhalePump Reborn claimed that Wintermute had lost hundreds of millions and was preparing legal action, describing the situation as “not going to be pretty.”

This was followed by another detailed post from a popular X account known as StarPlatinum, which addressed rumors that Wintermute was pursuing legal action against Binance over what it called unfair ADL executions during the massive liquidation event in early October. 

As noted by the post, Binance’s system overload during the crash led to automatic deleveraging (ADL) at extreme price points, causing an estimated $19 billion to $20 billion in liquidations in just 24 hours, the largest single-day wipeout in crypto history.

Notably, Wintermute’s portfolio across Ethereum, Arbitrum, and Solana fell by about $65 million following the crash, though no on-chain patterns indicated forced liquidations or large withdrawals. Binance, for its part, had acknowledged system overloads at the time but denied any preferential treatment or technical fault that could have led to any unfair losses.

Wintermute Founder Refutes Claims Of Lawsuit

As panic spread through the market, Wintermute’s founder, Evgeny Gaevoy, took to X to dispel the rumors entirely. Quoting an earlier post from October 11, Gaevoy reiterated that Wintermute had never planned to sue Binance and saw no reason to do so in the future. 

“We never had plans to sue Binance, nor see any reason to do it in future,” Gaevoy said on X. “I should probably ask to make a note of all the people spreading baseless rumors, but most of people believing these have goldfish memory capacity, so I wont,” he added. He also described the circulating claims as complete bullshit in a direct response to the WhalePump Reborn post. 

The Wintermute rumors are part of various factors that are causing the price of cryptocurrencies to crash. Another factor could be the Fed Chair Jerome Powell hinting that the central bank may not pursue additional rate cuts anytime soon. Adding to the selling pressure were outflows from spot Bitcoin ETFs. According to data from Farside Investors, Spot Bitcoin ETFs started November with outflows on Monday, bringing the trend to four consecutive days of outflows.

At the time of writing, Bitcoin is trading at $104,502, down by 2.8% in the past 24 hours. Ethereum is trading at $3,490, down 6.0% in 24 hours. Dogecoin is trading at $0.1618, down 6.8% in 24 hours.

Bitcoin price chart from Tradingview.com (Ethereum, Dogecoin)

Over $1 Billion in BTC, ETH, and SOL Trades Liquidated as Market Slides 5–10%

Last updated on November 04, 2025

This Article Was First Published on The Bit Journal.

Bitcoin liquidation rocked the crypto market this week after Bitcoin tumbled from $112,000 to below $106,000, erasing over $1.27 billion in leveraged positions. According to the source, long traders bore the brunt of the damage, losing nearly $1.14 billion as cascading sell-offs triggered automatic closures across major exchanges.

The wave hit just as traders were bracing for the Federal Reserve’s policy decision, adding fuel to fears that tightening liquidity could squeeze crypto leverage once again.

Massive Bitcoin Liquidation Wave Hits Long Traders

Data from leading analytics platforms showed Bitcoin liquidation activity surged to one of the highest levels since August. Hyperliquid topped the list with $374 million in forced closures, followed by Bybit with $315 million and Binance at $250 million. The single most significant liquidation, worth $33.95 million, came from a BTC-USDT long on HTX.

Bitcoin’s price has now stabilized around $106,200, but sentiment remains fragile. Analysts note that heavy long liquidations often markshort-term bottoms”, as over-leveraged positions are flushed out before a potential rebound. However, with open interest still near $30 billion, traders remain wary of another swing before the Fed’s statement later this week.

Ethereum And Solana Join The Slide

Ethereum (ETH) and Solana (SOL) also felt the shockwave. Combined altcoin liquidations surpassed $300 million, as both tokens slid 5% to 8% over 24 hours. ETH now trades near $3,030, while SOL hovers around $160.

Market watchers say these wipeouts are part of a broader leverage reset. One trader commented on social media thatthin liquidity and stacked long positionscreated the perfect storm for a rapid downturn.

Charts from an official site show dense liquidation zones between $105,000 and $107,000 for Bitcoin, suggesting these areas could act as temporary support if buyers return.

Bitcoin Liquidation
Source: X (Formerly Twitter)

What This Bitcoin Liquidation Means For Traders

This Bitcoin liquidation serves as a reminder that using leverage increases both profits and losses. In periods of extreme market activity, even minor price adjustments can escalate into large-scale selling. Experts note that in such cases, funding rates usually decline, thereby reducing speculation and providing spot-market buyers with a better entry point.

Still, the fact that open interest remains elevated suggests traders are far from abandoning risk. Some believe another Bitcoin liquidation could occur if prices retest the $103,000–$104,000 range, while others see it as ahealthy resetbefore the next rally.

Conclusion

The recent Bitcoin liquidation is a loud warning for those traders who have over-leveraged themselves. It is a reminder to the market that volatility is always present, especially as major events like the Fed’s decision approach.

Short-term discomfort could disrupt bullish sentiment, but these shakeouts usually contribute to the gradual development of stronger, more sustainable growth after the dust settles.

Glossary of Key Terms

  • Bitcoin Liquidation: Forced closure of a leveraged position when margin levels drop below the exchange’s requirement.
  • Leverage: Borrowed capital used to amplify potential gains or losses in trading.
  • Open Interest: The total number of outstanding futures contracts yet to be settled.
  • Funding Rate: A periodic fee paid between traders to keep futures prices aligned with spot prices.

FAQs About Bitcoin Liquidation

1. What caused the recent Bitcoin liquidation?

A sharp price drop from $112,000 to $106,000 triggered automatic sell-offs on leveraged long positions.

2. Which exchanges saw the highest liquidations?

Hyperliquid led with $374 million, followed by Bybit and Binance.

3. How do liquidations affect Bitcoin’s price?

They often create short-term volatility but can reset leverage for healthier price action later.

4. Are more liquidations expected this week?

Analysts are cautious, citing the Federal Reserve’s upcoming decision as a potential catalyst.

5. How can traders manage liquidation risk?

Use lower leverage, set stop-loss orders, and monitor funding rates regularly.

Read More: Over $1 Billion in BTC, ETH, and SOL Trades Liquidated as Market Slides 5–10%">Over $1 Billion in BTC, ETH, and SOL Trades Liquidated as Market Slides 5–10%

Bitcoin Liquidation Wipes $1.27B After Market Crash Hits Leverage Bulls

Head And Shoulders Pattern Says Bitcoin Price Is Headed Below $100,000

Amid the bearish pressure that has rocked the market, the Bitcoin price continues to fluctuate around the $110,000 support, especially with selling pressure building up. This has led to predictions that the Bitcoin price is headed for another crash amid the weakness. One analysis that stands out comes from crypto analyst Toby Dawson, who pointed out the formation of a bearish Heads and Shoulders pattern that could trigger a cascade below $100,000.

Head And Shoulders Pattern Points Downward

In the analysis shared on the TradingView website, Dawson outlines the formation of the head and shoulders pattern. The first shoulder here, the left shoulder, was created at around $117,000, when the price was struggling back in the month of September. The subsequent recovery would then give rise to the formation of the head.

Next was the rapid Bitcoin price rise to a new all-time high above $126,000 before hitting resistance. This resistance at this level led to the formation of the head of the pattern, and, as expected, the price continued its downtrend following this.

The most recent of these is the formation of the right shoulder, which was created in the rally toward $117,000 at the end of October. Once again, the Bitcoin price hit another major resistance, marking the completion of the head and shoulders pattern.

With this formation, the crypto analyst points out the possibility that the Bitcoin price will see a major bounce. However, in the case of a breakdown, the expectation would be for the price to crash below the $100,000 and move toward $90,000.

Bitcoin price

Bitcoin Price Crash Expectations Spread

Another crypto analyst has also called out the possibility of the Bitcoin price crashing. This comes after the cryptocurrency made a new all-time high above $126,000, and the analyst points out that the digital asset has always seen a major price crash after reaching new peaks.

From here, the focus is now on the 1-week 50 EMA and the support at $100,000. These two are serving as the last line of defense, and if they fail, then the analyst expects the Bitcoin price to go into free fall. As a result, the analyst warns that investors should get ready to exist as “Bitcoin is heading straight to hell!”

Just like Dawson, the crypto analyst expects that Bitcoin will break below $100,000, but puts it even further. This time, it isn’t expected to actually stop above $90,000, but to reach deeper into the $80,000 territory before finding support.

Bitcoin price chart from Tradingview.com

Bitcoin Price Poised For A Bullish November: Key Catalysts That Can’t Be Ignored

As the new month began, the Bitcoin price opened on a downward trend, slipping below its consolidation range amid rising uncertainty and bearish sentiment in the market. Nevertheless, analysts are identifying a collection of indicators suggesting that a bullish resurgence for the cryptocurrency could be on the horizon.

What’s Fueling BTC’s Potential Surge This November?

According to experts at The Bull Theory, November is poised to be the most bullish month of the year for Bitcoin, and the supporting numbers are quite compelling. Historically, November has been one of the strongest months not only for US equities but also for the Bitcoin price. 

For stocks, it consistently ranks as a top-performing month, while Bitcoin has historically recorded some of its most significant rallies during this time, averaging gains between 40% and 42%. What sets this November apart, however, are the underlying factors at play.

One of the primary catalysts identified by the analysts is the anticipated end of the US government shutdown, which is expected to conclude this month. While this may seem like a political issue, its financial implications are substantial. 

They assert that the resumption of government spending means “billions of dollars” will start flowing back into contractors, projects, and public sectors. This return to fiscal spending acts as a mini liquidity injection into the economy. 

Historically, such movements of money have had a positive effect on risk assets, including equities and cryptocurrencies, as capital begins to rotate from the real economy into the financial system.

Another significant factor is the planned ramp-up of corporate buybacks. Within the next few weeks, many major companies are expected to restart their buyback programs. 

This creates new demand in equities at a time when liquidity is improving, which historically has pushed stock indices higher. Given that cryptocurrencies often track global liquidity cycles, this corporate-driven demand could similarly benefit the crypto market.

Bitcoin Price To Reach $160,000?

Additionally, the Federal Reserve (Fed) has quietly re-entered the scene, as evidenced by a spike in daily overnight repo loans, which reached $29.4 billion—the highest level in nearly five years. 

This significant borrowing indicates that banks are short on dollars and are relying heavily on the Fed. Such activity typically signals stress in the short-term funding market. 

Historically, when repo activity surges, the Fed tends to inject liquidity to stabilize the situation. This influx of capital does not remain isolated within the banking system; it tends to flow through markets, lifting equities and eventually benefiting cryptocurrencies once confidence is restored.

Moreover, the US Treasury’s General Account (TGA) balance has surged close to $1 trillion, sitting approximately $150 to $200 billion above normal levels. This capital is currently idle, but once government spending resumes following the shutdown, it is likely to begin circulating again. 

If the Bitcoin price performance this November mirrors its historical averages, the analysts anticipate a potential rally of around 40%. Such an increase could see the Bitcoin price reaching the $150,000 to $160,000 range. 

Bitcoin price

Featured image from DALL-E, chart from TradingView.com 

Caution In The Crypto Market: Expert Warns Of Bearish Phase Unfolding This November

November has kicked off on a negative note for crypto prices, with Bitcoin (BTC) briefly dipping toward $105,000 on Monday. This decline has sparked a renewed sense of bearish sentiment among investors, and experts caution that conditions could worsen in the coming days.

November Deadline Approaches

Market expert CryptoBirb recently expressed concerns on social media platform X (formerly Twitter), noting that the market is already ten days into a bearish cycle. According to CryptoBirb, diving into on-chain data, the more alarming the picture appears.

CryptoBirb’s analysis begins with cycle peak data: it has been 1,078 days since the low in November 2022, which is 101.2% of the crypto cycle complete. Additionally, it has been 563 days since the last Halving, with 45 days remaining within the typical 518 to 580-day peak range. 

Alarmingly, the anticipated rally leading to this peak has not materialized, and there are only 17 days left before the window for a peak closes on November 20. Missed breakouts during this time frame have signaled the end of previous bullish cycles.

When comparing the current situation to the 2017 cycle, it is noted that Bitcoin reached its peak on December 17, 2017, 1,068 days after its low. With BTC now 1,078 days into the current cycle, the chances of a late top are diminishing with each passing day that the cryptocurrency remains below $113,000. 

Crypto

From a performance standpoint, Bitcoin is down 16% from its all-time high of $126,200 and has only gained 8.2% year-to-date. The market’s leading crypto has faced repeated rejections near the $113,000 to $114,000 range and is currently trading below the 200-day simple moving average (SMA) of $109,882. 

Historically, November typically sees an average gain of 17.5%, with positive performance in 10 out of the last 15 years. However, the expert points that when November begins in the red, it often indicates that the cycle is already shifting.

Potential Bullish Factors Amid Ongoing Crypto Concerns

Adding to this bearish sentiment, DeFi researcher DeFiIgnas has outlined several factors complicating the crypto market’s trajectory. These include what he calls “the speculative nature of the artificial intelligence (AI) bubble,” the failure of bullish news to invigorate crypto prices, uncertainty surrounding entities that collapsed after the October 10 crash, and the cyclical nature of the market. 

Additionally, the selling activity from long-term holders and negative crypto exchange-traded funds (ETF) flows contribute to the prevailing concerns.

Despite these challenges, DeFiIgnas also identified some potential bullish factors that could foster recovery instead of further declines. 

These include easing liquidity and interest rate cuts by the Federal Reserve (Fed), a lack of euphoria in the crypto space, slow but steady institutional adoption, and the potential passage of a US crypto market structure bill. 

Historically strong performance in the fourth quarter, stablecoin supply at all-time highs, and a recent US trade deal with China could also provide a counterbalance to the prevailing bearish sentiment.

Featured image from DALL-E, chart from TradingView.com 

Bitcoin Bull Run: Over Or Just Paused? CryptoQuant CEO Presents The Data

Bitcoin’s on-chain picture is flashing a rare combination: substantial profits across cohorts, rising realized capitalization, and record network hashrate—yet none of the price-accelerating euphoria that typically marks late-stage bull legs. That is the central takeaway from CryptoQuant CEO Ki Young Ju’s latest thread, which parses holder cost bases, cohort profitability, leverage, and the evolving role of ETFs and corporate treasuries in setting the tape.

Is The Bitcoin Bull Run Over?

The headline number is startling on its face. “Bitcoin wallets’ avg cost basis is $55.9K, meaning holders are up ~93% on average,” Ju wrote, adding that realized capitalization climbed by roughly $8 billion this week, a clean read that “on-chain inflows remain strong.” Realized cap—an alternative valuation measure that sums coins at their last transacted price rather than today’s market price—has historically served as a lower-variance proxy for true money-at-work. Its continued rise typically implies that fresh cost basis is being set higher on chain, even when spot stalls.

Bitcoin Realized Cap and Price

So why hasn’t price budged in tandem? Ju’s answer is straightforward: “Price hasn’t gone up because of selling pressure, not because demand was weak.” That framing is consistent with a market digesting gains while liquidity providers and profitable cohorts distribute into strength. It also helps explain the co-existence of healthy inflows with flat price action around the $110,000 handle that Ju cites as the current print.

Where the marginal demand is coming from—and where it has slowed—matters. According to Ju, “New inflows mostly come from ETFs and Bitcoin treasury companies, while CEX traders & miners are sitting on ~2x gains.” He broke out estimated cohort cost bases and mark-to-market performance as follows: “ETFs / Custodial Wallets: $112K (-1%), Binance Traders: $56K (+96%), Miners: $56K (+96%), Long-term Whales: $43K (+155%). Current Price: $110K.”

Cost-Basis Comparison (Realized Price)

If those estimates hold, short-horizon institutional buyers are hovering near breakeven, while long-tenured entities still carry deep embedded profits. That distribution dampens forced selling risk at the very top but also withholds the kind of fresh momentum that typically arrives when new buyers push decisively into the money. Valuation context helps. Ju notes that in pronounced bull phases, market cap tends to outrun realized cap, creating a widening “valuation multiplier.” “When the growth rate gap between market cap and realized cap widens, it shows a stronger valuation multiplier,” he wrote.

“Roughly $1T in onchain inflows has created a $2T market cap. The gap seems moderate for now.” A moderate gap is a double-edged signal: not obviously frothy, but also not the kind of exuberant expansion that ends cycles. It complements Ju’s assessment of large-holder positioning: “Whales’ unrealized profits aren’t extreme.” That scenario admits two interpretations he spelled out explicitly: “Hype hasn’t arrived yet—we’re still far from euphoric sentiment.” Or, “This time is different—the market is too big for extreme profit ratios.”

Perpetuals and collateral flows round out the microstructure picture. Ju highlights a “sharp” drop in BTC moving from spot-focused venues to futures exchanges—an indication that “whales are no longer opening new long positions with BTC collateral as actively as before.”

If the marginal long is no longer pledging coins, the market loses a mechanical source of bid intensity and convexity from collateralized positioning. Yet leverage itself has not reset: “Bitcoin perp leverage remains high despite the recent wipeout,” Ju writes, pointing to ratios such as BTC-USDT perpetual open interest relative to exchange USDT balances and to USDT market cap.

In simple terms, conviction longs appear less collateral-heavy in BTC, but system-wide leverage, as proxied by perps, remains elevated versus two years ago. That combination can suppress clean trending behavior: fewer collateralized longs to chase upside, but enough leverage in the system to impose choppy liquidations.

Bitcoin perp leverage remains high

Hashrate and industrial supply trends complicate the narrative further. “Bitcoin hashrate keeps hitting new highs (~5.96M ASICs online). Public miners are expanding, not downsizing, which is a clear long-term bullish signal. The Bitcoin ‘money vessel’ keeps growing.”

Rising hashrate plus expanding public miner fleets typically points to forward investment and confidence in long-run fee and subsidy economics. It does not, however, guarantee short-term price appreciation; if anything, it can expand miner treasury management needs, interacting with market liquidity in ways that are neutral-to-price absent fresh demand.

Bitcoin hash rate

New Demand Push Needed

The demand side, in Ju’s read, is presently dominated by two channels: “Demand is now driven mostly by ETFs and Strategy, both slowing buys recently. If these two channels recover, market momentum likely returns.” That is a clean, falsifiable thesis: if primary institutional conduits re-accelerate, spot should regain buoyancy; if they remain tepid, realized cap can still grind higher on steady inflows while price chops as distribution absorbs them.

Bitcoin demand by Strategy and ETFs

Cohort profitability provides an additional boundary condition for scenarios. “Short-term whales (mostly ETFs) from the past 6 months are near break-even. Long-term whales are up ~53%,” Ju wrote. Historically, cycle tops have often coincided with extreme unrealized profit ratios for dominant cohorts, creating structural sell pressure when every marginal uptick unlocks significant gains.

Unrealized Profit Ratio for whales

Ju is effectively saying we are not there. At the same time, he cautions that the market’s regime may have already decoupled from the textbook four-year cadence: “In the past, the market moved in a clear four-year cycle of accumulation and distribution between retail investors and whales. Now it’s harder to predict where and how much new liquidity will enter, making it unlikely for Bitcoin to follow the same cyclical pattern again.”

Taken together, the thread sketches a market with three defining traits. First, fundamentals of “money in” look resilient: realized cap rising, holders broadly in profit, and network security hitting new highs. Second, microstructure is unspectacular and even a touch cautionary: fewer whales seeding BTC-collateralized longs, while system leverage remains high enough to destabilize clean moves. Third, the demand baton is concentrated in ETF and corporate treasury channels that have recently eased off—the very actors whose re-acceleration could reignite momentum.

At press time, BTC traded at $107,609.

Bitcoin price

Bitcoin Long-Term Holders Show Signs Of Selling — Is A Reversal Imminent?

Recent on-chain data shows that a relevant class of Bitcoin investors known as long-term holders has continued to move out of their market positions.

LTHs Actively Switching To Distribution 

In a November 1st post on social media platform X, popular on-chain analyst Burak Kesmeci shared an insight into the prevalent structural bias among Bitcoin’s long-term holders. Kesmeci’s analysis hinges on the Long-Term Holder Net Position Change metric, which tracks the net buying or selling behavior of Bitcoin’s long-term investors over a period of 30 days.

Related Reading: Bitcoin At A ‘Do-Or-Die’ Level As Cycle Faces First Real Test: Analyst

A positive reading is usually interpreted as a sign that the LTHs are in a net accumulation phase, as there are more market participants within this investor class buying Bitcoin than those who are selling. On the flipside, when the Long-Term Holder Net Position Change metric is negative, it means that the LTHs are in a distribution phase.

Kesmeci explained in his post that there has been an increasing amount of momentum towards the sell side of the metric. In the highlighted chart, around 400,000 BTC appears to have been sold off in the past 30 days. Interestingly, the LTHs don’t seem to be easing off on their sales — a behavior which stands equally as a source of concern. 

Bitcoin

In a case where Bitcoin’s long-term investors do desist from selling their holdings, Bitcoin could put in a local price bottom, as this typically indicates renewed interest and ‘smart money’ positioning for the next cycle. However, if this distribution momentum continues to grow, the premier cryptocurrency could continue towards the downside, as its long-term holders continue to inject more bearish pressure.

LTH 2.2% Supply Drop Relatively Modest — Analyst

In another X post, crypto pundit Darkfost shed light on the implications of Bitcoin’s LTH behavior shift. According to the analyst, the 2.2% “modest reduction” of Bitcoin LTH supply in October is not much to worry about, especially when compared to the levels seen in 2024. 

As of March 2024, Bitcoin’s LTH supply dropped by approximately 5.05%. In December, there was an even higher decline of about 5.2%. Darkfost implied that the present distribution the market is seeing could therefore be a result of early profit taking, where the market could soon see a rebound of the Bitcoin price. 

Nonetheless, the long-term holder net position’s trend is one that should be monitored, as a move back towards neutral readings could signal the start of an accumulation phase and subsequent price reversal to the upside.

As of this writing, BTC is valued at approximately $110,750, with no significant movement in the past 24 hours.

Bitcoin

Bitcoin Coinbase Premium Gap Enters Deep Red Zone — Impact On Price?

The price of Bitcoin closed the historically bullish month of October on a loss for the first time in seven years. While the month started in typical fashion—on a bullish tear, the intense downturn didn’t begin until October 10, when US President Donald Trump threatened new trade tariffs on China.

Now, although the United States and China seem to have found a temporary truce, the cryptocurrency market has been unable to find similar relief. In fact, the latest on-chain data suggests that US investors are still less optimistic about the digital asset market, specifically Bitcoin.

Negative Coinbase Gap Premium Coincides With Massive ETF Outflows 

In a November 1st post on social media platform X, crypto analyst Maartunn revealed that the world’s largest cryptocurrency has seen extremely low demand in the United States in recent days. The relevant indicator here is the Coinbase Premium Gap, which has entered a deep red territory in the past few days.

This on-chain metric measures the difference between the Bitcoin price on the US-based Coinbase exchange (USD pair) and the global Binance exchange (USDT pair). A positive difference indicates that the flagship cryptocurrency has a higher value on Coinbase than on Binance.

When the Coinbase Premium Gap is positive, it implies that US-based investors are purchasing Bitcoin aggressively. On the flip side, a negative Coinbase Premium Gap typically indicates heavy selling pressure for the market leader.

Bitcoin

According to data highlighted by Maartunn, this on-chain metric is back around -$80, reflecting significant selling pressure from the US institutional players. This reduced demand can be seen with the disappointing performance of the US-based spot Bitcoin exchange-traded funds (ETFs) in recent days.

Data from SoSoValue shows the Bitcoin ETFs registered a total net outflow of more than $191 million on Friday. This marked the third consecutive day of negative outflows, having seen withdrawals of nearly $500 million each on Wednesday and Thursday.

From a historical perspective, a negative Coinbase Premium Gap is often correlated with periods of sluggish or downward movement for the BTC price. Hence, with the current intense selling pressure from large US investors, it is difficult to see the premier cryptocurrency making a strong recovery in the coming days.

Bitcoin Price At A Glance

As of this writing, the price of BTC sits just above $110,200, reflecting a measly 0.9% jump in the past 24 hours. According to data from CoinGecko, the flagship cryptocurrency is down exactly 1% in the last seven days.

Bitcoin

Are Bitcoin Investors Back In Accumulation Mode? On-Chain Data Says ‘Possibly’

After the market-wide downturn on October 10, the Bitcoin price showed no definite direction for the rest of the historically bullish month. At the moment, the premier cryptocurrency is struggling to gather any significant momentum to the upside. However, recent on-chain evaluation suggests that this period of relative silence could represent a springboard for the cryptocurrency’s sustained upswing.

Sender/Receiver Ratio Falls To One-Year Low 

In a recent Quicktake post on the CryptoQuant platform, pseudonymous analyst CryptoOnchain shared an interesting insight into Bitcoin’s future trajectory, leaning towards a bullish hypothesis in the report.

The relevant on-chain indicator here is the Bitcoin Sender/Receiver Address Ratio, which compares the number of active sending (selling) addresses to receiving (buying) addresses. This metric acts as a means to gauge the prevalent market sentiment within a period of time. 

Related Reading: Altcoin Season Loading: Bullish Factors That Point To A Massive Surge

A high ratio (with a reading above 1) indicates that there are more sending addresses compared to the buying addresses. As a result, there is expectedly greater selling pressure in this market condition. On the other hand, a low ratio (a reading approaching 1 and levels below) reflects the preponderance of buying addresses. 

Bitcoin

CryptoOnchain reported that Bitcoin’s Sender/Receiver ratio on Binance has recently fallen to 1.34 — its lowest level in the past year. As previously explained, when this ratio falls to levels such as it currently reads, it usually indicates that there are more buying addresses relative to the amount of selling addresses in the market. 

This shift in investor leanings typically signals an accumulation phase, where more investors are willing to acquire Bitcoin on exchanges. 

Interestingly, the analyst also referenced historical evidence, explaining that periods where this shift in market sentiment occurred often preceded the establishment of local price bottoms. As of late 2024, the Sender/Receiver ratio fell to levels around 1.3, with significant upward movement following suit, and a similar pattern was seen in early 2023.

According to CryptoOnchain, this current consolidation phase could signal that the market’s foundation is gaining strength. Thus, if history is anything to go by, Bitcoin’s price could see an immense upward boost in the days to come — one which could sponsor the world’s leading asset to see a fine amount of growth in the mid-term. 

Bitcoin Price At A Glance

As of this writing, Bitcoin is worth approximately $109,899, reflecting no significant movement in the past day. According to data from CoinGecko, the premier cryptocurrency is down by nearly 2% in the past seven days.

Bitcoin

Bitcoin October Slump: Fourth Worst On Record Since 2013, Per Fortune Analysis

As October comes to a close, Bitcoin (BTC) has disappointed many who had anticipated the month to be a strong one for the cryptocurrency, often referred to as “Uptober” due to its historically positive performance. Instead, Bitcoin finished the month down, creating a gap of approximately 13% from its all-time high. 

Historical Trends Suggest Bitcoin Could Rebound

Joel Kruger, a market strategist at LMAX Group, noted that while October was a letdown compared to historical trends, it’s essential to contextualize the price movements. He remarked, “Prices have held up well overall, especially after a September that actually bucked the usual weakness.”

Notably, on the 6th of this month, the market’s leading cryptocurrency reached an all-time high just beyond $126,000. Additionally, the current downturn has failed to erase the year-to-date gains, with Bitcoin still recording a 55% uptrend during this period.

However, according to a recent analysis by Fortune, this October marks the fourth-worst performance for Bitcoin since 2013 and the worst in the past seven years. Bitcoin’s performance lagged behind that of the S&P 500, which saw a gain of roughly 2.3% during the same period. 

Bitcoin

Despite this under performance, Kruger remains optimistic about Bitcoin’s potential recovery in the upcoming months. “Historically, Q4 has been one of the best periods for crypto performance,” he stated, expressing hope for a push toward record highs for both Bitcoin and Ethereum (ETH) as the year draws to a close.

October Challenges

The month proved challenging not only in terms of price but also due to significant market events. Adam McCarthy, a senior research analyst at digital market data provider Kaiko, observed that cryptocurrencies entered October tracking gold and stocks at near all-time highs. However, as uncertainty crept into the market, investors did not flow back into Bitcoin as anticipated. 

In addition, October witnessed the largest liquidation event in cryptocurrency history, triggered by President Donald Trump’s announcement of a 100% tariff on Chinese imports, alongside threats of export controls on crucial software.

McCarthy commented on the impact of this liquidation, stating, “That washout on the 10th really reminded people that this asset class is very narrow.” He emphasized that even dominant cryptocurrencies like Bitcoin and Ethereum can experience sharp drawdowns, citing instances of 10% declines occurring in just 15 to 20 minutes.

Amid these developments, concerns have been raised by several figures regarding the high valuations in equity markets. Jamie Dimon, CEO of JPMorgan Chase, recently warned of a heightened risk of a significant correction in the US stock market within the next six months to two years. 

Jake Ostrovskis, head of trading at Wintermute’s over-the-counter desk, noted that participants in the market remain hesitant as they grapple with the implications of the largest liquidation event on record. He added that this caution persists amid ongoing speculation about vulnerabilities that might still exist within the financial system.

Bitcoin

When writing, BTC was trading at $109,688, losing its nearest support floor of $110,000. 

Featured image from DALL-E, chart from TradingView.com 

❌