Delta Unites American, United & Southwest Airlines in a Bold Aviation Power Play as Iran Conflict Sparks Panic, Sky-High Fares and Unstoppable Revenue SurgeDelta Unites American, United & Southwest airlines in a bold aviation power play as Iran conflict sparks... Read More
Bitcoin searches for equilibrium at $70,000 while rising crude oil prices and tanking stock markets have investors worried over the future of inflation in the US.
A strong buy signal not seen since 2022 just flashed on Ether, but the altcoin needs to hold above a key price level to avoid invalidating the pattern.
XRP is sitting at a make-or-break level, and the signals are turning hard to ignore. The weekly chart shows price once again testing a long-standing ascending trendline, a zone that has repeatedly acted as a strong buying opportunity in past cycles. At the same time, momentum is quietly building beneath the surface. ETF inflows are climbing, and whales are pulling large amounts of XRP off exchanges, tightening supply just as price compresses near support.
With both technical and on-chain signals aligning, XRP’s current setup is starting to look less like consolidation, and more like a breakout waiting to happen.
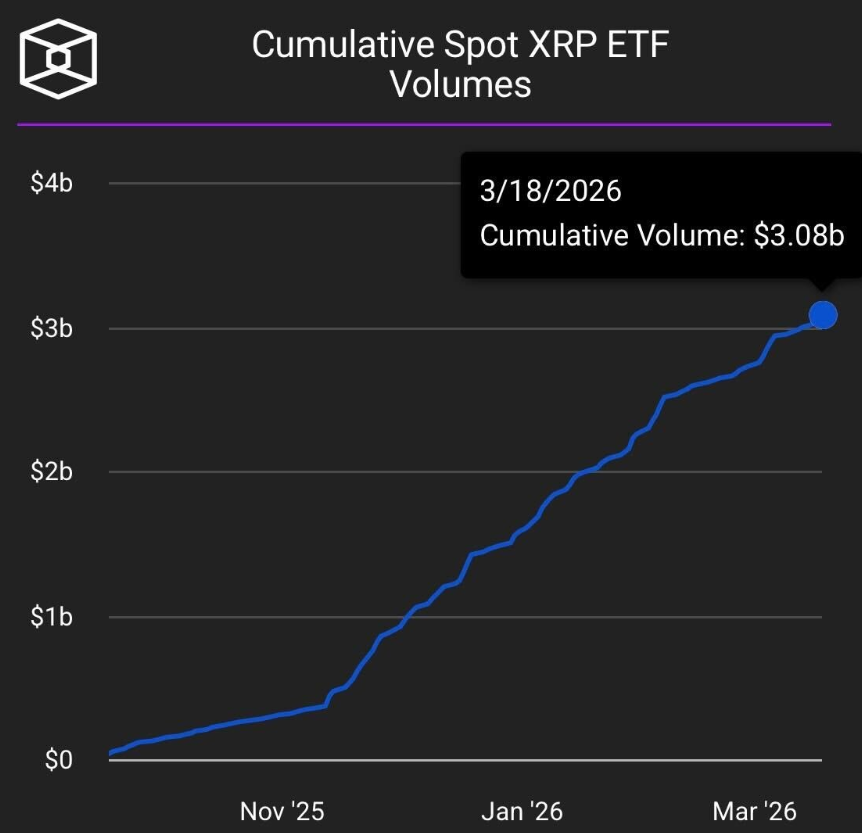
Institutional participation in XRP has strengthened notably in 2026, with cumulative inflows into spot-based investment products surpassing $1.4 billion. This represents a sharp increase in demand and pushes total tracked volumes beyond $3 billion.
Such sustained inflows typically reinforce price stability during corrective phases while establishing a base for medium-term expansion. The persistence of capital allocation into XRP-linked products indicates growing confidence among larger market participants, even as short-term price action remains subdued.
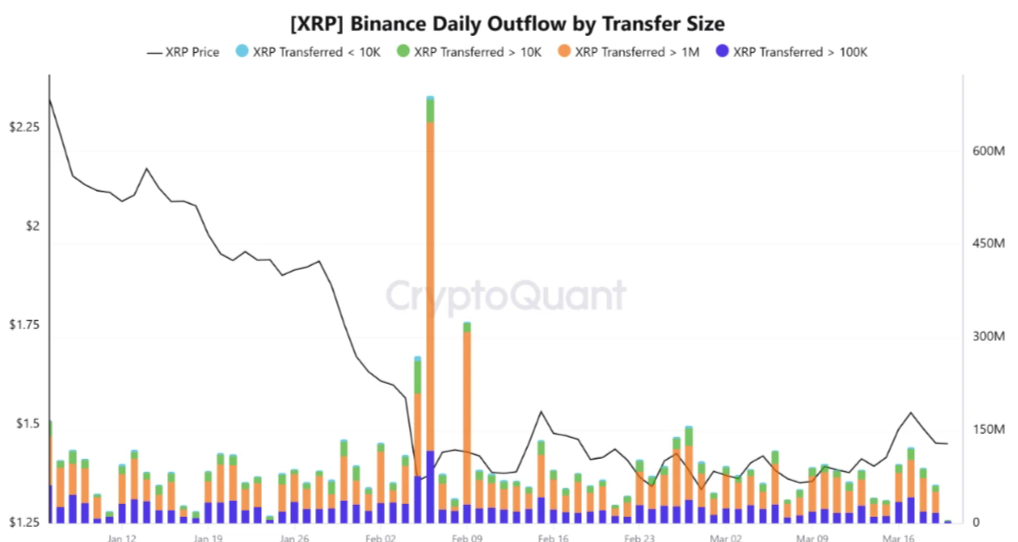
Large-Scale Whale Withdrawals Point to Supply Constriction
On-chain data highlights a parallel trend of significant XRP outflows from centralized exchanges, led predominantly by Binance. A single-day withdrawal of 530 million XRP in early February marked one of the largest movements in recent months, followed by consistent daily outflows averaging close to 50 million XRP through March.
Notably, transactions exceeding one million XRP continue to dominate activity, indicating that large holders are actively repositioning. This shift reduces available exchange liquidity and introduces the potential for supply-side pressure, a condition often associated with upward price repricing.
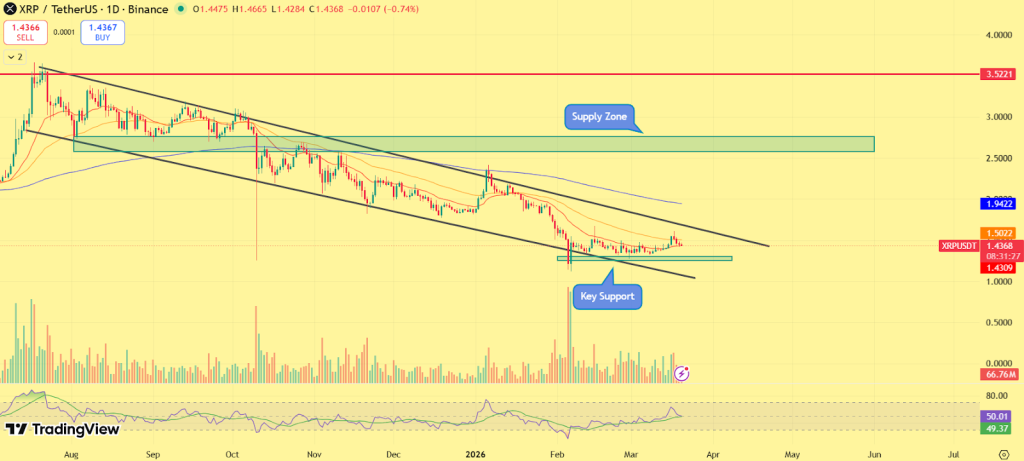
XRP remains within a broader descending channel, characterized by a sequence of lower highs since its previous peak. However, price action has begun to compress near the lower boundary of the structure, suggesting weakening bearish momentum.
Immediate support is established in the $1.40–$1.43 region, which has so far prevented further downside expansion. A secondary support level is positioned near $1.20. On the upside, initial resistance is observed at $1.50, followed by a more significant barrier between $1.90 and $2.00, where both trendline resistance and a historical supply zone converge.
A breakout above the descending resistance could invalidate the current structure and initiate a broader trend reversal.
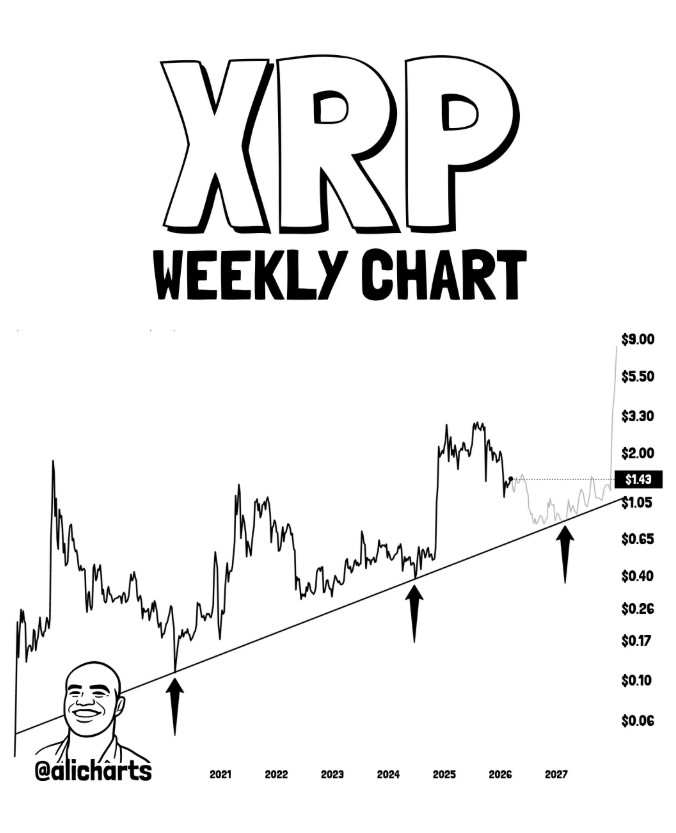
Market analyst Ali Charts has pointed to XRP’s long-term ascending trendline on the weekly timeframe, highlighting it as a key structural support. According to the analysis: XRP has respected this trendline across multiple cycles. Recent price action shows another bounce from this support zone. The structure suggests a potential higher-low formation
This external validation strengthens the broader technical outlook, indicating that XRP is not only stabilizing but doing so within a historically significant support framework.
Outlook: Accumulation Phase Nearing Resolution
XRP appears to be transitioning through a late-stage accumulation phase, supported by rising institutional inflows and continued whale activity. While price action remains constrained within a descending structure, the compression of volatility suggests that a decisive move may be imminent.
A confirmed breakout above the $1.90 resistance zone would likely open the path toward the $2.50–$3.00 range. Conversely, failure to maintain current support levels could delay recovery.
At present, XRP remains positioned at a critical inflection point, with both fundamental and technical indicators signaling the potential for a high-momentum move once key levels are breached.
PHA price just did what most altcoins dream of waking up from a nearly doomed stage, even get listed, and immediately rip higher. A fresh KRW trading pair listing on Bithumb lit the fuse, and the reaction wasn’t subtle. We’re talking a sharp intraday move, backed by aggressive on-chain activity and a sudden shift in trader positioning.
And yeah, this isn’t just hype, there’s actual data behind the chaos.
Listing Hype Meets Real Demand
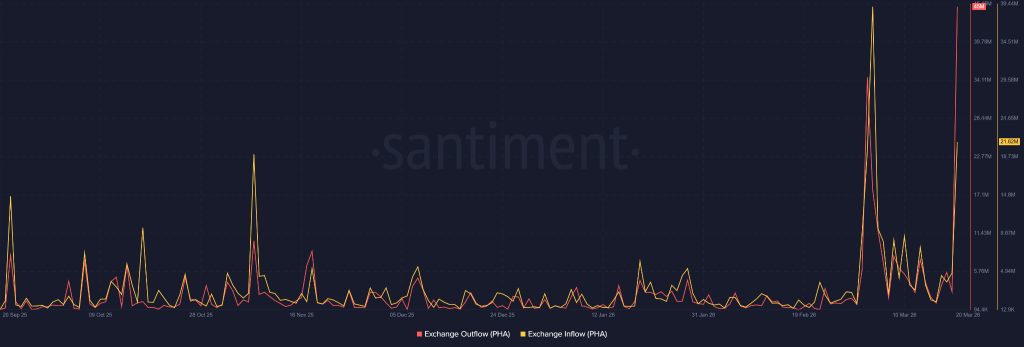
So here’s the deal. The Bithumb listing triggered a classic liquidity event, but instead of just inflows chasing the pump, something more interesting happened tokens started leaving exchanges.
Roughly 45 million PHA flowed out, while inflows lagged behind at 21.62 million. That imbalance screams accumulation. Traders aren’t just flipping; they’re pulling supply off the market, tightening availability, and effectively creating upward pressure.
Well, this kind of behavior usually doesn’t happen unless participants expect higher prices ahead. It’s not retail panic buying; it’s calculated positioning.
Whales And Metrics Flash Bullish
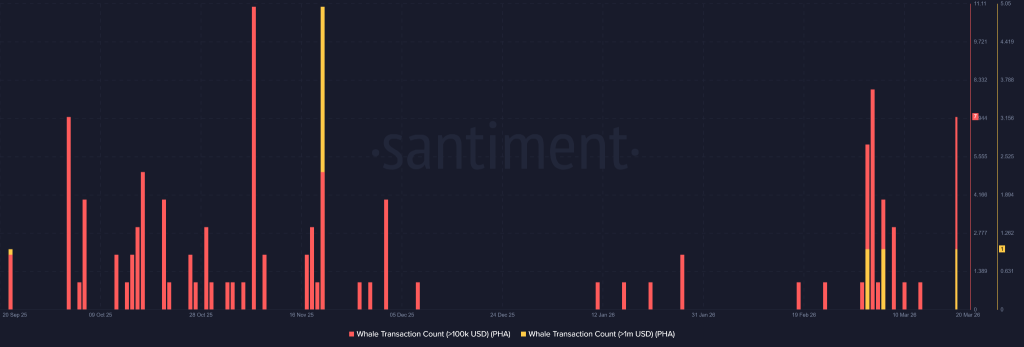
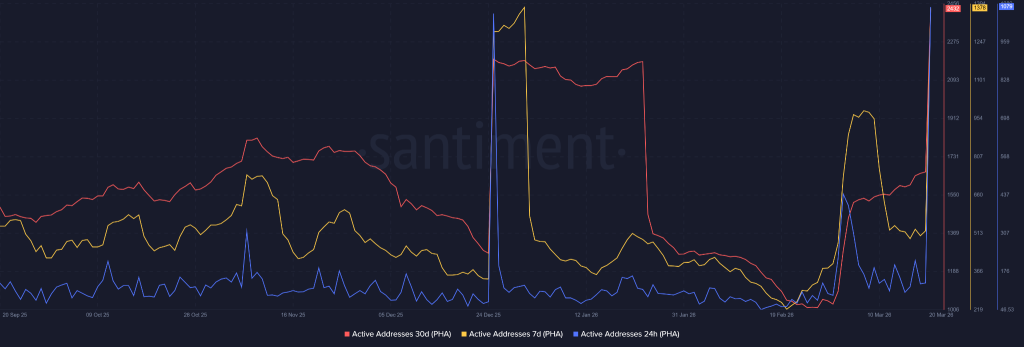
But let’s be real, exchange flows alone don’t tell the full story. Whale activity stepped in hard. Transactions above $100K spiked noticeably, confirming that bigger players weren’t sitting this one out. They showed up and they showed up fast.
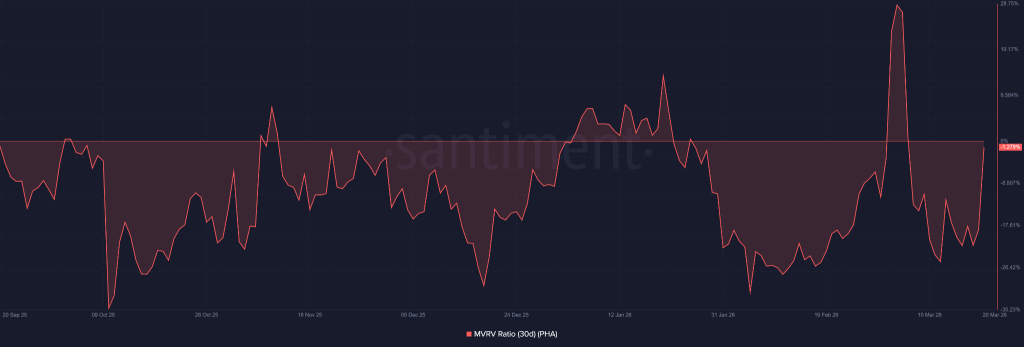
At the same time, the 30-day MVRV ratio surged, dragging average investor positions close to breakeven. That’s important. It means holders who were underwater are now seeing relief, which often reduces immediate sell pressure, at least temporarily.
Add to that a rise in active addresses, and you’ve got a textbook case of growing network participation. Not just price chasing but shows actual engagement.
PHA Price Technical Levels Ahead
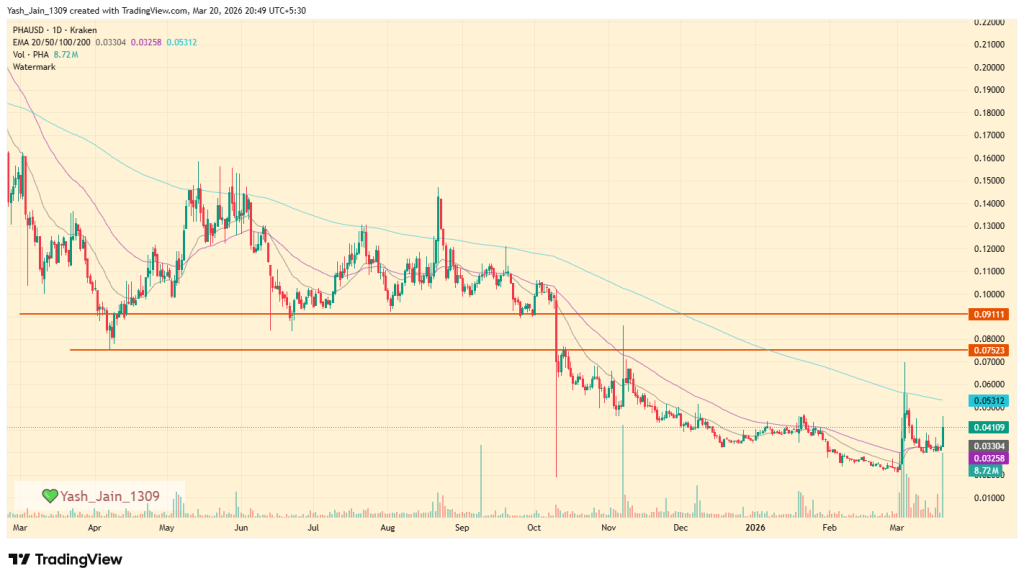
Now zooming out a bit. This rally didn’t come from nowhere infact the PHA price bounced from a monthly low near $0.021, marking a staggering 110% recovery, and 30% intraday surge. That’s not noise that’s clearly momentum that PHA price has just witnessed.
But momentum needs structure. Right now, the key level sits around $0.053, which aligns with the 200-day EMA. That’s the first real test. If bulls manage to flip it, the next logical targets stack up at $0.075 and $0.091.
Miss that breakout though? Things get messy again. Simple as that.
So, what’s next? If demand holds and exchange supply keeps shrinking, this move might have legs. But if the hype fades, as it often does, then PHA price could just as easily stall right where it is.
The KITE price just caught a sharp bid and no, it’s not random. A sudden 20% jump from the $0.18 support level has traders scrambling for explanations, but the trigger is surprisingly straightforward: narrative meets timing, and the market eats it up.
AI Narrative Sparks KITE Price Surge
It all kicked off with a well-timed post tapping into the growing hype around AI’s next evolution is autonomous agents. The argument? Moving from chatbots to agents isn’t incremental… it’s exponential. Think 10,000x more compute demand and 100x more consumption. Sounds ambitious. Maybe even a bit too neat.
But here’s where it gets interesting. The real bottleneck isn’t compute but it’s payments. Machines can’t swipe credit cards. And when you’re talking about thousands of microtransactions per second, the traditional financial system starts looking like a relic. That’s the gap KITE claims to fill: a native economic layer for machine-to-machine transactions.
Markets love a good “infrastructure of the future” story. And this one landed right on cue.
Jensen Huang just shared a massive insight on @theallinpod predicting a 1000000x scale up in AI. His logic is brilliant. Moving from simple chatbots to autonomous agents takes 10000x more compute. And because people gladly pay for actual work rather than just text generation the… pic.twitter.com/bPfW8e5vN6
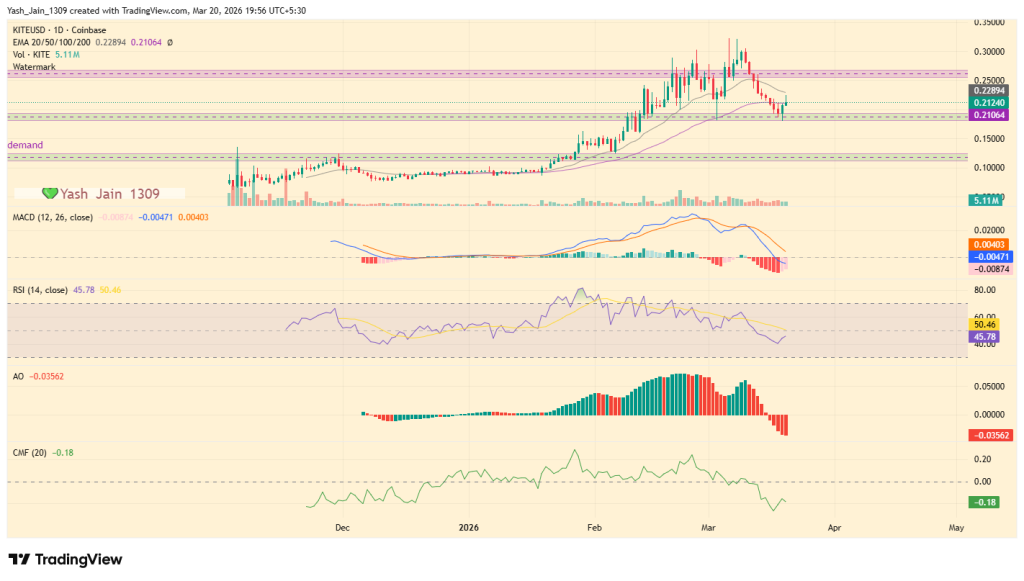
Now let’s strip away the hype and look at the chart. The KITE price bounced cleanly from $0.18 and is now wrestling with the 50-day EMA.
Momentum indicators are… cautiously optimistic. MACD is showing bearish pressure fading, which is a polite way of saying sellers are getting tired. RSI is pushing toward the midline, flirting with a shift into stronger momentum territory if it breaks higher.
And then there’s CMF which is still not screaming bullish, but definitely ticking upward. Translation? Money is starting to flow back in, just not aggressively yet.
Demand Spike Driven by Activity Surge
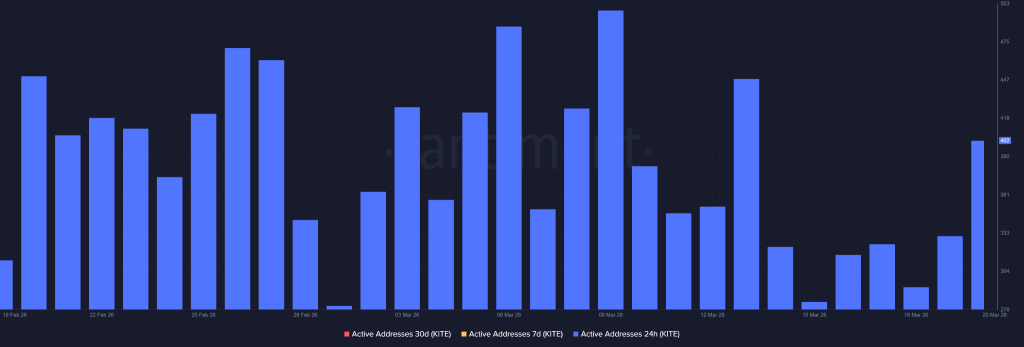
Well, this wasn’t just a narrative pump but a bit on-chain activity backed it up. A noticeable rise in 24-hour active addresses added fuel to the move, suggesting actual participation, not just speculative noise.
That said, let’s not pretend this is a straight line up. The immediate test sits around sustaining above that EMA band. If buyers keep pressing, the next logical move is a revisit toward $0.26. But if momentum stalls? This could just as easily fade back into the same range it came from.
Short-Term Outlook Remains Conditional
So, what’s next? The KITE price is at a crossroads. The setup is improving, sure but it’s not bulletproof. This is still a market that loves to overreact to narratives and just as quickly forget them.
If demand keeps building and indicators confirm, the move higher makes sense. If not, this rally risks becoming just another short-lived spike in a crowded altcoin landscape.
For now, KITE price is holding attention. Whether it holds momentum… that’s a different story.
Zcash price fell over 18% from its weekly high to $232, a level that aligns with a key trendline support that could determine whether the current pullback stabilizes or extends further. According to data from crypto.news, Zcash (ZEC) price shot…
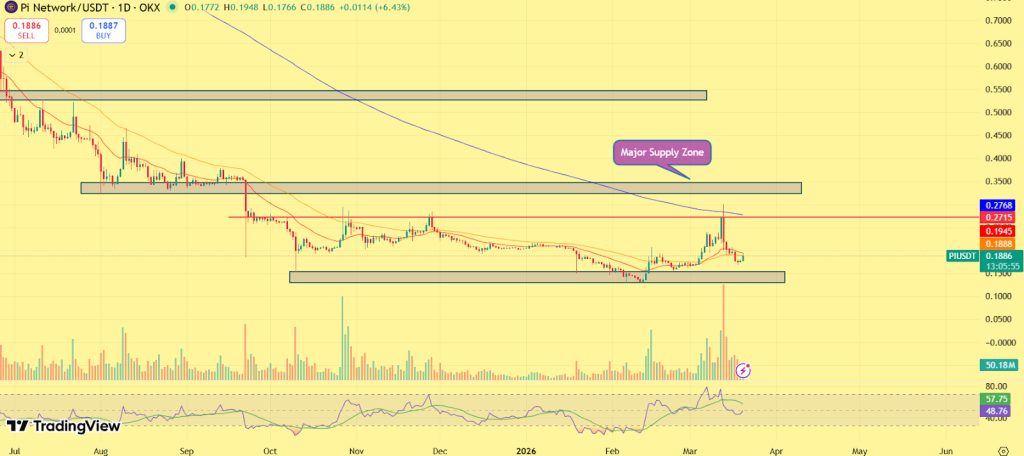
Pi Network (PI) price has bounced sharply today, rising over 8% to $0.1911, marking its strongest recovery attempt since the recent sell-off. After days of downside pressure, the latest move signals that buyers are stepping back in, absorbing supply as selling momentum fades. The rebound comes at a critical time, with PI attempting to stabilize after a correction driven largely by profit-taking.
This shift suggests the market may be transitioning from weakness to early recovery.
A critical element supporting the current recovery is the rollout of Protocol 20, which reinforces Pi Network’s long-term development trajectory. The upgrade is designed to enhance:
The Pi Mainnet has successfully upgraded to Protocol 20, laying the foundation for supporting smart contracts. Node operators, please ensure your systems are up to date and stay tuned for instructions regarding the upcoming v21 upgrade.
User and developer engagement, supporting future adoption
In early-stage ecosystems like Pi Network, upgrades serve as confidence anchors, signaling continued progress and reducing uncertainty. While they may not trigger immediate price surges, they often play a key role in stabilizing sentiment during corrective phases. In this context, Protocol 20 is acting as a fundamental cushion, supporting the current rebound.
PI Price Analysis: From Sell-Off to Rebound – What the Chart Is Showing Now
The Pi Network (PI) price has recently gone through a sharp correction, where the chart shows a clear rejection from the $0.25–$0.27 supply zone, triggering a wave of profit-taking. This led to a controlled decline, with price sliding back toward the $0.17–$0.18 support area, where buyers began to re-enter.
Instead of breaking down further, PI formed a stable base, indicating that selling pressure was being absorbed. This phase reflects a shift from aggressive selling to demand-driven stabilization, often seen near short-term bottoms. The latest move adds to this narrative. Today’s 8% rebound to $0.1911 signals that buyers are stepping back in with intent, pushing price away from support and attempting to reclaim lost ground. However, the recovery is still in its early stages and remains below key resistance. Now, the chart is clearly approaching a critical decision zone.
Major resistance: $0.25–$0.27 (trend reversal zone)
Key support: $0.17–$0.18
If PI manages to break and hold above the $0.20 region, it could build momentum toward the upper range. A decisive breakout above $0.27 would confirm a trend reversal and continuation of upside. On the flip side, failure to sustain the rebound may keep price range-bound, with another test of support possible. At this stage, the chart reflects a classic transition phase, from sell-off to stabilization, and now potentially toward recovery, with the next move dependent on how price reacts at resistance.
Outlook: Recovery Building, But Breakout Confirmation Needed
The Pi Network (PI) price is showing early signs that the worst of the correction may be over, supported by easing sell pressure and strengthening fundamentals.
However, the recovery remains incomplete without confirmation. A decisive move above the upper resistance zone would validate bullish momentum and signal a transition into a new trend phase. Until then, PI is likely to remain in a consolidation-driven recovery, where structure continues to develop. For now, PI token is not trending, it is preparing.
FAQs
Why is Pi Network (PI) price up today?
Pi Network price is up over 8% to $0.1911 as buyers step in near the $0.17–$0.18 support zone, absorbing selling pressure following a sharp correction from the $0.25–$0.27 supply area.
What is Protocol 20 and how does it affect Pi Network?
Protocol 20 is a core upgrade enhancing network scalability, efficiency, and ecosystem infrastructure. It reinforces Pi Network’s long-term development, helping stabilize market sentiment during the current price recovery.
Is Pi Network’s price recovery sustainable?
The recovery shows early strength, but sustainability depends on breaking above $0.20–$0.21 resistance. Without a decisive move higher, Pi may enter a consolidation phase before attempting another breakout.
What is Pi Network price prediction for 2026?
Pi Network could trade between $0.25–$0.50 if growth continues, with upside toward $0.70. Key support may hold near $0.17, depending on demand and adoption.
Kaspa price shot up to a seven-week high of $0.041 on Thursday before settling at $0.037 at press time. It has now confirmed a breakout from a multi-year falling wedge pattern, which could spur more gains ahead. According to data…
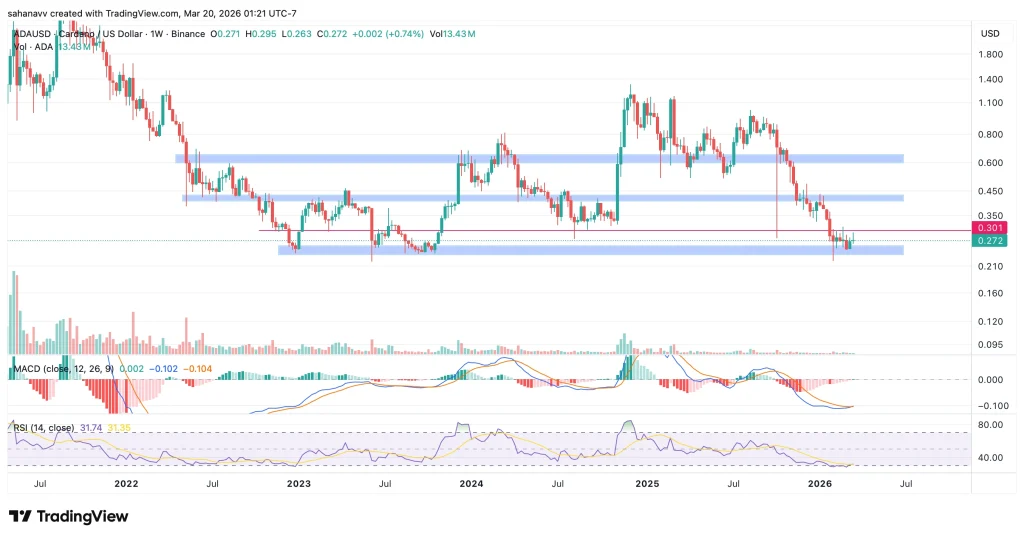
Cardano is beginning to show signs of stability after weeks of sustained pressure, with the price now hovering around $0.27. The recent pullback from higher levels appears to be slowing, as ADA price continues to hold above the $0.23–$0.26 support zone—a range that has repeatedly acted as a base in the past.
While the broader trend still leans bearish, the latest weekly structure suggests that selling pressure may be fading, setting the stage for a potential shift in momentum.
Chart Structure Shows a Market in Transition
A closer look at the weekly chart reveals a clear pattern. Cardano is still trading within a well-defined range, rather than a confirmed trend. The price has been making lower highs over the past few months, but the downside is now meeting consistent demand near $0.23. At the same time, every recovery attempt has faced resistance near the $0.30–$0.31 zone, keeping the price locked within this range.
This kind of structure usually points to one thing: The market is no longer trending, but it’s deciding.
The indicators add another layer to this setup. The RSI is hovering near 31, brushing against oversold levels, which typically reflects weakening bearish momentum. Meanwhile, the MACD remains negative, but the histogram is flattening—an early sign that the intensity of selling is declining.
However, there’s a key detail here: there’s still no strong bullish expansion on the chart. That means buyers are stepping in—but not aggressively enough to flip the trend just yet. At this stage, Cardano is sitting at a level that could define its next move.
If the current support continues to hold, ADA could attempt a move back toward $0.30, with further upside opening toward $0.42 if strength builds
If the price continues to move sideways, it would signal accumulation, not weakness
But if the $0.23 level breaks, the structure weakens again, exposing the price to deeper downside
Conclusion: What Comes Next for ADA Price?
Cardano is no longer in a strong downtrend—but it hasn’t confirmed a recovery either.
What’s emerging instead is a transition phase, where selling pressure is easing, but buyers are yet to take full control. The next few weekly closes will be critical in determining whether this develops into a sustained rebound or remains a short-lived pause within a broader bearish structure.
Besides, as mentioned by a popular analyst, Ali, Cardano has printed a TD Sequential “9” buy signal, a setup that typically appears near the end of extended downtrends. Historically, this pattern tends to precede short-term upward expansions lasting one to four weeks, rather than immediate trend reversals.
XRP price rebounded back above $1.45 on Friday after bulls managed to defend the $1.40 support during the market-wide bloodbath over the past day. After falling nearly 11% from its weekly high to $1.45 on March 19, XRP (XRP) price…
Ethereum price has fallen by over 35% since the beginning of this year. However, a bullish pattern forming on charts now suggests a potential bounce back to earlier levels if confirmed. According to data from crypto.news, Ethereum (ETH) price was…
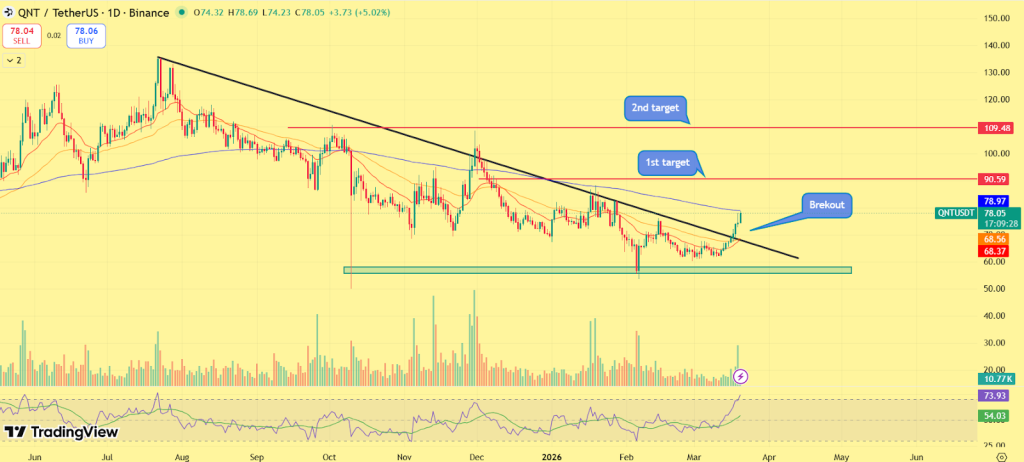
Quant (QNT) price is extending its upward move, currently trading around $78 after a sharp 19% weekly surge. The rally reflects a steady shift in momentum, with buyers consistently stepping in on dips and pushing price toward a key resistance zone.
Unlike short-lived spikes, this move has developed through controlled price expansion, indicating that the market is building a stronger foundation rather than overheating. With QNT now approaching the $80 level, attention is turning toward a potential breakout.
Robinhood Listing Adds Fresh Momentum to QNT Rally
A key catalyst behind the recent upside is QNT’s listing on Robinhood, which has significantly expanded access to retail investors. The platform confirmed that QNT is now available for trading on Robinhood Crypto, including major markets like New York. This is a meaningful development, as Robinhood often acts as an entry point for new market participants.
Early wallet activity suggests initial inflows and accumulation, even if volumes remain modest for now. Historically, such listings tend to trigger:
Increased visibility and accessibility
Fresh retail-driven liquidity
Short-term momentum acceleration
The timing is particularly notable, as the listing coincides with an already strengthening technical setup, amplifying the impact of the rally.
Quant Price Analysis: Will QNT Reach $100?
QNT price structure is showing a clear trend reversal. After months of trading under a descending trendline, price has now pushed higher and is attempting to break above this resistance. This marks the first meaningful shift away from the previous downtrend.
QNT/USDT price chart also highlights a strong demand zone near $55–$65, where repeated downside attempts were absorbed. This base has acted as a foundation for the current rally, reinforcing the idea of accumulation before expansion. Momentum is gradually strengthening, with indicators trending higher while still leaving room for further upside.
Key Levels to Watch
Immediate resistance: $88-90
Next target zone: $90–$100
Support: $68-$72
Demand zone: $60–$65
A confirmed breakout above $80 would validate the bullish structure and open the path toward the $90 region, which aligns with the next major supply zone. If rejected, price may retest the $70 level, but the broader structure would remain intact as long as higher lows continue to form.
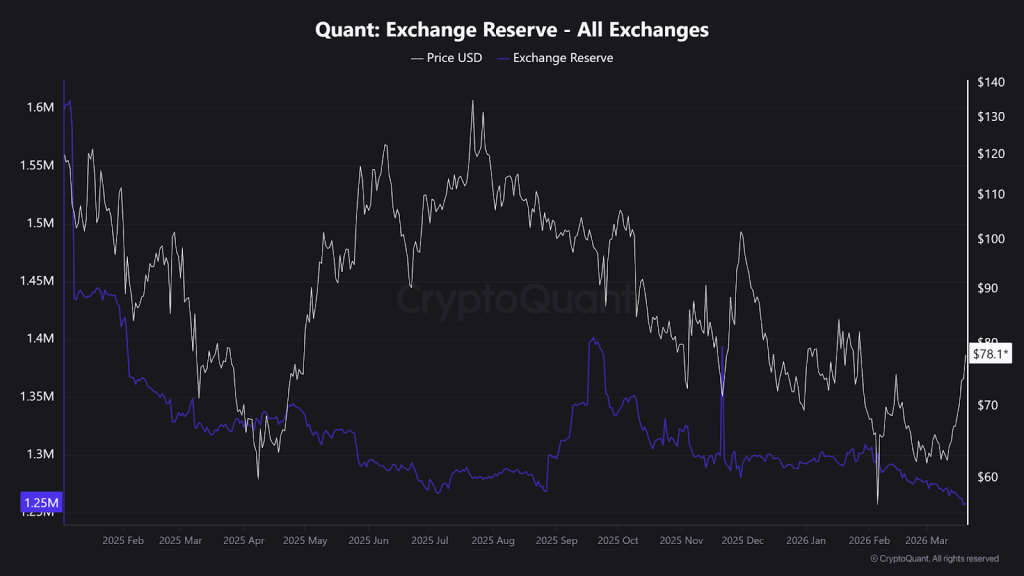
On-Chain Data Points to Accumulation Phase
Supporting the rally, on-chain signals indicate that QNT is currently in an accumulation phase rather than distribution. Exchange balances have shown signs of decline, suggesting that tokens are being moved off exchanges and into long-term holding. At the same time, trading volume has increased alongside price, pointing to real demand rather than thin market conditions.
Derivatives activity is also picking up, reflecting growing participation and positioning among traders. This combination of tightening supply and rising demand typically creates favorable conditions for continued upside, especially when aligned with strong technical structure.
Final Outlook: Momentum, Structure, and Narrative Begin to Align
The current setup is being driven by a convergence of key factors. The Robinhood listing has improved accessibility, on-chain data points to accumulation, and the technical structure is shifting from downtrend to potential reversal. This alignment across fundamentals, sentiment, and price action increases the probability of a sustained move.
Historically, such conditions often precede strong directional expansions, as multiple layers of the market begin positioning in the same direction. With strong weekly gains, improving demand, and a breakout attempt underway, QNT is positioning itself as one of the more structurally bullish altcoins in the current market phase.
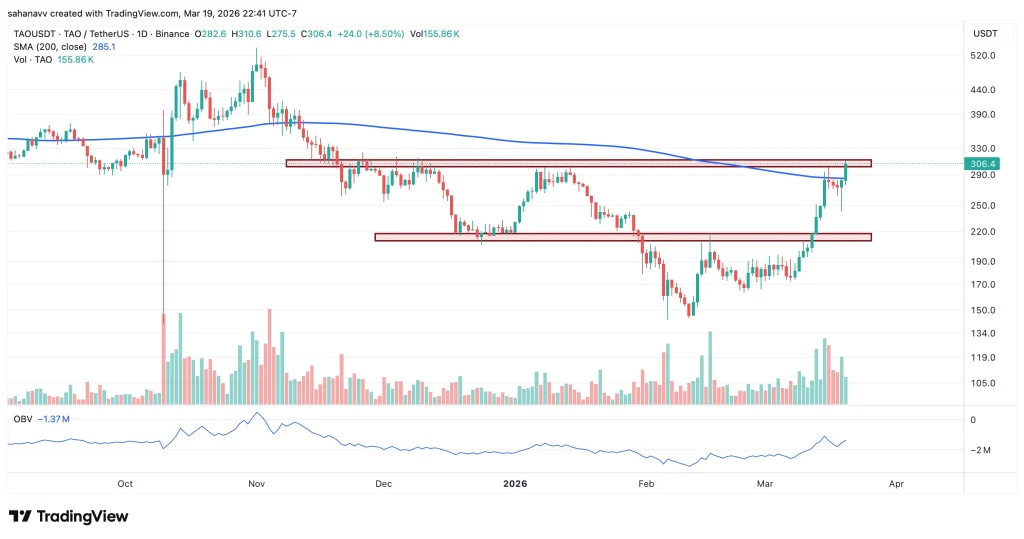
Bittensor price has drawn strong market attention since February, rallying even as the broader market consolidated. Bulls stepped in aggressively below $250, driving TAO back toward a critical resistance zone. The token now trades near $304, up around 16.5%, as it retests the psychologically significant $300 level that has capped prior rallies.
The move is supported by a sharp 90% surge in 24-hour trading volume to $645 million, reflecting strong buying interest. However, momentum indicators point to overbought conditions, making the $300 zone pivotal—where a confirmed breakout, rejection, or reversal could shape the next long-term trend.
What’s Fueling Bittensor’s Rally?
Beyond price action, the move aligns with growing interest in the AI-crypto sector, where Bittensor continues to stand out due to its subnet-driven architecture. The expanding subnet ecosystem, accounting for a significant share of the network’s total valuation, reflects increasing demand for decentralized machine learning resources.
This suggests that the rally is not purely speculative but partially backed by network-level growth and capital rotation into AI-focused assets. However, the sustainability of this trend will depend on whether these metrics continue to expand. Sharp volume spikes and rapid price appreciation often precede short-term exhaustion, especially when momentum indicators already signal overbought conditions.
Can TAO Sustain Above $300? Key Levels to Watch
Bittensor price is now testing a major supply zone between $300 and $310, a level that has previously acted as a strong rejection area. The current move has pushed the price to around $306, marking a clean recovery from the February lows near $150–$170, translating to a nearly 80–90% upside rally in just a few weeks. The 200-day SMA, currently near $285, has been reclaimed, signalling a shift in macro trend bias toward bullish territory.
However, the TAO price is now extended above this average, increasing the probability of short-term mean reversion if momentum slows.
From a market structure perspective, this is the first higher high attempt after a prolonged downtrend, which makes this level structurally critical. Volume analysis supports the breakout attempt, as the recent candles show consistent volume expansion, not a single spike, which indicates sustained participation. Additionally, On-Balance Volume (OBV) is trending upward, confirming that buying pressure is gradually increasing, aligning with the price breakout attempt.
Key Scenarios
Bullish Case (Continuation):
A confirmed daily close above $310
Opens the path toward $340–$360 (next supply zone from prior structure)
Bearish Case (Rejection):
Failure to hold above $300
Likely pullback toward $260–$280 (previous consolidation + 200 SMA zone)
Breakdown Risk:
If $260 fails, the price may revisit $220 support, which acted as a base during accumulation
Breakout or Bull Trap? The Decisive Moment for TAO
Bittensor’s rally is clearly backed by strong participation and a renewed AI-driven narrative, but the real test lies in whether this momentum can translate into sustained acceptance at higher levels. Sharp recoveries often attract late buyers, which can temporarily inflate price action without establishing long-term strength.
The broader setup presents a classic dilemma. On one hand, a near 90% recovery from February lows, rising volume, and an upward-trending OBV suggest that buyers remain in control. On the other hand, the price is now extended above key averages and testing a historically strong supply zone—conditions that often precede short-term exhaustion.
Ultimately, the next move will likely define the medium-term trend. Until a clear breakout is confirmed, the current rally of Bittensor (TAO) price remains promising—but unproven.
Bitcoin price marched back above $70,000 on Friday morning, erasing part of the losses seen over the past two days. However, its momentum quickly gave up as Asian tech stocks dropped lower. After dropping over 8% to a weekly low…
Rhode Island Joins Massachusetts, New Hampshire, New York, Washington, Minnesota and More US States in Becoming the Safest Road Trip Destinations for Spring Break American Travellers: Everything You Need To Know is HereRhode Island Joins Massachusetts, New Hampshire, New York,... Read More
Arthur Hayes, a veteran trader and co-founder of BitMEX, has once again placed a bet in ETHFI nearly a month after a possible exit from the token. According to a March 19 X post by on-chain tracker Lookonchain, Hayes invested…
The cryptocurrency market is red today, Bitcoin lost its strong support at $710000 USD. Some altcoins, such as RIVER, Dexe, Quant, and JUST, are moving in opposite directions. Let us examine the strength of this trend continuation.
Bitcoin, after losing its critical support at $71,000, tested the $ 70,000 support today, indicating increased volatility amid the war. The world’s largest cryptocurrency looks bound to range between $70K USD and $74K USD. Ethereum (ETH), BNB, XRP, and Solana (SOL) all follow the Bitcoin trend and show negative 24-hour growth.
RIVER Coin Eyes at $40
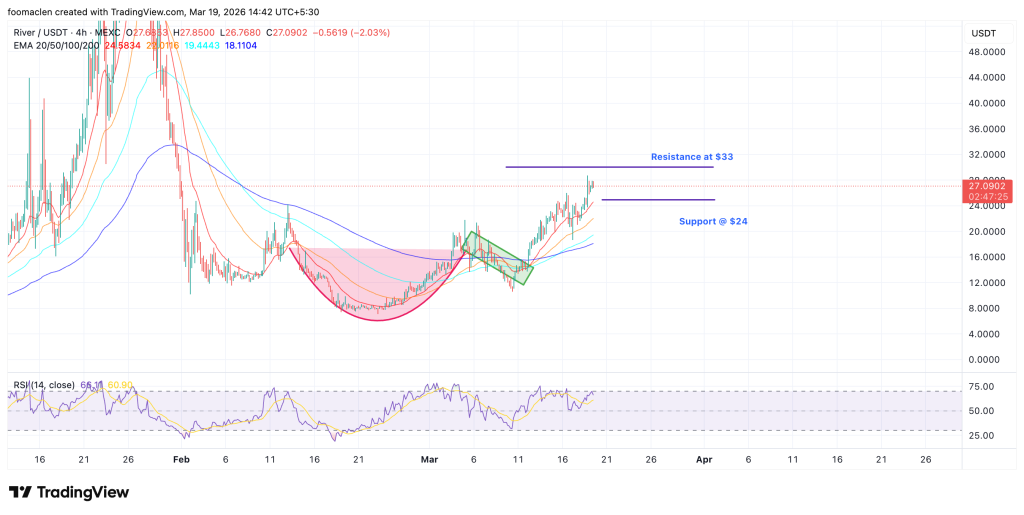
RIVER Coin is now trading at $26.9 USD, above all moving averages with a sharp 24hr surge of 12%. Following the successful cup-and-handle pattern, this cryptocurrency has risen by nearly 50% over the past week and by 112% over the past month.
Driven strong system updates like reaching $27M in staking value ( 1.04M tokens), then the DIA Oracle Partnership on March 12, PancakeSwap 340% APR pool launch, and the River4Fun rewards points program. Additionally, the SatUSD listing on Stargate Finance further amplified community sentiment.
RIVER/USDT 4h Chart is bullish
As we see, RIVER/USDT is trading above all the major EMAs and holds support at the 21 EMA and the 50 Day EMA golden crossover.
RIVER Coin is Still Bullish
A rejection near $24 was observed, but the asset pulled back above $27, indicating strong buyer interest.
A psychological resistance is at $30, passing which the RIVER price can trigger to $33 to $35 zone. Support is at $24, which is strong here. RSI at 69 is strong but not in an extreme overbought zone yet.
With the current liquidity and market structure, the price is headed towards $40.
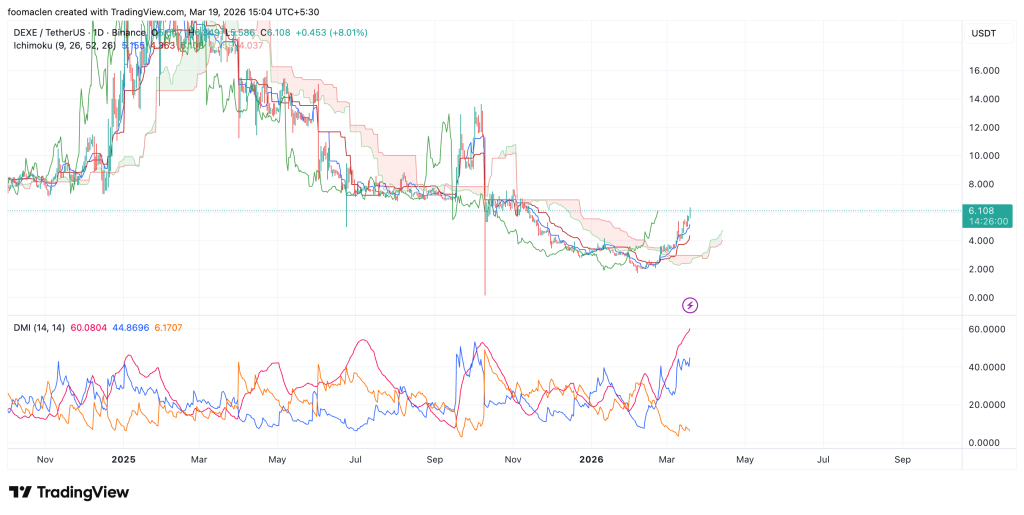
Dexe Coin Hits 4-month high
The governance token Dexe is one of the best performing crypto in recent times. Dexe coin, at the time of writing, has surpassed $6, a strong resistance level, and is now changing hands at $6.14.
The Coin has moved 13.24% in the last 24 hours and 162% in the last 30 days of trading.
DEXE/USDT Chart Prints Bullish picture.
As seen on the DEXE/USDT 4-hour chart, the short-term and mid-term momentum continues to be bullish. Surging above the $6 territory has pushed bulls into a stronger zone to hit the next ultimate resistance at $7.5 and further at $8.3.
Dexe Coin Bullish for $8
After we apply the Ichimoku Cloud indicator, which shows the moving resistance and support of an asset, it prints a bullish scenario as the price trades above the cloud.
Also Applied, Directional Movement Index (DMI) that reflects buying and selling pressure, now shows a positive directional index (+DI) resting above the negative directional index (-DI).
Additionally, supported by the consistent positive closing of derivatives markets since 13 March. The tokens ong/short ratio has returned 1 value in the last week.
If the momentum changes, the Dexe coin price has strong support at a low of $4.42
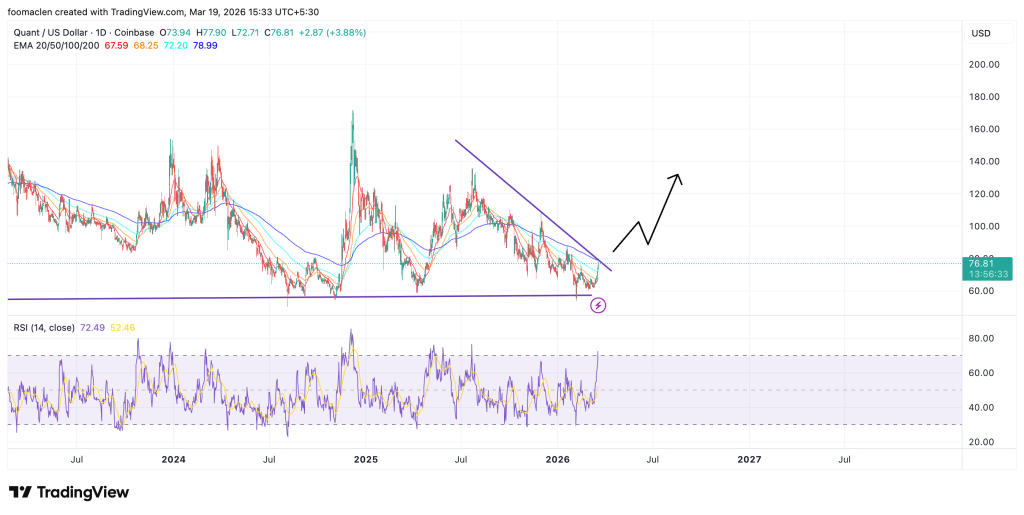
Quant, QNT needs a push.
QNT/USDT, at the time of writing, is $75.91 with a 24-hour surge of 5.74% and a weekly surge of 20%. The crypto in the daily time frame chart can be seen creating a triangle tight consolidation pattern, usually a setup for a potential breakout.
A break below this descending resistance line will take QNT into a bound zone between $83 to $120, and further gains thereafter to market momentum.
Quant QNT coin needs a push
The ultimate level of the 200-day EMA, priced at 79.36, is a barrier; if breached, the break above is confirmed. The momentum indicator RSI is at 72, not highly overbought, and may face a little flattening ahead. MACD has a bullish crossover still.
Quant coin presents indicators, and market sentiment is neutral to bullish, if there is invalidation of the trend, we have support at $68.3 and then at $62.
Pi Network price managed to brush off the bearish sentiment prevailing in the broader crypto market amid a major mainnet upgrade that introduced smart contract functionality to the Pi ecosystem. According to data from crypto.news, Pi Network (PI) price initially…
Ethereum developers are pushing one-click staking to simplify validator operations, attract institutions and strengthen decentralization across the network.
After rallying to a multi-week high of $1.60, XRP price crashed amid a market-wide downtrend triggered by escalating geopolitical and macroeconomic tensions. According to data from crypto.news, XRP (XRP) price fell 4.4% over the past 24 hours to $1.46 at…
Bitcoin price erased all of its gains from this week as it crashed to a critical support level amid hotter-than-expected PPI data and Jerome Powell’s Federal Reserve speech that cast a shadow over any interest rate cuts for this year.…
Solana price fell 4% on Wednesday, moving closer towards the $90 support amid a broader market downturn triggered by hotter than expected U.S. PPI data. According to data from crypto.news, Solana (SOL) price fell to an intraday low of $90.4,…
Uniswap price risks a drop to $3.3 in the coming sessions if it confirms a break below a key trendline support on charts. According to data from crypto.news, Uniswap (UNI) price fell 3.8% on Wednesday, March 18, to $3.85 at…
Hyperliquid price rallied over 20% in the past seven days, reclaiming $40 as support, driven by record commodities trading activity on its perpetual futures markets. According to data from crypto.news, Hyperliquid (HYPE) price rallied 22% to a four-month high of…
Spot Ethereum exchange-traded funds drew in $138.2 million in net inflows over the past day, their highest single-day inflows since Feb. 25. According to data compiled by SoSoValue, BlackRock’s ETHA led the inflows of the day with $81.7 million entering…
Bitcoin price fell back under the $74,000 support level after three straight days of gains as investors remained cautious ahead of the Federal Reserve’s rate cut decision scheduled for later today. After rallying over 7% and touching nearly $76,000 on…
Delta, United, American, JertBlue, Southwest and more US airlines stocks rising sharply, but the tourism situation is volatile—and the contrast is intensifying fast.
Pi Network price has fallen by over 38% as investors sold the Kraken listing news. Pi Network (PI) price has dropped over 10% over the past 24 hours and 38% from its highest point on Friday, March 13. It remains…
Zcash price shot up over 25% on Tuesday, outpacing the broader crypto market and taking the spot of the leading gainer of the day. According to data from crypto.news, Zcash (ZEC) price briefly hit a daily high of $288.12 on…
XRP price hit a multi-week high of $1.6 on March 17 before settling around $1.5. Can it hold the key support level as whale demand is back? According to data from crypto.news, XRP (XRP) price hit $1.60 on Tuesday, March…
Ethereum price rallied to a six-week high of $2377.64 on Tuesday as institutional investors continue to accumulate the asset. According to data from crypto.news, Ethereum (ETH) price rose 6% to hit $2,377.64 on March 17, its highest level since the…
Bitcoin price briefly surged to a six-week high of $75,937 on Tuesday, as over $330 million in short positions were liquidated in the past 24 hours. According to data from crypto.news, Bitcoin (BTC) price touched an intraday high of $75,937…
Pepe price rose as the best performer in the crypto market amid a market-wide recovery triggered by Bitcoin’s surge past $74,000 support. According to data from crypto.news, Pepe (PEPE) price shot up 21% to a two-week high of $0.000040 as…
Solana’s price rallied over 6% to a five-week high of $94 on Monday amid a broader market rebound. According to data from crypto.news, Solana (SOL) price rose nearly 7% to $94.07 on March 16, reaching its highest level since early…
Bitcoin price rallied to a 5-week high of $74,157 on Monday morning amid institutional and whale accumulation. Can the bellwether climb past the $75,000 psychological support level ahead of the Federal Reserve interest rate decision set to be revealed later…
Synthetix price moved slightly higher as the project published its roadmap for 2026, which includes token buybacks and new trading products. At press time, Synthetix (SNX) token traded at $0.3251, up about 2.9% in the last 24 hours. The token…
The Official Trump token surged on heavy trading after news spread that large holders could receive invitations to a private event at Mar-a-Lago. At press time, The Official Trump (TRUMP) traded at $4.28, up about 52% in the past 24…
Ethereum’s price rallied to a weekly high of $2,144 on Friday following the strong debut of investment manager BlackRock’s staked Ethereum ETF. According to data from crypto.news, Ethereum (ETH) price shot up nearly 6% to $2,144 during Friday morning Asian…
Bitcoin price is consolidating beneath major resistance near $72,400 as volatility compresses and momentum weakens. Bitcoin’s (BTC) price action has entered a period of low volatility as the market consolidates beneath a major resistance cluster near the upper boundary of…
A new report digs dip into short-term Bitcoin price trajectory, citing the U.S. mid-term elections as a key catalyst that could spark a rally. Bitcoin (BTC) could see a strong move higher after the next U.S. mid-term elections, according to…
XRP price has gone nowhere in the last 30 days as third-party data reveals that demand from Wall Street investors has stalled. Ripple (XRP) token was trading at $1.3825 today, March 12, inside a range it has remained at in…
Ethereum’s price has risen for four consecutive days and is now hovering around the crucial support level of $2,000, as BlackRock launches its first staking ETF today, March 12. Ethereum (ETH), the second-biggest cryptocurrency, trades at $2,056, inside a range…
AVAX price hovered near a key level on Thursday as the market reacted to the launch of a new exchange-traded fund tied to the token. At press time, Avalanche (AVAX) traded at $9.58, down about 0.8% over the past 24…
PUMP price edged higher on Thursday as traders speculated about the project’s potential expansion beyond its current ecosystem. At press time, Pump.fun (PUMP) was trading at $0.00206, up about 4% in the past 24 hours. Over the past week, the…
Looking for the best altcoins to buy amid the ongoing Iran-US war volatility? This article highlights some of the top coins to buy for big gains as the war goes on and as many tokens become bargains. Hyperliquid Hyperliquid (HYPE)…
Bitcoin price risks a drop back to the $65,000 zone as bearish macroeconomic forces continue to impact investor risk sentiment. According to data from crypto.news, Bitcoin (BTC) price fell 4.8% over the past 7 days, dropping below the $70,000 support…
Geopolitical tensions have risen to new levels, disrupting the global trade supply chain, and in the midst of it, the AI frenzy sees a major risk, with suppliers getting cut off from economic resources. Asian Suppliers Are Heavily Dependent On Energy Imports From the Middle East, Creating Huge Long-Term Risks When we talk about the AI frenzy, several risks need to be addressed to ensure the pace doesn't slow down, and one of the major ones is supply chain disruptions. We have already seen a glimpse of it with tariffs under the current US administration, and how difficult they are […]
Intel's packaging services are being considered a viable alternative to TSMC's CoWoS, as supply constraints are forcing US fabless customers to seek other options. Intel's EMIB Packaging Orders Could Reach 'Billions in Revenue' Moving Into H2 2026; a New Prospect For the Foundry Business Advanced packaging has emerged as a major driver of computing power in modern-day AI architectures, and alongside semiconductors, solutions like CoWoS are seen as vital for firms like NVIDIA and AMD. With the start of the AI frenzy, advanced packaging has been dominated by TSMC, but as demand for CoWoS and derivatives ramps up, a supply […]
Intel's CFO, David Zinsner, took the stage at the Morgan Stanley conference, and based on his comments on the foundry front, Team Blue looks a lot more confident about division breakeven. Intel's 18A-P & 14A Will Prove to Be Effective Solutions For External Customers; Packaging To Bring 'Billions' In Revenue Under CEO Lip-Bu Tan, Intel has been entering the foundry market at a time when the AI frenzy significantly drives customer demand. One of the more significant achievements under Tan was the successful ramp-up of Panther Lake, and according to Zinsner, 18A has delivered on expectations, with yield rates improving […]