The Bitcoin price continues to trade within a defined $60,000–$70,000 range, but this lack of movement is not random—it reflects a market in equilibrium, not expansion. Spot demand is gradually absorbing sell-side pressure, while derivatives have reset, removing excess leverage. As a result, volatility has cooled, and price action has stabilized.
But stability is not strength.
Without a clear catalyst or aggressive demand, Bitcoin remains in a compression phase, where both buyers and sellers are active, yet neither side has enough conviction to drive a sustained move. On-chain data from Glassnode explains why the breakout is still missing.
Supply in Loss Signals: Selling Pressure Is Being Absorbed
The “Total Supply in Loss” metric shows a recent spike, indicating that a large portion of BTC holders are currently underwater. Historically, this phase often leads to increased sell-side pressure, as weaker hands exit positions.
However, the price has not collapsed. This suggests that spot demand is absorbing supply effectively, preventing a breakdown. While this is constructive, it does not indicate strength—it reflects balance between buyers and sellers, not dominance.
Realized Loss Spikes Point to Capitulation — But Not Expansion
On-chain Glassnode data shows a rise in realised losses, particularly among short-term holders. This typically marks local capitulation events, where panic selling flushes out weak participants. Historically, such phases can form a base, but only if followed by strong inflows.
Right now, that second part is missing. The market has absorbed losses, but there is no clear follow-through demand, keeping Bitcoin stuck within its current range.
Derivatives Reset Removes Fuel for Breakout
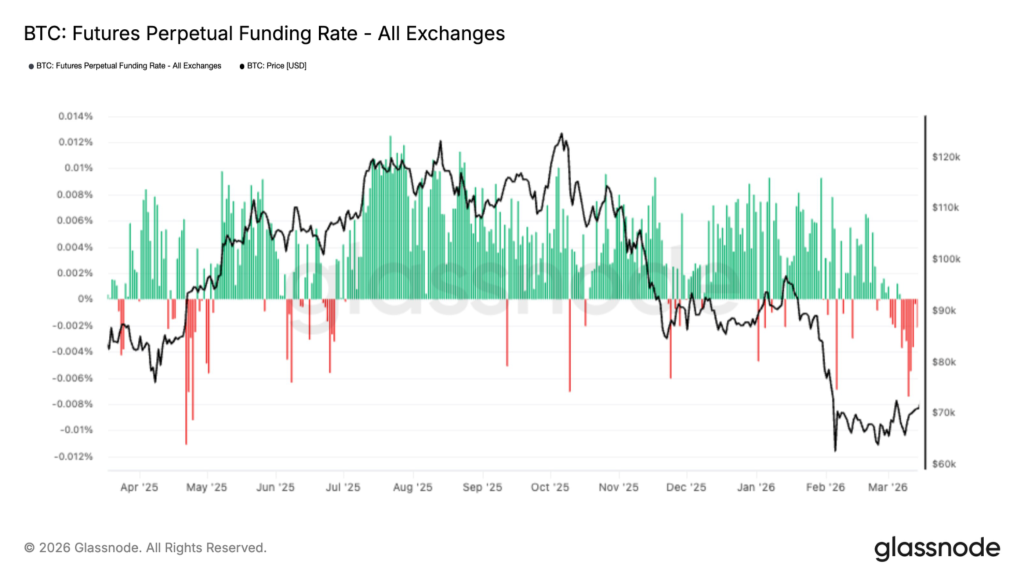
The perpetual market directional premium has normalized, showing that leverage has been flushed out of the system. At the same time, volatility risk premium is declining, signaling reduced expectations of large price swings.
This move is pivotal as breakouts require aggressive positioning, expanded voalitlty and a strong directional conviction. Unfortunately, none of this has happened as of now, hinting towards the future traders being uncertain.
Bitcoin Price Outlook — Range Holds Until Catalyst Appears
Bitcoin is not weak—but it is not ready to move either. The current phase reflects absorption without expansion, where supply is being managed but demand is not strong enough to drive a breakout. Until a clear catalyst emerges, Bitcoin is likely to remain range-bound, controlled, and directionless.
As the BTC price remains stuck between $60,000 & $70,000, a breakdown or a breakout from the range may trigger upside or downside price action.
Ever since the February drop, the Ethereum price has been trading within a range with predefined resistance and support. In the times when the Bitcoin price is attempting larger moves, ranging from lows around $62,000 to as high as $75,600, the ETH price is failing to secure a range above 2,200. However, the price has been defending the pivotal support close to $2000 that may appear bullish, but the underlying data tells a different story.
Currently, the momentum is weak, and capital is not flowing back to ETH, and this divergence raises a critical question: Is Ethereum preparing for a delayed breakout, or is this an early warning of deeper weakness?
Ethereum price is showing signs of stabilization on the price chart, but a deeper look at the ETH/BTC pair reveals a more critical signal; it continues to underperform Bitcoin in the current market cycle. The ETH/BTC chart remains locked in a clear downtrend, marked by consistent lower highs and a sharp breakdown in February. This keeps Ethereum in a relative weakness phase, rather than signaling a true reversal.
This divergence between the ETH price and the ETH/BTC performance is significant. While ETH/USD appears stable, the relative decline indicates that capital is not flowing back into Ethereum at the same pace as Bitcoin. Instead, the current market environment reflects a Bitcoin-led recovery, where BTC continues to absorb liquidity while ETH lags.
From a trading perspective, this structure does not support a bullish bias yet. As long as the ETH/BTC pair fails to break its downtrend and reclaim key levels, any upside in Ethereum price should be viewed as limited and conditional, not a confirmed trend shift.
Ethereum Dominance Drops as Bitcoin Gains Control — Capital Rotation Intensifies
Ethereum price is continuing to lose ground in the broader market, with Ethereum dominance (ETH.D) holding near its lows despite a recent bounce. The structure remains weak, with no confirmed higher high, signaling that ETH is not regaining meaningful market share. At the same time, Bitcoin dominance (BTC.D) remains elevated, showing consistent relative strength. This divergence confirms a clear shift in capital flow; liquidity is favoring Bitcoin while Ethereum lags.
The total crypto market has attempted a recovery following the recent correction, but Ethereum has failed to capture a proportional share of that move. This indicates that the current environment is not driven by altcoin expansion but by a Bitcoin-led recovery phase, where capital is concentrated rather than broadly distributed.
As long as Ethereum dominance remains suppressed and fails to reclaim higher levels, ETH is likely to continue underperforming. A meaningful shift in trend will require sustained strength in ETH.D alongside a cooling in BTC dominance, confirming that capital is rotating back into Ethereum.
What This Means for the Retailers
The continued downtrend in the ETH/BTC pair highlights relative weakness, while declining ETH dominance confirms that Ethereum is losing market share. At the same time, Bitcoin dominance remains elevated, signaling that liquidity is concentrated in Bitcoin. This combination defines the current environment as BTC-led, not ETH-driven.
At this stage, Ethereum does not offer a confirmed trend. Instead, it presents a conditional setup where confirmation is required before taking directional bias. A shift in trend will only occur if Ethereum shows clear strength across multiple metrics:
ETH/BTC breaks its downtrend and forms higher highs
ETH dominance (ETH.D) starts trending upward
Price reclaims key resistance levels with strong momentum
Invalidation of Bullish Setup
Continued weakness in ETH/BTC
Failure of ETH dominance to recover
Rejection at key resistance levels
Collectively, the Ethereum price is not in a confirmed bullish trend—it is in a setup phase with weak relative positioning. Until capital rotates back into ETH from Bitcoin, and key structures are reclaimed, any upside should be treated as limited and reactive, not a sustained move.
In March 2026, public companies added over 47 000 BTC to their balance sheets, with Strategy contributing 44 400 BTC through large weekly purchases funded by STRC and MSTR ATM sales. After about 22 000 BTC was sold by nine firms, the net addition was around 25 000 BTC. Outside of Strategy, roughly 15 companies added about 3 000 BTC. Key changes included American Bitcoin gaining 960 BTC and major sellers like MARA Holdings reducing by 15 100 BTC. GameStop pledged 4 700 BTC, leaving one BTC in holdings.
US-listed spot Bitcoin ETFs ended the first quarter of 2026 in negative territory. March did see a return of inflows, but that came only after two straight months of steady withdrawals. Figures from SoSoValue show that the funds added $1.32…
Playnance is making a bold push into one of the largest entertainment markets on the planet—and it’s doing it on-chain. The Web3 infrastructure company has teamed up with SOFTSWISS Sportsbook to bring more than 2.5 million live sports and esports […]
Bitcoin crossed $69,000 USD, amid Trump’s war easing statement.
ETF inflow flips to green after 4 consecutive red candles
Ethereum, Solana, LINK, Cardano, XRP. Follow the trail with a 3% to 5% Surge in 24h
The US-Iran war is now at rest, as Trump announces a temporary pause on attacks on Iranian energy infrastructure. Iran, on the other hand, also agreed to have a peace talk under some proposed conditions.
Also, to note, the War hasn’t ended yet. It is still uncertain how the two entities wrap the deal, but there is still tension on the cards. The US military ground invasion threats, no strong, balanced announcement from either side, show unclear stands of both nations.
The Crypto Market Reacted Fast.
Bitcoin price on Wednesday, 1st April, has met expectations to begin Q2 with bullish momentum. With Trump and Iran issuing war settlement statements, the bitcoin price today surged past the $6500 resistance and is now trading near $6900.
Following the bitcoin trail, Ethereum (ETH) trades at $2150 (4.4%) , Solana $84.51(1.43%), Chainlink (LINK) at $9.08 (4.37%), Cardano(ADA ) $0.2509 (2.9%), and XRP $1.35 ( 2.89%).
As we see, the data by SoSo Value shows a flip of the daily Spot ETF flow from red to Green. The close on 31 March yielded a net inflow of $118 million, and for Ethereum, the net inflow was $31.17 million.
As per SoSo, on March 31 (ET), the total net inflow of Bitcoin spot ETFs was $118 million. Total net inflow of Ethereum spot ETFs was $31.17 millions. pic.twitter.com/JAvPoFHYWN
— Coinpedia Markets (@MarketCoinpedia) April 1, 2026
The net inflow of Bitcoin and Ethereum has a direct impact on the market sentiment and shows the changing interest of Institutions in assets.
Bitcoin Teases $69,000, Ethereum Towards $2200
BTC/USDT 1 Day Chart shows the asset trading between $65,700 support and $71,500 resistance. Any breakout below this support will enhance a further downward rally, only a shift i sentiment and a strong close above the resistance can put Bitcoin into the $73000 zone.
BTCUSD_2026-04-01_14-36-21
Ethereum, on the other hand, is trading between the $2000 to $2200 zone, acting as ultimate support and resistance. ETH price needs a consecutive higher and higher low pattern trading to fall back into the buyers’ confidence zone.
Solana Shows Mixed Sentiment, But Bearish
Solana, the star performer, isn’t gaining momentum long-term now; only in the last week, the crypto dropped 11% from $92 to $80. On-chain data isn’t of any catalytic support; the Dex Volume in Solana dropped to $55.5 billion, the weakest since Sept 2025. A 42% quarter-over-quarter decline in network fees since January.
Despite this, the Solana tops in decentralized application monetization, with 13 of its application 1 million USD of monthly revenue.
The SOL/USDT 4 chart shows a clear rejection at the $85.1 level, making it an ultimate resistance. The Sol price continues to trade below all the major EMA’s and RSIs at 50.97, directed towards a cooling of buyers ahead of uncertainty.
SOLUSDT_2026-04-01_14-36-05
For Solana their is strong support at $80, is also an accumulation zone, but we need to flip the $85.1 first to validate a further bullish trend.
LINK Eyes at $20
Chainlink, LINK coin, on Wednesday continues to react positively to its ongoing fundamentals and on-chain updates. First, the listing of LINK ETF on NYSE Arca via Bitwise Chainlink ETF (CLINK), and Finchain’s adoption of Chainlink’s tech support.
Adding to it, there was a good number of whale activities for the LINK token. There was an increase in Binance withdrawals. 8,000 LINK coins were withdrawn from 10 transactions.
LINK/USDT Volume jumps 75% and is now trading at $9.01, this is a clear recovery from the $8.90 resistance. The LINK price is now topped near the downward resistance of $9.20. A strong 4 candle validation is needed above the channel to put LINk coin in the direction of $20
LINKUSDT_2026-04-01_14-56-35
In case of invalidation, $8.54 is the major support here. RSI is cooling down for correction, but in 65, show buyers confidence is coming.
Bitcoin has recently rebounded, closing its first positive month after five consecutive monthly declines, a key psychological milestone for traders. However, the recovery has not been smooth.
BTC Price action remains volatile and uneven; the current structure is non-linear, marked by alternating upward and downward moves. While sentiment has slightly improved, the market is still searching for a clear direction within a wide trading range.
Bitcoin Transaction Fees Fall Below $0.40 as Network Stays Active
According to CryptoQuant Analyst, Bitcoin Transaction costs have dropped to their lowest levels since 2017, with the yearly average now falling below $0.40. This is a major shift for a network that has historically seen fees surge during periods of congestion.
Importantly, network activity has not declined significantly. Daily transactions are still averaging above 3,000, showing that Bitcoin remains actively used despite the drop in fees.
This decline is largely driven by the introduction of inscriptions, which help limit the weight of transactions included in each block. Even though this change came through a soft fork, it represents a meaningful improvement in how the network manages block space and efficiency.
Historically, Bitcoin fees tend to peak during price highs and fall during bear market phases, making the current low-fee environment consistent with broader market conditions.
Bitcoin Whales Stack Sell Orders as BTC Approaches Breakout Zone
As per Coinglass data, Order book data shows Bitcoin is moving into a heavy cluster of whale sell walls. Significant overhead liquidity is concentrated between $68,800 and $69,600, with the strongest resistance sitting just above $69,000.
On the downside, support levels are layered at $67,200, $66,400, and deeper around $65,800. Price is currently being pulled toward overhead liquidity, making the $69K zone a critical level to watch.
If bulls manage to absorb selling pressure above $69K, a continuation move higher could happen quickly. If not, the market may see another rejection and liquidity sweep to the downside.
Bitcoin Dominance and Price Action at Critical Turning Points
On the dominance chart (BTC USDT.D), Bitcoin is forming a clean falling wedge pattern on both daily and weekly timeframes. If the current support zone holds and forms a higher low, dominance could push toward 8.56%–9.04%.
However, losing this support would invalidate the setup and could send dominance toward 7%, which may align with Bitcoin pushing higher toward the $76K–$78K range.
BTC Price Movement Hinges on Key Intraday Levels
In the short term, the $67,800–$68,200 range is seen as a key intraday zone. If price holds here, a breakout to the upside becomes more likely. However, a breakdown could trigger another downward move, which some analysts currently see as the more probable scenario.
From a daily perspective, Bitcoin has already cleared liquidity from the lows around $65K and is now bouncing upward for a potential bearish retest. Early moves at the start of a new month are often misleading, and a push higher could still favor a continuation to the downside.
The immediate resistance zone between $68,800 and $69,100 remains critical. A rejection here could lead to a strong move lower, while a breakout could trigger a pullback followed by a push toward the $71,400 region, where additional liquidity sits.
FAQs
Why are Bitcoin transaction fees so low right now?
Fees are low due to improved block efficiency and lighter transactions, reducing congestion even while the network remains actively used.
Why do low Bitcoin transaction fees matter for long-term network security?
Transaction fees are a key incentive for miners, especially as block rewards decrease over time. Persistently low fees could raise concerns about whether miners will remain sufficiently incentivized, potentially impacting the long-term security model of the Bitcoin network.
How could macroeconomic factors impact Bitcoin’s next move?
External factors such as interest rate decisions by the Federal Reserve, inflation data, or global liquidity conditions often influence risk assets. A shift in macro sentiment can override technical setups and drive Bitcoin’s direction regardless of chart patterns.
BitGo has rolled out a new financing platform that allows institutions to borrow and lend against a range of crypto holdings. According to the announcement, the platform brings together features like borrowing, lending, and collateral management to eliminate the need…
The crypto market recovered for the second straight day, rising 2.1% over the past 24 hours to $2.45 trillion on Tuesday. Bitcoin (BTC), the bellwether asset, rose 2.4% to a six-day peak of $69,000. Ethereum (ETH) price was up 4.2%,…
On April 1, 2013, Bitcoin traded above $100 for the first time, a major milestone in its early market journey. Just four years earlier, Bitcoin had little to no monetary value. The surge past $100 came during a period of rising global financial stress, including the Cyprus banking crisis, which increased demand for alternatives to traditional banks. Growing exchange activity and media attention fueled momentum, signaling Bitcoin’s transition from a niche experiment to an emerging financial asset.
Moody’s Investors Service has assigned a provisional rating to New Hampshire’s Bitcoin-backed U.S. municipal bond. Per a Tuesday statement, the agency has given the bond a Ba2 rating, which falls within the “speculative grade” category and reflects substantial credit risk.…
Interactive Brokers has introduced crypto trading for retail clients across the European Economic Area, with users gaining access to Bitcoin alongside a handful of other assets. Details shared in a Tuesday announcement show that the offering is being delivered through…
Trump’s push for an extra $200 billion Iran war budget on top of record defense spending is forcing crypto markets to reprice geopolitical risk, debt, and the dollar in real time. Trump’s reported push to have Arab states help bankroll…
Bitcoin trades in a tight mid‑$60k range beneath stacked moving‑average resistance, with extreme fear and weak momentum keeping any breakout on a short leash. Bitcoin (BTC) hovered around $66,597 on March 31, 2026, as the largest cryptocurrency by market value…
Tech mogul Elon Musk is convinced that quantum computers could enable the recovery of lost crypto wallet passwords – a plus side of the computing technology amid all the recent buzz of the great risks it poses to blockchain and cryptocurrencies.
Blockchain analytics estimates that at least 3-4 million Bitcoin (BTC), or 15%-20% of the total circulation, have been irretrievably lost. Additionally, the number of BTC lost due to forgotten or misplaced seed phrases surpassed that lost from exchange hacks.
A quantum computer capable of solving for private keys given known public keys could therefore prove beneficial to this population. That said, wallet inactivity does not necessarily mean the owner forgot/lost their password.
On the plus side, if you forgot the password to your wallet, it will be accessible in the future https://t.co/xAFtNGC5FE
Musk’s statement came as a humorous response to Google’s recent research, which concluded that Bitcoin could be cracked with far less quantum resources and less time than previously anticipated.
Several blockchains have taken the quantum threat seriously and are actively upgrading their cryptography to render it quantum-proof.
Ethereum has developed a quantum-resistance roadmap, while Cardano has partnered with experts from Google, Microsoft, and Linux for the same purpose. Bitcoin lags behind this front in terms of timelines, contingency plans, and dedicated teams.
Still, crypto proponents Michael Syalor and Changpeng Zhao are confident that crypto will survive quantum risks.
Risks vs benefits
The timeline for achieving quantum capabilities at any level is widely estimated to be between 2029 and 2035. And while certain risks rattle the crypto community, it might be helpful to consider some of the benefits such an advancement could pose in a post-quantum era. These include:
Enhanced security through true randomness in cryptographic key generation and non-copyable digital currency (quantum money).
Scalability through parallel transaction processing and faster block finality.
Real-time and complex logic smart contracts.
Energy consumption reduction for Proof-of-Work networks.
Lower transaction costs following improved network speed and efficiency.
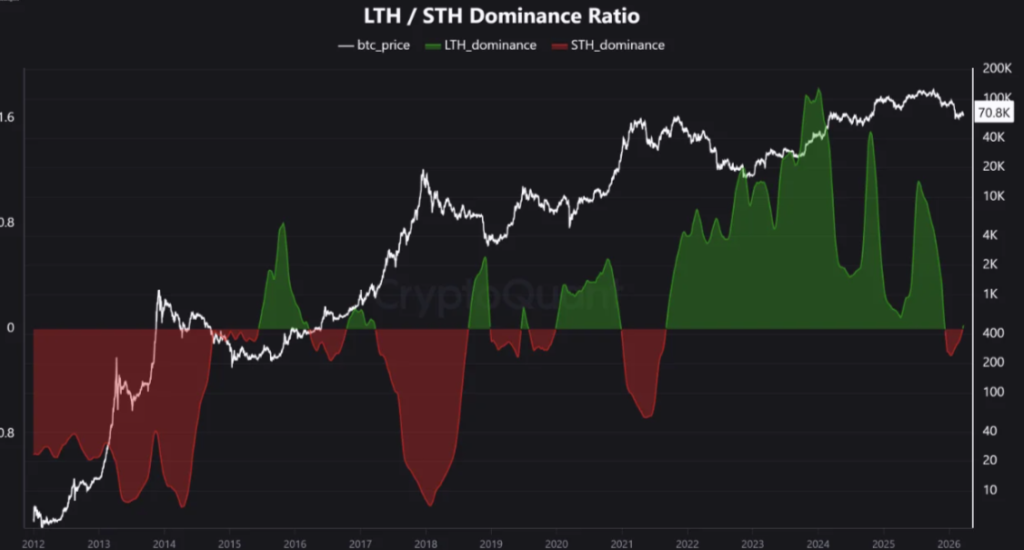
Data from CryptoQuant shows Bitcoin long-term holders (LTHs) with coins held over 155 days are now selling at a loss, as LTH-SOPR falls below 1.0, indicating a surrender phase. Short-term holders (STHs) are also under pressure, facing $113.9 billion in unrealized losses across nearly 9 million BTC, around 45-46% of total supply, following 110 days of consecutive realized losses. These trends suggest heightened market stress, with both LTHs and STHs adjusting positions amid prolonged downside volatility.
The Royal Government of Bhutan has transferred another 375 $BTC, worth $25.18 million, marking continued activity in its crypto holdings. Over the past week, the country has moved a total of 1,018 $BTC, equivalent to $70.43 million. These transactions highlight Bhutan’s active management of its Bitcoin reserves, drawing attention from the crypto community. While the reasons for these transfers haven’t been publicly detailed, the scale shows a significant reshuffling of the nation’s digital assets.
Ethereum researcher Justin Drake has brought to attention two major quantum computing breakthroughs that could significantly accelerate the timeline for breaking modern cryptography.
At the center of it all is Shor’s algorithm, a quantum method capable of breaking the encryption behind Bitcoin and Ethereum.
Google and Oratomic Push the Limits
Drake described the release of two new research papers as a “monumental day” for quantum computing. Both studies improve Shor’s algorithm, a quantum method known for its ability to crack widely used encryption systems like RSA and elliptic curve cryptography, which secure networks such as Bitcoin and Ethereum.
“The algorithm runs on ~1K logical qubits for the 256-bit elliptic curve secp256k1. Due to the low circuit depth, a fast superconducting computer would recover private keys in minutes.”
The first paper, from Google Quantum AI, shows that private keys tied to blockchain signatures could potentially be recovered in minutes using around 1,000 logical qubits. The second, from startup Oratomic, suggests even greater efficiency at the hardware level, reducing the number of required physical qubits by up to 40x.
Put simply, both papers attack different parts of the problem, and together, they make quantum threats feel far more real.
Q-Day Might Not Be So Far
Interestingly, Drake now believes the chances of “Q-Day”, when quantum computers can break current cryptography, arriving by 2032, have jumped significantly.
My confidence in q-day by 2032 has shot up significantly. IMO there’s at least a 10% chance that by 2032 a quantum computer recovers a secp256k1 ECDSA private key from an exposed public key.
He estimates at least a 10% probability that a quantum system could recover a private key within that timeframe.
Speed is the real game-changer here. Superconducting quantum machines could crack keys in minutes, while slower systems might take days, but either way, the direction is clear.
The Real Risk Isn’t Mining
One key takeaway stands out. Quantum computing is not coming for Bitcoin mining anytime soon. Instead, the real threat lies in signature security, how wallets and transactions are protected.
Drake also hinted that future breakthroughs may not even be fully disclosed, as research could face censorship or secrecy.
Never Miss a Beat in the Crypto World!
Stay ahead with breaking news, expert analysis, and real-time updates on the latest trends in Bitcoin, altcoins, DeFi, NFTs, and more.
FAQs
Can quantum computers really break Bitcoin or Ethereum security?
Not yet, but new research shows it’s becoming more realistic. Future quantum systems may recover private keys from public keys in minutes.
What is “Q-Day” in quantum computing?
Q-Day is when quantum computers can break today’s encryption. Experts now see a real chance this could happen as early as 2032.
How can crypto users protect themselves from quantum threats?
Use wallets that avoid key exposure, upgrade to quantum-resistant cryptography when available, and follow network updates for security changes.
Bitcoin price has formed support over $66,000 as investor hopes for an end to the ongoing U.S. and Iran conflict gained renewed momentum from Trump discussing a potential ceasefire, even if the Strait of Hormuz remains closed. According to a…
Nakamoto, the Bitcoin treasury firm that rebranded from KindlyMD, has pared back its crypto exposure in March, selling $20 million worth of Bitcoin while also cutting a sizeable portion of its Metaplanet investment at a loss during the first quarter.…
The 2026 Q1 has been dramatic for the crypto space, Bitcoin is down -46% from its all-time high and -30% since the January high. Ethereum is nearly 50% down from its all-time high. Solana, BNB, XRP, and other top altcoins face losses from peak to bottom. It is to note that the Fear and Greed index has spent 46 consecutive days in the extreme fear zone.
While geopolitical tensions added a strong drag on growth in March, uncertainty continues over Bitcoin as an asset or currency. April 2026 is anticipated to shift the gears in favour of peace and neutralization.
The April calendar for Crypto holds major catalysts, including the CLARITY Act markup, which is expected to land with the Senate Banking Committee by mid-April. The Ethereum Glamsterdam upgrade is in the final stage and is set to go live in June. The AI tokens category marketcap grows 30% in a month from $14.13B to $19B combined. The US Spot Bitcoin and Ethereum are closing green with net inflow in the last 30 days.
Bitcoin on Tuesday stays neutral at $67,821, trading in a range-bound of $65,000 to $72,000 in whole of March. Sellers seem to be defending the $72,000 mark consistently, and buyers are entering in $65K to $67 k range.
Its Simple logic here, If Bitcoin price breaks and makes a weekly close above $72000, supported by positive volume, then wait for the restest. If there is strong retest, BTC will rally into the $78,000 zone. The lined-up FMOC meeting on 28-29 April could be a catalyst for the rally, and if the price action, as said above, happens before that, the pre-meeting sentiment will trigger it too.
Ethereum, on the other hand, is a disappointment to holders since it lost its $3000 territory. Currently trading at $2043, ETH holds great potential in the Glamsterdam upgrade. The upgrade is meant to increase the gas limit from 60 million to 200 million and host 10,000 transactions per sec. This is a major technical haul since the Merge upgrade.
It is interesting to see that the ETH coin has always responded bullish to the Upgrade news historically. The Merge in Sept 2022 triggered 35% rally a before 2 months of the event, the Shanghai staking withdrawal in April 2023 drew nearly 40%, and the Dencun upgrade in march 2024 helped Ethereum surge 20%.
These patterns show a clear reaction starting from 4 to 6 weeks before the event day. Currently, the trade scale of Etherume is $1900 to $2100, with the sentiment building around the Glamsterdam upgrade planned to go live in June, we may see Ethereum making higher highs and lows towards the $2700 -$2900 region. Only if the upgrade is pushed to Q3, Ethereum could experience more losses.
AI Tokens Taking The Lead
The last 4 weeks in crypto, the Artificial Intelligence category is the only sector yielding returns. Tokens like Bittensor(TAO) up +67.5%, Render coin at 21% monthly returns, SIREN sitting 540% monthly returns, FET at 44.13 %, and many other coins have yielded massive returns in this sector. The Artificial Intelligence market cap surged to $19B, with upward momentum to its last zone of $28B.
This is a common cycle in crypto that also happened with memecoins and RWA. In this cycle of the Sector, in phase 1, yields good returns( happened now), followed by a consolidation phase where the top gainer will undergo corrections for a 3-4 week period. Further, in the third phase, the sector will yield more returns than the first cycle.
So, If starts defending the AI coins’ prices, keep a close watch, it might be just a consolidation phase and buying opportunities.
Memecoins With Surge Potential
Solana memecoins weekly dex volume has surged from a low of $40.5 billion in August 2025 to $87.8 billion in the last week of March 2026. Showing increased dex trades in Solana coins, directly affecting the top coins like BONK, PENGU, TRUMP, PIPPIN, CAT, DOG, and POPCAT,
Solana Dex Volume
The Web3 Tokens Are Gearing Up
The Web3 Tokens sector has lined up some good on-chain and fundamental events to strengthen the growth of Chainlink(LINK), PolkaDot( DOT), Uniswap(UNI), The Graph (GRT), and Internet Computer (ICP)
Chainlink(LINK): The LINK token saw 62% QoQ growth, with nearly $18 billion in monthly cross-chain transactions. Companies like JPMorgan and UBS actively participate and run blockchain settlements on Chainink. Listed on NYSE Arca, The Bitwise Chainlink ETF ( CLINK) is strategically exposing LINK coin to retirement accounts and strategic accounts.
Currently trading at $8.69, the LINK/USDT fundamentals are priced ahead, which can send LINK to $25-$40.
LINKUSDT_2026-03-31_13-47-20
POLKADOT: In early March, Polkadot permanently hard-capped 2.1 billion DOT supply, making it deflationary. The joint classification of DOT as a ‘Digital Economy” by the SEC and CFTC, making it similar to Bitcoin and Ethereum. The upcoming staking economics upgrade in April, which is proposed to reduce the unbonding frame from 28 days to just 24-48 hours, will escalate the staking of DOT.
On the Technichal side, DOT/USDT is trading above the critical support of $1.22 and facing a descending resistance. The ADX indicator shows momentum changing to a slightly bullish moment.
We need a reclaim above $1.65 to open direction towards $2.
Uniswap (UNI) : The top dex on the Ethereum blockchain also supports other blockchains and is developing its technical haul regularly. The new upgrade, Uniswap V4, has unique and interesting features. The new version allows pools to modify fees, on-chain limit, and price curves. An ongoing vote for distributing a portion of protocol fees to UNI stakers is being observed, too.
In the long picture, UNI/USDT is too low from its all-time high, but the shorter period shows the dex coin creating lower lows and highs. Positive volume and buyers’ confidence in the fundamentals are catalysts here.
DOTUSDT_2026-03-31_13-53-45
We need a strong daily close above $6 to trigger a $7- $9 range, whereas the support for UNI stands at $3.45
The Bitcoin price rebounded from the local lows around $65,000 and began the weekly trade on a bullish note. Currently, the price has surged close to $67,500, forming an intraday high at $68,408 as market pressure has been fading since yesterday. The price continues to trade within a rising channel structure but seems to have remained stuck within a compression phase as bulls & bears struggle to establish control.
This tightening range often precedes a volatility expansion, and hence, the next upcoming BTC price action may be extremely crucial.
Whale vs Retail Activity Signals a Quiet Accumulation Phase
The chart highlights Bitcoin’s spot average order size, a key metric used to identify whale vs. retail trading behavior in the market. Green dots indicate large orders (whales) and red dots represent smaller, retail-driven transactions. Recent data shows a concentration of large buy orders between $60K and $100K, signaling that institutional and high-net-worth investors remain active despite market consolidation.
At the same time, retail activity appears limited, with red clusters mainly appearing near short-term price peaks. This suggests a lack of aggressive retail participation, while sustained green clusters suggest ongoing accumulation by whales. Similar patterns in previous cycles have aligned with re-accumulation phases before major moves, hence pointing towards building market positions rather than exiting.
Bitcoin Buyers Lose Control Near Key Levels
Bitcoin’s 90-day Futures Taker CVD (Cumulative Volume Delta) highlights a shift in market behavior, showing that sell-side pressure is increasing while aggressive buying is fading. The chart shows a noticeable rise in red bars, indicating that taker sell orders are dominating the market. At the same time, green bars (buy-side aggression) are becoming less consistent.
This suggests that traders are increasingly hitting market sells rather than chasing price upward. Even as Bitcoin holds above key support levels, the declining CVD trend signals reduced buy-side conviction, lack of aggressive trend continuation and growing probability of short-term exhaustion. This divergence often appears during consolidation or early distribution phases.
Bitcoin is trading near $67,400, continuing to hold above the key $65,600 support level while moving within a rising channel on the daily chart. After a sharp correction, the price has shifted into a tight consolidation range, forming higher lows but failing to break above the $70K–$71K resistance zone. This structure suggests compression, not trend confirmation.
Bitcoin recently bounced from the lower trendline support, confirming that buyers are still defending the structure. However, repeated rejections near $70K highlight strong supply overhead, due to which the price remains range-bound. RSI is gradually trending higher and sits near neutral levels, indicating slow momentum recovery. At the same time, CMF remains negative, showing that capital inflows are still lacking.
This suggests the momentum is stabilizing, but the buyers are not aggressive, also backed by a decline in volume, hinting at reduced participation.
Key Levels to Watch
Immediate support: $65,600
Critical support: $63,000–$64,000
Breakdown level: $65,000
Immediate resistance: $70,000
Breakout confirmation: $71,000
Upside target: $75,000
Above $71K → bullish continuation likely
Below $65K → downside pressure increases
Will BTC Price Break Past $70,000?
Bitcoin continues to trade within a tight range, holding above the $65,600 support while struggling to reclaim the $70,000 resistance zone. The broader structure remains constructive, with higher lows intact, but momentum indicators and derivatives data show limited buying conviction.
On-chain activity suggests accumulation, yet futures positioning reflects weakening aggressive demand. This mismatch keeps Bitcoin in a consolidation phase rather than a confirmed breakout trend.
A move toward $70,000 remains likely if support holds, but the absence of strong volume and buyer dominance suggests the level may be tested gradually rather than broken decisively. In the near term, Bitcoin is expected to remain range-bound, with a potential push toward $70,000 over the coming days, while a confirmed breakout above $71,000 will be needed to validate sustained upside.
FAQs
What is the Bitcoin price prediction for 2026?
Bitcoin is expected to range between $100K and $180K in 2026, with bullish momentum building as consolidation near $70K shifts into expansion.
How much will 1 Bitcoin be worth in 2030?
Bitcoin could range between $380K and $900K by 2030, with an average target near $750K as adoption, scarcity, and institutional demand grow.
What will 1 BTC be worth in 2040?
By 2040, Bitcoin could range between $5,799,454 and $13,532,059, with an average estimate near $9,665,757 as adoption and scarcity increase.
How much will Bitcoin be in 2050?
Bitcoin in 2050 could range from $161M to $377M, with an average estimate near $269M, driven by long-term adoption, scarcity, and global demand.
Republican senators Bill Cassidy and Cynthia Lummis have introduced a new bill that seeks to bring Bitcoin mining manufacturing back to the U.S. and support the establishment of a Strategic Bitcoin Reserve. On Monday, the two senators introduced the “Mined…
Bitcoin (BTC) mining firm American Bitcoin now holds over 7,000 Bitcoin, worth over $467 million at press time (BTC price of $66,754). Following a prior accumulation of 416 BTC, the company is now the 16th-largest publicly traded Bitcoin Treasury in the world. The development also marks 186.53% growth in the company’s holdings, given that it went public with 2,443 BTC in September, 2025.
American Bitcoin employs a dual accumulation strategy – either mining or buying Bitcoin. With a total investment of around $360 million, the firm’s average cost basis for its reserve is $51,428, indicating an unrealized profit of $15,040 per Bitcoin.
7,000+ Bitcoin secured.
#16 largest public Bitcoin treasury in the world.
All achieved in under 7 months since our Nasdaq debut.
The accumulation machine is running at full throttle — mining at a discount + disciplined buying. No company is climbing the rankings… https://t.co/8ei0MLV8Od
American Bitcoin is one of several publicly traded companies that have increased their Bitcoin holdings despite current market uncertainty and consolidation.
Strategy acquired over 23,000 Bitcoin this month before the recent pause of its 13-week streak of purchases. 21 Capital and Metaplanet are other accumulators whose reserves mostly come from purchases made in 2025. Others continue to pursue Bitcoin investments, including Empery Digital, which recently raised $1.3 billion toward this cause.
Differently, miners such as MARA Holdings, Bitdeer Technologies, and Cipher Digital sold their Bitcoin to fund the transition to AI and traditional investment instruments.
Meanwhile, Tesla has maintained a stash of 11,509 BTC for several quarters with no additional sales or purchases.
These differences in sales and purchases persist due to varying perceptions of near-term and long-term profitability.
Company performance metrics
Despite its latest milestone, American Bitcoin stock (Nasdaq: ABTC) failed to reflect the development, closing at $0.79 (an 8.14% drop from the previous day’s close) and nearly 88% less than its post-IPO price of $14.52.
The company also recorded a loss of $153.2 million in 2025, a significant increase from the previous year’s $21.3 million loss, despite a 159% YoY increase in revenue.
Bitcoin (BTC) has been consolidating between $68,000 and $66,000 over the weekend after falling below $70K last Thursday. At press time, Bitcoin was trading at $66,386, up just 0.02% over the past 24 hours and down 6.27% over the past week. Several indicators signal the coin’s upcoming capitulation but also point to an eventual recovery and a final turn to bullish trends.
BTC whale and institutional offloading have increased amid prevailing geopolitical and economic stress.
US President Donald Trump claims an ongoing negotiation with Iran to end all hostilities, but the latter refutes such news, labeling it a strategic maneuver to cool oil prices. Trump promises escalated US military aggression on Iran’s electric power plants, oil wells, and the Kharg Island energy hub should these alleged talks prove unfruitful.
“The United States of America is in serious discussions with A NEW, AND MORE REASONABLE, REGIME to end our Military Operations in Iran.” – President Donald J. Trump pic.twitter.com/0MWL2hSNmK
Meanwhile, the Fed has maintained a “wait and see” approach regarding interest rates, citing trade-offs between inflation and unemployment.
Uncertainty around these developments caused US spot Bitcoin ETFs to break a four-week positive streak, recording $296.18 million in net outflows in the week ending March 27.
As for on-chain indicators, the 1-week exchange whale ratio reads 0.57 according to blockchain analytics firm CryptoQuant. The metric indicates heightened Bitcoin whale offloading, which is typically interpreted as a bearish signal. This notion was supported by a drop in Bitcoin whale monthly demand growth to 1% in March from 6% in February.
Crypto analysis by Ali Martinez shows the formation of a descending triangle pattern, a bearish setup based on historical trends. This projects a potential 2021-like crash, with a breakdown below $64,100 and towards $50,000.
Even more, he notes a crossover between the 50-day and 200-day simple moving averages on the 3-day chart, indicating an impending historical 40%-50% reset.
That said, Ali predicts potential buy zones if BTC bottoms out between $40K and $30K, adding that this phase would precede a major bull market.
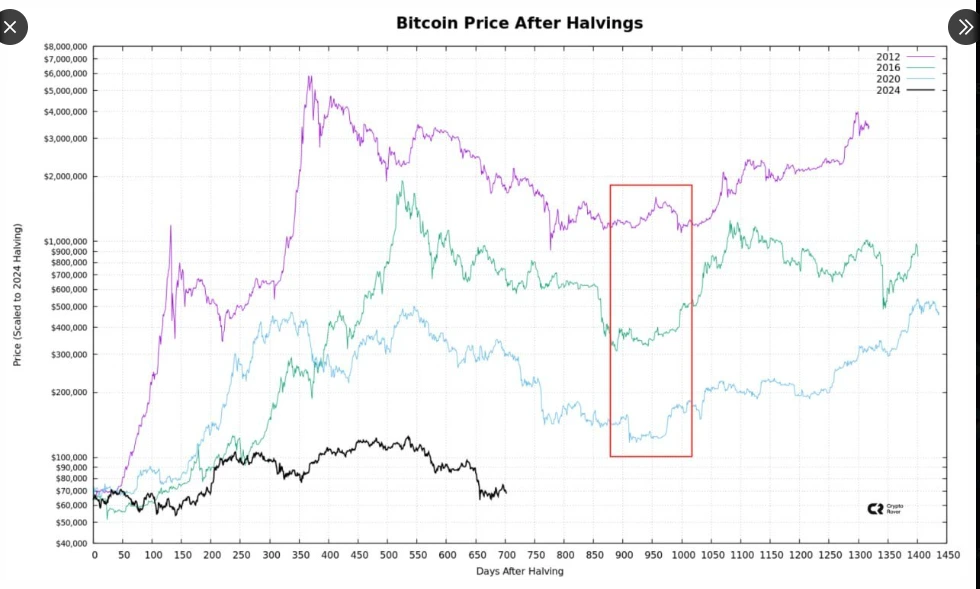
Bitfinex Alpha says weakening demand, macro headwinds and a turn in spot ETF flows now “dominate” Bitcoin’s price path as it drifts back toward its monthly open. Bitcoin’s (BTC) next big move will hinge less on halvings and more on…
Bitcoin is sitting below $70,000. But one analyst says that the next major money printing event is not a matter of if but when, and when it arrives, Bitcoin’s price could blow.
Analyst John laid out nine specific scenarios that could trigger the next big government spending wave, and every single one of them historically ends the same way: with more money printed, more dollars created, and hard assets like Bitcoin repriced significantly higher.
Why Another Big Print Is Coming
The argument starts with a simple observation. The COVID pandemic showed the world that governments will print trillions of dollars when they feel they have no choice. Most people have already half-forgotten how extraordinary that response was, slipping back into what John calls the frog in boiling water mentality. But the underlying conditions that make another print inevitable have not changed.
The Nine Catalysts to Watch
First, a large-scale geopolitical war or military escalation. Current conflicts could intensify and force emergency government spending at a scale that dwarfs anything seen in peacetime.
Second, AI-driven job displacement. If artificial intelligence eliminates enough jobs fast enough, governments will face enormous pressure to introduce universal basic income or massive public works programmes. That spending has to come from somewhere.
Third, the state budget collapses. California is already spending far beyond its means while losing its wealthiest residents. States cannot print money the way the federal government can, meaning a federal bailout becomes the only option when things get bad enough.
Fourth, pension system insolvency. Millions of Americans are depending on pension funds that have made promises they may not be able to keep.
Fifth, a regional banking crisis similar to what happened with Silicon Valley Bank in 2023, but potentially larger and more contagious.
Sixth, a collapse in private credit markets, which have grown enormously and remain largely unregulated.
Seventh, structural entitlement expansion including social security increases, Medicare expansion or student loan forgiveness programmes.
Eighth, a major natural disaster requiring emergency federal spending on a large scale.
Ninth, an AI public works programme, which John considers among the most likely near-term triggers as governments scramble to be seen doing something about technological unemployment.
What This Means for Bitcoin
John’s timeline for at least one of these catalysts materialising is somewhere between three and twenty-four months. When it happens, the money printing that follows would dwarf even COVID-era stimulus, and Bitcoin, with its fixed supply of 21 million coins, would be one of the few assets positioned to absorb that wave of new money.
Strategy, the company formerly known as MicroStrategy, appears to have paused its weekly Bitcoin purchases after stacking BTC for 13 straight weeks. During that run, it accumulated about 90,831 BTC. Holdings now stand at 762,099 Bitcoin, roughly 3.6% of total supply. Executive chair Michael Saylor skipped his usual weekly buy signal on social media and instead promoted the company’s preferred stock offering. The pause has sparked debate among traders about future buying plans.
Bitcoin price has fallen over 30% from its yearly high, largely impacted by geopolitical and economic concerns that deteriorated investor appetite for risk assets. After rallying nearly 12% to a yearly high of $97,538 on Jan. 15, the bellwether crypto…
Bitcoin ETFs snapped a four-week inflow streak, with over $296.18 million in outflows recorded over the last week. According to data from SoSoValue, spot Bitcoin ETFs posted $296.18 million in net outflows after four weeks of inflows, during which more…
The rise of institutional interest in the crypto markets has changed the dynamics of Bitcoin, specifically. Strategy (then MicroStrategy) has played a major role in changing these institutions’ perceptions of cryptos. Recent data suggests that Strategy has emerged as the dominant buyer of BTC, raising questions about the sustainability of the ongoing price trend.
Weak Participation Raises Red Flags
Over the past 30 days, Strategy has reportedly accumulated nearly 45,000 BTC, marking its fastest pace of acquisition in almost a year. At the same time, participation from other treasury companies has dropped sharply, with the number of active buyers falling from 30 to just 13. Their combined purchases have declined by nearly 99%, now contributing only a marginal share of total demand.
This sharp decline in broader participation is further compounded by rising ETF outflows, signaling that institutional appetite may be weakening rather than expanding.
This creates a critical imbalance. Instead of a broad-based rally supported by multiple demand sources, the market appears to be relying heavily on a single entity to absorb supply. Such concentration introduces structural fragility, as the absence of diversified buyers limits the market’s ability to sustain upward momentum. However, Bitcoin’s muted price reaction suggests that ongoing buying pressure is being offset by persistent selling.
Is Strategy Absorbing Supply—or Supporting the Market?
There are two possible interpretations of the current setup. On one hand, Strategy’s aggressive accumulation could represent a silent absorption phase, where large players steadily accumulate BTC before a potential breakout. In this scenario, the lack of price movement reflects a transfer of supply rather than weakness.
On the other hand, the data may point to a more concerning reality. With ETF outflows rising and fewer companies participating, Strategy’s purchases could effectively be acting as exit liquidity—absorbing selling pressure from other market participants rather than driving fresh demand.
How Will This Impact Bitcoin (BTC) Price?
The Bitcoin price appears to be at a crucial turning point, with its current structure offering mixed signals across timeframes. In the short term, Strategy’s aggressive accumulation continues to provide support, helping absorb selling pressure and prevent deeper downsides.
However, the midterm outlook remains uncertain, as weakening ETF flows and declining participation from other corporate buyers keep the market range-bound. This lack of broad-based demand limits the strength of any sustained upside move.
From a long-term perspective, the growing concentration of demand introduces structural risk. If new institutional players fail to enter and reliance on a single dominant buyer persists, the sustainability of the broader rally could come into question.
Bitwise says Finance 2.0 is arriving from the outside in, as tokenization, stablecoins and crypto ETFs start to rewire how savings and capital move around the world. According to Bitwise, the future of the global money system is being openly…
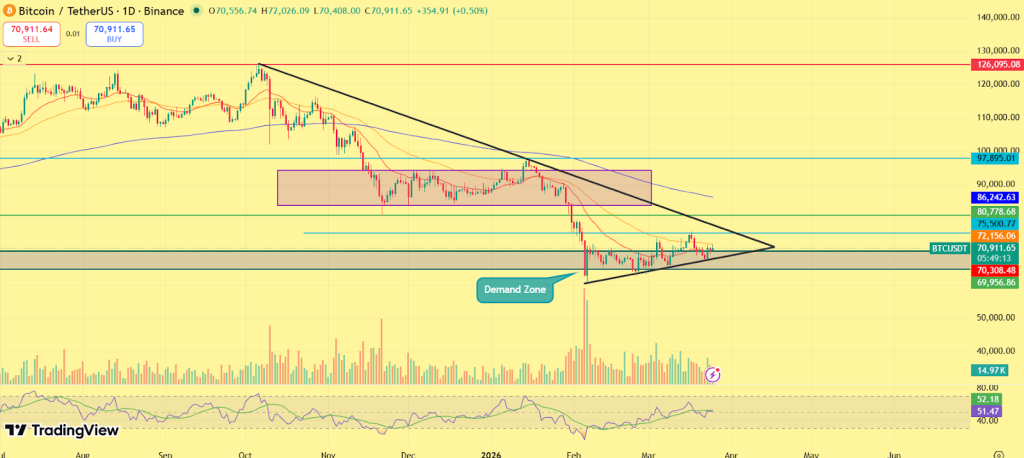
Bitcoin price prediction is starting to shift, and not because of anything happening inside crypto. Right now, the bigger story is outside. Oil is climbing toward $100, global markets are getting tighter, and liquidity isn’t as easy as it was a few weeks ago. In that environment, the BTC price, sitting near $67,000, doesn’t just move on charts, it reacts to pressure.
A normal consolidation is beginning to feel different. This is the kind of setup where markets don’t drift, they move: So, Is Bitcoin price about to break down or hold its ground?
Oil at $100: This Is the “Trial by Fire” Phase
Oil pushing toward $100 is where things stop being theoretical and start getting real. When energy prices move this high, it doesn’t stay contained in one sector. It spreads across the system. Costs rise everywhere, transport, production, logistics, and that pressure builds quickly. Markets feel it before data even reflects it.
This is where the “trial by fire” idea comes in.
Bitcoin has performed well in environments where liquidity is expanding and conditions are supportive. But this is the opposite setup. Liquidity is tightening, risk is rising, and capital is becoming more selective. This is the kind of phase that tests conviction. Not every asset holds up when conditions change. Some lose momentum, some break structure, and only a few manage to absorb the pressure and stabilize.
For Bitcoin, this is that moment. It’s not about narratives or long-term potential right now. It’s about whether the BTC price can hold steady when the system around it is tightening. If oil stays elevated or spikes further due to geopolitical risks, pressure doesn’t just continue, it accelerates. That’s when markets stop reacting slowly and start moving sharply.
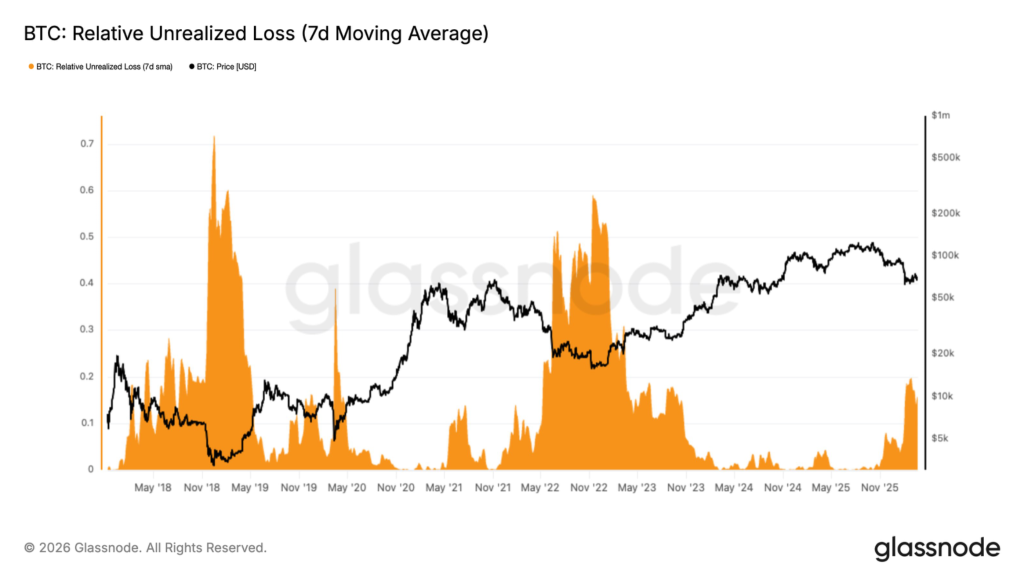
On-Chain Data Shows the Pressure Is Already There
Inside the market, the pressure is visible. The Short-Term Holder MVRV at ~0.77 shows that recent buyers are already in loss. That shifts behavior.
When traders are in profit, dips are opportunities. When traders are in loss, dips create hesitation.
This is where the BTC price becomes more sensitive. Moves don’t need strong catalysts, positioning alone can drive volatility. There is also a clear gap between current price and the $85,000 cost basis for short-term holders. That gap represents unrealized losses sitting across the market.
At the same time, this is not unusual. These phases often mark the beginning of accumulation, where weaker hands exit and stronger participants begin to step in. It doesn’t happen cleanly, it comes with volatility.
BTC price has already broken its short-term structure, and not in a bullish direction. Bitcoin was trading within a defined range, but that range has now been lost. Price has moved below it and is currently retesting the lower boundary, which is now acting as resistance.
This is a key shift. When support turns into resistance and price fails to reclaim it, it usually signals that momentum has weakened. Instead of continuation, the market enters a phase where bounces are sold into.
Right now, Bitcoin is trading between $63K and $67K, but the structure is weaker than before. The inability to move back into the previous range shows a lack of strong buying pressure.
The $63,000 level is now critical. If this level holds, the market can stabilize and rebuild structure. If it breaks, the move lower is likely to accelerate as liquidity below gets taken. On the upside, Bitcoin needs to reclaim the broken range near $68K–$70K to shift momentum back in its favor.
Final Words
The current Bitcoin price prediction is not about direction, it’s about reaction. Oil is high. Liquidity is tight. On-chain data shows pressure. The chart confirms a weaker structure. These factors are now aligned.
If Bitcoin holds above $63K, the market can stabilize and form a base. If not, the downside move could extend quickly. This is not a trending phase. This is a test, and how the BTC price reacts here will define what comes next.
The crypto market rebounded 1.2% on Monday to $2.4 trillion in a relief rally amidst signs of potential de-escalation of the ongoing U.S. and Iran war in the Middle East. Bitcoin (BTC) rose 1.4% to back above $67,600 after dropping…
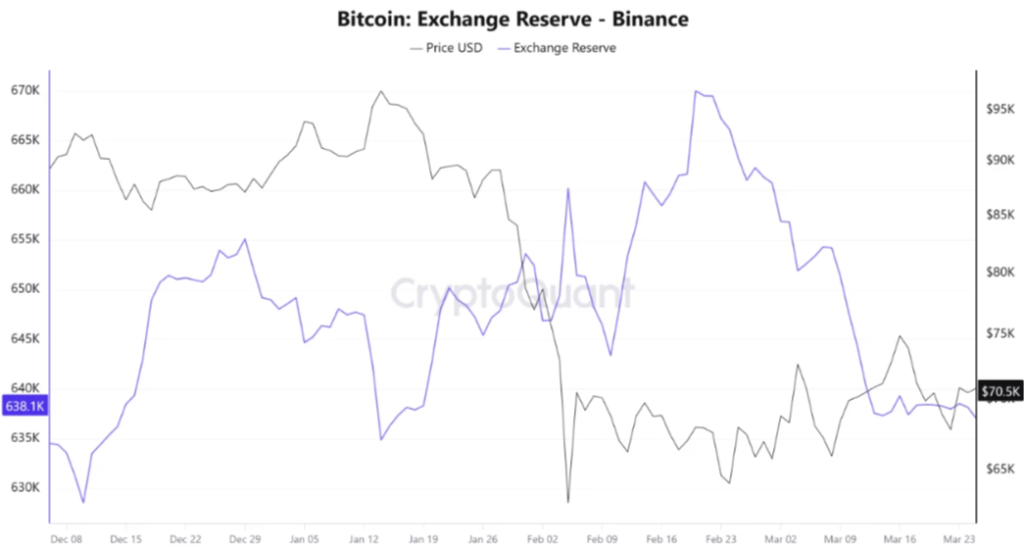
On-chain expert Willy Woo projects Bitcoin’s bottom may land between $46,000 and $54,000, citing the CVDD Floor Model near $45,500 and historical patterns from past bear markets. Bitcoin has declined from over $90,000 in late 2025 to around $66,500, with key metrics showing capital stored in BTC has been falling since November. Woo warns that because these models are based on only four prior downturns during broad bullish cycles, a larger market breakdown could push BTC into an uncharted, deeper bear trend. Meanwhile, prediction markets like Polymarket currently price a 54% chance of BTC hitting $45,000 by year-end, highlighting mixed sentiment between caution and opportunistic buying.
Bitcoin price continues to trade within a tight range near $66,700, showing limited momentum despite a slight 0.57% gain over the past 24 hours. While the broader crypto market remains relatively flat, BTC is holding key support levels, hinting at underlying demand. Beneath this muted price action, however, a high-stakes setup is quietly building. Recent liquidation data points to a significant imbalance in the market, suggesting that the next move may be driven less by sentiment and more by liquidity positioning.
As a result, Bitcoin’s next directional move is likely to depend on where the largest clusters of leveraged positions are concentrated—making this a classic liquidity-driven setup rather than a momentum-led breakout.
Bitcoin Liquidation Map: Where the Real Pressure Lies
The latest liquidation data reveals a significant imbalance in the derivatives market. Over $12 billion worth of short positions are stacked above Bitcoin’s current price, while only around $3 billion in long liquidations sit below. This uneven distribution highlights a key dynamic: liquidity is heavily concentrated on the upside as more pressure is building above the current price range.
The BTC price appears more likely to move higher in the short term, targeting these short positions, which may further trigger a short squeeze. Although this does not confirm a sustained bullish trend, these liquidity-driven moves are temporary, followed by sharp reversals once the positions are cleared. This suggests that the price may follow a strong upside, but the traders need to remain cautious about a potential pullback after the liquidity is absorbed.
Bitcoin is currently trading around the $66,600 level, continuing to move within a tight range after facing repeated rejections near the $70,000–$72,000 zone. The 4-hour chart reflects a lack of strong directional momentum, with price action leaning slightly bearish in the short term. A closer look at the Bollinger Bands shows that BTC is trading below the mid-band, indicating that buyers are struggling to regain control.
Although the price recently bounced from the lower Bollinger Band near $65,000, the recovery remains weak, suggesting that the move may be a temporary relief rather than a confirmed reversal. The Relative Strength Index (RSI) is hovering near the 40 level, reflecting neutral-to-bearish momentum. This indicates that while the market is not oversold, it also lacks the strength required for a sustained upside move.
Key Levels to Watch
Immediate Resistance: $68,000
Major Resistance: $70,000–$72,000
Immediate Support: $65,600
Strong Support: $63,900
Wrapping it Up: Liquidity Signals Strength, But Bitcoin Price Needs Confirmation
Bitcoin is currently caught between bullish liquidity signals and weak price structure, creating a high-risk, high-opportunity setup. In the near term, Bitcoin could see a short squeeze toward the $68,000–$70,000 range, driven by liquidity. However, unless BTC manages to sustain above these levels, the move may turn into a bull trap, followed by renewed downside pressure. On the flip side, a breakdown below $65,600 could expose the next key support at $63,900, where buyers are expected to step in.
The crypto market faces a wholesome decline in price this week, with Bitcoin dropping to 2 weeks low near $66000. Altcoins like Etherem looses 7% in a week below $2000 USD, Solana, BNB, XRP, Shib, Doge, Pepe, and many of the previous performers have been dull. Although there is positive institutional participation, the uncertain geopolitical situation has increased market greed.
Coinpedia Markets’ analysis for next week forecasts a neutral-to-bullish week. Bitcoin will trade in a range of $66000 and $72,000, and altcoins that performed positive growth may repeat the cycle.
Here is our list of altcoin watchlist for next week.
Bittensor (TAO) Target: $414.60
Bittensor(TAO)] is among the star performers, with a monthly growth of nearly 80%, reaching from a low of $171 to 375.
Currently trading at $320.62 with -2.29% growth, TAO/USDT in a 4-hour frame shows firm bullish growth. RSI at 48 is neutral buying pressure, but the altcoin price is trading above the Ichimoku cloud, showing a buyer’s confidence.
Bittensor (TAO) Target: $414.60
Moving in an upward channel, the price may retract to a buying opportunity dip between $280 to $305. In the same scenario, followed by correction, the TAO coin is expected to trade in the $380 to $415 zone in the next 2 weeks.
In case of trend invalidation, Bittensor coin prints a strong support at $300 phsycoligal level.
Siren ( SIREN) Target: $4
The newly launched AI-memecoin on BSC, SIREN, has been on the top gainers’ charts for the last week. At press time, SIREN coin is trading at $1.66, with 24h growth if 101% and monthly growth 337%. It is also to note the the previous two trading days, it fell neatly 62% in days, falling to around $0.875.
Despite all the Scrutiny and warnings about a major concentration of circulating supply being held by the team, SIREN coin is a dramatic and clear result of FOMO mixed with ongoing uncertainty.
SIREN/USDT is also seen with balanced long/short derivatives, which can amplify the price further near the horizontal resistance $1.7 range. Holding strong above this level could trigger the rally to the next resistance near $2.06.
Siren ( SIREN) Target: $4
In a bearish scenario, a break below $1.50, SIREN could retest the support at $1.20.
Midnight (NIGHT) Target: $0.072015
The Cardano-based coin Midnight (NIGHT) reacted bullish again after the Monument Bank of the UK announced its plan to tokenize ADA and NIGHT tokens. Further, today, the rally was supported by the Australian exchange CoinSpot listing yesterday.
NIGHT coin at the time of writing is trading at $0.05164, up 12.4% in 24 hours and moved 18.67% in in one month. Launched in early March, Midnight coin has gained its place in the Top 50 coins by marketcap of $744.4m USD.
NIGHT/USDT 4-hour chart shows the coins shows the altcoin is gaining back the momentum. Average Directional Index ( ADX) is at 26 and upward direction, indicating that buyers have entered since 26 March. The MACD line is above the signal; there is a sharp shift in momentum for further gains.
Midnight (NIGHT) Target : $0.072015
The Support for NIGHT now sits at $0.045 and $0.0423, and a resistance pain point at $0.5517, breaking beyond will push the altcoin to the $0.07 zone.
Other Coins on the List are
Pudgy Penguins ( $PENGU)
Now: $0.006546
Target: $0.0077
River ( $RIVER)
Now: $14.58
Target: $22
WikiCat ( $WKC)
Now: $0.0000001104
Target: $0.00000018504
Qubic ( $QUBIC)
Now: $0.0000009989
Target: $0.00000166719
Osaka Protocol ( $OSAK)
Now: $0.00000004137
Target: $0.000000070414
Dusk ( $DUSK)
Now: $0.1104
Target: $0.2110
Hachiko ( $HACHI)
Now: $0.000000005016
Target: $0.0000000157491
The market is significantly affected by the ongoing war situation, and Bitcoin is falling due to the uncertainty, which is making altcoins fall too. But the above coins are the ones that have not been majorly impacted by the trend.
The Bitcoin price experienced a significant drop in the past sessions, dropping close to $65,500. The drop is primarily driven by the largest single-day outflow from the U.S. spot Bitcoin ETFs in three weeks. It has slipped below a key short-term support, triggering fresh concerns over a deeper pullback. After repeated rejections near the $70K zone, the latest breakdown has weakened bullish momentum and shifted near-term sentiment toward caution.
With BTC now trading around $66K, the focus has turned to whether this move is a temporary correction—or the beginning of a broader downside phase heading into the monthly close.
Why Bitcoin Price Is Dropping Today
The latest pullback has raised the possibility of yet another bearish monthly close after marking five months in the red. The current decline is not driven by a single factor but rather a confluence of pressure points:
Macro uncertainty: Rising geopolitical tensions and surging oil prices have triggered a global risk-off sentiment, pushing investors away from volatile assets like crypto
Derivatives-led volatility: A large wave of liquidations has wiped out leveraged long positions, accelerating downside momentum
Options expiry impact: Recent expiry events have increased short-term volatility, with price gravitating toward key liquidity zones
Profit-taking: After multiple rallies, short-term holders appear to be booking gains near resistance
This combination has created a cascade effect, where selling pressure feeds further downside.
BTC Liquidation Heatmap Signals Volatility Ahead
The 12-hour liquidation heatmap highlights a liquidity-driven setup, where Bitcoin’s next move is likely to target leveraged positions rather than follow a clean trend. A major liquidity cluster sits between $67K and $69K, acting as a potential upside magnet. If BTC reclaims nearby resistance, a short-term move toward this zone could trigger liquidations and fuel volatility.
On the downside, strong liquidity is concentrated around $64K–$65K, making it a key target if current support levels fail. This creates a liquidity sandwich structure, with price caught between two high-liquidity zones. Notably, liquidity near the current $66K range is relatively thin, suggesting the market may avoid consolidation and instead move sharply toward either side.
Bitcoin Price Analysis: Can BTC Defend $65,000?
The 4-hour chart of Bitcoin (BTC/USDT) shows a clear shift in short-term market structure, with the price breaking below a crucial ascending trendline and slipping under key moving averages. This breakdown signals weakening bullish momentum and rising downside risk. Bitcoin had been trading within an ascending trend, supported by a rising trendline, since late February. However, the recent sharp drop has decisively broken this support, indicating that buyers have lost control in the short term.
Such breakdowns often act as early signals of a trend reversal or deeper correction, especially when accompanied by increased selling pressure.
The price is now trading below the 50-day and 200-day moving averages, positioned around the $68.4K–$69.2K range. This zone has flipped into a strong resistance area, limiting upside attempts. As long as BTC remains below this range, the market is likely to stay under bearish pressure in the near term.
Bitcoin is currently hovering near immediate support around $65.6K. A breakdown below this level could accelerate the decline toward $63.9K, which is a strong horizontal support and $62.5K, which is the major demand zone and high-confluence support. These levels are critical for maintaining the broader structure. Losing them may open the door for a deeper correction phase.
The Stochastic RSI is currently near oversold levels, suggesting that a short-term relief bounce is possible. However, this does not confirm a trend reversal and may simply result in a temporary pullback toward resistance.
Conclusion — Will Bitcoin Close the Month Bearish?
Bitcoin price is approaching a critical monthly close, with price action currently favoring the bears after losing key support and trendline structure. As long as BTC trades below the $68.4K–$69.2K resistance zone, the market remains vulnerable to further downside. A sustained breakdown below $65.6K could accelerate the decline toward the $63.9K–$62.5K demand zone, increasing the likelihood of a bearish monthly close.
A strong reclaim of $68.4K–$69.2K could invalidate the breakdown and push Bitcoin back toward the $70K level. Or a Continued rejection below resistance may drive BTC toward $63.9K or even $62.5K, which is more likely.
The Bitcoin price keeps drifting lower while everyone looks around for a clear villain, and somehow, it’s not the usual suspects this time. No, miners aren’t dumping. Instead, the pressure seems to be coming from a more subtle, and arguably more dangerous, place: weak demand and rising leverage, while geopolitical tensions are another additional villain and together they are compressing BTC/USD.
Derivatives Positioning Rises While Spot Demand Fades
An analyst CoinNiel said that exchange inflows have flipped. After a stretch of outflows, we’ve now seen three straight days of BTC moving back onto exchanges. That’s usually not a bullish signal. More coins on exchanges often mean one thing: potential sell pressure is creeping back in.
At the same time, open interest is climbing again. Not explosively, but steadily. That suggests traders are stepping back into the derivatives market, cautiously rebuilding positions. But its not something to get too excited because this isn’t aggressive bullish leverage. Funding rates have turned negative again, which hints that short positions or hedges are dominating the current setup.
And then there’s the Coinbase Premium for which the analyst said that it’s dropped deeper into negative territory, which basically screams weak U.S. spot demand. Meanwhile, Korea Premium has ticked back into positive territory, showing regional demand divergence.
Bitcoin Price Prediction Tilts Slightly Bearish Short Term
Also, in CoinNiel’s perspective, the broader picture doesn’t look great. When you combine rising exchange inflows with declining spot demand, the Bitcoin price prediction starts leaning more cautious.
On-chain probability paints it pretty bluntly, in his terms analyst predicts around 55% neutral-to-bearish trend versus 45% chance of a rebound. That’s not exactly confidence-inspiring. The market isn’t collapsing right now, but it’s definitely not strong either.
There’s also chatter about a bearish continuation pattern forming, similar to what played out in January, per an analyst Tedpillows. If that analogy holds, late March could be setting the tone for a bearish start to Q2. Not guaranteed but enough to keep traders on edge.
Whales Sell While Retail Keeps Accumulating Bitcoin
Now looking at Supply distribution data it shows that large holders those sitting on 100 to 10,000 BTC have been offloading again. Quietly, but consistently.
Meanwhile, smaller wallets holding between 0 to 1 BTC are doing the opposite. They’re accumulating relentlessly. And 1-100 BTC are kind of flat.
So, what’s the message here? Big money is de-risking while retail keeps buying the dip. It’s a classic divergence and not always a bullish one in the short term.
Bitcoin Price Chart Signals Caution Ahead
So, what’s next? The Bitcoin price chart isn’t screaming strong panic yet, but it’s definitely not signaling major strength either. Rising leverage, weak spot demand, and increasing exchange inflows create a setup where downside pressure can build quietly before showing up all at once.
If anything, the current phase feels like a waiting game. Either demand steps in and flips sentiment, or the market slowly bleeds until it finds a level where buyers actually care again, the real bottom i mean.
Until then, the Bitcoin price remains stuck in this awkward limbo where nothing is breaking yet, but nothing looks particularly strong either.
FAQs
What is the Bitcoin price prediction for 2026?
Bitcoin is expected to range between $100K and $180K in 2026, with bullish momentum building as consolidation near $70K shifts into expansion.
How much will 1 Bitcoin be worth in 2030?
Bitcoin could range between $380K and $900K by 2030, with an average target near $750K as adoption, scarcity, and institutional demand grow.
What will 1 BTC be worth in 2040?
By 2040, Bitcoin could range between $5,799,454 and $13,532,059, with an average estimate near $9,665,757 as adoption and scarcity increase.
Is it safe to invest in Bitcoin today for long-term?
Bitcoin can be a strong long-term asset, but it remains volatile. Investing gradually and holding long-term may reduce risk and improve potential returns.
Bhutan has intensified its Bitcoin sales this year, offloading nearly $120 million worth of BTC and cutting its holdings by around 1,700 coins. The government typically breaks its sales into smaller batches of $5 million to $10 million, routing funds through exchanges or market makers such as QCP Capital to manage liquidity. In recent weeks, transfer activity has accelerated, including a fresh move of 123.7 BTC valued at about $8.5 million, signaling continued strategic selling.
Morgan Stanley, one of the leading banks in the US with $6.2 trillion in client assets and 16,000 financial advisors, has set a 0.14% management fee for its spot Bitcoin ETF (MSBT).
The announcement is part of its updated S-1 registration statement filed with the US Securities and Exchange Commission (SEC) for said Bitcoin ETF.
Should the agency approve the filing, the bank’s fees would be the lowest and most competitive in the $85 billion to $92 billion spot Bitcoin ETF market. By comparison, Grayscale Bitcoin Mini Trust’s fee is 0.15%, while BlackRock’s iShares Bitcoin Trust and Fidelity Wise Origin Bitcoin Fund are each 0.25%.
Morgan Stanley’s application for a spot Bitcoin ETF
Previously a cautious observer of cryptocurrencies, Morgan Stanley filed its initial applications for a spot Bitcoin ETF and a spot Solana ETF on January 6, 2026. Shortly afterwards, it filed for a staked Ether ETF and then appointed Amy Oldenburg, one of its time-honored executives, as head of its digital asset strategy.
On March 17, the bank filed an amended S-1, specifying a $1 million seed investment and the ticker MSBT. The company also noted that Coinbase and BNY Mellon were the proposed custodians of the product.
A week later, the New York Stock Exchange (NYSE) issued an official listing for the product, citing its launch as “imminent.”
In addition to the spot Bitcoin ETF, Morgan Stanley applied for a national trust banking charter in mid-February to provide crypto custody, trading, and staking services.
The bank now recommends that its clients allocate 2%-4% of their investment portfolios to cryptocurrencies, including those in individual retirement accounts (IRAs) and 401(k) plans.
Despite disputes with stablecoin issuers over yield farming, banks are increasing their exposure to blockchain and cryptocurrencies through products such as ETFs, tokenized fiat deposits, and tokenized real-world assets. JPMorgan Chase, Standard Chartered, and Goldman Sachs are among the banks leading this cause while helping to legitimize cryptocurrencies in the global financial space.
Bitcoin (BTC) has plummeted below $66K, trading at $65,675 at press time, which is a 3.98% drop in 24h, and a 47.9% dip from its October all-time high (ATH) of $126K.
Liquidations in Bitcoin futures positions totaled $189.17 million, with long positions accounting for $173.24 million.
Traditional assets have not been spared, with gold and silver witnessing 20% and 45% drawdowns from their ATHs, while the Magnificent 7 stocks fell by upto 34% from their January peaks.
Why is Bitcoin down today?
Bitcoin’s price has declined today amid uncertainty caused by the escalation of strikes between the US and Iran and its proxies. Crude oil prices now trade at least $99.13/barrel, adding to inflationary fears amid rising energy prices.
The US Federal Reserve remains undecided on interest-rate action, calling it a “challenging situation” driven by new inflationary shocks amid the conflict in the Middle East. The current US inflation rate is near 3%, well above the Fed’s 2% target.
Additionally, $16.38 billion in Bitcoin and Ethereum futures contracts expired on the Deribit exchange today, marking the largest single-day derivative settlements of the year.
As a result, sentiment turned bearish among institutions, with spot Bitcoin ETFs seeing net outflows of $306.44 million between March 26 and March 27.
BTC price prediction
According to market analyst Aksel Kibar, Bitcoin is mirroring previous bearish wedge patterns, indicating a possible downside move towards $52.5K.
See my analysis at the time of the previous bearish wedge pattern. A similar pattern might be developing.
Another analyst says a bottom will form once BTC drops towards $50K. For bullish investors, both predictions signal a great buying opportunity in the near future.
Goldman Sachs already calls a bottom, while gold permabull Peter Schiff criticizes the coin’s fall below its 2021 peak of $69K “despite record hype and so-called adoption.”
Developments in the US-Iran conflict this weekend are the key events to watch, along with the resulting energy prices and investor action.
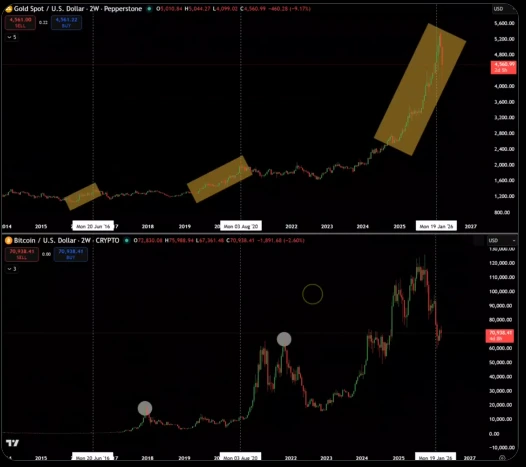
While Bitcoin sits near $70,000 and many investors are questioning whether they missed the rally, macro investor Lawrence Lepard is making a bullish case: the biggest move is still ahead, and the window to buy cheap is closing fast.
Buy the Dip or Regret It
Lepard’s message to anyone sitting on the sidelines is clear. “Think of it the way you think of food. Filet mignon is on sale, you go buy it,” he said. “If you can buy Bitcoin at $70,000, that is great.” For long-term investors, the current price is not a warning sign. It is an opportunity.
He manages money on a multi-year timeframe and says he has high confidence that Bitcoin reaches $200,000, driven not by speculation but by the structural collapse of the dollar’s purchasing power.
The Fed Is Printing Again
The trigger for Lepard’s thesis is already in motion. The Federal Reserve has quietly returned to money printing, currently running at $40 billion per month, what analyst Lyn Alden has called the “gradual print.” While it is not the trillions printed during COVID, Lepard believes it is the beginning of a much larger wave.
“The next print will be bigger than the last one,” he warned. With the US deficit running at over $2 trillion annually and a war adding hundreds of billions more, he sees no path forward that does not involve significantly more money creation.
Dollar Losing Reserve Status
Lepard draws a direct parallel to Britain’s Suez moment, the point at which the pound lost its global dominance. He believes the US dollar is experiencing the same slow-motion collapse, accelerated by geopolitical conflict and fiscal irresponsibility.
“If you are saving money, you have to save in things the government cannot print,” he said plainly.
Bitcoin Over Gold
While Lepard is bullish on both Bitcoin and gold, he sees Bitcoin as the better buy at current levels, with greater upside potential as institutional adoption accelerates and available supply continues to shrink through ETF lockups and long-term holding.
His timeline for the broader system to face a breaking point: somewhere in the next 12 to 18 months. The avalanche, he says, is already built. Nobody knows which snowflake triggers it.
Bitcoin is trading at $66,636 at the time of writing, down 3.82% on the day, with the Coinpedia technical analysis gauge firmly in Strong Sell territory. The move lower hasn’t caught everyone off guard, but the speed of it has.
Over $115 million in BTC long positions were liquidated in a single hour as the price broke below $67,000. The fear and greed index has dropped to 23, down from 32 last week, sitting in Fear territory.
The Pattern Analysts Are Watching
Crypto analyst Crypto Patel flagged the setup directly: “First Bearish Flag broke down and Bitcoin crashed from $89,000 to $60,000 in just 8 days. Now $BTC is forming the exact same pattern again.”
First Bearish Flag broke down and Bitcoin crashed from $89,000 to $60,000 in just 8 days.
His warning is specific. A daily close below $66,000 could trigger a breakdown targeting $46,000.
Ran Neuner echoed the concern: “The bear flag just broke down. It’s not good. Could go as low as $50k if we don’t bounce soon.”
Month-end timing adds to the pressure. Michaël van de Poppe noted Bitcoin’s current weakness heading into month end and flagged the risk of a deeper correction, with a potential sweep of the lows.
His positioning: “I remain to be interested to be buying in the lower $60K regions.”
The on-chain picture reflects the same uncertainty. On March 26, spot Bitcoin ETFs recorded $171 million in net outflows. Spot Ethereum ETFs saw $92.54 million exit, extending their outflow streak to seven consecutive days, according to Wu Blockchain.
Institutional money is not stepping in to cushion the slide.
Interactive Brokers strategist Steve Sosnick noted that market internals still show persistent buying on dips, but framed it as a warning rather than reassurance.
“We’ve gotten so convinced that every dip is a buying opportunity,” he said, pointing to reflexive FOMO behaviour rather than fundamental conviction. With oil not yet hitting the $150-$200 barrel scenarios risk managers have long modelled for a Strait of Hormuz closure, Sosnick’s read is that markets may be underestimating what’s still possible.
Never Miss a Beat in the Crypto World!
Stay ahead with breaking news, expert analysis, and real-time updates on the latest trends in Bitcoin, altcoins, DeFi, NFTs, and more.
FAQs
What is the Bitcoin price prediction for 2026?
Bitcoin is expected to range between $100K and $180K in 2026, with bullish momentum building as consolidation near $70K shifts into expansion.
How much will 1 Bitcoin be worth in 2030?
Bitcoin could range between $380K and $900K by 2030, with an average target near $750K as adoption, scarcity, and institutional demand grow.
What will 1 BTC be worth in 2040?
By 2040, Bitcoin could range between $5,799,454 and $13,532,059, with an average estimate near $9,665,757 as adoption and scarcity increase.
Is it safe to invest in Bitcoin today for long-term?
Bitcoin can be a strong long-term asset, but it remains volatile. Investing gradually and holding long-term may reduce risk and improve potential returns.
The Bitcoin price is once again approaching a critical zone, but the current setup suggests traders may be walking into a trap. Despite strong liquidity clusters building above the $70,000 level, key derivatives data show weak conviction, rising leverage dominance, and a lack of real spot demand. This combination often precedes sharp, unexpected moves in the opposite direction.
With Bitcoin consolidating near $68,000 inside a rising channel, the big question is: Will BTC break toward $72K or drop to sweep liquidity near $66K first?
Bitcoin Liquidation Heatmap Shows $72K Target — But a Short-Term Dip Could Come First
Recent shifts in open interest, funding rates, and volume ratios indicate that the market is not trending—it’s positioning for a liquidity-driven move. And historically, in such conditions, Bitcoin tends to move where it hurts the most traders before choosing a direction.
The latest Bitcoin liquidation heatmap (48-hour) highlights a clear liquidity imbalance, with major clusters forming above the current price. Data indicates that the $70,000 to $72,000 range holds a dense concentration of leveraged short positions, making it a key target for any upward move. This zone acts as a liquidity magnet for the BTC price, as a move into this region could trigger a short squeeze.
Historically, Bitcoin tends to test such high-liquidity levels.
While the upside target remains clear, the heatmap also reveals nearby liquidity below the current price, particularly around $66K–$68K. These levels contain long liquidation clusters, with the price often moving toward closer liquidity zones first as weak momentum increases the chances of a downside sweep. This suggests that Bitcoin could drop in the short term before attempting a move toward $72K.
The liquidation heatmap suggests that while Bitcoin price could target $72K, traders should prepare for short-term volatility and potential downside risk first.
Bitcoin Derivatives Data Hints at Volatility as Leverage Dominates Market
Bitcoin’s current price action suggests consolidation, but underlying derivatives data tells a more important story—the market lacks strong conviction and is increasingly driven by leveraged trading rather than spot demand.
Aggregate open interest remains largely flat near the $21 billion level after a recent decline, indicating that traders are not aggressively building new positions. This lack of participation typically signals uncertainty and often precedes a sharp move once liquidity is triggered.
At the same time, the funding rate has turned slightly positive, reflecting a mild long bias in the market. However, the absence of extreme funding levels suggests that bullish sentiment is not strong enough to sustain a breakout on its own. This aligns with the Relative Strength Index (RSI), which continues to hover in the neutral zone near 44, highlighting the absence of clear momentum in either direction.
Adding to this, the perpetual futures-to-spot volume ratio remains elevated, showing that most of the trading activity is concentrated in derivatives rather than actual buying in the spot market. Historically, such conditions lead to liquidity-driven price action, where Bitcoin moves sharply to liquidate overleveraged positions rather than follow a steady trend.
Taken together, these indicators suggest that Bitcoin is currently in a low-conviction environment, where price is more likely to experience sudden volatility than a sustained directional move. This reinforces the possibility of a liquidity sweep before any meaningful breakout, aligning with the broader market structure seen in recent sessions.
Bitcoin Outlook for Traders: Key Levels and Month-End Target
Bitcoin price remains in a low-conviction, liquidity-driven phase, where price is more likely to move sharply toward key liquidation zones rather than follow a steady trend. Current structure and derivatives data suggest that traders should prepare for volatility and fakeouts rather than a clean directional breakout.
In the near term, the $66,000–$67,000 zone acts as critical support, where a cluster of long liquidations could be triggered if the BTC price dips further. On the upside, the $70,000 level remains immediate resistance, while the broader $71,500–$72,500 range stands out as the primary liquidity target, supported by dense short positions visible on the heatmap.
Given the lack of strong participation in open interest and the dominance of leveraged trading, Bitcoin is unlikely to break out cleanly without first clearing nearby liquidity. This increases the probability of a short-term downside sweep below $67K, followed by a reversal toward the $70K–$72K range by the end of the month
The crypto market is flashing a clear warning, and this time, it’s not just technicals driving the move. Bitcoin price has slipped to $68,670, Ethereum price has dropped near $2,050, and over $336 million in liquidations have already been triggered as geopolitical tensions escalate. The catalyst? A sharp deterioration in the US–Iran conflict, which is rapidly pushing global markets into a risk-off mode.
With sentiment now firmly in the fear zone, the big question is no longer whether volatility is coming, but how deep this crypto crash could go if macro pressure intensifies further.
War Tensions Trigger Broad Crypto Sell-Off
The latest escalation in the US–Iran conflict has rattled global financial markets, with investors quickly moving away from high-risk assets. Crypto, which has increasingly behaved like a risk-on instrument in recent cycles, is now reacting sharply to geopolitical uncertainty.
Recent developments indicate that Iran has rejected key diplomatic proposals, prolonging uncertainty and keeping markets on edge. This has directly impacted crypto sentiment, with Bitcoin dropping below the critical $69K region while Ethereum and other major altcoins follow suit. The broader market reaction highlights a growing trend, crypto is no longer acting as a hedge, but rather as a liquidity-sensitive asset tied to global macro conditions.
Liquidations Surge as Market Structure Weakens
The sudden downturn has triggered a cascade of liquidations across derivatives markets. Over $336 million in positions have been wiped out, with long traders taking the biggest hit as prices moved sharply lower.
This type of liquidation spike typically accelerates downside momentum, as forced selling pushes prices further down in a short period. It also reflects excessive leverage in the system, which tends to unwind aggressively during macro-driven shocks.
At the same time, the Crypto Fear and Greed Index dropping to 29 confirms a rapid deterioration in sentiment. Markets have shifted from cautious optimism to fear within a short span, indicating that traders are reducing exposure and waiting for stability.
Bitcoin & Ethereum Price Analysis: Key Levels To Watch
Bitcoin price is now testing a crucial support zone around $68,000–$68,500. This level has historically acted as a short-term demand area, but repeated tests weaken its strength.
A confirmed breakdown below this region could expose Bitcoin to a deeper move toward $65,000, where stronger support lies. For the past sessions, Bitcoin has failed to sustain above the hurdle of $70,000-$73,000 and faced rejection multiple times. A clean break above $73K would lead to a massive short covering move toward $80K in the short term.
Meanwhile, Ethereum price is holding near the $2,000–$2,050 range, a key psychological and structural level. If this zone fails to hold, downside could extend toward $1,900, increasing pressure across the altcoin market. On the upside, recovery will require Bitcoin to reclaim the $70,000 level, while Ethereum needs to move back above $2,200 to regain bullish momentum. Until then, rallies are likely to face selling pressure.
Outlook: Volatility Likely to Intensify
The current market setup reflects a clear convergence of macro stress, liquidation pressure, and weakening sentiment. The escalation in geopolitical tensions has introduced a layer of uncertainty that is difficult for markets to price in quickly. In the near term, volatility is expected to remain elevated. Any signs of de-escalation could trigger a relief bounce, but continued tensions may deepen the current correction.
For now, the crypto market remains in a fragile state, where macro headlines, not technical setups, are driving the next move.
A large batch of Bitcoin and Ethereum options is set to expire this Friday, with total value crossing $15.58B billion as per Deribit insights. This marks one of the largest single-day expiries of the year and will take place at 8:00 UTC. The put/call ratios stand at 0.63 for Bitcoin and 0.57 for Ethereum, showing that more traders are still positioned for upside.
As expiry gets closer, prices often move toward what traders call the “max pain” level. This is the price at which most options expire worthless. Because of this, markets can feel like they are being pulled toward certain levels. At the same time, traders and market makers keep adjusting positions, which creates a tug-of-war in price.
This effect usually lasts only until expiry. Once the contracts expire, that pressure disappears.
Bitcoin Market Sentiment Weakens Before Options Expiry Today
Most of the expiring value is in Bitcoin, with around $14 billion worth of contracts. The key level to watch is $75,000, often called the “max pain” point — where most options are expected to expire without profit.
As the expiry gets closer, market activity can slowly push the price toward this level. Right now, most bullish bets are placed much higher, above $90,000, while only a small number sit below $78,000. If Bitcoin stays near $71,000 at expiry, a large share of these bullish positions could expire worthless. Because of this setup, bulls would need roughly a 6% move up in a short time to shift momentum in their favor.
There are also a few important price levels to keep in mind. Around $71,000 is acting as immediate resistance, while $75,000 remains the key level to break. If price moves higher, the next area to watch is around $78,000–$79,000. On the downside, support sits near $66,000–$67,000.
Bitcoin is currently trading near $68,000, which means it is still below the key $75,000 level. This could create some upward pressure in the short term, but if the price fails to move higher, it may continue to stay weak.
Ethereum Options Expiry Signals Limited Volatility in the ETH Price
Ethereum has about $2.2 billion in options expiring, with a key level around $2,300. With the price already near this level, the ETH Price may not see sharp moves like Bitcoin. Instead, it is more likely to stay within a limited range in the short term.
The current trend is slightly weak so upside moves may struggle without strong buying support. If the price dips toward $2,020 or $1,916 and shows signs of recovery, it could move up toward $2,147 and then $2,197.
If the price moves higher toward the $2,200–$2,300 zone but fails to hold, it may turn lower again. In that case, downside levels to watch are $2,147, followed by $2,020 and $1,916.
A clear break above $2,386 would signal stronger upward momentum. On the downside, a drop below $1,800 could open the door for further weakness.
Never Miss a Beat in the Crypto World!
Stay ahead with breaking news, expert analysis, and real-time updates on the latest trends in Bitcoin, altcoins, DeFi, NFTs, and more.
FAQs
What happens when Bitcoin and Ethereum options expire?
When options expire, contracts settle and hedging pressure fades. This often reduces volatility and can shift price trends shortly after expiry.
Will Bitcoin price rise after this $15.58B options expiry?
Bitcoin may see relief after expiry as pressure eases. A move above $72K–$75K could strengthen bullish momentum if buying volume increases.
What key levels should traders watch after options expiry?
For Bitcoin, watch $72K–$75K resistance and $66K support. For Ethereum, monitor $2,300 resistance and $2,020–$1,916 support zones.
Bitcoin (BTC) has recently breached the key psychological support level of $70,000, trading at $68,739.30 (-3.49% in 24h) at press time.
This happened after the Pentagon reported plans to execute a “final blow” on Iran, in addition to the upcoming expiration of $16.4 billion in Bitcoin and Ethereum options on Friday.
Nonetheless, on-chain data show persistence in whale accumulation, with wallets holding between 10 and 10,000 BTC increasing their positions by 0.45% (61,568 BTC) over the past month.
Consistent accumulation is generally a sign that the market is ripe for bullish momentum.
Still, the digital asset’s price has continued to drift, failing to break above $75,000 over the past month.
Beyond macroeconomic and geopolitically driven uncertainty, retail fear of missing out (FOMO) is contributing to the price pullback.
According to market intelligence platform Santiment, retailers’ accumulation of Bitcoin is moving in tandem with that of sharks and whales. In the past month, wallets with under 0.01 BTC have added onto their stash by 0.42%.
Bitcoin has historically shifted from bearish to bullish momentum when the actions of these two investors diverged – long-term holders expressed immense buying pressure as short-term holders exited the market.
Until we attain such a trend, the digital asset is likely to experience prolonged sideways movement. Fed actions, inflation reports, and developments in the ongoing US-Iran conflict will continue to drive price volatility.
Near-term BTC movement
In the near term, analysts point to an impending capitulation, driven by historical trends and economic pressures.
Another analyst points out that a dip below $48,387 (the long-term holder realized price) and the -0.2 standard deviation band ($36,657) have historically sparked bull runs. And each time the gains exceeded 300% within 18 months.
For over a decade, Bitcoin $BTC has kicked off new bull runs after dropping below:
Leading US exchange Coinbase has partnered with Better Home & Finance (Better.com) mortgage lender, to launch cryptocurrency-backed mortgages.
Henceforth, home buyers can pledge their Bitcoin (at 250% collateral) or USDC (at 125%) as collateral for home loans without selling them (the tokens). This eliminates capital gains tax since there are no realized gains.
Additionally, these loans comply with the new Federal Housing Finance Agency (FHFA) standards, which make them eligible for lower interest rates than private cryptocurrency loans.
Notably, the loan terms and conditions remain unchanged amid crypto market volatility. While this introduces liquidation risk if the asset’s value falls below the threshold price, it provides home buyers with loan repayment stability.
Get your house and keep your crypto.
Crypto-backed mortgages are here – increasing access to homeownership for millions of Americans.
Buy a home without converting your portfolio by using BTC or USDC as collateral for your down payment.
The Coinbase announcement comes after a June 2025 directive from the FHFA ordering secondary mortgage lenders, Fannie Mae and Freddie Mac, to recognize digital assets as eligible collateral for the $18.5 trillion mortgage market.
The product addresses homeownership barriers, with the US median home sale price at about $429,000 as of February 2026. Meanwhile, the median age of first-time homebuyers was at an all-time high of 40 as of late 2025.
With the news, Better.com stock (Nasdaq: BETR) gained 5.41% in the day to a closing price of $33.12.
America’s largest bank, JPMorgan Chase, now allows a select group of clients to use Bitcoin and Ethereum as loan collateral through its Onyx blockchain platform.
BNY Mellon offers a similar service, providing crypto custody and loans simultaneously. Meanwhile, Wells Fargo and Bank of America take spot Bitcoin ETF shares as collateral.
The leading providers of crypto-backed loans in centralized finance include Nexo and Ledn, while in the decentralized space, the leading providers are Aave and Morpho.
Sygnum Bank, a Swiss cryptocurrency bank, provides credit solutions with digital assets or their hashrate as collateral.
Marathon Digital ($MARA) has sold 15,133 Bitcoin between March 4 and March 25, raising roughly $1.1 billion in one of its largest BTC liquidations this year. The company disclosed the sale in an SEC filing and plans to use most of the proceeds to repurchase around $1 billion in convertible senior notes due in 2030 and 2031, reducing its debt load by about 30%. MARA’s stock jumped as investors saw the move as a strategic step to strengthen the balance sheet and limit shareholder dilution.
Bitcoin is currently trading at: $ 70,044.84668093
Bitcoin holds strong near $70K in 2026, signaling accumulation. A breakout above $75K could drive BTC toward $120K–$150K this cycle.
BTC remains range-bound between $67K–$75K, with strong demand below. Analysts predict a bullish expansion toward $150K+ before 2026 ends.
Bitcoin’s consolidation phase in 2026 reflects accumulation, not weakness, with long-term forecasts targeting $250K+ and up to $900K by 2030.
Three months into 2026, Bitcoin price continues to hover around the $70K–$71K zone, and the market is starting to realize that this isn’t weakness, it’s a phase of positioning. Despite multiple attempts, BTC has struggled to sustain moves above the $72K–$75K resistance, while every dip toward the $67K–$69K range is being absorbed quickly. This behavior reflects a market where selling pressure is no longer dominant, but buyers are also not chasing price aggressively. At the same time, capital rotation across the crypto market remains selective.
Large-cap assets like Bitcoin continue to hold relatively stable, while broader participation remains uneven, a pattern often seen when the market is rebalancing rather than trending. What’s also notable is the steady demand during dips. Recent price action shows consistent buying interest near support, suggesting that stronger hands are gradually building positions, while the lack of breakout continuation indicates that liquidity above remains heavy.
This push-and-pull dynamic has resulted in a tight compression structure, where volatility continues to contract and price action becomes increasingly controlled. Such phases don’t reflect weakness, they reflect preparation. With Bitcoin spending extended time within this range, the structure suggests that the market is building pressure near a key inflection zone, where the next move could define the broader trend for the months ahead.
With that in focus, let’s move into Bitcoin’s price prediction for 2026 and understand what lies ahead.
Coinpedia’s BTC Price Prediction 2026
Coinpedia’s price prediction suggests that Bitcoin is currently in a transitional phase, cooling off after its 2025 peak while holding a long-term bullish structure. The ongoing consolidation near $70K reflects a reset in momentum rather than a breakdown, with the market rebalancing before its next move. While short-term volatility may persist, BTC could gradually recover, with potential to reach $120K–$150K+ in 2026, as the cycle shifts toward expansion.
Bitcoin’s recent price action clearly shows a range-bound structure, with price oscillating between $67K–$75K over the past few weeks.
On the downside, the $67K–$69K zone continues to act as a strong demand area, where buyers are consistently stepping in and preventing deeper corrections. Each dip into this region is being absorbed quickly, indicating that downside momentum remains limited.
On the upside, Bitcoin is facing repeated rejection near the $72K–$75K resistance zone. Despite multiple attempts, the price has failed to sustain above this level, suggesting that supply remains active and breakout momentum is still lacking. This behavior reflects a tight compression phase, where volatility is shrinking and price is getting squeezed between support and resistance. If Bitcoin manages to break above the $75K level, it could trigger a momentum shift toward the $80K–$85K range, potentially opening the door for further upside expansion.
However, if BTC fails to hold the $67K support, the price may revisit the $62K–$64K zone, aligning with previous demand levels. Overall, Bitcoin price is currently in a range-bound accumulation phase, and the longer it continues within this structure, the stronger the eventual breakout is likely to be.
Bitcoin Price Prediction 2026
Bitcoin’s price structure in 2026 points toward a transition year, where the market is gradually shifting from consolidation into expansion rather than entering a fresh bearish phase.
The first key trigger remains the $75K–$80K range. A sustained reclaim of this zone would indicate strengthening momentum, allowing BTC to move toward the $90K–$100K region, where the next resistance is likely to emerge. If price stabilizes above this level, it would confirm a shift out of the current range, opening the path toward the $110K–$130K zone in the later part of the year.
At the same time, external uncertainties continue to keep the upside controlled. Periodic spikes in geopolitical tensions, sudden liquidity shifts, and risk-off reactions across global markets are creating intermittent pressure, preventing immediate breakout continuation. This is one of the key reasons why Bitcoin, despite holding strong support, is still struggling to trend decisively.
However, what stands out is the consistency in demand. Every dip toward lower levels is being absorbed, suggesting that the market is building a base rather than weakening. This kind of structure typically forms before expansion, especially when downside follow-through remains limited. On the downside, failure to hold the $67K support zone could trigger a temporary correction toward the $60K–$62K region. But unless this level breaks decisively, the broader structure remains intact.
Overall, 2026 is shaping up as a rebuilding and controlled expansion phase, where Bitcoin is stabilizing under external pressure while gradually preparing for its next major move.
Bitcoin Price On-chain Outlook
Bitcoin’s on-chain data is currently reflecting a strong shift in supply dynamics and holder behavior, aligning closely with the ongoing range-bound structure on the chart. One of the most notable developments is the decline in Bitcoin reserves on major exchanges like Binance, which have dropped to their lowest levels since the start of 2026. This reduction in available supply suggests that coins are increasingly being moved off exchanges into cold storage or long-term holdings, effectively reducing immediate selling pressure in the market.
At the same time, a contrasting trend is visible on platforms like Upbit, where reserves have climbed to their highest levels since 2024. This divergence highlights a shift in liquidity distribution, where global supply is tightening while regional trading activity, particularly in the Korean market, is increasing, often acting as an early signal of rising demand or short-term volatility.
Alongside this, holder behavior is undergoing a significant transition. Data shows that Bitcoin accumulated during late 2025 has now crossed the 155-day threshold, moving into the long-term holder (LTH) category. This shift indicates that a large portion of previously active supply is no longer being traded, but instead held with conviction. Historically, the transition from short-term holder dominance to long-term holder dominance marks a move away from speculative trading toward accumulation-driven phases. The current environment reflects a similar pattern, where conviction-based holding is beginning to outweigh short-term market activity.
Taken together, these on-chain signals suggest that Bitcoin is in a phase where supply is tightening while holding behavior is strengthening, even as price remains range-bound. This kind of setup typically forms when the market is building a base, where reduced sell pressure and increasing long-term conviction gradually set the stage for a stronger directional move ahead.
Recent Events Affecting Bitcoin’s Price
The shift from late 2025 into 2026 has completely changed Bitcoin’s momentum. After hitting its peak near $120K+, the market entered a cooling phase as profit-taking kicked in and the price slipped into a prolonged consolidation. This marked the transition from a high-momentum rally into a structure-building phase, where volatility started to compress.
The biggest trigger in recent months has been the ongoing Iran conflict, which has injected uncertainty across global markets. Rising tensions, drone strikes, and threats around the Strait of Hormuz have disrupted energy markets and increased volatility, keeping risk assets like Bitcoin, capped despite strong support.
At the same time, the Trump factor has played a direct role in Bitcoin’s short-term moves. Announcements around delaying strikes on Iran or initiating negotiations have repeatedly triggered relief rallies, pushing BTC back above $70K. However, the lack of sustained resolution has also caused sharp reversals, keeping the price locked in a range.
Institutional behavior has also influenced price direction. Earlier outflows and profit booking created downward pressure, but recent sessions have shown renewed positioning near lower levels, preventing deeper breakdowns and supporting the current range-bound structure.
Another layer of uncertainty comes from ongoing regulatory developments in the U.S., where delays and debates around crypto legislation continue to impact sentiment. Proposals affecting stablecoins and broader market rules have created hesitation among investors, limiting aggressive upside momentum.
Meanwhile, global markets themselves remain unstable. Fluctuations in oil prices, shifts in bond yields, and defensive positioning by investors have created a mixed environment, where Bitcoin is reacting to both risk-on and risk-off signals without a clear trend.
Bitcoin Crypto Price Prediction 2026 – 2030
Year
Potential Low ($)
Potential Average ($
Potential High ($)
2026
100k
150k
180k
2027
170K
250K
330K
2028
200K
350K
450K
2029
275K
500K
640K
2030
380K
750K
900K
Bitcoin Price Prediction 2026 Forecast
The BTC price range in 2026 is expected to be between $100K and $180K.
BTC Price Prediction 2027
Subsequently, the Bitcoin price range can be between $170K to $330K during the year 2027.
Bitcoin (BTC) Price Prediction 2028
With the next Bitcoin halving, the price will see another bullish spark in 2028. Specifically, as per our Bitcoin Price Prediction, the potential BTC price range in 2028 is $200K to $450K.
BTC Price Target For 2029
Thereafter, the BTC price for the year 2029 could range between $275K and $640K.
Bitcoin (BTC) Price Prediction 2030
Finally, in 2030, the price of Bitcoin is predicted to maintain a positive trend. Indeed, the BTC price is expected to reach a new all-time high, ranging between $380K and $900K.
The long-term projection assumes Bitcoin (BTC) sustains relevance in overall cryptocurrency adoption and the continued development of blockchain payment solutions, with growth moderating over time as the asset matures.
Year
Potential Low ($)
Potential Average ($)
Potential High ($)
2031
540,830
901,383
1,261,936
2032
757,162
1,261,936
1,766,711
2033
1,059,945
1,766,711
2,473,477
2040
5,799,454
9,665,757
13,532,059
2050
161,978,188
269,963,647
377,949,106
Bitcoin Prediction: Analysts and Influencers’ BTC Price Target
“Jack Dorsey, former Twitter CEO (now X), predicts Bitcoin could exceed $1 million by 2030 due to its ecosystem growth and increasing adoption.”
Cathie Wood, CEO of Ark Invest, projects Bitcoin to reach $1.5 million by 2030, driven by institutional adoption and its position as digital gold.”
“Wall Street broker Bernstein believes 2026 will mark the start of a tokenization “supercycle,” maintaining its $150,000 Bitcoin price target for this year and $200,000 for the 2027 cycle peak.”
“Brad Garlinghouse, the Ripple CEO, predicts Bitcoin will hit $180,000 in 2026, due to favorable market and regulatory conditions.”
Never Miss a Beat in the Crypto World!
Stay ahead with breaking news, expert analysis, and real-time updates on the latest trends in Bitcoin, altcoins, DeFi, NFTs, and more.
FAQs
What is the Bitcoin price prediction for 2026?
Bitcoin is expected to range between $100K and $180K in 2026, with bullish momentum building as consolidation near $70K shifts into expansion.
How much will 1 Bitcoin be worth in 2030?
Bitcoin could range between $380K and $900K by 2030, with an average target near $750K as adoption, scarcity, and institutional demand grow.
What will 1 BTC be worth in 2040?
By 2040, Bitcoin could range between $5,799,454 and $13,532,059, with an average estimate near $9,665,757 as adoption and scarcity increase.
How much will Bitcoin be in 2050?
Bitcoin in 2050 could range from $161M to $377M, with an average estimate near $269M, driven by long-term adoption, scarcity, and global demand.
Is it safe to invest in Bitcoin today for long-term?
Bitcoin can be a strong long-term asset, but it remains volatile. Investing gradually and holding long-term may reduce risk and improve potential returns.
Is it worth putting $100 into Bitcoin?
Yes, investing $100 in Bitcoin can be a good start. It allows beginners to gain exposure, learn the market, and benefit from potential long-term growth.
The US White House has completed its review of the proposal to allow cryptocurrencies, including Bitcoin (BTC) and private equity exposure in 401(k) retirement plans.
The proposal now awaits formal ruling from the Department of Labor (DOL). A positive ruling would support the flow of $13.9 trillion from defined-contribution plans, such as 401(k), into cryptocurrency investments.
This development would further reinforce the legitimacy of the blockchain and cryptocurrency industry, possibly driving higher demands and breaking recent price consolidation in favor of a bullish reversal.
Bitcoin inclusion in retirement portfolios
The clearance from White House comes after an August 2025 executive order asking the DOL to ease restrictions on alternative assets. The latter spans private equity, real estate, infrastructure, commodities, and cryptocurrencies.
While Bitcoin inclusion in 401(k) plans is already legal under the Employee Retirement Income Security Act (ERISA) of 1974, a positive review from the DOL would shift the DOL’s crypto stance away from “extreme care.”
By contrast, the former Biden administration warned against integrating cryptocurrency into retirement plans, saying volatility could wipe out entire funds and threaten economic stability.
This stance shifted in May 2025 in line with the Trump administration’s aspirations to make America a global hub for Bitcoin and cryptocurrency.
Community reaction on crypto retirement plans
The move to integrate Bitcoin and crypto into retirement portfolios has elicited divergent reactions within the community. Supporters highlight increased accessibility to high-yield digital assets, with financial gains offsetting inflationary effects on the value of fiat.
The #1 barrier to #Bitcoin adoption just crumbled. The Labor Department’s new rule means your employer can finally offer you Bitcoin without fearing a lawsuit. By opening the $13T 401(k) market, the government is making Digital Scarcity a core pillar of the American Dream. This…
Critics note that uptake may be lower because retirement firms prioritize stable gains over speculative ones or illiquid investments like private equity.
What happens next?
Currently, the DOL maintains a neutral stance on the inclusion of crypto in retirement plans. Once it issues its upcoming ruling, a public commentary period would follow, and thereafter a final ruling.
A positive verdict would provide legal protection to fiduciaries, preventing them from being investigated or sued for including Bitcoin.
Nonetheless, the integration may take some time as retirement firms assess the benefits of such investments and develop the necessary infrastructure to support them.
At press time, the flagship cryptocurrency was trading at $70,748, having gained 1.3% in the day following reported peace talks between the rival nations.
The positive price action is also attributed to a year-to-date reversal in Bitcoin ETF outflows, with $2.5 billion in inflows over the past month alone.
Why Bitcoin is consolidating despite heightened accumulation
A short squeeze could have triggered further buying pressure as investors sought to cover their losses (short-position liquidations rose to $48.2 million on the day).
Another reason is increased investor accumulation, as shown by blockchain intelligence firm Glassnode. 10,485 BTC has been offloaded from exchanges in the past week, bringing Bitcoin balances to an all-time low of 2.4 million. Long-term holders have expanded their BTC portfolios, adding about 33,000 BTC in the past month.
Still, prices remain below $75K due to insufficient buying pressure despite tight supply.
The BTC price debate
In the past, Bitcoin prices have plunged roughly 850 days after a halving. At around 700 days post the 2024 halving, it would appear we are almost due for a repeat in history.
Crypto market intelligence division K33 Research supports this theory, identifying $60K as a likely upcoming bottom fueled by negative funding.
To add on to that, Bitcoin’s “electrical cost” (break-even mining price) has declined below $60K from $70K in Q4 2025. Historically, reduced miner profitability coincided with price floors. This has been the argument among analysts, including those at Kalshi prediction markets, in their forecasts of a low of $48K.
Gold permabull Peter Schiff warns of a financial crisis brought on by inflationary pressures from rising oil prices.
We are headed for a full-blown financial crisis. February import prices spiked 1.3% while export prices surged 1.5%, annualizing to inflation rates of 16.8%–19.6%. That's before oil rose 50%. Unless the Fed raises rates several hundred basis points now, inflation will skyrocket.
Bitcoin is showing signs of a short-term recovery, with price action attempting to push higher toward the $73,500 level. However, analysts warn that the current move may not mean a full bullish reversal, but rather a temporary rebound within a broader corrective structure.
Recent market activity shows that Bitcoin climbed steadily before encountering resistance near the $71,550 zone. This level has been a critical barrier, having acted as a rejection point multiple times in recent sessions.
Despite the upward momentum, the move is being viewed as a counter-trend rally, meaning it could face renewed selling pressure. While the price action remains constructive in the very short term, the broader structure still lacks clarity.
For bullish momentum to continue, Bitcoin must break decisively above the $71,550 resistance. A successful breakout could open the door for a move toward the $73,500 range, which is currently seen as a near-term target based on technical projections.
On the downside, support is forming around $70,400. Holding this level is crucial for maintaining upward momentum. A break below it would not necessarily trigger a sharp decline, but it could signal a shift in structure and increase the likelihood of further consolidation or downside movement.
Bigger Picture Remains Uncertain
Zooming out, the broader trend shows Bitcoin may still be navigating a corrective phase following a previous decline. Analysts point to the possibility that the current upward move is part of a larger wave structure, rather than the beginning of a sustained rally.
The resistance range between $73,500 and $74,800 is being closely monitored. This zone could act as a strong ceiling, where sellers may re-enter the market and trigger another downward leg.
The Bitcoin price has started to stabilize around the $70K region after a sharp pullback, with signs of easing sell-side pressure and improving ETF flows. The immediate downside momentum has slowed, but the recovery still lacks conviction.
Spot volumes remain muted, and overhead supply continues to cap upside moves. This puts BTC in a familiar position—stabilizing, but not yet breaking out. The next move depends on whether fresh demand steps in or if the price remains stuck in a broader range. Below is the on-chain data from Glassnode, which suggests that the breakout may not be nearby.
This heatmap tracks where short-term holders accumulated Bitcoin, essentially showing where supply is concentrated across price levels. Right now, a significant portion of that supply sits above the current price, particularly in the $75K–$90K range. This creates a clear overhead resistance zone. Many of these holders are currently at a loss, and as the price moves higher, they are likely to sell at breakeven. That’s what makes upside moves slow and difficult to sustain.
On the other side, the $65K–$70K range is starting to build as a support cluster. This is where newer buyers have stepped in and are holding their positions, preventing further downside for now. So the structure is quite clear—Bitcoin is trading between a strong support base below and heavy supply above. Until that overhead supply gets absorbed or cleared, any rally is likely to face resistance, keeping the price stuck in consolidation.
Unrealized Loss Spikes Hint at Weak Hands Being Flushed
This chart tracks how much of the market is sitting at a loss over time. Right now, unrealized losses are starting to rise again, which means a growing number of participants are holding Bitcoin below their entry price. This typically happens during pullbacks, when recent buyers get trapped.
In earlier cycles, sharp spikes in this metric marked capitulation phases, where weak hands exited and strong hands accumulated. However, the current levels are still relatively moderate compared to those extremes. The trade set-up suggests that some pressure is building, but not enough to signal a full market reset. This explains the current price action. Bitcoin is stabilizing, but without a strong flush or aggressive accumulation, momentum remains limited.
Funding Rates Turn Negative as Sentiment Weakens
Perpetual funding rates have flipped negative across exchanges, showing that short positions are gaining dominance in the market. This shift reflects weak sentiment and a lack of aggressive long positioning. Earlier, positive funding showed aggressive long positioning during the uptrend. But the shift to negative funding suggests that confidence has dropped, and the market is no longer chasing upside.
At the same time, persistent negative funding can act as a setup for short squeezes, but only if spot demand returns. Without that, it simply confirms bearish pressure. So the setup is clear—sentiment has turned cautious, but positioning is starting to get crowded on the short side. This keeps Bitcoin in a range for now, but also leaves room for sharp moves if sentiment flips.
Options Gamma Shows Heavy Resistance Above Price
Options data highlights significant negative gamma exposure around the $70K–$75K range, indicating strong dealer hedging pressure. This creates resistance on upward moves and increased volatility near key levels. When gamma is negative, it tends to amplify price moves. On the upside, it creates resistance as dealers hedge by selling into rallies. On the downside, it can accelerate drops as selling pressure increases.
In simple terms, even if BTC attempts to push higher, derivatives positioning may slow the move unless strong spot demand absorbs it. The current range is heavily controlled by derivatives’ positioning, making breakouts harder in the short term. Until this gamma pressure eases or gets absorbed, Bitcoin is likely to stay volatile but range-bound around these levels.
Conclusion – What to Expect This Quarter End
Bitcoin is not in a breakdown, but it’s also not in a confirmed recovery. The market is clearly waiting for liquidity.
Support is forming around $65K–$70K.
Resistance remains heavy above $70K–$75K.
Sentiment is weak, but not extreme
For the rest of the quarter, BTC is likely to remain range-bound unless a strong demand catalyst emerges. A breakout above resistance would require sustained spot inflows, while failure to hold support could bring another leg lower. Right now, Bitcoin price is in a transition phase—not a bearish collapse, but not bullish expansion either.
Need to know what happened in crypto today? Here is the latest news on daily trends and events impacting Bitcoin price, blockchain, DeFi, NFTs, Web3 and crypto regulation.
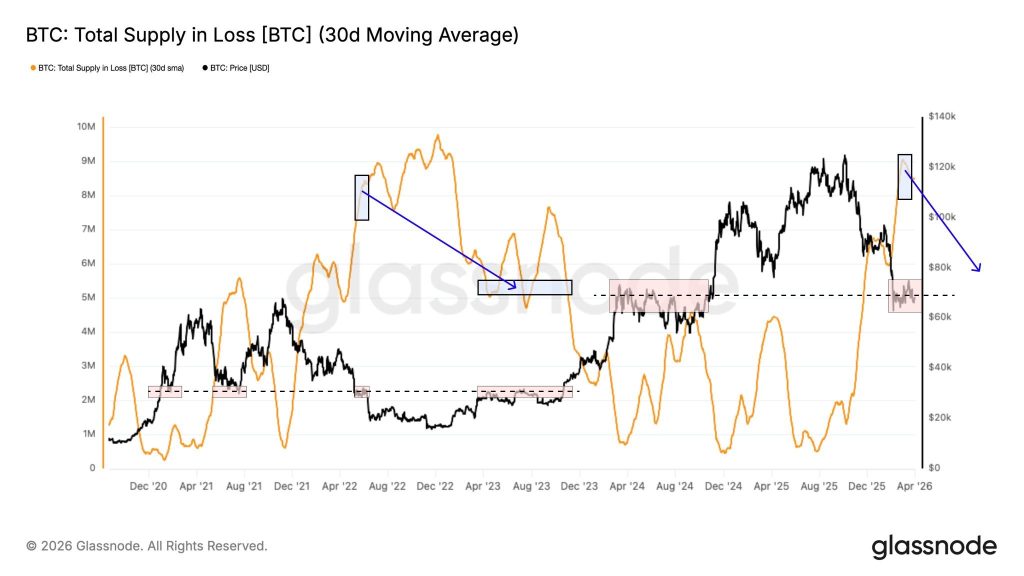
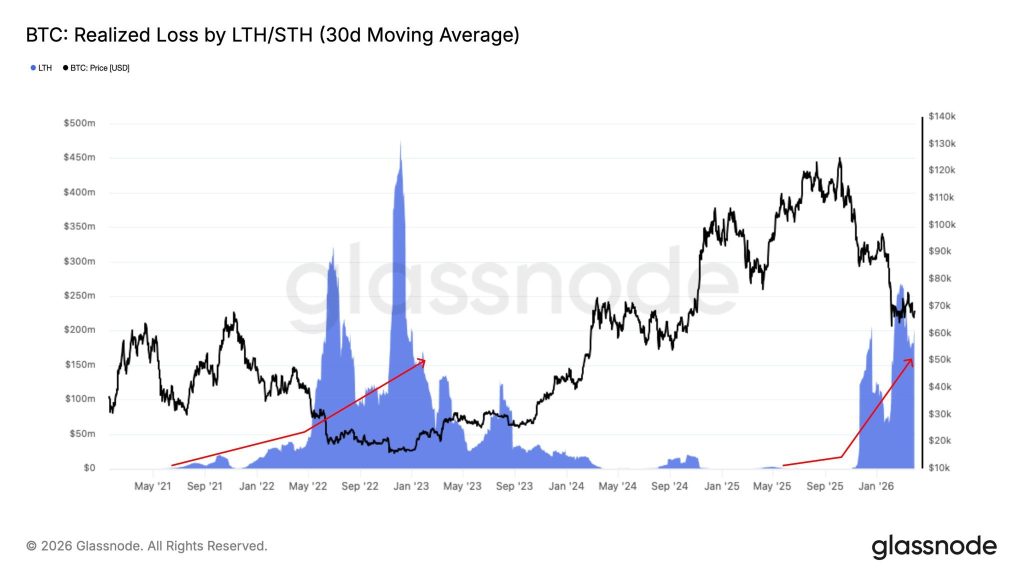
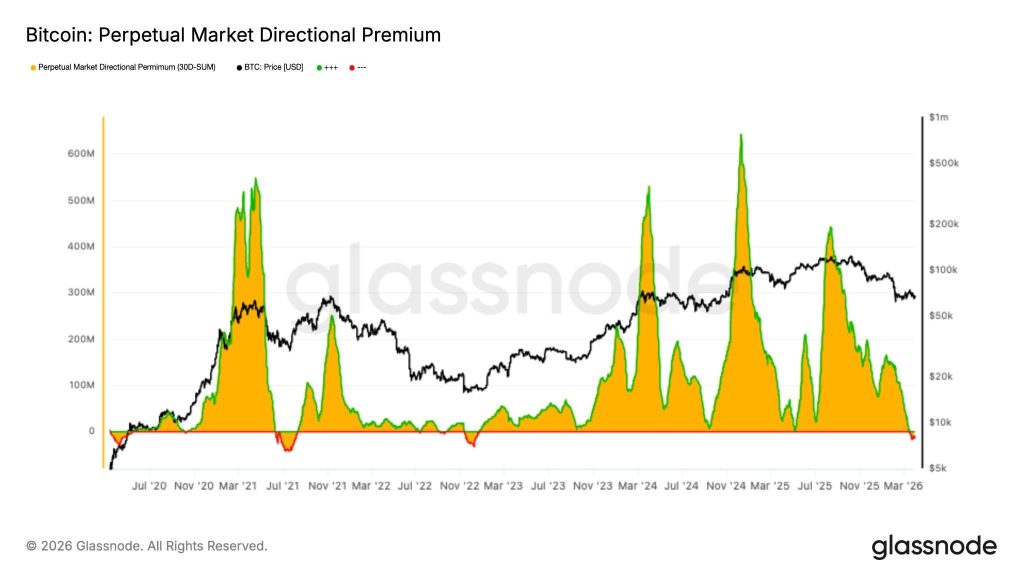
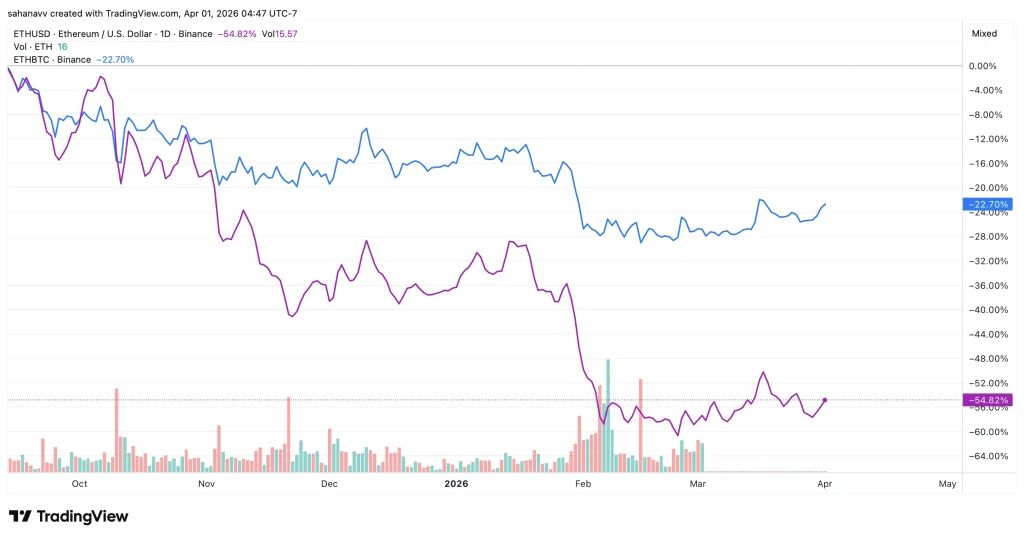
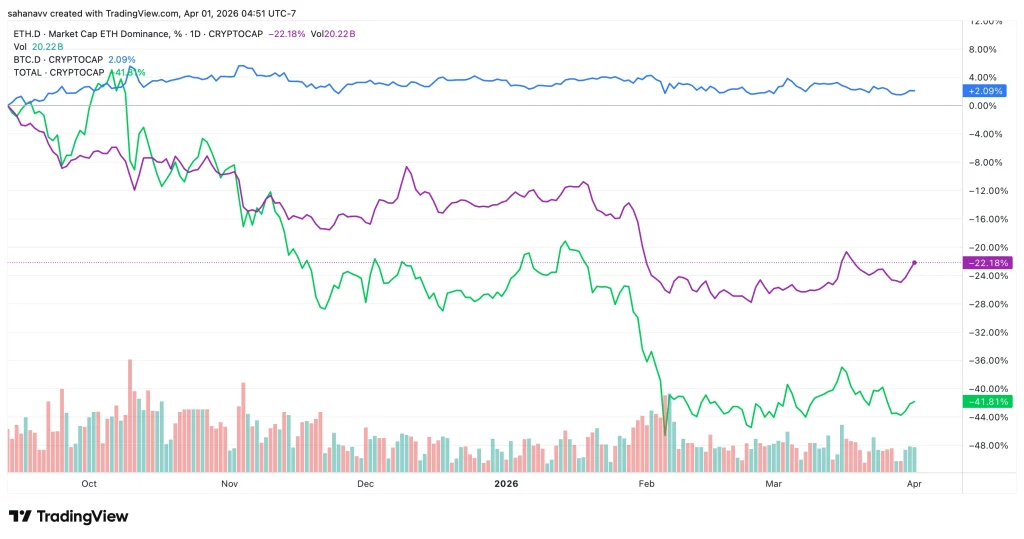


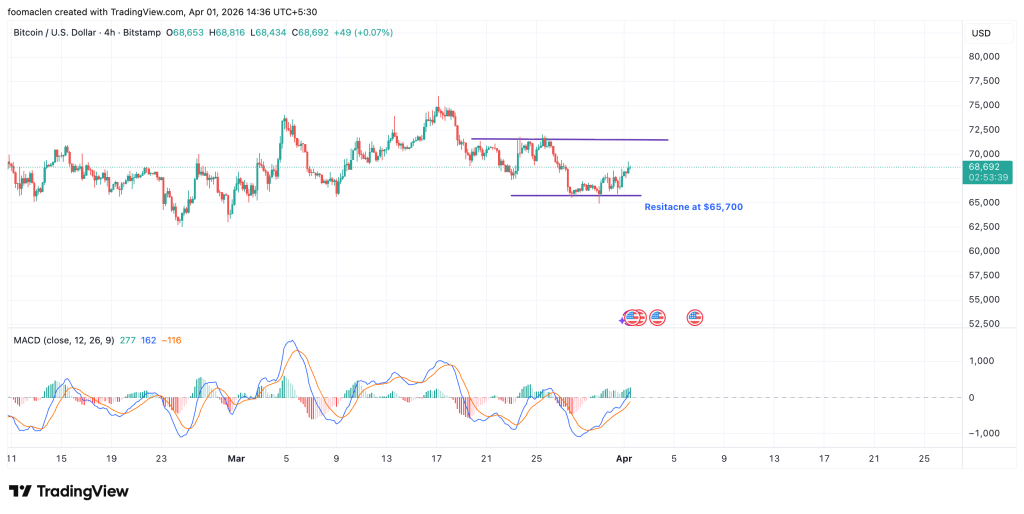
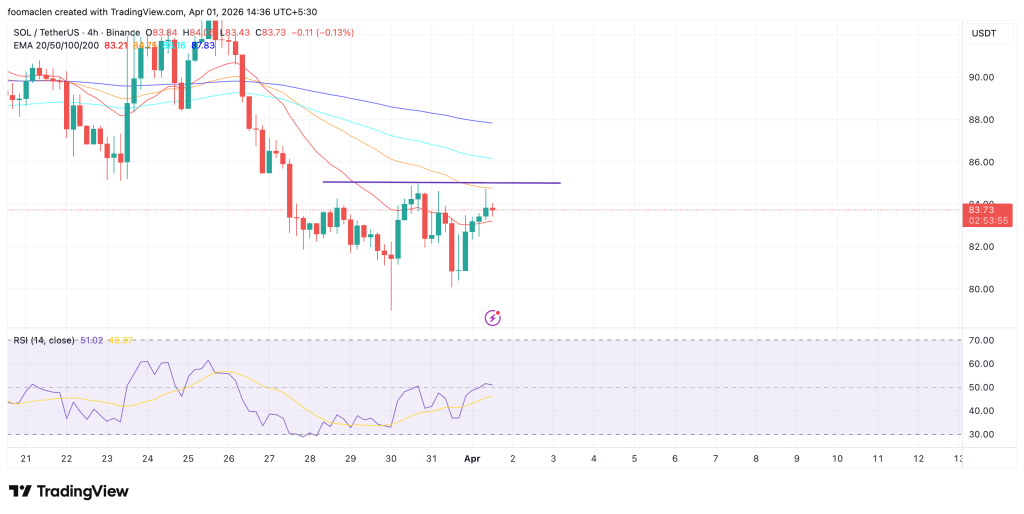
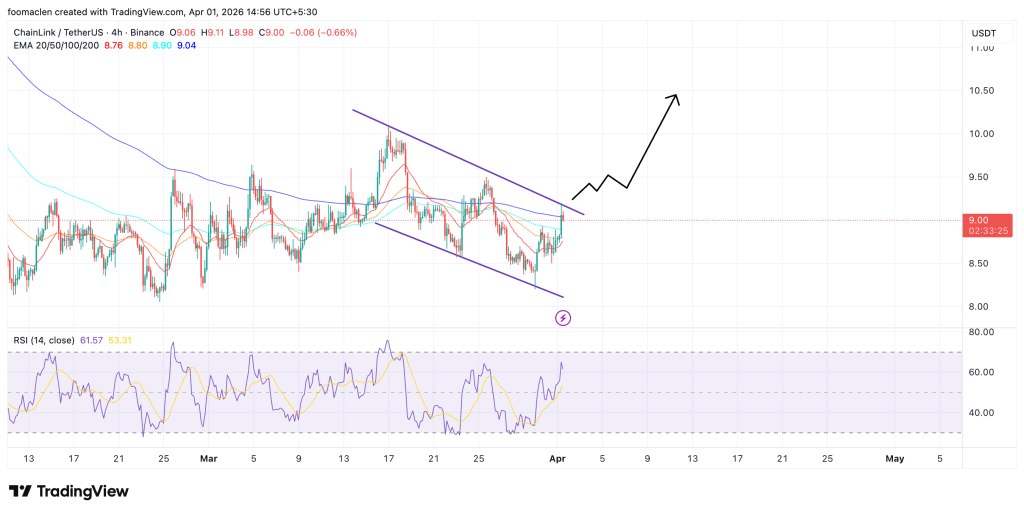
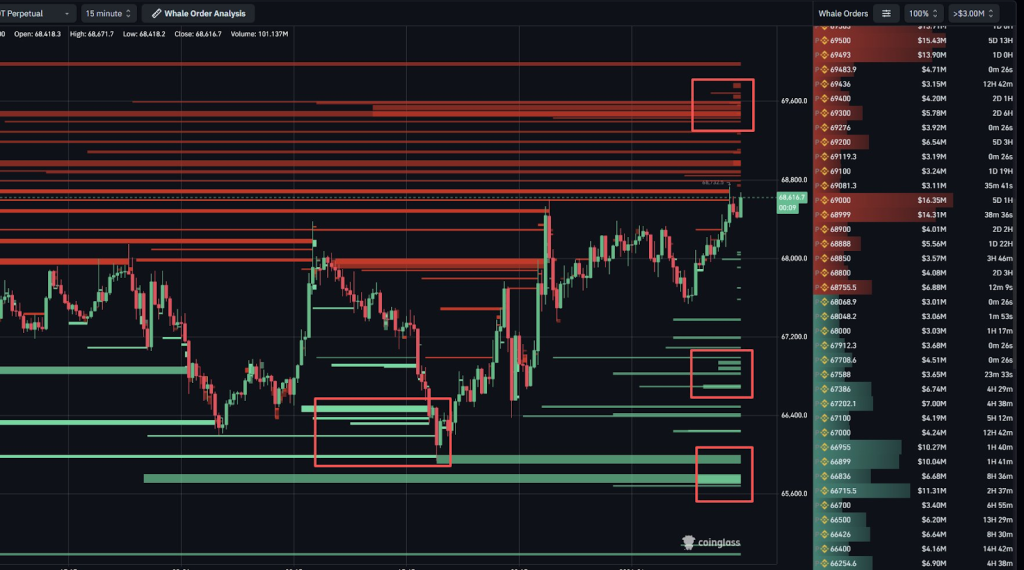
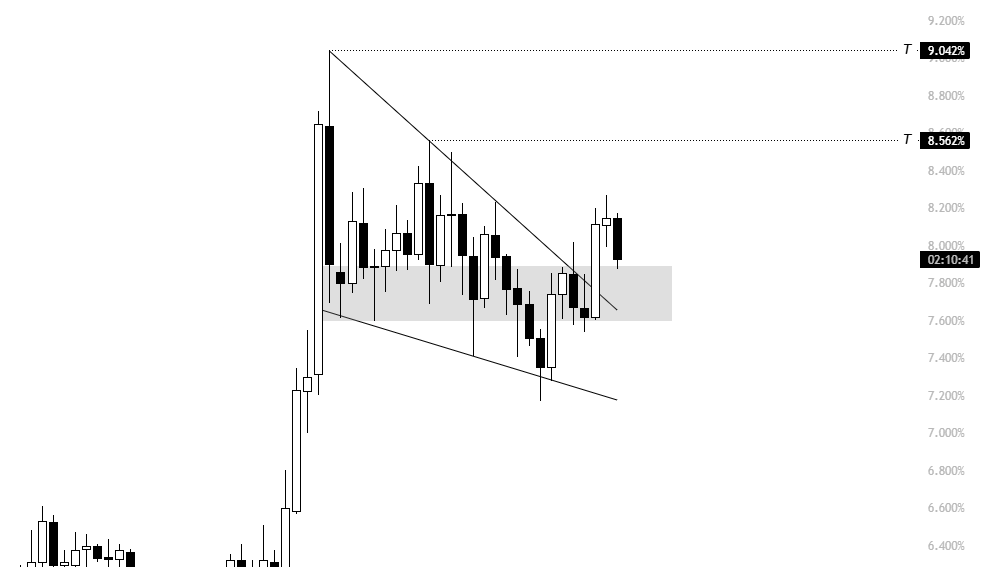
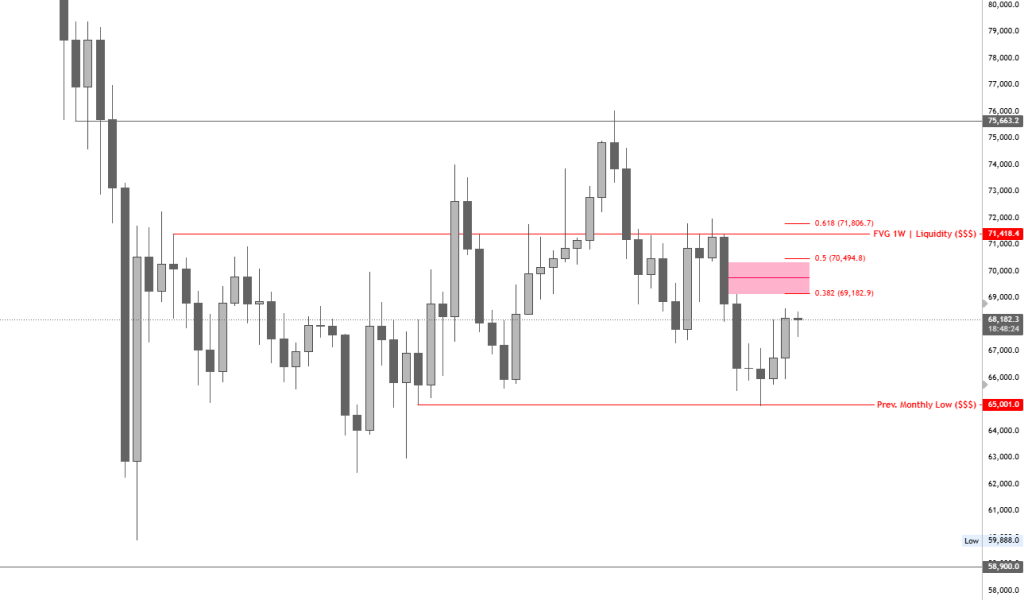


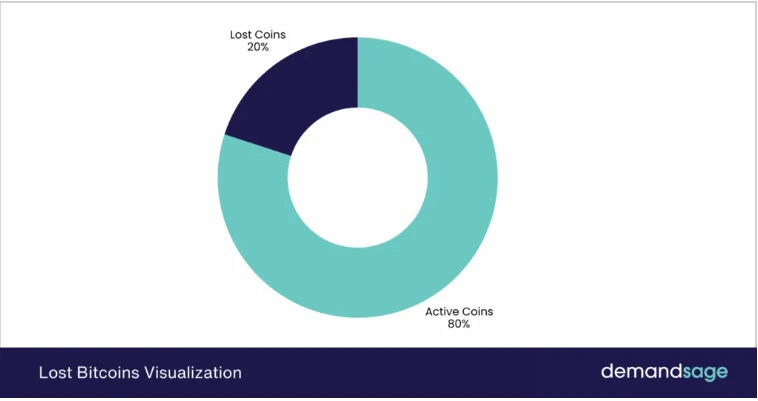


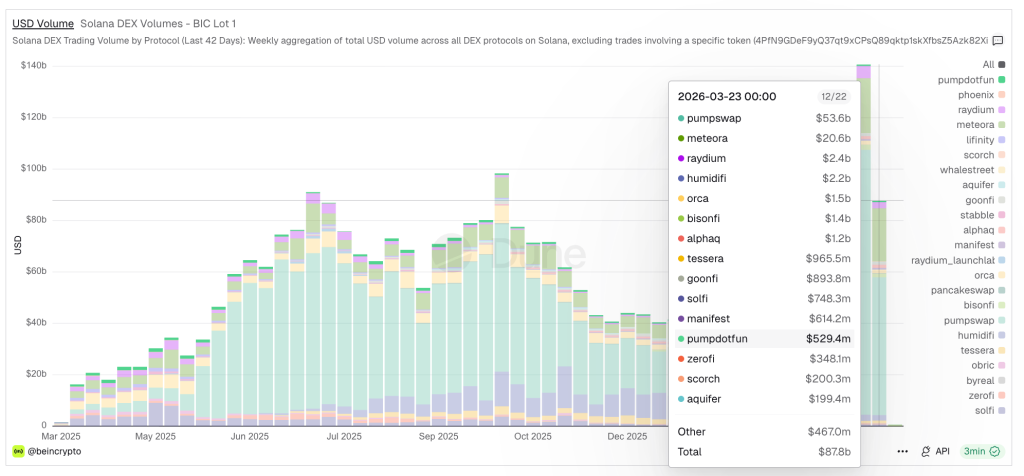
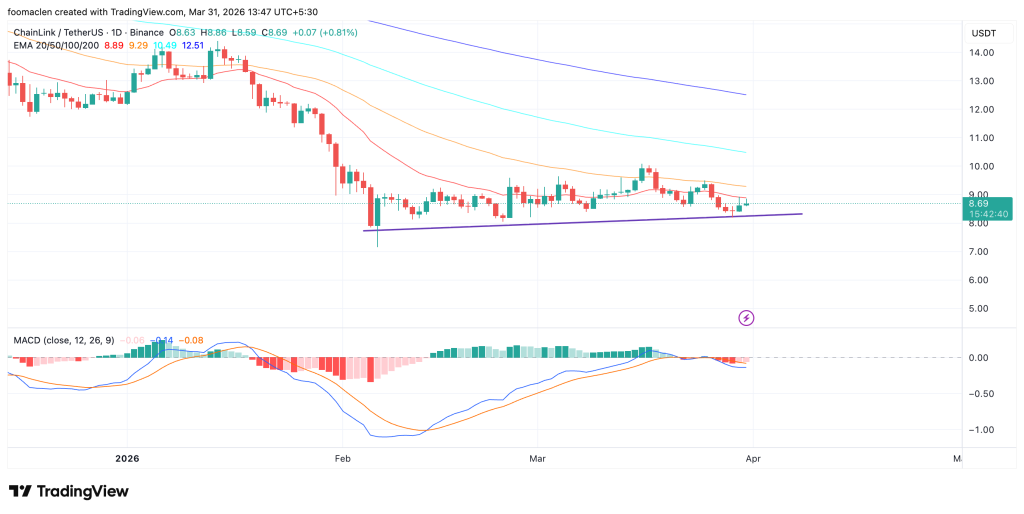
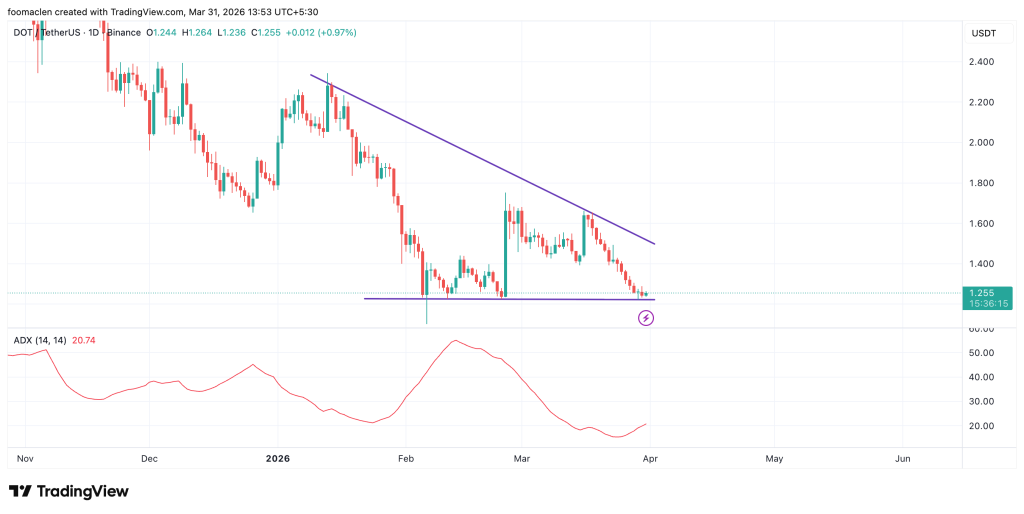
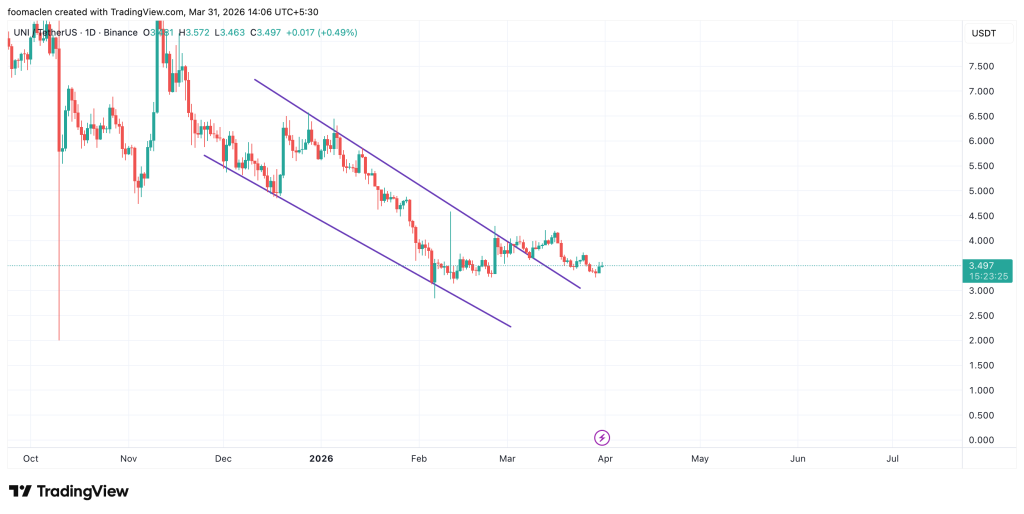
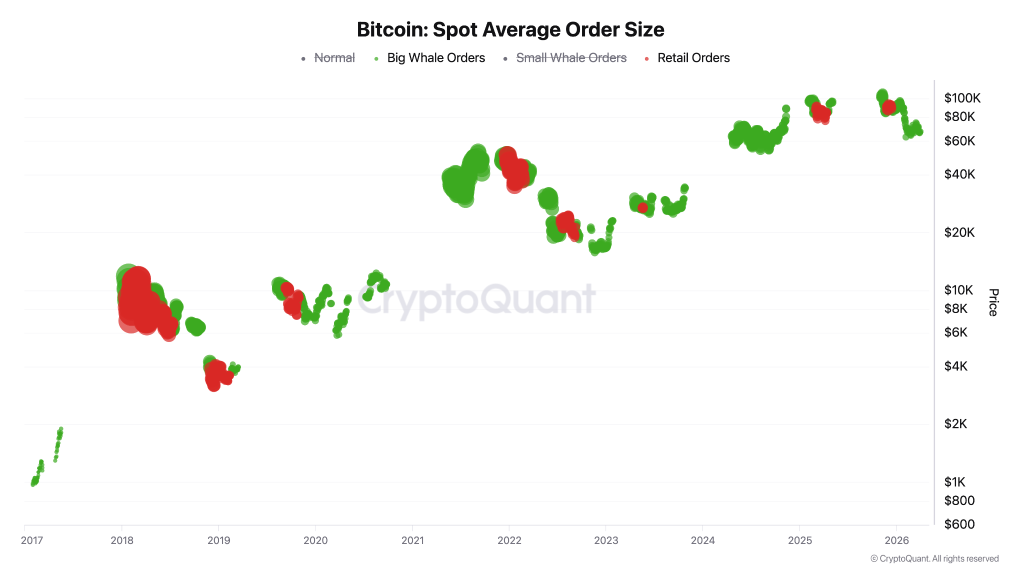
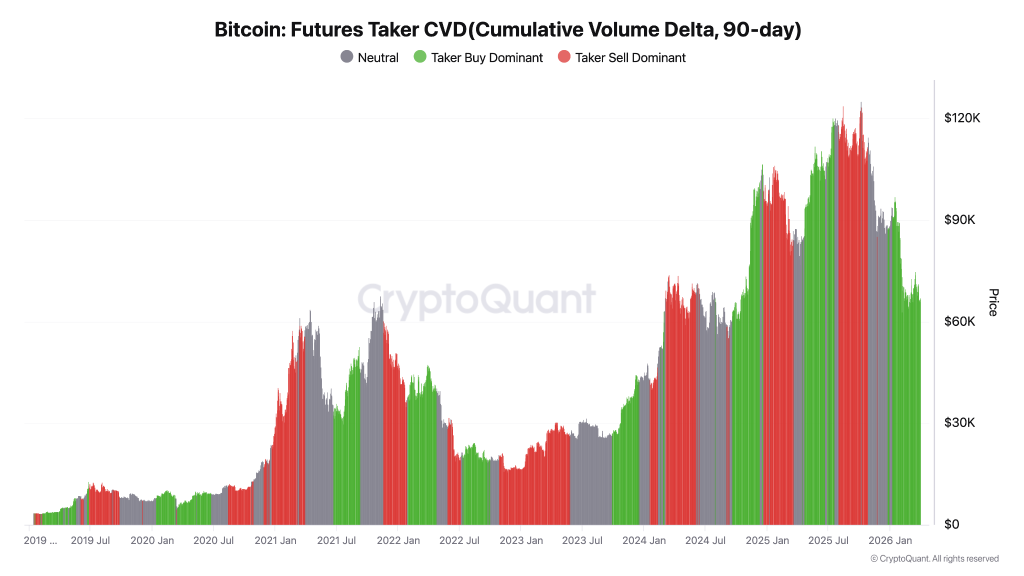
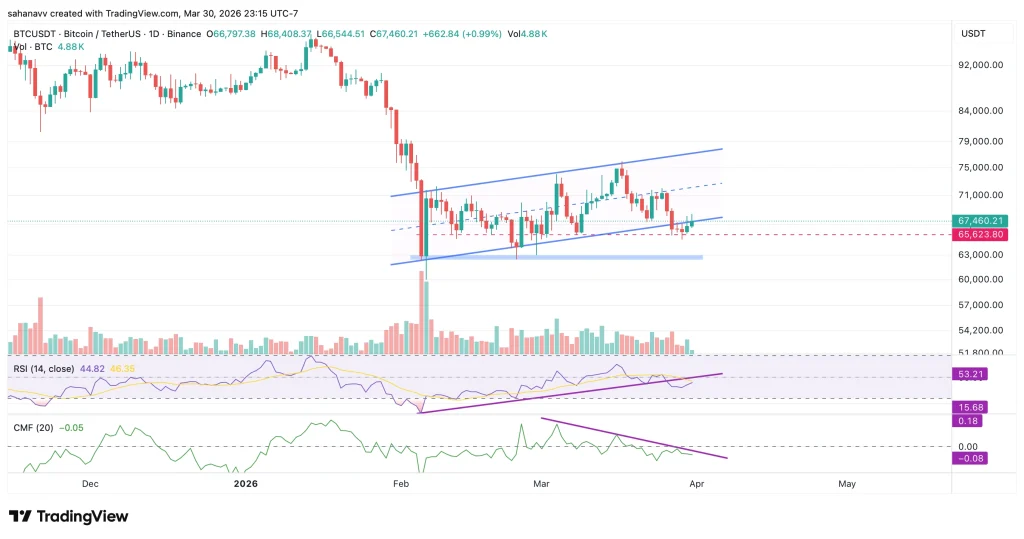


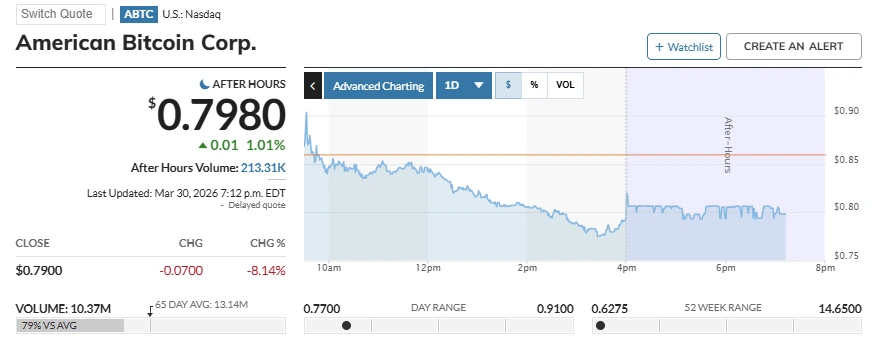
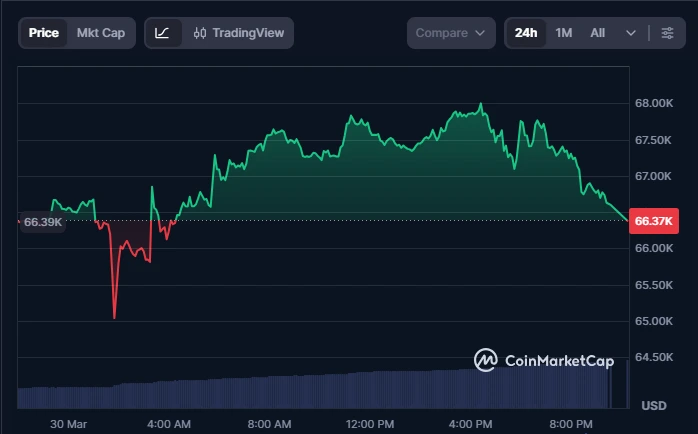

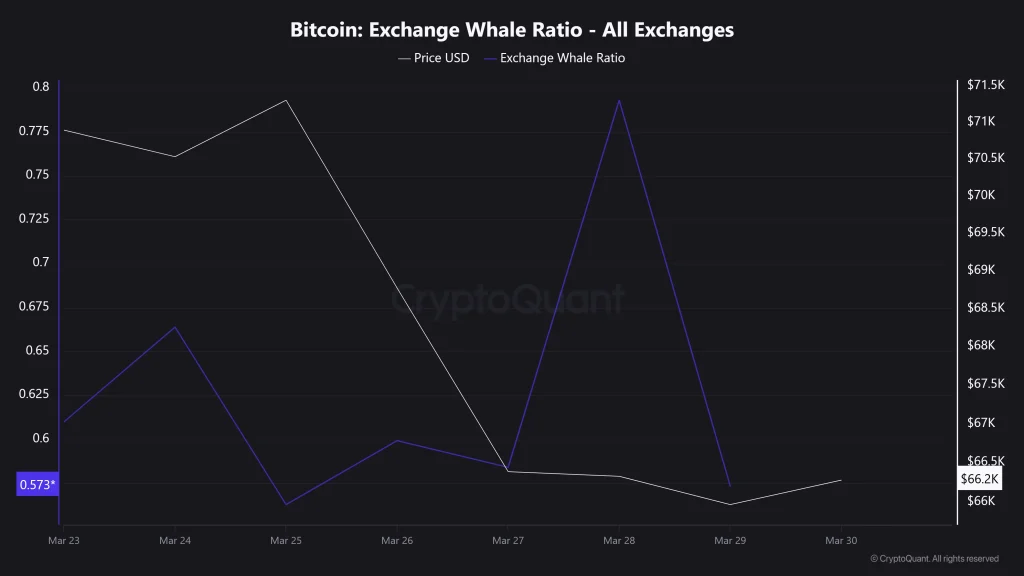


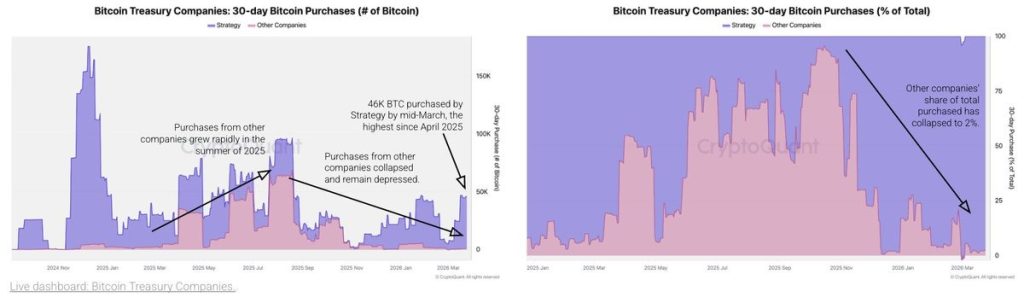
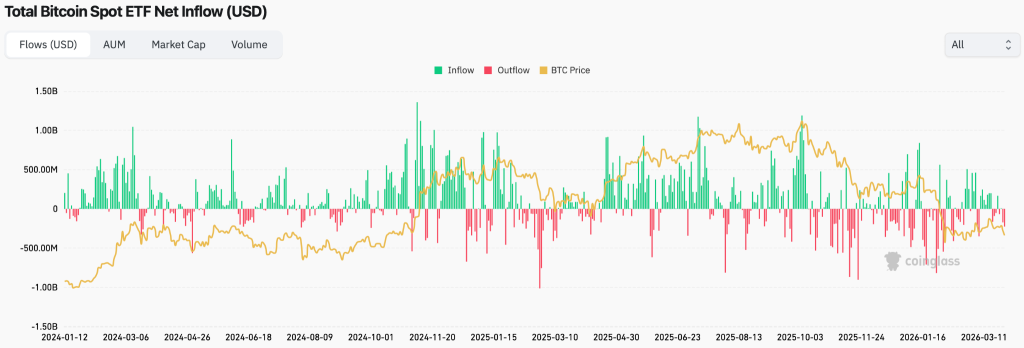

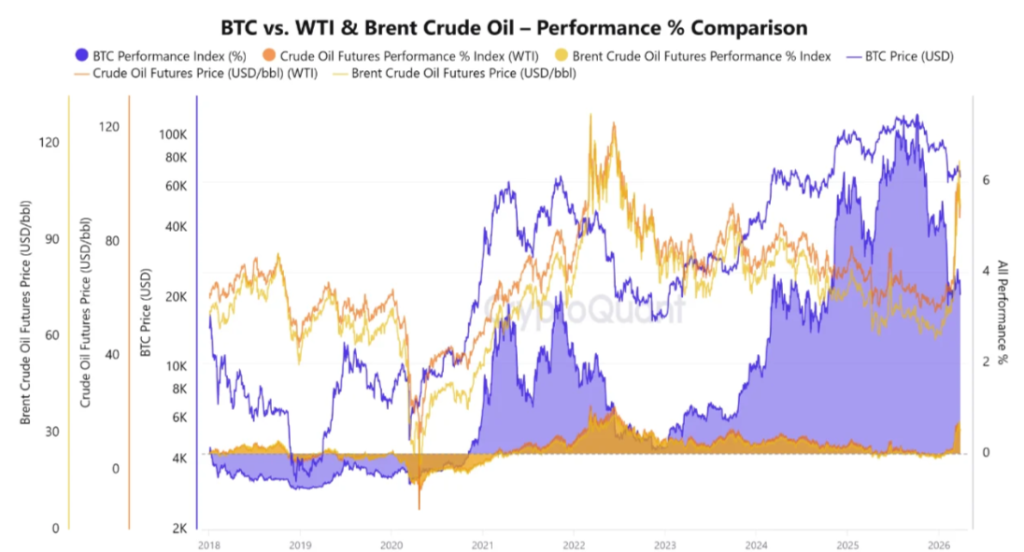
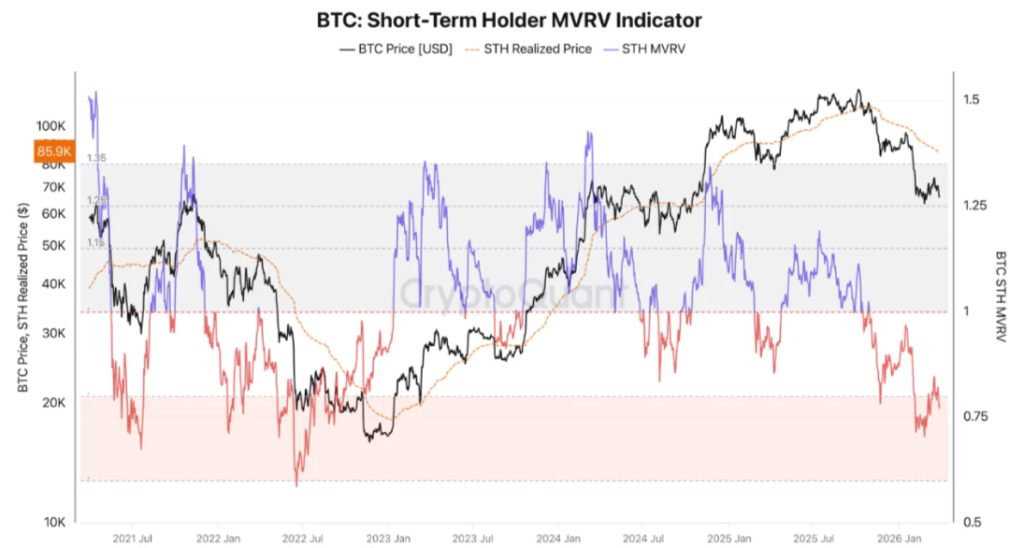
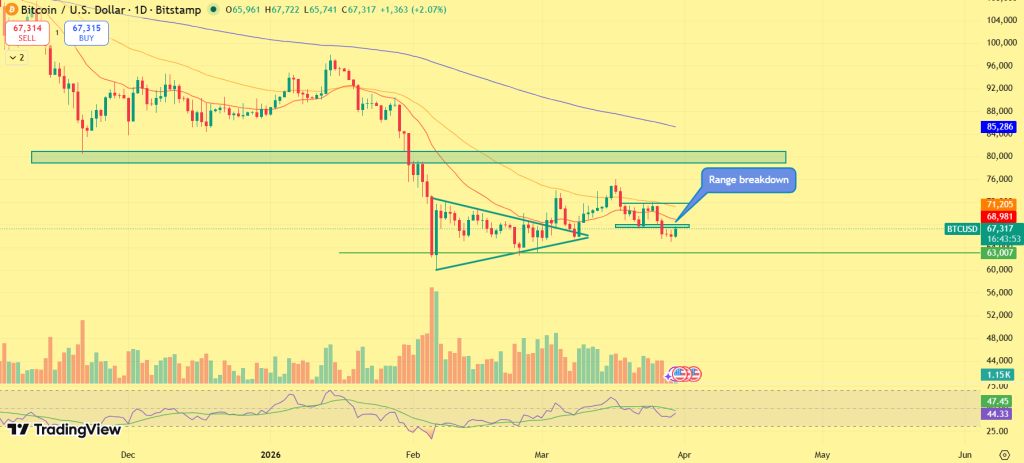


![Bitcoin Price Today [LIVE] Updates, Why is Crypto Going Up 16th March](https://image.coinpedia.org/wp-content/uploads/2026/03/16140330/Bitcoin-Price-Today-LIVE-Updates-Why-is-Crypto-Going-Up-16th-March-1024x536.webp)
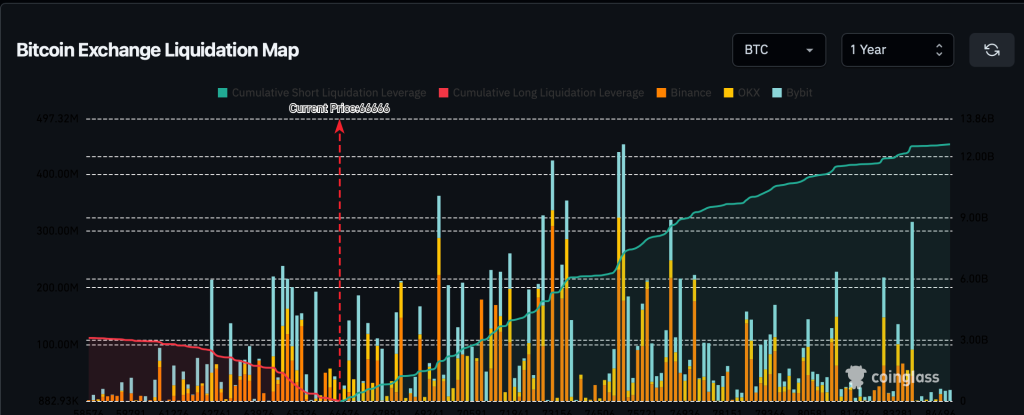
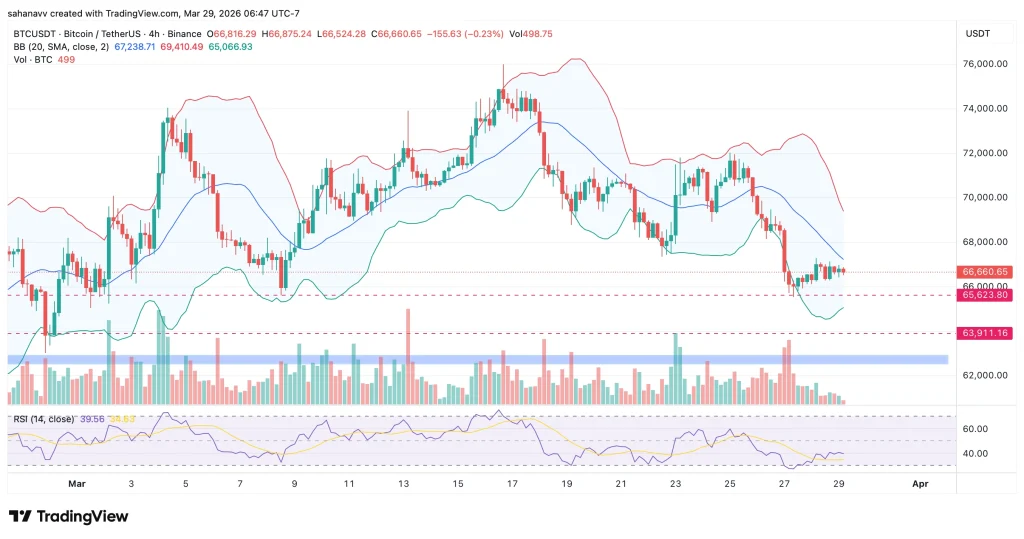


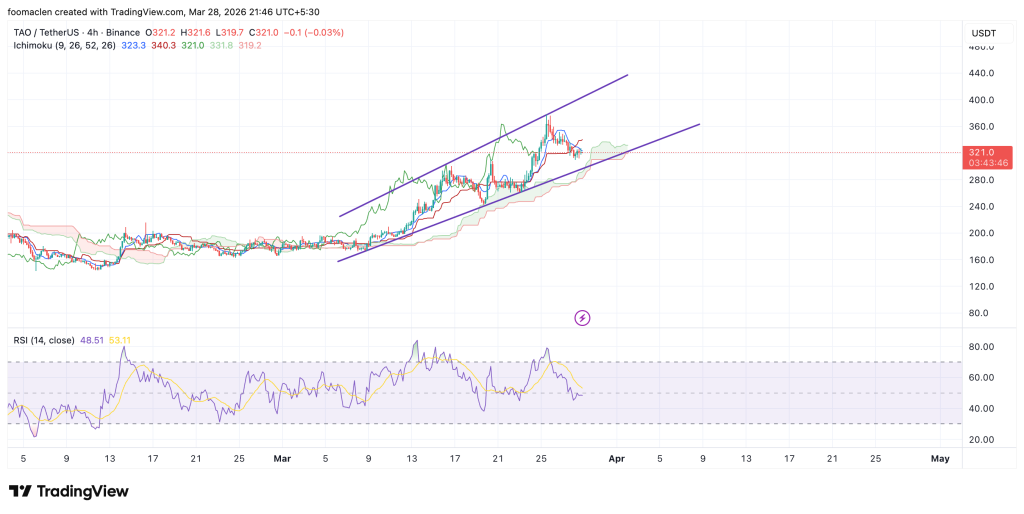
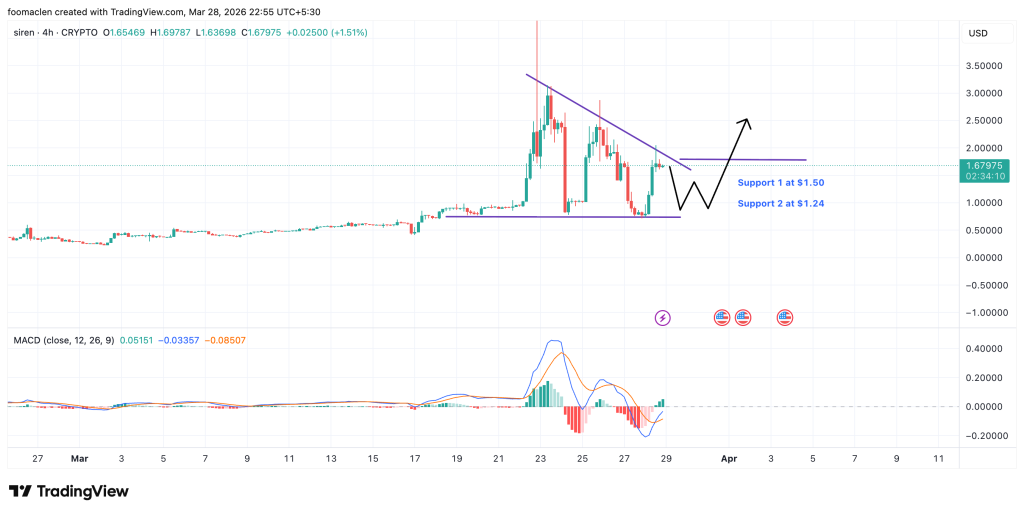
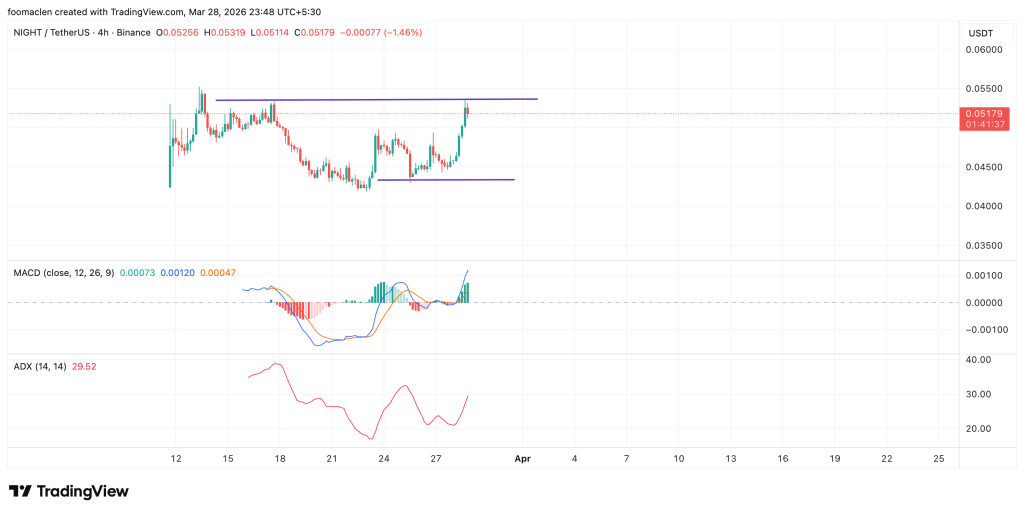
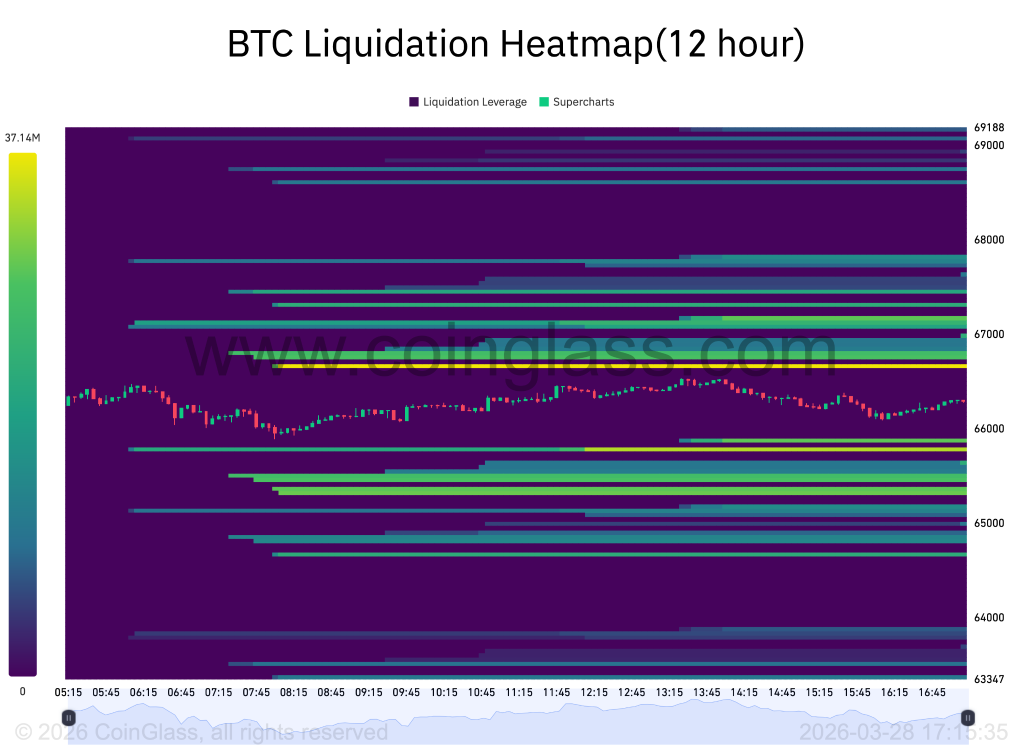
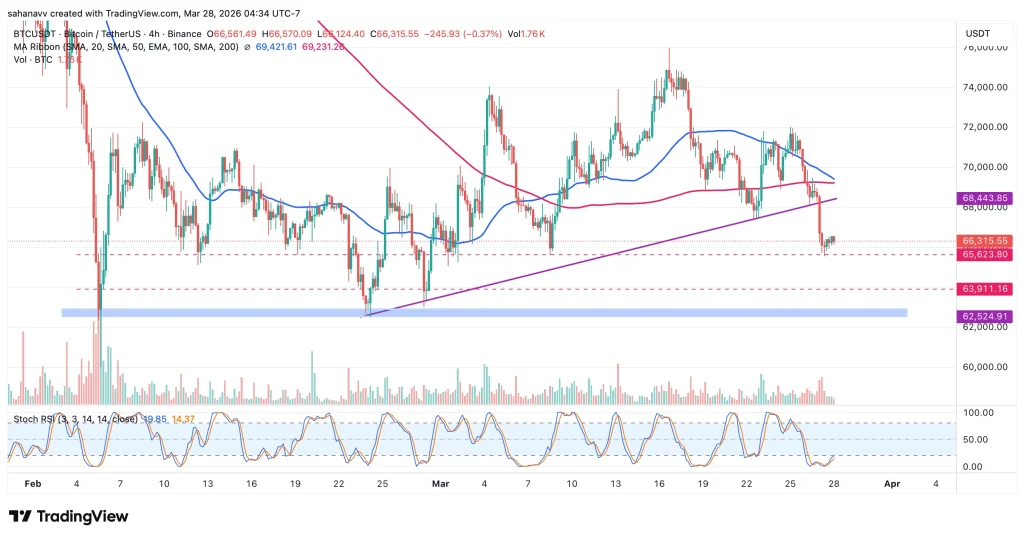
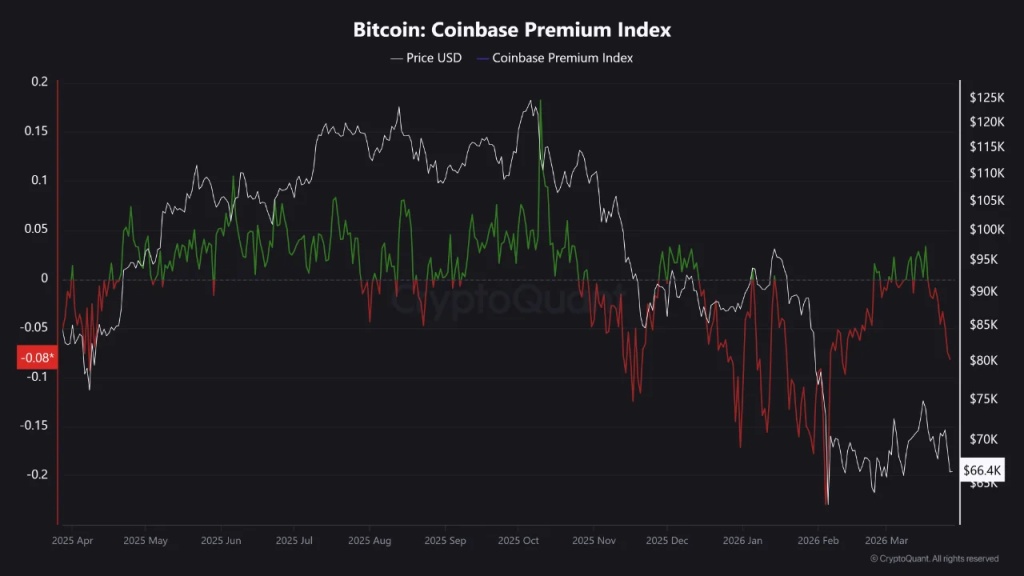
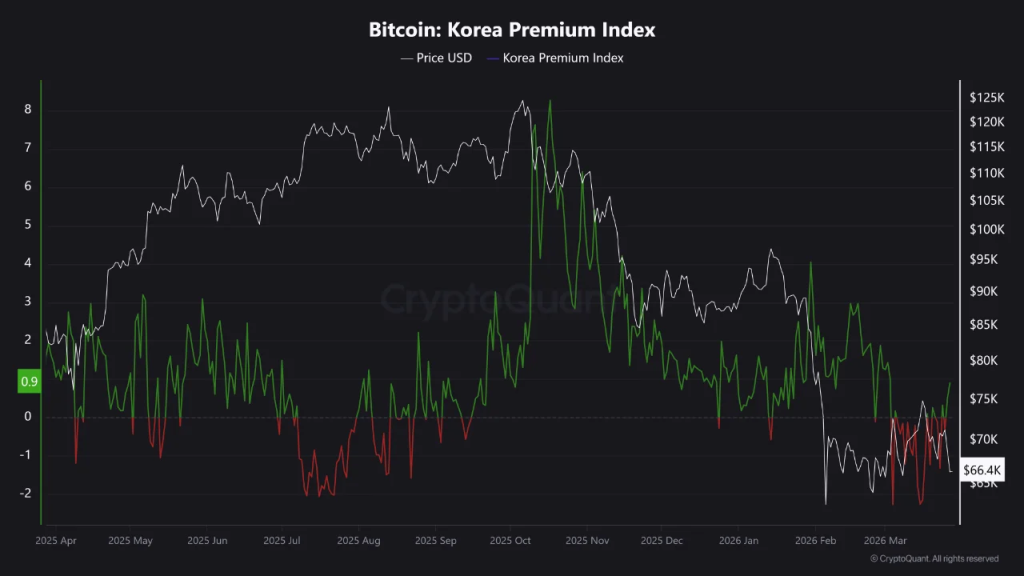
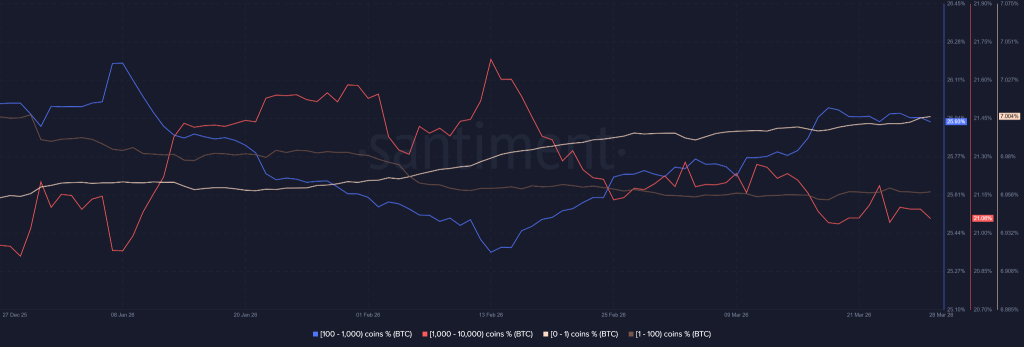
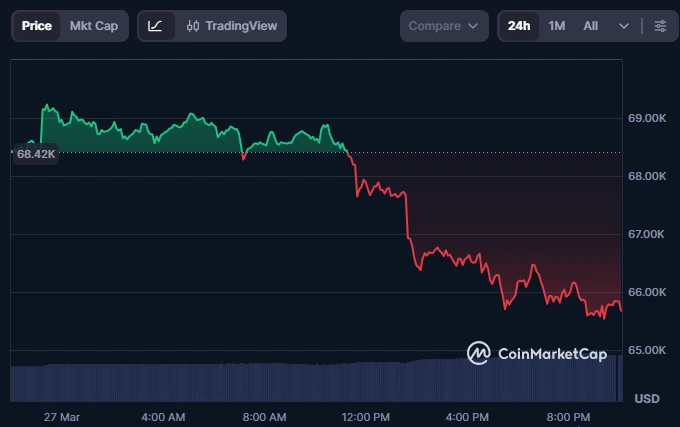
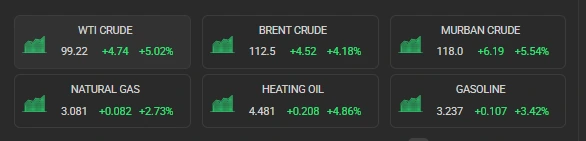
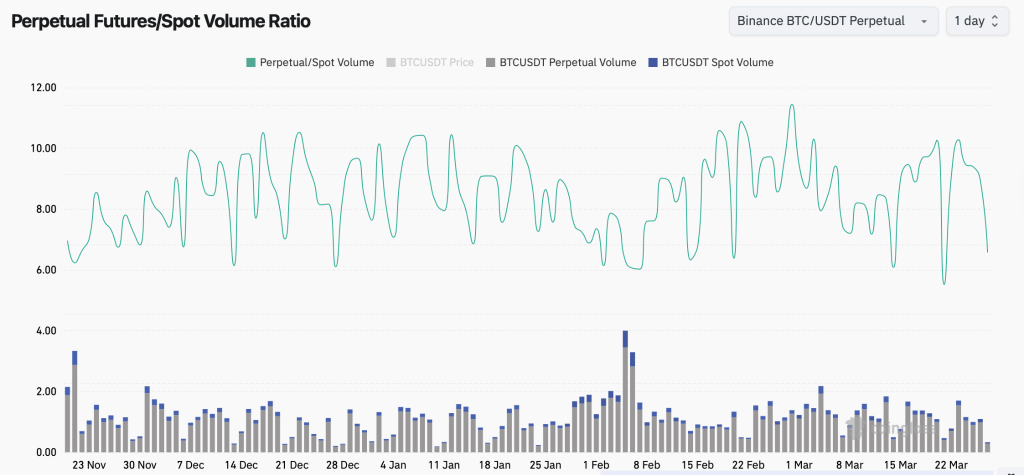
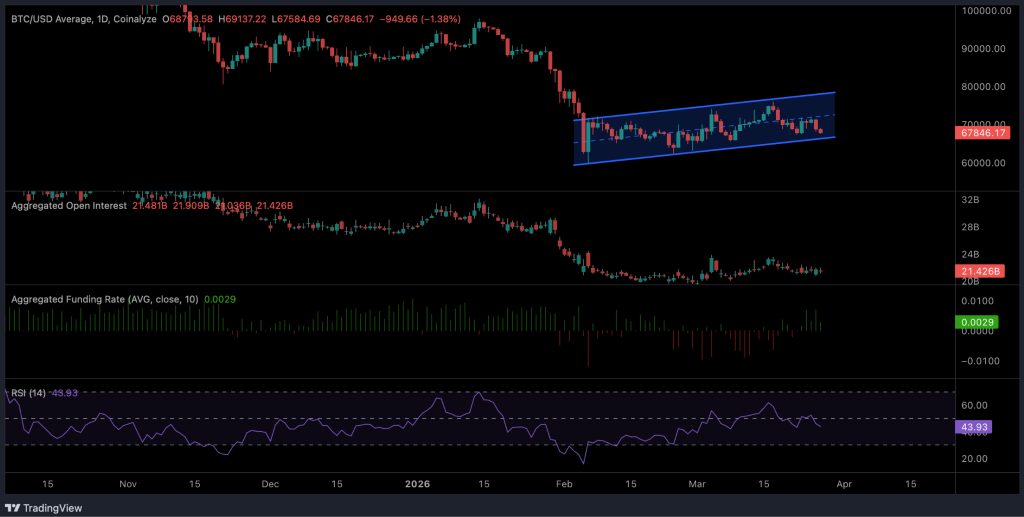

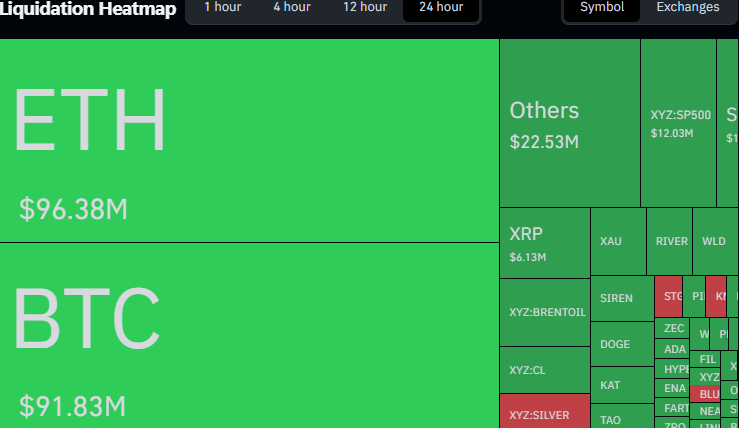
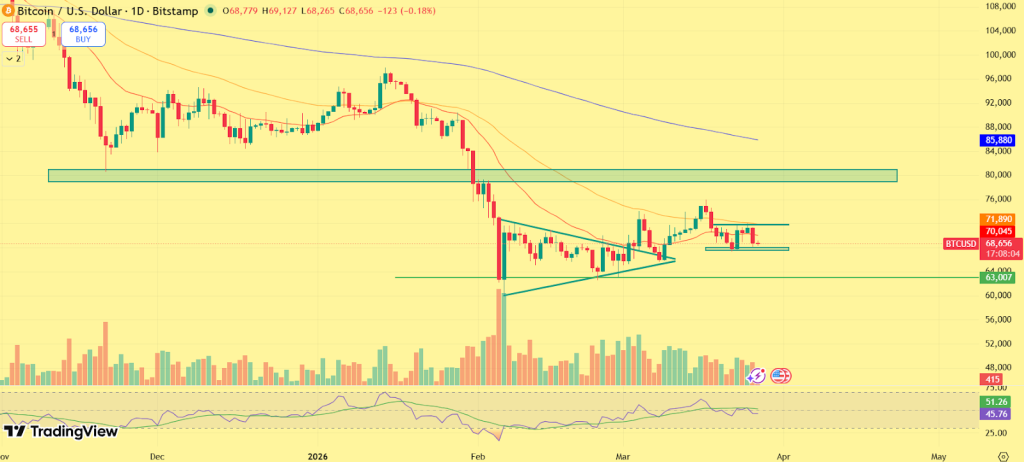
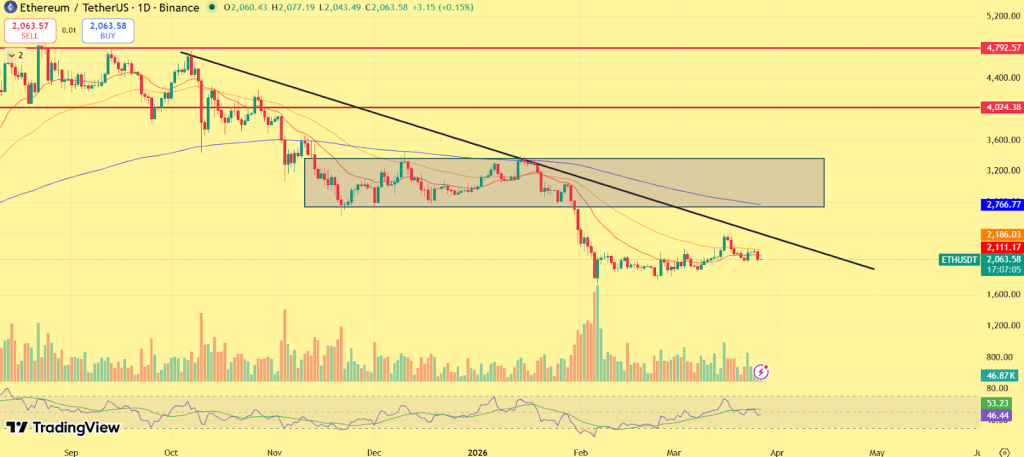
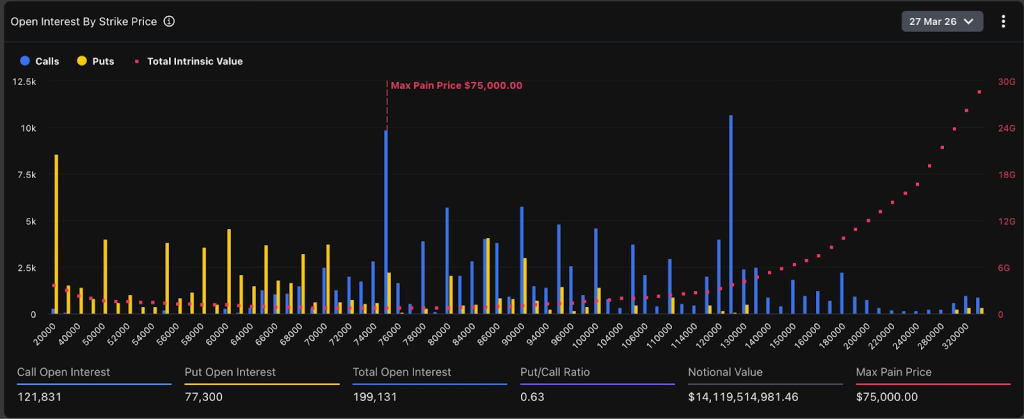
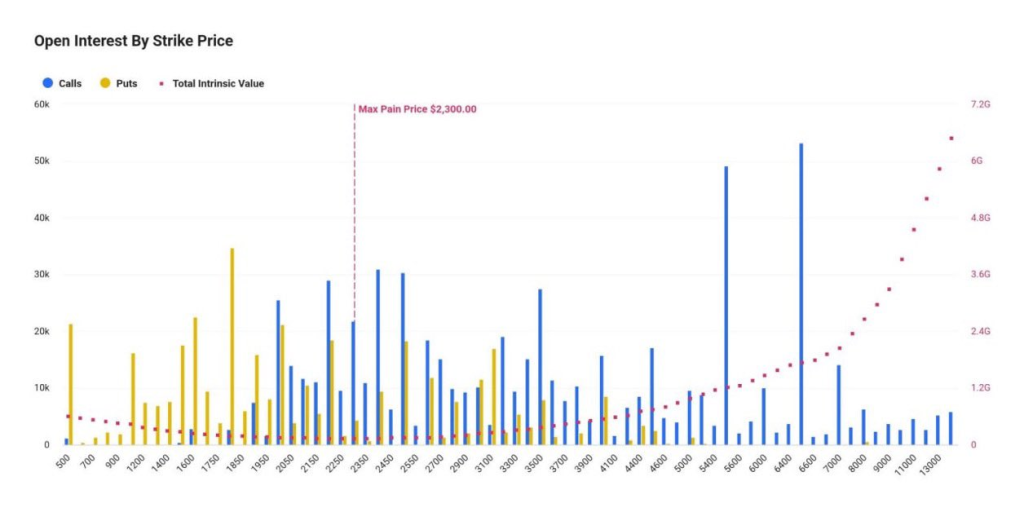
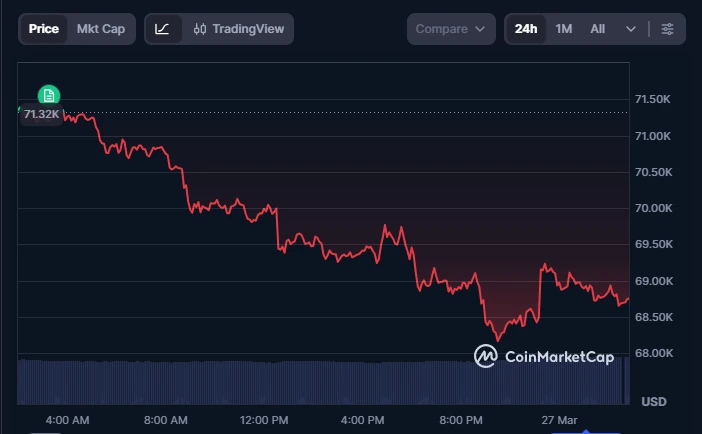
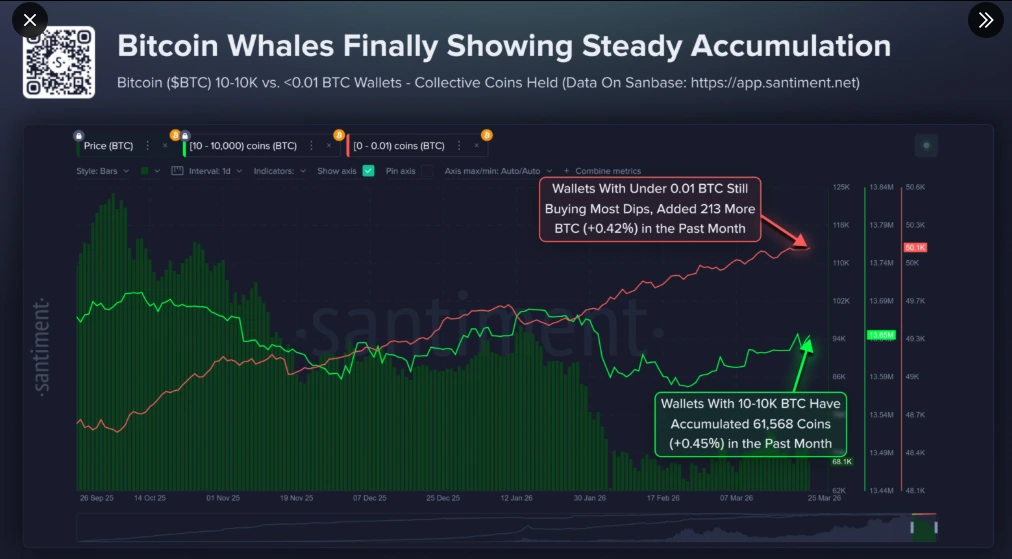
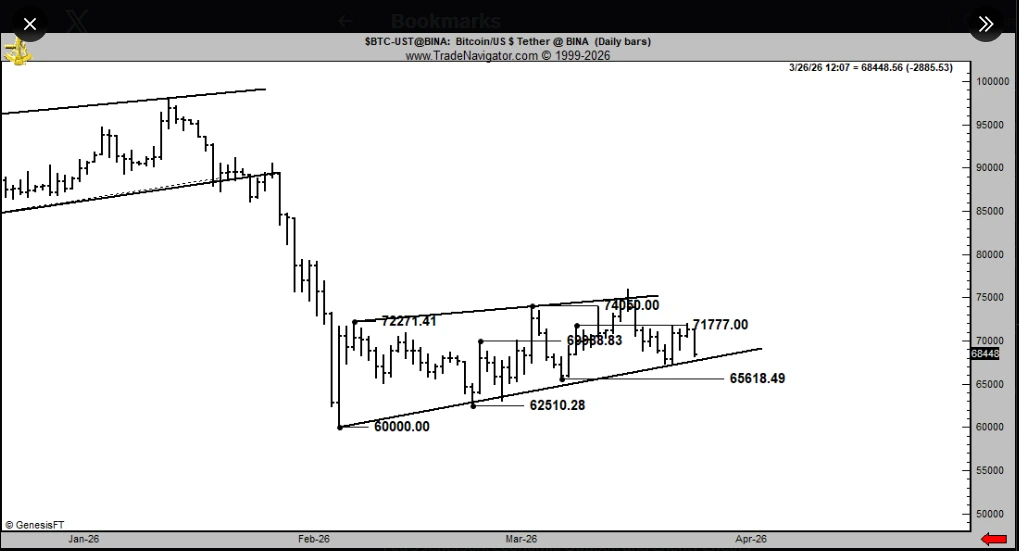
 (@coinbase)