Bitcoin price soared back above $71,000, but BTC options data shows pro traders are still extremely cautious about the sustainability of the rebound rally. Is the sell-off really over?
Crypto’s downturn is rippling through treasuries, ETFs and mining infrastructure, exposing how digital asset volatility reshapes balance sheets and operations.
As XRP searches for a price floor amid broader market weakness, some holders are shifting focus from short-term price moves to strategies designed to stay steady through volatility. #partnercontent
The South Korean exchange said an internal error during a promotional event led to brief price dislocations, stressing that no customer assets were lost.
Bitcoin and altcoins saw strong double-digit price rebounds after this week’s brutal sell-off, but do technical charts forecast a longer-term recovery, or is today’s rally just a dead cat bounce?
In a video interview, Samson Mow shares his views on Bitcoin's latest bloodbath, quantum fears and the catalysts that could drive Bitcoin’s next recovery.
Bitcoin is showing early signs of recovery after falling sharply in recent weeks. The world’s largest cryptocurrency bounced from around the $60,000 level and has moved modestly higher, giving investors some hope that the worst part of the recent correction may be ending. However, analysts say it is still too early to confirm that the market has fully stabilized.
At the time of writing, Bitcoin is up by more than 7% and is trading slightly below $70,000.
Recovery Seen, But Confirmation Still Needed
Bitcoin has already climbed more than 10% from its recent low, which is a positive signal for the market. Even so, experts explain that a stronger and more consistent upward move is needed before traders can confidently say that a new uptrend has started. Markets often show short-term rebounds during corrections, and sometimes prices can fall again before a true recovery begins.
Because of this, many traders are carefully watching how Bitcoin behaves over the next few weeks. If buying demand continues to grow and prices keep rising steadily, it could confirm that a meaningful bottom has been formed.
Possible February Rally in Focus
Bitcoin could see a stronger rally later in February once the correction phase ends. One important level being watched is around $94,000, which is considered a key resistance area based on previous price movements. A move toward that level would mean strong recovery momentum, although it may not happen immediately.
Downside Risk Still Exists
Despite the recent bounce, risks remain. If selling pressure returns, Bitcoin could still fall toward the $55,000–$56,000 range, which is seen as the next important support zone.
For now, the market remains mixed. Investors are waiting for clearer signs of sustained strength before making large moves, while long-term holders continue to focus on Bitcoin’s broader growth trend despite short-term volatility.
The recent pullback in the crypto market has pushed XRP into a period of volatility, but comments linked to Brad Garlinghouse, CEO of Ripple, are stirring fresh discussion among investors about whether the downturn could present a buying opportunity.
Market Fear Rises as XRP Metrics Turn Bearish
XRP has been moving in line with the broader crypto market decline, with several indicators showing weakening momentum. On-chain data indicates that XRP exchange reserves recently climbed to around 2.7 billion tokens, meaning that some investors are moving holdings onto exchanges — often interpreted as a signal that traders may be preparing to sell.
However, at the time of writing, XRP has gained more than 19% in the last 24 hours. Analysts warn that short-term rebounds could also turn into “bull traps,” where prices briefly rise before continuing lower, making timing the market difficult.
Investors Urged to Wait for Confirmation
Several experts have advised investors to avoid rushing into dip-buying strategies. Historically, sharp corrections can continue longer than expected, and analysts say confirmation of a sustained uptrend is often safer than trying to catch a “falling knife.”
This approach shows the broader uncertainty in the crypto market, where sentiment indicators have recently slipped into extreme fear territory.
Garlinghouse Quote Interpreted as Subtle Signal
Amid the downturn, Garlinghouse shared the well-known Warren Buffett quote: “Be fearful when others are greedy and greedy when others are fearful.”
My favorite Warren Buffet quote:
"Be fearful when others are greedy, and greedy when others are fearful!"
While the Ripple CEO did not directly comment on XRP’s price, many traders interpreted the post as a possible signal encouraging long-term confidence during the market’s fear phase. Social media reactions from XRP supporters quickly framed the message as a reminder that major opportunities often appear during market stress.
Long-Term Fundamentals Still in Focus
Despite short-term bearish signals, XRP supporters continue pointing to Ripple’s ongoing institutional partnerships, payment-network expansion, and new use cases on the XRP Ledger as long-term drivers that could support the asset once broader market sentiment improves.
For now, analysts say the coming months could determine whether the market stabilizes into a consolidation phase or experiences additional downside.
The LINK price is trading near $8.60, under pressure despite a fresh catalyst from the Chainlink Reserve, which added over 125,000 LINK in a single update. While broader crypto markets weaken, on-chain accumulation and ETF flows suggest a widening disconnect between price action and underlying demand.
The Chainlink Reserve continues to expand its footprint as a long-term sustainability mechanism for the network. According to official data, the reserve has accumulated 125,454.48 LINK, bringing total holdings to approximately 1.9 million LINK. This reserve is funded through a combination of off-chain enterprise revenue and on-chain service usage, reinforcing its role as infrastructure rather than a market-facing liquidity tool.
RESERVE UPDATE
Today, the Chainlink Reserve has accumulated 125,454.48 LINK.
Meanwhile, this steady accumulation occurs independently of short-term LINK price USD fluctuations. That separation is notable. Historically, reserves of this nature tend to grow during periods of suppressed market confidence, when usage-driven revenues quietly outpace speculative demand.
At the same time, the reserve’s design reduces reliance on inflationary incentives, aligning with Chainlink’s broader goal of long-term network sustainability rather than cyclical price appreciation.
ETF Inflows Contrast Broader Crypto Outflows
From a flows perspective, Chainlink stands out. While Bitcoin and Ethereum ETFs have experienced consistent outflows during recent market stress, LINK ETF products have yet to record a single day of net outflows. Data shows cumulative inflows of $78.63 million, representing roughly 1.11% of LINK’s market capitalization.
Notably, institutional vehicles such as Grayscale and Bitwise have maintained their exposure even as volatility increased. That persistence suggests portfolio-level conviction rather than momentum-driven positioning. Still, ETF stability alone has not insulated the LINK price chart from downside pressure.
Whale Distribution Adds Near-Term Pressure
That said, on-chain supply distribution reveals a more complex picture. Addresses holding between 1 million and 10 million LINK have been net sellers over the past 48 hours. This cohort historically acts as a liquidity driver during periods of market stress, and their activity aligns with recent downside moves.
Conversely, wallets holding 100,000 to 1 million LINK continue to accumulate. This divergence suggests a transfer of supply from larger entities to mid-sized holders rather than broad capitulation. Still, until selling from the upper bracket cools, downward pressure on LINK crypto markets may persist.
Technical Zones and Risk Framing
From a technical perspective, analysts continue to closely monitor lower channel supports. If demand weakens further, $5 appears as a historically relevant zone where price compression previously stabilized. A deeper downside scenario places attention on the $1.20 region, which aligns with long-term cycle extremes rather than base expectations.
Still, the LINK price analysis suggests that these levels on chart function more as stress-test markers than forecasts. With the LINK price already down materially from cycle highs, further declines would likely require sustained macro deterioration and continued whale distribution.
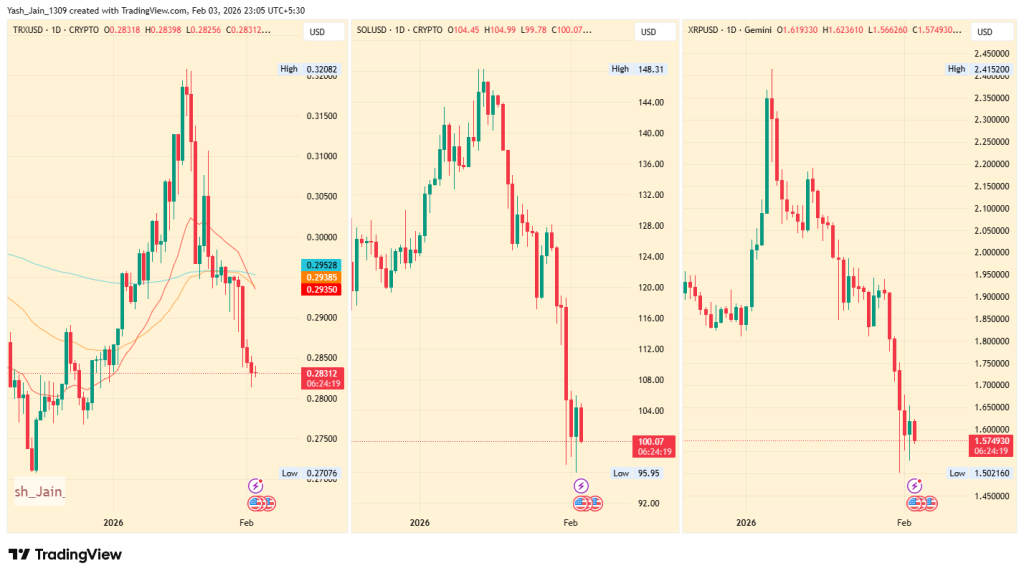
Solana price has rebounded from key support, but weak volume and heavy resistance overhead raise the risk that the current rally is only a temporary dead cat bounce.
Ethereum price continued its strong downward trend this week, reaching its lowest level since May last year. Ethereum (ETH) token dropped to a low of $1,768, down by 60% from its all-time high. This retreat coincided with the broader crypto…
XRP price remains vulnerable to further downside as unresolved single-print imbalances continue to exert technical pressure toward the $0.50 support zone.
Remittix gains attention with live utility and 300% bonus, attracting selective investors amid market turbulence. This week in Crypto has been characterized by heavy selling on centralized exchanges as Bitcoin dropped to new lows in 2026 following the violation of…
Remittix 300% bonus sparks buzz on X, Telegram, and Discord, highlighting real product utility over hype. This week, crypto users on X, Telegram, and Discord are talking about one thing: the Remittix 300% bonus. While the market as a whole…
Ripple (XRP) delivered one of the market’s top rallies in 2021, peaking at $1.96. However, as the market matures, analysts note that replicating big gains has become difficult for large-cap tokens. This shift has investors searching for the best crypto to invest in 2026. One DeFi crypto now drawing significant attention is Mutuum Finance (MUTM), a low-priced token at $0.04 in presale. MUTM is gaining traction for its decentralized lending and borrowing model and rapidly advancing presale adoption. Analysts believe MUTM has the potential to outperform even XRP’s 2021 run in the next market rally. This makes it the best crypto to invest in for early adopters.
Ripple (XRP) Holds Key Support During Market Reset
Ripple (XRP) is priced at $1.521, down roughly 56% from its 2025 high. This decline has occurred alongside continued ecosystem progress, including Ripple Labs securing an EU-wide electronic money license, which supports longer-term integration with financial institutions across Europe. For now, price action suggests a stabilization phase as the market digests recent volatility, with XRP behaving more as a mature, infrastructure-focused asset than a high-growth play. Investors are now keeping an eye on newer tokens that are still early in their development cycles, among them MUTM.
Ripple (XRP) 2021 Rally: A Benchmark for Future Gains
In 2021, Ripple (XRP) delivered one of the market’s standout performances, rising from around $0.21 at the start of the year to a cycle high of $1.96, representing roughly a 900% gain over the course of the year. This surge was driven by renewed investor interest, network developments, and broader crypto market momentum. Analysts suggest that Mutuum Finance (MUTM) has the potential to replicate or even surpass similar percentage gains in the next cycle. These market strategists point to MUTM’s strong value drivers, such as its dual lending model, staking dividends, and attractive lending APYs, and rapidly progressing presale. This further positions MUTM as the best crypto to invest in for strategic market entrants.
MUTM Presale: Early Investors Gain the Edge
Mutuum Finance’s MUTM token is currently at $0.04 in Phase 7 of its presale, and is set to increase to $0.045 in Phase 8. Early participants are positioned to benefit the most from this price progression. Take the example of an investor putting $2,500 into the presale today. They will acquire 62,500 MUTM tokens. When Phase 8 begins, these tokens will be worth nearly $3,000, delivering a profit of $500 even before the presale concludes. By the time of listing at $0.06, the same holding will be valued at $3,750, representing a gain of $1,250 prior to any public market activity. This demonstrates why early entry into the MUTM presale can yield substantial returns for investors.
Passive Income Through Token Buybacks
Mutuum Finance incentivizes loyalty through its buyback and redistribution mechanism, which channels a portion of protocol revenue to purchase MUTM tokens and distribute them to mtToken stakers. For example, if the protocol generates $9 million in quarterly revenue and allocates 15% of it, or $1.35 million, for buybacks, this amount would be used to purchase MUTM tokens on the open market and return them to active stakers. An investor with a stake representing 0.5% of all staked mtTokens would receive approximately $6,750 worth of additional MUTM as passive income, on top of any interest accrued from lending pools. This provides a dual benefit of ongoing yield and rewards for long-term participation.
The MUTM Stablecoin
In the future, Mutuum Finance plans to introduce its own overcollateralized stablecoin, designed to let users unlock liquidity without giving up yield on their assets. Mutuum Finance’s native stablecoin allows users to borrow liquidity while their collateral continues to yield interest in lending pools. Collateral is required, e.g 150% of the borrowed amount to maintain system safety. For instance, an investor holding $30,000 in ETH could deposit the full amount as collateral to mint $18,000 in MUTM stablecoin. The ETH continues to accrue interest in Mutuum Finance’s lending pools, e.g 7–10% APY, where part of the yield generated can be used to repay the stablecoin loan.
Community Engagement Drives Adoption
Mutuum Finance has also focused on creating a strong and active community. The project recently launched a $100,000 giveaway, awarding $10,000 in MUTM tokens to ten lucky participants. Daily incentives, such as a $500 MUTM reward for the largest buyer of the day, encourage continuous engagement, while the recognition of the top 50 MUTM holders on a leaderboard fosters friendly competition among the community. These initiatives cultivate a loyal and active user base, driving adoption of the platform and positioning MUTM as one of the most promising new DeFi crypto projects entering 2026.
Forget XRP’s old rally. Mutuum Finance (MUTM) could easily be the best crypto to invest in for 2026. Priced at $0.04, this DeFi crypto offers a real lending platform and has raised over $20M, positioning it for huge gains. Join the presale today, while MUTM is still undervalued.
For more information about Mutuum Finance (MUTM) visit the links below:
Ethereum slipped below the $2,000 mark for the first time since May 2025 as intense selling pressure swept through the crypto market. Bitcoin’s drop to $60,000 added to the downside momentum, dragging ETH lower until buyers stepped in around $1,753, a level that helped stall the decline and spark a rebound.
The recovery lifted the ETH price back above $1,975, suggesting the move lower was largely technically driven rather than event-led. With no major negative catalyst behind the sell-off, rising buying pressure fueled a swift bounce, shifting focus to whether Ethereum can now build on this recovery or if the rebound remains a short-term reaction within a broader range.
Weekly Chart Signals Compression Ahead of a Breakout
This ETH weekly chart captures a long phase of consolidation that traders often see before a big expansion move. Ethereum has been printing higher lows since the 2022 bottom, while price keeps getting capped near the $3,800–$4,000 resistance zone. The recent move above that level, followed by a sharp pullback, looks like a classic fakeout meant to flush late entries. With the broader structure still intact, this setup leans more toward prolonged accumulation than a trend breakdown.
For traders, the line in the sand sits around $2,800–$3,000, where the higher-low structure is anchored. As long as ETH holds this zone, upside attempts remain valid. A strong weekly close above $4,200 would signal real acceptance and could open the path toward $5,000–$5,500, with $7,000 as the larger breakout target. Losing $2,800 on a weekly close would weaken the setup and point to more sideways or corrective price action.
Ethereum Price at a Decision Point
Ethereum’s current price action reflects stabilization, not confirmation. After defending the $1,750–$1,900 macro support zone, ETH has managed to rebound above $1,950, but it continues to struggle below the $2,150 resistance, which remains the first level bulls need to reclaim to regain short-term control.
From a higher-timeframe perspective, the weekly higher-low structure is still intact, meaning the broader bullish thesis has not been invalidated yet. However, the lack of a strong follow-through move and continued rejection near resistance suggests ETH is still range-bound, not trending.
As long as ETH holds above $1,750, the downside risk remains containe,d and the market stays in a positioning phase. A weekly close below $1,700 would weaken the structure and open the door to a deeper correction. On the upside, a reclaim of $2,150, followed by acceptance above the $2,600 mid-range, would be the first signs that Ethereum is preparing for a broader breakout attempt.
BTC price rebounded to nearly $69,500 after briefly breaking down toward $60,000 in recent week, triggering debate over whether the move reflects stabilization or a classic dead-cat bounce. While crowd sentiment has flipped deeply bearish, on-chain data shows rising whale exchange activity, adding complexity to Bitcoin’s short-term outlook.
Crowd Psychology Turns Deeply Bearish After Sharp Selloff
When markets fall aggressively, expectations often follow price. After BTC price slipped to $60,000, social sentiment quickly shifted toward calls for “lower” and “below,” signaling widespread fear among retail participants. Historically, such spikes in bearish crowd language tend to occur closer to local inflection zones rather than continuation peaks.
Meanwhile, data tracking social volume suggests that pessimism has intensified rather than faded during the rebound toward $69,500. This imbalance indicates that confidence in the recovery remains fragile, even as price attempts to stabilize. Still, extreme fear phases often reduce immediate selling pressure, particularly if weaker hands have already exited.
Dead Cat Bounce or Short-Term Relief Rally?
That said, the ongoing recovery raises an very important question on the BTC price chart: is this merely mechanical short covering, or a response to sentiment exhaustion? Since, markets rarely move in straight lines, and violent declines are often followed by reflexive rebounds.
From a technical perspective, BTC price USD is hovering just above the weekly 200-EMA band, an area closely watched by long-term participants. A sustained hold above this region could allow price to revisit higher liquidity zones crossing the $70,000 area towards $80K-$85K. However, failure to defend this band would increase downside exposure toward the mid-$50,000s.
Whale Exchange Activity Adds Caution to the Setup
At the same time, on-chain behavior introduces a more defensive note. The Exchange Whale Ratio on Binance, smoothed over 30 days, has climbed to 0.447, its highest reading since March 2025. This suggests that large holders now account for a disproportionate share of exchange inflows.
Historically, elevated whale ratios coincide with phases of distribution or hedging rather than accumulation. As shown on the chart, this spike aligns closely with Bitcoin’s recent price decline, reinforcing the idea that larger players remain active on the sell side. Until this metric begins to cool, downside risk remains structurally present.
Contradictory Signals Keep BTC Price Range-Bound
Still, the divergence between retail fear and whale pressure creates a complex environment. While extreme pessimism among smaller participants can support short-term rebounds, continued whale dominance in exchange inflows limits upside follow-through.
From a broader lens, BTC crypto markets appear to be undergoing a reset rather than a directional trend. If price stabilizes above key moving averages, the BTC price prediction narrative could temporarily shift toward consolidation or relief rallies. Conversely, renewed weakness below support could open the path toward the $53,000 region, where prior demand has historically emerged.
In this context, BTC price remains caught between sentiment exhaustion and structural selling, making the coming weeks particularly sensitive to crowd behavior and on-chain flow shifts.
CZR Exchange has officially launched a comprehensive rebrand alongside a significantly upgraded trading platform, marking a pivotal step in the exchange’s long-term strategy. The update goes beyond visual changes, introducing deeper infrastructure improvements and native integration of the platform’s utility token, $CZR, as a core component of its ecosystem.
According to the company, the rebrand reflects a broader transformation of CZR Exchange from a conventional crypto trading venue into a utility-driven platform designed to support sustainable growth and user alignment over time.
A Structural Upgrade, Not a Cosmetic One
While rebranding is common across the crypto industry, CZR Exchange says its latest update was driven by structural priorities rather than aesthetics. The upgraded platform features a redesigned interface focused on speed and usability, alongside backend performance enhancements aimed at improving execution reliability and scalability.
The exchange has also implemented a modular system architecture, allowing new features and services to be introduced without disrupting core operations. This design is intended to support ongoing development as the platform expands its product offerings.
Charlie Rothkopf, Founder of CZR Exchange, emphasized that the rebrand represents a foundational rebuild rather than a surface-level refresh.
“This was about rethinking how the exchange operates at both a technical and economic level,” Rothkopf said. “$CZR is embedded directly into the platform to support real utility and long-term participation.”
$CZR Utility Embedded Into the Exchange Experience
A central element of the rebrand is the native integration of the $CZR token across the platform. Rather than existing as a standalone asset, $CZR is built directly into key exchange functions, including trading fees, rewards, and user status tiers.
Users can benefit from trading fee reductions, accelerated access to VIP levels, ecosystem incentives, and eligibility for future premium tools and features. By tying these functions directly to token usage, CZR Exchange aims to align user activity with platform growth through a shared economic framework.
The exchange stated that this approach is designed to encourage participation based on utility and engagement, rather than short-term speculation.
Phase One of a Broader Ecosystem Roadmap
The newly launched platform represents the first phase of CZR Exchange’s broader roadmap. Future phases are expected to expand the role of $CZR across additional services, including payments, identity-based solutions, rewards systems, and other financial tools.
By establishing token utility at the infrastructure level early on, CZR Exchange is positioning $CZR to scale alongside platform adoption rather than being retrofitted at a later stage.
Looking Ahead
With its rebrand now live, CZR Exchange is entering its next phase focused on ecosystem expansion and long-term execution. The company says its goal is to build a scalable, utility-driven exchange model that balances performance, usability, and economic alignment.
More information and official updates can be found at czrex.com.
Crypto liquidations have jumped by over 122% in the last 24 hours to over $2 billion. But there are some key signs that suggest a crypto recovery is coming soon.
Bitcoin Core maintainer Gloria Zhao has stepped down and revoked her PGP signing key after six years as one of the project’s most influential mempool and policy engineers.
Trend Research has been reducing its Ether exposure, as ETH price closed in on some of the investment company's critical liquidation levels below $1,700.
Bitcoin price has rebounded from a critical multi-year channel support near $62,500, raising the question of whether a high-timeframe bottom may be forming.
The price of XRP rose strongly on Friday after a sharp earlier decline, supported by increased buying activity and a technical rebound from oversold levels.
XRP gained roughly 15%, recovering to around $1.30–$1.40, after falling nearly 20% earlier in the week to its lowest level since November 2024. The rebound came even as the broader cryptocurrency market remained under slight pressure.
Oversold conditions trigger recovery
Market data showed the token had entered deeply oversold territory during the recent sell-off, prompting bargain buying that helped drive the recovery. Trading volumes also increased sharply, indicating strong spot demand as investors stepped in following the decline.
Such rebounds are common after rapid price drops, particularly when leveraged positions have already been cleared from the market.
Liquidations and supply changes added to volatility
Earlier losses were intensified by approximately $40 million in liquidations, which accelerated selling during periods of thin liquidity. Additional pressure came from the scheduled release of about 300 million XRP tokens from escrow by Ripple, temporarily increasing available supply.
Mixed outlook for near-term prices
Market participants remain divided over the near-term outlook. Some analysts said the rebound could mark the formation of a temporary price floor after the recent correction, while others warned that volatility may persist if broader crypto market sentiment remains weak.
Maintaining levels above the $1.29 area could allow further gradual gains, while a renewed drop below that range could lead to another test of recent lows.
Analyst EGRAG Crypto said his strategy is to stay positive on the asset if the price moves back above $1.85, which he believes could open the way for a rise toward $2.20. He added that a confirmed move above $2.50 would require a fresh reassessment of the overall market structure.
On the downside, he said that if the price falls below $1.28, the position is small enough that he is comfortable continuing to hold it as part of his risk management approach.
Mahe, Seychelles — BitMart has expanded the availability of its crypto-linked payment card, BitMart Card, to more than 115 countries and regions worldwide, marking a new phase in the platform’s payment ecosystem strategy. Alongside the geographic expansion, the company unveiled its 2026 reward structure, offering cashback rates of up to 5.5% and annual cumulative benefits exceeding $300. The move reflects the increasing integration of digital assets into day-to-day financial activity beyond exchange trading environments.
Everyday Spending Trends Support International Growth
Unlike some crypto payment products that rely on short-term promotions or remain limited to specific regions, BitMart Card’s global footprint has been built through sustained, real-world consumer demand. The card is now widely used across a range of everyday spending scenarios, including dining, online shopping, high-frequency daily expenses, and cross-border payments.
BitMart noted that the formation of stable usage patterns across multiple markets highlights increasing acceptance of crypto payments globally, as users seek practical, reliable ways to spend digital assets beyond trading environments.
In the early stages of crypto payment adoption, many products were largely experimental, with limited use cases and frequency. As infrastructure has matured, crypto payment tools are increasingly evolving toward everyday financial utilities.
The usage trajectory of BitMart Card reflects this shift. Crypto assets are no longer confined to on-platform balances, but are increasingly being used directly for real-world consumption. Whether for seamless payments during international travel or instant settlement in daily transactions, demand for stable, long-term crypto payment solutions is being met through BitMart Card.
Updated 2026 Rewards Emphasize Continued Engagement
As both user adoption and usage frequency continue to grow, BitMart has introduced a 2026 upgraded benefits structure for BitMart Card, designed to emphasize long-term value rather than short-term incentives.
According to the company, key highlights of the updated benefits framework include:
Up to 5.5% cashback across a wide range of everyday spending categories
More than $300 in annual cumulative rewards, combining welcome benefits and ongoing usage incentives for both new and existing users
Additional benefits such as free ATM withdrawal allowances, tiered cashback structures, and long-term reward programs integrated with the BitMart ecosystem, aligning payment activity with broader asset participation
A BitMart spokesperson said the upgrade reflects a systematic optimization based on long-term user behavior, aimed at supporting the normalization of crypto payments in everyday consumption through sustainable incentives.
External Reviews Reinforce Competitive Standing
Amid intensifying competition in the crypto payments sector, BitMart Card has also received independent third-party recognition. The card recently ranked among the top global crypto cards evaluated by CryptoCardHub, an industry review platform that assessed 86 crypto card products worldwide. The recognition reflects the card’s practical usability, accessibility, and overall value proposition in real-world payment scenarios.
According to CryptoCardHub’s assessment, BitMart Card’s performance is driven by its focus on everyday spending convenience, automatic crypto-to-fiat conversion at the point of payment, and its integration with Visa’s global merchant network. This recognition underscores BitMart’s continued efforts to advance the mainstream adoption of digital assets through functional payment infrastructure.
Payment Infrastructure Gains Strategic Importance
As crypto trading infrastructure becomes increasingly standardized, industry competition is shifting toward real-world application and payment usability. Market observers widely view the ability to deliver consistent, reliable payment experiences across regions as a key differentiator in the next phase of platform competition.
BitMart emphasized that expanding BitMart Card to 115+ countries and regions represents a critical step in integrating crypto assets into the real economy. The company said this foundation not only strengthens its position in crypto payments but also supports future expansion into broader payment scenarios and financial services.
BitMart is a premier global digital asset trading platform with more than 13 million users worldwide. Consistently ranked among the top crypto exchanges on CoinGecko, BitMart offers over 1,700 trading pairs with competitive fees. Committed to continuous innovation and financial inclusivity, BitMart empowers users globally to trade seamlessly. Learn more about BitMart on the Website, follow their X (Twitter), or join their Telegram for updates, news, and promotions. Download the BitMart App to trade anytime, anywhere.
The global cryptocurrency market has lost about $720 billion in value since the start of the year, with total market capitalization falling from $2.97 trillion to about $2.25 trillion in just over five weeks.
Large holders selling as retail investors buy
Blockchain data shows that large Bitcoin holders, often referred to as “whales,” have been reducing their positions during the recent decline. Wallets holding 10 to 10,000 Bitcoin now control about 68.04% of the total supply, a nine-month low, after selling roughly 81,000 BTC over the past eight days.
What's been behind the Bitcoin crash that has seen prices fall to as low as $60,001 for the first time since October, 2024?
Whale and shark wallets holding 10-10K Bitcoin now hold a 9-month low 68.04% of the entire $BTC supply. This includes a dump of -81,068 BTC in just… pic.twitter.com/Yyd20dy3nS
At the same time, smaller retail investors continue to accumulate. Wallets holding less than 0.01 BTC now account for about 0.249% of supply, the highest level in roughly 20 months, showing continued dip-buying despite falling prices.
Bitcoin struggling near key support
In an interview with Coinpedia, Avinash Shekhar, co-founder and CEO of Pi42, said Bitcoin’s drop toward $60,000 marks its weakest stretch since late 2024, with the asset now down nearly 50% from its October 2025 peak.
He said heavy liquidations and continued outflows from exchange-traded funds have intensified the sell-off, while repeated failures to hold above the $70,000–$72,000 range have kept market sentiment defensive.
According to Shekhar, the $58,000–$60,000 region remains an important support band, and stability at those levels could gradually restore confidence and allow for a measured recovery if volatility begins to ease.
Ethereum and XRP lead the correction
Shekhar said the broader downturn has been driven by sharp weakness in Ethereum and XRP, which have both seen steep declines in recent weeks. Ethereum’s fall below $2,000 pushed prices back to levels last seen in 2023, with the asset down roughly 30% over the past week.
XRP has also dropped more than 25% during the same period, accompanied by falling derivatives activity and large liquidations, indicating reduced speculative participation across the market.
Deep corrections often precede consolidation
Despite the scale of the decline, Shekhar said such sharp market resets often occur before longer consolidation phases that help establish stronger foundations for future recovery.
“While near-term caution remains dominant, such deep corrections often precede consolidation phases that help establish stronger long-term bases for recovery,” he said.
While near-term caution remains dominant due to continued volatility and weak sentiment, he said improving stability near major support levels could eventually pave the way for gradual market normalization in the coming months.
Bitcoin Reclaims $68,000 as Crypto Market Adds $270 Billion
Bitcoin climbed back above $68,000, rising about 14% from its previous day’s low as buying momentum returned to the crypto market. The rebound helped lift the total cryptocurrency market value by roughly $270 billion, while about $185 million in short positions were liquidated within 12 hours.
February 6, 2026 15:09:57 UTC
Crypto Rebound Begins, XRP Gains 10%
At the time of writing, Cryptocurrency markets showed mild recovery signs over the past 24 hours, with Bitcoin trading around $68,090, up about 0.5%, while Ethereum rose roughly 1.8% to $1,972. XRP led gains among major tokens, climbing nearly 10% to around $1.47. The broader CoinMarketCap 20 index also advanced more than 2%.
February 6, 2026 14:43:54 UTC
Crypto Market Losing Nearly $20 Billion Daily in 2026 as $720 Billion Wiped Out
The cryptocurrency market has shed roughly $720 billion since January 1, with total market capitalization falling from $2.97 trillion to $2.25 trillion, according to market estimates. From the January 14 peak, the broader market has lost about $1 trillion, averaging close to $44 billion in daily declines, highlighting the scale of the ongoing crypto downturn.
February 6, 2026 14:43:54 UTC
Bitcoin Must Hold $65K to Stop Liquidation Spiral
The crypto market downturn deepened as leveraged positions from the 2025 rally continue to unwind, triggering fresh selling pressure. Investor sentiment has dropped to Extreme Fear (index 5). Analysts say Bitcoin stabilizing above $65,000 and falling liquidation volumes could signal early signs of market recovery.
February 6, 2026 14:31:01 UTC
Cardano Founder Charles Hoskinson Says He Lost Over $3 Billion
Cardano founder Charles Hoskinson says he has lost over $3 billion across crypto cycles but refused to cash out, stating it would have been “real easy” to walk away while reaffirming his commitment to long-term blockchain development.
February 6, 2026 14:31:01 UTC
Crypto Market Cap Drops to $2.29T as Investors Enter Extreme Fear Zone
The global cryptocurrency market remained under pressure, with total market capitalization falling to $2.29 trillion, down nearly 4% in the past 24 hours. Investor sentiment weakened sharply, as the Fear & Greed Index dropped to 5, signaling extreme fear in the market. Bitcoin traded near $67,880, while Ethereum hovered around $1,973.
Since then, Bitcoin has reclaimed the $67,000 mark, while SOL has rebounded above $83, fueling hopes that the market may have already formed a bottom. However, beneath the surface, sentiment remains cautious. Technical signals and on-chain data indicate that traders are still hesitant to commit, suggesting the bounce may be driven more by short-term positioning than a clear shift in market confidence.
Spot Traders Turn Optimistic While Long-Term Investors Remain Cautious
The crypto market has shown signs of recovery after rebounding from recent lows, but underlying data suggests the move is still being driven more by positioning than long-term conviction. While prices have bounced and trading activity has picked up, several key metrics indicate that the market remains cautious beneath the surface.
Source: Defilama
Active addresses are increasing, and DEX trading volumes have climbed, suggesting higher participation and capital rotation as volatility returns. These trends often emerge during early recovery phases, when traders begin testing the market after a sell-off.
However, not all signals are supportive. Total Value Locked (TVL) continues to decline, indicating that long-term capital is still being withdrawn from protocols. This suggests that while traders are active, longer-term investors and liquidity providers remain cautious and unwilling to commit.
Short Positions Pile While SOL Price Rebounds
Solana’s price action over the past few weeks has been choppy and uncertain. After dropping more than 21% from monthly highs above $106, SOL has bounced back about 18% from the lows. The increase in active addresses shows more traders stepping in, which has also pushed volatility higher. Still, the rebound hasn’t fully convinced the market, as many participants appear to be positioning for a possible rejection rather than a clean recovery.
Following the rebound, open interest has started to rise, indicating that new positions are being opened rather than the move being driven purely by short covering. At the same time, funding rates remain negative, showing that traders are still skewed toward short positions despite the price recovery. This combination points to disbelief in the rally rather than aggressive bullish positioning.
Taken together, the data paints a clear picture: the market is seeing renewed activity and speculation, but not yet a return of confidence. For the rebound to develop into a sustained recovery, price strength would need to persist alongside stabilization in TVL and a gradual shift in positioning. Until then, the current move appears to be an early, fragile phase rather than a confirmed trend reversal.
What’s Next for SOL Price: A Rise to $100 or Drop to $60?
Solana’s price is currently in a make-or-break zone. The rebound from the lows has been sharp, but a trend reversal has not been confirmed yet. For the bullish continuation to $100, the price is required to hold above $80 to $82 and reclaim the resistance around $93 to $95. A failure could drag the price back to $70, triggering a deeper correction to $60 or below.
Therefore, the weekly close can be important for the Solana (SOL) price, which may further decide the next price action.
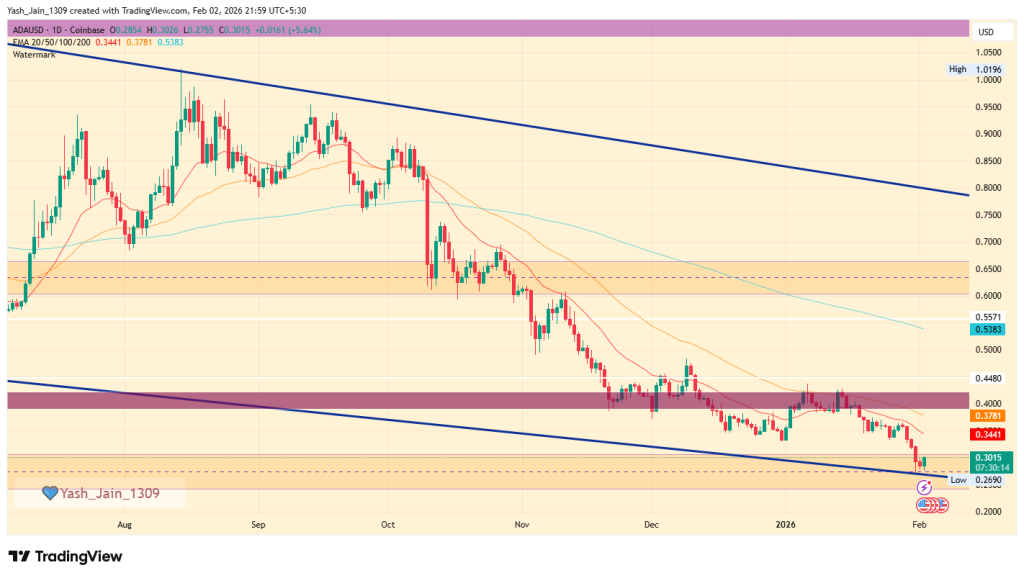
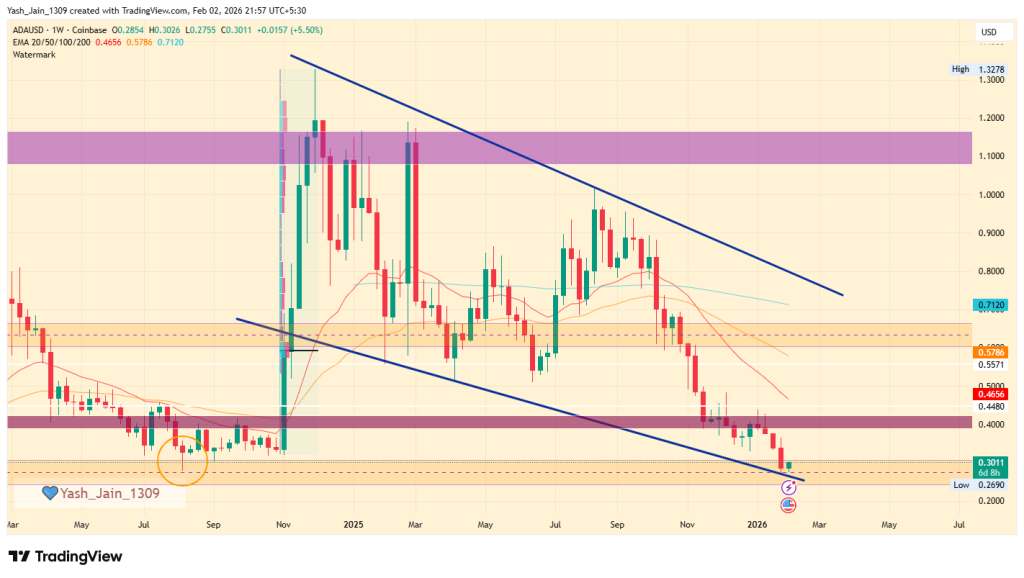
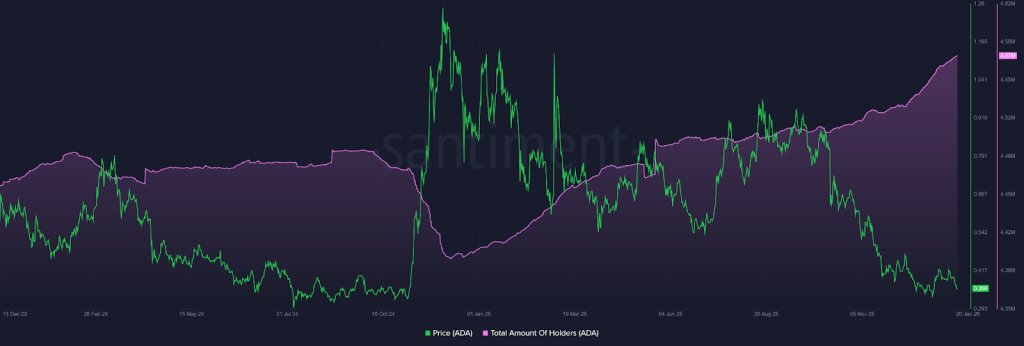
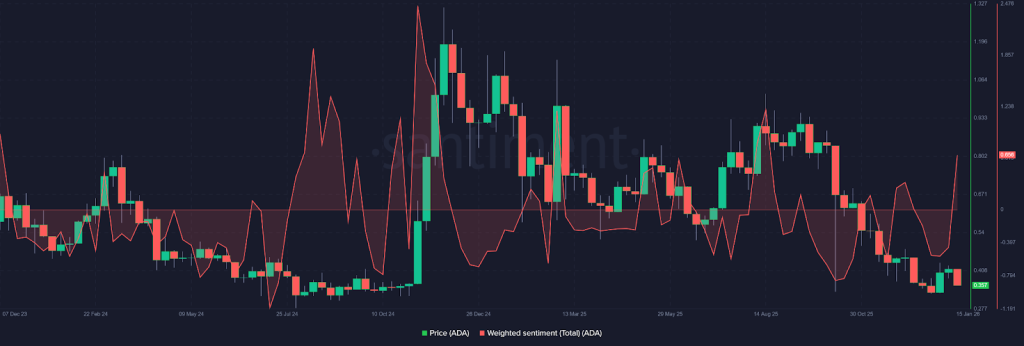
Cardano price continued its strong downward trend, reaching its lowest level since February 2021, as the crypto market crash accelerated. Cardano (ADA) token was trading at $0.2650, down by 80% from its highest point in December 2024. It has also…
Nexus International hits $1.2 billion revenue as billionaire Gurhan Kiziloz sets sights on $100 billon long-term growth. Gurhan Kiziloz, the self-made billionaire behind Nexus International, is not one to celebrate mid-journey. His company just crossed $1.2 billion in annual revenue…
CryptoQuant’s Ki Young Ju warns that absent a near-term Bitcoin rebound, forced liquidations and cascading institutional selling could hit ETFs, miners, and trust. CryptoQuant CEO Ki Young Ju stated that the risk of institutional selling in cryptocurrency markets could increase…
Speculation around Pi Coin gained fresh momentum after Kraken added Pi Network to its 2026 asset listing roadmap. While the move does not confirm an imminent spot listing, it marks the first formal signal from a major U.S. exchange that Pi could be under consideration for broader market access. The update arrives at a critical moment for Pi, which has been struggling with heavy price pressure and weakening investor confidence.
What Kraken’s Roadmap Update Really Means
Kraken’s roadmap outlines digital assets that may be listed in the future, subject to regulatory, technical, and liquidity requirements. Pi Network now appears alongside other potential listings such as Conflux and Pepecoin. Importantly, the exchange has not committed to a timeline or guaranteed spot trading support.
This development builds on Kraken’s earlier move to launch Pi perpetual futures in 2025. That product allowed traders to take both long and short positions using more than 40 supported collateral assets, increasing Pi’s exposure within derivatives markets even as spot trading remained limited.
Currently, Pi Coin is already available for spot trading on exchanges like OKX and Bitget, offering some liquidity to the market. However, the absence of listings on top-tier platforms such as Binance, Coinbase, and Robinhood has remained a major hurdle for broader adoption.
In Binance’s case, industry watchers have long speculated about a potential listing, but those expectations have repeatedly stalled. Ongoing leadership controversies within Pi Network appear to be one of the factors dampening progress with major U.S. and global exchanges.
Pi Current Market Sentiment
Pi Network remains under heavy pressure after sliding 9% on Thursday and breaking below the key $0.1533 support, a level that previously marked the October 10 low. Although the price bounced slightly from a fresh record low near $0.1300, the relief appears limited as bearish momentum still dominates. Technical indicators underline the weakness, with the RSI stuck deep in oversold territory around 20, signaling aggressive selling, while the MACD continues to trend lower in negative territory, reinforcing downside pressure.
With momentum tilted firmly toward sellers, PI appears to be entering a price-discovery phase, leaving the $0.100 listing price as the next major reference level. Any meaningful recovery would require a clear reclaim of the $0.1533 zone to ease selling pressure and stabilize price action.
Never Miss a Beat in the Crypto World!
Stay ahead with breaking news, expert analysis, and real-time updates on the latest trends in Bitcoin, altcoins, DeFi, NFTs, and more.
FAQs
Is Pi Coin listed on Kraken?
No, Pi Coin is not currently listed for spot trading on Kraken. However, Kraken has added Pi Network to its 2026 asset roadmap for potential future listing, following its 2025 launch of Pi perpetual futures contracts.
Is Pi Coin available for trading on major exchanges?
Pi Coin trades on platforms like OKX and Bitget, but top-tier exchanges such as Binance and Coinbase have yet to list it.
Why is Pi Coin’s price under pressure?
Heavy selling, weak investor confidence, and technical resistance near $0.1533 are driving Pi Coin’s recent price decline.
What is the future outlook for Pi Network?
The future outlook remains uncertain. While Kraken’s interest is a positive signal, Pi Network faces hurdles like exchange adoption delays and internal controversies. Price recovery requires stabilizing above previous key support levels.
Weekly stablecoin inflows to exchanges doubled from $51 billion in late December to around $100 billion amid the recent crypto dip, surpassing the 90-day average of $89 billion. January transaction volumes reached $10 trillion, with USDC leading at $8.4 trillion, highlighting its speed and efficiency over traditional payments. U.S. Senator Cynthia Lummis urged banks to adopt stablecoins for custody and cheaper payment rails. Meanwhile, China banned unapproved yuan-linked stablecoins, and Binance CEO CZ is developing native stablecoins with multiple countries.
The crypto market has just experienced one of its sharpest sell-offs on record, with Bitcoin plunging nearly $10,000 in a single day and briefly touching the $60,000 level. The sudden collapse triggered widespread panic, wiping out more than $2 billion in leveraged positions, most of them from traders betting on higher prices.
U.S. stock markets also showed clear signs of stress, with both the S&P 500 and Nasdaq slipping below key technical levels.
Broader macroeconomic pressures added fuel to the fire. Weaker-than-expected U.S. job openings data sparked fresh selling in equities, which quickly spilled over into crypto. Major technology stocks, including Microsoft, Nvidia, Tesla, and Meta, fell to recent lows, reinforcing a risk-off environment across global markets.
Capitulation Phase Signals Emerge as Bitcoin Volatility and Fear Spike
Despite a major crypto crash, market data suggests the sell-off may be approaching a point of exhaustion. Bitcoin’s price volatility has surged to levels seen only a few times in its history, often associated with major market stress events.
Forced liquidations in the futures market have reached extreme levels, driving sharp sell-offs followed by sudden rebounds. These violent intraday moves reflect a market dominated by panic rather than rational positioning.
Several additional indicators point to extreme fear. Bitcoin is now as oversold as it was during the March 2020 market crash, one of the most dramatic downturns in crypto history. Overall sentiment across the crypto market has dropped to one of its lowest readings on record, with traders rushing to exit positions at nearly any price.
These conditions resemble a classic capitulation phase, where panic selling peaks and weaker hands are flushed out of the market. However, capitulation does not guarantee an immediate recovery. In previous market cycles, Bitcoin often required weeks or even months to form a durable bottom after similar events.
Bitcoin Bear Market Timeline Points to Further Downside Risks
Looking at the broader cycle, earlier Bitcoin bear markets generally lasted around 12 to 14 months from peak to trough. If this cycle follows a similar trajectory, the market may still face further downside or an extended phase of sideways consolidation before stability returns.
For now, traders are closely watching key downside levels. Bitcoin could revisit the $57,000 zone, which has previously acted as an important support area. Below that, the $54,000–$55,000 range remains another critical level, as it held during earlier periods of broader market weakness.
Ethereum, XRP, and Solana Struggle as Altcoin Sell-Off Intensifies
Altcoins have suffered heavy losses, with market structure across most tokens remaining weak. Ethereum continues to face strong selling pressure and could slide toward the $1,500 level or lower if current conditions persist. XRP is drifting closer to $0.60, with no clear signs yet that the downtrend has ended.
Solana has dropped sharply into the $60–$70 range following a steep sell-off. While short-term rebounds of 30% or more are possible, analysts warn that any recovery is likely to remain volatile and occur within a broader downtrend. Other major tokens, including Cardano, Avalanche, and Sui, are also approaching key support zones where brief relief rallies could emerge.
Stablecoin Inflows Grow as USDT Dominance Weighs on Bitcoin
Meanwhile, USDT dominance has surged to new highs, signaling that investors are moving capital into stablecoins. Although this move appears stretched in the short term, sustained strength in USDT dominance would be bearish for Bitcoin and the wider crypto market.
A clear pullback in stablecoin dominance could trigger a strong relief rally, potentially pushing Bitcoin back toward the $70,000–$80,000 range. However, analysts caution that positioning aggressively for this scenario remains risky given the current macro and market conditions.
Never Miss a Beat in the Crypto World!
Stay ahead with breaking news, expert analysis, and real-time updates on the latest trends in Bitcoin, altcoins, DeFi, NFTs, and more.
FAQs
What is a Bitcoin capitulation phase?
Capitulation occurs when panic selling peaks, weaker hands exit, and extreme fear dominates, often signaling a potential market bottom.
How are altcoins like Ethereum, XRP, and Solana affected?
Altcoins are under heavy pressure, with Ethereum near $1,500, XRP around $0.60, and Solana at $60–$70, showing weak market structure.
What Bitcoin price levels are key to watch next?
Traders are watching $57,000 as near-term support, with $54,000–$55,000 critical if selling pressure continues.
China has banned unapproved offshore yuan-pegged stablecoins to stop crypto-based capital flight and financial crime. The People’s Bank of China repeated its strict ban on crypto activity, citing risks tied to money laundering and foreign exchange fraud. Hong Kong regulators also warned that no licenses have been issued, and promoting such stablecoins is illegal. The move targets offshore RMB tokens like CNH stablecoins and supports China’s push toward its digital yuan, the eCNY.
ARK Invest, the investment firm led by well-known tech investor Cathie Wood, has made a notable portfolio move after a sharp fall in crypto-linked stocks. The firm sold about $17 million worth of Coinbase shares and used nearly the same amount to buy stock in digital asset platform Bullish, signaling a strategy change during market weakness.
ARK Invest Sells $17.4 M Coinbase Shares as Stock Falls
Coinbase (COIN) shares have fallen heavily in recent weeks, dropping more than 40% over the past month and hitting multi-month lows. As prices continued to weaken, ARK Invest sold 119,236 shares of Coinbase, worth around $17.4 million in a single trade session.
ARK had mostly been buying Coinbase on dips and had not sold shares for many months. In fact, just days before this sale, the firm had added a small number of Coinbase shares, continuing its earlier buy-the-dip pattern.
Crypto Update: Cathie Wood’s ARK dumps $17M in Coinbase stock as shares fall 37% YTD
Girl, Cathie Wood finally getting real about Coinbase's struggles? Smart move, 'cause that YTD drop is no joke and sometimes you just gotta protect your portfolio. pic.twitter.com/S5nxLUsLbh
Instead of holding cash, ARK quickly moved the money into another crypto company. The firm bought about $17.8 million worth of shares in Bullish, an institutional-focused crypto trading platform listed on the NYSE in 2025.
Since its listing, Bullish stock has struggled and is down more than 60%, while the company reported a Q4 net loss of $563.6 million on a GAAP basis. ARK appears to see value at these lower prices and is increasing its exposure.
This shift shows that ARK is not leaving crypto, but rotating investments toward firms it believes have better growth potential.
ARK Still Holds Large Coinbase Position
Even after this sale, ARK remains one of the major investors in Coinbase. Across its main ETFs, the firm still owns about $312 million worth of COIN shares.
Crypto markets extended their downside momentum on Friday as selling pressure intensified across both majors and altcoins. Bitcoin fell nearly 9% on the day, briefly touching the $65,000 level, while Ethereum slid below $2,000. The weakness quickly spilled into the broader market, pushing several large-cap and mid-cap altcoins into double-digit losses.
This phase of the altcoin crash did not unfold gradually. Instead, price action accelerated once key intraday supports failed, triggering forced liquidations across derivatives markets. Liquidity thinned rapidly, bids pulled back, and volatility expanded in a way typically seen during late-stage risk unwinds rather than the start of fresh bearish trends. With sentiment deteriorating sharply and leverage exiting the system, the market now faces a critical question: Is this the exhaustion phase of the selloff, or merely another step lower?
Liquidations Data Shows Capitulation Spreading Beyond Bitcoin
The scale of forced selling offers a clearer view of the current altcoin crash. According to derivatives data, total liquidations crossed $2.59 billion over the past 24 hours, marking one of the largest single-day wipeouts in recent months. Bitcoin led the move with $1.34 billion in liquidations, reflecting the cascade triggered once price broke below the $67,000 zone. Ethereum followed with $562 million, while altcoins collectively absorbed more than $1.1 billion in liquidations. Solana alone saw close to $187 million, with the remainder spread across high-beta Layer-1s, DeFi tokens, and speculative mid-caps. This distribution matters. In earlier corrections, Bitcoin typically carried the majority of leverage risk.
During this altcoin crash, forced selling extended far deeper into the market, confirming that speculative positioning had built up aggressively beyond BTC. Once prices turned, leverage exited quickly, accelerating downside momentum. Historically, liquidation-heavy sessions of this magnitude tend to reset market structure by flushing excess risk rather than marking the start of prolonged downside trends.
Extreme Fear Readings Reflect Late-Stage Panic Conditions
Market sentiment data reinforces the view that the current altcoin crash is driven by fear rather than complacency. The Crypto Fear & Greed Index fell to 5, placing sentiment firmly in “Extreme Fear” territory. Readings below 10 have appeared only a handful of times across past cycles, including 2018, March 2020, and late 2022.
In each instance, such levels reflected emotional capitulation rather than early-stage bearish conviction. While prices did not reverse immediately in every case, downside momentum typically slowed as panic peaked.
Despite the severity of the ongoing altcoin crash, long-term structure paints a more nuanced picture. Historical market-cap trends show that altcoin cycles often experience deep compression phases before meaningful rotation begins. In 2017, 2021, and following the 2022 bear market, altcoins endured extended periods of underperformance marked by repeated breakdown fears, declining relative strength, and sharp monthly selloffs. These phases typically preceded strong upside expansions once capital rotation resumed.
Current charts reflect a similar pattern. Altcoin market capitalization remains locked in a long-term consolidation range, with downside moves repeatedly attracting demand near historical support zones. While this does not confirm an immediate altcoin season, it suggests the present altcoin crash resembles structural compression rather than outright collapse. Notably, these transitions have historically occurred during periods of extreme fear conditions that closely mirror the current environment.
Final Thoughts
The altcoin crash appears driven more by liquidation pressure than fresh selling. With sentiment near extreme fear and leverage largely flushed, downside momentum may be slowing. Volatility can persist, but the data suggests the market is closer to stabilization than collapse. Caution remains key, yet conditions for a gradual base may be forming.
FAQs
Why is the crypto market crashing today?
Crypto prices fell as key supports broke, triggering mass liquidations. High leverage, thin liquidity, and panic selling accelerated losses across coins.
Is this crypto crash a sign of a new bear market?
Not necessarily. Data suggests forced liquidations drove the drop, which often marks late-stage selloffs rather than the start of long bear markets.
What do high crypto liquidations mean for prices?
Large liquidations usually flush excess leverage. This can reduce selling pressure and help prices stabilize once panic-driven trades are cleared.
Should investors buy altcoins during a crash?
Crashes can create long-term opportunities, but timing is risky. Many investors wait for volatility to cool and price action to stabilize.
XRP’s sharp 17% fall did not happen because of bad news from Ripple. The real reason was a broader crypto market crash. Bitcoin price fell quickly, and Ethereum dropped below the important $2,000 level. Investors across the market rushed to sell and cut their risk.
XRP usually moves faster than most large cryptocurrencies. So when the market turned negative, XRP fell harder and faster than others.
Once prices started dropping, panic selling kicked in. More sellers entered the market, pushing the price down even further in a short time.
Heavy Liquidations Triggered the XRP Sell-Off
The biggest reason behind the XRP price drop was forced liquidations. In the last 24 hours alone, nearly $46 million worth of XRP positions were closed automatically. Most of these were traders who had bet on XRP prices going higher.
When XRP fell below the key level near $1.44, many of these trades were shut down by exchanges. This added more selling pressure and caused prices to fall even faster.
In markets with high borrowing and leverage, once selling starts, prices often keep falling until the most risky positions are cleared.
Ripple’s Positive News Couldn’t Save XRP Price
This drop confused many investors because Ripple recently secured important regulatory approvals in Europe, including licenses in the UK and Luxembourg. Normally, such news would help XRP prices.
However, during a market-wide selloff, investors focus more on fear and safety than long-term progress. Right now, XRP is moving based on short-term market emotions rather than Ripple’s business growth.
The $1.00 price level is now the most important support for XRP. If the crypto market stays weak, a move toward this level would not be surprising.
XRP could briefly dip below $1.00 if panic selling returns, but a long-term fall below this level would likely need another major wave of selling across the market.
Meanwhile, analyst Bill Morgan’s comment about XRP possibly dropping below USDC in market value highlights how fragile investor confidence remains.
Why XRP Recovery Is Still Possible
Despite the sharp fall, large investors are not panicking. XRP ETFs are still seeing money flow in, even during the price drop. This is very different from Bitcoin ETFs, which have faced strong outflows.
XRP’s recovery will largely depend on whether Bitcoin and Ethereum stabilize. If the overall market calms down and price swings slow, XRP could bounce back faster than many expect.
With better regulation, steady interest from institutions, and lower risky trading activity, this drop may turn out to be a short-term reset rather than a long-term downtrend.
Never Miss a Beat in the Crypto World!
Stay ahead with breaking news, expert analysis, and real-time updates on the latest trends in Bitcoin, altcoins, DeFi, NFTs, and more.
FAQs
Who is most affected by XRP’s sudden volatility?
Short-term traders and leveraged participants are most exposed, as rapid price swings can trigger margin calls or forced exits. Long-term holders are less directly impacted unless volatility persists.
How could this price move influence XRP trading behavior going forward?
Sharp declines often reduce speculative leverage in the short term, leading to lower volatility. This can create a more stable trading environment once weaker positions are flushed out.
What does this mean for institutions tracking or offering XRP products?
Institutions may reassess short-term risk models but typically focus on liquidity and regulatory clarity. Sudden drops rarely change long-term exposure strategies unless market stress deepens.
What should investors watch for next in the XRP market?
Market participants will monitor derivatives activity, volume trends, and broader crypto sentiment. A shift in Bitcoin or Ethereum momentum often sets the direction before XRP reacts.
The crypto market has come under intense selling pressure, with more than $350 billion wiped off total market capitalization. Similar downturns in the past have usually been accompanied by falling participation and capital exiting the space. This time, however, the setup looks different.
Instead of drying up, capital has surged, with stablecoin inflows doubling even as prices decline. This points to traders staying engaged and waiting on the sidelines rather than rushing to exit, likely positioning for a potential entry near market lows.
The key question now is whether the Bitcoin (BTC) price has already found a bottom or if the market still needs to endure further downside before a more durable recovery can take shape.
Stablecoin Inflow Doubles to OVer $102 Billion
The Weekly stablecoin exchange inflows have witnessed a massive increase, nearly doubling, highlighting a sharp increase in funds moving into exchanges during the sell-off. The rise in the stablecoin inflow comes at a time when Bitcoin and major altcoins remain under pressure, weighed down by heavy liquidations and weakening short-term market structure.
The data from CryptoQuant shows a major spike in inflows reaching $102 billion, well above the 90-day average of around $89 billion. This increase indicates a rapid rise in stablecoins being transferred to exchanges rather than withdrawn. Large inflows during a sell-off usually indicate that traders are preparing for potential accumulation rather than exiting the market. In simple terms, they are waiting for the markets to bottom.
When Does the Crypto Market Typically Bottom?
Historical Bitcoin bear markets show a clear pattern in drawdowns. In past cycles—2011, 2013–15, 2017–18, and 2021–22—market bottoms have usually formed after Bitcoin recorded deep peak-to-trough losses ranging between 60% and 80%.
The chart highlights that earlier corrections rarely ended at shallow pullbacks. Instead, price tended to stabilize only after prolonged drawdowns, accompanied by sustained fear, declining participation, and extended consolidation phases. In the 2021–22 cycle, for example, Bitcoin bottomed only after the drawdown pushed well beyond 70%, followed by several months of sideways movement.
Source: X
In the current cycle, the drawdown remains shallower compared to prior bear-market bottoms, suggesting the market may still be in a price-discovery and positioning phase rather than a confirmed bottoming process. Historically, bottoms have formed not at the first sharp drop, but after volatility compresses and drawdowns stop making new lows.
This comparison suggests that while capital positioning is increasing, time and further stabilization, rather than a single event, have typically been required before durable market bottoms emerge.
The Bottom Line: What to Watch Next?
The data suggests the market is not in panic exit mode, but it may also not be done correcting. More than $350 billion has already been erased from total crypto market capitalization, yet stablecoin inflows have doubled to around $102 billion, showing capital is waiting rather than leaving.
Historically, Bitcoin bear-market bottoms have formed after 60%–80% drawdowns. From the recent cycle high, BTC is currently down roughly 35%–45%, which places the market short of typical historical lows. Based on past drawdowns, a probable downside zone for the Bitcoin price lies between $48,000 and $42,000, where long-term demand has previously emerged.
For the broader crypto market, a comparable move would imply total market capitalization falling toward the $1.6 trillion–$1.4 trillion range, down from recent highs near $2.3 trillion.
In short, capital appears ready, but history suggests price may still need to probe lower levels or consolidate longerbefore a durable bottom is confirmed.
FAQs
Why is the crypto market falling despite rising stablecoin inflows?
Prices are falling due to liquidations, but stablecoin inflows suggest traders are staying active and preparing to buy, not exiting crypto.
What do rising stablecoin inflows mean during a crypto crash?
They usually signal sidelined capital. Traders move funds to exchanges to prepare for buying near potential market bottoms.
Is this crypto crash panic selling or strategic positioning?
Data suggests positioning, not panic. Capital is waiting on exchanges, indicating traders expect opportunities after volatility cools.
A Bithumb employee accidentally sent around 2,000 $BTC to hundreds of users during an airdrop instead of the intended token, causing Bitcoin to drop about 10% on the exchange. Some users reported receiving 2,000 $BTC rather than the expected 2,000 KRW. The mishap triggered a sharp price reaction locally on Bithumb, though Bitcoin’s broader market remained relatively stable. The incident highlights the risks of human error in crypto operations and the potential market impact of large accidental transfers.
Two of Ethereum’s most senior figures just disagreed publicly on how the protocol should scale, and the conversation is worth paying attention to.
Ethereum Foundation Co-Executive Director Tomasz Stańczak suggested that Ethereum should drop its built-in statelessness effort at L1 and let L2s handle state scaling instead. He called the current approach too complex and “against the idea of simplicity,” adding that the current design leads to “nothing better than L2s.”
Vitalik Buterin responded directly and disagreed.
What Did Vitalik Buterin Say About L1 Statelessness?
Buterin first corrected how Stańczak framed the issue. He said current proposals are not about “higher-security vs lower-security” state but about “higher-accessibility vs lower-accessibility.”
He then laid out a path where Ethereum scales execution by 1000x but state by only 20x. In that setup, creating new storage slots becomes very expensive compared to computation.
Apps would need to provide merkle proofs to update virtual state trees instead of using native L1 storage. He noted that privacy protocols already work this way.
L2 Dependency Puts User Funds at Risk
This is where it matters most. Buterin said that relying too heavily on L2s means more dependency on extra-protocol code. When that code breaks, users lose money, and there is no hard fork to fix it.
He was clear: consensus failure followed by a hard fork is “less bad” than people quietly losing funds through broken L2 infrastructure. This lines up with his recent comments where he called most L2s “copypasta EVM chains” and said Ethereum does not need more of them.
Have been following reactions to what I said about L2s about 1.5 days ago.
One important thing that I believe is: "make yet another EVM chain and add an optimistic bridge to Ethereum with a 1 week delay" is to infra what forking Compound is to governance – something we've done…
If the goal is to minimize L1 work, Buterin said he would go with a bare-bones UTXO approach, starting with moving receipts to SSZ for better provability.
But he is not locking anything in.
“There is no need for us to commit to an exact path this year,”he said, emphasizing that L1-native solutions reduce the code apps depend on for security while protecting “privacy, availability and censorship resistance for users.”
With Ethereum L1 gas limit increases planned for 2026 and Buterin openly questioning the role of L2s, this debate inside the Foundation could shape the protocol’s scaling roadmap going forward.
Stablecoin issuer Tether has minted another $1 billion worth of USDT, adding to a sharp rise in stablecoin issuance over the past week, according to on-chain analytics firm Lookonchain. The latest mint brings total stablecoin issuance by Tether and Circle…
Crypto volatility has hit XRP hard, with macro worries and geopolitical tension putting traders on edge. The most recent drop has pushed the token near a major support level. Next up, we’ll examine the market and provide our latest XRP…
Perpetual DEXs processed over $70B on Feb. 5, their second‑biggest day ever, as Hyperliquid, Aster, edgeX and Lighter absorbed a sharp BTC, ETH, SOL‑led deleveraging. Perpetual DEXs just printed their second-biggest day on record, turning a brutal sell-off into a…
Binance has bought another 3,600 BTC for its SAFU fund, lifting the stash to 6,230 BTC as it races to convert roughly $1B in user‑protection reserves into Bitcoin within 30 days. Binance has quietly turned its emergency war chest into…
China has moved to lock down virtually all crypto and real‑world asset (RWA) tokenization activity, issuing a new notice that declares such operations illegal financial activity and extends liability across the entire service stack. Core of the new notice The…
South Korean crypto exchange Bithumb was thrust into the spotlight on Friday after claims surfaced on social media that an internal error led to the accidental distribution of 2,000 Bitcoin to users, triggering a sharp price dislocation on the platform.…
Tether has announced a $150 million investment in Gold.com, marking a major move to bring physical gold and digital assets closer together. The deal gives Tether around a 12% ownership stake in the precious metals company and strengthens its long-term focus on real-world assets and blockchain-based finance.
The investment will happen in two stages. Tether will first buy $125 million worth of Gold.com shares, followed by an additional $25 million, subject to regulatory approval. As part of the agreement, Tether will also be able to appoint a board member, giving it a say in Gold.com’s future plans.
Tether Gold and Physical Bullion: Connecting Digital and Real Assets
A key part of this partnership is the deeper integration of Tether Gold (XAU₮) into Gold.com’s platform. XAU₮ is a gold-backed digital token, with each token supported 1:1 by physical gold stored in secure vaults.
This collaboration could allow users to buy physical gold using digital assets, including USDT and XAU₮. By combining Gold.com’s bullion operations with Tether’s global stablecoin network, the companies aim to create a single platform linking traditional gold markets with crypto-based payments.
Gold Price Rally Boosts Demand for Gold-Backed Stablecoins
The timing of the deal comes as gold prices hit record highs, crossing the $5,000 per ounce level. Alongside this rally, interest in gold-backed stablecoins has surged.
Over the past year, the market for gold-backed digital assets has grown from $1.3 billion to $5.5 billion. Tether Gold leads the sector, holding more than half of the total market value. Tether itself reportedly owns around 140 tonnes of physical gold, worth over $23 billion, strengthening its role in hard-asset-backed digital finance.
Founded in 1965, Gold.com operates several well-known precious metals brands, including JMBullion, Monex Precious Metals, GovMint, and Stack’s Bowers Galleries. These platforms have long focused on physical bullion sales and collectibles.
With Tether’s backing, Gold.com plans to expand into digital gold products, stablecoins, and possibly gold leasing and tokenized assets. Company leaders say the partnership supports their goal of becoming a full-service precious metals platform, serving both traditional investors and crypto users.
Tether’s Growing Focus on Real-World Assets
This investment fits into Tether’s broader diversification strategy. The company reported $10 billion in net profit in 2025 and revealed excess reserves of more than $6.3 billion.
Beyond USDT, Tether has been investing in Bitcoin mining, artificial intelligence, decentralized communications, and now precious metals. The Gold.com deal highlights Tether’s push to position tokenized gold as a modern store of value, blending the stability of physical gold with the speed and flexibility of digital finance.
Never Miss a Beat in the Crypto World!
Stay ahead with breaking news, expert analysis, and real-time updates on the latest trends in Bitcoin, altcoins, DeFi, NFTs, and more.
FAQs
How does Tether Gold (XAU₮) work?
XAU₮ is a digital token backed 1:1 by physical gold stored in secure vaults, letting users hold and transfer gold on the blockchain.
Can users buy physical gold using crypto after this deal?
Yes. The partnership aims to let users buy physical gold on Gold.com using USDT, XAU₮, and other supported digital assets.
How does this deal fit Tether’s long-term strategy?
It supports Tether’s focus on real-world assets, expanding beyond USDT into tokenized gold and blending traditional finance with crypto.
Bitcoin just posted its worst single-day loss event ever recorded, and one crypto analyst believes the market is staring down a path that ends at zero.
Jacob King, founder of SwanDesk, laid out a 16-step breakdown of how Bitcoin could enter what he calls a “worst-case, totally catastrophic domino effect of cascading failures.”
BTC crashed toward $60,000 today, with on-chain data showing $3.2 billion in realized losses on February 5 alone.
That figure is larger than what investors lost during the Terra-Luna crash or the FTX bankruptcy, making it the most severe single-day capitulation event in Bitcoin’s history.
What Does King’s Bitcoin Doomsday Look Like?
King’s scenario begins with exchange liquidity collapsing under sustained ETF outflows, creating what he describes as a “self-reinforcing capitulation loop.” Retail investors rush for the exits, but platforms freeze or go dark. Exchanges lacking reserves start banning withdrawals altogether.
From there, things get worse. Tether comes under federal pressure and stops printing new supply, removing the artificial liquidity that has historically helped spark rebounds. Miners, hit by falling rewards and rising energy costs, dump their BTC reserves onto a market that already has no buyers.
Then comes the big domino. King warns that heavily leveraged corporate holders like MicroStrategy could face margin calls, forcing “massive involuntary liquidations” of hundreds of thousands of coins. Demand vanishes. Tether depegs. Hashrate collapses so far that a 51% attack becomes realistic.
“The story of Bitcoin mirrors the Titanic. It was said to be unsinkable, but that was never true. You will see,” King wrote.
The fear is not entirely detached from reality. Market depth, the amount of capital available to absorb large sell orders, sits more than 30% below where it was in October. That kind of thin liquidity means even moderate selling can trigger sharp moves down.
Historical patterns offer some perspective. Each Bitcoin bear cycle has produced a smaller drawdown than the one before: 93% in 2011, roughly 77% in 2022. If that trend continues from the $126,000 peak, a potential floor sits somewhere around $38,000.
Whether King’s full doomsday chain plays out is debatable, but traders need to be on full alert.
Metaplanet CEO Gerovich announced the company will continue steadily accumulating Bitcoin despite a 50% drop from October 2025 highs and shares nearly halving since mid-January. The Tokyo-listed firm, which began buying BTC in April 2024, now holds 35,102 BTC worth $2.2 billion, ranking fourth globally among public companies. With an average purchase price of $107,716 per BTC, the firm faces $1.6 billion in unrealized losses. Gerovich emphasized long-term growth, mirroring strategies of other resilient Bitcoin holders like MicroStrategy.
Today, the flagship cryptocurrency Bitcoin price saw a massive 14% crash to the $60,000 level before recovering toward $65,000 after several technical breakdown signals appeared at once.
The sharp fall triggered panic selling, heavy liquidations, and pushed market sentiment into extreme fear across crypto traders.
Extreme Fear and Bitcoin RSI Signals Show Panic Conditions
On 5th Feb, Bitcoin broke below the key $70,000 support and quickly dropped close to $60,000 before seeing a small recovery. The fall triggered three major technical breakdown signals, pointing to strong downside momentum.
In just one week, Bitcoin has fallen nearly 25%, marking one of the fastest corrections this year. Meanwhile, trading volume was more than 3x the normal price level, showing panic selling and heavy liquidations. Secondly, more than $60 billion was wiped from the crypto market during the drop.
Lastly, Bitcoin’s daily RSI fell near 9, an extreme level usually seen only during panic phases. The crypto fear index also plunged to 5, deep in the extreme fear zone.
Such signals often appear near short-term bottoms, but analysts warn that oversold markets can stay weak for longer.
Bitcoin may now move in a broad range between $60,000 and $73,000 in the coming weeks. If selling pressure rises again, traders fear another drop toward the $55,000 level.
Bitcoin Dominance Drops Sharply Against Altcoins
Additionally, Bitcoin dominance (BTC.D) dropped 1.64% in a single day, and its RSI is rolling over, signaling weakening strength. At the same time, combined stablecoin dominance has jumped sharply, which usually means investors are moving to cash and reducing risk.
Meanwhile, altcoin dominance is rising mainly because Bitcoin is falling faster than altcoins, not due to real market strength.
Ethereum and Altcoins Follow With Heavy Losses
Following the Bitcoin drop, Ethereum plunged about 30% during the same period, with its daily RSI near 11. The ETH/BTC ratio continues to trend lower, showing that Ethereum is weaker than Bitcoin in this correction.
Several major altcoins also broke long-term support levels.
Large-cap altcoins like BNB, SOL, LTC, and XRP moved into oversold territory, with some hitting multi-month lows after the market-wide dump.
Several Ethereum whales are at risk of major liquidations as ETH trades near $1,900. Trend Research leads with 356,000 ETH ($671 million) vulnerable between $1,562 and $1,698, followed by Joseph Lubin with 293,000 ETH ($553 million) and the “7 Siblings” group with 287,000 ETH ($541 million) exposed near $1,029 to $1,075. Trend Research recently sold 170,000 ETH ($322 million) and repaid $344 million in loans, reducing exposure. If ETH prices drop further, forced liquidations could trigger sell-offs, though adding collateral may help whales avoid wipeouts.
Cardano founder and former Ethereum co-founder Charles Hoskinson revealed in a livestream called Red Days that his crypto holdings have lost over 3 billion dollars as Bitcoin fell below 66,000 and ADA dropped to 0.25, down 92 percent from its 2021 peak. Hoskinson stressed his commitment to blockchain technology over profit, saying money is not his motivation, and he would stay dedicated even after such losses. He highlighted his clean record compared to scandals like FTX and urged the community to keep building despite market volatility.
Bitcoin fell by more than $10,000 in a single day for the first time, with BTC price bear market analysis warning that a rebound could take several years.
Net weekly outflows from Bitcoin ETFs reached $690 million as BTC briefly touched $60,000, reigniting analyst criticism over “paper Bitcoin” and scarcity.
Metaplanet CEO Simon Gerovich is sticking with the company’s Bitcoin accumulation plan despite a brutal drawdown in both its stock and the wider crypto market.
Cardano founder Charles Hoskinson sought to steady market sentiment during a sharp crypto sell-off, arguing that short-term price pain does not undermine the long-term case for blockchain-based financial systems. Speaking during a public livestream from Tokyo, Hoskinson acknowledged worsening market…
An analyst warns Bitcoin could revisit ~$38k if past 70% drawdown patterns repeat, while others argue deeper institutional flows may cap the correction nearer 55%–60%. Bitcoin (BTC) continued to trade under bearish pressure as analysts debate the potential depth of…
Bitcoin Core maintainer Gloria Zhao has revoked her signing PGP key and stepped down, ending a six-year run of mempool-focused work that reshaped transaction policy. Gloria Zhao has revoked her signing PGP key for Bitcoin Core, confirming her departure from…
IBIT’s heavy Bitcoin flows and rising institutional demand collide with growing “harvest now, decrypt later” fears and BMIC’s push for post-quantum wallet security. BlackRock’s iShares Bitcoin Trust recorded substantial daily trading volume, according to Nasdaq data, as digital asset security…
RWA perps volume explodes above $15B as gold and silver crash, Binance cements dominance, and ONDO, PAXG, MKR, LINK front-run the real‑world assets trade. The RWA perpetuals market is suddenly where the adrenaline is. As CoinMarketCap put it, “the RWA…
Bitcoin briefly crashed toward $60,000 on February 6, wiping out over $2.6 billion in leveraged positions in 24 hours. That makes it the worst single-day drop since the FTX collapse in November 2022. Most outlets are blaming macro pressure and weak sentiment.
But DeFi researcher CryptoNobler says the real issue is structural, and it has been building for months.
According to CryptoNobler, Bitcoin no longer trades like a supply-and-demand asset. Derivatives have taken over price discovery entirely.
“The moment supply can be synthetically created, scarcity is gone. And when scarcity is gone, price stops being discovered on-chain and starts being set in derivatives,” he stated.
What Happened to Bitcoin’s 21 Million Hard Cap?
The hard cap still exists on-chain. But Bitcoin’s original value proposition relied on two things: fixed supply and no rehypothecation.
That framework broke the moment Wall Street layered cash-settled futures, perpetual swaps, options, ETFs, prime broker lending, wrapped BTC, and total return swaps on top of the chain.
Bob Kendall, creator of PortfolioXpert and a technical analyst, backed the same argument.
“Once you can synthetically manufacture the supply, the asset is no longer scarce, and once scarcity is gone, price becomes a derivatives game, not a supply-and-demand market,” he said.
CryptoNobler pointed to what he calls the Synthetic Float Ratio (SFR). The idea is simple: one real BTC can now simultaneously back an ETF share, a futures contract, a perpetual swap, an options delta, a broker loan, and a structured note. All at the same time.
“That’s six claims on one coin. That is not a free market. That is a fractional-reserve price system wearing a Bitcoin mask,” he warned.
He added that this is the same structural break that already happened to gold, silver, oil, and equities once derivatives took over those markets.
Wall Street’s Playbook
Both researchers described a cycle that keeps repeating: create unlimited paper BTC, short into rallies, force liquidations, cover at lower prices, and do it again. CryptoNobler called it “inventory manufacturing.”
Today’s crash fits that pattern. Of the $2.6 billion in liquidations, over $2.1 billion came from long positions being force-closed. Derivatives markets led the selloff while spot activity stayed relatively calm.
The question now is how long this cycle continues before the market catches up.
Never Miss a Beat in the Crypto World!
Stay ahead with breaking news, expert analysis, and real-time updates on the latest trends in Bitcoin, altcoins, DeFi, NFTs, and more.
FAQs
Why is Bitcoin price down today?
Bitcoin is down today due to heavy leverage liquidations in derivatives markets, where forced selling amplified losses despite relatively stable spot demand.
How low can Bitcoin price go from here?
Bitcoin often tests major liquidity zones after crashes; downside risk depends on leverage unwinding, but strong spot buying can limit deeper drops.
When will the Bitcoin market recover?
Recovery usually begins once leverage is flushed out and derivatives open interest resets, allowing spot demand to regain control of price movement.
Crypto markets extended the downside move today, slipping deeper into a high-volatility sell-off that has shaken both spot and derivatives traders. Bitcoin price dropped nearly 8.6%, hovering near the $65,000 level, while Ethereum and major altcoins followed with sharp intraday losses. The intensity of the move points to more than routine profit-taking. With liquidations accelerating and sentiment collapsing into extreme fear, the ongoing crypto crash creates a dilemma among investors, one that forces traders and investors to confront a familiar question: Is this a buy-the-dip moment, or is patience still required?
Liquidations Data Reveals Market Still Under Stress
The key trigger of today’s crypto crash lies in derivatives data. More than $2.59 billion worth of crypto positions were liquidated in the last 24 hours, marking one of the most aggressive leverage flushes of the year.
Bitcoin and Ethereum accounted for the bulk of forced closures, while altcoins experienced cascading liquidations as price levels failed in quick succession. At the same time, total open interest fell 10.1% to $95.77 billion, confirming that leverage is being removed, not repositioned. Such conditions typically reflect instability rather than balance. Markets tend to struggle to form durable bottoms while liquidation velocity remains elevated.
Sentiment Hits Extreme Fear, But Capitulation Is Incomplete
The Crypto market Fear & Greed Index plunged to 10, placing sentiment deep into Extreme Fear, a zone that historically precedes medium-term recoveries. However, structural signals remain mixed. Bitcoin exchange balances increased by 13,800 BTC, suggesting that selling pressure has not fully exhausted itself. Coins are still moving toward exchanges rather than being locked away by long-term holders. In previous market cycles, sustainable bottoms emerged after extreme fear persisted alongside declining exchange inflows, a condition that has not yet fully materialized.
Bitcoin Price at $65K: A Decision Zone, Not a Confirmed Bottom
Bitcoin’s drop toward the $65,000 region is now colliding with a signal that long-term market participants rarely ignore. The monthly stochastic oscillator has slipped into extreme oversold territory, a condition that has appeared only three times over the past decade. Each prior occurrence aligned with major bear market bottoms and the start of prolonged accumulation phases. However, history also shows this signal is not a timing trigger. In previous cycles, Bitcoin did not immediately reverse higher. Instead, price often spent weeks sometimes months moving sideways or making marginal new lows as leverage flushed out and sentiment reset.
That dynamic matters today. While the long-term stochastic suggests downside may be structurally limited, short-term data still reflects stress. Open interest is falling, liquidations remain elevated, and exchange balances are rising, indicating that traders are still de-risking rather than rebuilding positions. In practical terms, this creates a split narrative. For long-horizon investors, conditions are beginning to resemble early accumulation zones. For short-term traders, volatility risk remains high until liquidation pressure eases and price stabilizes above key support. The signal argues that Bitcoin may be closer to a bottom than a top, but confirmation will require patience, not prediction.
Final Thoughts: Right Time to Buy or Wait?
The broader crypto market is showing classic stress signals, not clear bottoming behavior. Extreme fear readings, multi-billion-dollar liquidations, and declining open interest suggest forced deleveraging is still working its way through the system. While some assets are showing relative strength and selective accumulation, this looks more like rotation and positioning not a broad-based recovery.
Historically, durable market bottoms form after volatility compresses and sellers exhaust, not during peak liquidation phases. Right now, liquidity is thin and confidence remains fragile, leaving room for further downside or prolonged consolidation. This is not a clear “buy the dip” moment for the overall market. Caution and patience are still the better strategy, with selective accumulation only where strong fundamentals and on-chain support clearly justify it.
The Crypto Fear and Greed Index fell to extreme fear levels of 5-9, the lowest since the June 2022 Terra and FTX crashes, as Bitcoin briefly dropped below $65,000 before recovering. The cryptocurrency saw a single-day decline of over $10,000, wiping out significant market value and triggering widespread liquidations. U.S. spot Bitcoin ETFs recorded $434.1 million in net outflows on February 5, led by BlackRock’s IBIT, reflecting growing caution among institutional investors.
Bitcoin’s recent fall has triggered one of the biggest loss-taking events in its history, illustrating how quickly market sentiment has shifted after months of strong gains. As prices dropped nearly 10% to around $64,000, Bitcoin hit its lowest level since late 2024. This sharp move pushed many investors to sell their holdings at a loss.
Record Losses in a Single Day
February 5 stood out as a major stress point for the market. On-chain analyst Murphy reported that realized losses reached about $3.2 billion in just one day—the highest daily total ever recorded. Realized losses reflect how much money investors actually lose when they sell below their buying price, making this a strong sign of panic selling.
Murphy noted that this single-day loss was even larger than what was seen during major past crises, including the Terra-Luna collapse and the FTX bankruptcy. This highlights how severe and sudden the latest sell-off has been.
Low Liquidity Made the Drop Worse
The Kobeissi Letter added that the decline was not driven by fear alone. It also exposed weak market liquidity. Bitcoin’s market depth, the amount of money available to absorb large trades, is still more than 30% lower than its October high. With fewer buyers at key price levels, even moderate selling can cause sharp price drops.
The last time market depth was this low was after the FTX collapse in 2022, showing that the market remains fragile during periods of heavy selling.
No Clear Trigger Behind the Sell-Off
Unlike previous crashes caused by major news events, this downturn did not have one obvious trigger. Murphy said that aside from a data adjustment issue in late 2025, the current loss numbers reflect real selling pressure. He also defended using dollar-based loss data, saying it better shows the financial and emotional stress investors feel during sharp declines.
The Kobeissi Letter also pointed out another first: Bitcoin recorded a single-day drop of more than $10,000. Even during earlier high-liquidation events, prices did not fall this much in one day. This has led to speculation that a large leveraged trader was forced to exit, which likely accelerated the fall and exposed how risky large positions can be.
How Much Lower Can Bitcoin Go?
Crypto researcher Sherlock highlighted a long-term pattern in Bitcoin’s history. Each bear market has resulted in smaller losses than the previous one, as the asset has matured. Bitcoin fell about 93% in 2011 and around 77% in 2022. If this trend continues, the current cycle could see a drop of roughly 70% from the $126,000 peak, pointing to a possible bottom near $38,000.
This outlook suggests that while the recent sell-off has been painful, it may not be the final low and a quick recovery should not be taken for granted.
Never Miss a Beat in the Crypto World!
Stay ahead with breaking news, expert analysis, and real-time updates on the latest trends in Bitcoin, altcoins, DeFi, NFTs, and more.
FAQs
Why is Bitcoin price down today?
Bitcoin is down due to low market liquidity and forced selling from leveraged positions. With fewer buyers, sell orders moved prices sharply lower.
How big were the losses in the recent Bitcoin sell-off?
On February 5, investors realized losses of roughly $3.2 billion in a single day—the highest daily loss ever recorded, exceeding losses seen during the Terra-Luna and FTX collapses.
Could Bitcoin’s price drop further from here?
Based on historical bear market patterns, Bitcoin could potentially fall around 70% from its $126,000 peak, suggesting a possible bottom near $38,000, though market conditions remain fluid.
Was there a specific event that caused Bitcoin’s latest sell-off?
No single news event triggered it. The drop appears driven by market structure, leverage unwinding, and fragile liquidity conditions.
Strategy, formerly known as MicroStrategy, has reported a staggering fourth-quarter net loss of roughly $12.6 billion, ranking among the largest quarterly losses ever recorded by a U.S. public company.
The hit was driven almost entirely by unrealized losses on its Bitcoin holdings, underscoring how deeply the firm’s balance sheet is tied to crypto market movements rather than its underlying software business.
Crypto Market Crash Erases Billions in Paper Gains
The loss followed one of Bitcoin’s sharpest drawdowns in recent history. During the quarter, Bitcoin plunged nearly 15% intraday, sliding from around $73,100 to a low of $62,400. This move pushed Bitcoin below Strategy’s average acquisition price of roughly $76,000, flipping the firm’s position from massive unrealized gains into deep losses. Just a few months earlier, Strategy was sitting on more than $30 billion in paper profits when Bitcoin surged to record highs.
Strategy Stock Feels the Pressure
The market reaction was swift. Strategy shares dropped sharply after the earnings release and continued falling in after-hours trading. Over the past year, the stock has been down more than 70%, erasing much of the premium investors once assigned to the company’s aggressive Bitcoin accumulation strategy. Since its November 2024 peak, the stock is now down nearly 80%, highlighting how quickly sentiment has turned.
Bitcoin Exposure Magnifies Financial Impact
Strategy remains the largest corporate holder of Bitcoin globally, with more than 713,000 BTC on its balance sheet as of early February. Much of this position was accumulated during the late-2024 bull run, when Bitcoin briefly climbed above $120,000. With prices now well below those levels, unrealized losses have ballooned, making quarterly results highly sensitive to Bitcoin’s volatility.
Saylor Stays Defiant as Critics Circle
Despite the historic loss, Executive Chairman Michael Saylor showed no sign of wavering, posting a brief “HODL” message on X. However, critics have grown louder. Investors like Michael Burry have warned that sustained declines in Bitcoin could trigger cascading losses for corporate holders, reviving long-standing concerns around leverage and exposure to non-yielding assets.
Strategy is not alone. BitMine Immersion Technologies is facing roughly $8.2 billion in unrealized losses after Ethereum slipped to around $1,930, well below its average purchase price of $3,826. The company holds about 4.29 million ETH but has cushioned the blow by staking over 2.9 million ETH, generating around $188 million in annual yield, while maintaining strong cash reserves and no debt.
Volatility, Not Failure
Amid the turmoil, Anthony Pompliano offered a broader perspective, arguing that Bitcoin’s volatility is a feature, not a flaw. He pointed out that repeated 50–85% drawdowns have defined Bitcoin’s history, yet the network has continued to operate flawlessly for over a decade. While critics celebrate downturns, long-term holders remain focused on scarcity, betting that short-term pain is temporary in Bitcoin’s long-term growth story.
Never Miss a Beat in the Crypto World!
Stay ahead with breaking news, expert analysis, and real-time updates on the latest trends in Bitcoin, altcoins, DeFi, NFTs, and more.
FAQs
How much Bitcoin does MicroStrategy own, and why does it matter?
MicroStrategy holds over 713,000 Bitcoin, making it the world’s largest corporate holder. This massive stake makes its financial results extremely sensitive to Bitcoin’s price volatility.
Did MicroStrategy sell its Bitcoin after the loss?
No. Executive Chairman Michael Saylor signaled a continued “HODL” strategy, indicating the company does not plan to sell its Bitcoin despite the paper losses.
Are other companies facing similar crypto losses?
Yes. For example, BitMine faces about $8.2 billion in unrealized losses on its Ethereum holdings, though it offsets some risk through staking rewards and strong cash reserves.
Is Bitcoin’s volatility a sign it’s failing?
No. Analysts note Bitcoin’s history is defined by large drawdowns, yet the network operates flawlessly. Long-term investors view volatility as a temporary feature of its long-term growth story.
In contrast, the Decred (DCR) price has shown strong relative strength. The token surged over 30%, reaching levels above $24.65in the past few hours, even as market sentiment remained weak.
The rally appears driven by a clean technical breakout, placing DCR among the top-performing assets over the past seven days. Price has moved above the key resistance zone between $22.17 and $23.40, a range that previously capped upside attempts.
A daily close above this zone would likely validate bullish continuation toward the next target near $30. The key question now is whether DCR can maintain momentum and continue decoupling from the broader bearish market structure.
Following the breakout, Bollinger Bands have started to expand, pointing to rising volatility as buying activity picks up. At the same time, On-Balance Volume (OBV) has moved sharply higher, indicating that more volume is flowing in on up-moves than on declines—often a sign of accumulation rather than short-term speculation.
With demand building alongside improving volume structure, DCR appears positioned for a potential move toward the $30 level. However, for this bullish setup to remain valid, the price needs to secure a daily close above the immediate resistance zone between $22.12 and $23.51. Failure to do so could delay further upside and keep the Decred (DCR) price vulnerable to short-term pullbacks.
Bitcoin has broken below the major trendline that supported the entire bull run.
Crypto analyst Nathan Sloan of Investing Made Simple laid out the key levels to watch and why the 4-year cycle suggests this crash may follow a familiar pattern.
After failing to reclaim $100,000, which flipped from support to resistance, Bitcoin flushed down past $70,000 and is currently trading around $65,845.
But this sell-off isn’t limited to crypto. Gold is correcting sharply, silver dropped 10% in a single day, and the NASDAQ is pulling back as well.
Bitcoin 4-Year Cycle Points to a Familiar Pattern
Sloan highlighted that averaging the 2017 and 2021 cycle tops closely predicted the exact market top this cycle. That makes the 4-year cycle harder to dismiss as a coincidence.
Bitcoin has now posted five consecutive red months since October. That has only happened once before, during the 2018 bear market, which saw six in a row. A relief rally is statistically overdue since Bitcoin has never posted more than six consecutive negative months.
Historically, cycle bottoms have landed around October.
Bitcoin Buying Levels to Watch
Sloan outlined four price zones he considers important.
The $70,000 level, the previous all-time high from the 2021 cycle, has already been broken. Bitcoin is now trading well below what Sloan considers a strong long-term entry zone.
The $63,000 level, now less than 4% below current prices, would mark a 50% drawdown from the all-time high. At that level, simply returning to the prior high would mean a 2x return.
The 200-week moving average sits just below $60,000 and is rising. Sloan flagged this as a historically reliable level. Every major crypto crash has either touched or broken below this line before recovering.
“If you can get in between 60 and 70, if you can ignore all the pain and the fear over the next 3 to 6 months, you’ll likely do very, very well,” he said.
Fed Policy Could Decide What Happens Next
Sloan sees monetary policy as the strongest macro correlator for crypto. He compared the current setup to 2019, the last time the Fed pivoted, which saw a roughly 53% drawdown before recovery.
His personal plan is to buy back in around the $63,000 level within the next month or two, accepting the risk of being early.
“The only downside for me is that I might be too early. So yes, Bitcoin could go sideways for months. It could even come down a little bit more,” he said.
Bitcoin is currently trading at: $ 65,897.09558022
Predictions suggest BTC to hit $150K to $250K before 2026 ends.
Long-term forecasts estimate BTC prices could hit $900K by 2030.
The Bitcoin price prediction 2026 is becoming increasingly bullish as the 2025’s second half comes to a close soon, with all-time highs of $125K reached this year as the highest point.
As a wave of bullish momentum sweeps into the market, investors and traders are intrigued by its next stop.
The year was marked by optimism, driven by massive inflows into spot Bitcoin ETFs, skyrocketing institutional adoption, clearer regulations, and unwavering political support. There were several macro downturns, too, that capped BTC’s uptrend, like trade tariffs and wars.
Despite that, BTC holds its level, making it now seen as “a hedge against inflation” more than ever. Major players, including MicroStrategy, Metaplanet, and several other entities, are boldly adding BTC to their balance sheets, signaling unshakable adoption and confidence in its future.
The market enthusiasm is at a fever pitch, investors are buzzing with questions: “Can Bitcoin sustain its meteoric rise?” and “Will it redefine the financial landscape in the next five years?” This Bitcoin price prediction 2026 – 2030 dives deep into the trends driving this historic rally. Read on for the full scoop.
Coinpedia’s BTC Price Prediction 2026
In December 2025, Bitcoin faced constant resistance, leading to a decline. By early February, it fell below the 200-day EMA, and now approaching $65K. If it drops below that, it may reach $53K in Q1 2026.
What is the Bitcoin price prediction for today?
The BTC price may range between $60,074.20 and $71,584.86 today.
On February 5, 2026, Bitcoin (BTC) dropped sharply below $70,000, marking its lowest point in 15 months. This decline is due to a “risk-off” sentiment in global markets, large-scale liquidations of leveraged positions, and reduced institutional demand.
The market reacted to the potential appointment of Kevin Warsh as Federal Reserve Chair, leading to expectations of tighter monetary policy and a larger U.S. Dollar Index (DXY), which increased above 97.5, lessening the attractiveness of riskier assets like Bitcoin.
This situation triggered forced liquidations and a decline in demand for Spot Bitcoin ETFs. The Crypto Fear & Greed Index fell to 11, signaling “Extreme Fear” among investors. Analysts suggest that if Bitcoin cannot hold the $65,000 support level, it may drop further, potentially reaching targets of $60,000 or lower.
Bitcoin Price Prediction 2026
In December 2025, the Bitcoin price retested the lower border of the ascending wedge pattern as resistance, with a slight bullish attempt that proved to be a fakeout, leading to a deeper decline. This is exactly witnessed in January when the fall worsened to $80738 January end,and early February even penetrated the 200-day EMA band and is approaching $65Ksupport area. Itis expected that if BTC/USD doesn’t take support and keeps falling, then odds suggest that beneath $65K, the Q1 2026 could see price falling towards $53K.
Month
Potential Low
Potential Average
Potential High
2026
$60,000-$95,000
$100,000 – $108,000
$115,000 – $118,000
Bitcoin Price On-chain Outlook
The on-chain data has showed strong accumulation in 2025 and sustained declines in exchange reserves. Crucially, this confirms the elevated institutional commitment, which is evident even in the US Spot ETFs data figures and the corporate adoption also reinforces this trend, with public company holdings nearly doubling since the start of the year.
Ultimately, a Bitcoin price prediction 2025 suggests that the future potential depends strictly on how sustained buying demand remains, as well as geopolitical stability and regulatory clarity.
If the current bullish sentiment persists, the BTC price is expected to reach a cycle high target of $150,000. Conversely, should global uncertainty intensify and sentiment turn negative, the downside risk is projected to find strong support around the $70,000 mark.
The BTC price range in 2026 is expected to be between $150K and $230K.
BTC Price Prediction 2027
Subsequently, the Bitcoin price range can be between $170K to $330K during the year 2027.
Bitcoin Predictions 2028
With the next Bitcoin halving, the price will see another bullish spark in 2028. Specifically, as per our Bitcoin Price Prediction, the potential BTC price range in 2028 is $200K to $450K.
BTC Price 2029
Thereafter, the BTC price for the year 2029 could range between $275K and $640K.
Bitcoin Price Prediction 2030
Finally, in 2030, the price of Bitcoin is predicted to maintain a positive trend. Indeed, the BTC price is expected to reach a new all-time high, ranging between $380K and $900K.
Based on the historic market sentiments and trend analysis of the largest cryptocurrency by market capitalization, here are the possible Bitcoin price targets for the longer time frames.
Year
Potential Low ($)
Potential Average ($)
Potential High ($)
2031
$540,830.43
$901,383.47
$1,261,936.86
2032
$757,162.60
$1,261,936.86
$1,766,711.60
2033
$1,059,945.80
$1,766,711.60
$2,473,477.75
2040
$5,799,454.28
$9,665,757.13
$13,532,059.98
2050
$161,978,188.65
$269,963,647.74
$377,949,106.84
Bitcoin Prediction: Analysts and Influencers’ BTC Price Target
As per the Bitcoin price forecast by Blockware Solutions, the price of 1 BTC could hit $400,000
Cathie Wood predicts the price of BTC to achieve the $3.8 million mark by 2030.
Michael Saylor-led MicroStrategy expects Bitcoin to soar beyond $13 million by 2045.
ARK Invest has increased its bullish BTC price target to $2.4 million by 2030.
Never Miss a Beat in the Crypto World!
Stay ahead with breaking news, expert analysis, and real-time updates on the latest trends in Bitcoin, altcoins, DeFi, NFTs, and more.
FAQs
What are the biggest risks to Bitcoin’s price in 2026?
Major risks include global recessions, tighter crypto regulations, declining liquidity, or a sustained breakdown below key support levels.
How much will BTC be worth in 2030?
Bitcoin price forecasts for 2030 range from $380K to $900K, driven by scarcity, long-term adoption, and expanding institutional participation.
What will be the price of Bitcoin in 2050?
While uncertain, many long-term projections suggest Bitcoin could exceed $1 million by 2050 if it becomes a global store of value.
Is Bitcoin still a good hedge against inflation in the long term?
Bitcoin’s fixed supply makes it attractive as an inflation hedge, especially during currency debasement and long-term economic uncertainty.
Marathon Digital Holdings, one of the largest publicly traded Bitcoin mining companies, has recently executed a significant on-chain movement of Bitcoin worth roughly $87 million amid a broader sell-off in crypto markets. The activity, captured by on-chain analytics firm Arkham,…
Secure Digital Markets sent $1M in Bitcoin to Kraken over Lightning, showcasing near-instant, low-fee settlement for institutional-size payments. Secure Digital Markets (SDM) completed a $1 million Bitcoin transaction via the Lightning Network on January 28 in a pilot project with…
CZ says Binance is working with governments to launch local-currency stablecoins, widening stablecoin options beyond dollar-pegged tokens. Binance founder Changpeng Zhao announced the cryptocurrency exchange is collaborating with multiple countries on issuing stablecoins pegged to local currencies, according to a…
Top AI-focused cryptos like TAO, NEAR, ICP, and RENDER faced losses surpassing 20% as investor demand in the sector fell amid concerns surrounding Big Tech’s growing bets on AI infrastructure. According to data from CoinGecko, Bittensor (TAO), the largest AI-focused…
Veteran trader Peter Brandt said Bitcoin could be approaching a potential downside floor, arguing that past bear market patterns suggest losses may be limited from current levels. “If Bitcoin digs into the banana peel as deeply as in past bear…
Bitcoin price entered Friday under pressure as $2.1 billion in options contracts approach expiry. Bitcoin is facing another key test as a large batch of derivatives contracts reaches maturity. Bitcoin options worth about $2.1 billion are set to expire at…
Binance has boosted its Secure Asset Fund for Users by adding $233 million in Bitcoin, acquiring 3,600 BTC, and bringing total holdings to 6,230 BTC, worth approximately $404 million. This marks the third significant purchase in days, totaling nearly $430 million. The move is part of a strategy announced on January 30 to gradually convert SAFU reserves from stablecoins into Bitcoin amid market dips, reflecting strong confidence in BTC as a long term reserve asset.
The cryptocurrency market has faced heavy selling pressure in recent weeks, with Bitcoin briefly dropping to around $60,000 before recovering slightly. Most major altcoins, including Ethereum and Solana, have also fallen. However, despite the overall decline, a few tokens are moving in the opposite direction, drawing investor attention.
Two projects in particular: Hyperliquid’s HYPE token and Canton’s CC token, have shown little gains while much of the market remains in the red.
Hyperliquid (HYPE) rises on strong platform activity
Hyperliquid’s native token, HYPE, has surged roughly 50% over the past two weeks, standing out during a period when many cryptocurrencies have dropped.
The token’s rise appears to be driven by increased activity on the Hyperliquid trading platform. The exchange recently captured a measurable share of global silver trading volume shortly after listing the asset, boosting trading demand. Since all trading fees on the platform are paid in HYPE, higher trading activity directly increases demand for the token.
Institutional attention has also supported sentiment, with major asset managers reportedly exploring exchange-traded fund (ETF) filings linked to the project. In addition, new integrations within other blockchain ecosystems have expanded trading access, improving liquidity and visibility.
A recent platform upgrade allowing traders to hedge positions using shared margin has further increased trading efficiency, leading to higher trading volumes, rising open interest, and stronger daily platform revenues — all factors that helped push the token higher even as the broader market declined.
Canton (CC) gains as institutional adoption grows
Another token outperforming the market is Canton’s CC token, which recently reached a new all-time high and climbed more than 30% in recent weeks.
Unlike many retail-focused crypto projects, Canton is designed primarily for institutional finance. Several large financial institutions are already building on or testing the network, including major global banks and financial infrastructure providers. The platform is also being used in tokenization initiatives such as digital government securities, strengthening its institutional relevance.
A driver behind the token’s performance is its supply-reduction mechanism. Institutions using the network’s global synchronizer system must burn CC tokens during transactions, steadily reducing circulating supply. With hundreds of thousands of transactions occurring daily, this burn mechanism has created additional upward pressure on price, especially as institutional activity continues to grow.
XRP price slipped lower today as selling pressure across the crypto market picked up pace. The move followed Bitcoin’s drop to around $60,000, which triggered another wave of risk reduction and forced liquidations. In the latest flush, more than $1.85 billion in long positions were wiped out, setting a cautious tone for large-cap altcoins, including XRP.
There was no XRP-specific trigger behind the decline. Instead, traders stepped back as volatility stayed high and dip buying remained weak. With leverage still unwinding and confidence shaken, short-term bounces in XRP have struggled to hold. For now, price action remains tied to broader market stability, with traders waiting for signs of exhaustion in selling before positioning for any meaningful recovery.
Current XRP Price Position Today
XRP extended its decline over the past 24 hours, dropping 9.77% to trade near $1.30. The sell-off intensified after the token failed to hold the $1.50 support, triggering a sharp pullback during the previous trading session.
The downside move dragged XRP as low as $1.13, a level not seen even during the October 2025 sell-off, highlighting the severity of the breakdown. As the price slipped below $1.50, trading volume began to rise after remaining relatively flat near $4 billion since the start of the month.
Volume spiked sharply as XRP marked its lows, surging past $10 billion and later climbing above $13 billion as the price rebounded. This increase in activity suggests bullish participation near the lows, with buyers stepping in to defend the range. The rebound has pushed XRP back toward $1.30, where it is now attempting to stabilize.
However, upside momentum remains capped. Strong overhead resistance continues to limit recovery attempts, keeping bearish risks firmly in play despite the bounce from recent lows.
XRP Price Analysis for this Week—Can XRP Still Plunge Below $1?
XRP went through a similar sell-off in October 2025, when long liquidations crossed $612 million. The current pullback, however, appears technically deeper, even though long liquidations so far remain below $60 million.
This imbalance suggests the weakness is being driven less by forced exits or external shocks and more by a clean technical breakdown and fading trader confidence. With liquidation pressure still relatively contained, sellers continue to control price action, leaving XRP vulnerable to further downside. Unless buyers step in decisively, the token remains exposed to a move below the $1.00 level in the near term.
As seen on the chart, XRP has rebounded from the $1.05–$1.15 range, a zone where buyers previously stepped in during November 2023 and pushed the price toward a peak near $2.91. That historical reaction highlights the importance of this demand area.
However, the current rebound looks different. Despite visible buying interest, XRP has struggled to move decisively higher and remains pinned close to support. More importantly, open interest continues to decline, suggesting the move lacks strong bullish backing.
The rebound appears to be driven largely by short liquidations, rather than fresh long positions entering the market. As contracts continue to close even as price ticks higher, it signals ongoing deleveraging and a lack of conviction among traders. For now, $1.05 remains a critical line of defense. A clean break below this level could open the door to a deeper correction.
Conclusion
XRP’s recent rebound offers short-term relief, but the underlying signals remain mixed. While buyers have defended the $1.05–$1.15 zone, the lack of follow-through and falling open interest suggests the recovery is being driven more by short covering than genuine demand. Until fresh long positions enter the market and momentum improves, the bounce risks fading. For now, XRP remains at a critical juncture, where holding key support could stabilise price, but a breakdown would likely trigger renewed downside pressure.
Tether has made a $150 million strategic investment in precious metals platform Gold.com, acquiring a roughly 12% stake as part of a broader push to expand access to both tokenized and physical gold. The investment is aimed at strengthening XAU₮,…
US Treasury Secretary Scott Bessent says banks and crypto may begin to offer similar products, and pledged to prevent deposit flight concerns that are stalling a key crypto bill.
Japan’s Metaplanet will continue buying Bitcoin even as the crypto market downturn has weighed heavily on the company’s shares. As Bitcoin price touched $60,000 around the Asia open, Metaplanet CEO Simon Gerovich took to X to reaffirm the company’s decision…
BTC, ETH, BNB, and XRP prices continued their freefall on Friday, triggering over $2.5 billion in liquidations across leveraged markets. According to data from crypto.news, Bitcoin (BTC) price fell 18% from Thursday’s high of $73,639 to an intraday low of…
BlackRock’s iShares Bitcoin Trust ETF has hit a new all-time high in daily trading volume as the bellwether cryptocurrency posted one of its largest intraday drops on Thursday. As noted by Bloomberg ETF analyst Eric Balchunas, IBIT reportedly “crushed its…
U.S. Senator Cynthia Lummis said banks should embrace digital assets rather than resist them, arguing that cryptocurrencies and stablecoins offer new products and revenue opportunities for traditional financial institutions. In a Fox News interview shared on X, the Wyoming Republican…
Hyperliquid price has stayed resilient above key support levels despite a $340 million token unlock and wider crypto market weakness. Despite a decline in the overall cryptocurrency market, Hyperliquid is up 2.9% on the day, trading at $34.80 at the…
Bitwise Asset Management has filed a Form S-1 registration statement with the U.S. Securities and Exchange Commission (SEC) for a spot Uniswap ETF, marking a major step toward a regulated exchange-traded product tied directly to the UNI token. Uniswap ETF…
Crypto markets remain under pressure as Bitcoin struggles to regain footing, with downside risks increasingly centered around the $50,000 level. Risk appetite has thinned, ETF outflows have accelerated, and trader confidence across majors like Bitcoin and Ethereum continues to erode. XRP has not been immune to the sell-off. The price has moved lower alongside the broader market, reflecting its correlation with Bitcoin during risk-off phases. However, beneath the surface, the structure of XRP’s price decline, and the behaviour of traders around it tells a different story.
While Bitcoin appears to be grappling with sentiment capitulation, XRP’s on-chain and positioning data suggest the asset may be undergoing a controlled reset rather than a breakdown. That divergence raises a key question for the coming weeks: If Bitcoin price falls further, is XRP price better positioned to recover first?
Sentiment Divergence: Bitcoin Capitulates While XRP Holds Its Ground
Recent data highlights a growing emotional gap between Bitcoin and XRP traders. Following last week’s sharp drawdown, sentiment toward Bitcoin has turned extremely bearish, a level typically associated with fear-driven selling and loss of conviction among retail participants. Ethereum sentiment has tracked a similar path, reinforcing the idea that broader market confidence remains fragile. XRP, however, is showing a more constructive profile.
Sentiment has turned extremely bearish toward Bitcoin and Ethereum following crypto's major downswing this past week. XRP is seeing a more optimistic outlook among traders.
As we know, markets move opposite to the fear & greed of retail traders. There remains a strong… pic.twitter.com/1U23pQ48D6
Despite price weakness, sentiment around XRP remains comparatively optimistic. This does not signal immediate bullish momentum, but it does indicate that traders are not rushing to abandon positions. Historically, this type of sentiment divergence often emerges near local bottoms, especially when broader markets are still dominated by fear. Markets tend to move against the prevailing emotional bias of retail traders. With Bitcoin sentiment approaching extremes, XRP’s relative resilience suggests it may be closer to sentiment exhaustion than escalation, a condition that often precedes stabilization or short-term relief rallies.
The ETF Story the Market Isn’t Talking About
While crypto prices remain under pressure, ETF flow data is quietly sending a message that doesn’t fully match the fear visible on Bitcoin’s chart. As Bitcoin slid lower, BTC spot ETFs saw roughly $258 million in net outflows, extending a clear pattern of institutional de-risking. Ethereum followed the same path, with around $72 million in outflows, reinforcing the view that large allocators are cutting exposure to high-beta majors rather than rotating deeper into risk.
XRP, however, told a different story. Despite trading lower on the day, XRP-focused ETFs recorded net inflows of about $1.28 million, a modest figure, but notable in a market where capital was largely exiting elsewhere. More telling was activity: XRP ETF trading volume surged to nearly $79.2 million, pointing to active positioning rather than passive holding. Bitwise led the flow with roughly $40.6 million in volume, alongside participation from Franklin Templeton and Canary Capital. The takeaway isn’t outright bullishness but rotation, not abandonment. While Bitcoin and Ethereum absorb most of the selling pressure, XRP appears to be quietly holding institutional interest, even as the broader market remains cautious.
XRP Price Prediction: Can XRP Hold $1.30 and Turn the Trend Back Up?
XRP’s recent sell-off has been sharp, but it has now brought price into a zone that traders have been watching closely for weeks. The $1.30 region is not just a psychological level, it aligns with a broader demand area that previously acted as a springboard during earlier corrective phases. The current decline appears driven more by broader market weakness and Bitcoin-led risk aversion than by XRP-specific deterioration.
On the chart, XRP has unwound from its rising structure and slid into this demand pocket after a steady sequence of lower highs. If XRP manages to hold above $1.30 on a daily closing basis, the structure opens the door for a relief move back toward the $1.45–$1.50 zone, where prior breakdowns and short-term supply are stacked. A successful reclaim of that range would shift the narrative from correction to stabilization, with $2.00 coming back into focus as a medium-term objective rather than a distant upside. Meanwhile, a clean break of $1.20 would expose XRP to a deeper downside toward the $1.15–$1.20 region, where the next meaningful demand sits.
Bitcoin price recorded one of its sharpest single-day declines in recent years, a move not seen since the FTX collapse. The largest crypto crashed to an intraday low near $60,000, marking its first visit to this level since October 2024 and fully erasing gains made after the US presidential election.
The downside pressure quickly spread across the broader crypto market. Ethereum slipped below $1,800, while Solana broke under $70 for the first time since December 2023. Dogecoin also plunged below the $0.10 mark, intensifying risk-off sentiment and triggering panic across retail-heavy tokens.
With key supports breached across major assets, traders are now questioning whether Bitcoin and the wider crypto market have officially transitioned from a correction into a full-fledged bear market.
Top Reasons Why Bitcoin Price Dropped to $60,000
Since Bitcoin slipped below the psychological $100,000 level, market sentiment has shifted sharply. Both traders and institutions appear increasingly cautious, with confidence fading faster than in previous pullbacks.
Unlike past market crashes, triggered by systemic shocks such as the ICO bubble, COVID-led liquidity stress, the Terra ecosystem collapse, or the FTX failure, the current decline lacks a single catastrophic event. Instead, the sell-off reflects a technical breakdown in market structure, compounded by weakening conviction and reduced risk appetite among participants.
Massive Long Liquidations Took Control
Over the past few days, the crypto market has been under intense pressure, with liquidation numbers repeatedly crossing $1.5 billion to $2 billion. The latest sell-off was especially brutal, wiping out over $1.85 billion in long positions, making it the second-largest liquidation event of 2026, after the $2.4 billion flush seen on January 31.
The impact was widespread and painful. More than 500,000 traders were forced out of their positions as leverage unravelled across exchanges. The largest single liquidation—a Bitcoin long worth more than $12 million—was recorded on Binance, highlighting just how exposed even large players were to the downside move.
Bitcoin Price Dropped Below Key Technical Support
Bitcoin’s fall to $60,000 was driven by a clear technical breakdown rather than a headline-driven shock. The sell-off accelerated after BTC decisively lost the $65,000–$62,000 support zone, an area that had held multiple pullbacks over the past few weeks.
Once Bitcoin slipped below $62,000, stop-loss orders clustered in this range were triggered rapidly. This led to a sharp increase in sell pressure and opened the way to the next major liquidity pocket near $60,000, where the price briefly stabilised.
The breakdown was further confirmed as Bitcoin dropped below key trend indicators. BTC lost support at both the 50-day and 100-day moving averages, levels closely watched by swing traders and short-term institutions. The failure to reclaim these averages turned them into immediate resistance, strengthening the bearish bias.
Weak Dip Buying at Key Levels—Why Buyers Stepped Back
One thing that stood out during Bitcoin’s slide to $60,000 was how quietly buyers stepped back. When the price fell through the $65,000–$62,000 zone, there was no strong rush to buy the dip, unlike earlier pullbacks. Any short-term bounce was quickly sold, showing that traders were more focused on cutting risk than building new positions.
With volatility high and liquidations piling up, many chose to stay on the sidelines and wait for clarity. That lack of conviction left Bitcoin exposed, allowing sellers to stay in control and push the price down toward the $60,000 level.
The Bottom Line—Has the Crypto Market Officially Entered a Bear Market?
The recent sell-off has clearly changed the mood across the crypto market. Bitcoin losing the $60,000 level, repeated billion-dollar liquidation events, broken supports, and a lack of strong dip buying suggest this move is more serious than a normal correction. Confidence has weakened, risk appetite has dropped, and traders are no longer quick to step in on dips.
Still, calling this an official bear market may be too early. Bear markets usually show prolonged weakness and repeated failures to recover key levels, not just a sharp breakdown. Right now, the market feels stuck in between—no longer bullish, but not fully broken either.
What happens next matters most. If Bitcoin fails to reclaim lost levels and selling pressure continues, this phase could easily turn into a full-fledged bear market. For now, crypto stands at a decisive crossroads.
Bitcoin miner Marathon Digital Holdings has transferred nearly $87 million worth of Bitcoin to major crypto service firms, sparking concerns about fresh selling pressure.
The move comes as Bitcoin trades around $64,800 after a sharp drop, adding to fears that miners may be increasing sell-offs.
Marathon Digital Bitcoin Transfer Signals Possible Selling
On February 6, Marathon Digital Holdings moved a total of 1,318 BTC valued near $87 million to institutional platforms, including Two Prime, BitGo, and Galaxy Digital.
These are well-known institutional platforms that provide custody, trading, and liquidity services. When a mining company sends coins to such firms, it often signals preparation for structured selling, collateral use, or treasury rebalancing.
However, the transfers happened within roughly a 10-hour window while Bitcoin traded around the mid-$60,000 range after a sharp daily drop.
Marathon Current Bitcoin Holdings
Despite the transfer, Marathon still holds about 52,850 BTC worth around 3.42 billion, keeping it among the top corporate Bitcoin holders worldwide. This shows the company is adjusting part of its treasury, not exiting its position.
Still, the timing adds to short-term caution. Bitcoin is already down nearly 10% in 24 hours, and broader sentiment is fragile. When miner flows rise during a falling market, traders tend to expect more volatility.
Miner & Whale Continue to Sell Bitcoin
One major pressure is coming from Bitcoin miners. The average mining cost has risen above $87,000, while Bitcoin trades near $65,402, forcing many miners to sell at a loss. CryptoQuant data shows miner reserves have dropped to 1.806 million BTC, confirming rising sell-offs.
Meanwhile, selling is not limited to miners. Santiment data reveals that Bitcoin whales and large holders are also reducing positions.
Wallets holding between 10 and 10,000 BTC now control just 68.04% of total supply, a nine-month low. These large holders have sold about 81,068 BTC in the last eight days alone.
The crypto market is facing renewed pressure as prices and investor confidence continue to weaken. The total cryptocurrency market capitalization has fallen by about $2 trillion from its October 2025 peak of $4.38 trillion, according to data from CoinGecko. As…
XRP price currently stands at $2.99, with a market capitalization of $179.79 billion. Analysts and AI forecasts alike suggest that XRP could reach $5.05 by the end of 2025. Long-term XRP price predictions also place it as high as $26.50 by 2030, with an ultra-bullish target of $526 by 2050.
Ripple (XRP) remains one of the top five crypto assets in the world, gaining traction as institutional adoption ramps up and its prolonged legal battle approaches resolution. Since President Trump’s return to office, XRP has seen a resurgence in on-chain activity, investor sentiment, and even XRP ETF approved turned it into a bluechip asset.
Now, making this the most ideal time for XRP price prediction 2026-2030 to be in more focus. Read this to know in depth what’s coming next in XRP.
XRP is currently falling towards $1.05 after breaking $1.41 due to negative macro pressures. The $1.05 level is a key support area; a rebound could see XRP rise to $2.0 or its all-time high of $3.66 in Q1 2026, but a drop below $1.05 could lead to further declines.
XRP Price Prediction For February 2026
A long-term declining channel broke in early February, and that even breached $1.41. Now, the nearest support is near $1.05, where a consolidation can be expected to rebuild demand. The two key resistances are now $1.63 and $1.41; they need to be flipped in February, or else $1.05 could breach too if it doesn’t recover.
XRP Price Prediction 2026
On the weekly chart, XRP’s price shows significant weakness and is slipping towards $1.05 after breaking $1.41 support in early February. But this selling pressure is due to worsening macro factors, which are pushing crypto markets deeper, and XRP is affected by it in early February.
However, $1.05 is a FRVP tool-based high-intensity support area that has a history of supporting rallies and could act as a reversal point in the remaining days of Q1 2026.
If a reversal comes, the XRP price might recover to $2.0 in Q1 2026 or even reach its ATH of $3.66. But $1.05 is crucial to sustaining price action; otherwise, the drop could extend further.
Year
Potential Low
Potential Average
Potential High
2026
$1.75
$3.45
$5.05
XRP Onchain Outlook
The XRP Ledger: DEX Transaction Count chart indicates a significant bullish divergence starting from May 2025. While the price is consolidating, the activity in decentralised exchanges (DEX) is increasing sharply.
The high transaction volume, which includes both orders placed and cancelled, shows that experienced traders are actively positioning themselves and adding liquidity in anticipation of a future price movement.
As a result, this on-chain metric suggests that the market is preparing for a powerful and sustainable rally in the XRP price ahead.
Also, the biggest fact right now in December is that altcoin liquidity is drying up. Projects securing new liquidity channels like ETFs have a better chance of long-term survival, and since November 14th, the XRP ETF has been seeing positive inflows consistently, despite what price action is, and so far, Cumulative Total Net Inflow has crossed $756 million, while total net assets are worth $723.05 million, by December 1st.
Ripple XRP Price Prediction 2026 – 2030
Year
Potential Low ($)
Potential Average ($)
Potential High ($)
XRP Price Prediction 2026
5.50
6.25
8.50
Ripple Price Prediction 2027
7.00
9.0
13.25
XRP Price Prediction 2028
11.25
13.75
16.00
XRP Price Prediction 2029
14.25
16.50
21.50
XRP Price Prediction 2030
17.00
19.75
26.50
This table, based on historical movements, shows XRP price prediction 2030 to reach $26.50 based on compounding market cap each year. This table provides a framework for understanding the potential XRP price movements. Yet, the actual price will depend on a combination of market dynamics, investor behavior, and external factors influencing the cryptocurrency landscape.
Based on historic price sentiments and XRP’s rising popularity, here are the XRP future price projections beyond 2030, where Ripple price forecasts suggest that it has become more speculative. Therefore, assuming continued adoption and dominance, XRP may see aggressive valuations in the decades ahead.
Year
Potential Low ($)
Potential Average ($)
Potential High ($)
2031
25.00
29.50
35.25
2032
31.50
36.75
41.25
2033
35.75
42.25
47.75
2040
97.50
135.50
179.00
2050
219.25
331.50
526.00
A look at this table, highlights the XRP price prediction 2040 and XRP price prediction 2050 potential high ambitious targets but this reflect a transformative vision for XRP as a dominant global payment player.
Market Analysis
Firm Name
2025
2026
2030
Changelly
$2.05
$3.49
$17.76
Coincodex
$2.38
$1.83
$1.66
Binance
$2.16
$2.27
$2.76
Never Miss a Beat in the Crypto World!
Stay ahead with breaking news, expert analysis, and real-time updates on the latest trends in Bitcoin, altcoins, DeFi, NFTs, and more.
FAQs
What will XRP be in 2026 price prediction?
XRP price predictions for 2026 range between $3.45 and $5.05, depending on ETF inflows, market sentiment, and sustained demand above key levels.
What will XRP be worth in 2030?
By 2030, XRP forecasts suggest a potential range of $17 to $26.50 if adoption grows and Ripple maintains its role in global payments.
How much will 1 XRP be worth in 2040?
Long-term projections estimate XRP could trade between $97 and $179 by 2040, assuming continued network usage and institutional integration.
Is XRP a good investment going into 2026?
XRP’s outlook for 2026 depends on ETF inflows, broader crypto sentiment, and its ability to hold key support levels above $2.
Price predictions for 2026 range from $400 to $600.
Long term outlook suggests gradual growth potential to approach $1200 by 2030.
Aave (AAVE) is a decentralized finance protocol built on Ethereum that facilitates permissionless lending and borrowing through smart contracts. After witnessing a strong expansion in the previous market cycle, AAVE entered a prolonged correction phase, with price gradually retracing from its earlier highs. Throughout 2025, AAVE remained in a consolidation structure, reflecting a period of market digestion rather than trend continuation. While short-term momentum has cooled, the broader technical structure suggests that AAVE may be transitioning into a new accumulation phase.
As volatility contracts and price holds above long-term demand levels, attention is now shifting toward whether 2026 can trigger the next major price discovery cycle.
AVAX dropped to $9 after facing resistance at $15 in January. A recovery is possible, with high expectations for Q1 2026. Based on recovery odds, experts are targeting $20 with even potential to reach $28, and if it breaks that, $44 by mid-year. If $28 holds, consolidation may continue.
Avalanche (Avax) Price Prediction 2026
In January, the AVAX price faced rejection from $15 and slipped to $9 support zone in early February. Since Q1 still has many days left, a recovery remains an option, as it has reached a demand area of $9 that ignited the late 2024 rally. Sustained demand here could signal a reversal.
Now, expectations for its recovery, which are gaining momentum in Q1 2026, are significantly higher. Now, it appears AVAX may not have performed in 2025 to the present time, but it was all about establishing a base, and it seems it has done so. Now, an impressive rally ahead is a strong possibility.
For Q1, we expect $20 with potential to test the pattern’s upper border at $28. However, if it clears the upper border, we can expect AVAX to hit $44 by the end of the first half. But if $28 repels, then the first half could see consolidation stretching.
Year
Potential Low
Potential Average
Potential High
2025 (conservative)
$25
$33
$50
AVAX On-Chain Analysis
AVAX shows a highly bullish sentiment. Big Whale Orders in both spot and futures indicate strong institutional accumulation. With Taker Buy Dominance at 90 days, aggressive buyers are in control, while the Cooling volume bubble map suggests a healthy consolidation phase. Collectively, major metrics point to a bullish rally ahead.
Avalanche Price Prediction 2026 – 2030
Year
Potential Low ($)
Potential Average ($
Potential High ($)
2026
400
500
600
2027
550
690
820
2028
650
830
980
2029
740
950
1100
2030
820
1000
1200
AAVE Price Forecast 2026
Looking ahead to 2026, AVAX’s potential price is anticipated to rise even further, with a projected low of $20.00 and a high of $80.00. The average price for AVAX in 2026 will likely be $50.00.
AAVE Price Prediction 2027
In 2027, the analysis suggests a continued upward trend in AVAX’s value, with the price potentially ranging between $31.50 and $126.50. Based on the calculated figures, the average price is projected to be approximately $79.00 during this period.
AAVE Prediction 2028
By 2028, AVAX’s price could potentially experience further growth, falling within the range of $50.50 and $202.50. The average price during this period, calculated from the data, is expected to be around $126.50.
AAVE Price Prediction 2029
Moving forward to 2029, AVAX’s price is predicted to ascend between $81.00 and $324.00. The average price during this period is estimated at around $202.50 based on calculated figures.
AAVE Price Prediction 2030
By 2030, AVAX’s price is forecasted to soar between $129.50 and $518.50. Further, the average price during this period, calculated from the data, could stand at $324.00.
Based on the historic market sentiments and trend analysis of the largest cryptocurrency by market capitalization, here are the possible AAVE price targets for the longer time frames.
Year
Potential Low ($)
Potential Average ($)
Potential High ($)
2031
890
1100
1350
2032
920
1200
1500
2033
1100
1350
1780
2040
1600
2200
3000
2050
2600
3300
4500
AAVE Price Prediction: Market Outlook?
Year
2026
2027
2030
Changelly
$500
$750
$1100
DigitalCoinPrice
$480
$680
$1000
WalletInvestor
$520
$650
$1250
Never Miss a Beat in the Crypto World!
Stay ahead with breaking news, expert analysis, and real-time updates on the latest trends in Bitcoin, altcoins, DeFi, NFTs, and more.
FAQs
Is AAVE a good investment for 2026?
AAVE shows long-term growth potential if it breaks key resistance levels. However, price depends on market conditions and DeFi adoption.
What should investors watch before buying AAVE?
Watch support near $135–$150, resistance above $250, overall market trend, and activity within the Aave protocol.
What could drive Avalanche (AVAX) price growth in the coming years?
Key drivers include DeFi expansion, institutional adoption, subnet growth, and overall crypto market recovery cycles.
What is the AVAX price prediction for 2026?
The AVAX price prediction for 2026 suggests a potential range between $400 and $600 if market momentum and network growth remain strong.
What is the AVAX coin price prediction for 2030?
AVAX coin price prediction for 2030 points to a possible range of $820 to $1,200, assuming sustained adoption and favorable market conditions.
What is the Avalanche price prediction for 2040?
Avalanche price prediction for 2040 estimates a broad range between $1,600 and $3,000 if long-term blockchain adoption accelerates globally.
Bitcoin has once again tested investor conviction. After revisiting levels last seen during the 2025 drawdown, price action has reinforced a familiar reality of the asset class: volatility remains a defining feature, even as the market continues to mature.
For long-term holders, these cycles are nothing new. Bitcoin has weathered repeated corrections over the past decade, often emerging stronger in subsequent phases. But for a growing segment of the market, particularly investors with longer planning horizons, the latest move has prompted a broader reassessment of how returns are generated in crypto.
The question increasingly being asked is not whether Bitcoin will recover, but whether relying solely on price appreciation remains the most effective way to deploy capital in digital assets.
Volatility Is Normal, Expectations Are Changing
Bitcoin’s price history has always been cyclical. Sharp drawdowns have historically coincided with periods of consolidation, shifts in liquidity conditions, or broader macro uncertainty. What has changed over time is the composition of participants.
As crypto ownership has expanded beyond early adopters and traders, more capital is entering the market with different expectations. Portfolio managers, family offices, and long-term allocators tend to evaluate exposure through a wider lens, balancing risk, time horizons, and income needs.
For these investors, volatility is not necessarily a reason to exit the market. It is, however, a reason to reconsider how exposure is structured.
From Price Exposure to Return Structure
For much of crypto’s history, returns have been dominated by price movements. Income strategies, where they existed, were often variable by design. Staking rewards fluctuated. Lending rates adjusted with demand. Incentive programs changed as protocols evolved.
While these approaches remain relevant for active participants, they offer limited predictability. Returns can vary significantly over time, and planning around future cash flows is difficult.
This has led some investors to explore alternatives that place more emphasis on structure than on market timing. Rather than attempting to optimise entry and exit points, the focus shifts toward defined terms, known durations, and clearer expectations around income.
Why This Shift Is Gaining Attention Now
Several factors are converging to make this reassessment more visible.
First, crypto markets have matured operationally. Custody, settlement, and reporting infrastructure has improved, making more structured approaches feasible.
Second, the experience of recent market cycles has highlighted the trade-offs between flexibility and predictability. Variable returns can be attractive in rising markets, but they also introduce uncertainty during prolonged periods of consolidation.
Finally, as digital assets increasingly sit alongside traditional investments, they are being evaluated using familiar financial frameworks. Concepts such as duration, income visibility, and risk-adjusted returns are becoming part of the conversation.
Fixed Income Enters the Discussion
In traditional finance, fixed-income instruments exist to provide clarity. Capital is committed for a defined period. Returns are agreed upfront. Payments follow a schedule. The trade-off is well understood: upside is capped in exchange for predictability.
In crypto, applying these principles is still relatively new, but interest is growing. Some platforms are beginning to structure exposure through fixed-term instruments that aim to deliver defined returns independent of short-term price movements.
Rather than replacing direct asset exposure, these approaches are being viewed as complementary. They offer an alternative for capital that prioritises planning over speculation.
Bitcoin’s recent price action has not undermined its long-term narrative. If anything, it has reinforced its role as a volatile, high-conviction asset. What it has done, however, is accelerate a conversation that was already underway.
As the market evolves, investors are increasingly distinguishing between exposure and outcome. Holding Bitcoin remains a strategic decision. How returns are generated on deployed capital is becoming a separate one.
Platforms such as Varntix have emerged as part of this broader shift by exploring fixed-income structures within a digital asset context. Their relevance lies less in any single product and more in what they represent: a move toward clearer expectations and more deliberate capital allocation.
The Bigger Picture
Bitcoin will continue to be central to crypto markets, and volatility will remain part of the landscape. But as participation broadens, so too will the range of strategies investors use to engage with digital assets.
For some, price exposure will remain the primary focus. For others, particularly those navigating longer time horizons, the appeal of structured returns is becoming harder to ignore.
The current market environment is not signalling an exit from crypto. It is signalling a diversification of how returns are pursued within it.
On February 6, the crypto market saw a sharp crash as Bitcoin plunged nearly 15%, wiping out around $350 billion in total market value in a single day. Bitcoin’s price fell to $60,030, erasing gains made since its October peak near $126,000.
This drop also wiped out the entire “Trump bump” rally from November 2024, as selling pressure increased from miners, profit-taking, deleveraging, and global market fears.
Bitcoin Price Drop Linked to Miner Selling Pressure
One of the biggest pressures is coming from Bitcoin miners. Data shows that the average cost to mine one Bitcoin has now risen above $87,000. With Bitcoin currently trading near $65,000, many miners are operating at a loss. To cover expenses, they are being forced to sell their holdings.
Bitcoin miner Reserves have fallen consistently over the past months and now stand near 1.806 million BTC. This indicates that miners are selling more coins than they are keeping, adding to market supply.
Bitcoin ETFs Record Heavy Outflows
At the same time, institutional demand has weakened sharply. Bitcoin exchange-traded funds (ETFs) saw heavy outflows again. On February 5, spot Bitcoin ETFs recorded $258.8 million in net withdrawals.
Although this was lower than the $544.9 million outflow seen a day earlier, the total outflows for the week have already crossed $1.07 billion.
Liquidations Add More Pressure on BTC Price
Liquidations also played a major role in pushing prices lower. In just 24 hours, more than $2.65 billion worth of leveraged crypto positions were wiped out. Around 82% of these liquidations came from long traders who were betting on higher prices.
The single largest liquidation happened on Binance, where a BTCUSDT position worth $12 million was forcibly closed.
Michael Saylor’s Strategy In Big Losses
Even major corporate Bitcoin holders felt the pain. Michael Saylor’s Strategy reported an unrealized loss of about $9 billion, equal to 16% of its massive Bitcoin holdings. Despite this, Saylor urged investors to stay calm and “HODL.”
Yet some leaders, including Ripple CEO Brad Garlinghouse, reminded traders of Warren Buffett’s famous advice: be fearful when others are greedy and greedy when others are fearful.
Bitcoin Price Outlook
Bitcoin is now testing one of its most important support levels in years. If the price fails to hold above $60,000, analysts warn that more downside could follow.
Even traders on the prediction market Kalshi expect Bitcoin to touch $58,000 in 2026.
Kalshi, the federally regulated prediction market platform, announced a major expansion of its market surveillance and enforcement framework aimed at preventing insider trading and market manipulation across its platform. The updates were shared on February 5, 2026, as part of…
Meme coin launchpad Pump.fun has announced the acquisition of trading terminal Vyper, a move aimed at expanding its cross-chain trading capabilities. The deal was confirmed on February 5, 2026, though financial terms were not publicly disclosed. Vyper’s team and technology…
Strategy has told investors that Bitcoin would have to collapse to around $8,000 before its crypto holdings no longer cover the company’s net debt, even as paper losses continue to deepen. The Michael Saylor-led firm made the disclosure in investor…
A senior Bloomberg Intelligence strategist has warned that Bitcoin could face a severe collapse toward $10,000 as global markets show signs of stress similar to past financial crises. In recent social media posts in early Feb. 2026, Bloomberg Intelligence senior…
Kalshi has seen nearly $170 million in Super Bowl-related bets, and its move to boost oversight comes amid scrutiny of prediction markets by regulators and Congress.
Bitcoin plummeted to a low of around $60,000 after the Crypto Fear & Greed Index hit its lowest score since mid-2022, when the Terra blockchain collapsed.
Out with crypto, in with gambling. Gemini is laying off employees and shifting focus to Gemini Predictions, a platform that has processed over $24 million in volume since December.
Bitcoin fell below 63,000 as investors reacted to dismal US economic data, a weakening stock market and fears of an AI industry bubble. Does data forecast a return to $90,000 by March?
European tokenization companies urged EU lawmakers to quickly amend the DLT Pilot Regime, warning that current limits risk pushing onchain markets to the US.
Hong Kong's sandbox role allows China to explore new financial technologies, like a gold-backed digital asset. Why does it matter? It could potentially be a stable alternative to the dollar.
Dogecoin and Shiba Inu slid deeper into selloff territory even as on-chain activity spiked, underscoring a growing disconnect between network usage and price action across the meme-coin sector.
CleanSpark shares plummeted as investors wait for that earnings report, and with the volatility in the crypto sector, it’s anyone’s guess where the stock might land next.
Nvidia shares slid to their lowest level since December, falling roughly 20% from record highs as an accelerating rotation from growth to value pushed the world’s most valuable company into bear-market territory.
U.S. markets edged lower as a sharp selloff in cryptocurrencies spilled into software and commodity names, with Bitcoin sliding 9% to around $66,000—its lowest level since October 2024.
Ethereum price remains under bearish pressure, with price rotating lower within a high-timeframe range and downside risk building toward the $900 support zone.
Bitcoin touched new lows under $64,000 as market selling reached a historic level, and analysts warn that the bottom is not in. Does data support analysts’ sub-$60,000 prediction?
The investment extends an existing partnership with Anchorage and comes as the federally regulated crypto bank explores a major capital raise ahead of a potential IPO.
Ether is testing holder conviction with its price dip, with data showing continued selling by smaller holders and steady accumulation by larger investors.
Polymarket will migrate from bridged USDC on Polygon to Circle-issued native USDC, reducing reliance on cross-chain bridges as prediction markets expand.
Vietnam’s crypto market grows fast in 2026 as users focus on choosing the right exchange for their needs. Vietnam remains one of Southeast Asia’s fastest-growing cryptocurrency markets. High mobile banking penetration, a tech-savvy retail user base, and sustained interest in…
WPA Hash cloud mining gains attention in 2026 as investors seek stable crypto income beyond price swings. In 2026, after several rounds of volatility, the cryptocurrency market is gradually becoming more structured and rational. For many investors, simply relying on…
XRP price continued its strong downward momentum and lost a crucial support level as the crypto market crash gained steam. The Ripple (XRP) token continued to fall, reaching a low of $1.3495, its lowest level since November 2024. It has…
Recently, the shift toward a “risk-off” sentiment is largely driven by a more hawkish U.S. Federal Reserve, with the potential for higher-for-longer interest rates strengthening the U.S. Dollar. As a result, the dollar gains strength from $95.56 to $97.80 when writing. Since DXY rose, capital has typically exited speculative assets like Bitcoin and Ethereum and that’s why liquidations has increased in February, as at times like these markets favor safer, yield-bearing government bonds. That’s why TOTAL, which represents the entire crypto market cap, took a deeper hit this time, falling to $2.28 trillion.
Whereas TOTAL is at risk if DXY continues to pump around 10%-11%, which could push it to $110 by July 2026, it could harm TOTAL badly, pushing it down 33% to around $1.5 trillion. This event is at higher odds because DXY is supported by the most reliable support, a 200-month EMA, and a decline in the crypto market seems to be intensifying.
In February, the decline intensified as global liquidity tightened significantly amid disappointing economic data from major markets, leading to a broader sell-off in the technology sector. Since cryptocurrencies remain highly correlated with tech stocks, the Nasdaq’s February decline triggered a massive wave of liquidations across the crypto market, a trend that could worsen over time.
Geopolitical tensions and regulatory uncertainty have further spooked institutional investors, causing a sharp reversal in Spot ETF inflows. This lack of institutional support, combined with a breach of key technical support levels, has created a “perfect storm” that forced the entire sector into a deep correction.
The February Fall Intensified With 24-hour Liquidation
According to CoinGlass data, over the past 24 hours, 302,435 traders were liquidated, totaling $1.43 billion in liquidations. Across 7 exchanges, data shows over $100 million in liquidations; Bybit saw the most, at $338.54 million, and Hyperliquid was second, at $335.78 million.
The top 3 cryptocurrencies with the most liquidations were BTC ($736 million), ETH ($337 million), and SOL ($77 million). And the weighted sentiment for this trio has fallen sharply, and most people are talking negatively about these assets.
The price of XRP continued to move lower this week, extending its corrective phase after breaking below a consolidation pattern and reflecting broader weakness across the cryptocurrency market.
XRP has fallen about 12% in a short period, with chart-based projections placing the next important price region between $1.36 and $1.21, where the decline could begin to slow if buying demand strengthens.
Decline follows break below consolidation range
The latest downward move accelerated after XRP dropped below a triangular consolidation pattern that had held prices steady for several sessions. Once the lower boundary of that range was breached, selling intensified and prices moved rapidly toward lower technical projections.
Analysts describe the current move as part of a broader corrective cycle within the longer-term trend, in which a rapid final phase of selling typically follows the completion of earlier consolidation waves.
Retracement levels define the next trading range
Technical projections based on earlier price swings place potential stabilization zones near $1.36, $1.29, and $1.21. The $1.21 area corresponds roughly to a 50% retracement of the previous upward rally, a region where declines often begin to slow as longer-term investors re-enter the market.
If prices fall below that band, the correction could extend toward lower historical trading ranges, with some analysts pointing to significantly lower retracement zones as alternative scenarios depending on overall crypto market sentiment.
Recovery requires reclaiming earlier range
For a sustained recovery to develop, XRP would need to move back above approximately $1.64, which marked the upper boundary of the earlier consolidation zone. A move above that level would indicate that downward momentum is easing and that a more stable price base is forming.
Broader market conditions remain the main driver
The current XRP decline has taken place alongside a wider digital-asset downturn, in which Bitcoin, Ethereum and other major cryptocurrencies have also experienced steep losses.
Analysts say XRP’s direction in the near term is likely to remain closely linked to the broader crypto market environment, including institutional flows, leverage reductions and overall investor sentiment.
Until a clear reversal develops, XRP is expected to remain within a corrective phase characterized by sharp short-term fluctuations and gradual attempts to stabilize near major retracement regions.
Uniswap (UNI), one of the top blockchain projects in the decentralized exchange sector, has lost all momentum over the past few months. UNI briefly challenged the $6.5 level in late 2025, but it has since collapsed to $3.9 and is struggling to find support around that level.
Large-cap tokens have failed to regain momentum in this bearish cycle, while emerging utility tokens with superior economic moats are gaining massive traction as the next winners.
On the cross-border banking front, Digitap ($TAP) has emerged as a leader by introducing the world’s first omnibank platform that connects currency and crypto in a single app. Because of its first-mover advantage and a massive total addressable market of billions of users, Digitap is now ranked as the best crypto to buy in a crash.
Uniswap below multi-year support: Is a crash to $3 coming?
During the recent market crash, Uniswap struggled to break below the multi-year support level of $4.5-$5. This support zone was significant, as it protected the downside in many cycles. Amid bearish market conditions, the breakdown of this support level has opened the door to further downside, removing Uniswap from the list of the best cryptos to buy in a crash.
As of press time, Uniswap was trading at around $3.90, down about 18% over the past seven days. Historical price action data show that if UNI fails to reclaim and sustain above the $4.5 support, the current decline could extend by $3, representing another 22% loss from current levels.
Persistent underperformance in Uniswap’s price has prompted investors to seek top altcoins to buy to recoup losses during short-term upswings.
Digitap ($TAP): Banking revolution in a single app
Digitap has attracted attention despite weak market conditions because it’s the world’s first omnibank platform with the potential to disrupt the crypto banking sector. It operates on multi-rail infrastructure and already has a working product. While many projects are still building promises, Digitap delivers tools people can use today, positioning it as the best crypto to buy in a crash.
The Digitap app is live on both iOS and Android. It allows users to manage traditional money and digital assets in one place. From everyday banking to saving, investing, and spending, users can handle multiple fiat currencies alongside more than 100 cryptocurrencies without switching platforms.
By blending crypto speed with traditional banking access, Digitap enables cross-border money transfers at fees below 1%. This approach opens the door to the global remittance market, a trillion-dollar industry that still relies on slow and expensive systems. Being early in this space gives Digitap a strong advantage as demand for cheaper international transfers continues to rise.
The platform recently expanded its capabilities by enabling Solana deposits directly inside the app. Users can now add SOL and USDT via the Solana network, enabling faster transactions and lower fees. This update directly addressed community requests for speed, highlighting Digitap’s focus on practical improvements.
Why $TAP is the best crypto to buy in the 2026 crash
While Uniswap continues to move sideways around $3.93, crypto presales like Digitap are gaining investors’ attention. When popular projects lose momentum, capital often shifts toward newer ideas with clearer growth potential.
For investors scanning the market for the best crypto buy in this crash, Digitap stands out among presale projects. Early entries often carry a higher risk but also offer the greatest upside. With $TAP priced at $0.0467, it offers a ground-floor entry into a project that could easily reach $1 if adoption accelerates.
Discover how Digitap is unifying cash and crypto by checking out their project here:
Despite the recent volatility in digital asset markets, Matt Hougan, chief investment officer at Bitwise Asset Management, says the broader crypto sector may already be emerging from a bear-market phase, with institutional demand and improving fundamentals likely to drive the next cycle.
“We already had a bear market”
Hougan argued that much of the crypto market experienced a significant downturn earlier, even if major assets appeared relatively resilient.
“We had a full-blown bear market last year. We didn’t experience it because Bitcoin, ETH, and XRP did okay — they had institutional flows from ETFs and corporations,” he said.
Assets without institutional backing, he noted, fell sharply, with some large cryptocurrencies declining 50%–60%, resembling conditions seen during previous bear cycles such as 2018 and 2022.
According to Hougan, the market may already be moving into a recovery phase.
“We ran the four-year cycle last year. We’re already at the bottom. I think we’re coming back up.”
Institutional demand reshaping the market
Hougan said the introduction of Bitcoin exchange-traded funds in early 2024 created a structural shift in demand. ETF purchases, corporate accumulation and other institutional buying have, at times, exceeded the amount of new Bitcoin entering circulation.
“If you look at ETF purchases or corporate purchases, it’s vastly more than the amount of new Bitcoin being produced,” he said.
He compared the situation to the gold market, where sustained central-bank buying initially stabilized prices before eventually driving a stronger rally once selling pressure from existing holders declined.
“Just like gold eventually entered a parabolic move, Bitcoin will follow suit. We’re just earlier in that process.”
A more selective altcoin cycle ahead
Hougan said the next phase of the crypto market is unlikely to resemble past “everything rallies” altcoin cycles. Instead, investors are becoming more selective, rewarding projects with real adoption and strong fundamentals.
“We’re not going to have a classic alt season where every zombie coin rises,” he said. “People are going to distinguish between high-quality projects and low-quality projects.”
He pointed to networks with strong activity in areas such as stablecoins, tokenization and decentralized infrastructure as potential leaders in the next cycle, while weaker projects could struggle to attract capital.
Long-term outlook remains constructive
Hougan also highlighted a broader shift occurring within the market: early investors and long-term holders are gradually selling portions of their holdings, while institutional investors increasingly replace them as the dominant buyers.
This transition, he said, is typical of maturing asset classes and does not necessarily signal weakening demand.
“We’re working through that sale wall… but we’re going to get through it,” he said, adding that the long-term trend of increasing institutional participation remains intact.
While timing remains uncertain, Hougan said the combination of structural demand, improving infrastructure and investor selectivity could support the next stage of growth in digital assets, with stronger projects leading the recovery rather than the entire market moving in unison.
By 2026, the focus of the market is shifting away from the slow-moving leaders of the past decade. As investors look for the next big crypto breakout, attention is increasingly turning to newer protocols rather than only established coins. A quiet change is taking place as projects that address real challenges in crypto lending begin to stand out.
Many analysts believe that the strongest upside in this cycle may come from assets that are still early in their growth and adoption. While much of the attention remains on older tokens, new crypto infrastructure is being developed that could reshape how digital finance works.
Mutuum Finance (MUTM)
Mutuum Finance (MUTM) is a decentralized protocol focused on crypto lending and borrowing. The project is developing a non-custodial system that allows users to access liquidity while maintaining ownership of their digital assets, with all activity designed to run through smart contracts rather than intermediaries.
The protocol has already reached notable funding milestones, raising over $20.4 million from a global community of more than 19,000 token holders, reflecting growing interest as development continues.
Participation is currently managed through a structured presale that is moving through its final stages. The project is currently in Phase 7, where the price of the MUTM token is set at $0.04. This follows a growth path that started at just $0.01 in early 2025, representing a 300% surge so far.
With the official launch price confirmed at $0.06, investors entering at the current rate are securing a 50% increase in value before the token even hits public exchanges. The total supply is fixed at 4 billion tokens, with 45.5% (1.82 billion) specifically allocated for the community during these presale stages.
V1 Activation and Passive Yield Mechanism
The biggest catalyst for the recent growth is the official activation of the V1 protocol on the Sepolia testnet. This move has proved that the code is functional. Users can now test core features such as liquidity pools and automated borrowing flows. A key component of this system is the mtToken.
When you supply assets like ETH or USDT to the protocol, you receive mtTokens that act as interest-bearing receipts. These tokens automatically grow in value as borrowers pay interest back into the system. This allows lenders to earn a passive yield without having to manage their positions actively.
To support the long-term price of the token, the protocol’s whitepaper uses a buy-and-distribute model. A portion of the fees generated from lending activity is used to purchase MUTM tokens on the open market. These tokens are then distributed to participants who stake their mtTokens in the safety module.
This creates consistent buying pressure and aligns the token’s value with the actual usage of the platform. Because of these strong utility mechanics, many analysts are highly optimistic. Current predictions suggest that the token could see a 600% to 1,000% increase within the first few months of its mainnet release, with some experts eyeing a move toward the $0.30 to $0.45 range.
Security and Community Trust
In the world of DeFi, security is the most important factor for success. Mutuum Finance has prioritized safety by completing a full independent audit with Halborn Security. This firm is known for testing some of the most complex architectures in the blockchain world.
Additionally, the project holds a high 90/100 score from CertiK, verifying that its smart contracts are built to institutional standards. The team also maintains a $50,000 bug bounty to reward security researchers for finding and reporting any potential vulnerabilities.
To keep the community engaged during these final stages, the project features a 24-hour leaderboard. Every day, the top daily contributor is rewarded with a $500 bonus in MUTM tokens. This transparent system ensures that the most active supporters are rewarded while the project maintains its steady momentum.
With over 840 million tokens already sold and the V1 testnet live, the window to access Phase 7 prices is closing quickly. As the project prepares for its full public debut, the combination of technical milestones and community backing has positioned MUTM as a top crypto opportunity for the 2026 cycle.
For more information about Mutuum Finance (MUTM) visit the links below:
The breakdown of the ascending wedge in Bitcoin price chart and the dip below the psychological $70,000 level have shifted the immediate market bias to bearish. With spot BTC ETFs experiencing massive net outflows in recent weeks the institutional “shield” that protected higher price levels is currently under pressure.
Currently, Bitcoin crypto’s adjusted Net Unrealized Profit/Loss (NUPL) stands at approximately 26–29%, down from its January highs. This is not yet in the “capitulation” zone seen in 2022, but it is trending toward the neutral territory last seen during the September 2023 reset.
Now, BTC is inching towards $65K support now a failure to reclaim the $65,000 support level would likely trigger further liquidations toward the $53,000 to $56,000 range, which aligns with the realized price (average cost basis) of the network. While the $41,000 level remains a theoretical target on the macro chart, the presence of institutional demand at lower levels and a recent shift in whale behavior suggest a “hard floor” may form much higher.
Bitcoin Price Affected By Whale Reshuffle: Who is Selling and Who is Stacking?
The supply distribution data reveals a fascinating “changing of the guard” among Bitcoin’s largest holders over the last 48 hours:
Addresses holding 10,000 to 100,000 BTC have been significant sellers, contributing to the recent break below $70,000.
Conversely, the 1,000 to 10,000 BTC cohort, which had been in a decline, has begun aggressive accumulation in the last 48 hours. This suggests that while some “mega-whales” are taking profits, institutional-sized “smart money” is actively buying the dip.
Despite the headline-grabbing outflows, the total net assets in U.S. spot Bitcoin ETFs remain substantial at over $93.5 billion, indicating that many long-term institutional holders are not panicking.
What to Lookout for February 2026
Bitcoin price analysis highlights the importance of a critical support zone. This suggests that If Bitcoin price fails to hold the $65,000 mark, the next major demand floor sits at $53,000–$56,000, which represents the network’s current realized price.
Whale Sentiment Divergence: Mega-whales are offloading supply, but mid-tier institutional whales (1k–10k BTC) are aggressively accumulating, creating a potential bottoming structure.
Volatility Warning: With record-high leverage usage and declining open interest, the market is primed for violent price swings; a return to $78,000 is required to invalidate the current bearish trend.
The new facility allows institutions to redeem tokenized real-world assets into stablecoins instantly, addressing a key liquidity bottleneck in onchain markets.
A $1 million Lightning transfer between SDM and Kraken was used to test whether Bitcoin’s main scaling layer could handle seven‑figure, institutional‑grade payments.
House Democrats probe $500 million UAE investment in Trump-linked WLFI, highlighting questions over dealings with the country's national security adviser.
Cryptocurrency markets extended their sharp decline on Thursday, with Bitcoin, Ethereum and XRP dropping to multi-month lows as institutional selling, heavy liquidations and weak market sentiment combined to push prices lower.
Bitcoin fell below $69,000, slipping under its previous 2021 all-time high, while Ethereum dropped below $2,000 for the first time since May 2025. XRP also recorded steep weekly losses as selling spread across major altcoins.
The total crypto market capitalization declined to roughly $2.3 trillion, down more than 7% in 24 hours.
Bitcoin’s sharp decline from record highs
Bitcoin has now fallen roughly 45% from its recent peak near $126,000, marking one of the fastest multi-month corrections of the current cycle. Over the past 120 days, the cryptocurrency has dropped by more than $56,000, averaging a decline of roughly $14,000 per month.
BREAKING: Bitcoin just dropped below its 2021 all time high of $69,000
while ETH fell below $2,000 for the first time since May 2025.
Market analysts say the fall below the $69,000 level is psychologically significant because it represents a loss of a major long-term support zone that had held since the previous bull cycle.
Institutional selling and ETF outflows pressure markets
The sell-off has been driven largely by institutional flows rather than retail activity. Analysts pointed to large deposits of Bitcoin onto major exchanges and continued outflows from U.S. spot Bitcoin exchange-traded funds, which together increased available supply in the market.
Some blockchain tracking services reported that several large trading firms and exchanges collectively moved billions of dollars worth of Bitcoin during low-liquidity trading hours, accelerating the downward move.
Liquidations intensify the crash
The decline triggered a wave of forced liquidations across leveraged trading positions. More than $1.3 billion in crypto positions were liquidated in 24 hours, including hundreds of millions of dollars in Bitcoin long positions.
Market sentiment indicators reflected the stress, with the Fear and Greed Index dropping to “extreme fear” territory while momentum indicators signaled heavily oversold conditions.
Ethereum and XRP follow broader market weakness
Ethereum fell sharply during the week, losing more than 25%, while XRP also posted double-digit declines as traders reduced exposure to higher-risk altcoins during the downturn.
Historically, altcoins tend to fall faster than Bitcoin during risk-off phases because of thinner liquidity and higher speculative positioning.
Macro pressures and market correlation
There is also rising correlation between crypto markets and traditional financial assets, including equities and gold, suggesting the sell-off may be partly driven by broader macro positioning rather than crypto-specific news.
The lack of a single major negative headline has led some analysts to describe the downturn as a liquidity-driven reset, where institutional positioning, leverage unwinding and weak sentiment collectively pushed prices lower.
What happens next?
Technical analysts say the near-term outlook depends on whether Bitcoin can hold the $66,000 support zone. Holding above this level could trigger a short-term relief rally as oversold conditions attract buyers, while a decisive break lower could open the path toward the $62,000–$60,000 range.
Bitcoin price has officially erased all the gains incurred in the past couple of years, specifically after Donald Trump was elected as the president of the US. The current trade dynamics and the market structure suggest Bitcoin bears may still be in control, highlighting the possibility of a deeper correction in the coming days.
The BTC price has come under pressure after losing key support zones between $75,000 and $81,000, shifting the short-term market structure in favour of the bears. With the momentum fading and volatility picking up, the attention has now shifted to the next major support and resistance zones.
BTC Price Rally Resembles a ‘Liquidity Hunt’
Bitcoin’s recent price action looks less like a clean trend and more like a liquidity-driven move. On the all-leverage liquidation map, the largest clusters of open positions sit below the current price, which makes downside moves easier to trigger.
The biggest liquidity pools are stacked around $81,200, $75,300, $68,400, $64,700, and $60,600. Each time BTC loses a support level, the price drifts toward the next pocket where leveraged long positions are concentrated. Those levels act like magnets, as forced liquidations add momentum to the downside.
This also explains why the rebounds have struggled to hold. Without steady spot buying to absorb sell pressure, prices continue to sweep lower liquidity zones. Until that changes, volatility is likely to stay high, and risk remains tilted toward further downside moves.
Will Bitcoin (BTC) Price Test $60,600?
In the long-term, the Bitcoin price broke down from the rising wedge in mid-Q4 2024. This was believed to be a correction that could rebound as the price was accumulating within an ascending trend. However, a rejection of $90,000 has pushed the BTC price into a strong bearish trap. Currently, the support at $74,500 is also broken, which suggests the BTC bears are still in control.
On the price side, Bitcoin has clearly been rejected from the upper supply zone near the $100K–$120K region, confirming strong selling pressure at higher levels. The sell-off has now pushed BTC into a well-defined weekly demand zone around $60K–$65K, an area where buyers have historically stepped in.
RSI adds an important layer here. The weekly RSI has dropped toward the lower end of its range, nearing oversold territory compared to prior cycles. This suggests that while momentum is still weak, selling pressure is starting to look stretched. In past instances, similar RSI conditions inside major demand zones have often preceded either a relief bounce or a period of consolidation rather than an immediate continuation lower.
Put together, the indicators suggest Bitcoin is at a critical turning point: holding this demand zone with stabilizing RSI could trigger a short-term rebound or sideways base, while a breakdown, especially with RSI slipping further, would point to deeper downside risk in the weeks ahead.
The Bottom Line
Bitcoin has now entered a demand zone just below $70,000, where the buyers have previously stepped in. The weekly RSI has dropped to the lower threshold below the lower threshold for the first time since November 2022, followed by a strong rebound backed by volume. But the volume has drained now, indicating a massive drop in the trader’s participation. In such a scenario, the BTC price is feared to drop below $60,000 before the end of the week.
Veteran market analyst Gareth Soloway has outlined several possible paths for Bitcoin’s price, including a worst-case scenario that could see the cryptocurrency fall sharply if global financial markets face a major downturn.
In a recent market update, Soloway said Bitcoin is currently holding an important price area and has shown more resilience than U.S. stock markets, which he expects to remain under pressure in the months ahead.
He added that while equities may continue to struggle, some capital could rotate into Bitcoin, helping limit further downside in the near term.
Bitcoin Shows Near-Term Stability
Soloway said that Bitcoin recently moved lower but managed to close back above important chart levels. This behavior, he said, suggests buyers are still active at current prices.
The area around $73,000–$74,000 has acted as a strong zone of interest, as it previously marked a major breakout point. Bitcoin also reacted sharply near $73,000, bouncing almost precisely from that level.
Because of this, Soloway says Bitcoin could see a short-term bounce, even if broader market risks remain.
Bounce May Face Selling Pressure Near $85,000–$86,000
If Bitcoin rebounds, Soloway expects selling pressure to emerge around the $85,000 to $86,000 range. This zone previously acted as support before breaking down and is now likely to limit upside in the short run.
He stressed that any rebound into this area would not necessarily signal the start of a new bull market and could be followed by renewed weakness.
Base Scenario Points to $55,000 Area
Looking further ahead, Soloway outlined his base scenario, which assumes a typical market correction rather than a severe financial crisis.
Drawing on past Bitcoin cycles, he noted that during previous downturns Bitcoin often fell roughly 20% below the prior cycle’s all-time high. Applying that pattern to the 2021 peak near $69,000 suggests a possible move toward the $55,000 region.
He said this area aligns with historical trading activity and could act as a longer-term floor if market conditions remain relatively orderly.
Soloway added that he would look to accumulate Bitcoin gradually if prices move into the $55,000–$65,000 range.
Worst-Case Scenario Sees Bitcoin Near $35,000
Soloway said a much deeper drop would likely require a sharp collapse in global equity markets, potentially involving losses of 30% to 50%.
In such a case, Bitcoin’s chart has formed a large head-and-shoulders pattern, a bearish structure that can signal deeper declines. If fully played out, this pattern points to a potential fall toward $34,000 to $35,000.
He warned that this scenario is not his central expectation and would only occur under extreme market stress.
Brazil’s congressional committee has approved Bill 4,308/2024 to strengthen stablecoin oversight. The law requires all stablecoins to be fully backed by reserves, banning unbacked tokens like Ethena’s USDe and Frax. Issuers of unbacked coins could face up to eight years in prison, and exchanges handling foreign stablecoins such as USDT and USDC must follow strict compliance and risk rules. This move is set to reshape Brazil’s crypto market.
Former U.S. Commodity Futures Trading Commission chair Chris Giancarlo said XRP became the “poster child” of Washington’s tough stance on cryptocurrency, but noted that the project has survived and is now moving forward.
Speaking in a recent discussion on crypto regulation and innovation, Giancarlo said regulatory clarity is critical for the future of digital finance in the United States. Without clear rules, he warned, American banks could fall behind their global peers.
Europe Moves Ahead as US Lags
Giancarlo pointed to Ripple as an example of how clear rules can unlock innovation. Ripple has recently secured regulatory approvals in Europe, allowing its stablecoin and XRP to be used more widely within the region’s financial infrastructure.
Under Europe’s MiCA framework, banks across the region can now hold and use these digital assets in a regulated manner. Giancarlo said this gives European banks a major advantage, while U.S. banks remain cautious due to regulatory uncertainty.
“Something clear is better than nothing,” he said, adding that while Europe’s rules may not be perfect, they at least allow institutions to move forward.
XRP’s Fight With the SEC
Giancarlo also touched on XRP’s long-running legal battle with the U.S. Securities and Exchange Commission, calling it a defining moment for the crypto industry.
He said XRP became a key target during what he described as the crackdown led by regulators under former SEC leadership. Despite years of legal pressure, he noted that XRP “stood up to it, withstood it, and is still standing.”
The legal fight between Ripple and the SEC, which centered on whether XRP should be classified as a security, has been closely watched across the crypto market and is seen as a test case for how digital assets are regulated in the U.S.
Banks Will Innovate When Forced
Giancarlo argued that U.S. banks tend to innovate only when regulation leaves them no choice. Once clear crypto rules are in place, he said banks will no longer be able to use regulatory risk as an excuse and will be pushed to adopt digital network technologies.
He added that the future of digital finance will not be dominated by a single blockchain. Instead, multiple networks will likely coexist, much like Visa, Mastercard, and American Express operate side by side today.
“The digital future will be just as complex as the financial system we already have,” Giancarlo said.
Global financial markets saw heavy losses over the past 24 hours, with cryptocurrencies leading a sharp sell-off that wiped out trillions of dollars in market value across asset classes.
The total crypto market fell about 7%, erasing roughly $184 billion in value in a single day, as selling pressure accelerated and investor confidence weakened.
Crypto sees deep losses and heavy liquidations
Bitcoin dropped nearly 8%, losing around $120 billion in market value, while Ethereum slid more than 30% from recent highs. Over the past eight days, Bitcoin has fallen roughly $20,000, while Ethereum has lost close to $1,000. Bitcoin has also slipped below $70,000 at the time of writing.
Forced liquidations intensified the move. More than $830 million in positions were liquidated in the last 24 hours alone, while total liquidations over the past week exceeded $6.7 billion, according to market data.
Analysts said the decline reflects aggressive deleveraging as traders unwind risky positions.
Selling spreads beyond crypto
The sell-off was not limited to digital assets. Traditional markets also recorded losses:
Gold fell about 5.5%, wiping out nearly $1.9 trillion in market value
Silver dropped roughly 19%, erasing close to $1 trillion
The S&P 500 declined nearly 1%
The Nasdaq fell about 2.5%, while smaller stocks also weakened
In total, close to $5 trillion was erased across global markets in a short period, despite the absence of any single major negative headline.
Institutional flows remain weak
Investor demand showed further signs of strain. Bitcoin exchange-traded funds recorded significant outflows in January, reinforcing signs of sustained institutional selling.
Meanwhile, indicators tracking U.S. investor demand showed persistent weakness, showing limited buying support during the downturn.
Sentiment hits extreme fear levels
Market sentiment has deteriorated sharply. The crypto Fear and Greed Index has logged one of its longest stretches of “extreme fear” in recent months, a level often seen during late-stage market drawdowns.
Data from on-chain analytics firms also showed momentum indicators falling to their weakest levels, signaling little near-term bullish conviction.
No clear bottom in sight
Some analysts said Bitcoin is approaching price zones where buyers may begin searching for a bottom, but warned that past cycles show such phases can last months rather than days.
“This is no longer a routine pullback,” one analyst said. “It’s a broad reset driven by forced selling, broken confidence and declining risk appetite.”
Ethereum’s evolving role shifts investor focus from holding ETH to broader income strategies across digital asset portfolios. Ethereum has long occupied a unique position within the crypto ecosystem. Beyond being a digital asset, it has served as the infrastructure layer…
Brazil advances a bill to ban algorithmic stablecoins and force all domestic issuers to fully collateralize tokens, tightening rules in a market where stablecoins drive 90% of crypto flows. Brazil’s Congress has fired a clear warning shot at uncollateralized stablecoins,…
The broader crypto market has slipped into a bearish phase, with Bitcoin dropping below $70,000 and giving up more than 50% from its cycle highs. As downside pressure builds across majors, Chainlink has also erased most of its 2024–25 gains, raising concerns that Chainlink’s price could drift back into the long consolidation range seen during 2022–23.
With price now losing key support levels, traders are watching closely to see whether LINK price enters another extended accumulation phase or if the current weakness marks a short-term corrective pullback that could eventually set the stage for a stronger rebound.
LINK Risks Re-Entering Its 2022–23 Accumulation Zone
Chainlink is starting to look vulnerable as the broader crypto market remains under pressure. After failing to hold the $11–$12 support zone, LINK has slipped lower and is now trading in a price area that previously defined its long consolidation phase in 2022–23. With momentum fading and buyers stepping back, traders are questioning whether this move marks the beginning of another extended accumulation period or just a temporary pullback before a rebound.
On the weekly chart, LINK has clearly lost a key support level that had held through much of 2024 and early 2025. Once the price broke below this zone, it quickly struggled to recover, turning former support into resistance, which is a classic sign of weakening structure.
The highlighted box on the chart marks LINK’s previous accumulation range, where the price spent months moving sideways between roughly $6 and $9. With LINK now trading near $8.8, the price is already testing the upper end of that old range. If buyers fail to step in here, the risk shifts toward range acceptance rather than a quick bounce.
Momentum indicators add to the cautious picture. The RSI has drifted lower, showing fading strength without signaling a full oversold reset, while CMF turning negative suggests capital is slowly flowing out rather than back in.
For now, LINK needs to reclaim the $11–$12 area to shift sentiment back in favor of the bulls. Until that happens, the chart points to continued consolidation or further downside, with the 2022–23 range acting as the key zone to watch.
The Bottom Line
Chainlink price is still under pressure after losing the $11–$12 zone, and for now, the downside risks haven’t eased. In the near term, $8.5–$8.8 is the level to watch this week. If that fails, the price could slide toward $7.5. Looking further into the month, holding below $9 keeps the LINK price exposed to a move back into the $6.5–$7.0 range. Bulls only regain some control if the price manages to reclaim $11, which could allow for a short-term bounce.
Bitcoin fell to $75,000 over the weekend, down over 40% from its all-time high of roughly $126,000 reached in early October. The sell-off came amid renewed uncertainty around Fed policy and risk sentiment across crypto markets.
In a recent Schwab Network segment, analyst Adam Lynch and host Jenny Horne discussed what’s driving Bitcoin’s decline and why Trump’s nomination of Kevin Warsh as the next Fed Chair could shift the outlook for crypto investors.
Who Is Kevin Warsh and Why Should You Care?
President Trump nominated Warsh, a former Fed Board of Governors member who served under Ben Bernanke from 2006 to 2011, to replace Jerome Powell after his term ends in May. The pick came as a surprise, as BlackRock’s Rick Rieder had been the early favorite.
Warsh has historically been seen as a hawk, but his recent stance has leaned more dovish. Robin Brooks at the Brookings Institution expects Warsh to cut rates aggressively, projecting around 100 basis points in cuts over his first four meetings.
“He can’t be and he won’t be [hawkish] because his worst nightmare is probably to have Trump on him the way he was on Powell,” Brooks noted, as cited by Lynch.
His confirmation does face one hurdle. Senator Tom Tillis (R) has said he will oppose any nomination until the Fed’s investigation into Jerome Powell is resolved, though most expect this to be cleared by May.
A 40% Bitcoin Drop
Bitcoin started 2026 at around $88,000, briefly hit $95,000, then began its most recent decline in mid-January. It now trades well below its 50-day and 100-day moving averages.
Lynch put the drawdown in perspective. Bitcoin’s volatility runs 3-4x that of equities.
“If you can reasonably expect a 10 to 15% equity market correction in any given year, and you can, a 40% drop in Bitcoin is just as reasonable,” he said.
Is Strategy Drowning?
Strategy disclosed it purchased 855 Bitcoin last week at roughly $88,000, bringing its total holdings to around 713,000 BTC at an average cost of $76,000. With Bitcoin below $75,000, the position is currently in the red.
Canaccord analyst Joseph Vafi cut his price target 61%, from $475 to $185, but maintained a buy rating. He described Bitcoin as being “amid an identity crisis. Still somewhat fitting the profile of a long-term store of value, but increasingly trading like a risk asset in the short term.”
Bitcoin (BTC) has recently slipped below the $80,000 psychological level, as thin liquidity and futures-related liquidations amplified market volatility. With macro uncertainty rising and risk appetite weakening, short-term price stability has once again become a concern across the crypto market. In this environment, strategies that rely solely on predicting price direction are facing growing uncertainty.
When Market Volatility Becomes the Risk
As volatility intensifies, many participants are realizing that risk does not only come from “being wrong on direction,” but from overexposure to price movements themselves. During choppy market cycles, strategies based on short-term trading or leverage are easily disrupted by sudden shifts in liquidity and market sentiment. As a result, some investors are beginning to explore participation models with clearer rules, fixed cycles, and automated settlement—seeking ways to stay engaged in the market without being fully dependent on price trends.
What Is SolStaking?
SolStaking is a platform that provides multi-asset staking and cloud mining services. Rather than focusing on market timing or price prediction, SolStaking is designed around contract-based participation models that aim to operate consistently across different market conditions.
At the infrastructure level,SolStaking places strong emphasis on compliance and security for long-term operation:
U.S.-registered operating entity: Sol Investments, LLC
Asset segregation: User staking assets are kept strictly separate from platform operating funds
Independent audits: Periodic audits conducted by PwC
Custody insurance: Coverage provided by Lloyd’s of London
Enterprise-grade security: Multi-layer encryption, system isolation, and 24/7 risk monitoring
This framework is not built for short-term speculation, but for sustained operation in volatile market environments.
The Role of Real-World Assets (RWA)
Unlike models that are fully exposed to on-chain price fluctuations, SolStaking incorporates Real-World Assets (RWA) as part of its underlying support. These assets include, but are not limited to:Large-scale AI data center operations, sovereign and investment-grade bonds, physical gold and commodities, industrial metal inventories, logistics and cold-chain infrastructure, as well as agricultural and clean energy projects.These real-world assets operate off-chain and generate relatively stable revenue streams. After verification and accounting, relevant data is mapped on-chain, where smart contracts execute settlement automatically based on predefined rules—without manual intervention. This approach helps reduce reliance on single-market price movements.
SolStaking Contract Examples (Model Illustration)
SolStaking offers a range of staking and cloud mining contracts designed to accommodate different capital sizes and participation periods, including:
Contract Type
Starting Amount
Duration
Estimated Settlement
Trial Plan
$100
2 days
approx. $108
TRX Income Plan
$3,000
15 days
approx. $3,585
XRP Flagship Plan
$30,000
30 days
approx. $44,400
BTC Flagship Plan
$300,000
50 days
approx. $630,000
The above figures are model illustrations. Actual results depend on contract terms and system performance.
Under certain capital allocations and contract configurations, the system model can generate results equivalent to approximately 3,000+ XRP per day, driven by operational design and execution efficiency rather than market price movements.
How to Get Started
Participation follows a straightforward process:
Step 1: Register an Account Visit https://solstaking.com and complete account registration.
Step 2: Choose a Contract Deposit XRP, BTC, ETH, or SOL, and select a staking or cloud mining contract aligned with your capital size.
Step 3: Contract Execution & Settlement Once activated, the system runs automatically. Returns are settled according to contract rules and credited to your account, with asset and earnings status available for review and withdrawal.
The platform supports deposits and withdrawals in multiple cryptocurrencies, including USDT, BTC, ETH, XRP, USDC, SOL, LTC, and DOGE.
Conclusion
As Bitcoin breaks key support levels and market volatility becomes a constant rather than an exception, more participants are reassessing how they engage with crypto markets.
The challenge may no longer be improving price forecasts—but upgrading participation models.
SolStaking represents one approach designed to remain operational and consistent in environments defined by uncertainty rather than momentum.
Price predictions for 2026 range from $0.0000160 to $0.0000330
BONK could extend toward $0.0001300 by 2030, if recovery structure holds.
Bonk (BONK) has entered a phase where price action matters more than narrative. After witnessing sharp upside volatility followed by an extended cooldown, the Solana-based meme token is now trading within a clearly defined structure, signaling that speculative froth has largely settled.
Unlike its early cycles driven by hype alone, BONK’s current movement reflects broader market positioning, liquidity shifts, and technically respected demand zones. As the market turns its attention toward 2026, BONK’s chart suggests it may be approaching a pivotal phase where consolidation gives way to directional expansion provided key resistance levels are reclaimed.
As February unfolds, BONK continues to trade above a critical demand band near $0.000015–$0.000017, a zone that has repeatedly absorbed selling pressure in recent months. This area has now become a structural base, indicating that downside momentum is weakening. On the upside, BONK faces immediate resistance around $0.000022, followed by a more decisive barrier near $0.000026. A sustained hold above these levels would signal growing bullish participation, while failure to break higher could result in continued range-bound movement through the month. From a technical standpoint, February’s price behavior is likely to act as a tone-setter, either confirming accumulation or extending the consolidation phase into the second quarter.
Bonk (BONK) Price Prediction 2026
The broader 2026 outlook for BONK hinges on how price reacts to its long-term compression structure. On higher timeframes, BONK is trading within a narrowing range formed by descending resistance and a stable horizontal base, a setup often associated with volatility expansion once resolved.
In the early part of 2026, BONK may continue oscillating between $0.000016 and $0.000024, allowing liquidity to build. However, a confirmed breakout above the upper boundary of this range could trigger a shift in market structure, opening the path toward higher price discovery zones.
If bullish momentum strengthens alongside broader market recovery, BONK could advance toward $0.000028, with an extended upside scenario placing the token near $0.000033 by the latter half of 2026. Importantly, pullbacks during this phase are expected to remain corrective as long as price holds above its established base.
Bonk Crypto Price Prediction 2026 – 2030
Year
Potential Low ($)
Potential Average ($
Potential High ($)
2026
0.0000160
0.0000245
0.0000330
2027
0.0000280
0.0000410
0.0000560
2028
0.0000450
0.0000670
0.0000850
2029
0.0000720
0.0000980
0.0001150
2030
0.0000950
0.0001120
0.0001300
Bonk (BONK) Price Forecast 2026
In 2026, Bonk price could project a low price of $0.0000160, an average price of $0.0000245, and a high of $0.0000330.
Bonk Price Prediction 2027
As per the Bonk Price Prediction 2027, BONK may see a potential low price of $0.0000280. Meanwhile, the average price is predicted to be around $0.0000410. The potential high for BONK price in 2027 is estimated to reach $0.0000560.
Bonk (BONK) Price Prediction 2028
In 2028, Bonk price is forecasted to potentially reach a low price of $0.0000450 and a high price of $0.0000850.
Bonk Coin Price Prediction 2029
Thereafter, the Bonk (BONK) price for the year 2029 could range between $0.0000720 and $0.0001150.
Bonk Price Prediction 2030
Finally, in 2030, the price of Bonk is predicted to remain steadily positive. It may trade between $0.0000950 and $0.0001300.
The long-term projection assumes Bonk sustains relevance in enterprise blockchain use cases, with growth moderating over time as the asset matures.
Year
Potential Low ($)
Potential Average ($)
Potential High ($)
2031
0.0001100
0.0001450
0.0001750
2032
0.0001400
0.0001900
0.0002400
2033
0.0001800
0.0002400
0.0003200
2040
0.0004200
0.0006800
0.0009500
2050
0.0008500
0.001300
0.001900
Bonk (BONK) Price Prediction: Market Analysis?
Year
2026
2027
2030
Changelly
$0.0000350
$0.0000500
$0.0001350
CoinCodex
$0.0000300
$0.0000590
$0.0001120
WalletInvestor
$0.0000280
$0.0000510
$0.0001200
CoinPedia’s Bonk Price Prediction
Coinpedia’s price prediction suggests that BONK could trade between $0.000016 and $0.000033 in 2026, provided the asset sustains its demand zone and confirms a higher-timeframe breakout. Looking ahead, if BONK maintains relevance within high-beta market phases, the token may extend toward $0.000130 by 2030, though price volatility is expected to remain elevated across cycles.
Year
Potential Low ($)
Potential Average ($)
Potential High ($)
2026
0.0000160
0.0000245
0.0000330
Never Miss a Beat in the Crypto World!
Stay ahead with breaking news, expert analysis, and real-time updates on the latest trends in Bitcoin, altcoins, DeFi, NFTs, and more.
FAQs
What is Bonk’s price prediction for 2026?
In 2026, BONK could range between $0.000016 and $0.000033, depending on breakout confirmation above key resistance levels.
Could Bonk (BONK) reach new highs by 2030?
Yes, if bullish momentum continues, BONK may reach up to $0.000130 by 2030 while maintaining a stable long-term base.
What factors influence Bonk’s price movement?
BONK’s price moves are shaped by market positioning, liquidity zones, resistance levels, and broader crypto market trends.
Is Bonk (BONK) a good long-term investment?
If BONK sustains demand zones and market relevance, it shows potential for long-term growth, though volatility remains high.
The crypto market bears have strengthened since the start of the month as the top tokens, Bitcoin and Ethereum, have attracted significant selling pressure. While BTC price is feared to drop below $60,000, ETH is showing mixed but increasingly cautionary signals. Now that the Ethereum price is about to test one of the crucial support levels at $2000, the question arises whether the distribution phase is about to begin.
Ethereum Transfer Activity Hits 1.17 Million
On-chain data shows Ethereum transfer count has surged to 1.17 million, a level historically associated with late-cycle market behavior. Similar spikes were last seen near market tops in 2018 and 2021, periods that preceded sharp volatility and prolonged consolidations.
While high network activity is often interpreted as bullish, history shows that activity peaks without sustained price expansion can signal distribution. In such phases, large holders continue transacting, but price struggles to trend higher as supply gradually outweighs demand.
Notably, Ethereum’s price has failed to establish a strong upside continuation despite rising transfers, reinforcing the view that network usage is no longer translating into directional price strength.
ETH Price Drifts Toward a High-Liquidity Zone
At the same time, derivatives data highlights a dense liquidity cluster between $1,800 and $2,000, where a large concentration of leveraged positions sits. Liquidation heatmaps show this zone acting as a magnet for price, particularly during periods of weakening momentum.
As ETH moves closer to this range, downside liquidity becomes increasingly attractive from a market-structure perspective. In distribution environments, price often drifts toward areas with maximum liquidation potential, rather than breaking higher resistance levels. This setup suggests that short-term price action may remain reactive and volatility-driven, with sharp moves possible as leverage is flushed out.
What Traders Should Watch Next
Both charts combined indicate active participation with potential supply rotation with the probability of downside tests. The second-largest token now appears to be more vulnerable to liquidity-driven moves due to a lack of strong upside follow-through. These points hint towards a distribution phase where markets transition from momentum-driven to balance-seeking behaviour.
Overall, the Ethereum (ETH) price is not showing signs of panic or breakdown, but the data suggests the risk remains skewed to the downside in the near term.
Crypto markets are moving lower, but the broader picture remains one of caution rather than panic. Bitcoin and Ethereum have both slipped after weeks of subdued trading, while capital has not rotated into higher-risk assets. At press time, Bitcoin (BTC)…
Payward’s Kraken unit posted $2.2b in 2025 adjusted revenue and $2t in trading volume, while LiquidChain launched a cross-chain Layer 3 touting 1,965% staking rewards. Payward Inc., the parent company of cryptocurrency exchange Kraken, reported $2.2 billion in adjusted revenue…
SBI and Startale launched Strium, a Layer 1 for 24/7 tokenized securities trading, with a yen stablecoin and testnet slated for 2026 to plug into Asia’s capital markets. SBI Holdings and Startale Group announced the launch of Strium, a Layer…
Congress hears that Treasury can’t bail out Bitcoin or force banks to buy it, even as Trump’s strategic reserve keeps seized BTC that has swelled from $500m to $15b. U.S. Treasury Secretary Scott Bessent told Congress on Wednesday that the…
AI agents will increasingly transact and interact on-chain, with blockchains providing identity, payments, and contract rails to prevent impersonation and automate tasks. Venture capital firm Andreessen Horowitz (A16Z) stated that blockchain technology may serve a critical function in verifying artificial…
SoFi posts record quarter with $1B revenue, stronger crypto and payments push, and 2026 growth outlook as shares climb over 6% on guidance. SoFi Technologies Inc. reported its first billion-dollar revenue quarter and net income of $173.5 million in the…
SBI Holdings CEO Yoshitaka Kitao shared Ripple’s XRP Community Day 2026 announcement on X today, drawing attention to what’s shaping up to be a major event for the XRP ecosystem.
The global virtual event is scheduled for February 11-12 and will feature Ripple CEO Brad Garlinghouse, President Monica Long, and a lineup of speakers from some of the biggest names in crypto and traditional finance.
According to Ripple’s blog, the event will bring together “XRP holders, builders, institutions, and Ripple leaders” to discuss the growing utility and adoption of XRP and the broader XRPL ecosystem.
Why the Speaker Lineup Matters
The names on this roster are worth paying attention to.
Grayscale’s Head of Product & Research, Rayhaneh Sharif-Askary, will speak on regulated XRP investment products and the growth of crypto ETFs and ETPs globally. Brad Vopni, Head of Institutional at Gemini, and Bitnomial President Michael Dunn are also part of the event.
Ripple also teased a “surprise guest” for a fireside chat on tokenized finance with Markus Infanger, SVP of RippleX. No details yet on who that might be.
Wrapped XRP Comes to Solana
One session that stands out covers wrapped XRP expanding to other blockchains, starting with Solana. Solana Foundation’s Interim CMO Vibhu Norby and Hex Trust’s CPO Giorgia Pellizzari will discuss what this means for liquidity, access, and real-world use across chains.
Monica Long will lay out Ripple’s key priorities for 2026, with XRP at the center of the company’s strategy. Other sessions will cover stablecoins, DeFi on XRPL, ecosystem funding, and the introduction of a new XRPL Foundation Executive Director.
David Schwartz, co-creator of the XRPL, will close out the APAC session with a live community Q&A.
XRP Community Day kicks off next week!@JoelKatz returns with @sentosumosaba to take some of YOUR questions and share his perspective on how XRP use cases have evolved, what matters most for adoption, and where real progress is happening.
The event runs across three live X Spaces on Ripple covering EMEA and Americas on February 11, and APAC on February 12.
Attendees can RSVP through Luma for reminders, and recordings will be posted on Ripple’s official channels after the event.
Never Miss a Beat in the Crypto World!
Stay ahead with breaking news, expert analysis, and real-time updates on the latest trends in Bitcoin, altcoins, DeFi, NFTs, and more.
FAQs
When is the XRP Community Day 2026 event?
The global virtual event is scheduled for February 11-12, 2026, featuring live X Spaces sessions for different time zones. Recordings will be available on Ripple’s official channels afterward.
Who are the key speakers at XRP Community Day 2026?
Key speakers include Ripple CEO Brad Garlinghouse, President Monica Long, XRPL co-creator David Schwartz, and executives from Gemini, Grayscale, and the Solana Foundation, discussing adoption and strategy.
How can I attend the XRP Community Day 2026 event?
Join via live X Spaces on Ripple’s X account. You can RSVP on Luma for session reminders. It’s a free, global virtual event open to all.
Bitcoin briefly dropped below the $70,000 mark for the first time since November 2024 and is now trading at $70,131, down 5.34% in the past 24 hours. Ethereum also faced heavy selling pressure, sliding to $2,095 after a sharp 6.96% daily decline. Market volatility triggered massive liquidations, with CoinGlass data showing $951 million wiped out in the last 24 hours. Long traders were hit the hardest, accounting for $790 million of the total liquidations, as the sudden sell-off caught bullish bets off guard.
Dogecoin price slid sharply nearly 7% intraday and dipped below the key $0.10 support zone amid broader market weakness. The decline comes despite renewed “moon mission” chatter linked to Elon Musk’s recent social media interaction, showing that the meme coin’s traditional narrative drivers may be losing momentum in the current macro environment. While DOGE did briefly react to Musk-related posts earlier in the week, the response has so far failed to sustain a bullish trend, leaving price vulnerable as sellers remain in control.
Elon Musk’s recent reply on X, hinting that SpaceX “maybe next year” could support the long-delayed DOGE-1 lunar mission sparked modest interest in Dogecoin, with markets initially posting gains. However, the hype was short-lived. Unlike past cycles where similar comments triggered extended rallies, DOGE’s bounce lacked follow-through and quickly gave way to renewed selling.
BREAKING: Elon Musk says SpaceX will likely put Dogecoin on the moon next year, calling a Dogecoin to the moon moment inevitable. pic.twitter.com/ZulhZXDelV
This suggests that narrative catalysts alone are not carrying the same market influence they once did, especially when broader crypto sentiment is under pressure.
ETF Flows Lose Momentum as DOGE Price Fails to Respond
Dogecoin spot ETF data paints a mixed picture rather than a bullish one. During early January, DOGE ETFs recorded a weekly net inflow of roughly $252K, followed by additional single-day inflows near $1.9M–$2.6M in subsequent sessions. These spikes briefly lifted cumulative inflows to around $6.7M, while total net assets hovered near $9.3M.
However, these inflows failed to persist. Several sessions quickly flipped back into net outflows, highlighting a lack of sustained institutional conviction. Trading volumes also remained uneven, suggesting that most activity was reactive rather than trend-driven. In short, ETF participation exists but it is tactical, not directional. Without consistent inflows, DOGE has struggled to find a structural bid.
Dogecoin Price Analysis: What the Chart is Really Saying
Dogecoin price has been trading inside a well-defined descending channel, but the latest move is critical, as DOGE price has fallen toward the support trendline that had held since the previous consolidation phase. This drop shifts near-term control firmly toward sellers. Recent rallies are getting cut short earlier, while drops are stretching deeper than before. Each recovery attempt loses momentum near the same zone, while downside moves travel further. At press time, DOGE price trades at $0.098, below the short-term moving averages, underlying weakness.
On the downside, the $0.098–$0.095 zone now stands out as the first major support. A daily close below $0.095 would expose DOGE to a deeper pullback toward the $0.088–$0.090 range, which represents the channel base and a historically reactive level. On the upside, immediate resistance sits near $0.105–$0.108, where price was repeatedly rejected after the breakdown. Above that, the more decisive level remains $0.118–$0.120, coinciding with the descending channel’s midline. Until DOGE reclaims this zone with volume expansion, rebounds are likely to remain corrective rather than trend-reversing.
Liquidation Heatmap Shows Heavy Pressure Below $0.10
Liquidation data shows that Dogecoin has already swept most downside liquidity following the recent sell-off, reducing the immediate incentive for price to push sharply lower from current levels. As DOGE dipped below the $0.10 zone, clusters of long liquidations were largely cleared, easing near-term downside pressure. Now, attention is shifting to overhead liquidity, where dense clusters are building between $0.129 and $0.132. These levels mark areas where a large concentration of short positions remains exposed. If price begins to grind higher and approaches this zone, it could trigger forced short covering, potentially accelerating upside momentum.
Notably, this setup reflects a market driven more by liquidity positioning than organic spot demand. Traders are watching whether DOGE can attract enough buying pressure to move into these liquidity pockets. Without follow-through, price risks remaining range-bound. However, a decisive push toward these levels could quickly change market dynamics, turning a slow recovery into a sharper liquidity-driven move.
FAQs
Did Elon Musk’s recent tweet affect Dogecoin’s price?
While Musk’s hint about the DOGE-1 mission sparked initial gains, the rally was short-lived, suggesting such narrative catalysts now have less influence amid overall negative market sentiment.
What is the price prediction for Dogecoin (DOGE)?
Dogecoin faces immediate resistance near $0.105-$0.108. A daily close below key support at $0.095 could see a pullback toward $0.088, while reclaiming $0.120 is needed for a potential trend reversal.
Are Dogecoin ETFs a good investment right now?
DOGE ETF flows have been inconsistent, flipping between inflows and outflows, indicating a lack of sustained institutional conviction and making them a tactical, rather than directional, investment currently.
What is the liquidation heatmap saying for Dogecoin?
Liquidation data shows heavy short positions clustered overhead near $0.129-$0.132. A price move toward that zone could trigger a short squeeze, but it requires stronger buying pressure than currently exists.
Bitcoin price continued to face heavy selling pressure this week, trading near the $71,000 level and showing signs of further downside as broader market uncertainty builds. Market observers warn that a break below the $70,000 psychological support could open the door to a deeper correction into the $60,000 range or lower.
Bitcoin Bear Market Duration Shows a Clear Downtrend
Past Bitcoin bear markets show a clear trend of becoming shorter with each cycle. The first major downturn lasted about 410 days. The second cycle lasted around 365 days. The most recent completed bear market lasted roughly 330 days. This shows that Bitcoin’s price declines have taken less time over the years.
Despite this pattern, some analysts still use an average duration of about 370 days to estimate market bottoms. This approach ignores the steady shortening of market cycles.
When historical data is analyzed using trend-based models, the current bear market is projected to last closer to 288 days. Measured from Bitcoin’s all-time high on October 6, this points to a possible market bottom around July 21, 2026.
On-Chain Data Highlights $60,000 as a Potential Bitcoin Bottom Zone
More signs of a possible Bitcoin price bottom come from a long-used market indicator that compares how much Bitcoin is currently in profit versus how much is in loss.
In previous market declines, Bitcoin has often reached its lowest point when these two amounts moved close to each other.
Right now, about 11 million Bitcoins are still in profit, while roughly 9 million are sitting at a loss. If these figures continue to narrow at current price levels, it would point to a Bitcoin price near $60,000, which closely matches where past market bottoms have formed.
Bitcoin Price Bottom Timeline
Based on the historical view, Bitcoin’s price could hit a low as early as May 14, well ahead of the July estimate suggested by longer-term trend models. Even though the timelines differ, both point toward the same price area, making $60,000 an important level to watch.
While market conditions can change quickly and no single method can predict prices with certainty, the way past trends, price behavior, and supply data line up this cycle suggests the downturn may be shorter than in previous years.
The economic conditions and unexpected events could still affect the outcome, but the repeating patterns seen across multiple Bitcoin cycles offer useful context for those watching Bitcoin’s long-term price direction.
Never Miss a Beat in the Crypto World!
Stay ahead with breaking news, expert analysis, and real-time updates on the latest trends in Bitcoin, altcoins, DeFi, NFTs, and more.
FAQs
What is causing Bitcoin’s current price decline?
Bitcoin is under pressure due to market uncertainty, profit-taking, and weakening sentiment, with traders watching the $70,000 support closely.
Is Bitcoin currently in a bear market?
Market data suggests Bitcoin is in a corrective phase, with price behavior and cycle trends aligning with past bear market conditions.
Are Bitcoin bear markets getting shorter over time?
Yes, historical cycles show each Bitcoin bear market has lasted fewer days, suggesting faster corrections as the market matures.
When could Bitcoin reach its next market bottom?
Based on trend models and historical patterns, Bitcoin could form a price bottom between mid-2025 and mid-2026, depending on market conditions.
The global market crash has hit the crypto market hard, wiping out $184 billion in value and pushing the total market cap down to $2.43 trillion. Bitcoin is now trading around $71,470, just $2,000 above its key 2021 all-time high of $69,000.
Meanwhile, traders fear that if Bitcoin breaks its 15-year pattern, the market could face further downside.
Bhutan Selling BTC Led The Drop
One of the reasons behind this bitcoin price drop is selling from wallets linked to Bhutan’s Royal Government. During this market dip, Bhutan sold more than $22 million worth of Bitcoin, transferring over 284 BTC to institutional market maker QCP Capital.
Data shows that Bhutan has been selling Bitcoin in batches of nearly $50 million over the past few months.
Meanwhile, experts believe this selling is mainly due to rising mining costs after the latest Bitcoin halving, which has reduced profits for sovereign and state-linked miners.
Coinbase Premium Turns Deeply Negative
Another key signal comes from the Coinbase Premium Gap. This metric compares Bitcoin prices on Coinbase versus Binance. It has now turned deeply negative, the lowest level this year, indicating strong selling from institutional traders
This institutional selling has been clearly visible in Bitcoin ETFs for the past three weeks.
On February 4, 2026, alone, U.S. spot Bitcoin ETFs saw about $545 million in net outflows, with BlackRock’s IBIT losing roughly $373 million.
CryptoQuant Data Show STH Selling BTC In Losses
CryptoQuant data shows that short-term holders (STH) are panicking as Bitcoin continues to fall. In the last 24 hours, these holders have sent nearly 60,000 BTC to exchanges, marking the highest single-day inflow seen this year.
Most of these coins were moved at a loss, meaning recent buyers are exiting under pressure.
At the same time, long-term holders are mostly inactive, with very little profit-taking from older wallets. This pattern usually appears during strong and heavy market corrections.
As of now, Bitcoin is testing a very important historical price level. It is now just $2K away from hitting the previous ATH of $69,000 from the last cycle in 2021.
For 15 years, Bitcoin has followed one strong pattern, it has never stayed below the previous cycle’s all-time high. In every cycle, old highs turned into long-term support. This rule held in 2014, 2018, and even during the 2022 crash.
Now the market is testing that rule again. If Bitcoin drops and stays below $69,000, it would be the first time this historic pattern breaks. That could signal a major change in market structure and open the door for a deeper fall toward the $62,442 level.
Stay ahead with breaking news, expert analysis, and real-time updates on the latest trends in Bitcoin, altcoins, DeFi, NFTs, and more.
FAQs
How might institutional behavior change if volatility continues?
Prolonged volatility often leads institutions to reduce exposure or hedge positions. This can lower short-term liquidity and slow recovery momentum even if prices stabilize.
Who is most affected by the current market structure shift?
Recent buyers and leveraged traders face the highest risk, as price swings can force liquidations. Long-term holders are typically less impacted unless support breaks decisively.
What indicators will traders watch next to gauge market direction?
Traders will closely track ETF fund flows, exchange inflows, and whether Bitcoin reclaims key levels. These signals often shape sentiment before price trends reverse.
Ethereum co-founder Vitalik Buterin has sold a significant amount of his personal ETH holdings over the past several days. According to blockchain analytics shared by Lookonchain, Vitalik has offloaded 2,961.5 Ethereum (ETH), worth approximately $6.6 million, at an average price…
Recent volatility reviews, new surveillance systems and a landmark court ruling show how South Korea is enforcing stricter oversight of crypto markets.
Bitcoin ETFs saw $545 million in daily outflows as BTC neared $70,000, though analysts said most investors were holding positions despite market weakness.
A Nevada judge declined to grant regulators’ bid to halt Coinbase’s event contract markets, as the exchange presses a CFTC preemption argument in federal court.
USDt added $12.4 billion in Q4 to reach a $187.3 billion market cap, increasing users and onchain activity even as rival stablecoins declined after October’s liquidation event.
Tron tightens its USDT lead over Ethereum as network activity and BTC reserve plans climb, yet TRX price lags, retracing into a multi‑month consolidation range. The Tron network has surpassed Ethereum in stablecoin supply, marking a shift in the competitive…
Coinbase has secured an early procedural win in its legal standoff with Nevada regulators, blocking an emergency effort to immediately shut down its prediction markets offering in the state. A Nevada court declined to grant the Nevada Gaming Control Board’s…
Ethereum co-founder Vitalik Buterin has pushed back against what he described as a lack of originality in the current layer-2 and blockchain scaling landscape. In a blog post published earlier today, Buterin said the ecosystem has grown too comfortable with…
DeFi platform Aperture Finance has suffered a major security breach, losing about $3.67 million in a smart contract exploit. Blockchain security firm PeckShieldAlert shows the hacker is actively moving stolen funds through Tornado Cash, a privacy-mixing service.
The activity has raised new concerns about fund recovery and how the actual hack happened.
How The Aperture Finance Exploit Happened
According to PeckShieldAlert, the Aperture Finance hack happened on January 25, 2026, due to a weakness in its V3 and V4 smart contracts, combined with existing user token approvals.
In DeFi platforms, users often permit contracts to move their ERC-20 tokens or liquidity position NFTs so trades and strategies can run automatically. But in this case, the exploiter found a flaw in how the contract handled those permissions and function calls.
Instead of breaking wallets or stealing private keys, the attacker used the contract’s own logic to trigger unauthorized asset transfers.
Because many users had already granted approvals, the attacker could move funds without needing new signatures. This allowed them to drain assets tied to approved tokens and liquidity positions.
Funds Moved to Tornado Cash After Hack
And all this led to the extraction of $3.67 million in value, the attacker converted a large share into ETH, and sent about 1,242 ETH to Tornado Cash to hide the trail.
Attackers often use mixing services like Tornado Cash to hide the origin of stolen crypto and make tracking more difficult. The funds were sent in multiple small transactions, including batches of 10 ETH and 100 ETH, a common method used to avoid attention.
Following the exploit, the Aperture Finance team released an emergency notice and shared a list of affected contract addresses. And also warned users to urgently revoke both ERC-20 token approvals and ERC-721 liquidity position approvals tied to the risky addresses.
Affected Contract List
Please cross-reference your ERC-20 and liquidity position (ERC-721) approvals against the addresses listed in the image below. All such approvals to these addresses should be revoked. pic.twitter.com/Sn1BJ8fh92
Ethereum co-founder Vitalik Buterin has taken aim at the current state of Layer 2 projects in a follow-up post that has the crypto community talking. According to Buterin, most L2s are recycling the same tired formula and adding nothing new to Ethereum.
He compared the standard L2 approach to “forking Compound,” calling it “something we’ve done far too much for far too long, because we got comfortable, and which has sapped our imagination and put us in a dead end.”
“We don’t friggin need more copypasta EVM chains, and we definitely don’t need even more L1s,”he added.
Why the Original L2 Vision No Longer Works
Buterin’s frustration didn’t come out of nowhere. In an earlier post, he pointed to two key problems: L2 progress toward Stage 2 security has been much slower than expected, and Ethereum L1 is now scaling on its own, with gas limit increases planned for 2026.
“The original vision of L2s and their role in Ethereum no longer makes sense, and we need a new path,” he said.
With L1 set to handle a lot more blockspace directly, the main reason most L2s exist, scaling, is losing relevance.
What Vitalik Wants Ethereum L2s to Focus On
Instead of more generic EVM chains, Buterin wants L2s building around privacy, app-specific efficiency, ultra-low latency, and emerging sectors like AI, social platforms, and digital identity. These are areas where even a scaled L1 won’t be enough.
From Ethereum’s side, he also pushed for a native rollup precompile, a protocol-level tool that would verify ZK-EVM proofs and give real L2s secure, trustless connections to Ethereum without relying on security councils.
Buterin also had a clear message on L2 branding. If your project barely depends on Ethereum for security, stop calling yourself an Ethereum L2.
“The degree of connection to Ethereum in your public image should reflect the degree of connection to Ethereum that your thing has in reality,” he said.
With Ethereum L1 scaling fast and Buterin publicly reshaping what counts as a legitimate L2, projects still running the 2021 playbook could find themselves without a purpose.
Never Miss a Beat in the Crypto World!
Stay ahead with breaking news, expert analysis, and real-time updates on the latest trends in Bitcoin, altcoins, DeFi, NFTs, and more.
Bitcoin remains under pressure, trading close to $72,000, despite a recovery from $70,034, while Ethereum hovers around $2,100, struggling to reclaim key short-term resistance. Broader market sentiment stays cautious as derivative positioning turns defensive and spot demand remains muted, keeping upside moves across majors limited.
Despite this risk-off backdrop, select altcoins are beginning to diverge from Bitcoin’s weakness. Prices of Hyperliquid and MYX Finance have staged short-term recoveries, attracting fresh speculative interest. The rebound suggests early positioning rather than trend confirmation, but it highlights how capital is selectively flowing into altcoins even as BTC and ETH remain range-bound under selling pressure.
MYX Finance (MTX) Price Set for a Bullish Breakout
The MYX Finance price has been rising in a bullish pattern since the November rebound, which has kept the bullish possibility alive. After the rebound from the support of the rising parallel channel, the price is consolidating within a tight range, suggesting a strong compression. As the price continues to consolidate within the upper bands of the Bollinger, a breakout appears to be on the horizon.
Although the markets are experiencing significant selling pressure, the MYX price is gearing up for a breakout. The MACD is heading for a bullish crossover as the buying volume is rising effectively. Therefore, the price is expected to enter the immediate resistance zone between $7.05 and $7.38 and may further test the resistance of the channel at $8.5. Considering the current market conditions, a breakout seems to be unlikely, but the crypto may continue to maintain an ascending trend consolidation until it rises above $10.
Hyperliquid (HYPE) Price Enters a Crucial Range
The Hyperliquid price has been maintaining a strong upswing since late January 2026, attracting more than 75% gains. In times when the price is heading towards its ATH, the pullback can be considered as an interim correction. The technicals remain bullish, hinting towards continued price action towards the final resistance zone.
The price has entered a decisive phase between $34.94 and $35.95, which can be considered a trend reversal zone, as the price range had been offering strong support earlier. The Ichimoku cloud turns bullish, while the price consolidates above the cloud, hinting towards growing bullish strength. On the other hand, the RSI is hovering around the upper threshold, hinting towards the growing strength of the rally. Therefore, these technicals hint towards a continued upswing and secure the resistance.
Overall, the rebound in these altcoins appears to be a short-term rotation, but not a clear shift in trend. A sustained upswing in the prices of MYX Finance and Hyperliquid may depend on the growing strength in the top cryptos like Bitcoin & Ethereum. The ETH price is showing stability, while the BTC price may remain volatile and indecisive. Therefore, until Bitcoin rises above the threshold, the consolidation may prevail.
The broader crypto market came under heavy pressure today as a sharp wave of crypto liquidations ripped through leveraged positions, dragging Bitcoin, Ethereum, and major altcoins lower within hours. Over $700 million in crypto positions were liquidated during the session, with long traders bearing the brunt of the damage. The speed of the move suggests the decline was driven less by fresh selling and more by cascading margin calls as key intraday supports failed.
Crypto Liquidations Drive the Selloff as Leverage Unwinds
Today’s market selloff triggered over $700 million crypto positions liquidated over the past 24 hours, with long positions accounting for the clear majority of losses. Bitcoin led the wipeout, accounting for over $410 million in liquidations, as BTC slipped toward the $71,000 level. Ethereum followed closely, with roughly $208 million in ETH positions liquidated as price dropped near $2,100. XRP and other large-cap altcoins contributed the remainder, as cascading stops were triggered across derivatives markets.
The liquidation skew was heavily long-biased, signaling a mechanical leverage reset rather than panic-driven selling.
Open interest fell sharply alongside the liquidations, showing that traders were being forced out of positions instead of exiting voluntarily. In short, today’s move reflects leverage flushing out of the system, not a mass exit by long-term holders.
Bitcoin Price Slides 5% as Liquidation Clusters Get Swept
Bitcoin’s decline accelerated after BTC lost key intraday support and slipped nearly 5% to the $71,000 zone, triggering a sharp liquidation cascade across futures markets. Liquidation data shows roughly $409 million worth of Bitcoin positions were force-closed during the move, with long traders accounting for the overwhelming majority. The selloff was mechanically driven. As Bitcoin price broke below short-term support levels near the mid-$74K range, liquidation clusters stacked around $73K and $72K were rapidly cleared. This forced selling amplified downside momentum, dragging price swiftly toward $71K before bids began to stabilize.
Importantly, spot market behavior remained relatively composed. Exchange inflows did not spike aggressively, suggesting the move was fueled by excess leverage unwinding, not panic-driven spot selling. In classic fashion, futures markets led the decline, while spot liquidity lagged behind. For now, Bitcoin’s ability to hold above the $70K–$71K region will be closely watched. A failure to stabilize around $70k could expose deeper downside, while consolidation here may signal that the bulk of forced selling has already played out.
Ethereum Price Drops to $2100 as Leverage Reset Mirrors Bitcoin
Ethereum tracked Bitcoin’s weakness almost tick for tick, falling nearly 5% to around $2,100 as liquidation pressure spilled across correlated markets. Data indicates approximately $208 million in Ethereum futures positions were liquidated, again dominated by long-side losses. ETH’s decline was not driven by Ethereum-specific developments. Instead, it reflected a broader deleveraging event as traders reduced exposure across majors once Bitcoin broke lower. Once ETH price lost support near the $2,250–$2,300 area, liquidation thresholds were quickly hit, accelerating the slide toward $2,100.
From here, Ethereum’s short-term outlook hinges on whether $2,000 can hold as a stabilization zone. A sustained failure below this level would keep pressure on the downside, while consolidation could allow volatility to compress as leverage resets.
Market Outlook
Today’s market sell-off carries a clear message: the market was over-leveraged. The $700M liquidation wave acted as a reset mechanism, forcing out crowded bullish positions without triggering mass spot exits. If liquidation pressure continues to ease and open interest stabilizes, markets may attempt to consolidate at lower levels. However, until Bitcoin and Ethereum reclaim broken supports, volatility is likely to remain elevated. For now, crypto markets are not collapsing, they are deleveraging. History shows that how price behaves after leverage resets often defines the next major trend.
FAQs
What caused the crypto market to crash today?
A sharp $700 million liquidation wave triggered a cascade of forced selling in leveraged futures markets, rapidly pulling down Bitcoin, Ethereum, and altcoin prices within hours.
How much was liquidated in the crypto market selloff?
Over $700 million in crypto positions were liquidated, with Bitcoin longs accounting for over $410 million and Ethereum longs for roughly $208 million of that total.
What does a long liquidation mean in crypto?
It means traders who bet on prices rising using borrowed funds were forced to sell as prices fell, triggering more automatic sell orders and accelerating the downturn in a short-term cascade.
South Korea’s Financial Supervisory Service (FSS) has opened an investigation into ZKsync (ZK) after the token surged nearly 970% in just three hours on Upbit, the country’s largest crypto exchange.
The February 1 spike happened right around a scheduled maintenance window, and regulators suspect coordinated price manipulation.
So, is trouble brewing?
All About the ZKsync Pump
ZKsync was trading at around 33 KRW that morning. By 11:30 AM, just before Upbit’s maintenance began, the price shot up to 350 KRW. By 6:30 PM, when maintenance ended, it had dropped back to the 30 KRW range.
“We are aware that ZKsync experienced a rapid price fluctuation in a short period of time,” a spokesperson for the FSS’s Virtual Asset Investigation Bureau said. “We may quickly transition to a formal investigation after determining the severity of the case.”
Blockchain data showed that 15 previously inactive wallets bought over 4.2 million ZK tokens in the 30 minutes leading up to the maintenance window. Once the price peaked, the same wallets sold, with estimated profits of around $18.7 million.
Upbit’s Volume Spike Stood Out
Upbit recorded a 4,200% spike in ZKsync trading volume on February 1. In comparison, Binance saw a 180% increase and Coinbase logged 150%.
The price on those exchanges moved just 38-42%, while Upbit saw nearly 987%.
Legal experts say the incident likely falls under the Virtual Asset User Protection Act, which came into effect in 2024.
Jin Hyeon-su, managing partner at Decent Law Firm, pointed out that the pattern of “a large number of buy orders being concentrated in a short period of time, followed by a release of the volume afterwards” likely constitutes “price manipulation, collusive trading, and unfair trading.”
Under the law, offenders face over a year in prison and fines up to five times their profits.
Regulators Are Already Moving
This is not an isolated case. A Seoul court sentenced the CEO of a crypto management firm to three years in prison on February 4 for manipulating token prices on Bithumb.
The FSS has also announced plans to use AI-powered tools for real-time crypto market surveillance, a clear sign that South Korea’s crackdown on altcoin manipulation is picking up pace.
Never Miss a Beat in the Crypto World!
Stay ahead with breaking news, expert analysis, and real-time updates on the latest trends in Bitcoin, altcoins, DeFi, NFTs, and more.
FAQs
Why is South Korea investigating ZKsync?
Regulators suspect coordinated price manipulation after ZKsync surged nearly 970% on Upbit during a maintenance window and quickly collapsed.
What happened to ZKsync’s price on Upbit?
ZK jumped from 33 KRW to 350 KRW in hours, then fell back near 30 KRW after trading resumed, raising red flags for abnormal activity.
Could ZKsync traders face legal penalties?
Yes. Under South Korea’s Virtual Asset User Protection Act, proven manipulation can lead to prison terms and fines up to five times profits.
Is South Korea increasing crypto market surveillance?
Yes. The FSS plans to deploy AI-based monitoring tools to detect real-time manipulation as part of a broader crypto enforcement crackdown.
U.S. spot Bitcoin ETFs log $545M in daily outflows as BTC, ETH, and SOL slip, exposing how concentrated ETF ownership can amplify downside in a risk-off tape. U.S. spot Bitcoin (BTC) ETFs just logged another sharp outflow day, underscoring how…
Dogecoin has long lived in the hearts of crypto traders as much for its “to the moon” narrative as for its technical price behavior. With recent comments from Elon Musk suggesting SpaceX may put a literal Dogecoin (DOGE) on the…
XRP price has crashed nearly 50% since Q4 2025, yet over 500k new wallets pushed the ledger above 7.5m accounts, creating a sharp divergence between price and participation. XRP’s (XRP) price has been gutted; its network has not. Despite a…
Bitcoin is printing massive bearish candles for the third consecutive day, dragging the price down by more than 10% this week. The BTC price hit an intraday low very close to $70,000, but it did not attract strong buying volume. This raises the possibility of the start of the bearish phase, and the data from Glassnode below hints towards a deeper correction.
The risk indicator shows Bitcoin trading below the Short-Term Holder (STH) realized price, a level that often defines near-term market control. When BTC holds below this red cost-basis line, recent buyers remain underwater, and upside moves typically face selling pressure.
At the same time, price is drifting closer to the Active Investor Mean and True Market Mean, suggesting the market is rotating toward lower on-chain cost bases. Historically, this structure reflects bearish dominance in the short term, with price action driven more by risk reduction than fresh accumulation.
Rising Realized Losses Signal Capitulation
The Realised Loss chart shows a sharp rise in realised losses as Bitcoin’s price continues to decline. The recent spikes indicate that a growing number of investors are selling coins at a loss, reflecting rising stress among short-term participants.
Historically, sustained increases in realized losses tend to appear during corrective or distribution phases, when downside momentum forces weaker hands to exit positions. The elevated 7-day average suggests selling pressure remains active, reinforcing the view that current price action is driven by capitulation rather than confident buying.
Institutional Netflows Turn Negative
The BTC DAT Netflow chart shows a clear shift into negative netflows across spot ETFs, corporate treasuries, and government-linked wallets. This indicates that large holders are distributing rather than accumulating, removing a key source of structural demand.
As institutional netflows slip below neutral, Bitcoin price action weakens alongside it, suggesting that recent declines are being reinforced by capital outflows from major entities, not just retail selling. Until netflows stabilize or turn positive, upside momentum remains limited.
Put Option Demand Surges as Traders Hedge Against Bitcoin
The chart shows a sharp rise in put premiums bought for the $75K strike, while net put premiums turn decisively positive. This indicates traders are increasingly paying up for downside protection, reflecting growing bearish expectations in the short to mid term.
At the same time, Bitcoin price trends lower as put demand accelerates, reinforcing the view that market participants are positioning defensively rather than betting on a near-term rebound. Elevated put activity typically signals risk-off sentiment and heightened downside caution.
The Final Verdict: Are the Bitcoin Bears in Control?
The data shows Bitcoin price is under pressure, but not in free fall. The price sitting below the short-term holder cost basis tells us recent buyers are stuck in losses, which explains why every bounce runs into selling. The rise in realized losses confirms that some traders are now exiting positions under stress, not rotating calmly.
What matters more is that big money isn’t stepping in yet. Institutional netflows remain weak, and the jump in put option demand shows traders are paying for protection rather than betting on a quick recovery. That’s a clear sign of caution, not confidence.
Overall, this looks like a defensive, risk-off phase where the market is trying to find balance after excess optimism. Conditions can still stabilize, but until selling pressure cools and demand improves, upside moves are likely to stay limited and fragile.
FAQs
Is Bitcoin starting a bear market?
Current data suggests a bearish short-term phase, with price below key holder cost bases and rising institutional outflows, but this indicates a correction, not necessarily a long-term bear market.
Why is the Bitcoin price dropping sharply?
The drop is driven by several factors: recent buyers are selling at a loss, institutional netflows have turned negative, and traders are actively hedging against further downside with put options.
Are big institutions still buying Bitcoin?
Recent data shows a clear shift; major entities like spot ETFs and corporate treasuries are now in distribution mode, creating net outflows and removing a key source of market demand.
Should I buy the Bitcoin dip right now?
Current indicators show high caution, with weak buying volume and strong defensive hedging. Until selling pressure cools and demand improves, near-term rallies are likely to face significant resistance.
The crypto market is going through a sharp downturn. The total value of all cryptocurrencies has fallen close to $2.31 trillion, a level last seen in April 2025. In just 22 days, the market has lost more than $900 billion, showing how fast prices have dropped.
Bitcoin and Ethereum Price Crash Are Dragging the Market Down
The biggest cryptocurrencies are leading the fall:
Bitcoin has dropped about $20,000, falling from $90,000 to $70,000, a decline of 23%.
Ethereum has fallen nearly $1,000, dropping from $3,050 to $2,070, down 32%.
As prices fell quickly, many traders were forced to exit their positions. More than $7 billion worth of trades were closed automatically due to losses. In the past 24 hours alone, total losses crossed $833 million, as Bitcoin briefly slipped toward $71,000.
Large Bitcoin Sales Increase Pressure
Selling by large holders has added to the pressure. Bhutan sold $22.4 million worth of Bitcoin this week, as the value of its crypto holdings dropped more than 70%. The country’s portfolio has fallen from a peak of $1.4 billion to around $412 million.
Such large sales during a market downturn often increase fear among investors and push prices down further.
Altcoins Continue to Struggle
Altcoins continue to struggle, with some of the biggest names seeing sharp declines. Bitcoin ($BTC), Ethereum ($ETH), Solana ($SOL), and XRP ($XRP) have been among the hardest hit, adding to the overall market weakness.
Several major altcoins are now trading near multi-year lows, reflecting reduced investor confidence across the market.
Avalanche (AVAX) is testing a long-standing price level near $9, its lowest point in years.
Ethereum continues to experience persistent selling pressure, with prices showing no clear signs of stabilization. A minor support level is visible near $1,744, but the next major support lies around $1,350, close to the lows formed in April 2025. Failure to hold current levels could lead Ethereum toward this zone.
Solana has declined by nearly 6%, breaking its April 2025 support. The next key support for SOL is expected near the $80–$79 range, where buyers may attempt to step in.
Sharp price swings have triggered widespread forced selling. On the trading platform Hyperliquid alone, more than $50 million worth of long positions were wiped out, showing how extreme volatility is hurting traders betting on price recovery.
Overall, the continued losses in altcoins suggest investors are stepping back from riskier assets rather than buying during the downturn.
Global Economic Factors Are Hurting Crypto
Broader economic conditions are also playing a major role in the crash:
Investors are putting more money into safer assets like gold and silver, reducing interest in cryptocurrencies.
Markets now believe there is a 90% chance that interest rates will stay between 3.50% and 3.75%, and only a 10% chance of a rate cut at the March 18 U.S. Federal Reserve meeting.
Because of this, even the end of the U.S. government shutdown failed to lift crypto prices, as investors remain focused on high interest rates.
Never Miss a Beat in the Crypto World!
Stay ahead with breaking news, expert analysis, and real-time updates on the latest trends in Bitcoin, altcoins, DeFi, NFTs, and more.
FAQs
Why is the crypto market down today?
Crypto is down today due to heavy selling, forced liquidations, fading rate-cut hopes, and investors shifting money into safer assets like gold.
Why are Bitcoin and Ethereum leading the decline?
Bitcoin and Ethereum dominate market value, so heavy selling, leverage liquidations, and profit-taking in these assets pull the entire market lower.
Are altcoins more risky during a market downturn?
Yes. Altcoins usually fall harder than Bitcoin as investors avoid risk, liquidity dries up, and weaker projects lose buyer support.
On February 4, U.S. spot Bitcoin ETFs recorded total net outflows of $545 million, with BlackRock’s iShares Bitcoin Trust (IBIT) seeing the largest single‑day withdrawal at about $373 million. Spot Ethereum ETFs also saw net outflows of $79.48 million, reflecting continued selling pressure in major crypto funds. In contrast, XRP spot ETFs attracted net inflows of $4.83 million, showing selective investor interest despite broader ETF outflows. The data highlights growing divergence in where capital is flowing within the crypto ETF market.
Grant Cardone confirmed that his firm, Cardone Capital, has bought more Bitcoin at around $72,000 per coin, adding to its growing institutional crypto holdings as part of a hybrid strategy that blends real estate cash flow with long‑term BTC accumulation. He used recent announcements to challenge investors waiting for lower prices to buy, telling them to act now rather than time the market. Cardone also dismissed bearish predictions that Bitcoin could fall to zero, reinforcing his belief in Bitcoin’s future.
BitMine Immersion Technologies, led by Tom Lee, is reporting over $7.4 billion in unrealized losses on its 4.285 million ETH holdings, bought at an average of $3,830 per coin, now worth below $2,100, while Ethereum has fallen below current levels. Despite these paper losses, the company continues its Ethereum treasury strategy, adding more ETH during the downturn and staking a large portion of its holdings to earn yield. Lee emphasizes that such drawdowns are normal in a long-term treasury approach, reflecting broader market cycles rather than a flaw in strategy. BitMine’s Ethereum holdings, roughly 3.5% of circulating ETH, show both its conviction in the market and the risks involved in deep crypto treasury plays.
XRP price saw a sharp downside pressure during the latest session, dropping close to 10% before stabilizing near intraday lows. The move unfolded alongside broader market weakness, but on-chain data shows XRP’s decline is being driven less by panic selling and more by a structural reset in positioning. As price slipped, leverage exited aggressively, and large holders stayed on the sidelines. Together, these forces reshaped XRP’s short-term outlook, shifting focus away from momentum and toward whether the market can form a durable base.
Leverage Unwinds as Open Interest Falls to Multi-Month Lows
The most significant signal behind XRP’s decline is the sharp contraction in derivatives positioning. Open interest has now dropped to levels last seen in November 2024, effectively erasing the speculative buildup that accumulated during prior recovery attempts. Unlike liquidation-driven crashes, this reset unfolded gradually, with traders closing positions voluntarily rather than being forcibly liquidated.
With leverage largely flushed, XRP no longer faces the same downside risk from overcrowded long positioning. However, the reset also means the market lacks speculative momentum needed for a quick rebound.
While derivatives exposure has been reduced, large holders have yet to step in meaningfully. On-chain data shows no notable increase in whale accumulation during the sell-off. Wallet activity among large XRP holders remains muted, suggesting institutional and high-net-worth participants are waiting for stronger confirmation before deploying capital.
In previous XRP recoveries, whale inflows often provided a stabilising base, absorbing sell pressure and helping price form durable support. The absence of that behaviour this time leaves XRP exposed to extended consolidation, even as selling pressure eases. Simply put, leverage has exited, but strong hands have not yet replaced it.
XRP Price Slips to Channel Lows: What’s Next?
XRP price has been trapped inside a falling channel for months. The latest drop has pushed the price toward the lows of the channel, a structure that has guided price action for several months. The decline accelerated after XRP failed to hold the channel’s midline, triggering a clean rejection and confirming sellers control in the short term. Currently, XRP price slid into a high-confluence demand zone around $1.40, making it a technically significant region. Historically, XRP has shown short-term stabilization when price reaches this zone.
XRP price action shows longer lower wicks, hinting that selling pressure is slowing, but there is no confirmed reversal yet. As long as XRP trades below the channel midline and former support level of $1.30, any rebound risks being corrective. A sustained recovery would require a decisive reclaim of broken resistance. Failure to hold the current demand zone of $1.30-$1.40, however, could expose XRP to a deeper move into lower liquidity pockets near $1.10.
FAQs
What is causing the current decline in XRP price?
XRP’s drop is driven by a structural reset, not panic selling. Leverage is unwinding, and large holders are waiting, removing speculative momentum for a quick rebound.
Is now a good time to buy XRP after its price drop?
Currently, large “whale” investors aren’t accumulating, suggesting a wait for stability. With price in a falling channel, it may consolidate further before a durable base forms.
What does XRP need for a sustained price recovery?
XRP needs to reclaim and hold above the $1.30-$1.40 zone as solid support, alongside renewed buying interest from large holders, to signal a potential trend reversal.
Ethereum’s price crash leaves ETH stuck in a firm downtrend, with negative flows and weak momentum making a sustained reclaim of $3,000 in February increasingly unlikely. Ethereum’s (ETH) price and latest selloff has left investors nursing losses and staring down…
Bhutan-linked wallets controlled by Druk Holding & Investments (DHI) moved more than 284 bitcoin worth roughly $22 million over the past week, according to on-chain data from Arkham Intelligence. The activity places fresh focus on the Himalayan nation’s growing role…
Zcash price fell to a three-month low on Thursday as key metrics that supported the token declined. The privacy token now risks a drop towards $200 as it approaches a breakdown from a key ascending trendline that had been serving…
Bitcoin’s Coinbase Premium Gap has fallen to a yearly low, a move analysts say may reflect weaker relative demand on Coinbase-linked venues tied to institutional trading.
The dark web drug market used crypto for payments, but blockchain transaction tracing helped the FBI identify its creator, who was sentenced to 30 years in prison.
Some crypto companies have proposed giving community banks a bigger stablecoin role as Senate negotiations stall over the contentious market structure bill.
Payy has announced a privacy-enabled Ethereum layer 2 that it claims will make on-chain financial activity effectively “invisible” to the public eye. Payy, which operates a privacy-focused wallet and a Visa-powered crypto card, said in a Wednesday X post that…
Bitcoin price has confirmed a bearish inverse cup and handle pattern as institutional demand for the asset waned amidst market uncertainty, and it fell near $70,000. Bitcoin (BTC) price fell 7.2% to $70,119 on Thursday, Feb. 5, its lowest point…
A proposal to ban sports and political prediction markets issued under the Biden administration has been formally withdrawn by the Commodity Futures Trading Commission. According to a Feb. 4 statement from CFTC Chair Michael Selig, the 2024 proposal reflected what…
A senior Democratic lawmaker has launched a formal investigation into World Liberty Financial Inc (WLF), demanding information and documents over reported foreign investments and potential links between the crypto company, national security policy, and U.S. competition with China. Lawmakers raise…
U.S. Treasury Secretary Scott Bessent told lawmakers this week that the federal government lacks the legal authority to bail out Bitcoin or direct banks to purchase cryptocurrencies. His remarks emphasized the limits of government intervention as digital assets face renewed…
XRP price is testing a critical demand zone near $1.45 as rising on-chain velocity and falling open interest hint at a decisive move ahead. XRP was trading near $1.44 at press time, down about 10% over the past 24 hours,…
U.S. Treasury Secretary Scott Bessent told Congress the government has no power to bail out Bitcoin or force private banks to buy it. In response to questioning by crypto critic Rep. Brad Sherman, Bessent stressed that interventions in Bitcoin markets are not part of the Treasury’s authority. He also confirmed that the U.S. will retain its seized Bitcoin, which has grown from $500 million to over $15 billion, as part of a strategic reserve policy focused on holding rather than selling these assets.
A new crypto-linked political controversy has erupted in Washington after a reported $500 million investment from a UAE royal–connected group in World Liberty Financial, a project tied to the Trump family.
Following this, U.S. Representative Ro Khanna has launched an investigation, raising concerns over possible conflicts of interest and national security risks.
Rep. Ro Khanna Open Investigation In UAE – WLFI Deal
On January 16, 2025, a group linked to Sheikh Tahnoon bin Zayed Al Nahyan of the UAE signed a deal to buy a 49% stake in World Liberty Financial. The agreement was finalized just days before Donald Trump officially took charge of the White House.
Rep. Ro Khanna, Select Committee focused on China-related risks, has now demanded full details of this deal.
He sent a formal letter to Zach Witkoff, co-founder of World Liberty Financial (WLF), asking for ownership documents, payment flows, internal messages, and board communications connected to the transaction.
Breaking: I have launched an investigation as ranking member of the Select Committee on China into a $500 million UAE investment in the Trump family’s cryptocurrency company.
Lawmakers want to understand who approved the deal, how funds moved, and whether any policy decisions followed it.
Khanna believes the timing and size of the deal raise serious questions about transparency and national security.
Concerns Over National Security Risk & Conflict of Interest
The concern is not only about the investment size but also about timing and connections. The foreign investor group is reportedly tied to Sheikh Tahnoon bin Zayed Al Nahyan, a senior security official in the United Arab Emirates.
Khanna’s letter raises questions about whether this UAE investment could create possible conflicts of interest. Since the Trump family is directly connected to the crypto project, any foreign money flowing into it may affect US government decisions.
Although President Trump has denied knowing about the deal, he told reporters that his sons manage the business and accept investments from different global partners.
JUST IN: President Trump says he did not know Abu Dhabi invested $500 million in his World Liberty crypto project.
"I don't know about it. My sons are handling that, I guess they get investments from people." pic.twitter.com/AOBosetnpE
Khanna linked the crypto deal to sensitive U.S. technology policy. He said that soon after the UAE investment, the U.S. approved exports of advanced AI chips to the UAE, which are usually restricted due to security concerns.
He believes that the investment may have played a role in shifting US policy in favor of the UAE.
Khanna also raised concerns about the USD1 stablecoin from World Liberty Financial, saying it was used in a $2 billion Binance investment by a UAE-linked group. He believes this helped boost USD1’s global use and benefited the Trump-linked firm.
He even questioned whether these business ties were connected to the later pardon of Binance founder Changpeng Zhao.
Deadline For The Response
Khanna has asked World Liberty Financial to provide full documents and records by March 1, 2026. He warned that Congress would closely examine the matter to protect US national security.
While the company and the White House call the deal a normal business transaction, the investigation is likely to keep political and crypto circles on edge in the coming months.
Never Miss a Beat in the Crypto World!
Stay ahead with breaking news, expert analysis, and real-time updates on the latest trends in Bitcoin, altcoins, DeFi, NFTs, and more.
FAQs
What is the controversy with World Liberty Financial and the UAE?
U.S. lawmakers are investigating a $500M UAE investment in the Trump-linked firm over concerns about national security risks and potential conflicts of interest for the administration.
Why is Rep. Ro Khanna investigating the Trump crypto deal?
Rep. Khanna is investigating the timing and size of the investment, concerned it may have influenced U.S. policy like AI chip exports to the UAE and posed a conflict of interest.
What is the deadline for the UAE-WLF deal investigation?
Rep. Khanna’s committee has demanded all related documents from World Liberty Financial by March 1, 2026, as part of its ongoing review.
Over the past three days, Vitalik Buterin sold roughly 2,961.5 ETH, worth about $6.6 million, at an average price of $2,228 per coin, with selling still ongoing. On-chain data from his Gnosis Safe wallet shows repeated WETH outflows via CoW Protocol into tokens like USDC and GHO. The sales are a small portion of his 300,000+ ETH holdings, sparking mixed reactions: critics call it retail exit liquidity, while supporters note his history of funding Ethereum projects, biotech ventures like Kanro, and open-source initiatives. Ethereum traded near $2,150, down 5% in 24 hours, amid daily volumes exceeding $10 billion and continued institutional buying.
XRP dropped 10.08% to $1.43, underperforming the broader crypto market’s 7.18% decline and falling 23.85% over the past seven days. The drop followed a break below the critical $1.60 support, triggering automated selling and hitting the lowest price since November 2024. Bitcoin’s 6% decline and a global tech sell-off added pressure. Despite this, social sentiment remains strong, though extreme fear suggests short-term emotional selling may continue before a potential bounce.
The live price of the Jasmy token is $ 0.00563079.
JASMY price could claim its potential high of $0.0350 in 2026.
By 2030, JASMY could revisit the $0.18 range if its sharding-based infrastructure regains relevance in Web3.
JasmyCoin is a Japan-based blockchain project built around the idea of “data democracy.” Its goal is simple but ambitious: give individuals full control over their personal data generated by Internet of Things (IoT) devices and allow them to decide how that data is shared and monetized.
Founded by former Sony executives, Jasmy positions itself as a secure bridge between users and companies. Because of this focus, Jasmy is often referred to as the “Bitcoin of Japan.”
The JASMY token is the backbone of this ecosystem. It is used to reward data providers, enable secure data exchange, and support applications built on JasmyChain.
Following the recent launch of JasmyChain MemePad, interest in the project has returned, pushing JASMY’s price up more than 27% over the past month.
So, let’s dive into Coinpedia’s JasmyCoin (JASMY) Price Prediction 2026, 2027 – 2030.
On February 3, the JasmyChain L2 token officially went live. This upgrade enables decentralized data storage, edge computing for IoT devices, and new opportunities for AI and data monetization.
Just a week earlier, JasmyChain launched MemePad, a platform that allows users to create memecoins without coding. Users only need to connect a wallet, and JASMY is used for gas fees instead of ETH, similar to platforms like Pump.fun.
Each new token launch burns 10 JASMY tokens, adding a deflationary use case for the coin.
This has increased the interest in the Jasmy ecosystem. If adoption and usage continue to grow, JASMY could see a steady recovery, with the price potentially moving toward $0.0103 by the end of February.
Technical Analysis
Looking at the JASMY/USDT 4-hour price chart shows that Jasmy has been in a strong downtrend for several weeks. A clear descending trendline is visible, and the price has been making lower highs and lower lows, which confirms bearish market control.
Right now, price is trading near $0.0056, very close to the lower trendline support. This zone is acting as a critical demand area. If JASMY breaks below this support, the next downside targets could be around $0.0051 and $0.0045.
For a bullish reversal, JASMY must break above the falling trendline and reclaim $0.0065–$0.0070. A breakout above this level would surge the token to $0.0103
RSI is around 35, indicating the token is near oversold levels but not yet in strong bullish territory.
Month
Potential Low ($)
Potential Average ($)
Potential High ($)
JASMY Crypto Price Prediction February 2026
$0.0045
$0.0059
$0.0103
JasmyCoin Price Prediction 2026
2026 has started on a bullish note for JasmyCoin as it completed a major transition to becoming a full infrastructure provider. Beyond JasmyChain L2, Jasmy MemePad & JasmySwap, it aims to strengthen its data marketplace, improve enterprise onboarding, and expand IoT-based use cases.
Jasmy has consistently emphasized compliance with Japanese regulations, which could become a major advantage if data protection laws tighten globally.
Jasmy has made a significant strategic partnership with Apple, which is expected to go live, integrating Jasmy with Japan’s “My Number” digital ID card via iPhone devices.
If these efforts lead to measurable usage, JASMY could see steady growth, which could spike JASMY coin price towards $0.0400 by the year-end.
Year
Potential Low ($)
Potential Average ($)
Potential High ($)
JasmyCoin Price Prediction 2026
$0.0045
$0.0180
$0.0400
JasmyCoin (JASMY) Price Prediction 2026 – 2030
Year
Potential Low ($)
Potential Average ($)
Potential High ($)
2026
$0.0045
$0.0180
$0.0400
2027
$0.079
$0.0350
$0.0662
202
$0.0161
$0.0600
$0.105
2029
$0.0350
$0.0910
$0.149
2030
$0.050
$0.130
$0.220
JasmyCoin Price Prediction 2026
In 2026, JASMY’s price may rise gradually if its data-sharing ecosystem shows real adoption. A move toward $0.04 is possible under positive conditions.
JasmyCoin (JASMY) Price Prediction 2027
By 2027, wider use of IoT data platforms and enterprise partnerships could push JASMY closer to $0.066.
JasmyCoin Price Forecast 2028
If Jasmy becomes a trusted data layer for businesses, JASMY could approach $0.105 as utility demand grows.
JasmyCoin Price Target For 2029
As data ownership becomes more important globally, Jasmy’s early focus may gain value, supporting prices near $0.149.
JasmyCoin (JASMY) Price Prediction 2030
By 2030, if Jasmy’s vision of user-owned data succeeds, JASMY could trade above $0.22, though competition remains a risk.
What Does The Market Say?
Year
2026
2027
2030
Wallet Investor
$0.0418
$0.0516
$0.00826
priceprediction.net
$0.0738
$0.01072
$0.468
DigitalCoinprice
$0.0875
$0.012
$0.27
CoinPedia’s JasmyCoin Price Prediction
From CoinPedia’s view, JasmyCoin is focused on giving users control over their data. Its success depends on enterprise adoption and real-world usage of its data-sharing model.
However, Jasmy’s token price has moved up and down, but new updates in the project have brought fresh interest.
Therefore, CoinPedia analyst believes JASMY can slowly recover in 2026 and may reach around $0.04 if the project keeps growing and follows clear rules.
Year
Potential Low ($)
Potential Average ($)
Potential High ($)
2026
$0.0045
$0.0180
$0.0400
Never Miss a Beat in the Crypto World!
Stay ahead with breaking news, expert analysis, and real-time updates on the latest trends in Bitcoin, altcoins, DeFi, NFTs, and more.
FAQs
What is JasmyCoin (JASMY) and what does it do?
JasmyCoin is a Japan-based crypto focused on data democracy, letting users control, share, and monetize personal data from IoT devices.
Why is JasmyCoin called the “Bitcoin of Japan”?
Jasmy is called the Bitcoin of Japan due to its local roots, regulatory focus, and mission to give users ownership over digital data.
Where can I buy JasmyCoin (JASMY)?
JasmyCoin is available on major crypto exchanges like Binance, Coinbase, and KuCoin, where users can buy JASMY using USDT or fiat.
What will be the maximum trading price of JASMY by the end of 2026?
If ecosystem growth continues, JASMY’s maximum price in 2026 could reach around $0.04 under favorable market conditions.
How high may JasmyCoin (JASMY) price hit by the end of 2030?
By 2030, JASMY could trade above $0.22 if its data ownership model gains adoption, though market competition and volatility remain risks.
What is the price of JasmyCoin (JASMY) in 2040?
JASMY’s 2040 price is highly speculative, but strong global data adoption could support much higher levels if the project remains relevant.
What is JasmyCoin price prediction for 2050?
By 2050, JASMY’s value will depend on long-term data privacy demand, regulation, and competition, making precise forecasts uncertain.
Crypto prices today are in the red as forced liquidations and weak demand pushed major tokens lower. At press time, total crypto market capitalization was down 4.4% to $2.35 trillion. Bitcoin fell 5.5% in the past 24 hours to $73,103.…
The U.S. Commodity Futures Trading Commission (CFTC) has officially withdrawn its 2024 proposal to ban political and sports prediction markets such as Kalshi and Polymarket.
The decision signals a major policy shift and opens new doors for platforms that offer event-based trading in the United States.
CFTC Withdraws Prediction Market Ban
In a recent press release, the Commodity Futures Trading Commission (CFTC) announced that it has dropped the 2024 draft rule that aimed to ban political prediction markets. The earlier proposal planned to treat these markets as harmful and restrict them completely.
However, under the new leadership of Chairman Mike Selig, the draft rule will no longer move forward.
The CFTC admitted that the old proposal created confusion for businesses and investors. It also accepted that the plan went beyond the proper role of the regulator.
With this decision, prediction market platforms can now continue to operate without fear of an outright ban.
New Leadership Brings Clearer Direction
The policy change follows a major shift in CFTC leadership after President Trump took charge of Whitehouse. The earlier rule was created under the Joe Biden administration and never received final approval.
Chairman Mike Selig called the old proposal a “policy overreach.” He said it tried to control markets in a way that went beyond the agency’s proper role. According to Selig, the rule created confusion and uncertainty for businesses in the prediction market industry.
The Biden era prediction markets rulemaking was a frolic into merit regulation with an outright ban on political contracts ahead of the 2024 presidential election. The @CFTC is withdrawing that endeavor and will advance a new rule grounded in a rational interpretation of the law. https://t.co/sVrVQJVe8y
With this reversal, platforms like Kalshi and Polymarket can continue operating freely. These platforms let users predict real-world events, such as politics and sports, often using blockchain technology.
Relief for Prediction Market Platforms
The decision is being seen as a major victory for the growing prediction market industry. Over the past few years, on-chain platforms have gained popularity, especially during major political events.
In recent years, these platforms have grown in popularity, especially around major political and economic events. Users rely on them to trade contracts based on real-world outcomes.
In 2024, the CFTC tried to block Kalshi from offering political event contracts but lost a court battle. That defeat allowed such markets to launch legally.
With the ban now removed, these businesses can continue to expand and attract more users in the U.S. market.
Price predictions for 2026 range from $150 to $280.
QNT could extend toward $1000 by 2030, if the recovery structure holds.
Quant (QNT) enters 2026 in a position that few infrastructure-focused crypto assets currently share: technically compressed, fundamentally steady, and largely absent from short-term speculation. While much of the market continues to rotate between momentum-driven narratives, Quant’s price action has quietly tightened into a multi-year range, reflecting restraint rather than weakness. Quant’s positioning has remained consistent. Built around its Overledger technology, the project continues to focus on enterprise-grade blockchain interoperability rather than retail experimentation.
This long-term orientation has allowed Quant to develop outside the spotlight, even as speculative capital flowed elsewhere. Technically, this divergence is beginning to show. Volatility has contracted, downside reactions have become more controlled, and long-term support zones are holding with increasing reliability. As the market looks ahead to 2026, the key question is whether this prolonged compression marks exhaustion, or the early stages of a broader repricing cycle.
As February 2026 unfolds, Quant continues to trade within a clearly defined range, holding above its long-term support band near $110–$130 while facing overhead pressure near the $170–$180 region. This sideways movement reflects balance rather than weakness. Importantly, downside attempts remain shallow, with buyers consistently stepping in near the same demand zone. At the same time, sellers are failing to generate impulsive follow-through on rejection. As long as QNT remains above structural support and avoids a breakdown below the base, the broader trend bias remains neutral-to-constructive. A decisive move above $180 would shift momentum in favor of buyers and open the door for a broader 2026 expansion phase.
Quant (QNT) Price Prediction 2026
The year 2026 is shaping up to be a transition period for Quant rather than an explosive cycle top. The dominant feature on higher timeframes is a multi-year compression pattern, which historically tends to resolve with directional expansion once supply is absorbed. During the early months of 2026, QNT is likely to continue consolidating between $120 and $180, allowing the market to establish value and clear remaining overhead supply. This phase may test investor patience, but it also strengthens the structure.
If Quant successfully reclaims and holds above the $200 psychological level later in the year, it would confirm a shift from accumulation into expansion. In that scenario, price could gradually advance toward the $240–$280 zone before year-end, with pullbacks remaining corrective rather than trend-breaking.
Quant Crypto Price Prediction 2026 – 2030
Year
Potential Low ($)
Potential Average ($
Potential High ($)
2026
120
180
280
2027
180
260
380
2028
270
390
560
2029
420
620
820
2030
700
850
1000
Quant (QNT) Price Prediction 2026
In 2026, Quant price could project a low price of $120, an average price of $180, and a high of $280.
Quant (QNT) Price Forecast 2027
As per the Quant Price Prediction 2027, QNT may see a potential low price of $180. Meanwhile, the average price is predicted to be around $260. The potential high for QNT price in 2027 is estimated to reach $380.
QNT Price Prediction 2028
In 2028, the Quant price is forecasted to potentially reach a low price of $270 and a high price of $560.
Quant Price Prediction 2029
Thereafter, the Quant (QNT) price for the year 2029 could range between $420 and $820.
Quant (QNT) Price Prediction 2030
Finally, in 2030, the price of Quant is predicted to remain steadily positive. It may trade between $700 and $1000.
The long-term projection assumes Quant sustains relevance in enterprise blockchain use cases, with growth moderating over time as the asset matures.
Year
Potential Low ($)
Potential Average ($)
Potential High ($)
2031
720
900
1120
2032
780
1020
1280
2033
850
1150
1450
2040
1100
1500
2300
2050
1800
2500
3000
Quant (QNT) Price Prediction: Market Analysis?
Year
2026
2027
2030
Changelly
$250
$350
$900
CoinCodex
$220
$310
$780
WalletInvestor
$245
$340
$820
CoinPedia’s Quant Price Prediction
Coinpedia’s price prediction suggests that Quant appears to be approaching the later stages of a prolonged consolidation phase. If price continues to defend long-term support and eventually breaks above key resistance zones, QNT could trade near $280 by the end of 2026, with long-term potential extending toward $1,000 by 2030, depending on broader market participation and adoption growth.
Year
Potential Low ($)
Potential Average ($)
Potential High ($)
2026
120
180
280
Never Miss a Beat in the Crypto World!
Stay ahead with breaking news, expert analysis, and real-time updates on the latest trends in Bitcoin, altcoins, DeFi, NFTs, and more.
FAQs
What is Quant (QNT) used for?
Quant is used to power Overledger, a platform that connects different blockchains so enterprises and banks can build secure multi-chain applications.
What is the price prediction for Quant (QNT) in 2026?
Quant is expected to range between $120 and $280 in 2026, with price strength improving if it holds support and clears $200.
How much will 1 QNT be worth in 2030?
If adoption continues, 1 QNT could trade between $700 and $1,000 by 2030, reflecting steady enterprise growth rather than hype cycles.
What is the Quant (QNT) price prediction for 2050?
By 2050, QNT could trade between $1,800 and $3,000 if it remains relevant in enterprise blockchain infrastructure long term.
What makes Quant different from other crypto projects?
Quant focuses on enterprise blockchain interoperability via Overledger, prioritizing real-world use cases over short-term hype.
Is Quant (QNT) a good investment in 2026?
Quant shows steady fundamentals and strong long-term support. If it holds key levels and breaks resistance, 2026 could favor gradual upside.
Price prediction for 2026 suggests a potential high of $55.
Long-term forecasts indicate LINK could reach $195 by 2030.
Chainlink has emerged as a game-changing decentralized oracle network, enabling smart contracts to connect seamlessly with real-world data, APIs, and traditional financial systems. As the crypto market evolves, Chainlink’s role continues to expand, especially with its Cross-Chain Interoperability Protocol (CCIP) gaining traction. Its native token, LINK, not only powers the ecosystem but has also caught the attention of investors and analysts. As a result, institutional interest surged, leading to the launch of the LINK ETF by Grayscale in early December 2025.
With LINK price showing signs of a potential breakout and strong on-chain fundamentals backing its rise, the big question remains: Can LINK coin price hit $50 in December 2025? Let’s dive into this detailed Chainlink price prediction 2026–2030 to find out.
A long-term ascending trendline on LINK/USD’s weekly timeframe chart is observed, which has been reliable over the years, often leading to upward price movements. The Chainlink price prediction for 2026 indicates a strong potential for a significant price surge, reminiscent of the 2020 rally, possibly reaching $48 to $55 due to positive market momentum. For a more conservative outlook, predictions suggest a lower range of $32 to $36 by 2026, offering a favorable risk-reward scenario for investors.
Chainlink Price Targets February 2026
In January, the LINK price firmly continued its downtrend, reaching a significant long-term ascending trendline support above $9.0 on the daily chart in early February. This pivotal moment suggests LINK/USD is poised for a reversal this month, with a strong likelihood of recovering to $15. However, if it fails to hold above $9, the bullish outlook will be negated, leading LINK to new lows. Should the $9 support level be surpassed, we could see the price target for February soar to $18.
Chainlink Price Prediction 2026
On the weekly chart, a long-term ascending trendline has been consistently in effect over multiple years. This trendline has proven its reliability by producing upward price movements on numerous occasions, reinforcing its credibility as a key technical indicator.
Looking ahead, the Chainlink price prediction 2026 suggests that the potential for a significant price surge reminiscent of the explosive rally observed in 2020, remains high. Analysts suggest that such a rally could see prices target the range of $48 to $55, driven by strong market momentum and bullish sentiment.
For those taking a more conservative outlook, even the lower end of the targets suggests a promising rally, with predictions pinpointing a price range of approximately $32 to $36 by 2026. This presents a favorable risk-reward scenario for investors monitoring this trendline and assessing their market strategies.
Year
Potential Low ($)
Potential Average ($)
Potential High ($)
2026
35
50
55
Chainlink On-Chain Analysis
In the LINK on-chain metrics, both spot and futures markets are clearly exhibiting a Taker Buy-Dominant phase. It shows that buyers are actively executing at market prices without waiting for pullback opportunities. This is simply a strong sense of conviction rather than speculative strategies.
Additionally, the Average Order Size in both the spot and futures markets has escalated into the “Big Whale” category. This shift signals the involvement of institutional participants, who significantly influence LINK’s market structure, rather than retail trading flows.
Chainlink Price Targets 2026 – 2030
Year
Potential Low ($)
Potential Average ($)
Potential High ($)
2026
35
50
55
2027
48
64
80
2028
58
85
104
2029
70
108
141
2030
85
147
195
This table, based on historical movements, shows Chainlink price to reach $195 by 2030 based on compounding market cap each year. This table provides a framework for understanding the potential LINK price movements. Yet, the actual price will depend on a combination of market dynamics, investor behavior, and external factors influencing the cryptocurrency landscape.
LINK Crypto Price Forecast 2026
As per Chainlink’s Price forecast for 2026, the high price could be $55, the low may reach $35. This makes the average around $50.
LINK Price Prediction 2027
Moving to 2027, the LINK Price projects that it might hit a high price of $80 potentially. With a $48 low and an average of $64.
Chainlink Price Analysis 2028
Moving to 2028, the Chainlink Price Forecast predicts a high price of $104. On the flip side, the low may fall to $58, and the average is projected to be around $85.
LINK Coin Price Prediction 2029
As per Chainlink Price Forecast 2029, LINK’s high price is predicted to be $141, with a low of $70 and an average of $108.
Chainlink Price Prediction 2030
Finally, as per the Chainlink Price Forecast 2030, LINK’s price can reach a high price of $195. With a low of $85 and an average of $147.
Market Analysis
Firm Name
2026
2030
Changelly
$25.83
$140.70
coincodex
$6.44
$14.79
Binance
$18.43
$22.40
Mitrade
$32.22
$139.2
Investing Haven
$54.10
$80
Flitpay
$62.6
$110
*The aforementioned targets are the average targets set by the respective firms.
Never Miss a Beat in the Crypto World!
Stay ahead with breaking news, expert analysis, and real-time updates on the latest trends in Bitcoin, altcoins, DeFi, NFTs, and more.
FAQs
How much is Chainlink worth?
At the time of writing, the value of one LINK crypto token was $ 9.05357905.
What is the price prediction for Chainlink in 2026?
Chainlink price prediction for 2026 suggests LINK could trade between $35 and $55, with an average price near $50 under bullish conditions.
How much will 1 Chainlink be worth in 2030?
By 2030, 1 Chainlink could be worth between $85 and $195, depending on adoption, market cycles, and long-term crypto growth.
Where will Chainlink be in 5 years?
In five years, Chainlink is expected to be a core Web3 infrastructure, with broader adoption and a potential price range of $80–$140.
Is Chainlink a good long-term investment?
Chainlink is considered strong long term due to its real-world utility, oracle dominance, institutional adoption, and expanding cross-chain ecosystem.
What factors influence Chainlink price predictions?
LINK price is driven by oracle demand, CCIP adoption, staking growth, institutional interest, crypto market cycles, and global liquidity trends.
Analysts project Dogecoin could reach $0.75 to $1.25 by the end of 2026.
Long term projection highlights that by 2030 it could even reach the $3 mark.
Dogecoin, the original meme coin, has cemented its status as a crypto legend. Known for its viral appeal and a fiercely loyal community, it continues to capture headlines and investor interest. Following Donald Trump’s election win, speculation around a potential Dogecoin ETF fueled a surge in optimism.
Now, that speculation has become a reality. With the September 18 launch of the REX-Osprey DOGE ETF, trading under the ticker DOJE and carrying a 1.5% fee, the path has been cleared for institutional access. This groundbreaking debut makes it the first U.S.-listed spot ETF for Dogecoin and significantly raises the odds for similar approvals from major players like Bitwise and Grayscale before year-ends.As growing optimism and increasing adoption reshape the market, traders are asking: “Will Dogecoin go back up?” and “Can DOGE hit $1?” In this article, we dive into a detailed technical analysis and a long-term Dogecoin price prediction 2025 to 2030.
DOGE retested the $0.10 support level in February following January’s decline. Positive inflows into the Doge ETF fuel optimism for demand could push a reversal. A breakthrough past $0.39 could target $0.484 and possibly $1.00, but failure at $0.39 may lead to a retracement back.
Dogecoin Price Prediction 2026
January kept declining on the weekly chart despite an early January surge to $0.15. Now, in early February, it has retested the $0.10 support area, which aligns with a descending trendline.
Also, the US Doge ETF is seeing positive inflows in February, fueling further optimism that demand will surge in the months ahead.
Also, if this institutional demand propels DOGE, it might aim to move past the $0.39 resistance in Q1. It could even target its previous high of $0.484. A sustained rally beyond this point makes a move to the iconic $1.00 mark a real possibility.
However, if the price is rejected at the $0.39 resistance level by the Q1 of 2026, it may retrace back to the lower demand zone. The trajectory is heavily dependent on further institutional interest. For all this momentum to materialize in the future, it needs to build a strong base consolidating at $0.10.
Year
Potential Low ($)
Potential Average ($)
Potential High ($)
2026 (conservative)
0.13
0.39
1.00
DOGE On-Chain Outlook
Despite the price facing challenges after peaking at $0.46 in late 2024 and then falling, 2025 is a very tough year for its investors. But the total number of holders has surged to an impressive 8.17 million, indicating strong investor accumulation.
Similarly, large holders are showing strategic accumulation patterns that suggest bullish sentiment. While the number of retail holders holding between 10 and 10,000 coins has been declining, those holding between 100 million and 1 billion coins continue to increase, reinforcing a positive outlook for the asset.
Dogecoin Price Prediction 2026 – 2030
Year
Potential Low ($)
Potential Average ($)
Potential High ($)
2026
0.75
1.00
1.25
2027
1.15
1.35
1.50
2028
1.25
1.75
2.00
2029
1.50
2.15
2.65
2030
2.50
2.75
3.00
This table, based on historical movements, shows DOGE price to reach $3 by 2030 based on compounding market cap each year. This table provides a framework for understanding the potential DOGE price movements. Yet, the actual price will depend on a combination of market dynamics, investor behavior, and external factors influencing the cryptocurrency landscape.
Hyperliquid price is rallying against the market tide as institutional adoption and improving chart structure attract fresh buyers. Hyperliquid was trading around $34.96 at press time, up 6% in the past 24 hours, even as the crypto market sold off…
Strium will begin with synthetic US and Japanese stocks and commodities before expanding to real tokenized shares and asset-backed products with identity verification.
Solana became one of Samani’s favorite crypto projects at Multicoin in 2018 after he initially favored Ethereum but grew dissatisfied with how its developers addressed scaling.
CME Group is reviewing new digital infrastructure options as it prepares to expand its crypto trading operations. As part of a larger initiative to modernize margin and settlement for crypto derivatives, CME Group is exploring launching its own digital token. …
Ripple has made a new addition to its institutional trading platform as it adjusts its approach to decentralized markets. Ripple’s institutional brokerage arm has added access to decentralized derivatives markets by integrating Hyperliquid into its Prime brokerage platform. The company…
Bitcoin’s 12-day ETF outflows, derivatives data and the crypto market in tandem trading with tech stocks suggest traders will continue to cut exposure to risk assets.
Speaking on the company's earnings call, CEO Terry Duffy said the exchange is exploring a CME-issued token and is also piloting tokenized cash infrastructure with Google.
IREN, once known for mining Bitcoin, is undergoing a dramatic reinvention as an AI infrastructure provider—a transformation that will soon face a critical test.
Schiff, a vocal gold advocate and longtime crypto critic, argued that Strategy’s aggressive accumulation helped fuel Bitcoin’s meteoric rise — and that the unwind has now begun
As volatility grows in 2026, XRP and BTC holders turn to IO DeFi’s affiliate program for structured, stable income. Amidst the high volatility of the crypto market, the profit model relying solely on price increases is facing increasing uncertainty. For…
KT DeFi launches regulated cloud mining, offering low-entry, transparent access to BTC, XRP, ETH, SOL, and DOGE. In today’s rapidly evolving crypto landscape, a quiet but powerful transformation is taking place — one driven by energy efficiency and sustainability. Across…
Bitcoin price hit a 15-month low of $72,169, leading one analyst to say a revisit of BTC’s realized price near $56,000 may occur in a few months. Do charts hint at a rebound rally before the weekend?
The listing follows Bitnomial’s January launch of Aptos futures, as the exchange continues expanding US-regulated derivatives beyond Bitcoin and Ether.
Bitcoin fell to its lowest level since late 2024, breaking below its prior local low as traders turned their attention to $70,000 and lower support zones.
Crypto wasn’t spared from the tech risk-off mood. Bitcoin slid 2.5% to around $73,000 — its lowest level since early November 2024 — officially giving back the entire post-Trump election rally, no receipt required.
Stifel Financial Corp. (NYSE: SF) has issued a bold midterm prediction for Bitcoin (BTC) price. With Bitcoin price down 42% from its peak to hit a 14 month low of about $72k earlier today, Stifel stated that the flagship coin is on the cusp of further capitulation, with a target of $38k.
Stifel Warns of a 46% Bitcoin Drop in 2026
With the crypto market having lost more than $1.7 trillion in the past few months, Stifel cautioned that institutional and retail interest has dropped heavily. As such, the behemoth financial institution believes that the extreme fear will push Bitcoin price to $38,000 in coming months.
Stifel based this Bitcoin prediction on the past cycles, where a potential top was hit in October 2025. The bank cited tighter Fed’s policy, slow U.S. crypto regulations, shrinking liquidity, and heavy spot BTC ETFs outflow as the lagging indicator for a major selloff ahead.
What’s the Bigger Picture
Bitcoin price is well positioned to rally exponentially before the end of 2026 catalyzed by supportive liquidity flow. Moreover, the weakening U.S. dollar amid expected reversal of Gold price is a lagging indicator for a bullish Bitcoin outlook.
Moreover, Mike Novogratz, CEO of Galaxy Digital, believes that Bitcoin price is very close to its bear market bottom. According to John Deaton, Bitcoin price has suffered suppression through paper contracts in a similar manner as Silver by the traditional banks.
Nevertheless, Bitcoin is well poised to rebound backed by the notable decline in its supply amid a rising demand. Earlier today, Senator Cynthia Lummis urged Treasury Secretary Scott Bessent to buy Bitcoin using the country’s Gold reserves.
XRP price remains in a bear market this week despite some important network news and progress on its permissioned decentralized exchange vote. The Ripple (XRP) token dropped to a key support level at $1.5463, down 56% from its 2025 high.…
The crypto market extended its selloff on Tuesday, with Bitcoin falling below $73,000 for the first time since November 2024, triggering sharp swings across major digital assets.
Bitcoin briefly dropped nearly $1,900 in just 25 minutes, wiping out around $70 million in long positions. Minutes later, prices rebounded by more than $1,200, liquidating another $15 million in short positions — a sign of extreme volatility rather than a clear trend.
No Single Headline Trigger
The moves came despite the absence of any major negative news.
In fact, the selloff continued even after President Donald Trump said he had an “excellent” phone call with Chinese President Xi Jinping, discussing trade, military issues, and an upcoming visit to China. Trump also said China may increase U.S. agricultural purchases.
BREAKING: Bitcoin just dumped below $73,000, its lowest level since November 2024.
Markets largely ignored the update, underscoring that today’s crypto weakness appears driven more by positioning and sentiment than headlines.
Liquidations Fuel the Drop
Analysts say the sharp moves were amplified by forced liquidations.
As Bitcoin broke below key support levels, leveraged traders were pushed out of positions, accelerating the decline. Once prices bounced, short sellers were also caught off guard, adding to the rapid swings.
This kind of price action is typical during periods of low confidence and high leverage.
Broader Market Under Pressure
Losses were not limited to Bitcoin.
Ethereum slipped toward $2,100
XRP fell to around $1.51
Solana, BNB, and other major tokens posted daily declines of 5% to 10%
The total crypto market value dropped to about $2.48 trillion, down more than 3.5% in 24 hours.
Fear Dominates Sentiment
Market indicators show confidence remains weak.
The Crypto Fear and Greed Index stayed deep in “extreme fear” territory, while momentum indicators suggest the market is oversold. However, analysts warn that oversold conditions do not guarantee an immediate rebound.
Now it remains to be seen whether Bitcoin can stabilize above the $72,000–$73,000 range. A sustained break below that zone could open the door to further losses, while consolidation may allow volatility to cool.
Pepe Dollar emerges as a leading crypto buy in 2026 after $5m presale backed by audits and real utility. The quest for the next 1000X coin leads investors into the high-stakes arena of crypto presales, where early capital secures ground-floor…
Solana price has dropped for four consecutive weeks and is now trading at a crucial support level despite the soaring network metrics during the ongoing crypto winter.
As crypto prices slide and volatility spikes, some investors are shifting away from price bets toward structured, contract-based participation models like SolStaking. #partnercontent
Ripple is taking another step into decentralized finance, backing onchain derivatives at a moment when institutional players are quietly reassessing how and where they trade.
The blockchain firm said its institutional brokerage arm, Ripple Prime, has begun supporting Hyperliquid, a fast-growing decentralized derivatives venue. The move allows Ripple Prime clients to access onchain derivatives liquidity while managing risk and collateral alongside traditional asset classes.
The development shows a shift under way in crypto markets: decentralized trading venues, once dominated by retail users, are increasingly being shaped to meet institutional demands.
Bringing DeFi Into the Prime Brokerage Model
Through the integration, institutional clients using Ripple Prime can trade on Hyperliquid while keeping exposures consolidated across a broader portfolio that includes digital assets, foreign exchange, fixed income, and derivatives.
Instead of managing separate accounts and collateral pools for decentralized platforms, clients can operate through a single prime brokerage relationship — a structure long familiar in traditional finance but still rare in DeFi.
Market participants say this kind of setup could lower one of the biggest barriers to institutional DeFi adoption: fragmented risk management.
Why Hyperliquid?
Hyperliquid has gained attention for its onchain derivatives infrastructure, which aims to offer high-speed execution without relying on centralized intermediaries. While decentralized derivatives have existed for years, liquidity and performance concerns have kept most large institutions on the sidelines.
By plugging Hyperliquid into a prime brokerage framework, Ripple is effectively testing whether decentralized markets can be accessed in ways that resemble conventional trading desks — without requiring firms to abandon compliance, margin controls, or capital efficiency.
While DeFi volumes remain volatile and sensitive to market cycles, interest from institutional players has grown as infrastructure matures. The question is no longer whether institutions will interact with DeFi, but under what conditions.
For now, the move means less about explosive growth and more about quiet positioning. As crypto markets evolve, firms like Ripple appear to be betting that the future of trading will blur the line between centralized and decentralized finance — not replace one with the other.
Bitcoin has lost more than $53,000 in value over the past four months, extending a sharp downturn that has erased much of last year’s rally and left investors searching for signs of stability.
Bitcoin peaked near $126,000 in October 2025 and has since fallen to around $73,200, its lowest level this year. The decline has wiped out more than $1.1 trillion from Bitcoin’s market value and pushed it roughly 42% below its all-time high.
The selloff has also dragged down the broader crypto market. Ethereum is down about 56% from its peak, reinforcing concerns that digital assets remain stuck in a prolonged downturn.
Crypto Falls as Stocks Hold Near Records
The contrast with traditional markets has been striking.
U.S. stock indexes remain close to record highs, with the S&P 500 down about 1.5% from its peak, the Nasdaq off roughly 3.6%, and the Russell 2000 lower by around 4.2%. Crypto markets, by comparison, have suffered far deeper losses.
That gap has fueled speculation among some investors about market manipulation or deeper structural problems in crypto.
Analysts Reject Manipulation Claims
Julio Moreno, a crypto market analyst, pushed back against the idea that the drop signals something broken behind the scenes.
He said Bitcoin’s broader trend since 2023 had been upward until late last year, when momentum shifted. “We made a new all-time high,” Moreno said, arguing that 2025 was not a bear year overall despite ending in the red.
According to Moreno, the change came in November, when Bitcoin’s trend turned downward after falling below a long-watched technical level.
A Clear Bear Signal Emerges
Analysts point to Bitcoin’s move below its 365-day moving average as a major warning sign. That indicator has historically marked the shift from bull markets to bear markets.
“When price drops below the one-year average, that level tends to become resistance,” Moreno said. In past cycles, including 2022, similar moves were followed by extended declines.
This time, he said, the downturn has been worse than early 2022, suggesting a more prolonged correction.
He now sees several important price levels shaping what comes next.
$89,000 is viewed as a major resistance level where rallies could stall
$79,000 is considered near-term support
A sustained and continuous drop below that could open the door to $70,000 or lower
While XRP prices have struggled in recent weeks, flows into XRP-linked exchange-traded products tell a more mixed and in some ways surprising story.
Data from recent ETF activity shows that investors continued adding XRP exposure in early February, even as the broader crypto market remained under pressure.
Week 6 Sees Net Inflows Despite Market Weakness
In the first week of February (Monday and Tuesday), XRP ETFs recorded net inflows of about 12.6 million XRP. Total inflows reached 13.15 million XRP, comfortably outweighing outflows of roughly 590,000 XRP.
As a result, total XRP held across tracked products edged higher, ending the week near 755.5 million XRP.
These inflows came during a period when XRP prices were falling alongside Bitcoin and Ethereum, suggesting that some investors may be using price weakness to build longer-term positions.
Who Is Holding the Most XRP
By the end of January, holdings were spread across several major ETF issuers:
Canary: about 186 million XRP
Bitwise: roughly 165 million XRP
Franklin: around 147 million XRP
21Shares: about 123 million XRP
Grayscale: close to 59 million XRP
REX-Osprey and index products held smaller but steady positions
Canary and Bitwise continued to rank among the largest holders, while Franklin and 21Shares also showed stable exposure.
A Volatile January for XRP ETFs
The positive Week 6 flows followed a volatile January.
In Week 5, XRP ETFs saw net outflows of nearly 31 million XRP, largely driven by heavy selling from Grayscale, which alone shed more than 53 million XRP during that period.
Week 4 also ended in net outflows, with about 21.3 million XRP leaving ETF products. Those weeks coincided with sharper declines in XRP’s market price and rising risk aversion across crypto markets.
Despite those withdrawals, total XRP locked across ETFs has remained relatively high, fluctuating between roughly 755 million and 808 million XRP over the past several weeks.
Major cryptocurrencies remained under pressure on Tuesday, as a Bitcoin-led selloff dragged the broader digital asset market lower.
The total crypto market value fell to about $2.54 trillion, down over 3% in 24 hours, according to market data. Losses were led by Bitcoin, with Ethereum and XRP also declining sharply.
Bitcoin Breakdown Sets the Tone
Bitcoin slipped below an important support level around $75,000, triggering a wave of automated selling and forced liquidations across trading platforms.
Because Bitcoin accounts for nearly 60% of the total crypto market, its move lower had an outsized impact. More than $240 million in Bitcoin positions were liquidated in a single day, accelerating losses across other tokens.
Markets are now watching whether Bitcoin can hold the $72,000–$74,000 range. A sustained break below that zone could open the door to deeper declines, while stability could allow for a short-term rebound.
Ethereum Underperforms as Sentiment Weakens
Ethereum fell more sharply than Bitcoin, dropping nearly 4% over 24 hours and close to 28% over the past week.
Experts pointed to negative sentiment around the Ethereum ecosystem, including persistent short positioning and concerns about continued selling pressure. Funding rates on Ethereum derivatives have remained negative, suggesting many traders are betting on further downside.
Ethereum is now hovering near a key support area between $2,000 and $2,300. A clear move below that range could trigger another round of liquidations.
XRP and Altcoins Follow the Slide
XRP declined alongside the broader market, falling nearly 20% over the past week. Like many large altcoins, XRP has struggled to attract buyers as risk appetite fades. XRP is now trading near $1.55.
Analysts said the selloff has been broad-based, with Layer 1 tokens, DeFi assets, and high-beta altcoins all seeing sharp declines as traders reduce exposure.
Market indicators such as the Fear and Greed Index have dropped into “extreme fear” territory.
Macro Pressures Add to Volatility
Crypto markets have also been moving closely with traditional risk assets. Data shows a strong correlation between Bitcoin and U.S. stock indices, particularly the S&P 500, suggesting macroeconomic factors are playing a growing role.
Rising uncertainty around interest rates and capital flows has weighed on speculative assets, including cryptocurrencies.
An emerging protocol enabling native USDT transactions on Bitcoin becomes the latest participant of CTDG Dev Hub, a developer-centric technical hub by Cointelegraph focused on protocol design, implementation approaches, and network upgrade proposals.
Hashbitcoin leads 2026 cloud mining, letting beginners earn Bitcoin safely with AI-powered optimization. In 2026, cloud mining has become the easiest way for beginners to earn Bitcoin without purchasing expensive equipment. With growing electricity costs and complex mining setups, owning…
Fresh rumours around XRP have turned heads on social media after old emails from 2014 resurfaced, triggering claims that powerful figures wanted Ripple and XRP “gone” long before the U.S. regulatory crackdown. The latest debate has prompted a detailed response from XRP-supporting attorney Bill Morgan, who issued a warning in drawing sweeping conclusions.
What the 2014 Email Actually Shows
According to Morgan, the email at the centre of the controversy does suggest that Jeffrey Epstein expressed an interest in harming Ripple and, by extension, XRP and the XRP Ledger in 2014. However, Morgan stressed that the document reflects intent or discussion — not proof of coordinated action.
“The email implicates Epstein in a desire to harm Ripple,” Morgan explained, “but it does not show a sustained or successful campaign carried out over time.”
The Timeline Problem
Morgan highlighted a key issue often missing from online theories: timing. He noted that the U.S. Securities and Exchange Commission’s investigation into Ripple did not begin until between April and June 2018, nearly four years after the email in question.
That period also coincides with former SEC official Bill Hinman’s widely debated speech that signalled Ethereum was not considered a security. Morgan said the gap between 2014 and 2018 is critical and largely unexplained.
Where Gensler Fits — And Where He Doesn’t
Additional emails released publicly show interest from the same circle in Gary Gensler in early May 2018, referencing his political connections and links to what Morgan described as an anti-crypto faction within U.S. Democratic circles.
However, Morgan pushed back against claims that Gensler was involved earlier through MIT. While Gensler joined MIT in 2018, Morgan said there is no evidence tying him to MIT Media Lab activities or its former director, Joi It,o during the 2014–2018 period.
The Missing Link
“What’s missing,” Morgan said, “is a documented chain of involvement connecting these events over four years.” Aside from Joi Ito’s role at MIT Media Lab, Morgan noted there is no paper trail showing coordination between Epstein, regulators, or exchanges leading up to the SEC case.
Separating Facts From Assumptions
Morgan’s comments come as XRP once again becomes the focus of online narratives during periods of market stress. He said that while historical documents can raise questions, conclusions must be based on verifiable evidence rather than coincidence.
Never Miss a Beat in the Crypto World!
Stay ahead with breaking news, expert analysis, and real-time updates on the latest trends in Bitcoin, altcoins, DeFi, NFTs, and more.
SOL price is attempting to stabilize after a prolonged selloff, trading at $94.16 when writing, as short-term technical indicators begin to suggest seller exhaustion. A TD Sequential “9” buy signal on the 4-hour chart, combined with a bullish RSI divergence, has shifted focus toward whether current support can hold.
TD Sequential Buy Signal Flags Potential Selling Exhaustion
From a technical perspective, the Solana price chart has printed a TD Sequential “9” buy signal on the 4-hour timeframe. This is signaling that downside momentum may be stretched. While it does not guarantee a reversal, historically it often precedes short-term stabilization phases.
The TD Sequential flashes a buy signal on Solana $SOL, while a bullish RSI divergence forms.
Meanwhile, price action has respected the $93–$94 zone during recent sessions, suggesting that sellers may be losing control. Still, confirmation requires sustained holding above this area rather than a brief reaction.
Bullish RSI Divergence Reinforces Short-Term Support
At the same time, momentum indicators are beginning to diverge from price. While SOL price briefly dipped to $93, the Relative Strength Index formed a higher low. This bullish RSI divergence implies weakening downside pressure even as price printed a marginally lower low.
Such divergences often emerge near inflection points, particularly after extended declines. That said, they tend to work best when paired with structural support levels, which currently places added significance on the $94 region for SOL price today.
Key Levels Define Near-Term Risk and Reward
From a structural standpoint, $94.16 now acts as a critical support reference. If this level continues to hold on closing bases, attention shifts toward the monthly open near $105, which represents a potential recovery target of roughly 9.4% based on recent Solana price chart behavior.
Still, the path higher is unlikely to be linear. Any failure to defend current levels would delay this scenario and reintroduce lower liquidity zones. For now, the chart suggests that the immediate risk-reward profile has become more balanced than earlier in the decline.
Beyond price, Solana crypto fundamentals present a more constructive backdrop. Development activity has been trending higher, while daily active addresses continue to rise, too. This combination suggests that network usage is expanding even as market sentiment remains cautious.
Historically, divergences between improving on-chain engagement and soft price action often precede trend transitions, although timing remains uncertain. Still, it reduces the likelihood of purely speculative price behavior dominating short-term moves.
Volume Cooling Adds Context to Momentum Shift
Additionally, CryptoQuant data shows a noticeable cooling in trading volume. Rather than indicating disinterest, declining volume during downtrends often reflects the exhaustion of aggressive sellers. In prior cycles, similar volume compression has aligned with base-building phases.
As a result, SOL price is now balancing between technical exhaustion signals and broader market restraint. Whether this develops into a sustained recovery or extended consolidation will depend on how price reacts around current support over coming sessions.
Ethereum price is trading under pressure as on-chain data flashes a historically sensitive signal. In late january, Ethereum crypto’s total transfer count, smoothed by a 14-day SMA, surged to 1.17 million, a level previously associated with major market turning points. This sudden spike raises fresh questions about near-term risk.
Ethereum Network Activity Reaches a Critical Threshold
The latest Ethereum price chart is unfolding amid sharply rising network activity. According to on-chain data, the transfer count has accelerated sharply, reaching levels rarely sustained in past market cycles. While increasing activity can indicate adoption, the speed and magnitude of this move place it in a more cautionary category.
Historically, such abrupt spikes tend to appear near periods of elevated stress. Meanwhile, price action on higher timeframes has already softened, suggesting that activity may not be driven purely by organic growth. Instead, it may reflect increased repositioning as market participants adjust exposure.
Historical Parallels Resurface From 2018 and 2021
A closer look at Ethereum crypto’s historical data reinforces the concern. In January 2018, transfer counts surged in a similar fashion just days before Ethereum marked its cycle peak. At the same time, price momentum stalled and gave way to an extended bear market.
A comparable pattern emerged on May 19, 2021. Transfer activity spiked sharply as price volatility intensified, coinciding with a broad market crash. In both cases, elevated network usage reflected distribution and forced flows rather than healthy accumulation. While history does not repeat exactly, the structural similarity keeps risk elevated.
On-Chain Signals Point to Distribution and Volatility
From an analytical standpoint, parabolic increases in transfer counts often align with moments of emotional extremes. That said, these phases typically involve heavy asset movement between wallets and exchanges. This behavior suggests profit realization, collateral rebalancing, or liquidation-driven transfers.
At the same time, volatility tends to climax near these events. The Ethereum crypto ecosystem has historically seen spikes in transaction volume when conviction weakens on one side of the market. As a result, heightened activity alone does not confirm direction but signals instability.
MVRV Bands Highlight a Lower Valuation Zone
Adding to the cautionary tone, Ethereum crypto’s MVRV pricing bands are drifting toward historically significant territory. The Ethereum price USD has often formed durable bottoms only after dipping below the 0.80 MVRV band, a level that currently maps to just under $2,000.
In previous cycles, price spent prolonged periods consolidating near this lower valuation envelope before recovery phases began. From a structural perspective, the Ethereum price prediction remains sensitive to whether this zone is tested or defended. Meanwhile, cost-basis dynamics continue to rise slowly, lifting the long-term floor but not eliminating downside risk.
Ethereum Price Balances Between Risk and Repricing
Still, markets rarely move in straight lines. While current signals suggest elevated risk, they also reflect a market in transition. As speculative excess is absorbed, the Ethereum price may continue searching for equilibrium within historically relevant valuation ranges. Whether activity stabilizes or accelerates further will remain central to near-term direction.
Economist Peter Schiff criticized former President Trump’s push for U.S. dominance in Bitcoin and digital assets, calling it misguided as China focuses on building factories and buying gold. While the U.S. holds around 198,000 BTC, China’s holdings from seizures are close to 190,000-194,000 BTC. Meanwhile, China continues expanding its gold reserves, reaching 2,306 tonnes valued at over $319 billion by December 2025, signaling a preference for traditional assets over crypto.
The early weeks of 2026 have delivered a harsh reality check to the crypto industry. The Fear and Greed Index sank to extreme fear levels. With Bitcoin (BTC) struggling to regain $80,000 and Ethereum (ETH) facing ongoing outflows, it is clear that a bear market has arrived.
Investors now want projects that offer real-world utility. In the current risk-off environment, investors are no longer gambling on unproven protocols. Instead, they are turning to Digitap ($TAP), an omni-bank ecosystem that has bridged the gap between decentralized finance and traditional global banking.
Digitap has built a live, downloadable app that blends crypto and fiat into one banking dashboard. This utility makes it the best crypto to buy this February. And $TAP is emerging as a favorite asset for investors looking to shield their portfolios from further losses.
Here is why over 120,000 wallets have already been connected to its dashboard.
Crypto Panic Peaks: Why Smart Money is Rotating to $TAP
Institutional capital is flowing out of traditional large caps due to increased volatility. Market sentiment has dropped to extreme fear in early February 2026, with the Fear & Greed Index reaching a yearly low of 14.
This severe drop followed a disastrous “Black Sunday” where Bitcoin collapsed below $75,000, wiping out more than $2.2 billion in leveraged positions. The macroeconomic pressures, consisting of US dollar strength and geopolitical tensions, resulted in widespread ETF outflows and institutional de-risking.
Nevertheless, smart money is always rotating elsewhere while retail panic peaks. These experienced investors are shifting their focus toward platforms that offer real-world utility like Digitap.
Its omni-bank ecosystem enables it to maintain steady utility despite the general market’s liquidity drought and technical bearish trend. This ability to thrive even during a weak market is the reason investors consider $TAP as the best altcoin to buy this February.
Why Smart Money is Betting on $TAP’s Real-World Digital Bank
The smart investors are looking for refuge in projects that generate revenue irrespective of market direction. Digitap thrives in these conditions because it is building a fully operational digital bank with its app already available on the Apple App Store and Google Play Store.
Notably, Digitap enables users to manage multi-currency accounts and virtual cards that offer near-instant transactions at near-zero fees. These components make $TAP’s crypto presale a lucrative investment opportunity.
The shift toward utility is dominating the 2026 cycle, with investors preferring projects that enable them to spend crypto like cash. They do not want assets that rely on hype and speculation to grow.
Digitap’s omni-bank offers a circular economy where transaction fees and currency swaps drive the ecosystem. In a market where sentiment has dropped considerably, the ability to spend crypto in the real world using a Visa-backed card is the largest fundamental floor for any crypto project.
Digitap’s Solana Integration Powers Instant Visa Spending
Digitap has been building an impressive infrastructure that appeals to most investors. A significant turning point happened when Solana-native deposits were officially launched on the platform. Digitap has an ecosystem that favors modern investors who want speed and cost-efficiency.
With this integration, Digitap now lets users top up their banking wallets using SOL, USDT, or USDC directly from the Solana network. Thus, it connects one of the world’s most active retail blockchains with over 80 million merchant locations that accept Visa card payments.
By leveraging Solana’s fast transactions and low fees, Digitap has eliminated the challenges that previously plagued crypto-to-fiat conversion. Users do not need to engage with a centralized exchange or wait for many hours or network confirmations.
Investors can move their Solana-based assets into the Digitap omni-bank and spend them instantly. This collaboration has resulted in increased demand and a huge influx of new users who want to enjoy the efficiency of payment finance (PayFi).
Crypto to Buy in Volatility: $TAP Presale Appeals at 66% Discount
While the prices of large altcoins swing wildly, influenced by macroeconomic news, the $TAP crypto presale provides users with a defined and predictable growth path. Currently available at $0.0467, the token is selling at a 66.64% discount from a set exchange listing price of $0.14.
For those investors who buy $TAP at its current price, they will access a built-in 200% gain before $TAP hits the open market. This predictability is a huge advantage in the current highly volatile market.
While other investors watch their portfolio decline alongside large-cap cryptos, $TAP holders have invested in an asset with a clear trajectory and a defined value floor.
With more than $5 million raised from the purchase of 213 million coins and Round 3 selling out quickly, there is huge demand for Digitap. It means the market wants projects that merge early-stage growth with a functional product.
$TAP’s Deflationary Tokenomics Give it Bear Market Resilience
The long-term growth potential of Digitap is also boosted by its exclusive deflationary mechanics and “Real Yield” staking. While most other projects use inflationary tokenomics to appeal to investors, Digitap is built with a fixed maximum supply of 2 billion tokens without any additional minting.
Furthermore, the project uses 50% of all profits to buy back and burn $TAP tokens or redistribute them to stakers, aiming to drive scarcity.
Digitap is highly appealing because it also offers a 124% APY in its current crypto presale staking program. The yield is underpinned by the revenue generated from the platform’s banking services. Therefore, as more investors use their Digitap Visa cards and transact on the platform, the rewards offered to holders increase organically.
In the current bear market conditions, this high-yield, revenue-backed staking reduces the impact of market-wide meltdowns. Also, it continuously increases the holders’ share of the total token supply.
$TAP Thrives Amid Market Fear with Live Utility
Market history shows that the most lucrative investment opportunities often arise when fear is high and the market is bleeding. Digitap offers an exclusive blend of a mature, live banking product and a high-growth crypto presale.
With its platform already serving over 120,000 wallets and its integration with Solana rails making spending easy, $TAP is the best crypto to buy in 2026. For investors who are fed up with the uncertainty of the current market, Digitap offers a defined, utility-driven path to outshine the cycle.
Discover how Digitap is unifying cash and crypto by checking out their project here:
As Q2 2026 approaches, investors are moving their focus toward protocols that aim to solve financial problems. While many top altcoins struggle with high prices and slow growth, a new crypto generation of utility tokens is emerging. Experts are now pointing to one specific under-the-radar project as a top contender to hit the $1 milestone. This project is a fast-growing ecosystem that combines high-tech lending with a rock-solid security foundation.
What is Mutuum Finance (MUTM)?
Mutuum Finance (MUTM) is developing a decentralized lending and borrowing protocol designed to help users unlock liquidity from their digital assets without selling them. The platform is being built around a dual-market structure intended to support both straightforward lending activity and more advanced financial use cases, aiming to improve efficiency and transparency across the process.
Within the protocol’s design, users who supply assets are expected to earn variable annual percentage yields (APY), which adjust based on borrowing demand and pool utilization. For example, if a stablecoin pool offers a 6% APY, a user supplying $10,000 worth of assets could earn approximately $600 over one year, excluding compounding effects.
These yields are represented through interest-bearing mtTokens, which grow in value over time rather than paying out rewards manually. This structure is intended to keep returns predictable, transparent, and directly tied to real protocol usage rather than emissions or short-term incentives.
The project has seen strong growth since early Q1 2025. Mutuum Finance has raised more than $20.2 million and attracted over 19,000 investors, an unusually large community for a protocol still in its presale stage. This level of participation has helped position the project as one of the more closely watched emerging top crypto platforms.
The presale is currently in Phase 7, with MUTM priced at $0.04. This represents a steady increase from the initial $0.01 entry price, while still remaining below the project’s stated target launch valuation of $0.06.
V1 Launch and Proven Security
A major driver behind the growing attention is the successful activation of the V1 protocol on the Sepolia testnet. This milestone confirms that Mutuum Finance’s core technology is functional in a live environment rather than existing only on paper.
With V1 active, users can now interact with liquidity pools by supplying test assets and observing how interest is generated as borrowing demand increases. When a user borrows from a pool, the protocol issues debt tokens that track the borrowed amount plus accrued interest over time. For example, borrowing $1,000 at a 5% variable rate results in a debt position that gradually increases as interest accumulates.
Each position is monitored through a health factor and stability factor, which measure how safely a loan is collateralized. A health factor above 1.0 indicates a safe position, while dropping below that threshold would make the loan eligible for liquidation. This system ensures that liquidity pools remain solvent and that risk is managed automatically across the protocol.
Because of this technical progress, several analysts are already issuing bold price predictions. Many experts believe that once the mainnet goes live, MUTM could see an initial surge to the $0.25 to $0.30 range. This would represent a 625% to 750% MUTM appreciation from current levels.
The Power of Consistent Demand
The project’s roadmap also features a buy-and-distribute mechanism to support the token price. A portion of the platform’s revenue will be used to buy MUTM tokens from the open market. These tokens are then given to users who stake mtTokens in the safety module. This creates constant buying pressure and rewards long-term holders.
To reinforce trust around the protocol, Mutuum Finance has completed a full audit with Halborn Security, a well-known blockchain security firm, to review its smart-contract architecture. Halborn is recognized for auditing major DeFi protocols and identifying critical vulnerabilities before deployment. This added security layer is intended to reduce technical risk while ensuring that revenue distribution and staking mechanisms operate as designed.
To keep the community excited, there is also a 24-hour leaderboard. The top daily contributor wins a $500 bonus in MUTM tokens. This daily competition has helped Phase 7 move faster than any previous stage. Based on these utility features, some analysts have issued a second price prediction, expecting a 10x MUTM growth move by the end of 2026 as long as the roadmap unfolds as expected.
The Final Window for Whale Allocations
Right now, Phase 7 is quickly selling out as the project nears its final milestones. The market is seeing a massive influx of whale allocations, with some single entries exceeding $100,000. This is a crucial signal for retail investors because it shows big money is moving in.
When the smart money moves in with large sums, it usually means the technical delivery of the project has met their high standards. These large players are rushing in for three main reasons. First, buying at $0.04 before the $0.06 launch provides an instant advantage. Second, the V1 testnet success has removed much of the early-stage risk. Third, the remaining presale supply is becoming highly competitive with over 840 million tokens already sold.
As the presale nears its final stages, the window to secure MUTM at these rates is closing. With a working product, verified security, and a clear path to $1, Mutuum Finance is positioning itself as the next big crypto in 2026.
For more information about Mutuum Finance (MUTM) visit the links below:
Swiss banking giant UBS Group AG, which manages around $6.9 trillion in assets, is planning to offer cryptocurrency access to individual clients and tokenized deposit solutions for corporate customers as part of its digital asset strategy. CEO Sergio Ermotti described a cautious “fast follower” approach, focusing on building the right infrastructure and rolling out selective services while expanding pilot projects, highlighting the growing interest in blockchain among traditional banks amid evolving global demand and regulations.
The XRP Ledger has taken a major step toward regulated blockchain adoption with the activation of a new feature called Permissioned Domains. The update went live on February 4, after receiving strong support from network validators, and is designed to help institutions use blockchain technology while staying compliant with regulations.
What Are Permissioned Domains on XRP Ledger?
Permissioned Domains allow users to create a restricted area on the public XRP Ledger where only approved accounts can take part. This allows developers, banks, and regulated companies to build apps where only verified users can access certain services.
This feature works with the Credentials system, which helps confirm things like KYC and AML checks directly on the blockchain. Together, they make it possible to run secure financial activities on a public network while keeping access limited and controlled.
The amendment was activated at ledger index 102,017,953, and the first Permissioned Domain appeared on the network immediately after launch.
Strong Validator Support Drove the Upgrade
The amendment, known as XLS-80, needed at least 80% validator approval for two consecutive weeks to go live. That threshold was reached in late January, and by the time activation occurred, more than 90% of validators had voted in favor.
This level of support shows broad agreement within the XRP Ledger community that controlled access features are important for the network’s future growth.
Another related upgrade, called Permissioned DEX, is also approaching activation and is expected to go live around February 18 if voting continues at current levels.
Ripple’s CTO explained that compliance has long been a barrier for institutions wanting to use public blockchains. Permissioned Domains help solve that problem by allowing liquidity pools, trading features, and payment flows to operate only among verified participants.
This makes it easier for institutions to safely use blockchain technology for stablecoins, foreign exchange trades, tokenized assets, and cross-border payments, without violating regulatory rules.
With Permissioned Domains now live, the XRP Ledger is positioning itself as a network that can support both open innovation and regulated financial use cases.
Never Miss a Beat in the Crypto World!
Stay ahead with breaking news, expert analysis, and real-time updates on the latest trends in Bitcoin, altcoins, DeFi, NFTs, and more.
FAQs
What are Permissioned Domains on the XRP Ledger?
Permissioned Domains let institutions restrict access on XRP Ledger, allowing only verified accounts to use certain apps and services securely.
How do Permissioned Domains help with compliance?
They work with blockchain credentials to enforce KYC and AML checks, letting banks and businesses operate safely on a public ledger.
Who can use Permissioned Domains on XRP Ledger?
Banks, developers, and regulated companies can use Permissioned Domains to run apps and services for verified participants only.
What is the benefit of Permissioned Domains for enterprises?
They enable secure trading, stablecoin flows, and tokenized assets while ensuring regulatory compliance on a public blockchain.
Following the regulatory clarity of XRP, institutions and banking giants rushed to get their hands on XRP. And what’s more stable than an ETF?
In a recent investment disclosure, Bank of America has shown its exposure in XRP through investment in an XRP exchange-traded fund (ETF). This shows that the bank continued to deepen its partnership with Ripple, exploring cross-border payments and RLUSD stablecoin.
Bank of America Discloses XRP ETF Holdings
As per the latest U.S. SEC filing, Bank of America holds around 13,000 shares of the Volatility Shares XRP ETF, with a total value of about $224,640. While this investment is small compared to the bank’s overall portfolio, it is still an important step toward institutional crypto adoption.
What makes this move more interesting is that Bank of America recently expanded its crypto-related services. On January 5, 2026, the bank allowed its wealth advisors to begin recommending crypto ETFs to clients for the first time.
This move follows Bank of America’s shift in strategy, where Bank of America started supporting limited crypto exposure of up to 1–4% in client portfolios, mainly through regulated investment products like ETFs.
Institutional Growing Interest in XRP ETFs
Rising institutional demand for XRP ETFs is a key trend in the market. U.S. spot XRP ETFs have seen strong inflows and rapid growth since their launch, putting them on track to near $1.20 billion in assets under management (AUM) in a short period.
In fact, XRP ETF products have recorded extended streaks of inflows as demand from pension funds, asset managers, and advisory firms increases.
On 3 feb XRP ETF recorded an inflow of $19.46 million.
Even with strong institutional activity, the XRP price has remained weak. As of now, XRP is trading around $1.59, reflecting a drop of about 1%.
Perhaps, Cryptoquant data shows that the XRP exchange supply on Binance has been shrinking. From early 2025, the exchange stayed relatively stable around 2.7% – 3.1%.
This suggests holders are moving XRP to private wallets instead of selling, which indicates accumulation and potentially reduced selling pressure.
Never Miss a Beat in the Crypto World!
Stay ahead with breaking news, expert analysis, and real-time updates on the latest trends in Bitcoin, altcoins, DeFi, NFTs, and more.
FAQs
Why are institutions investing in XRP ETFs?
Institutions invest in XRP ETFs for regulated crypto exposure, portfolio diversification, and to participate in Ripple’s cross-border payment network.
Has XRP price reacted to institutional ETF inflows?
Despite strong ETF inflows, XRP trades around $1.59, showing little change as accumulation suggests reduced selling pressure.
Are XRP ETFs safe for client portfolios?
XRP ETFs offer regulated crypto exposure, limiting risk to 1–4% of a portfolio, making them a safer option for wealth advisors and investors.
Cardano founder Charles Hoskinson has hinted at a rare and notable update tied to the network’s growing AI experimentation. In a recent post on X, Hoskinson revealed plans to upgrade “Logan the Exit Liquidity Lobster,” an open-source AI bot associated with the Cardano ecosystem. Unlike routine protocol updates, this announcement stood out for its direct call to the community, with Hoskinson inviting developers to actively shape the next release.
What Is Logan and Why Does It Matter
Logan is an AI-powered bot designed to post Cardano-related content around the clock on Moltbook, a decentralized social platform. While initially built as a lightweight content engine, Hoskinson now wants to significantly expand its capabilities. The next iteration is expected to make Logan “aware” of Cardano-native projects, effectively turning it into a real-time ecosystem intelligence tool rather than a simple posting bot.
This shift could allow Logan to monitor on-chain activity, track project developments, and surface analytics related to tokens, applications, and network usage across Cardano.
Opening the Door to Developer Integrations
To support this expansion, Hoskinson has invited Cardano builders and project teams to submit technical documentation and integration details. Developers who participate may see their projects embedded directly into Logan’s functionality in the upcoming release.
Hoskinson emphasized that custom integrations are on the table, signaling a hands-on approach to ensuring the AI bot reflects the diversity of Cardano’s ecosystem. Community responses suggest strong interest, with several developers already engaging and signaling readiness to collaborate.
The announcement quickly sparked discussion among Cardano supporters. Some community members pointed to the playful naming of the update, reportedly titled “From Shell With Love”, as a reflection of Cardano’s developer-first culture. Others noted that Hoskinson’s open invitation reinforces the network’s emphasis on transparency and collaboration rather than closed development.
This level of engagement is relatively uncommon for ecosystem tooling updates, making the move stand out even amid Cardano’s steady stream of technical progress.
On the other hand, as Ethereum reassesses its heavy reliance on Layer-2 networks, critics argue that fragmented security and bridged assets have exposed structural weaknesses. Cardano supporters see this as validation of Cardano’s original design philosophy, which prioritized Layer-1 security and native scalability from the outset.
With solutions like Hydra and Leios enhancing throughput without compromising base-layer trust, the renewed focus on Cardano-native innovation, such as Hoskinson’s Logan AI update, underscores the network’s long-term strategy of building scalable, secure systems without sacrificing decentralization.
Never Miss a Beat in the Crypto World!
Stay ahead with breaking news, expert analysis, and real-time updates on the latest trends in Bitcoin, altcoins, DeFi, NFTs, and more.
FAQs
What could Logan’s upgrade mean for Cardano users and developers?
The enhanced AI capabilities may allow developers and users to access real-time insights on project activity, token usage, and ecosystem trends. This could improve decision-making for staking, investment, and project development within the Cardano network.
How might Logan impact the broader Cardano ecosystem?
By tracking on-chain activity and integrating multiple projects, Logan could increase visibility for smaller or emerging Cardano initiatives. This may help promote collaboration and adoption while encouraging developers to contribute actively to the network.
What is the timeline for Logan’s next release?
Charles Hoskinson has not announced an exact release date but has indicated that developer contributions and technical integrations will shape the rollout. Community engagement and submissions will likely influence how quickly the update becomes operational.
Who stands to benefit most from Logan’s expanded functionality?
Cardano developers, project teams, and active ecosystem participants are likely to gain the most, as they can embed their projects directly into Logan and receive real-time analytics. Investors and users could also benefit from enhanced transparency and early access to emerging project data.
Solana price fell sharply in today’s session, sliding close to 7% and breaking below the $100 mark, a level that had acted as short-term psychological support. The move marks a clear technical breakdown, with price slipping out of its recent consolidation range as sellers maintained control throughout the session. The decline unfolded without a liquidation shock or ETF disruption, pointing instead to a demand-driven selloff. Spot market weakness, fading on-chain activity, and thinning liquidity combined to push SOL lower, raising questions over whether the market is entering a deeper corrective phase or simply resetting before the next attempt higher.
ETF Inflows Hold, But Solana Price Still Slips Lower
Solana’s ETF-linked exposure remained stable, but it failed to cushion the price as spot selling intensified. U.S. Solana spot ETFs posted a modest daily net inflow of $1.24 million, lifting cumulative inflows to $877.75 million, while total net assets hovered around $854.3 million, a level that has largely moved sideways in recent sessions.
Beneath the surface, however, spot markets told a different story. Data shows net spot outflows nearing $29.9 million, coinciding with SOL’s breakdown below the $100 psychological level. This divergence proved critical. While ETFs neither saw aggressive redemptions nor meaningful dip buying, spot sellers dominated liquidity, leaving the market vulnerable once key support gave way. The result was a swift slide below the $100 mark, underscoring a familiar dynamic: ETF stability alone is not enough to support price when spot flows turn decisively negative.
On-Chain Data Shows TVL Decline as Capital Pulls Back
Solana’s on-chain metrics confirm that the latest price weakness is being accompanied by a measurable pullback in deployed capital. Network data shows Solana’s total value locked (TVL) has slipped by roughly 5–7% over the past week, easing from recent local highs as traders reduced exposure across DeFi protocols. While, the stablecoin market capitalization on Solana has also flattened, with balances holding near recent levels instead of expanding, a signal that fresh liquidity is no longer aggressively entering the ecosystem. Historically, periods where stablecoin supply stops growing tend to coincide with cooling momentum rather than trend acceleration.
Transaction activity remains elevated compared to late 2025 averages, but growth has slowed noticeably from January’s peak levels. In parallel, wallet interaction data shows fewer large inflows, suggesting institutional and high-net-worth participants are waiting for clearer price confirmation before redeploying capital. Taken together, the numbers point to controlled capital rotation, not network stress. Solana’s on-chain health remains intact, but the contraction in TVL and stagnant stablecoin flows indicate that the network is in a risk-off consolidation phase, limiting upside pressure until liquidity conditions improve.
Solana Price Slips Below $100 as Structure Tilts Bearish
Solana’s sharp 7% daily drop confirms a structural failure below the $100 psychological level. Today’s drop pushed SOL decisively beneath this pivot, shifting short-term control back to sellers and exposing the lower end of the established range. SOL price has been trading inside a broad horizontal distribution, capped near $110–$115 and supported around $88–$92. The latest decline followed a lower high near $108, completing a classic range rejection pattern rather than a trend continuation setup. The breakdown below $100 is critical because it removes the midpoint support of this range, increasing the probability of a full rotation toward the lower boundary. The price action also shows SOL slipping below its rising mid-range trend guide, signaling momentum deterioration rather than healthy consolidation.
As long as price remains capped below $100–$102, upside attempts are likely to be corrective in nature, with sellers defending that zone aggressively. In this context, the $90–$92 area becomes the immediate level to watch, as it aligns with prior demand absorption and multiple historical reactions. A clean daily close below $88 would invalidate the current range and open downside risk toward $78–$80, where the next high-timeframe demand zone emerges. On the flip side, stabilization above $90 followed by a reclaim of $100 would signal that today’s sell-off was a liquidity sweep rather than a trend shift, allowing for a recovery move back toward $108–$110 though still within range, not a breakout.
Smart Energy Pays has announced its expansion into the U.S. market, aiming to strengthen its global presence in digital financial infrastructure. The platform is operated by Smart Energy Pay Solution Ltd. and focuses on building systems that support real economic activity.
The U.S. is widely recognized as a major hub for fintech and digital payments, driven by strong institutional adoption and regulatory maturity.
As part of the expansion, the SEP utility token has been listed on UZX, a centralized exchange designed to support international market access. The Smart Energy Chain, the company’s proprietary Layer-1 blockchain, provides the technical foundation for settlement and transaction processing.
Smart Energy Pays offers a financial platform that connects fiat and digital payment flows. The SEP token is used solely for technical settlement, validation, and fee mechanisms.
Security and compliance measures include ISO 27001 standards, PCI-DSS and SOC-2 compliance, KYC and AML processes, and ongoing security audits with Hacken.
Cathie Wood Blames Binance Glitch for 2025 Crypto Crash
ARK Invest CEO Cathie Wood has blamed a Binance software issue for last year’s crypto flash crash, which saw Bitcoin fall from $122K to $105K, triggering $28 billion in forced margin calls and wiping out $19 billion in leveraged positions. The crash coincided with U.S. stocks losing $1.5 trillion amid China tariff fears. Binance founder Changpeng Zhao refuted the claim, citing that investigations found no core system outage. Binance has provided full compensation and established a $400 million relief fund for affected users. The debate highlights ongoing scrutiny over crypto platform stability during market turbulence.
February 4, 2026 12:46:19 UTC
Bitcoin Supply in Profit Plummets, Smart Money Eyes Opportunity
The number of Bitcoin ($BTC) coins in profit has dropped sharply from 19.8M to 11.2M, signaling that high-entry holders are selling at a loss. Long-term metrics suggest the market is entering a stress zone, historically a point where smart money starts accumulating. Analysts note that as weaker hands exit, stronger hands step in, making this a potential buying opportunity for institutional and long-term investors.
February 4, 2026 12:38:48 UTC
Bank of America Holds 13,000 Shares in XRP ETF
Bank of America (BofA) has disclosed owning 13,000 shares of the Volatility Shares XRP ETF, worth around $224,640, according to a Feb 3 SEC filing. The move shows BofA’s growing engagement with XRP, complementing its ongoing work with Ripple on cross-border payments and the RLUSD stablecoin. Spot XRP ETFs also saw $19.46M in inflows recently, though XRP remains under $1.60 amid market pressure. BofA continues to explore regulated crypto exposure for its clients.
February 4, 2026 11:45:23 UTC
Bitcoin Hits $72.9K Before Rebounding to $75K
According to QCP analysis, Bitcoin ($BTC) dipped to a post-election low of $72.9K before bouncing back to test $75K. The move saw falling futures open interest and negative funding, signaling deleveraging. Options data shows high short-term volatility and steeper downside risk, hinting at potential near-term weakness. Analysts say $75K is a key level: holding it encourages buying, while a break could trigger a more defensive market stance.
February 4, 2026 11:45:23 UTC
Bitcoin Price Today
Bitcoin ($BTC) saw wild price swings in under an hour, dropping below $73,000 and liquidating $285M, before quickly rebounding to $76,000, triggering another $100M in liquidations. Analysts note strong liquidity around $72,000–$74,000, which could be tested again, while the $78,000–$82,000 zone has significant liquidity, making it a likely target for the next move. Traders are closely watching these levels for short-term opportunities.
February 4, 2026 11:43:58 UTC
XRP Ledger Adds Permissioned Domains for Safer Institutional Use
The XRP Ledger has activated its Permissioned Domains feature, allowing accounts with proper KYC and AML credentials to access certain zones. Approved by over 80% of validators, this change lets banks set up safe transactions with up to 10 approved issuer pairs. Ripple CTO David Schwartz said it helps institutions, including Ripple’s 300+ partners, use the ledger confidently. A related Permissioned DEX upgrade is close to activation, further supporting compliant institutional adoption.
February 4, 2026 11:14:29 UTC
TRM Labs Raises $70M, Hits $1B Valuation
Blockchain analytics firm TRM Labs has closed a $70 million Series C funding round led by Blockchain Capital, with participation from Goldman Sachs, Bessemer, Brevan Howard, Thoma Bravo, and Citi Ventures, pushing its valuation to $1 billion. The firm provides blockchain intelligence software that helps track crypto-related crime, serving law enforcement agencies and private clients worldwide. This funding will accelerate TRM Labs’ growth and expand its global compliance and investigation solutions.
Binance founder Changpeng Zhao, widely known as CZ, has strongly denied claims that Binance manipulated Bitcoin prices during the October 10 market crash, which led to $20 billion in market liquidation.
He said the fall was caused by global tariff announcements, not by Binance systems or trading activity.
CZ Denies Binance Role in October Crash
Speaking during a recent AMA session, CZ addressed concerns from users who blamed Binance for the sudden market drop on October 10.
However, CZ called those accusations misleading and incorrect. He explained that the sudden fall in crypto prices came immediately after major tariff announcements, which triggered fear across global financial markets.
CZ made it clear that Binance had nothing to do with the fall in Bitcoin prices. He said the timing of the crash proves it was linked to economic news and not to any technical issue on the exchange.
CZ: No One in the World Is Crazy Enough to Manipulate Bitcoin
On January 31, Binance founder Changpeng Zhao stated in an AMA that the October 10 market crash was triggered by a tariff announcement, not Binance system error or price manipulation. He emphasized neither he nor… pic.twitter.com/ZFPtdGEkU0
CZ also made it clear that Binance does not trade cryptocurrencies to profit from price movements. He said the company’s role is to provide a trading platform, not to speculate or control markets.
“We don’t buy or sell crypto to make money from price changes,” CZ said, pushing back against claims that Binance benefits from market swings.
He also rejected rumors that Binance or he personally profited from trading during the crash.
CZ stated clearly that Binance does not trade crypto to make profits from price movements. The platform only provides services for users to buy and sell.
Addressing rumors of price manipulation, CZ said the idea is unrealistic. He pointed out that Bitcoin is now a nearly $2 trillion market.
To significantly move Bitcoin’s price, someone would need to risk hundreds of billions of dollars. “No one in their right mind would do that.”
He said, “I don’t know anyone on the planet who is crazy enough to try to manipulate Bitcoin.”
Lastly, CZ also highlighted that Binance is now a regulated company under the Abu Dhabi Global Market (ADGM). The exchange is closely monitored by regulators, and even U.S. compliance teams oversee its operations.
Because of this strict oversight, he said Binance cannot engage in any unfair activity. All trades on the platform are reviewed by regulators, making manipulation impossible.
Never Miss a Beat in the Crypto World!
Stay ahead with breaking news, expert analysis, and real-time updates on the latest trends in Bitcoin, altcoins, DeFi, NFTs, and more.
FAQs
Could Binance face legal or regulatory consequences from the October 10 crash?
Even though CZ denies involvement, regulators could still review trading activity across all exchanges to ensure no market manipulation occurred. Binance’s oversight under ADGM and U.S. compliance teams may help mitigate legal exposure, but investigations could affect reporting requirements or future audits.
How might this crash affect retail crypto investors?
Investors who experienced losses may adjust their trading strategies, possibly moving to stablecoins or less volatile assets. Market sentiment can remain cautious for weeks after a large liquidation event, impacting liquidity and short-term price volatility.
Could other exchanges be implicated in similar price movements?
Large-scale Bitcoin price swings often involve activity across multiple exchanges due to arbitrage and liquidity chains. Regulators may monitor whether coordinated selling occurred anywhere, not just on Binance, to determine systemic market risks.
LEO price is attempting to steady itself after a recent pullback, rising more than 2% in the latest session as buyers stepped in near the $8 level. The move comes after several days of persistent selling that pushed the token toward a price zone that has repeatedly acted as a floor in the past.
While the rebound is modest, it stands out because it comes at a time when broader market conditions remain uncertain. Instead of accelerating lower, LEO slowed its decline, found support, and began to move higher, raising an important question for traders: Is this just a temporary bounce, or a sign that downside pressure is starting to fade?
LEO Price Action Stabilizes After Testing Demand Zone
LEO’s recent decline pushed the token toward the $8 demand zone, a region that has historically acted as a buying region. After sliding for several sessions, LEO finally found support around $8,demand zone. As price reached this level, selling pressure visibly weakened. The recent bounce reflects defensive buying, not aggressive accumulation. The daily RSI has moved out of the oversold region and is now hovering around 40s. While this does not confirm bullish momentum yet, it does indicate that selling pressure has cooled. In strong bearish trends, RSI tends to remain pinned below 30-35, something LEO has avoided during this bounce.
At the same time, MACD remains negative but is flattening, with the histogram showing declining bearish momentum. This often precedes range formation or a short-term relief move, especially when price is sitting on a well-defined zone like $8. While LEO price is still trading below its 50-day and 100-day EMAs, which keeps the broader structure cautious.
Zooming out, LEO price remains inside a broader consolidation range rather than a clear trend. The recent rebound does not invalidate the larger sideways structure, but it does reinforce the idea that the token is respecting the demand zone of $8. On the upside, the first hurdle to watch sits around the $9-$9.50 region. This region has repeatedly acted as a reaction zone where prior rebounds stalled. A clean move above it would indicate improving strength and open the door toward the upper range near $10. However, resistance remains heavy, without a strong follow-through, LEO price may struggle to sustain gains beyond the mid-range. That keeps the outlook balanced rather than outright bullish.
Meanwhile, UNUS SED LEO is showing early signs of a base-building phase. The higher-lows on shorter timeframes and reduced selling pressure point toward stabilization. Still, confirmation requires continuation above resistance, not just a bounce from support. If buyers fail to build momentum and price drifts back below $8, the token likely returns to consolidation. A break below $7.50 would expose lower demand zones and invalidate the current recovery attempt.
FAQs
How high will the LEO price rise by the end of 2026?
According to our UNUS SED LEO price prediction, the digital asset might hit a maximum of $16 by the end of 2026.
Is the UNUS SED LEO (LEO) coin a good investment for the future?
In the cryptocurrency industry, LEO is among the active virtual currencies. Its value could increase if lending and saving protocols gain greater traction.
What will be the maximum price of UNUS SED LEO by the year 2030?
With a potential surge, the LEO price may reach a maximum of $44 by the end of the year 2030.
Bitwise Asset Management has announced the acquisition of Chorus One, a major institutional staking services provider, marking a strategic expansion into on-chain yield generation. As per the report, the deal brings Chorus One’s staking infrastructure into Bitwise’s ecosystem, which already oversees more than $15 billion in client assets globally. Although financial terms were not disclosed, the move highlights Bitwise’s intent to deepen its role beyond passive crypto exposure.
Why Staking Is Central to Bitwise’s Strategy
Staking has emerged as one of the fastest-growing areas in digital asset management, particularly among institutional investors seeking yield in a low-interest-rate environment. By integrating Chorus One, Bitwise can directly support clients who hold spot crypto assets and want to earn rewards through proof-of-stake networks. The acquisition positions staking as a core offering rather than an add-on, aligning with Bitwise’s broader push toward diversified, multi-strategy crypto solutions.
Chorus One Brings Scale and Infrastructure
Chorus One currently manages around $2.2 billion in staked assets and operates validator infrastructure across several major blockchain networks. Its expertise allows institutions to participate in staking without managing technical complexity or security risks themselves. Folding this capability into Bitwise’s platform enables tighter integration between asset management, custody, and yield generation, creating a more streamlined institutional experience.
The timing of the deal is notable as Ethereum staking activity reaches record levels. Roughly 30% of ETH’s circulating supply is now staked, signaling strong long-term confidence in the network. However, the surge in participation has also led to operational bottlenecks, with new validators facing activation delays that stretch beyond two months. Despite these hurdles, demand for Ethereum-based yield remains robust, reinforcing staking’s appeal.
Bitwise’s acquisition fits into a wider trend of consolidation across the crypto sector. In 2025, merger and acquisition activity surged as firms sought scale, efficiency, and end-to-end product offerings. Staking providers, in particular, have become attractive targets as asset managers look to internalize yield generation rather than rely on external partners.
Traditional Finance Moves Toward Crypto Yield
The deal also reflects a shift among traditional financial institutions. Firms such as Morgan Stanley and Grayscale are increasingly exploring staking within ETFs and trust structures, signaling growing acceptance of crypto-native yield strategies. This convergence suggests staking is becoming a standard component of institutional crypto portfolios.
Overall, Bitwise’s acquisition of Chorus One underscores how staking is changing into a foundational pillar of institutional digital asset investing, shaping the next phase of market maturity.
Never Miss a Beat in the Crypto World!
Stay ahead with breaking news, expert analysis, and real-time updates on the latest trends in Bitcoin, altcoins, DeFi, NFTs, and more.
FAQs
What does Bitwise’s acquisition of Chorus One mean for investors?
Bitwise now offers integrated staking, letting investors earn crypto rewards directly through its institutional platform.
How does staking benefit cryptocurrency holders?
Staking allows holders to earn rewards by supporting blockchain networks, providing passive income while securing assets.
How is institutional interest in crypto staking evolving?
Institutions are increasingly adopting staking for yield, integrating it into ETFs, trusts, and multi-strategy crypto portfolios.
Michael Burry, the investor famous for predicting the 2008 financial crisis, has issued a strong warning about Bitcoin. He has warned that the ongoing Bitcoin crash could seriously damage crypto miners and companies that hold large amounts of Bitcoin.
In a recent Substack post, Michael Burry said that Bitcoin has failed to prove itself as a safe store of value like gold or silver. He described it as a purely speculative asset that moves mainly on market hype.
While precious metals have recently reached record highs, Bitcoin has continued to slide lower.
He said Bitcoin has not reacted positively to typical market drivers like dollar weakness or geopolitical tensions. Instead, it is moving closely with the stock market, especially the S&P 500.
Burry pointed out that Bitcoin’s correlation with the S&P 500 has reached around 0.50, showing that it is acting more like a tech stock than an independent asset.
Michael Burry Warns Bitcoin Price To Crash To $50K
Since October, Bitcoin has already dropped around 40% from its high of $126,000, and Burry believes the worst may still be ahead.
However, Bitcoin recently fell below $73,000, its lowest level in over a year, due to weaker demand and lower liquidity.
He further criticized Bitcoin exchange-traded funds ETFs, which have seen some of their biggest outflows in recent months. He believes ETFs have increased speculation and made price swings even sharper.
Therefore, he believes that Bitcoin could further slide toward $50,000, which could seriously hurt miners and companies tied to crypto.
Bitcoin Holding Company & Miners May Face Heavy Risks
Burry is even more worried about large companies that hold Bitcoin on their balance sheets. He warned that firms like Strategy Inc., one of the biggest corporate Bitcoin holders, face serious risks.
If Bitcoin falls another 10%, the company could face billions of dollars in losses and struggle to raise new funds.
He also warned that continued price drops could push many Bitcoin mining firms toward bankruptcy. Since miners depend on high Bitcoin prices to stay profitable, a deeper crash could destroy their business models.
Never Miss a Beat in the Crypto World!
Stay ahead with breaking news, expert analysis, and real-time updates on the latest trends in Bitcoin, altcoins, DeFi, NFTs, and more.
FAQs
Why could a Bitcoin drop to $50K impact financial markets beyond crypto?
A sharp Bitcoin decline could strain companies holding large crypto positions, potentially affecting investor confidence, lending markets, and related tech stocks tied to crypto ecosystems.
What risks do corporate Bitcoin holdings pose to company finances?
Companies with significant Bitcoin reserves may face balance sheet volatility, impaired credit access, and potential write-downs, which could influence stock prices and investor sentiment.
Could this situation trigger regulatory or market interventions?
Persistent market stress from a steep Bitcoin decline could prompt regulators like the SEC or CFTC to issue guidance or scrutiny on trading practices, ETFs, and corporate disclosures.
U.S. Senate Democrats are preparing to restart discussions on long-awaited legislation for regulating the crypto market, signaling a renewed effort to reduce uncertainty around digital assets. This closed-door meeting is the first formal Democratic engagement since the bill’s markup was delayed last month, raising hopes that progress may resume after weeks of delay.
According to journalist Eleanor Terrett, Democratic lawmakers will use the meeting to review unresolved issues that previously stalled the bill. Discussions are expected to focus on resolving internal disagreements before the legislation moves further through the Senate.
SCOOPLET: Senate Democrats are planning to reconvene tomorrow for a closed-door meeting on crypto market structure, according to two sources familiar with the plans. It will be the first Dem member-level meeting since the @BankingGOP postponed its markup last month.
The main focus is the CLARITY Act, which seeks to create a clear framework for regulating digital assets in the U.S. A key part of the bill is defining the roles of the Securities and Exchange Commission (SEC) and the Commodity Futures Trading Commission (CFTC), an issue that has long divided regulators, lawmakers, and industry participants.
While some parts of the bill have already passed through committees, disagreements over regulatory scope, enforcement authority, and compliance rules continue to slow progress. The renewed Democratic talks are seen as a necessary step to resolve these issues.
White House Push Speeds Up Talks — But Deadlock Remains
Momentum has increased following reported pressure from the White House, which has urged lawmakers and industry groups to settle disputes by the end of February. However, a high-level White House meeting held on February 3 with banks and crypto industry leaders failed to resolve the core disagreements, particularly over whether stablecoin issuers can offer interest or rewards.
The Senate Agriculture Committee recently advanced a version of the crypto bill, giving it some legislative traction. However, the vote was along party lines, showing lack of bipartisan support, which remains a key obstacle to advancing it to the full Senate.
At the Ondo Finance Summit, Patrick Witt, Executive Director of the Crypto Council, said he believes President Trump is preparing to sign the CLARITY Act into law by April 3, 2026, if the bill clears Congress soon. This reflects strong optimism among industry leaders, even though the legislative path is not yet finalized.
Limited Time Before Elections
The political calendar adds urgency to the negotiations. As midterm elections approach, experts warn that the window for passing complex legislation will shrink. Lawmakers often slow down legislative work after midyear, making spring a critical period for progress.
Never Miss a Beat in the Crypto World!
Stay ahead with breaking news, expert analysis, and real-time updates on the latest trends in Bitcoin, altcoins, DeFi, NFTs, and more.
FAQs
What is the CLARITY Act in U.S. crypto regulation?
The CLARITY Act aims to define clear rules for digital assets and clarify the roles of the SEC and CFTC.
Why are Senate Democrats restarting crypto bill talks?
Democrats are reviewing unresolved issues to reduce uncertainty and move the crypto bill forward after delays.
How does the White House influence crypto legislation?
The White House is urging lawmakers and industry to resolve disputes quickly, speeding up progress on the bill.
When could the CLARITY Act potentially become law?
If Congress approves the bill soon, it could be signed by April 3, 2026, according to industry projections.
Dubai is taking a bold step in luxury and finance as Billiton Diamond and Ctrl Alt announce a new initiative to put polished diamonds on the blockchain. The project has already tokenized more than AED 1 billion (over $280 million) worth of certified diamonds held in the UAE, making it one of the largest real-world asset tokenization efforts to date.
The partnership aims to transform diamonds—traditionally illiquid and difficult to verify—into transparent, secure, and easily transferable digital assets. Ctrl Alt is responsible for converting the physical diamonds into blockchain-based tokens, while Ripple’s custody technology ensures ownership remains safe, auditable, and tamper-proof.
Dubai Brings Diamonds On-Chain
The tokenized diamonds are issued on the XRP Ledger (XRPL), chosen for its fast settlement speeds and low transaction costs—key advantages when handling high-value luxury assets. Each token is backed by a certified physical diamond stored securely in the UAE, with full traceability and real-time verification.
Billiton plans to launch a dedicated digital platform where buyers and sellers can view diamond inventory, certification records, and ownership details instantly. The platform may later enable regulated secondary trading, opening the door for improved liquidity and faster settlement for manufacturers, traders, and investors.
DMCC has played a central role by connecting stakeholders and guiding the regulatory framework, reinforcing Dubai’s growing leadership in blending physical commodities with advanced financial technology.
Executives from Billiton, Ctrl Alt, DMCC, and Ripple describe the initiative as a new benchmark for bringing high-value assets on-chain. Crypto analyst WrathofKahneman called it a major step forward for real-world asset adoption, while Bill Morgan joked that although his wife can’t wear a tokenized diamond, she might still want one.
Never Miss a Beat in the Crypto World!
Stay ahead with breaking news, expert analysis, and real-time updates on the latest trends in Bitcoin, altcoins, DeFi, NFTs, and more.
FAQs
What is diamond tokenization and how does it work?
Diamond tokenization converts physical diamonds into digital tokens on blockchain, allowing secure, transparent, and tradable ownership.
How does tokenizing diamonds benefit investors?
It increases transparency, reduces costs, and improves liquidity by making diamonds easily tradable digital assets with clear provenance and ownership records.
Is tokenized diamond trading regulated in Dubai?
Yes, all trading of tokenized diamonds will require approval from Dubai’s Virtual Assets Regulatory Authority (VARA), ensuring compliance and investor protection.
US President Donald Trump has signed a massive $1.2 trillion government funding bill, bringing an end to a brief four-day federal shutdown. The shutdown began over the weekend after lawmakers failed to reach an agreement on key spending measures.
The decision has reduced political uncertainty and brought a positive reaction in the crypto market, especially for Bitcoin.
Trump Signs $1.2 Trillion Bill Ending Government Shutdown
On February 3, 2026, US President Donald Trump signed the Consolidated Appropriations Act of 2026, a massive $1.2 trillion spending bill.
The bill was passed by Congress in the House by a narrow margin, 217-215. It finalizes 11 major annual spending bills that cover government programs and operations for the rest of the fiscal year.
BREAKING: The law being signed by President Trump SLASHES $10B in wasteful and fraudulent foreign aid, ENDS taxpayer grants to NPR and PBS, and solidifies the closure of USAID
With Trump’s signature, most federal agencies will now remain funded through September 30, 2026.
Key Highlights of the Spending Bill
The newly signed bill includes several important changes. It cuts funding for NPR and PBS, reduces foreign aid by nearly $10 billion, raises military pay, and increases money for deportation flights. It also confirms that USAID will be closed as part of budget reforms.
However, not everything is settled yet. The spending plan for the Department of Homeland Security is still under negotiation, with Democrats pushing for tighter limits on enforcement actions.
The bill also showed divisions inside the Republican Party, as some members disagreed with parts of the spending plan.
House Democratic Leader Hakeem Jeffries said Democrats will not support any more short-term funding for Homeland Security unless major changes are made. This creates a risk of another partial government shutdown soon.
How the Bill Impacts the Crypto Market
The bill does not include any direct rules for cryptocurrency, but it still affects the crypto market in important ways. As the bill was signed, Bitcoin saw a small recovery bounce from $75,600 and $77,310.
During the four-day shutdown, regulators like the SEC and CFTC were partly inactive, which slowed crypto approvals and ETF discussions.
With the government now reopened, key economic data, including the January jobs report and weekly jobless claims, will be released on time. These reports influence Federal Reserve decisions, which have a strong impact on crypto prices.
Never Miss a Beat in the Crypto World!
Stay ahead with breaking news, expert analysis, and real-time updates on the latest trends in Bitcoin, altcoins, DeFi, NFTs, and more.
FAQs
What does the $1.2 trillion funding bill do?
It ends the four-day shutdown and funds most federal agencies through Sept 30, 2026 with $1.2T in approved spending.
How did the bill affect Bitcoin and crypto markets?
It eased uncertainty; Bitcoin rebounded as markets welcomed reopened agencies and timely economic data that guide Fed expectations.
Does the bill include new cryptocurrency regulations?
No. It adds no crypto rules, but reopening the SEC and CFTC restarts reviews, data releases, and ETF-related processes.
Is another government shutdown still possible?
Yes. DHS funding is still disputed, and party divisions mean a partial shutdown risk remains if talks stall.
The Bitcoin price is under pressure after slipping below its April 2025 low. The move has reignited fears of a deeper correction, but analysts remain divided on whether this is the final phase of the bear market or just another leg down before recovery.
Historically, Bitcoin bear markets last around 12 months. Considering this, the current cycle appears roughly one-third complete. However, this time the decline has been faster than usual, raising the possibility that the bottom could arrive earlier than in past cycles.
Bitcoin Market Cycle Appears to Be Moving Faster
One key difference in this cycle is speed. Bitcoin topped earlier than expected in October, and the decline since then has been sharper than previous bear markets. Some analysts believe this faster drop could mean the bottom also forms sooner, possibly between June and August instead of late Q4.
There is also a growing belief that Bitcoin market cycles are shortening overall. As institutional participation increases, long-term holders and miners may have less influence on price swings, slowly pushing Bitcoin toward behavior closer to traditional risk assets like the S&P 500.
How Low Can Bitcoin Price Crash?
Based on historical drawdowns, Bitcoin often finds strong buying interest after falling 40% to 60% from its peak. In this cycle, many analysts do not expect a 70% crash like earlier bear markets.
Current estimates suggest Bitcoin may be 20% to 30% away from the final bottom. If price continues lower, the $65,000 level is seen as a zone where fear typically builds. A deeper drop toward $55,000 could trigger panic selling.
So, Late Q3 or early Q4 could offer better conditions for long-term investors to re-enter the market with confidence. Using the traditional 365-day bear market model, there are roughly 200 days left before a formal bottom forms.
From here, Bitcoin may move sideways with slow weakness, or it could drop sharply, bringing the bear phase to an earlier end.
Bitcoin Below Long-Term Support Raises Risk
Veteran trader Peter Brandt has noted that Bitcoin has breached an important long-term support level on the weekly chart. Historically, when this happens, the price often moves lower before finding real stability.
Past cycles in 2014, 2018, and 2022 show that once Bitcoin fell below the 100-week moving average, it often dropped quickly toward the 200-week level before any meaningful bounce occurred. This history suggests that short-term relief rallies are not guaranteed.
Galaxy CEO Says Bitcoin Is Near the Lower End of a New Range
Galaxy Digital CEO Mike Novogratz believes Bitcoin’s recent drop is driven by profit-taking rather than a breakdown in fundamentals. After Bitcoin surged above $100,000 and later reached near $130,000, many early investors locked in gains, creating selling pressure.
According to Novogratz, Bitcoin may now be trading within a broad $70,000 to $100,000 range. With price hovering near $76,000, he believes much of the excess leverage has already been flushed out, bringing the market closer to balance.
Further, macro conditions may play a role in stabilizing the Bitcoin price. The progress on crypto market structure regulation and shifts in interest rate expectations could improve sentiment.
Novogratz also highlighted that stablecoin usage and blockchain infrastructure growth remain strong, suggesting adoption continues even as prices struggle.
FAQs
How low can Bitcoin price fall during this correction?
Analysts see strong demand between $65,000 and $55,000, a range where fear peaks and long-term buyers often step back in.
Why is this Bitcoin market cycle moving faster than before?
Higher institutional activity and faster capital flows are shortening cycles, making price drops sharper but potentially reducing bear market length.
When could Bitcoin recover from the current downturn?
If history repeats, Bitcoin may stabilize by late Q3 or early Q4 as selling slows and macro conditions improve.
The nomination of Kevin Warsh as the next Chair of the US Federal Reserve is already facing serious hurdles. The group, led by Senator Elizabeth Warren are pushing back strongly, warning that the warsh nomination should not move forward while major investigations involving current Fed Jerome Powell remain unresolved.
Why Democrats Want Warsh’s Fed Nomination To Be Delayed
In a letter to the committee, the Democrats demanded that “any nomination proceedings for Mr. Warsh” be put on hold until the investigations are fully completed. They believe it would be unfair and politically risky to replace Powell while the cases are still open.
Jerome Powell is currently being investigated by the Department of Justice over possible issues tied to $2.5 billion in extra renovation costs at the Federal Reserve headquarters.
Although Powell has called the investigation “unprecedented” and hinted that it may be connected to political pressure from President Donald Trump over policy disagreements.
At the same time, Fed Governor Lisa Cook is reportedly dealing with a separate legal issue connected to an alleged mortgage fraud case. Trump had previously tried to remove Cook from her role, but she remains in office for now.
Concerns Over Federal Reserve Independence
Democrats say these investigations are being used as a political tool to weaken the independence of the Federal Reserve. They argue that allowing Trump to choose a new Fed Chair while two sitting officials are under investigation creates a dangerous situation.
The letter from Democratic lawmakers warned that letting the administration influence the Fed in this way could damage the credibility of the central bank.
They called the situation “absurd” and accused the government of trying to take control of the Fed through legal pressure.
Thin Senate Margin Gives Democrats Leverage
The Senate Banking Committee is narrowly divided, with 13 Republicans and 11 Democrats. While Democrats alone cannot block the nomination, even a single Republican dissent would be enough to stall Warsh’s confirmation.
That risk became real after Senator Thom Tillis announced he would oppose any Federal Reserve nominations until the investigations conclude. His stance effectively gives Democrats the leverage needed to delay the process.
Perhaps, until the investigations are closed, Warsh’s nomination is unlikely to advance smoothly. Even if Republicans push forward, the risk of a committee deadlock remains high.
Never Miss a Beat in the Crypto World!
Stay ahead with breaking news, expert analysis, and real-time updates on the latest trends in Bitcoin, altcoins, DeFi, NFTs, and more.
FAQs
Who is Kevin Warsh and why did Trump nominate him as Fed chair?
Kevin Warsh is a former Federal Reserve governor and Stanford fellow, nominated by Trump for his deep experience in monetary policy and markets.
Why do Democrats want to delay Kevin Warsh’s Fed nomination?
Democrats say replacing the Fed Chair while investigations into current officials are ongoing risks politicizing the central bank and harming its credibility.
Can Democrats block Kevin Warsh’s confirmation?
They can’t block it alone, but with the Senate narrowly split, one Republican opposing the move could stall the nomination process.
What role does Donald Trump play in the controversy?
Democrats argue the investigations may be used to pressure the Fed, allowing Trump to reshape leadership amid unresolved legal scrutiny.
Binance’s Secure Asset Fund for Users (SAFU) has made another big move in its ongoing plan to shift its $1 billion emergency reserve from stablecoins into Bitcoin. The fund added 1,315 BTC worth about $100 million in its latest buy, boosting total two‑day accumulation to 2,630 Bitcoin valued at roughly $201 million. This purchase is part of a 30‑day conversion strategy announced by Binance, reflecting confidence in Bitcoin as a core reserve asset and strengthening user protection in volatile markets.
Monero (XMR) is showing early signs of stabilization after a prolonged decline, rising over 3% on the day as price reacts from a technically significant support zone. The bounce comes at a critical moment, with XMR retesting the lower edge of a multi-week rising channel while broader crypto markets remain fragile. This creates a familiar dilemma: Is the move simply a relief bounce inside a weakening trend, or the early phase of a rotation back toward the upper channel near $500?
Monero’s price has defended the channel support zone of $380 and showed a pullback during the intraday session. This bounce has remained orderly rather than impulsive. As XMR approached the lower edge of the channel, selling pressure slowed gradually, with downside wicks expanded, suggesting sellers are no longer in control at current levels. Technically, the $360-$380 region has emerged as a demand zone.
As long as Monero price holds above this zone, the broader channel structure remains intact. The immediate test now lies at $390-$400, where sellers placed their positions. A strong break of this region would shift the corrective structure to neutral-bullish, opening the door toward $420-$450. While further strength above the 50-day EMA mark could extend the recovery toward the $480-$500 zone back into focus as a rotational target rather than a distant hope. On the other side, a break below $360, however, would invalidate the channel and expose deeper downside making the current bounce technically decisive.
Open Interest and Liquidation Map Point to Short-Covering Risk
Derivatives data adds weight to the rebound scenario. Monero’s future open interest has risen above $142 million, up more than 4% even as price stabilizes, a sign that traders are adding exposure, not exiting. This increase in open interest alongside price rise often signals shorts being forced to defend positions, especially when price sits near crucial support.
Liquidation heatmap data shows a clean cluster of short liquidation levels stacked above the current range, particularly between $390 and $410. If XMR price pushes into this zone, forced short closures could accelerate upside momentum, turning a slow rebound into a sharp squeeze. At the same time, downside liquidation pressure appears relatively thin below current price levels, reinforcing the idea that sell-side leverage has already been flushed during the prior decline.
Broader Context Keeps Reversal in Check
Despite the improving micro-structure, Monero is still trading within a broader environment of risk aversion, where capital remains selective and volatility elevated. Privacy-focused assets have lagged during recent market weakness, making confirmation, not anticipation. This means the rebound needs a follow-through, not just reaction. Without acceptance above reclaimed resistance, the move risks fading into another lower-high sequence. As XMR price remains at a decision point, holding above the support zone of $360 keeps the path toward $400-$420 viable.
FAQs
Is Monero (XMR) showing signs of a price reversal?
Monero is stabilizing at a key support zone, suggesting selling pressure is easing, but a confirmed reversal needs a breakout above $400.
Why is Monero price bouncing despite weak crypto markets?
XMR is reacting to strong technical support and short-covering pressure, even as overall market sentiment remains cautious.
What price levels should traders watch next for XMR?
Immediate resistance sits near $390–$400. A clean break could open the path toward $420–$450, while a drop below $360 weakens the setup.
Elon Musk has pulled far ahead as the world’s richest person after SpaceX acquired his AI startup xAI. Forbes’ real-time tracker now estimates Musk’s net worth at $852.5 billion. The deal merged SpaceX, xAI, and X, valuing the combined company at $1.25 trillion. Musk owns 42% of SpaceX, which now accounts for more than half of his total wealth. His fortune is now larger than the combined wealth of Jeff Bezos, Larry Page, and Sergey Brin. Tesla still makes up about 12% of his holdings, while SpaceX’s Starship and Starlink continue to drive growth.
Bitcoin price today dropped sharply, falling to the $74,000 level and triggering another wave of selling across the crypto market. Ethereum slipped nearly 10% to around $2,100, while most major altcoins declined between 5% and 10% today.
The sudden move has raised fresh concerns about whether Bitcoin is entering a deeper correction phase after weeks of volatility.
Possible Reasons Behind the Bitcoin Crash Today
The latest Bitcoin crash is not linked to a single event. Instead, analysts point to multiple factors hitting the market at the same time, creating strong downward pressure.
Heavy Liquidations Accelerate Bitcoin Decline
One of the main reasons behind the drop is massive liquidations in the futures market. Market data shows that over $500 million worth of Bitcoin positions were liquidated in recent sessions.
Many traders were using high leverage. When Bitcoin slipped even slightly, automatic liquidations kicked in, forcing positions to close. This led to a chain reaction of selling, pushing prices lower within minutes.
After the U.S. market opened, Bitcoin dumped another $1,700, wiping out more than $55 million in long positions in just two hours. The overall crypto market lost nearly $50 billion during the same move.
US Stock Market Weakness Hits Crypto Hard
The crypto sell-off mirrored weakness in traditional markets. The S&P 500 fell nearly 1.3%, as investors moved away from risk assets.
Historically, when global markets turn cautious, cryptocurrencies tend to react faster and more sharply. The same pattern played out this time, with Bitcoin and altcoins facing intense selling pressure.
Spot Bitcoin ETF Outflows Add Pressure
Another key factor weighing on prices is strong outflows from spot Bitcoin ETFs.
As per CoinGlass data, on February 3, spot BTC ETFs recorded $272 million in net outflows. BlackRock’s IBIT stood out as the only major buyer with $60 million in inflows, while other funds continued to see selling.
When ETF flows turn negative like this, it often signals reduced confidence among institutional investors, even if long-term interest remains intact.
Epstein Files Add to Market Uncertainty
Beyond macro pressure and liquidations, renewed discussion around the Epstein files has added another layer of uncertainty to the crypto market. Reports highlighting Jeffrey Epstein’s past connections to early Bitcoin research, funding linked to MIT’s Digital Currency Initiative, and ties to prominent crypto figures have resurfaced online.
While there is no direct evidence linking these revelations to current price action, the narratives have fueled speculation on social media and increased short-term volatility. During already weak market conditions, such controversies often amplify fear and contribute to risk-off behavior among traders.
Rising global tensions have also played a role. Ongoing disputes involving the United States, Iran, and Venezuela, along with tariff-related concerns, have increased uncertainty across financial markets.
During such periods, large funds and ETF managers usually cut exposure to risky assets. This capital outflow has added further pressure to Bitcoin and the broader crypto market.
Profit-Taking After Bitcoin’s Massive Rally
Galaxy Digital CEO Mike Novogratz believes the recent decline is mainly driven by profit-taking, not panic.
According to him, many investors who bought Bitcoin at much lower levels started selling after prices crossed $100,000, locking in gains after a long rally. He described the move as a “seller’s wave”, rather than fear-driven selling.
Novogratz also dismissed concerns around emerging threats like quantum computing, saying price moves are still driven by basic supply and demand.
Bitcoin Price Analysis: Key Support and Resistance Levels
The market is sitting at a critical turning point. If Bitcoin slips below the $74,500 support, the next downside target is seen around $69,800–$68,000, a zone that previously acted as strong resistance.
A deeper breakdown from there could drag prices toward the $53,000–$54,000 range, implying a correction of nearly 30% from current levels.
On the upside, analysts believe a quick recovery is unlikely, as Bitcoin would need to reclaim the $90,000–$95,000 resistance zone and establish a clear higher-high structure before any sustained rebound can take shape.
Never Miss a Beat in the Crypto World!
Stay ahead with breaking news, expert analysis, and real-time updates on the latest trends in Bitcoin, altcoins, DeFi, NFTs, and more.
FAQs
Why is Bitcoin price down today?
Bitcoin is down today due to leveraged liquidations, weak U.S. markets, ETF outflows, profit-taking after the rally, and rising global uncertainty.
How do U.S. stock market declines impact Bitcoin prices?
When stocks fall, investors reduce risk exposure. Bitcoin typically reacts faster, leading to sharper declines during market-wide sell-offs.
Is the current Bitcoin drop a healthy correction?
Yes. Many analysts view this move as a normal correction after a strong rally, helping reset leverage and excess speculation.
Does profit-taking mean Bitcoin’s bull market is over?
No. Profit-taking is common after major rallies and does not signal the end of a long-term bullish trend.
What could drive Bitcoin prices higher again?
Stabilizing markets, renewed ETF inflows, reduced leverage, and improving macro sentiment could support a recovery.
BitMine Immersion Technologies is facing fresh pressure after reporting over $6 billion in unrealized losses linked to its Ethereum-focused treasury strategy. As the Ethereum price fell along with the broader crypto market, BitMine shares (BMNR) dropped another 5% on Monday, trading near $23.83, their lowest level since the stock jumped in July 2025 following the ETH treasury announcement.
The decline has raised concerns among investors, but company leadership says the reaction is missing the bigger picture.
Tom Lee Says Losses Are Part of the Plan
BitMine Chairman Tom Lee rejected claims that the losses show a failed strategy. In posts shared on X, Lee explained that the company is not trying to time the crypto market.
These tweets miss the point of an ethereum treasury: – BitMine is designed to track the price of $ETH – outperform over the cycle (think up ETH) – crypto is in a downturn, so naturally ETH is down$BMNR will see “unrealized” losses on our holdings of ETH during these times: -… https://t.co/VpoNjAnJdC
— Thomas (Tom) Lee (not drummer) FSInsight.com (@fundstrat) February 3, 2026
Instead, BitMine is designed to track and outperform Ethereum over a full market cycle, similar to how long-term index funds work in traditional markets. According to Lee, losses during market downturns are expected, not accidental.
He added that index funds are rarely criticized during bear markets — and BitMine should be viewed the same way.
Heavy Ethereum Holdings Increase Price Impact
BitMine’s large Ethereum holdings make the company especially sensitive to price swings. It currently owns around 4.24 million ETH, worth about $9.6 billion, down from nearly $14 billion at last year’s peak.
Despite the price drop, BitMine continues to buy more Ethereum. The company added 41,788 ETH in just the past week, showing strong confidence in ETH’s long-term value.
Because of this scale, even small ETH price moves can have a big impact on BitMine’s reported losses, especially during periods of market stress and forced selling.
Rather than selling assets during downturns, BitMine earns income through Ethereum staking. The company expects to generate about $164 million per year from staking, with an average return of 2.81%.
As of February 1, around 2.9 million ETH — valued at nearly $6.7 billion — is actively staked. This provides steady income even when prices are weak.
Strong Balance Sheet With No Debt
One key advantage for BitMine is its debt-free balance sheet. The company reports:
193 Bitcoin holdings
$586 million in cash
$200 million stake in Beast Industries
No outstanding debt
This financial position allows BitMine to hold through market downturns without being forced to sell Ethereum at lower prices.
Long-Term Ethereum Strategy Remains Unchanged
Looking ahead, BitMine plans to launch its MAVAN validator network in 2026, partnering with three staking providers to expand operations. Despite short-term pressure, Lee says the company’s belief in Ethereum remains strong.
His message is clear: price volatility is temporary, but Ethereum’s role in the future of finance is long-term. For BitMine, current losses are not a warning sign; they are the cost of sticking with a long-term Ethereum investment strategy.
Never Miss a Beat in the Crypto World!
Stay ahead with breaking news, expert analysis, and real-time updates on the latest trends in Bitcoin, altcoins, DeFi, NFTs, and more.
FAQs
How much Ethereum does BitMine currently own?
BitMine holds about 4.24 million ETH. Because of this scale, even small ETH price changes significantly affect reported results.
Is BitMine financially stable despite the crypto market decline?
Yes. BitMine has no debt, holds substantial cash, Bitcoin, and equity investments, giving it flexibility to weather market downturns.
How does Ethereum staking impact BitMine’s financial performance?
Ethereum staking provides recurring revenue. BitMine expects roughly $164M per year, helping stabilize cash flow during crypto downturns.
Does BitMine have debt or liquidity risks as a crypto stock?
No. BitMine has zero debt, strong cash reserves, Bitcoin holdings, and equity investments, supporting long-term crypto exposure.
Bitmine (BMNR) has faced criticism after reports showed an unrealized loss of about $6.6 billion on its Ethereum holdings amid a market downturn. Some traders warned that this could create future selling pressure and limit ETH’s price. Bitmine Chairman Tom Lee pushed back, saying these views misunderstand the purpose of an Ethereum treasury; it’s meant to mirror ETH’s price over the full cycle, so paper losses during a slump are expected. Lee called the losses “a feature, not a bug,” comparing them to index ETFs that also show losses in down markets, and emphasized Bitmine’s long‑term strategy and ongoing ETH accumulation.
Tether has pulled back its fundraising plans after investors raised concerns about a reported $500 billion valuation, the Financial Times reported. The company had earlier considered raising $15–20 billion, but advisers are now discussing a much smaller amount of about $5 billion. CEO Paolo Ardoino said the higher figure was only the maximum Tether was willing to raise. He added that the company, which made around $10 billion last year from USDT reserves, is comfortable not raising any new funds.
The live price of the VeChain token is $ 0.00857868.
Price predictions for 2026 range from $0.035 to $0.088.
VET could extend toward $0.450 by 2030, if recovery structure holds.
VeChain (VET) enters the current market phase at a point where long-term fundamentals and price behavior are gradually beginning to align. As one of the earliest blockchain networks focused on real-world enterprise adoption, VeChain has spent years building infrastructure around supply-chain tracking, data transparency, and business-level integrations. While broader market interest faded during the prolonged correction, the protocol continued developing quietly, preserving its relevance beyond speculative cycles.
From a technical standpoint, VET’s chart structure no longer reflects panic-driven selling. Instead, price action has shifted into controlled consolidation, marked by lower volatility and consistent reactions around established demand zones. This type of behavior often suggests the market is transitioning from extended distribution into a valuation phase. As the year progresses, attention turns to whether VeChain can maintain this base and convert stability into a broader recovery move heading toward 2026.
As February unfolds, VeChain’s price action indicates that the market is prioritizing balance rather than momentum. VET has been rotating within a defined range, with buyers repeatedly defending the $0.020–$0.023 zone, while upside attempts continue to face supply pressure near $0.035–$0.038. As long as price holds above this lower support band, the broader structure remains constructive.
Rather than signaling weakness, this sideways movement suggests that selling pressure is being absorbed. A sustained break above the upper resistance zone would improve short-term sentiment, but even continued consolidation within this range supports the view that VeChain is building a base rather than entering a renewed downtrend.
VeChain (VET) Price Prediction 2026
Looking ahead, 2026 appears to be a transition year for VeChain, where prolonged consolidation may evolve into early trend development. The extended compression visible on higher timeframes suggests that speculative excess from previous cycles has largely been unwound, allowing price to rebuild on a firmer foundation.
During the first half of 2026, VET is likely to continue rotating within a broad band, potentially revisiting support near $0.030–$0.040 while making repeated attempts to reclaim resistance around $0.060. This range-bound behavior is typical during accumulation phases, where long-term participants gradually establish positions. If VeChain manages to reclaim and hold above the $0.060–$0.070 region later in the year, the technical structure would open the door for an advance toward the $0.088 level by year-end. Such a move would likely unfold gradually, supported by higher lows and improving trend consistency rather than sharp, speculative spikes.
VeChain Crypto Price Prediction 2026 – 2030
Year
Potential Low ($)
Potential Average ($
Potential High ($)
2026
0.035
0.060
0.088
2027
0.055
0.095
0.140
2028
0.085
0.160
0.250
2029
0.130
0.240
0.360
2030
0.200
0.350
0.450
VET Token Price Projection 2026
In 2026, VeChain price could project a low price of $0.035, an average price of $0.060, and a high of $0.088.
VeChain Coin Price Target 2027
As per the VeChain Price Prediction 2027, VET may see a potential low price of $0.055. Meanwhile, the average price is predicted to be around $0.095. The potential high for VET price in 2027 is estimated to reach $0.140.
VET Crypto Price Action 2028
In 2028, VeChain price is forecasted to potentially reach a low price of $0.085 and a high price of $0.250.
VeChain (VET) Price Forecast 2029
Thereafter, the VeChain (VET) price for the year 2029 could range between $0.130 and $0.360.
VeChain Price Prediction 2030
Finally, in 2030, the price of VeChain is predicted to maintain a steady positive. It may trade between $0.200 and $0.450.
The long-term projection assumes VeChain sustains relevance in enterprise blockchain use cases, with growth moderating over time as the asset matures.
Year
Potential Low ($)
Potential Average ($)
Potential High ($)
2031
0.30
0.40
0.60
2032
0.26
0.50
0.60
2033
0.30
0.55
0.75
2040
0.42
0.85
1.20
2050
0.65
1.40
2.20
VeChain (VET) Price Prediction: Market Analysis?
Year
2026
2027
2030
Changelly
$0.071
$0.105
$0.42
CoinCodex
$0.058
$0.082
$0.330
WalletInvestor
$0.086
$0.0125
$0.480
CoinPedia’s VeChain Price Prediction
Coinpedia’s price prediction suggests that VeChain is currently progressing through a late-stage accumulation phase. If VET continues holding its base and successfully reclaims higher resistance levels, the token could trade near $0.088 by the end of 2026, with longer-term potential extending toward the $0.30–$0.45 range by 2030, depending on market participation and trend strength.
Year
Potential Low ($)
Potential Average ($)
Potential High ($)
2026
0.035
0.060
0.088
Never Miss a Beat in the Crypto World!
Stay ahead with breaking news, expert analysis, and real-time updates on the latest trends in Bitcoin, altcoins, DeFi, NFTs, and more.
FAQs
What is the VeChain (VET) price prediction for 2026?
VeChain is projected to trade between $0.035 and $0.088 in 2026, with price action shaped by consolidation, accumulation, and gradual trend development.
What is the VeChain price prediction for 2027?
VeChain price prediction for 2027 suggests VET could trade between $0.055 and $0.140, supported by accumulation and gradual trend expansion.
What is the VET Chain price prediction for 2030?
VeChain price prediction for 2030 estimates a range of $0.200 to $0.450 if enterprise adoption grows and long-term market trends remain positive.
What is the VeChain price forecast for 2035?
VeChain price prediction for 2035 assumes steady maturity, with VET potentially trading between $0.45 and $0.75 as growth moderates over time.
What is the VeChain price prediction for 2040?
VeChain price prediction for 2040 projects VET could range from $0.85 to $1.20 if it maintains relevance in enterprise blockchain solutions.
How high can VeChain price go in 2025?
VeChain price in 2025 could range between $0.030 and $0.060 if consolidation holds and market conditions gradually improve without strong speculative momentum.
Is VeChain a long-term investment?
VeChain’s focus on enterprise blockchain use cases supports its long-term outlook, though price growth is expected to be gradual rather than explosive.
Bitcoin (BTC) price has led the wider crypto market in a further selloff. After slipping below its crucial buy zone around $80k last week, Bitcoin price extended its selloff today to hit $72,889 on Tuesday, February 3, for the first time since the first week of November.
Bitcoin Price Falls on Leverage Flashouts
As such, more than 167k leveraged traders were flashed out, with more than $730 million liquidated during the past 24 hours. Out of this, more than $528 million involved long traders, amid the notable decline in Bitcoin’s Open Interest (OI).
According to market data analysis from CoinGlass, Bitcoin’s OI has continued to shrink since the October 11 crypto capitulation to hover about $52.7 billion at press time.
Following today’s BTC price capitulation to $72k today, Matt Hougan, Bitwise CIO, stated that the flagship coin is under the influence of a multi-month bear market. Hougan stated that the Bitcoin price has been in a bear market since early 2025, but the high institutional adoption and regulatory clarity have blinded investors.
“This is not a bull market correction or a dip. It is a full-bore, 2022-like, Leonardo-DiCaprio-in-The-Revenant-style crypto winter set into motion by factors ranging from excess leverage to widespread profit-taking by OGs,” Hougan stated.
What’s Next?
Hougan, however, stated that the Bitcoin bottom is closer as its four-year bear cycle is in the last phase. Moreover, Hougan believes that Bitcoin investors are banking on regulatory progress and high institutional adoption, to drive a bullish rebound ahead.
Nonetheless, onchain data from Santiment shows that key Bitcoin investors have been aggressively selling while retail buys-back, a classic sell signal. From a technical analysis standpoint, if Bitcoin buyers fail to defend $73k in the coming day, a further correction towards $69k will be inevitable.
Dave Weisberger, co-founder of CoinRoutes and the man who built Morgan Stanley’s first program trading system, thinks October’s crypto crash was a coordinated attack. He shared his views on the Thinking Crypto podcast with host Tony Edward.
Weisberger called it “the greatest mass liquidation event in history.” The damage, that has kept the industry talking, was $19 billion wiped out. Bitcoin alone saw $5 billion in liquidations. Many altcoins dropped 20-70% at the bottom.
“Was it manipulation? I damn well think so. I have no proof. But it was just too damn obvious a time for an incredibly profitable attack,” he said.
How Did It Happen?
Weisberger broke down the playbook. Attackers spend weeks building a position: long spot, short perpetual futures. Then they wait for a low-liquidity window and dump spot holdings. They place bids far below market price in perpetuals.
When prices fall, leveraged traders get liquidated. Forced selling kicks in. The attackers scoop up assets at rock-bottom prices and walk away with massive profits.
DeFi exchanges got hit hardest because positions were visible on-chain. Binance’s auto-deleveraging system, Weisberger said, was “broken” during the event.
Weisberger has no patience for the halving cycle theory. He pointed out it’s based on just three data points.
He compared it to the Super Bowl Indicator, a 16-year streak that linked NFL wins to stock market performance. That correlation was “complete and unadulterated bullshit,” he said. The four-year cycle, in his view, is no different.
Why Recovery Is Still on the Table
Weisberger stays bullish long-term. Hash rate is now 6x what it was in 2022. Around 10-30% of Bitcoin supply has moved from early holders with cost basis between $10 and $1,000 to newer buyers who paid more.
New institutional holders are making multi-year allocations, not leveraged bets, he noted.
His portfolio reflects that confidence: Bitcoin as his main holding, Solana and BitTensor as secondary plays, and smaller positions in Zcash and XRP.
Coinbase has taken its fight against crypto debanking to Australia’s parliament, filing a formal complaint that accuses the country’s biggest banks of shutting legitimate crypto businesses out of the financial system.
Here’s the scoop.
Big Four Banks Named in Filing
The submission, sent to the House of Representatives Standing Committee on Economics, names Commonwealth Bank, Westpac, ANZ, and National Australia Bank. Coinbase said these banks are closing accounts without warning and blocking transactions tied to digital assets.
“There is nothing that degrades trust in an economy faster than being told you cannot use your own money,” Coinbase wrote.
The exchange warned that debanking has gone from a rare problem to a “systemic feature of the Australian financial landscape.” With four banks controlling most of the country’s payment rails, losing access amounts to an “unlawful regulatory ban” on lawful businesses.
Data cited in the filing shows 60% of fintech businesses faced denial of service from banks in 2021. That problem remains unresolved.
Reforms That Never Happened
Coinbase urged lawmakers to pass five transparency measures that regulators recommended years ago. The government backed these reforms in August 2022, but they were never put into law.
The measures would require banks to explain account closures, give 30 days’ notice, and provide access to dispute resolution.
The exchange pointed to how other countries handle the issue. The EU guarantees a basic bank account for all legal residents. Canada allows account access even with a bankruptcy history. In the U.S., President Donald Trump signed an executive order last August to stop crypto-related debanking.
Australia’s $4 billion fintech sector now waits on parliamentary recommendations expected later this year. The outcome could determine whether crypto innovation stays or moves elsewhere.
Recently the prices across the altcoin market remain under pressure. Yet a major institutional catalyst has emerged for the top blue chips of the industry. Moscow Exchange’s plans to launch cash-settled futures for Solana, XRP, and TRX adds regulated exposure at a time of heightened volatility, reshaping how these assets are viewed within long-term market frameworks.
MOEX Expands Crypto Derivatives Beyond Bitcoin and Ethereum
Moscow Exchange (MOEX) is preparing to broaden its regulated crypto derivatives lineup by introducing cash-settled futures linked to Solana, XRP, and TRX. The move extends the exchange’s existing Bitcoin and Ethereum offerings and aligns with its strategy to deepen institutional access to digital asset exposure in Russia.
Russia's Moscow Exchange announces plans to launch cryptocurrency indices for Solana, Ripple, $XRP and Tron by the end of 2026, signaling further crypto market integration in the country. pic.twitter.com/afvbVYhSjv
Initially, MOEX plans to launch indices tracking these altcoins, which will then serve as the underlying benchmarks for futures contracts. At the same time, settlement will be conducted entirely in Russian rubles, removing any need for physical cryptocurrency delivery and simplifying compliance requirements.
Regulatory Guardrails Shape Market Structure
Access to the new futures contracts will be restricted to qualified investors under Russian law. Meanwhile, contract specifications are expected to mirror MOEX’s existing crypto products, with monthly expiries and standardized risk controls.
JUST IN: Russia to roll out crypto regulatory framework this July, allowing retail participation. pic.twitter.com/rSGoesFBzK
This structure reflects a broader regulatory direction. The Russian government is working toward a comprehensive digital asset framework expected by July 1, 2026, positioning regulated derivatives as a controlled gateway for institutional participation rather than direct spot market exposure.
Institutional Credibility Versus Short-Term Market Stress
From a market context perspective, the announcement arrives during a sharp correction across the altcoin sector. While, prices for Solana, XRP, and TRX have all been influenced by broader risk-off sentiment rather than asset-specific fundamentals.
Still, promises for derivatives listings on national exchanges is a longterm. This broadly signal a shift in how assets are classified. Rather than speculative instruments, they begin to function as monitored financial products within formal trading ecosystems. That said, futures markets also introduce leverage and hedging dynamics, which can amplify volatility in the short term.
Sentiment Reset and Long-Horizon Positioning
At the same time, the current drawdown appears more consistent with a cooling phase than a structural breakdown. Market participation has thinned, forced liquidations have slowed after the event, and volatility is gradually normalizing.
Breaking developments such as MOEX’s futures expansion may not immediately reverse price trends. However, they do open the possibility of renewed interest once bearish pressure fades, particularly among long-term investors assessing regulated exposure and liquidity pathways rather than short-term price action.
How Futures Listings Could Influence Market Behavior
From an analytical perspective, regulated futures introduce price discovery mechanisms that operate independently of spot markets. For Solana, XRP, and TRX, this may gradually influence how capital flows react during future market cycles.
While price recovery is never guaranteed, the introduction of these contracts places the trio within a more formal derivatives framework. The presence of MOEX futures suggests that Solana, XRP, and TRX are increasingly treated as enduring components of the crypto market rather than transient narratives, reinforcing their standing within long-term structural discussions.
The crypto market is under pressure again, with prices sliding sharply during the latest trading session.
Total crypto market value has dropped 3.24% to $2.57 trillion, wiping out nearly $50 billion in a matter of hours. The selloff accelerated after the U.S. market opened, when Bitcoin suddenly fell by around $1,700.
Liquidations Add Fuel to the Drop
The sharp move triggered heavy liquidations.
Over $55 million in long positions were liquidated in just two hours
Traders betting on higher prices were forced out, pushing prices even lower
This happened despite positive news around the U.S. government shutdown, showing that market sentiment remains fragile.
Bitcoin and Ethereum Lead the Decline
Bitcoin fell more than 4% in 24 hours, trading near $75,700
Ethereum dropped over 6%, falling to around $2,220
Major altcoins like XRP, Solana, and Cardano also moved lower
Fear remains high, with the Crypto Fear & Greed Index stuck at 17, deep in “extreme fear” territory.
ETF Outflows and Weak Confidence
One key pressure point has been continued selling from institutional products.
U.S. spot Bitcoin ETFs have seen about $2.8 billion in outflows over the past two weeks
This steady selling has drained confidence and reduced buying support
Oversold conditions and low liquidity made the market vulnerable to sudden drops.
Ethereum at a Turning Point
Ethereum has broken below an important support level, adding to the bearish mood.
Short-term price trends remain weak
Longer-term trends are still pointing higher
Investors are now watching for a strong support zone to hold before any recovery can begin
Analysts say that Ethereum could still outperform Bitcoin later in the cycle, but only if broader market conditions stabilise.
A Sharp Contrast: Gold and Silver Surge
While crypto struggled, traditional safe-haven assets surged.
Gold is up 11% from its recent low, adding more than $3 trillion in value
Silver has jumped nearly 20%, adding around $800 billion
Together, nearly $4 trillion flowed back into precious metals in just 30 hours, a possible sign that investors are seeking safety.
What Should Investors Watch Next?
The next major catalyst will be the upcoming U.S. Federal Reserve meeting, which could set the tone for global markets.
Looking ahead, some research firms have warned that if selling pressure continues and no new catalysts emerge, Bitcoin could slide further and could even hit $58000, with long-term support levels coming into focus.
Crypto.com is spinning off its prediction market business into a standalone platform called OG, and it’s launching just days before the Super Bowl.
The platform will offer CFTC-regulated sports event contracts along with markets covering financial, political, cultural, and entertainment events. OG will also be the first prediction market platform to offer margin trading on prediction contracts.
The first one million users to sign up will receive up to $500 in rewards.
Why a Standalone Platform Now?
The numbers tell the story. Crypto.com has seen 40x weekly growth in its prediction market business over the past six months. That kind of traction demanded its own home.
“Crypto.com successfully built one of the largest brands and best app experiences in cryptocurrency during a period of hypergrowth amid a complex regulatory landscape, and now we will work to replicate this experience with OG in the prediction market space,” said Kris Marszalek, Co-Founder and CEO of Crypto.com.
OG is powered by Crypto.com | Derivatives North America (CDNA), the same CFTC-registered exchange and clearinghouse that launched the nation’s first federally licensed sports prediction contracts back in December 2024.
Nick Lundgren Named OG CEO
Nick Lundgren will lead OG as CEO. He currently serves as Crypto.com’s Chief Legal Officer and was the one who led the CDNA acquisition in 2022, then the largest acquisition in crypto history.
“Sports are the natural hub of prediction markets, and we see a massive opportunity to provide fans with an all-encompassing platform where it pays to be right,” Lundgren said. He called prediction markets a “deca-billion dollar industry.”
VIP Program Taps Major Sports Partnerships
OG will roll out a VIP program tied to Crypto.com’s existing sports deals. That includes access to experiences through Crypto.com Arena, UFC, Formula 1, and UEFA Champions League.
The launch lands at an interesting time. The CFTC said last week it would craft new rules for the prediction market industry. OG will be headquartered in the US and focused on that market first.
Ethereum founder Vitalik Buterin said the blockchain’s long-standing approach to scaling through layer-2 networks needs a rethink, as Ethereum’s core network grows faster than expected and many secondary chains struggle to meet earlier goals.
In a detailed post, Buterin said two developments have weakened the original case for treating layer-2 networks, or L2s, as extensions of Ethereum itself.
First, progress by L2s toward full decentralisation and security has been “far slower and more difficult” than expected. Second, Ethereum’s main network is now scaling directly, with transaction fees falling sharply and major increases in capacity planned from 2026 onward.
Together, those shifts mean the original vision for L2s “no longer makes sense,” Buterin said, calling for a new framework to define their role in the ecosystem.
From ‘Ethereum Shards’ to Independent Chains
Ethereum’s original roadmap imagined L2s as “branded shards” — tightly integrated networks that would inherit Ethereum’s security and censorship resistance while dramatically increasing transaction capacity.
But that vision has not materialised.
Some L2 developers have openly said they may never move beyond partial decentralisation, citing technical limits or regulatory demands that require retaining control. While that approach may suit certain users, Buterin said it does not align with the goal of scaling Ethereum itself.
“If you are doing this, then you are not scaling Ethereum in the sense originally intended,” he wrote.
Crucially, Buterin argued this is no longer a problem. Ethereum’s base layer is now expanding on its own, reducing reliance on L2s to deliver growth.
Ethereum’s Base Layer Gains Momentum
Rising capacity on the main network, combined with low fees, has weakened the argument that L2s must serve as near-identical replicas of Ethereum. Instead, Buterin said, L2s should be viewed as a broad spectrum — ranging from chains deeply secured by Ethereum to more independent systems with looser connections.
Users, he added, should decide how much trust or integration they require, rather than assuming all L2s offer the same guarantees.
What L2 Developers Should Focus On Now
Buterin urged L2 projects to define their value beyond simple scaling.
Possible directions include specialised features such as privacy tools, ultra-fast transaction processing, non-financial applications like identity or social platforms, and systems designed for workloads that even an expanded Ethereum mainnet cannot efficiently handle.
For L2s that rely on Ethereum-issued assets like ether, Buterin said a minimum level of security integration remains essential. Beyond that, flexibility — not uniformity — should be the goal.
A Push for Stronger Native Integration
On Ethereum’s side, Buterin said he has grown more confident in a proposal known as a “native rollup precompile” — a built-in feature that would allow Ethereum itself to verify advanced cryptographic proofs used by L2s.
Such a tool, he said, would reduce reliance on external security committees, improve trustless interoperability, and make it easier for L2s to build safely while adding unique features.
If flaws emerge, Ethereum would take responsibility for fixing them through network upgrades, bringing trust in the system.
Clear Guarantees, Not Perfect Uniformity
Buterin acknowledged that a more open approach will inevitably lead to some L2s being less secure or more centralised than others. That, he said, is unavoidable in a permissionless ecosystem.
“Our job,” Buterin wrote, “should be to build the strongest Ethereum that we can.”
XRP is showing tentative signs of stabilization after one of its sharpest pullbacks in recent months, even as broader crypto markets remain under pressure. For investors and experts, the focus is now shifting from panic-driven selling to whether prices are beginning to form a durable base.
How Far XRP Has Fallen
From its recent cycle high, XRP has declined by roughly 54%, a magnitude of correction that has historically preceded periods of consolidation or recovery rather than prolonged declines.
According to an expert, during the latest market-wide selloff, XRP briefly dipped toward recent lows but avoided setting a new breakdown point. Instead, prices rebounded quickly, suggesting that buyers are stepping in earlier than before.
This matters because in previous XRP cycles, declines in the 50–55% range have often marked exhaustion of selling pressure.
A Difference This Time: Higher Lows
While Bitcoin and Ethereum both pushed to new short-term lows during the latest drop, XRP did not.
XRP held above its prior low
This formed a higher low, a classic sign that downside momentum may be weakening
Buying interest appeared faster and more consistent on the rebound
For investors, this relative strength is important. It could mean that XRP is being accumulated at current levels rather than aggressively sold into weakness.
Short-Term Price Levels Investors Are Watching
XRP is now trading in a narrow recovery range, with several levels drawing attention:
Immediate support: The recent rebound zone where buyers stepped in aggressively
Near-term resistance: Around the $1.80 area, which previously acted as a floor before the selloff
Upside target if reclaimed: A sustained move above $1.80 could open the door toward $2.20–$2.30, where selling pressure last increased
A decisive break and hold above $1.80 would be an important signal that confidence is returning.
Bitcoin’s Role Remains Critical
Bitcoin is still hovering near a major support zone after its deepest pullback of the cycle. As long as Bitcoin holds these levels, XRP’s downside risk appears limited. A renewed breakdown in Bitcoin, however, would likely drag the entire market lower, regardless of individual strength.
In short: XRP can outperform, but it cannot fully decouple.
Broader Conditions Are Turning Less Hostile
Macro conditions are becoming less restrictive compared with recent months.
US economic data is pointing to renewed expansion
Expectations are growing for interest rate cuts later this year
Global trade tensions appear to be easing at the margin
After a brief recovery yesterday, the crypto market has turned red again.
On Monday, prices moved higher after comments from US President Donald Trump, who said he supports crypto and believes the US must lead in digital assets or risk falling behind China. That statement helped lift market sentiment for a few hours.
But the bounce did not last.
Crypto Market Slips Back Into the Red
At the time of writing, the total crypto market value has fallen 3.95% in the last 24 hours, dropping to $2.62 trillion.
Market sentiment remains weak
The Fear & Greed Index is at 17, showing extreme fear
Most major coins are still down sharply over the past week
Bitcoin, Ethereum and XRP are all trading lower again, along with most large altcoins.
Bitcoin Is Driving the Decline
Bitcoin continues to lead the market lower.
Bitcoin dominance is near 59%
This means the entire market is closely following Bitcoin’s price moves
When Bitcoin weakens, most other coins fall with it
Bitcoin is down more than 11% over the past seven days, keeping pressure on the broader market. Over $55 million worth of long positions were wiped out in just two hours as prices suddenly dropped.
The selloff came despite positive news around the U.S. government shutdown. BTC is currently down by more than 4%.
Ethereum Is Making Things Worse
Ethereum has fallen even harder than Bitcoin.
Ethereum is down more than 22% in the last week
This sharp drop has hurt confidence across the altcoin market
Many traders remain bearish, with little buying interest visible
Because Ethereum has such a large market value, its decline has added to the overall market losses.
Market Is Ignoring Stocks and Gold
Crypto is currently moving on its own, not in line with traditional markets.
Correlation with the S&P 500 is low
Correlation with gold is negative
This shows crypto is being driven mainly by internal fear and selling pressure
What Happens Next?
The market is at a critical level.
Holding above $2.59 trillion in total market value is important
A break below this level could lead to another sharp drop
Traders are watching US Federal Reserve signals and ETF fund flows for direction
Despite supportive comments from political leaders, crypto prices are falling again due to:
Continued Bitcoin weakness
Heavy losses in Ethereum
Extreme fear among investors
Lack of strong buying demand
Until Bitcoin stabilizes and sentiment improves, the market is likely to remain volatile.
The rejection of $3000 has pushed the Ethereum (ETH) price into a strong bearish trajectory. The price is failing to secure an important range of around $2300, which has become a major resistance to break. Meanwhile, the bulls have been defending the pivotal support at $2,150, keeping the bullish possibilities alive. This may point towards an upcoming trend reversal, but a popular analyst, Ali, suggests the bottom has not been reached yet.
Large Holders Remain in Disbelief
The big players seem to be not confident in the current price rebound, as they have been distributing instead of accumulating. The data from Glassnode shows that the Ethereum whales have been steadily reducing their holdings, possibly relocating them to other tokens.
The declining bars are the number of wallets holding more than 10,000, which has declined from 1,262 to 1,120. This validates the claim of a possible supply rotation, as they are not aggressively adding or holding at current levels. This points towards a weakening of upside momentum as buying pressure fades off. This may not follow a sudden crash but rather keep the price consolidated within a tight range.
Ethereum is Yet to Reach the Bottom
A better way to determine whether the ETH price is undervalued or overvalued is to analyse the MVRV values. The chart below shows the Ethereum MVRV ratio and how it behaves at the extreme levels over time. Historically, when ETH’s MVRV moves into the red zone above ~3.2, it has marked overheated conditions and major tops, where profit-taking tends to kick in. On the flip side, when MVRV drops toward the green zone around 0.8–1.0, it has often lined up with cycle bottoms, signaling that ETH is undervalued and long-term accumulation starts.
Right now, MVRV is sitting closer to the lower band, not in extreme greed territory. Historically, the Ethereum price bottoms when the MVRV ratio drops below 0.8. Currently, the ratio sits at 0.96, which suggests the typical bottom conditions haven’t fully formed yet.
ETH Price May Plunge Below $2000
The second-largest token has been facing strong upward pressure over the past few days; still, the support at $2000 was held tight. However, the data revealed by the MVRV pricing bands suggests the ETH price may find its bottom below $2000. MVRV pricing bands are used to map out where ETH tends to be undervalued, fairly valued, or overheated based on on-chain data rather than pure price action.
Historically, when ETH trades near the lower blue/green bands (0.8–1.0 MVRV), it has marked strong accumulation zones and cycle lows. On the other hand, moves towards the yellow and red bands (2.4–3.2 MVRV) have aligned with market tops, where price becomes stretched and profit-taking increases. Right now, ETH is trading above the lower bands but well below the red zone, suggesting it’s no longer deeply undervalued, yet still far from euphoric territory. They hint that Ethereum has room to explore lower levels, and based on this model, a cycle bottom could form below $1,959.
Wrapping it Up
Ethereum has long been viewed as one of the more stable assets in the crypto market, yet even the strongest ETH bulls are now deep in the red. BitMine, led by Tom Lee, is currently sitting on an estimated loss of nearly $6.8 billion. Meanwhile, prominent crypto whale Garrett Jin has faced losses of around $770 million, including a $195 million ETH long liquidation. In another major hit, Jack Yi, founder of Capital Inc., has reportedly lost close to $680 million.
These losses reflect the broader market environment, where sentiment remains firmly fearful amid extreme volatility across major cryptocurrencies, including Bitcoin and Ethereum. At the same time, buying pressure remains negligible, keeping the probability of a near-term reversal low. Given the current structure, traders may prefer to stay cautious until market conditions stabilize and bulls show clear intent. A sustained move above $3,500 would be required to confirm that ETH is breaking out of bearish influence and regaining upside momentum. Until then, downside risk remains firmly in play.
The live price of the Cardano token is $ 0.28352647.
Price prediction suggests potential to reach $2.75 to $3.25 by year-end 2026.
Long-term forecasts indicate ADA could hit $10.25 by 2030.
The Cardano price prediction 2026 is generating significant buzz in the crypto market, as the last quarter is soon to close in few days, boosting interest for the next altcoin. The 2025 for ADA/USD began with numerous fundamental updates strengthening its future, including the transformative Plomin Hard Fork, but 2026 seems even more constructive.
Now, Questions abound: “Will Cardano spearhead the altcoin movement?” and “What heights can ADA reach by 2050?” Explore this Cardano price prediction 2026 and beyond, filled with expert insights and ambitious forecasts.
Coinpedia’s Cardano Price Prediction
The Cardano price outlook for 2026 is promising, driven by its extraordinary 4,000% surge in 2020 and currently holding strong at a significant support level. With a positive shift in market sentiment, even a moderate increase could lead to a remarkable 1,000% rise, positioning Cardano around $4.50.
A more conservative target of $1.40 indicates a solid 300% gain based on existing trends. Analysts are broadly optimistic that upcoming ETF approvals will boost institutional adoption and market stability, with price projections ranging from $2.05 to $2.80.
The ADA price action is experiencing a significant sell-off, but early February has revealed a crucial demand area where new buying momentum is likely to emerge, paving the way for a bullish rally. Additionally, the lower boundary of the falling wedge is providing solid support, indicating that a price spike is imminent. I predict that ADA could very well reach $0.60 this month.
Cardano AI Price Prediction For February 2026
Source
Low Price
Average Price
High Price
Gemini
$0.85 – $0.95
$1.00 – $1.20
$1.30 – $1.50+
BlackBox
$0.65
$1.00
$1.50
ChatGPT
$0.75
$0.95
$1.25
ADA Price Prediction 2026
The Cardano price forecast for 2026 points to an important support level on its weekly chart, a range that has consistently acted as a strong pivot point for price trends, and is currently giving off signals of another potential rally. This support level is known for displaying remarkable resilience over time, suggesting that if Cardano price USD can maintain its position above this threshold once again, it could pave the way for significant price movements in 2026.
Looking back at Cardano’s historical performance on the weekly chart, it shows an extraordinary rally in 2020, when the asset posted staggering gains of nearly 4,000%. During that bullish phase, the Cardano price USD spent an extended period consolidating around the dynamic support trendline, which appears to be a strategic accumulation at discounts from smart money, contributing significantly to its eventual surge.
If the current market sentiment shifts positively, a resurgence in investor confidence could lead to a recovery. Not ambitiously, even modestly, past performance could give a tremendous surge. Last year’s performance was 4000%. If we assume 1/4 of that momentum, it would result in an increase of approximately 1000%, potentially elevating Cardano’s price to $4.50 by 2026.
Conversely, a more conservative approach suggests a realistic price target of around $1.40, indicating a potential increase of about 300%. This estimate remains feasible, especially since it is based on fundamental analyses and market trends that are not reliant on speculative triggers, such as the possible approval of exchange-traded funds (ETFs).
Additionally, many experts propose that these ETFs could significantly impact the market by boosting institutional investment and improving market stability. In a situation where ETF approvals occur and retail investor excitement rises, Cardano’s price could realistically range from $2.05 to $2.80.
Scenario
Potential Low
Average Price
Potential High
Without ETF Approval
$0.85
$1.10
$1.25
With ETF Approval + Retail Surge
$1.20
$1.65
$2.05
Bullish Breakout (with ETF & macro support)
$1.50
$2.05
$2.80
Cardano On-chain Analysis
As per Cardano’s on-chain metrics, “Smart Money” accumulation phase is the best observation right now, because the divergence between retail and institutional holders is more vivid than ever.
As the number of addresses holding between 10 and 1 million ADA is declining, and the consistent surge in the 10 million to 100 million coin bracket confirms this, this represents a major supply consolidation. The observation shows that these mega-whales are strategically absorbing the “weak hands” during price dips, effectively building a rock-solid fundamental floor for the asset. Also, the fact that the 1M to 10M coin bracket is also growing confirms that professional high-net-worth investors seem to be positioning for a recovery, too.
Similarly, the surge to 4.57 million total holders despite a grueling 2025 proves that Cardano’s ecosystem is expanding its reach even in a “stress test” environment. This growth in the holder base suggests that the asset is not being abandoned; rather, it is being redistributed into a more stable, long-term foundation. When a holder count rises as prices fall, it signals that the market views current levels as a deep-value opportunity rather than a reason to exit.
Additionally, the Weighted Sentiment flipping the 0 line to 0.656 is a crucial momentum trigger. Professionally, this “0-line flip” indicates that the aggregate social and market bias has shifted from fear to optimism.
Combined with the strategic whale accumulation, this sentiment pivot suggests that the “disbelief” phase is ending and that a bullish rally is likely once the remaining retail sell pressure is fully absorbed by the growing whale cohorts.
Cardano (ADA) Price Prediction 2026 – 2030
Price Prediction
Potential Low ($)
Average Price ($)
Potential High ($)
2026
2.75
3.00
3.25
2027
4.50
4.75
5.00
2028
5.25
5.50
5.75
2029
6.75
7.25
7.75
2030
9.00
9.75
10.25
This table, based on historical movements, shows ADA prices to reach $10.25 by 2030 based on compounding market cap each year. This table provides a framework for understanding the potential Cardano price movements. Yet, the actual price will depend on a combination of market dynamics, investor behavior, and external factors influencing the cryptocurrency landscape.
Need to know what happened in crypto today? Here is the latest news on daily trends and events impacting Bitcoin price, blockchain, DeFi, NFTs, Web3 and crypto regulation.


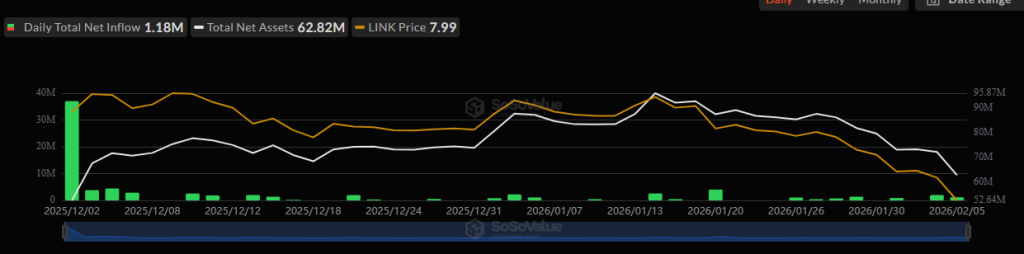
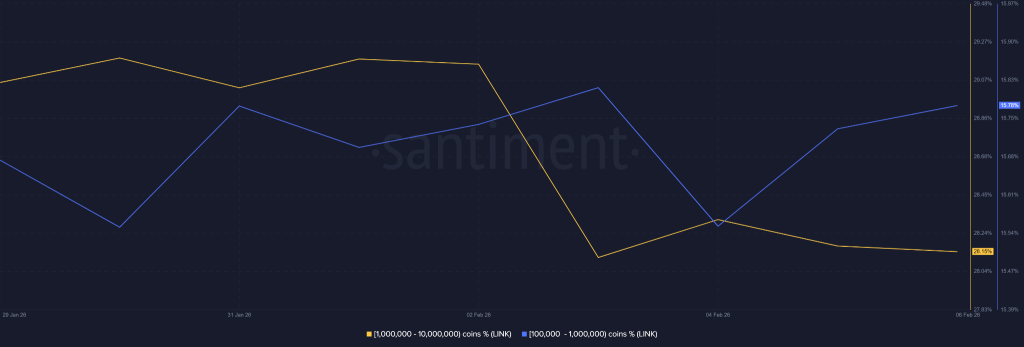


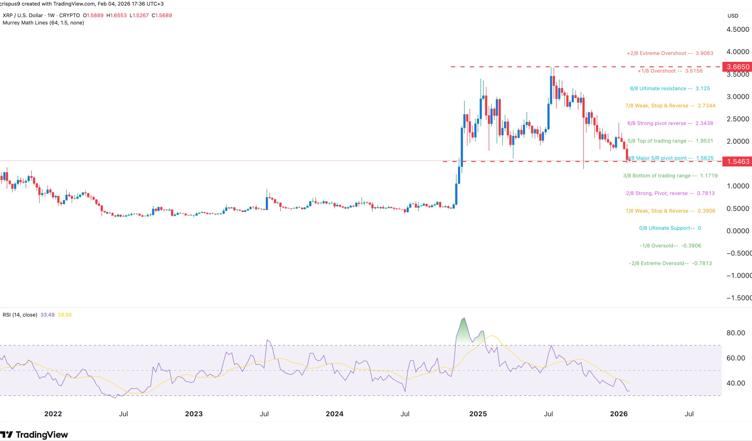
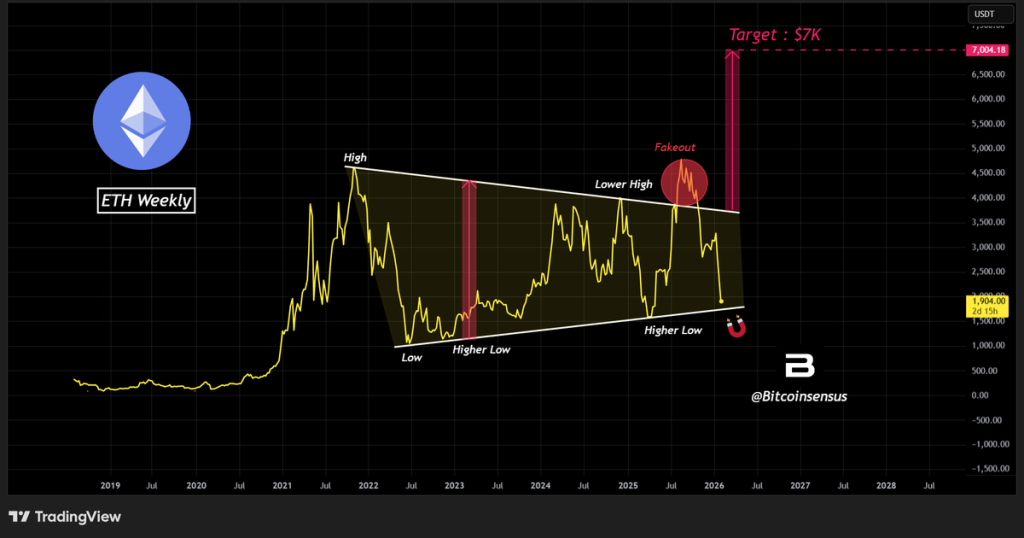
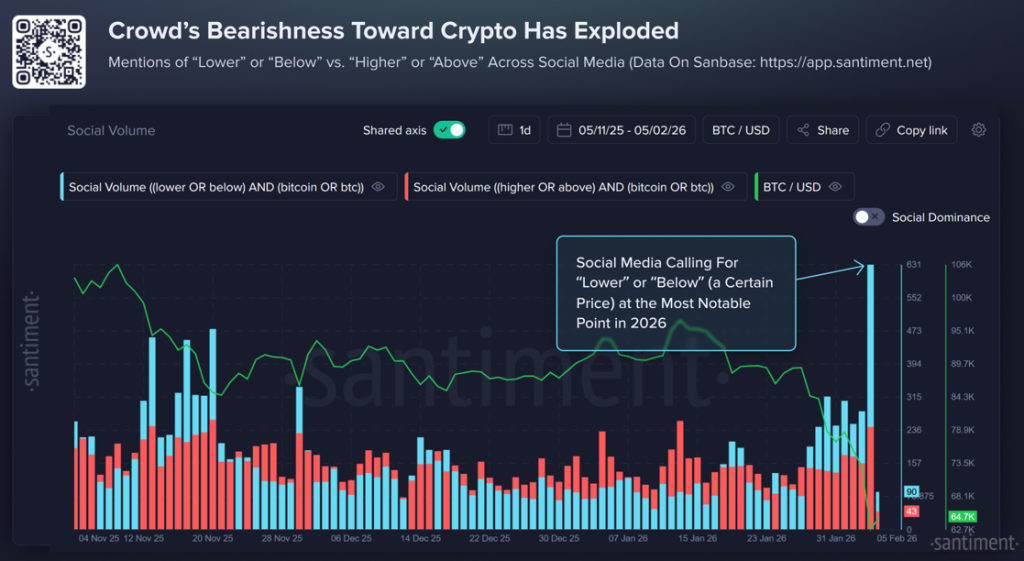
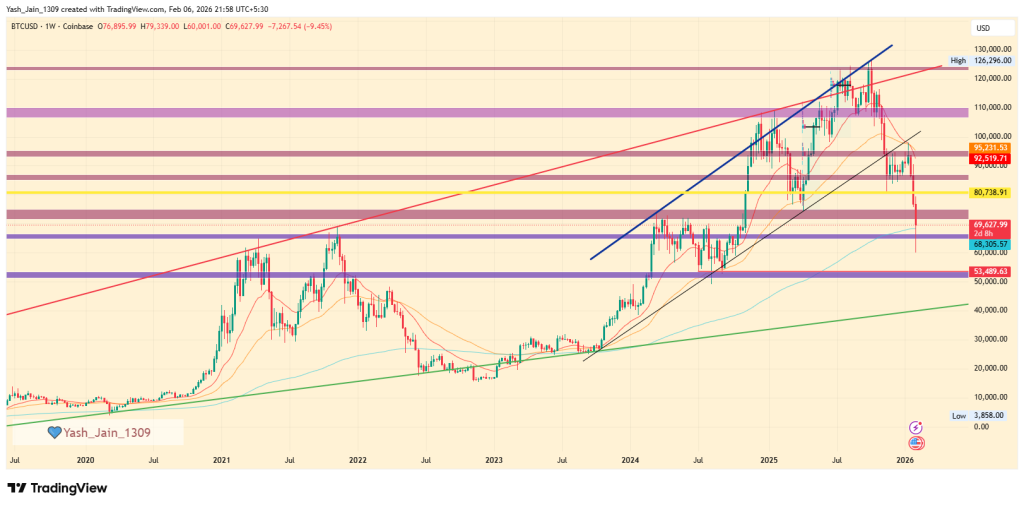
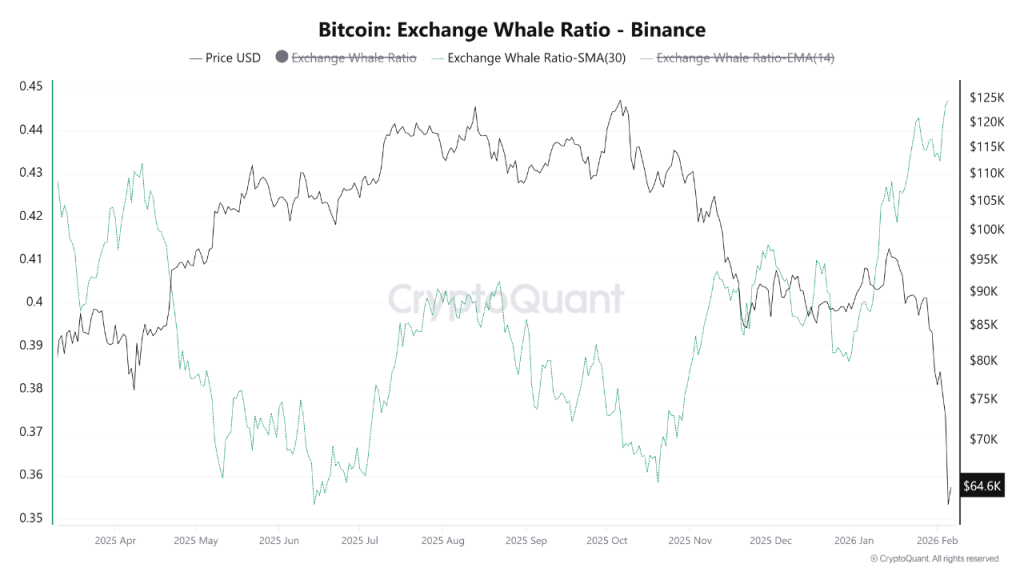


 What's been behind the Bitcoin crash that has seen prices fall to as low as $60,001 for the first time since October, 2024?
 Whale and shark wallets holding 10-10K Bitcoin now hold a 9-month low 68.04% of the entire
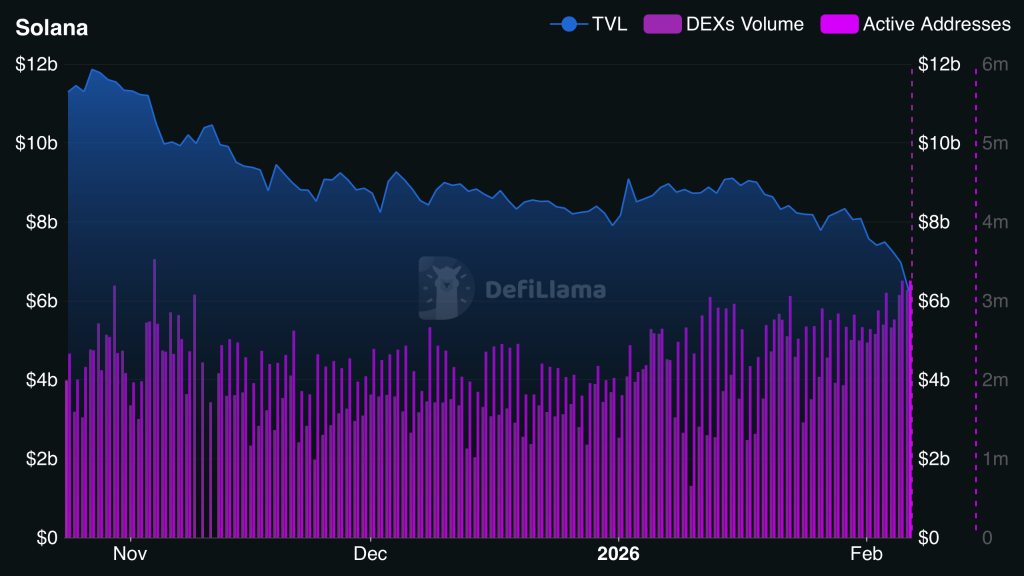
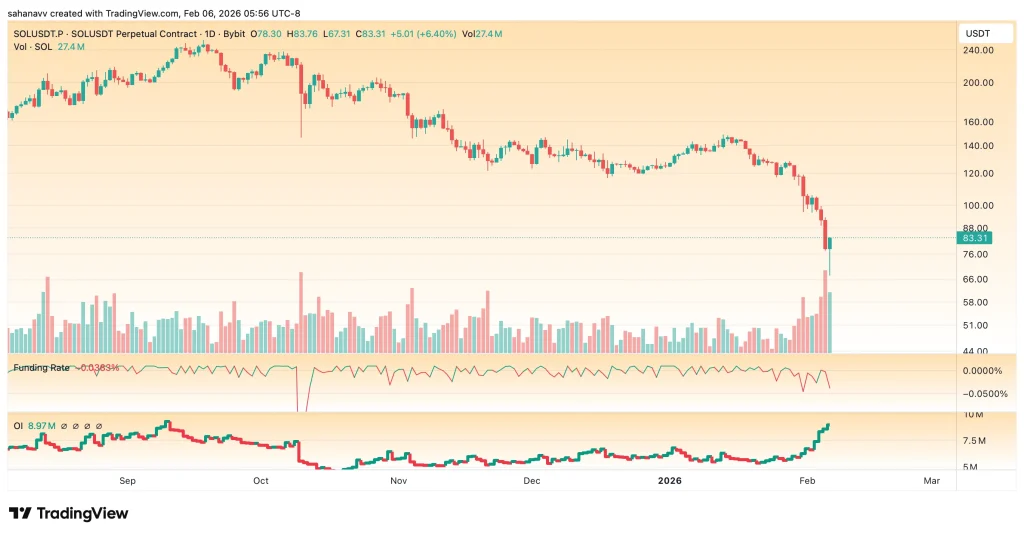


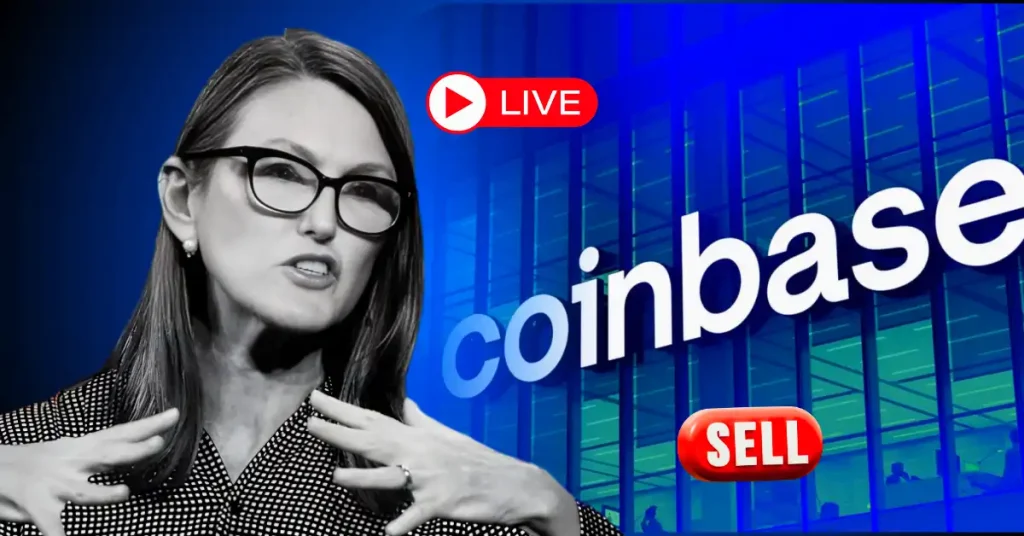

 Crypto Update: Cathie Wood’s ARK dumps $17M in Coinbase stock as shares fall 37% YTD
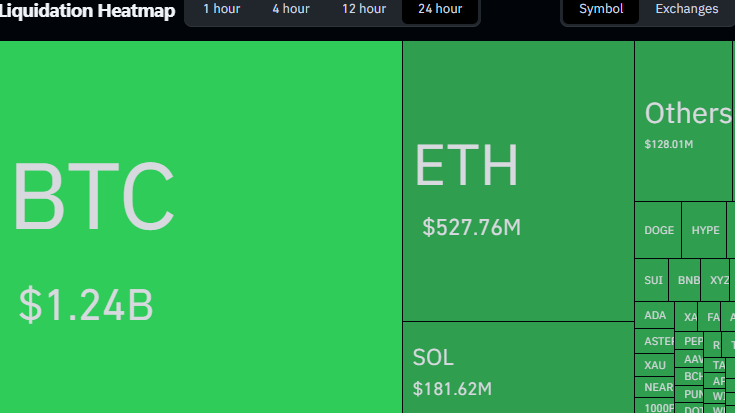
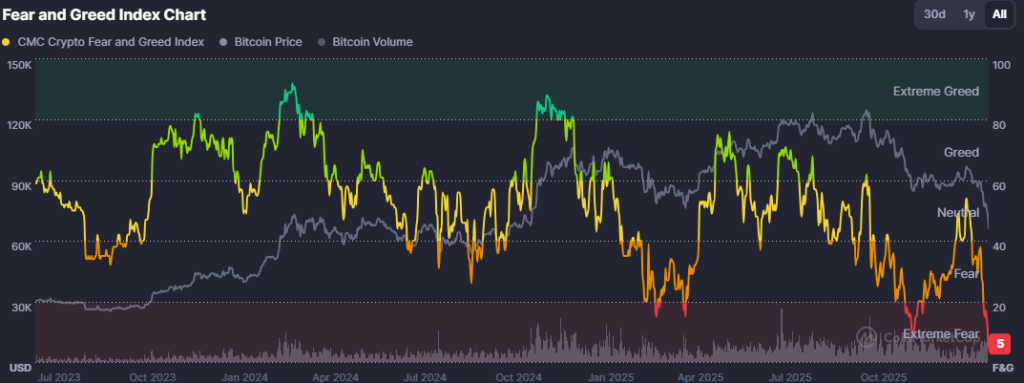
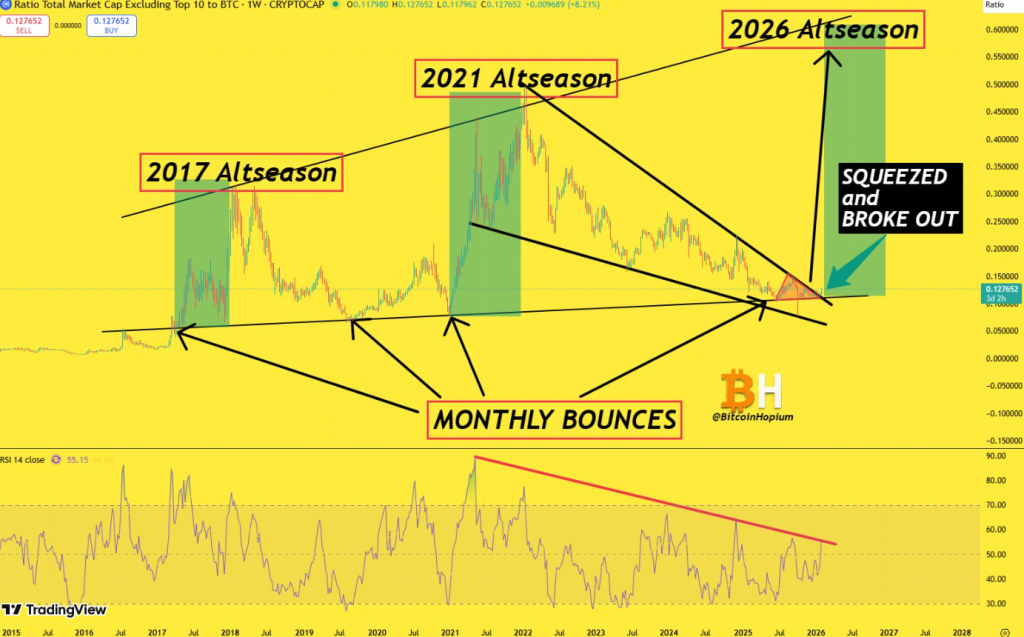
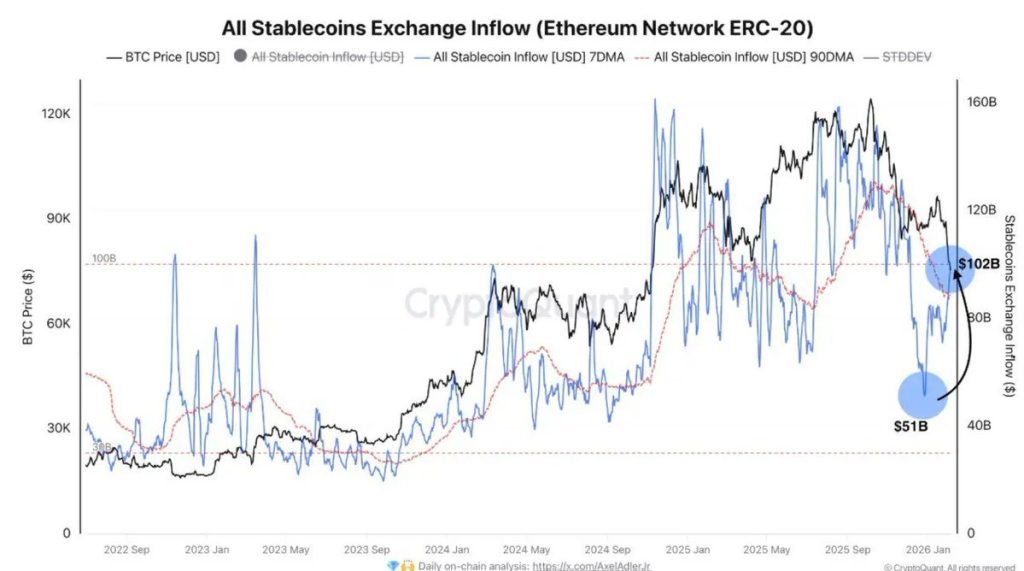
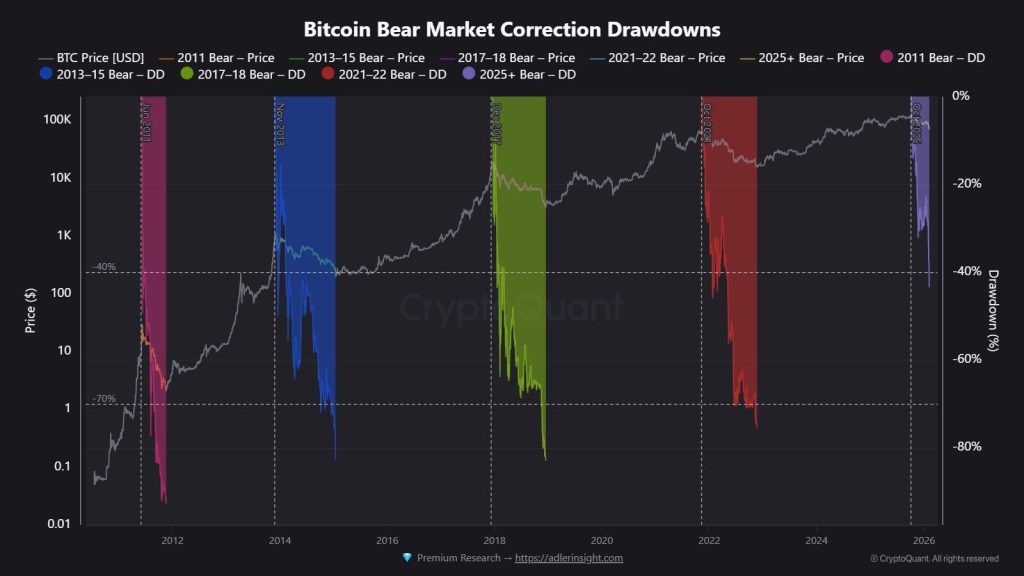


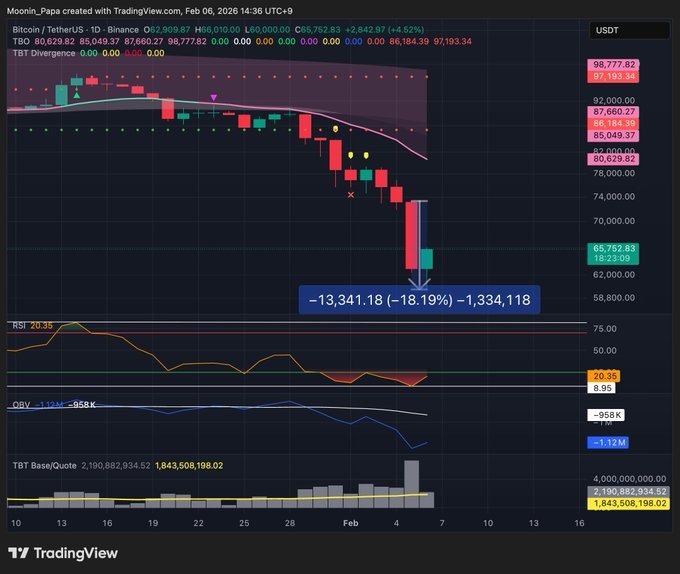
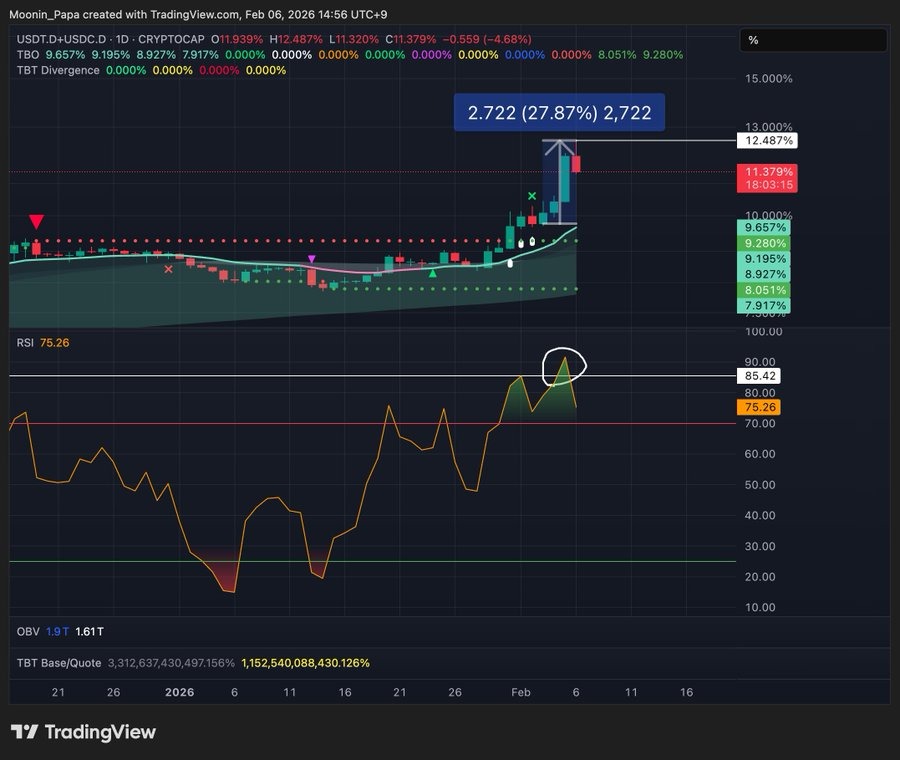


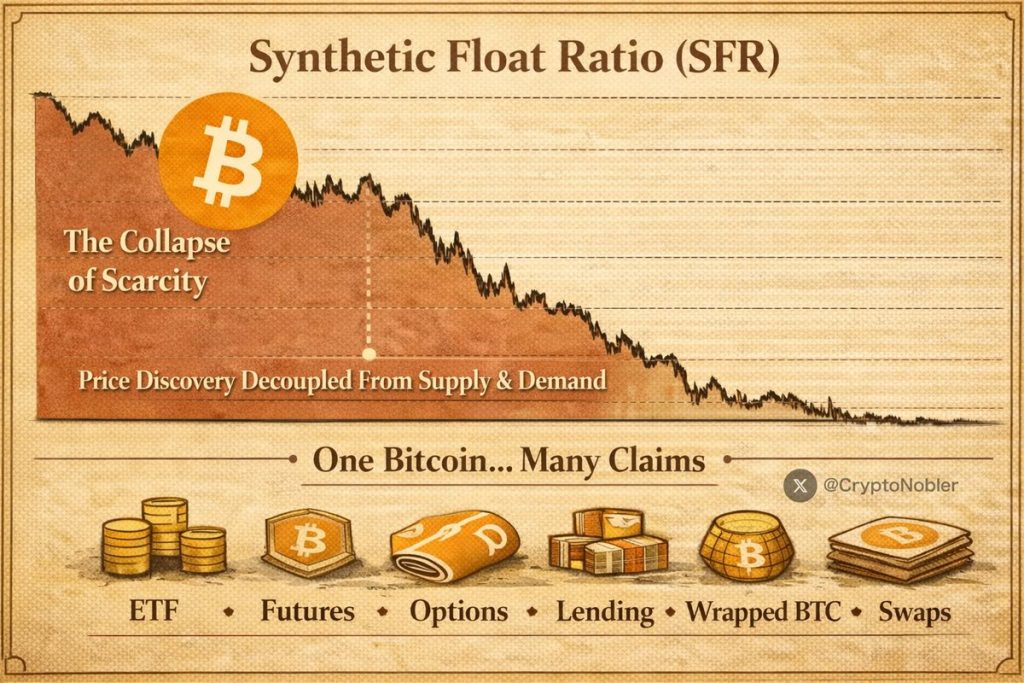
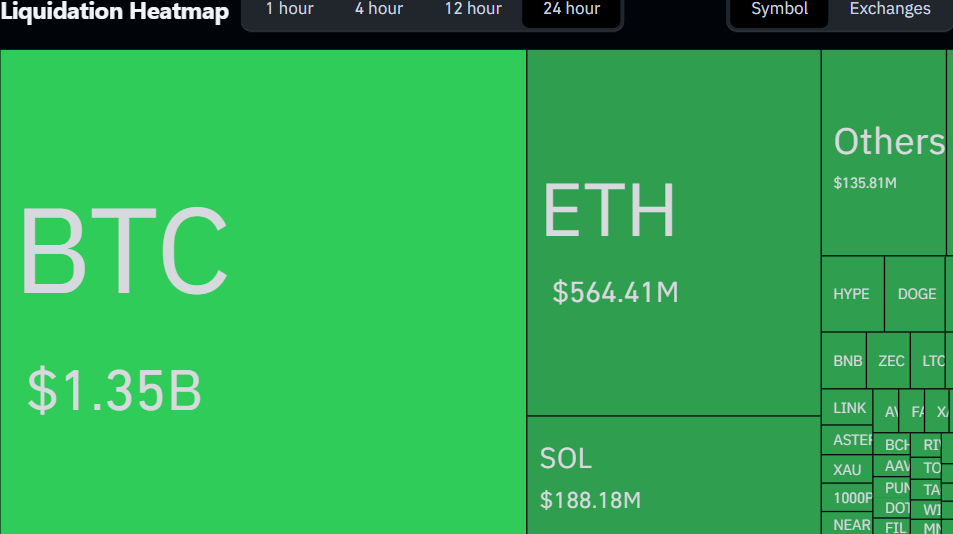
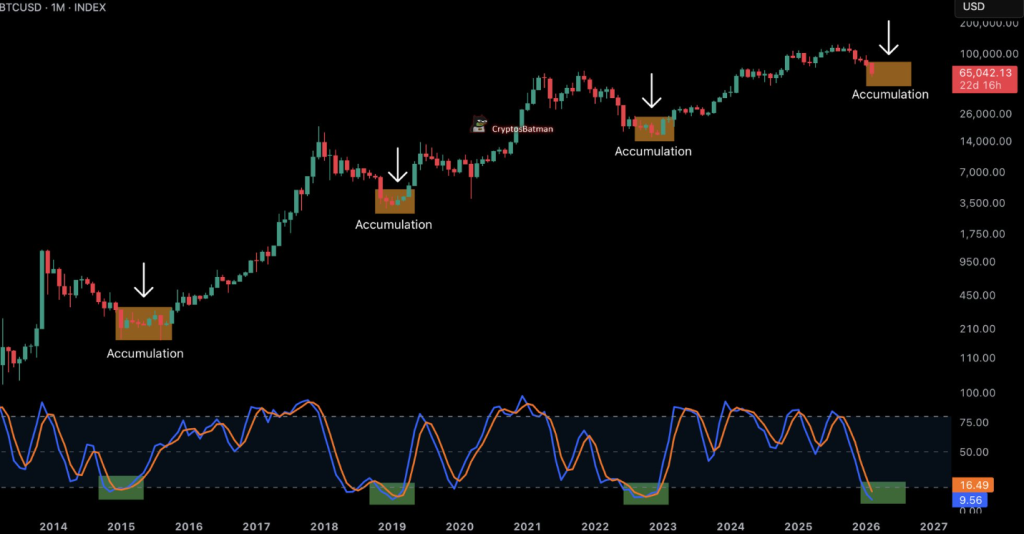
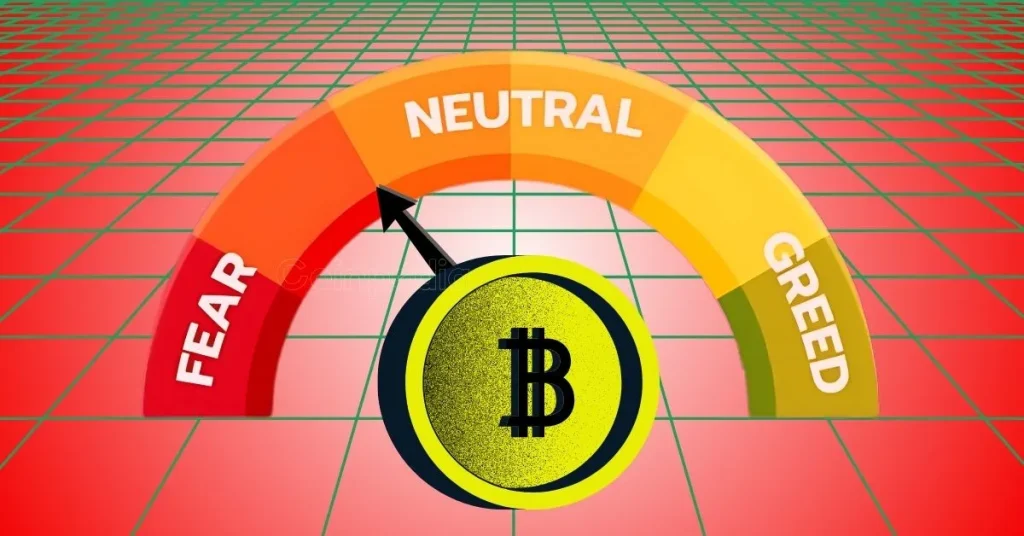
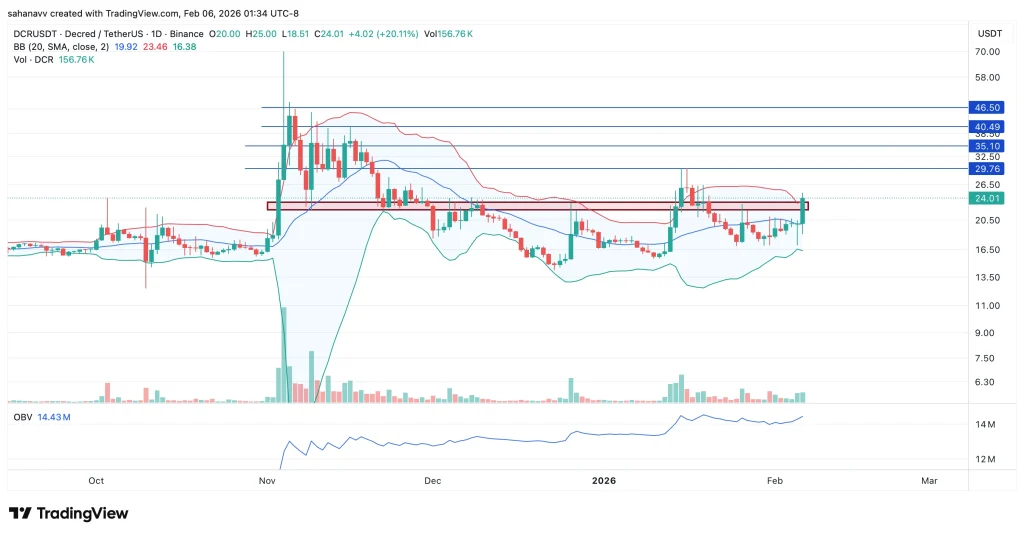

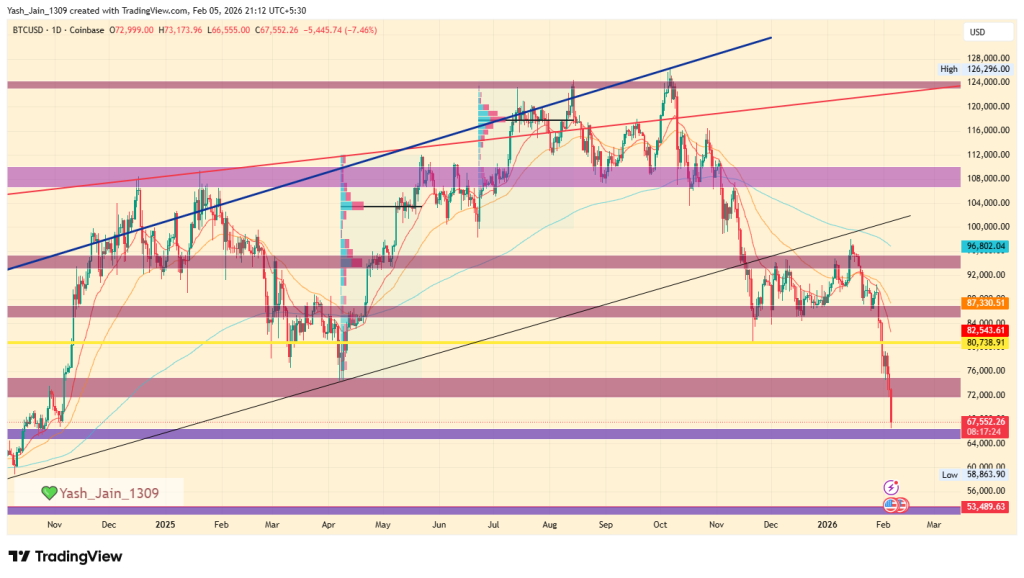
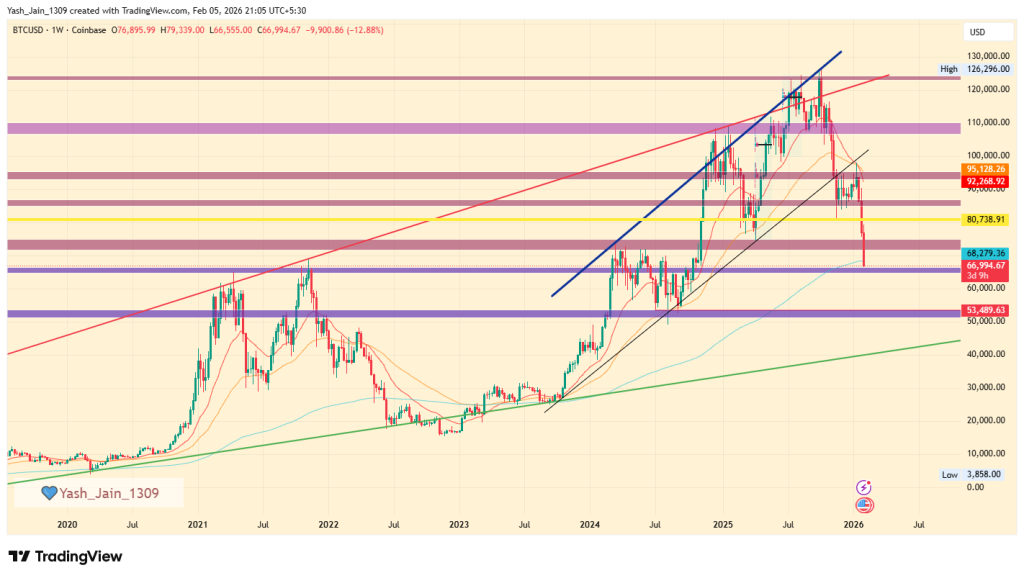


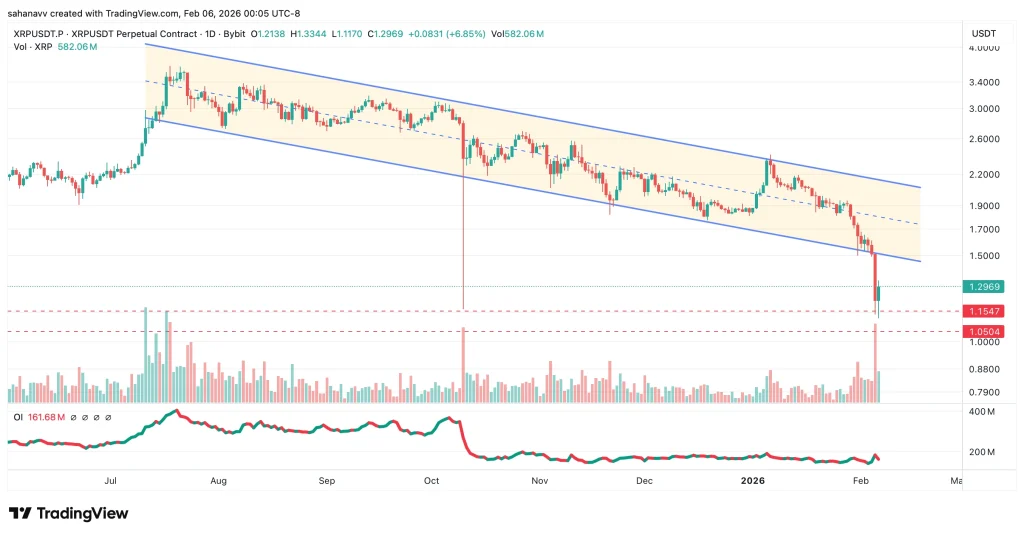


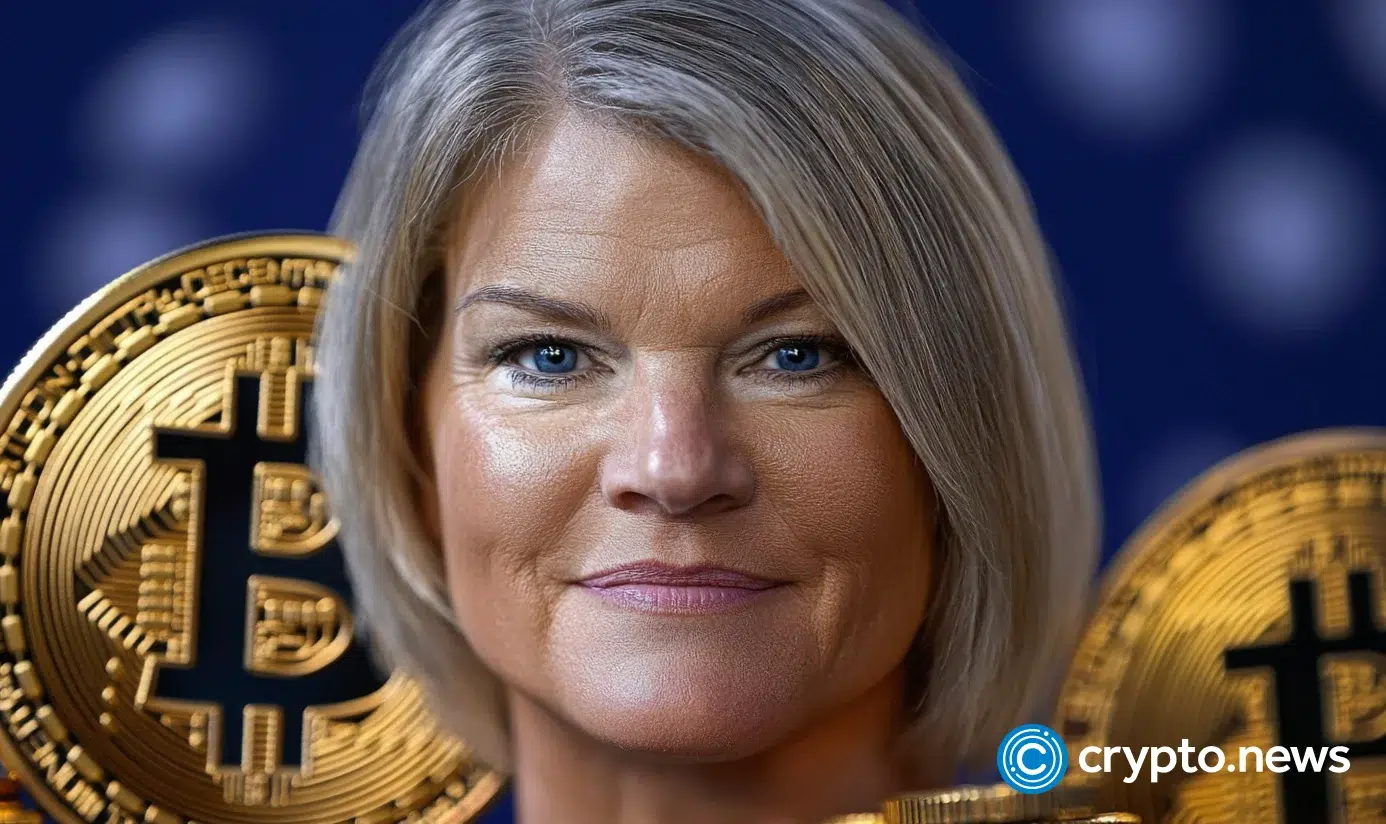


 Sentiment has turned extremely bearish toward Bitcoin and Ethereum following crypto's major downswing this past week. XRP is seeing a more optimistic outlook among traders.
 As we know, markets move opposite to the fear & greed of retail traders. There remains a strong…
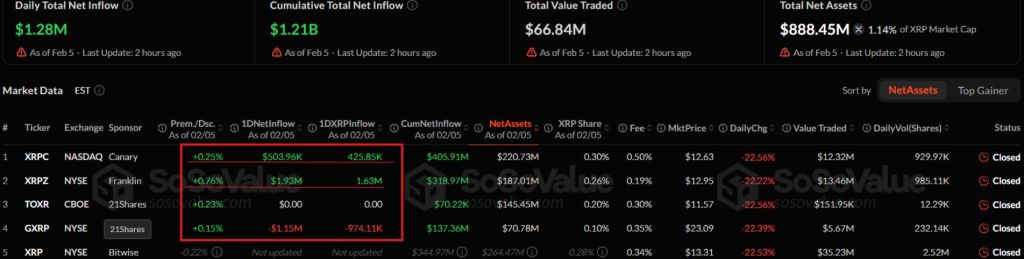
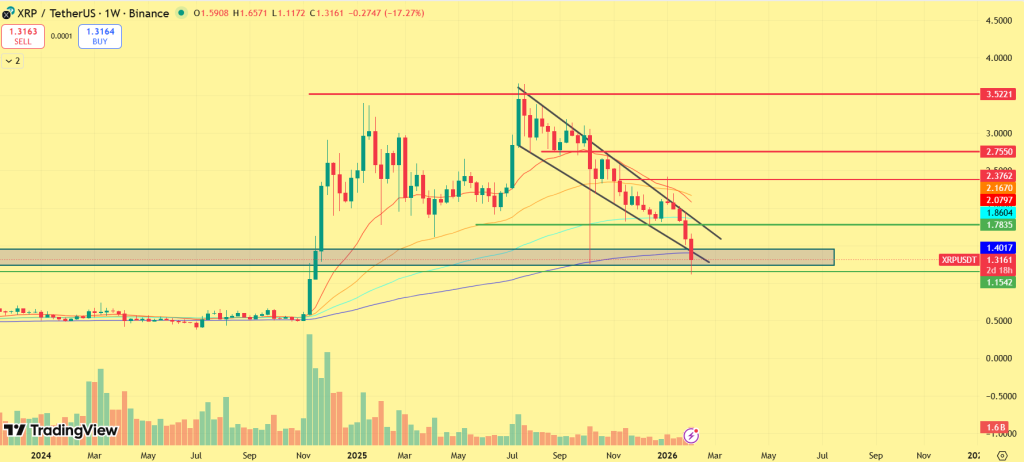
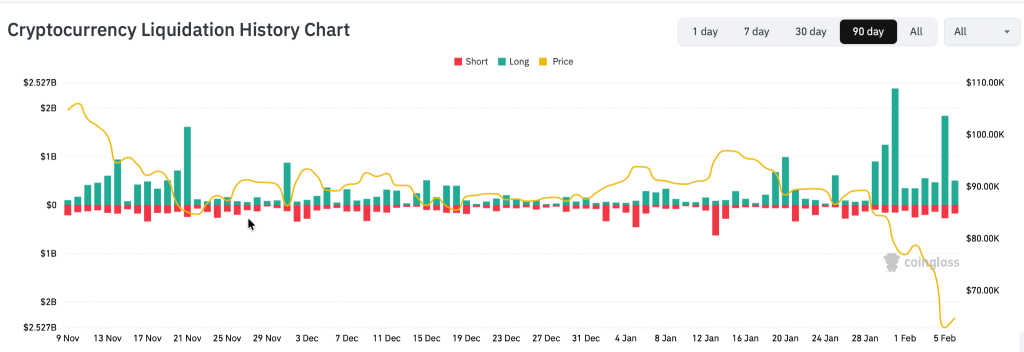
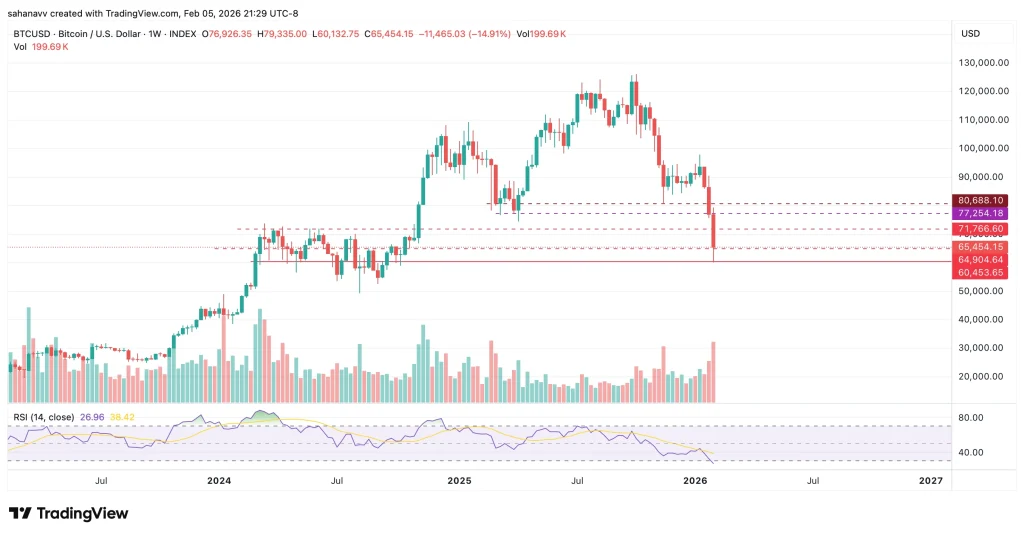

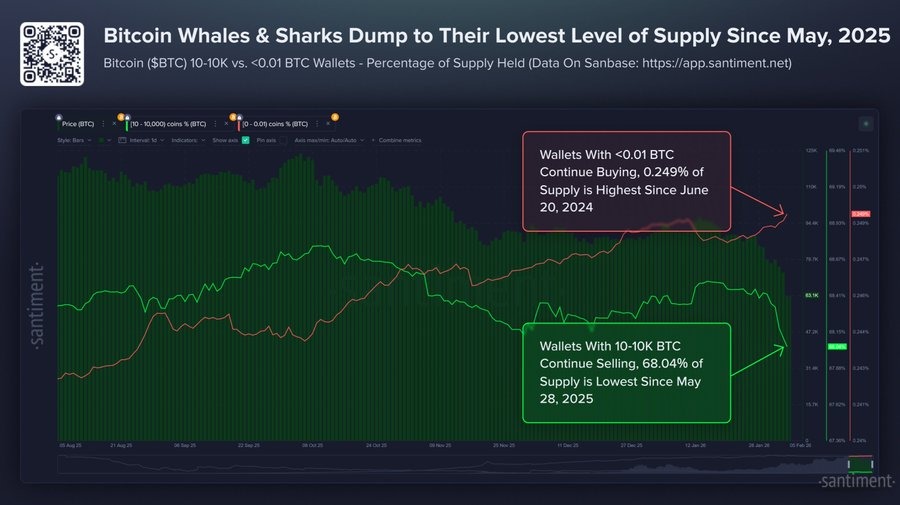


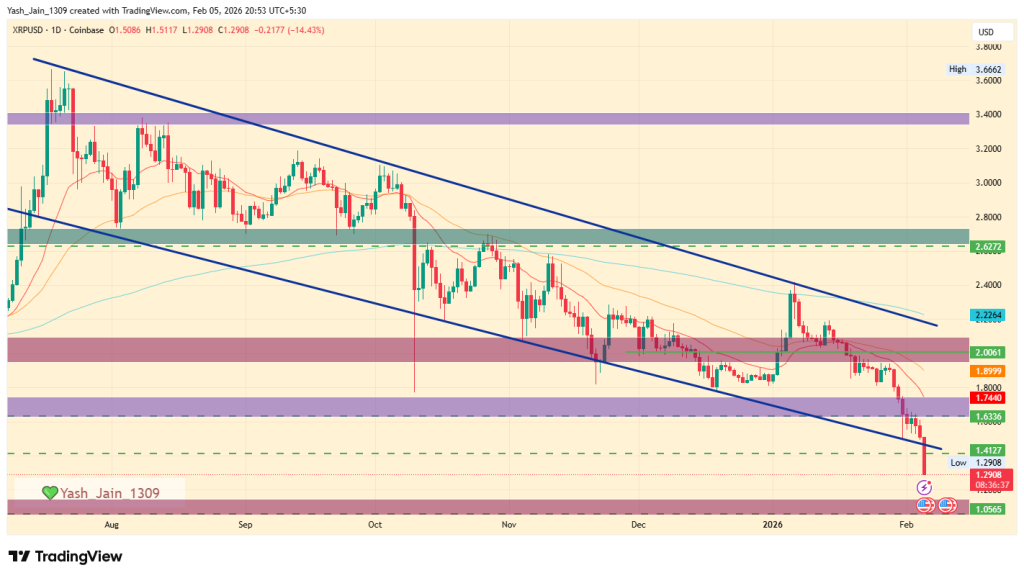
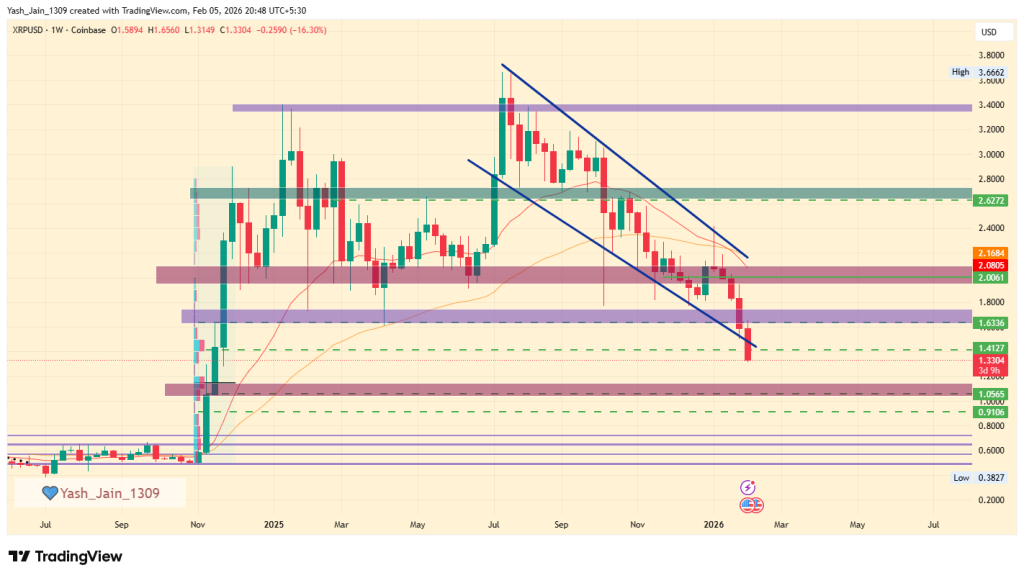
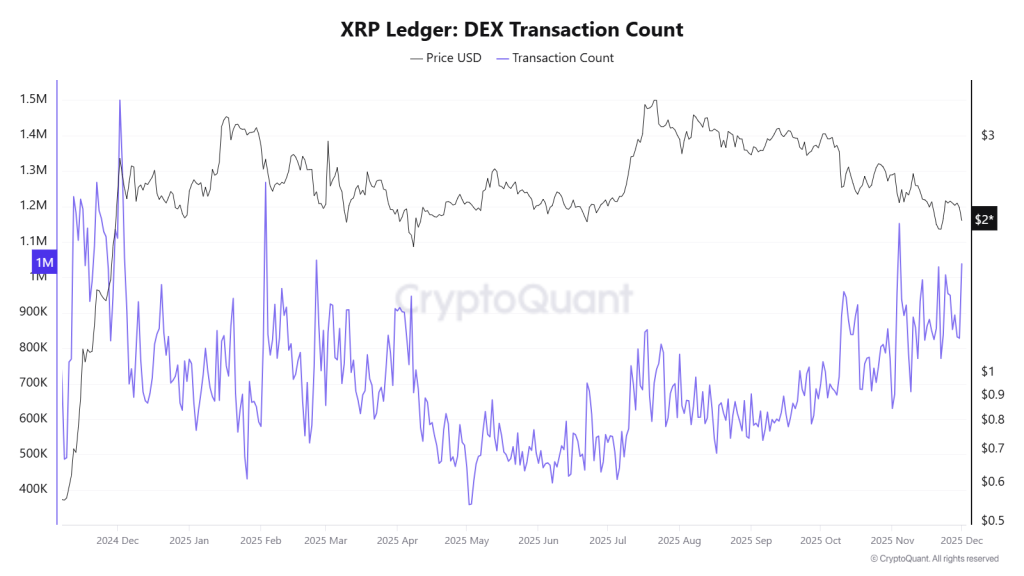
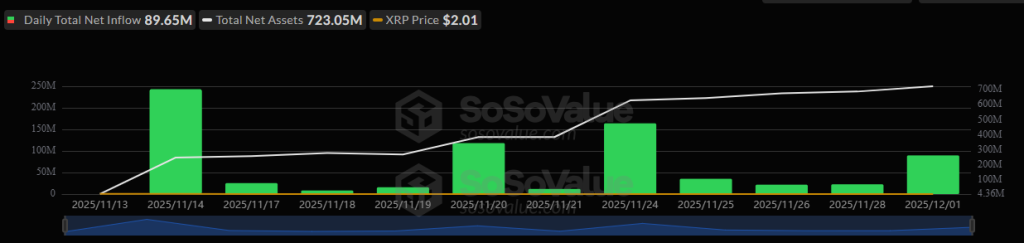
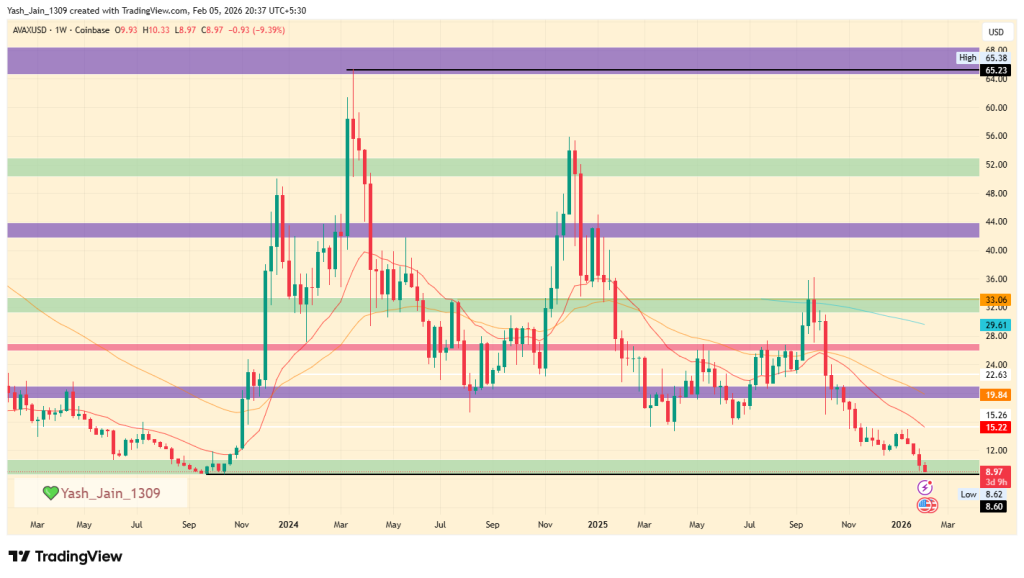
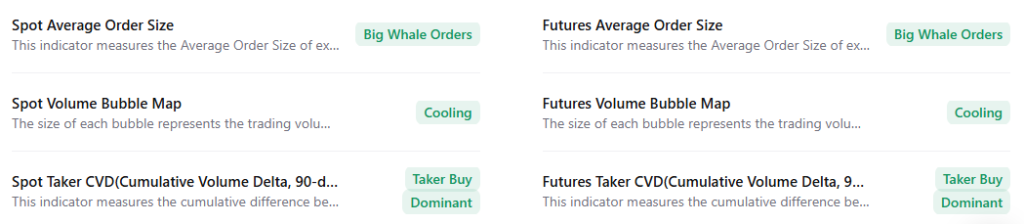


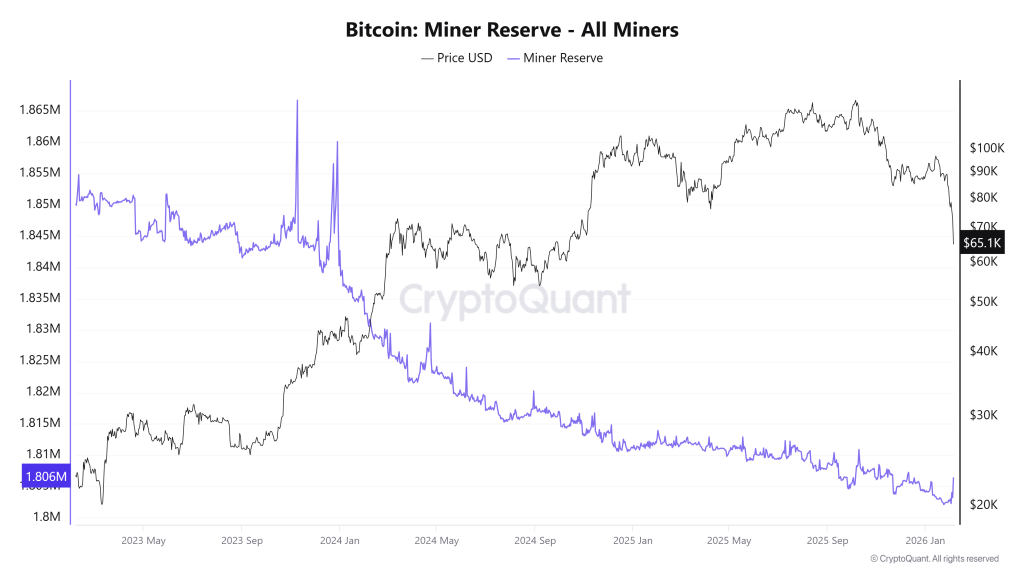
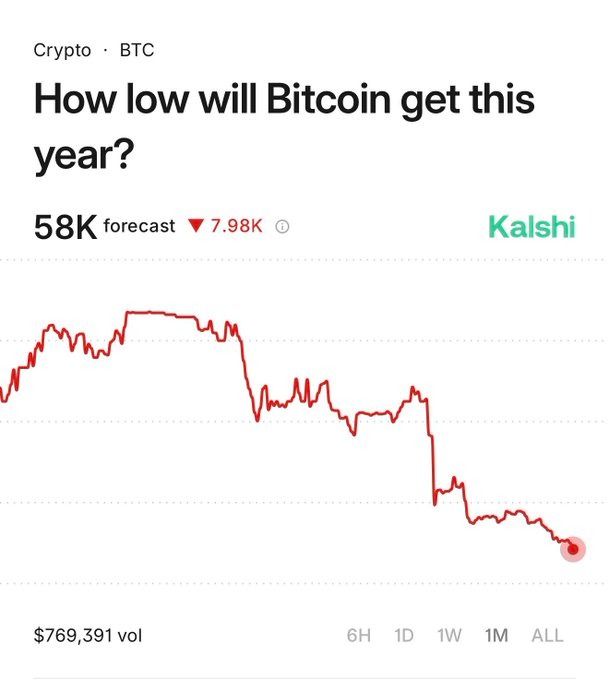


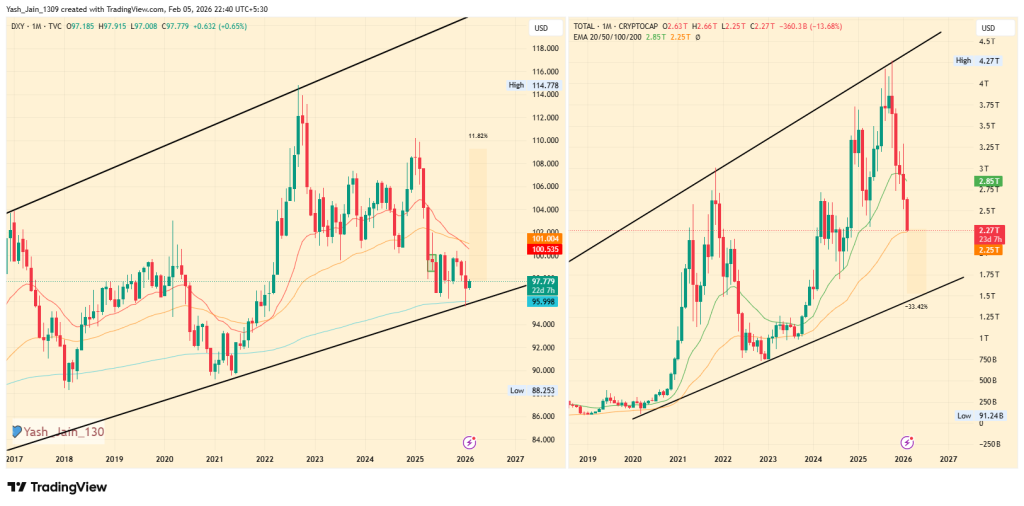
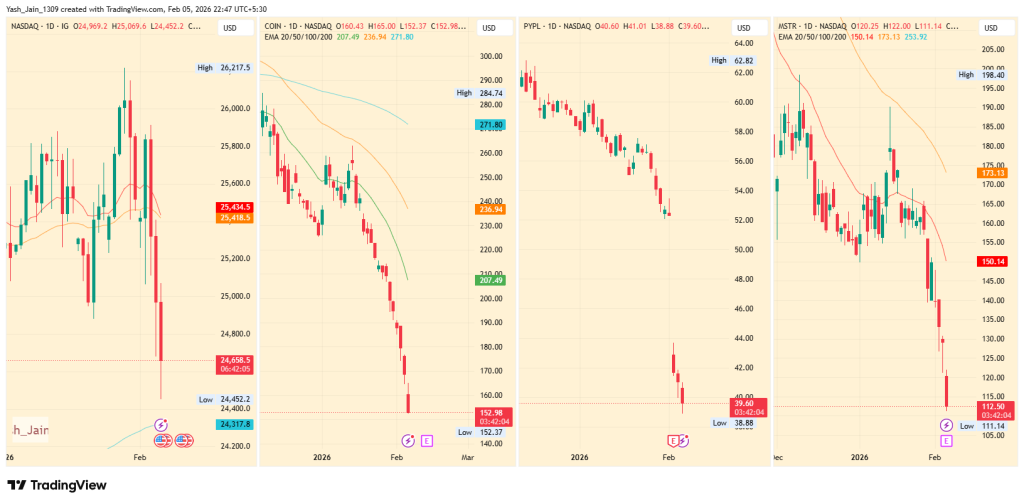
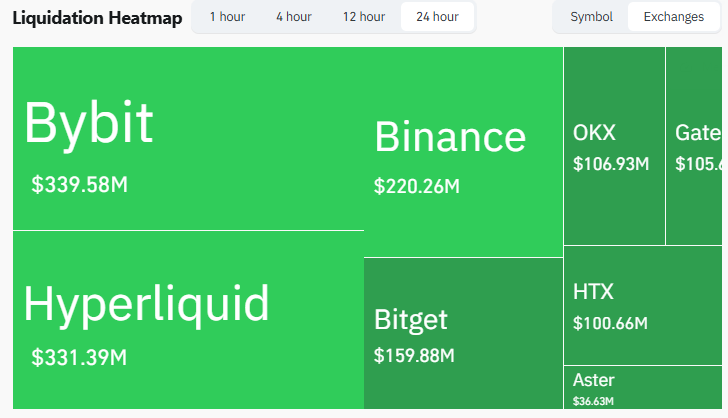
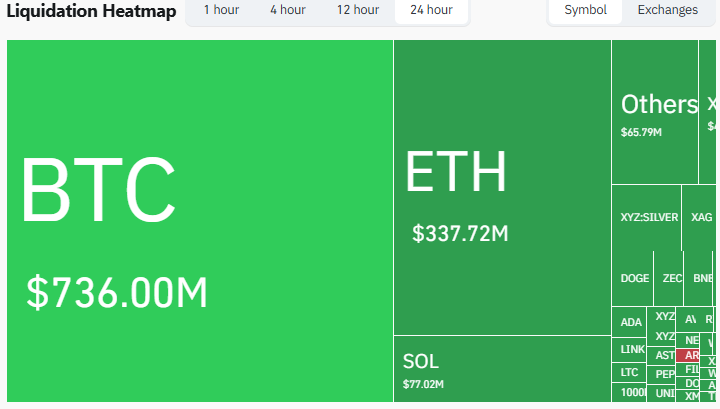
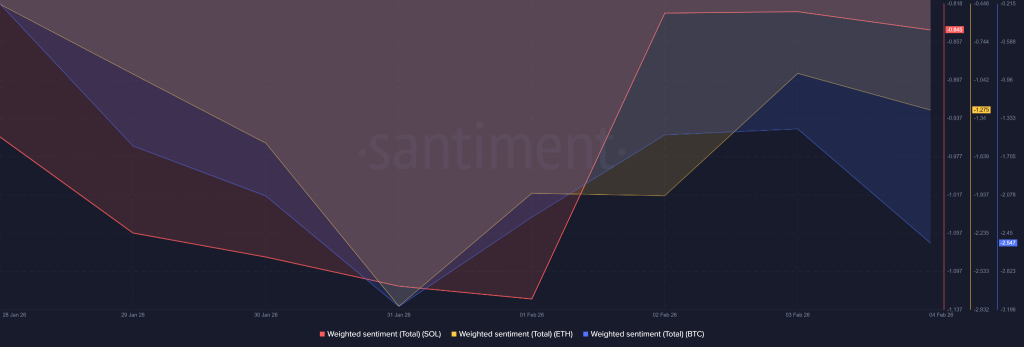

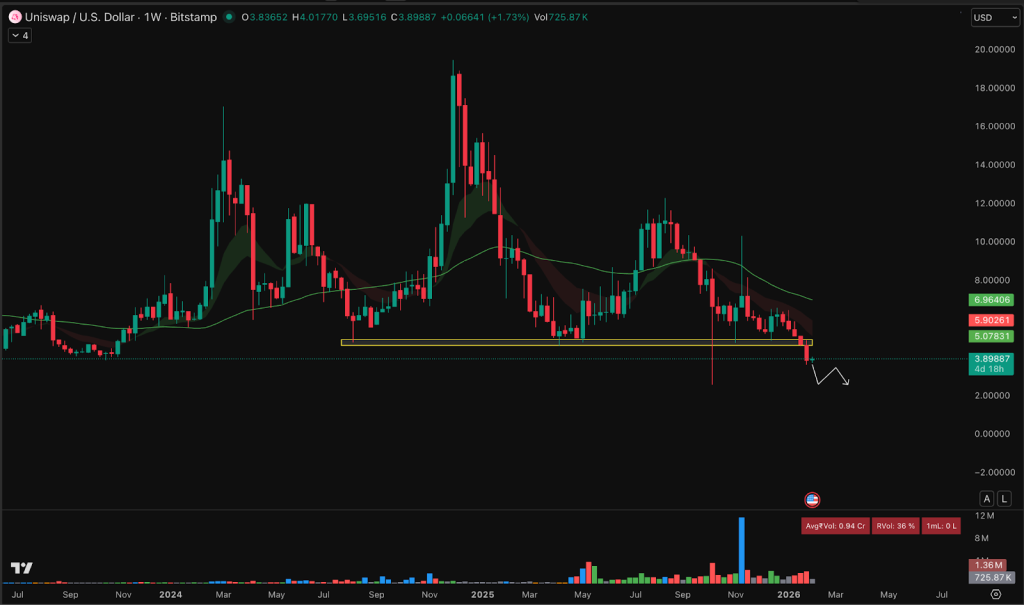


![[Live] Crypto Market News Today: Latest Updates on December 9, 2025](https://image.coinpedia.org/wp-content/uploads/2025/12/09165111/Live-Crypto-Market-News-Today-Latest-Updates-on-December-9-2025-1024x536.webp)


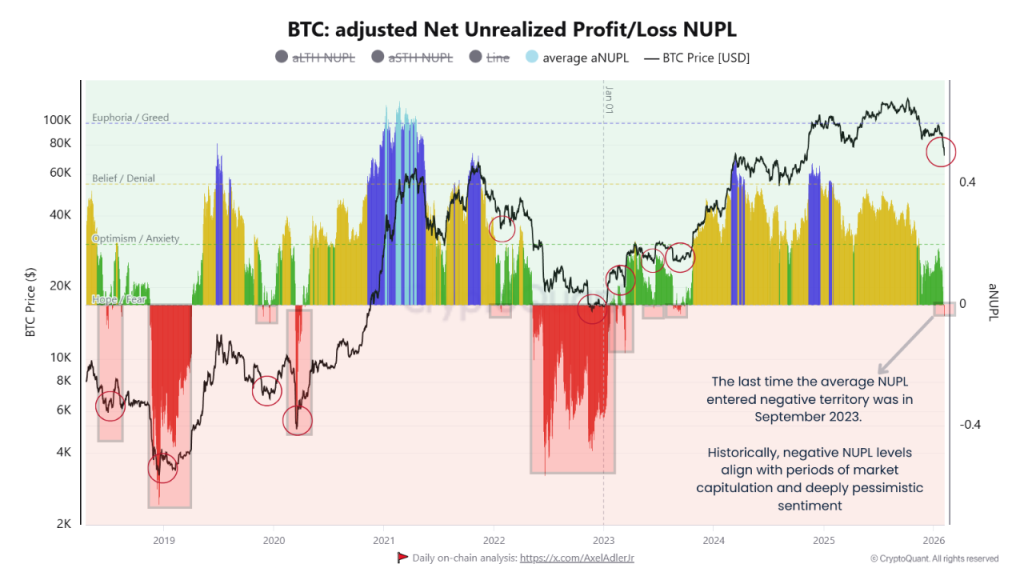
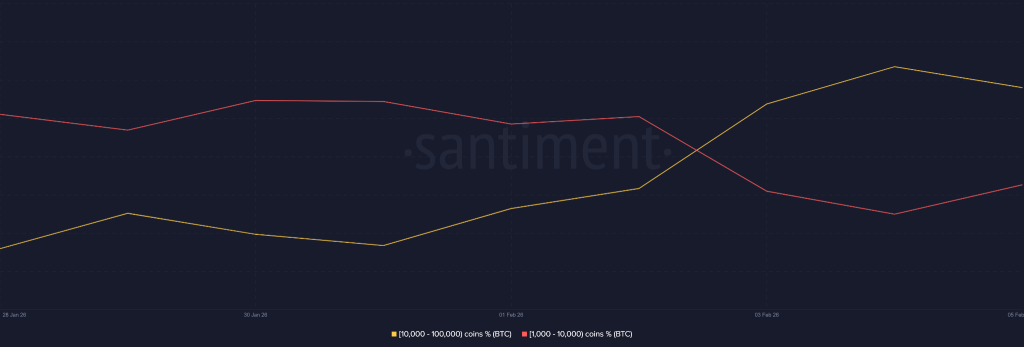
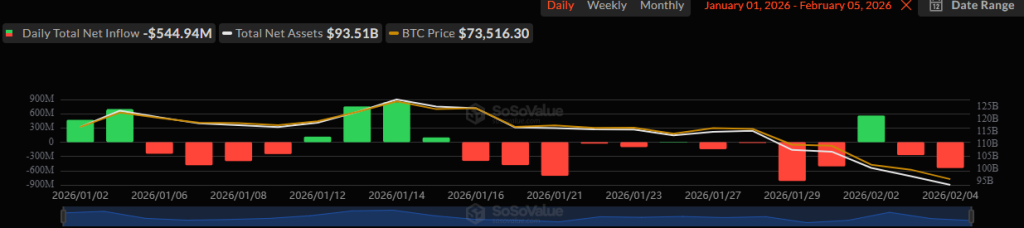
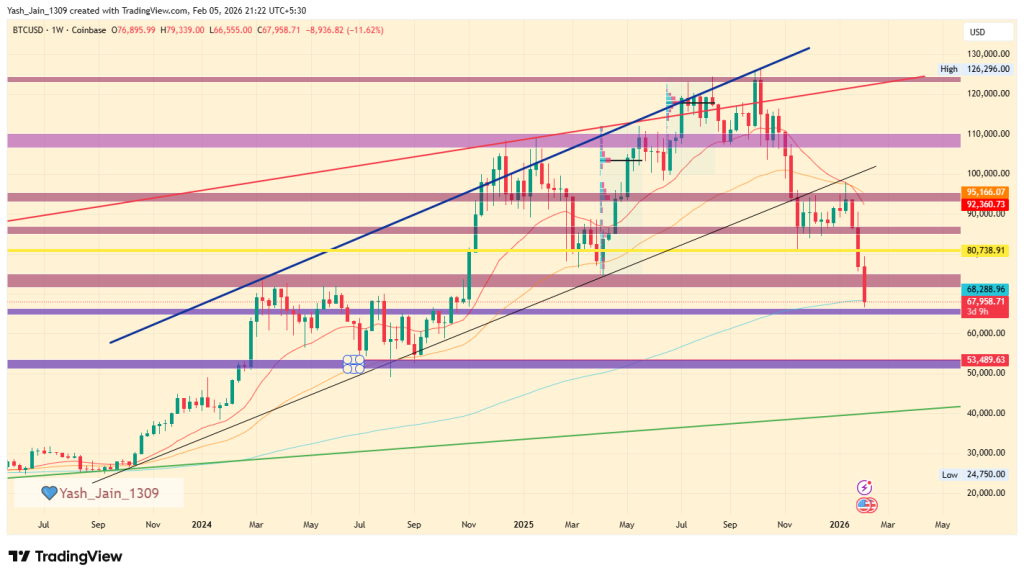


 BREAKING: Bitcoin just dropped below its 2021 all time high of $69,000
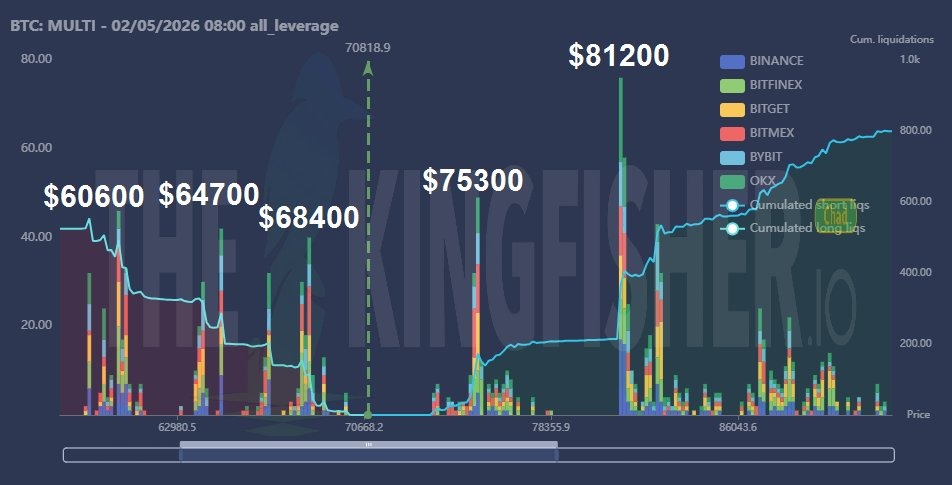
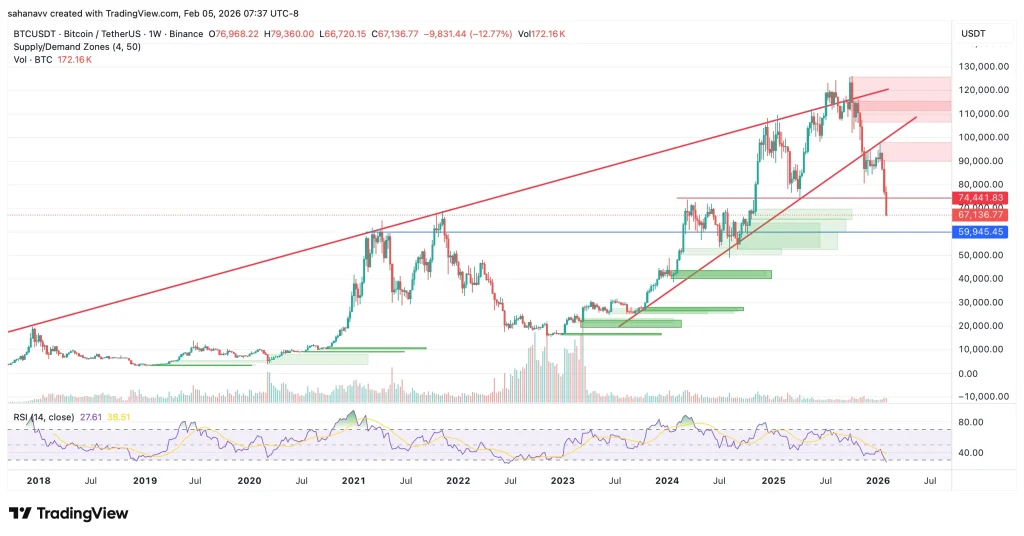


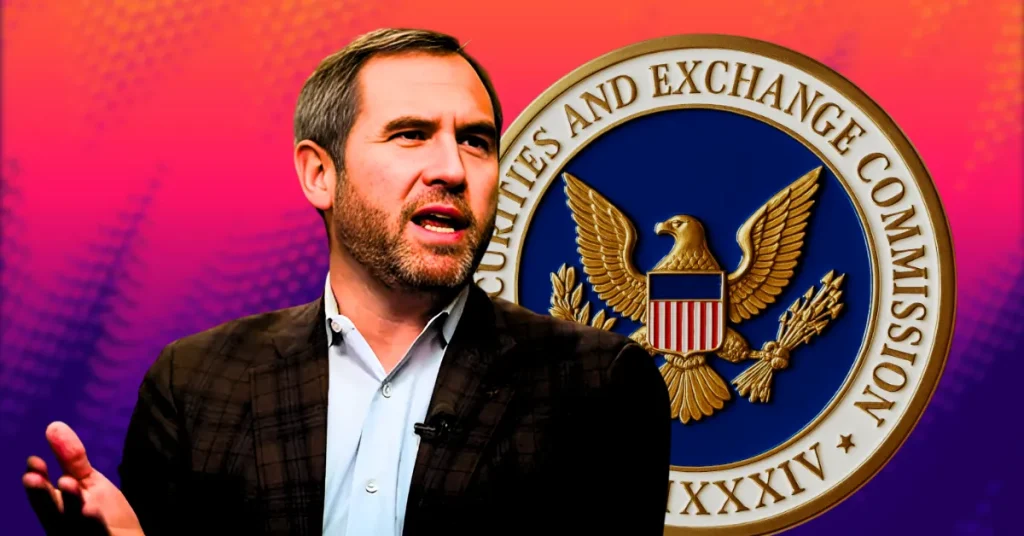


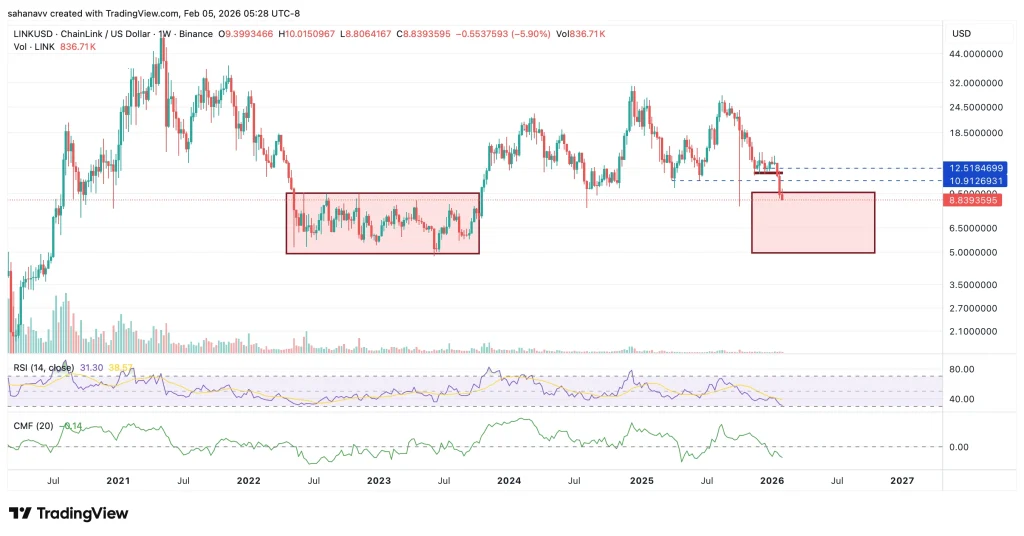


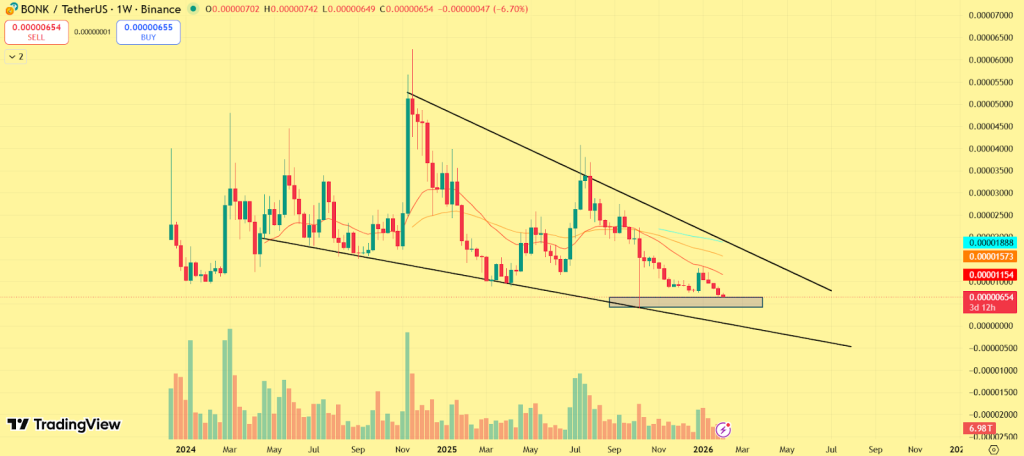

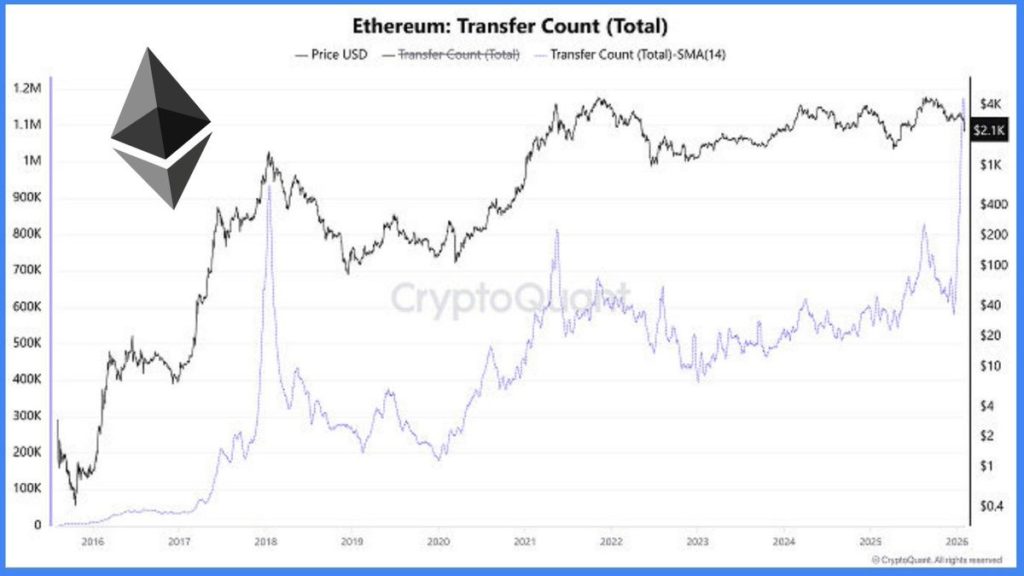
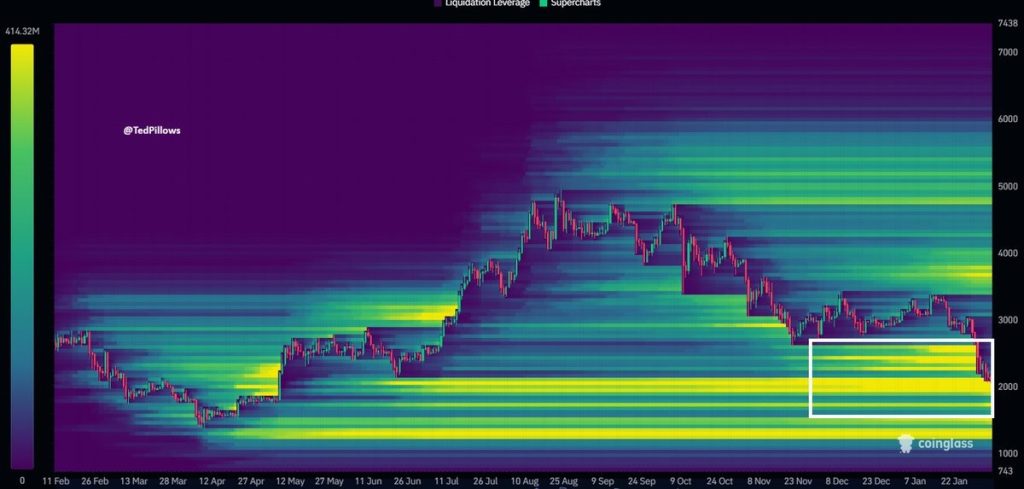


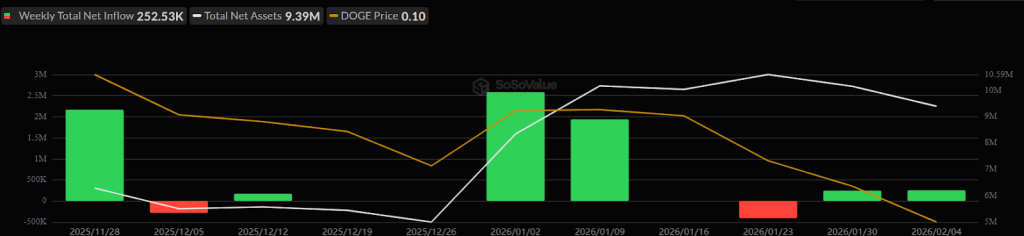
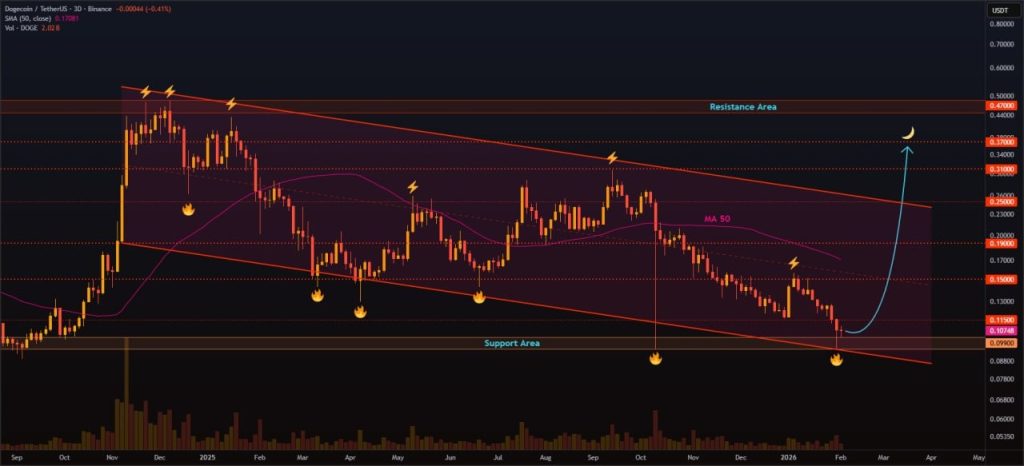
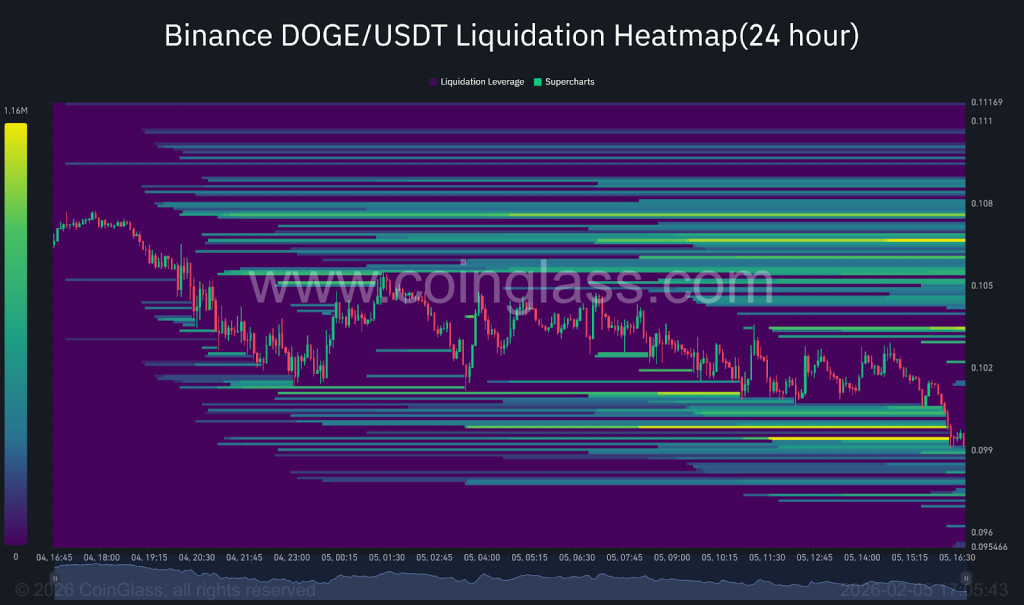
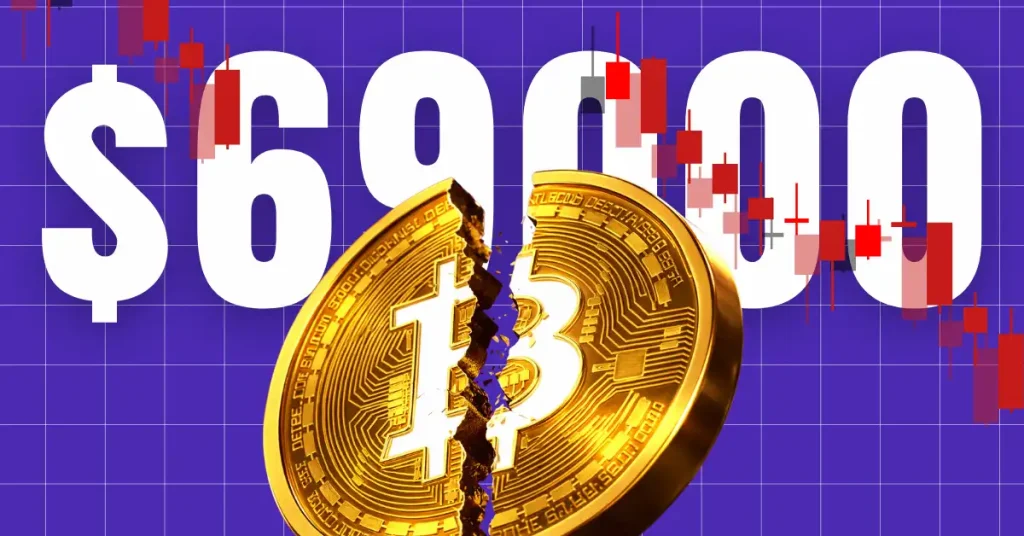
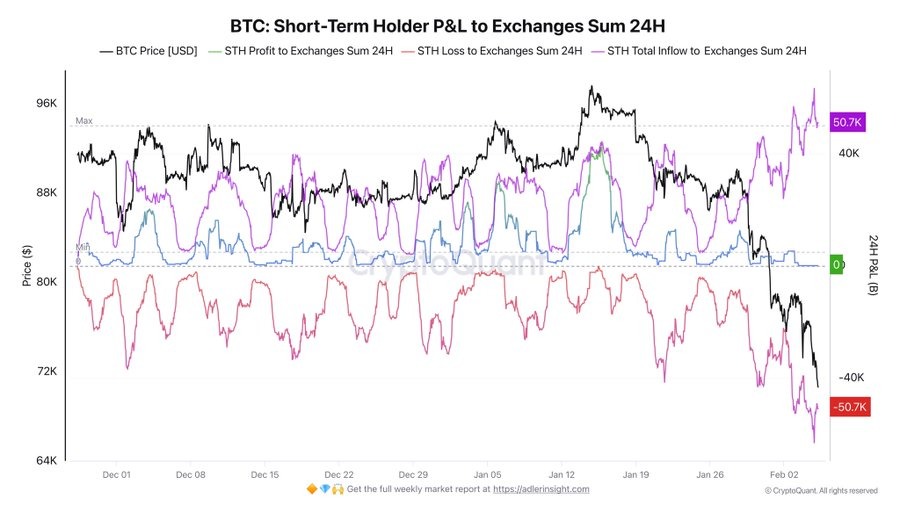
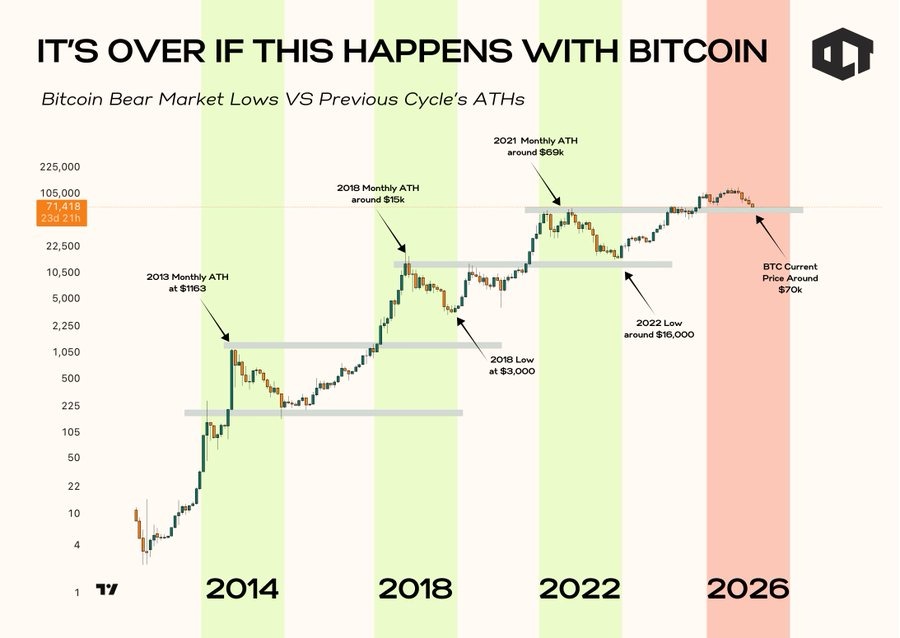


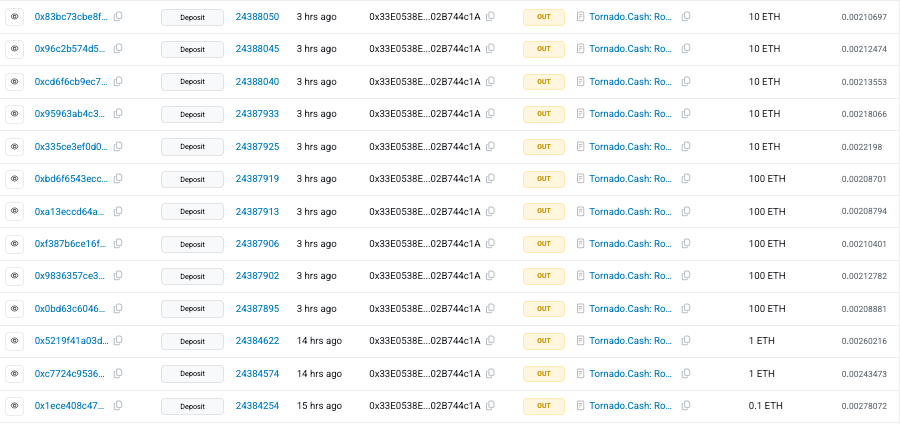

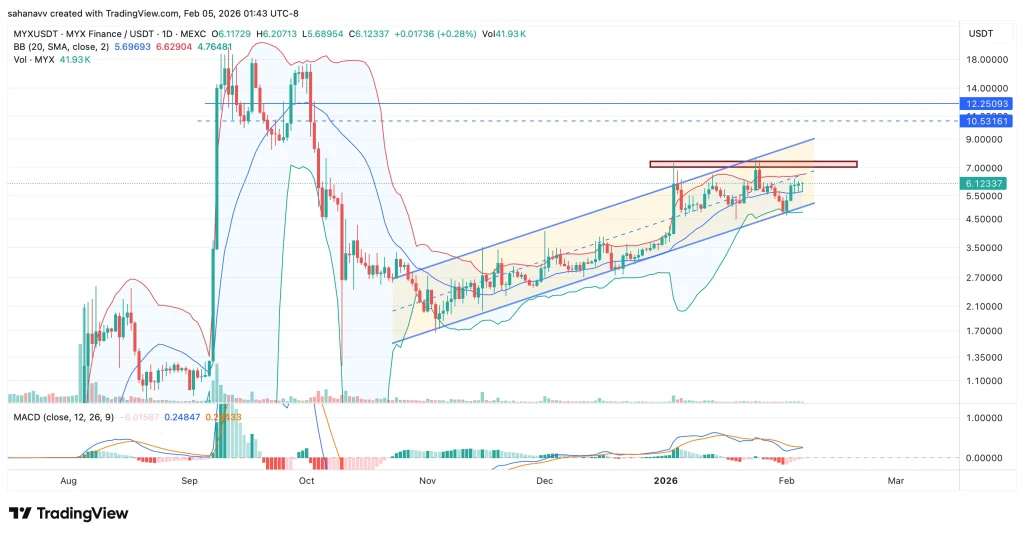
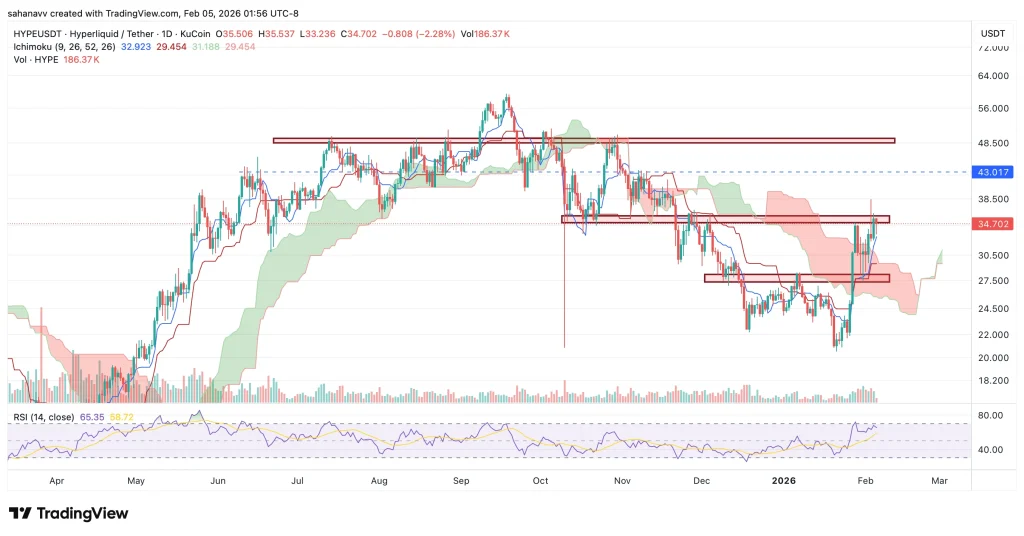
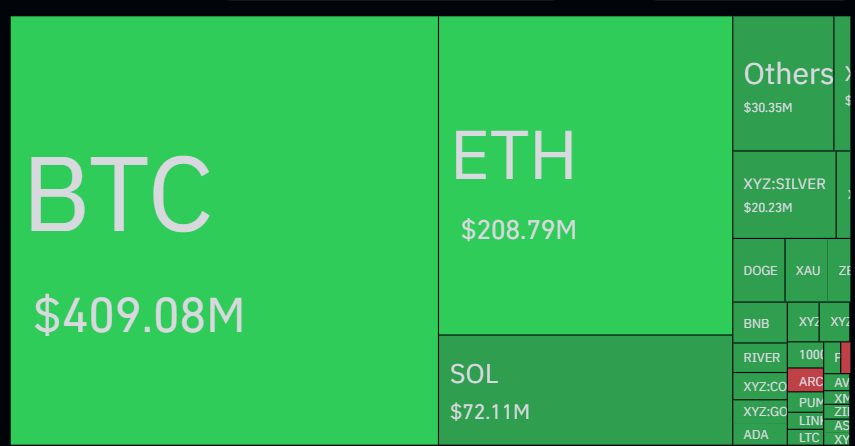
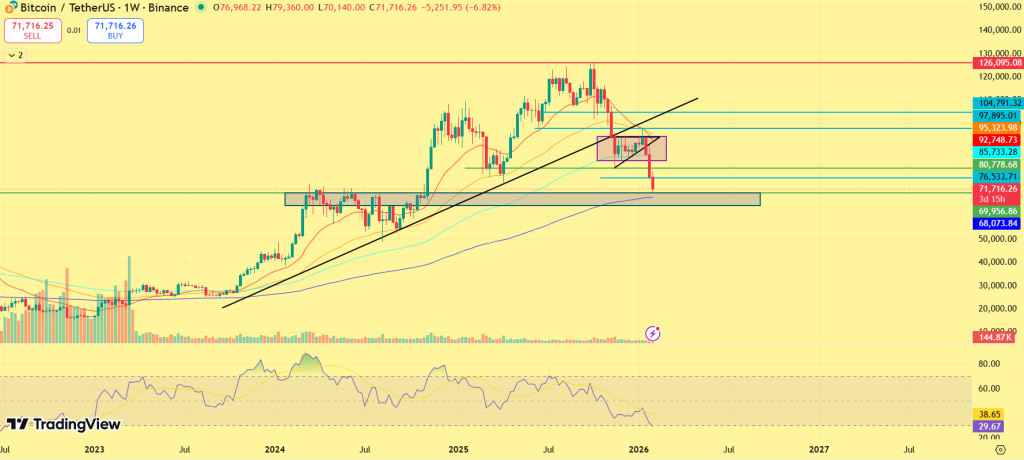
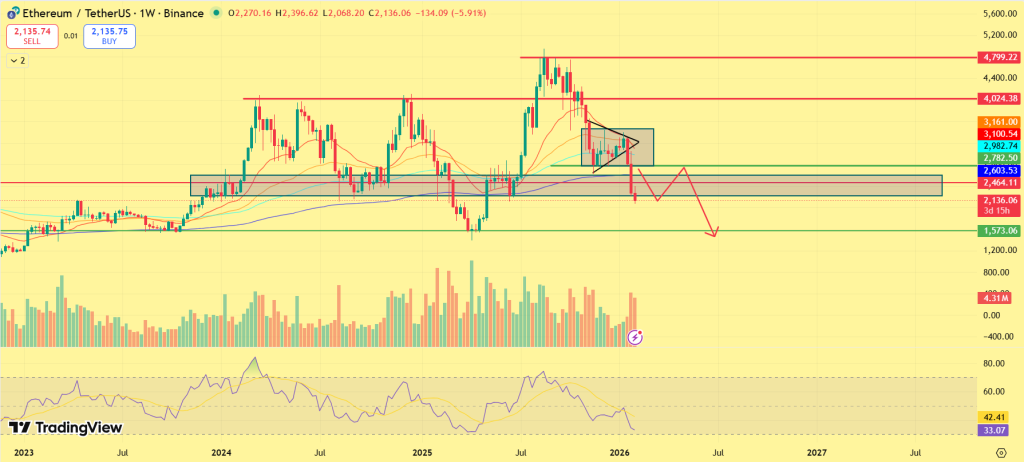


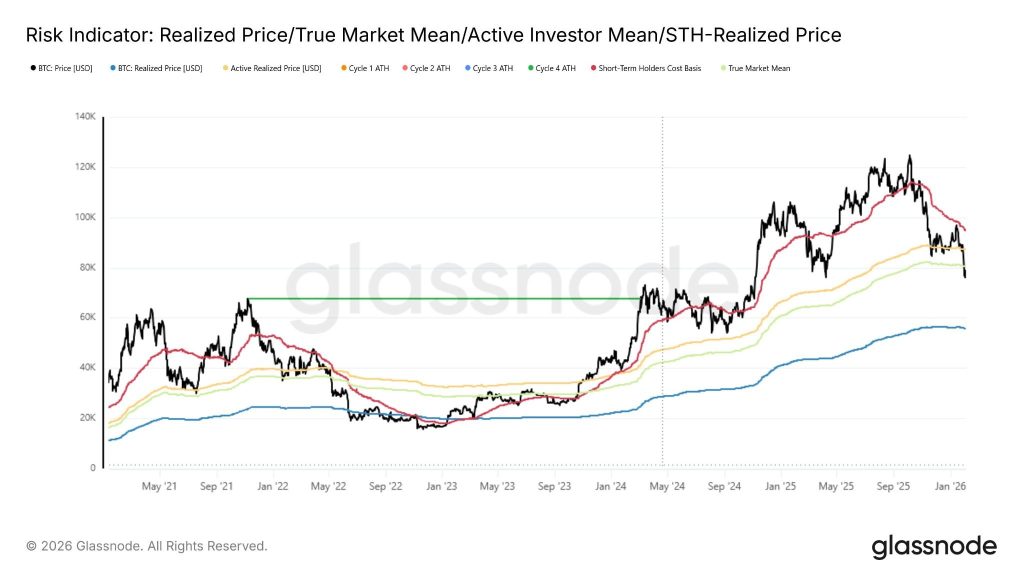
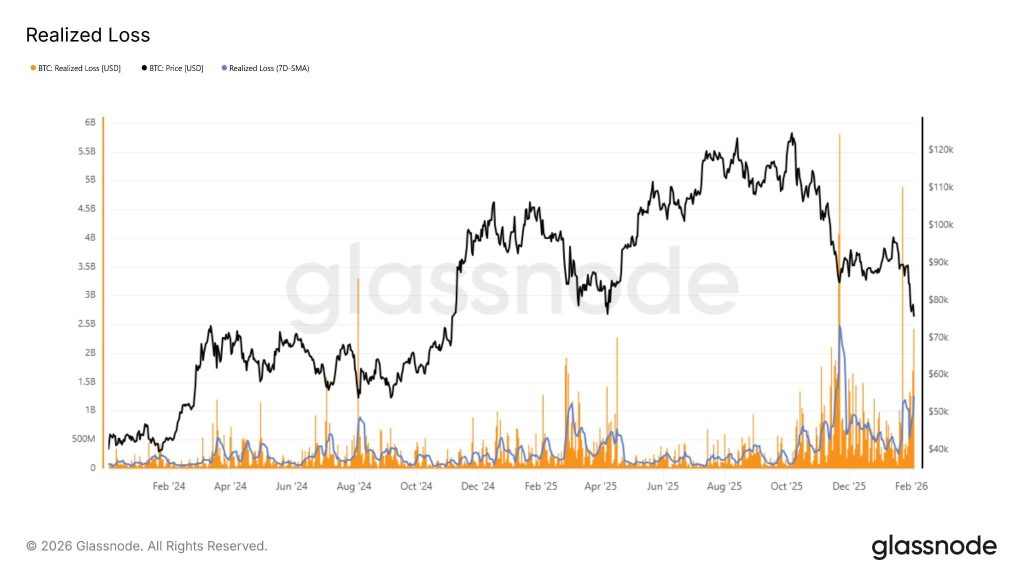
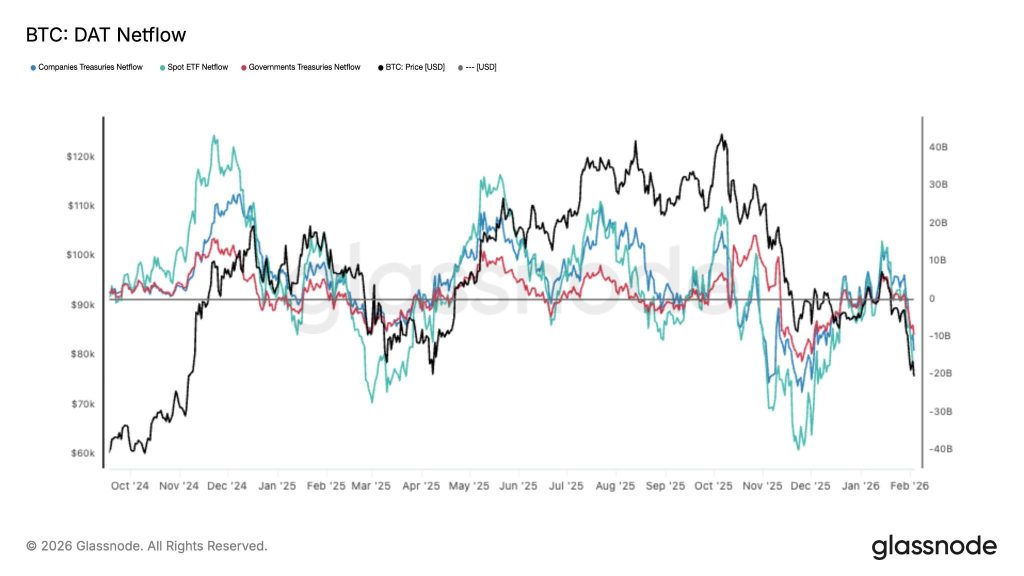
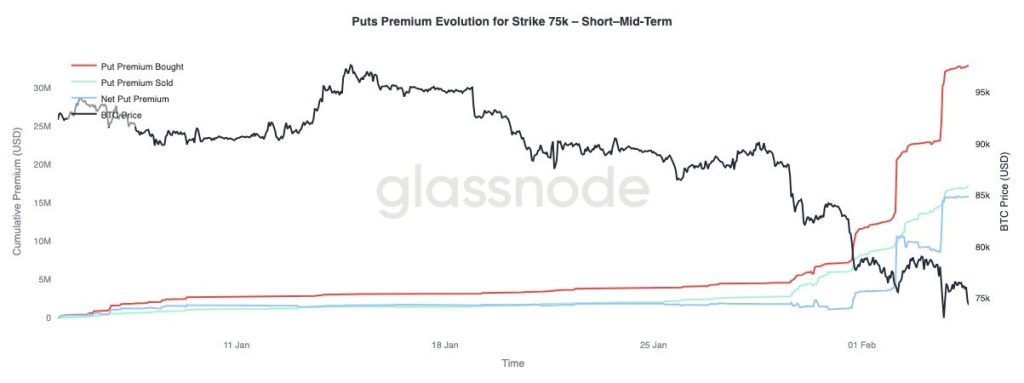


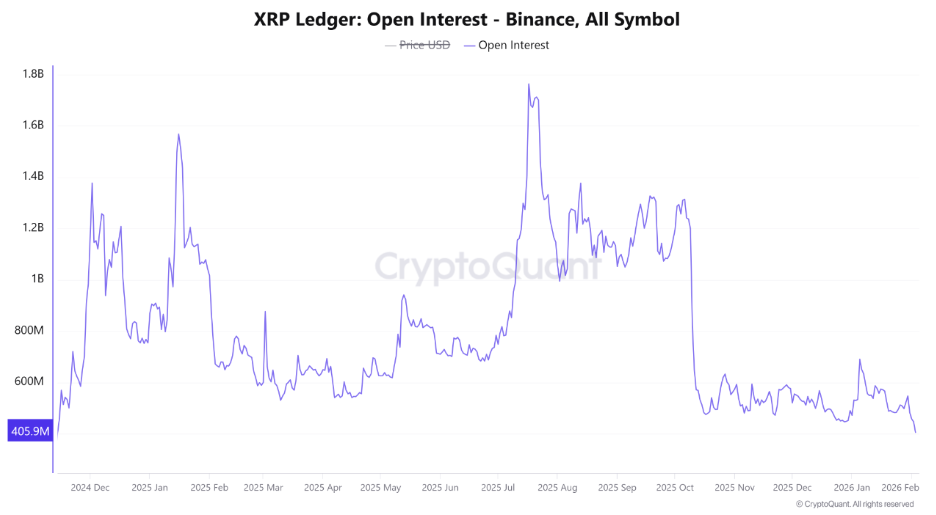
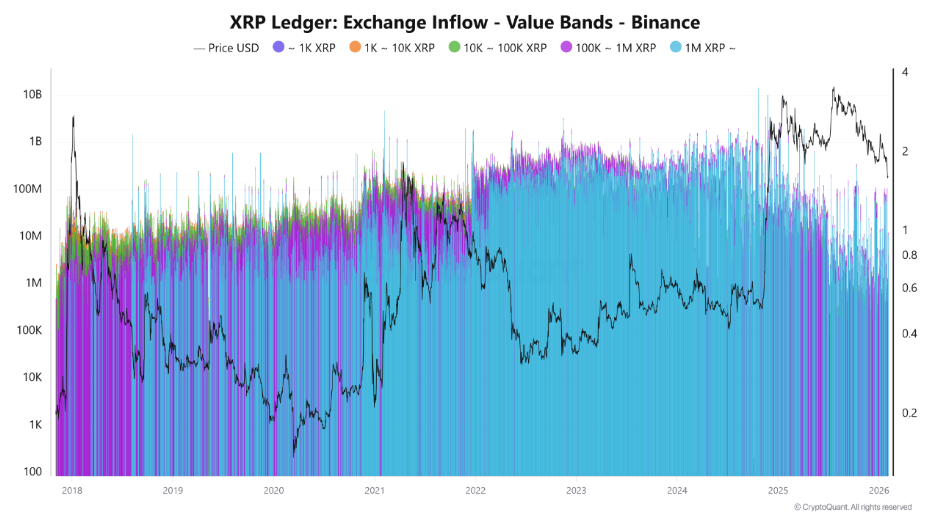
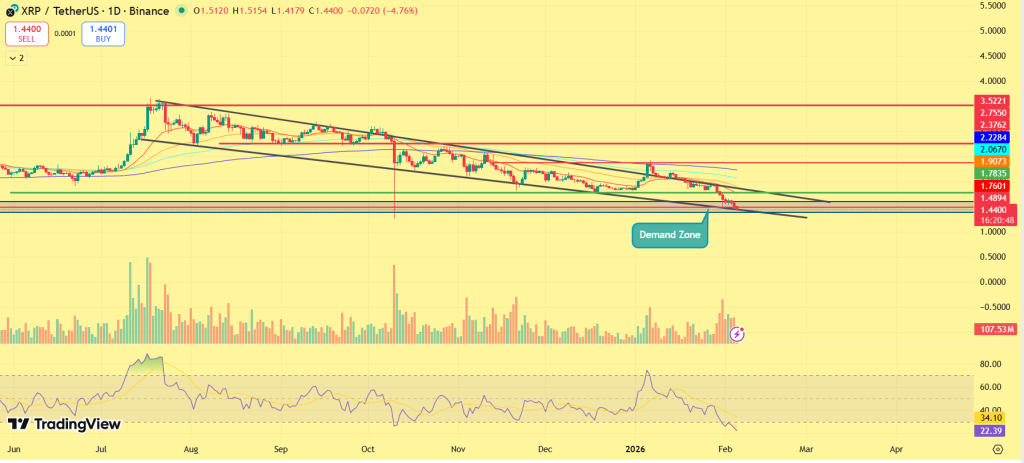


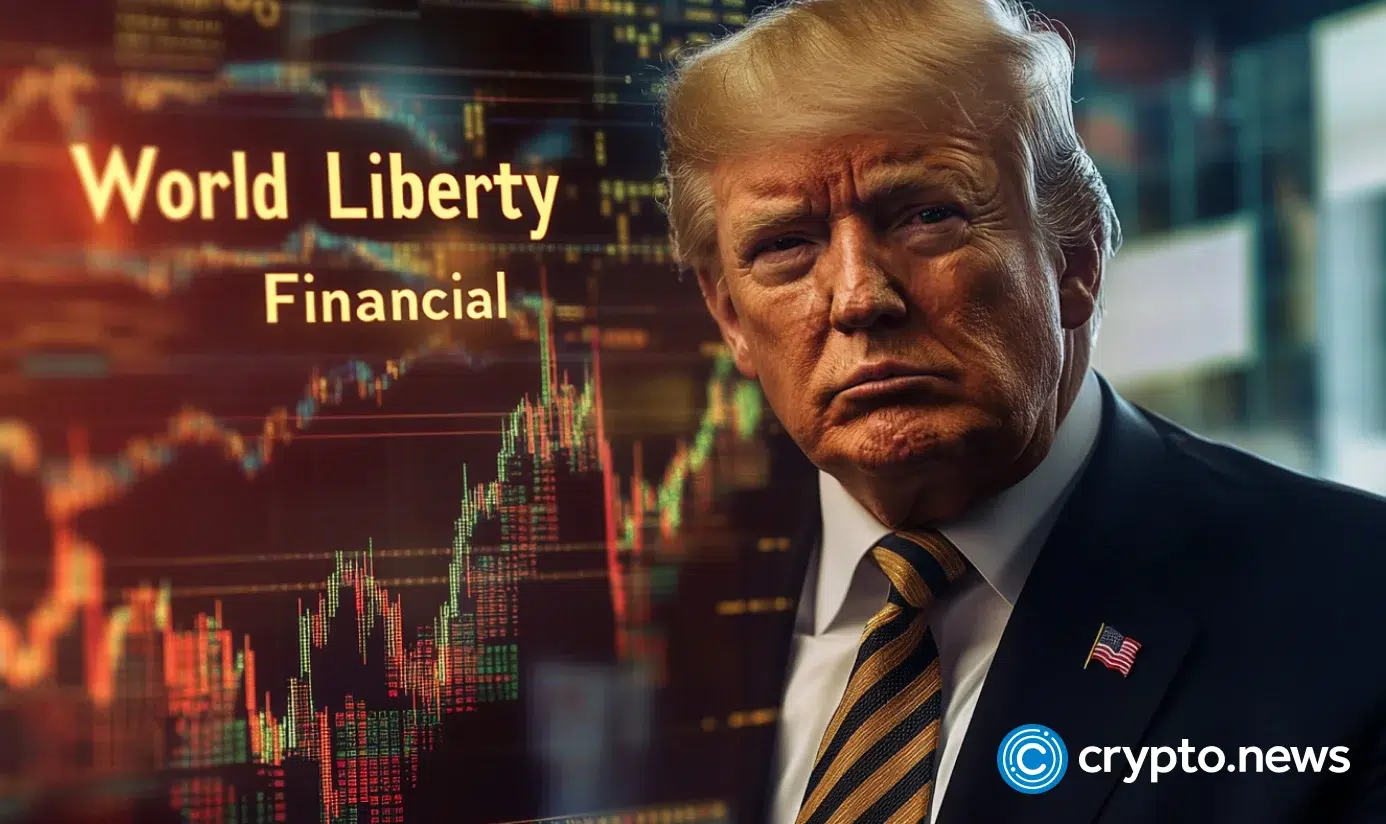


 President Trump says he did not know Abu Dhabi invested $500 million in his World Liberty crypto project.

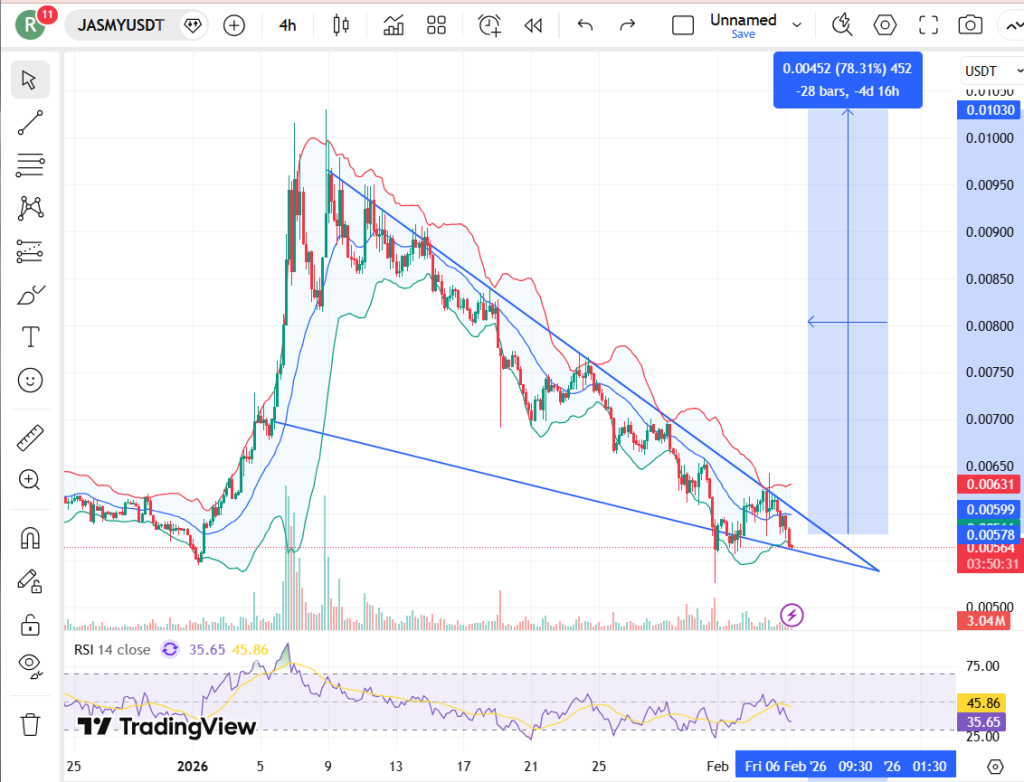


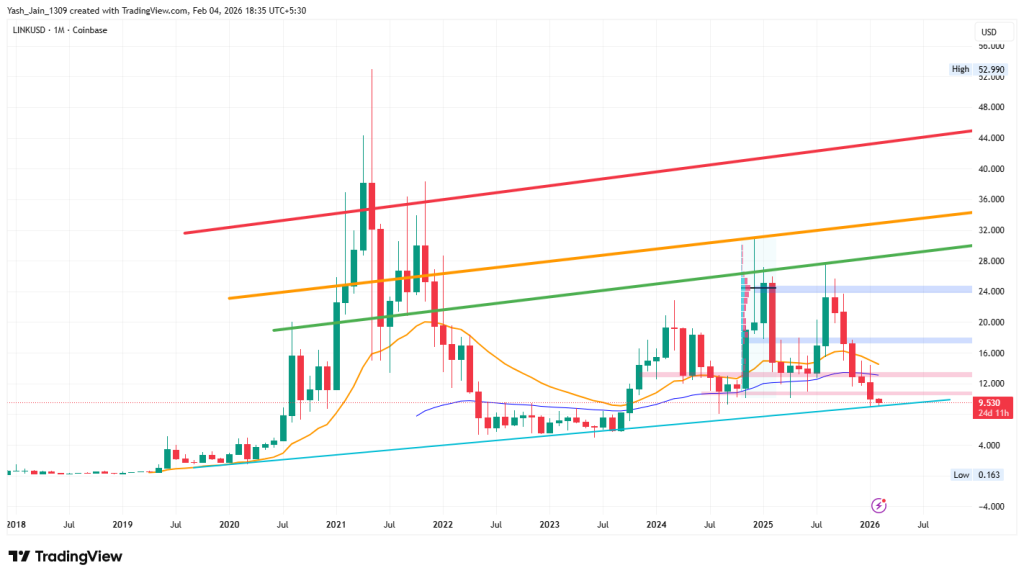


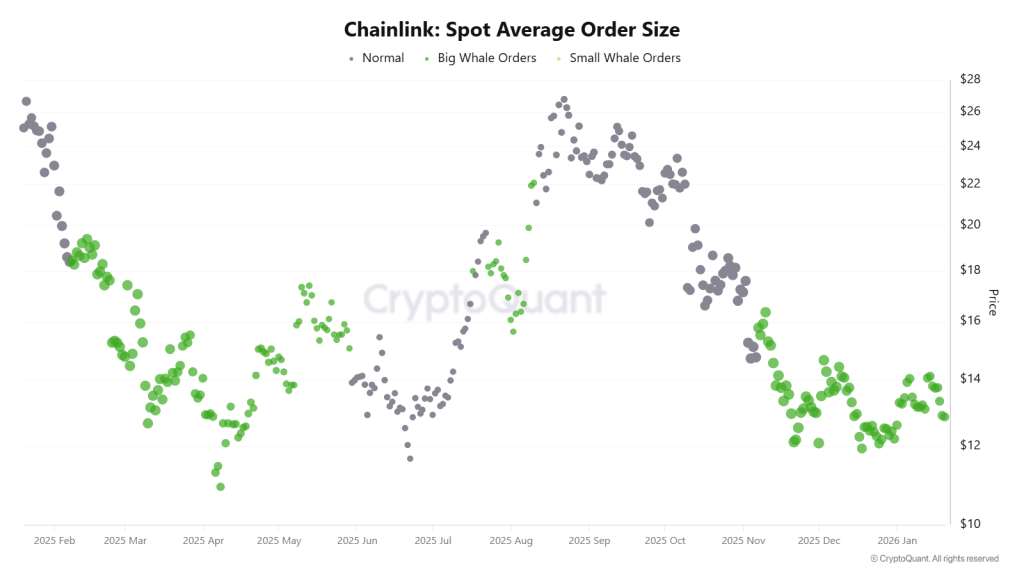

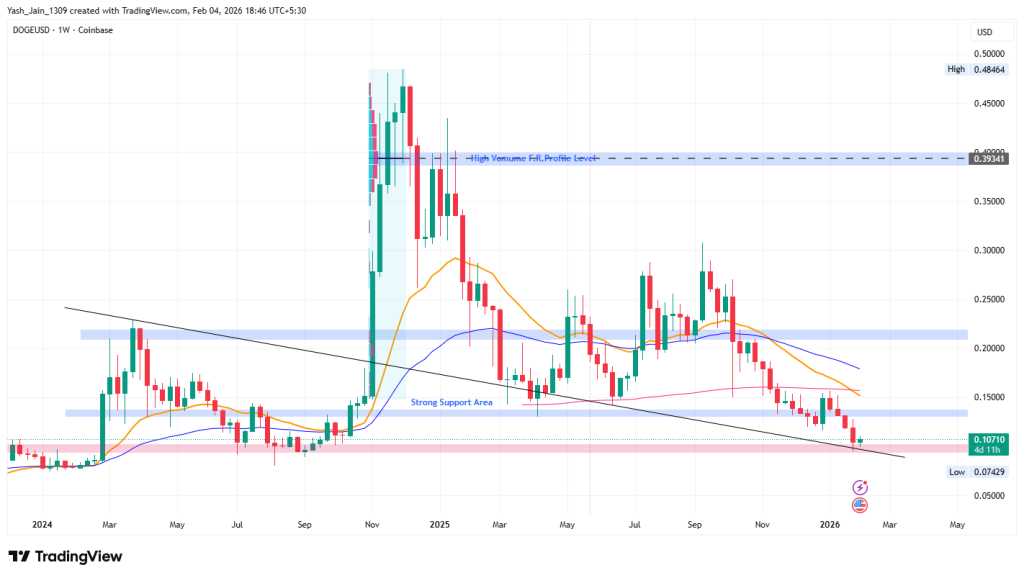
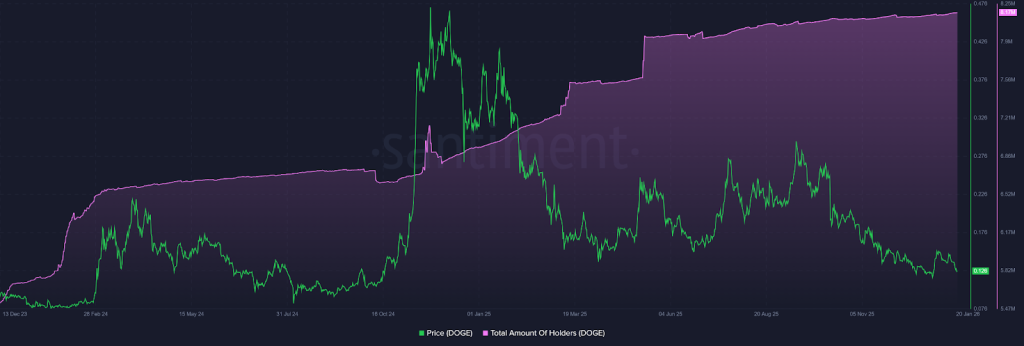
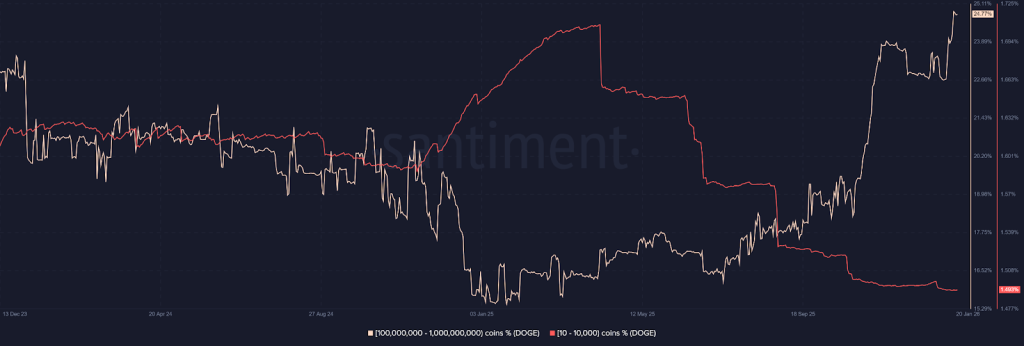


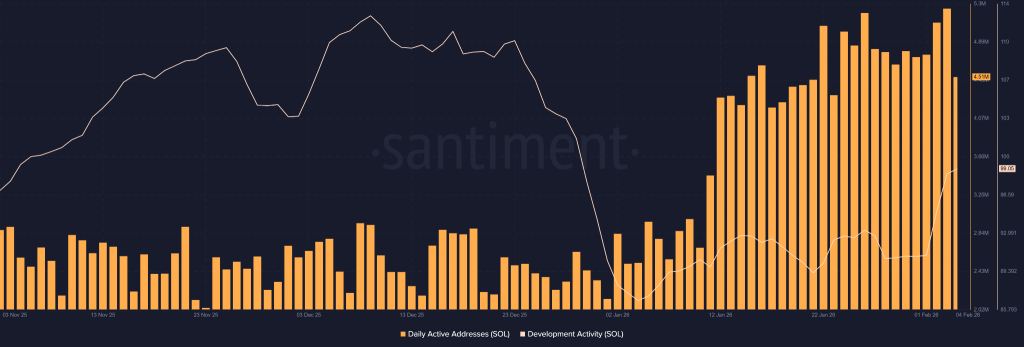
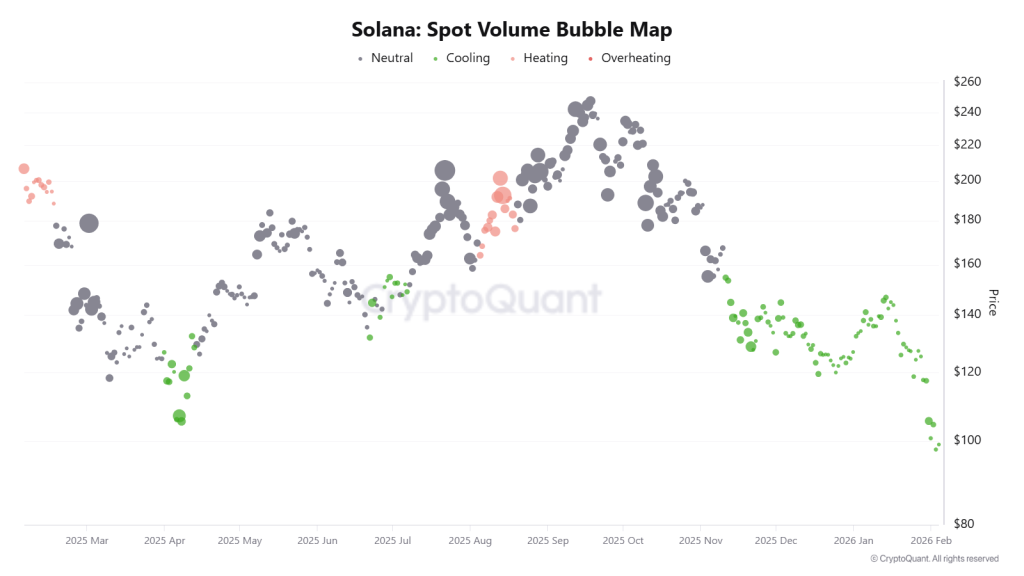
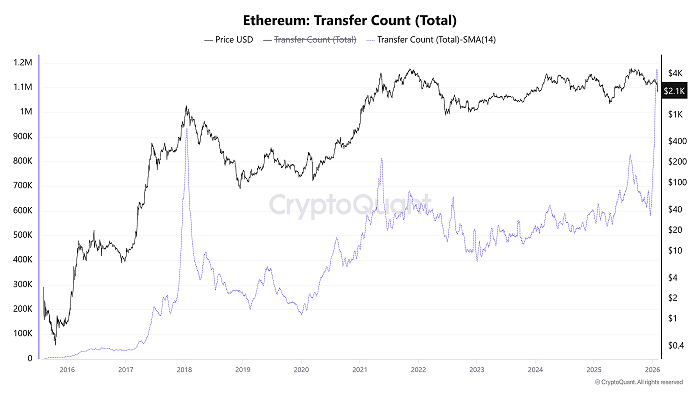
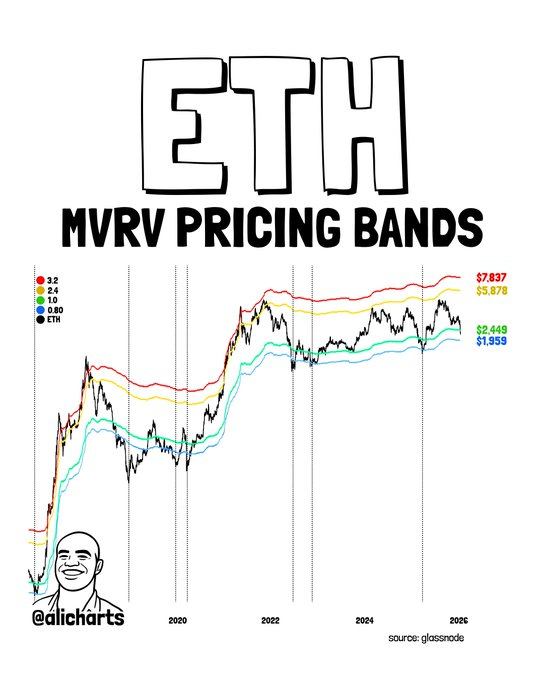

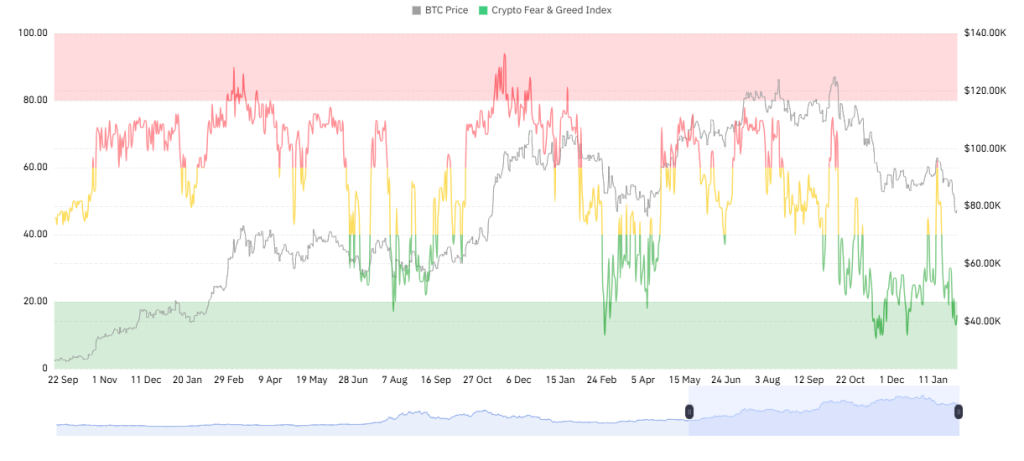
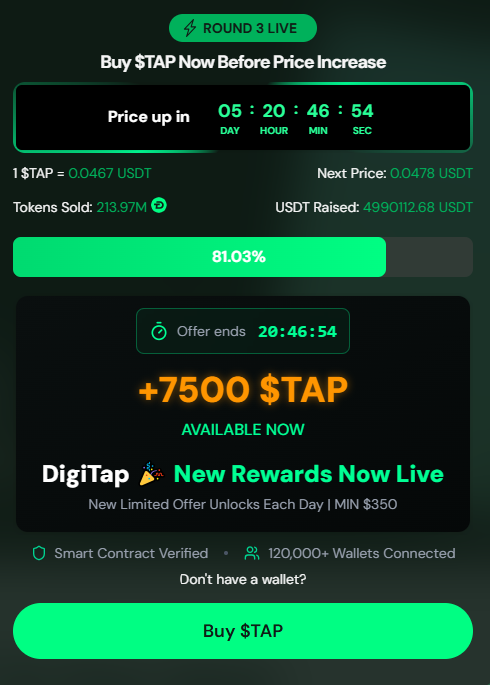

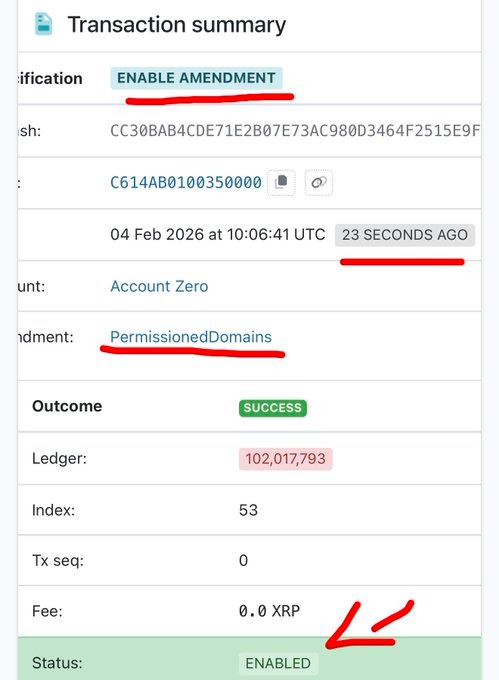
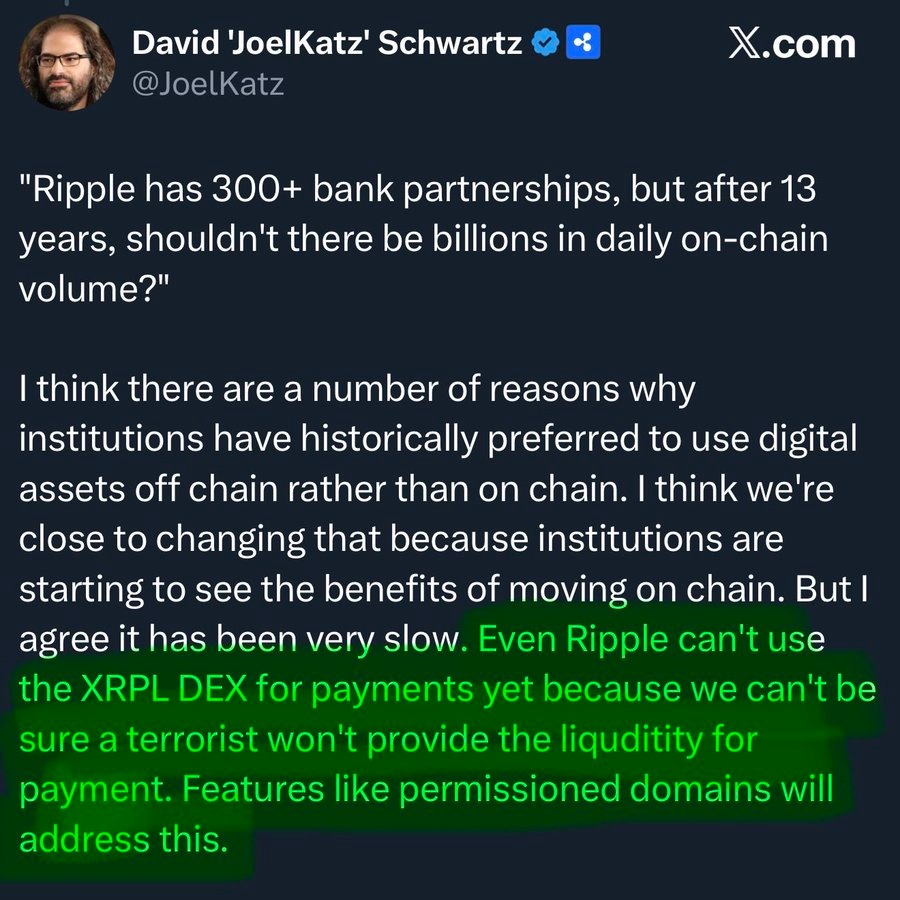
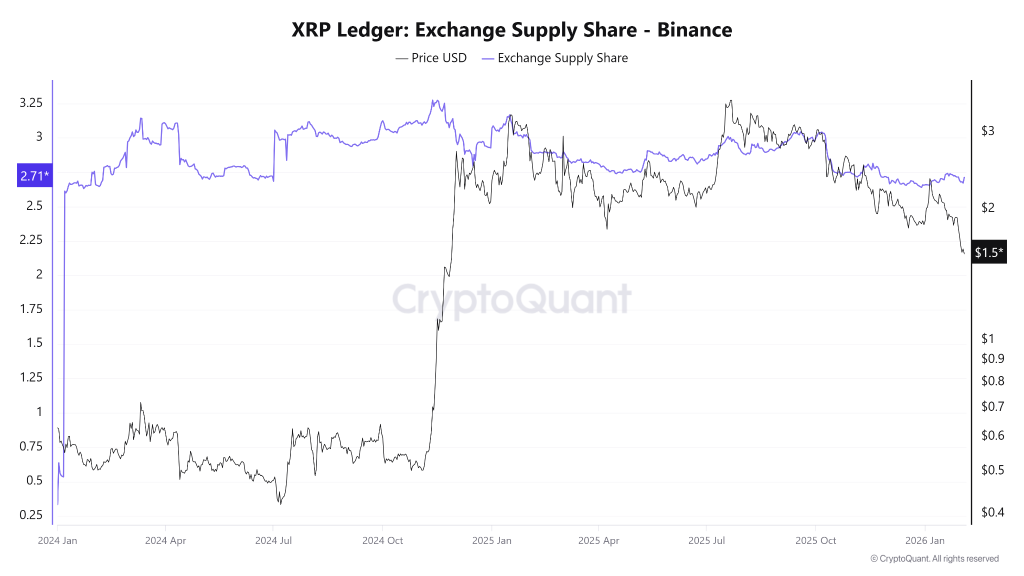
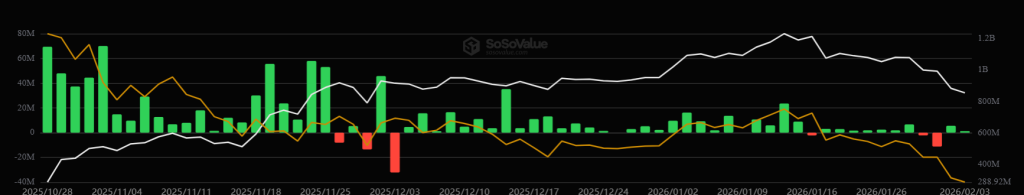
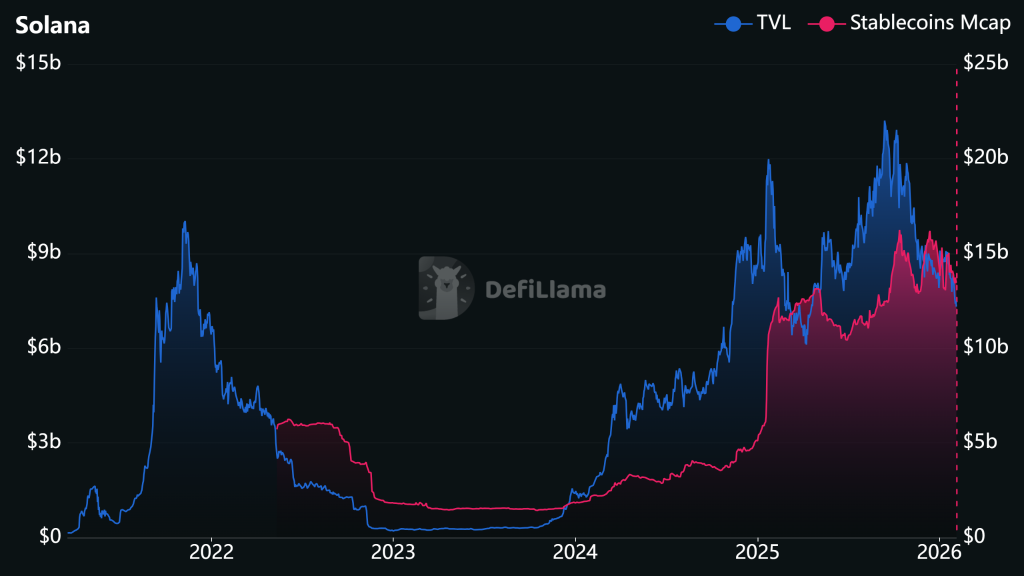
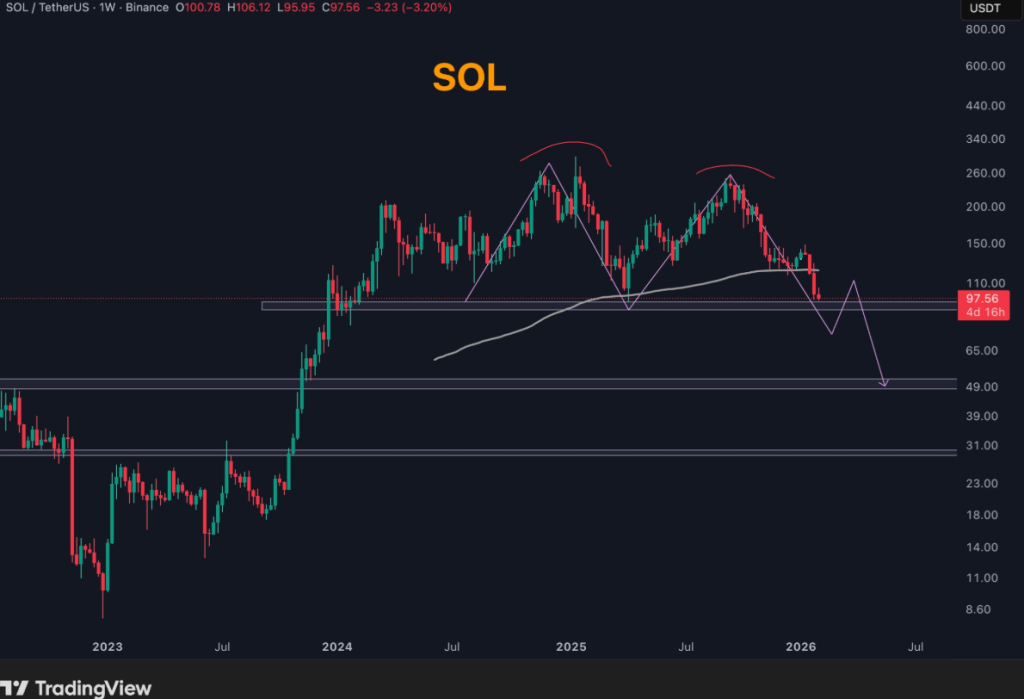


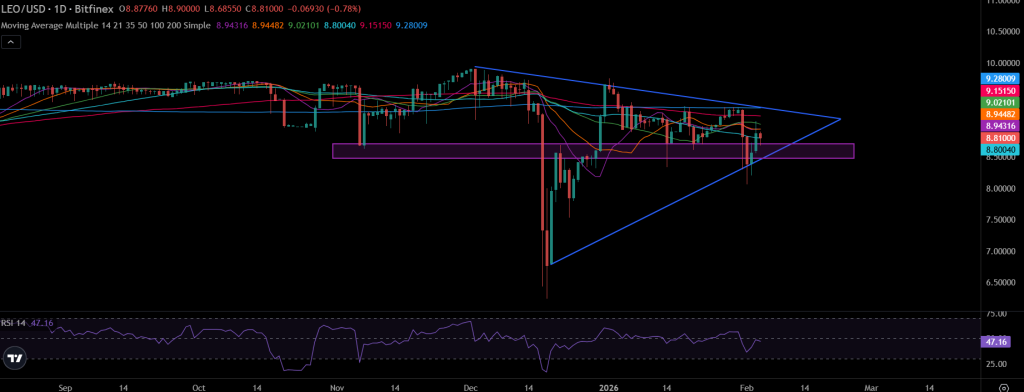

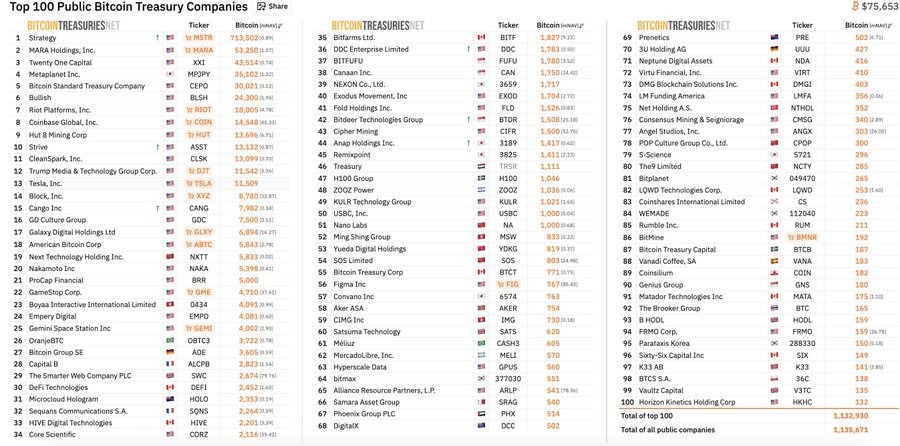


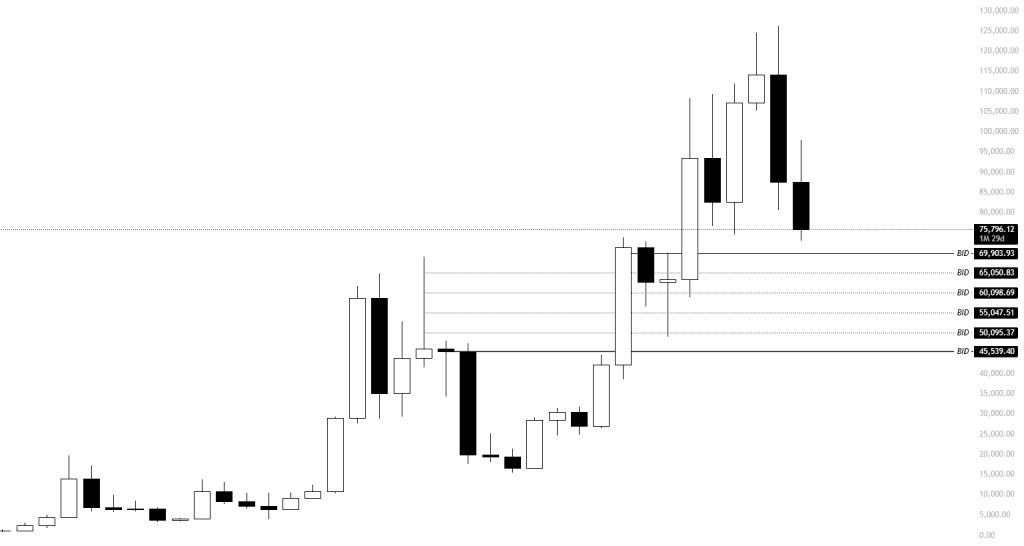
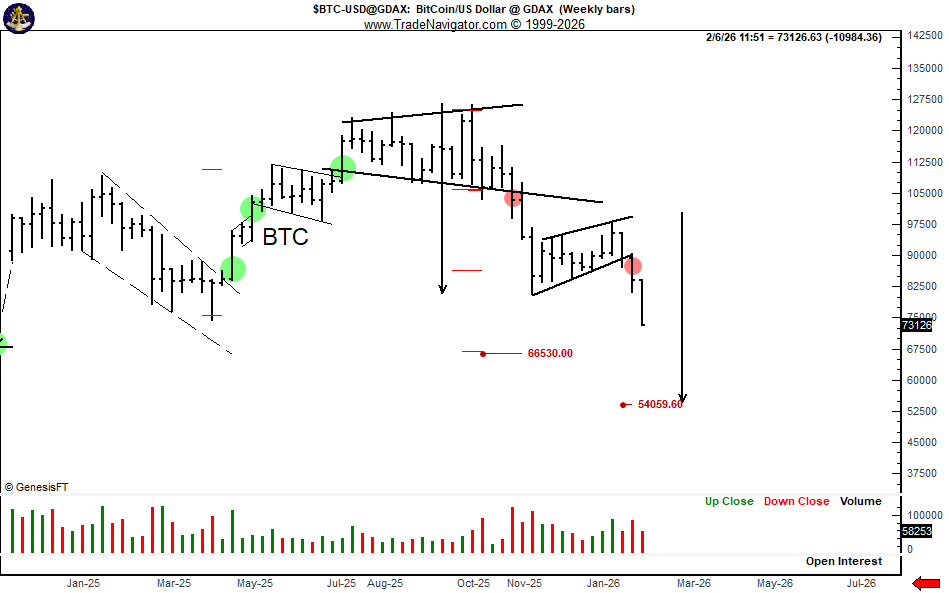

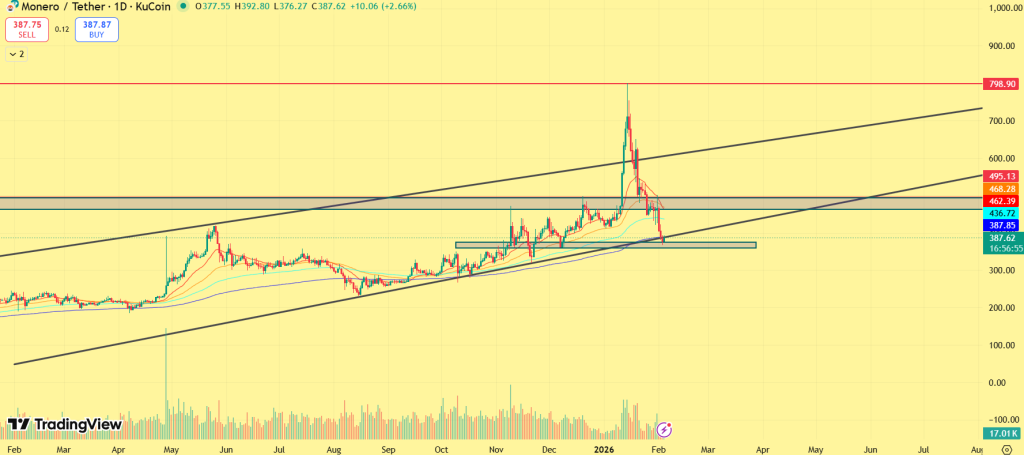
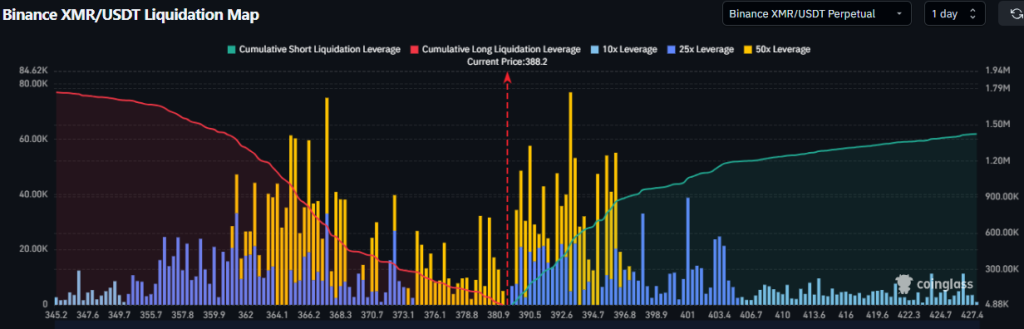


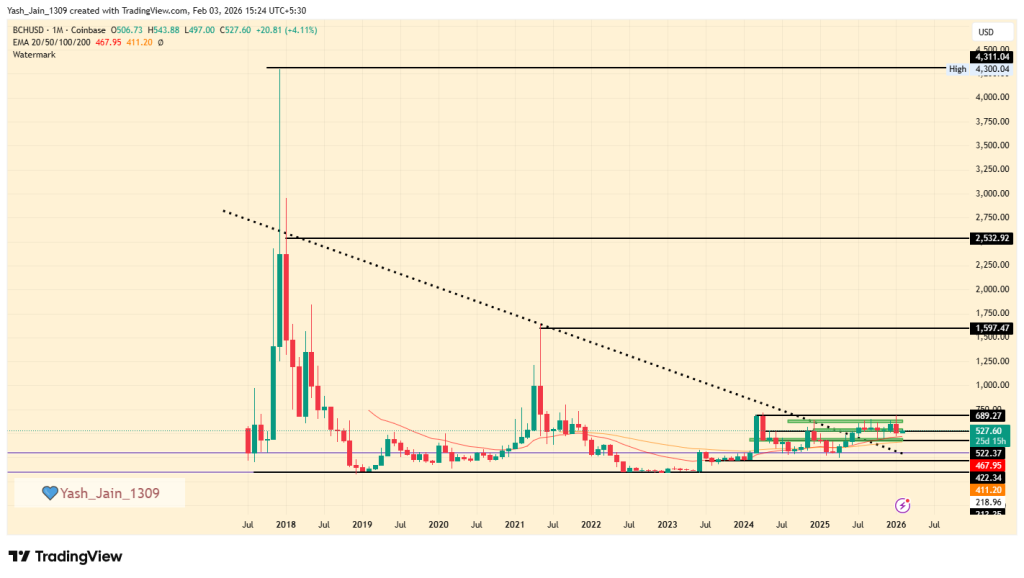
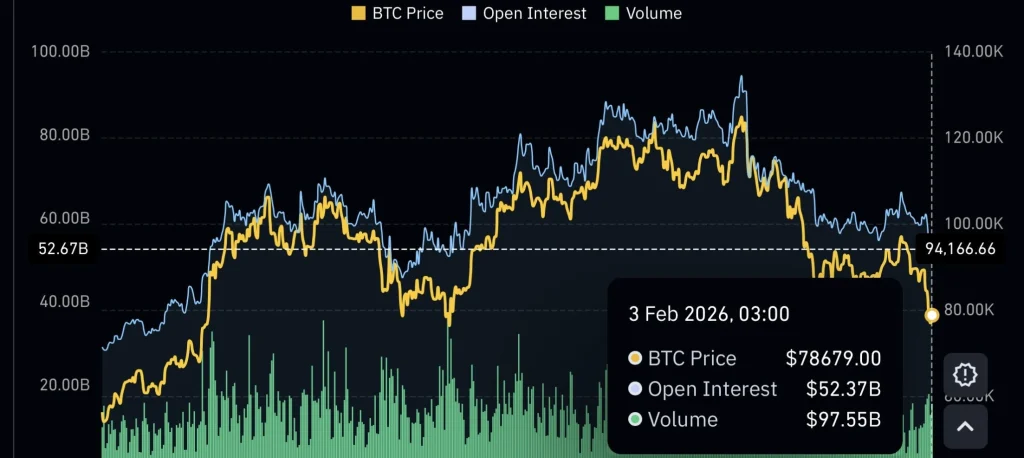
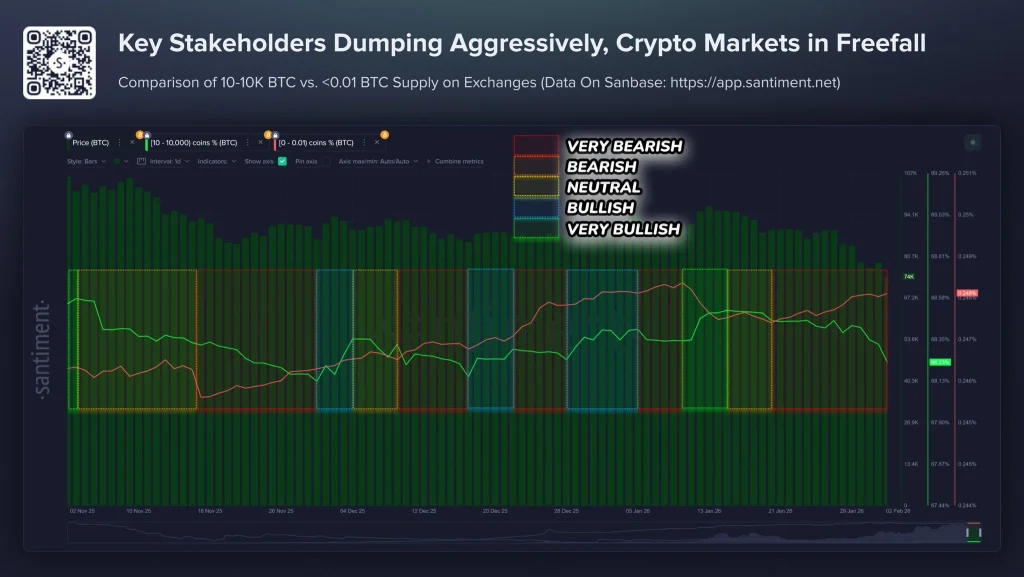


 Russia's Moscow Exchange announces plans to launch cryptocurrency indices for Solana, Ripple,
  |
| Russia to roll out crypto regulatory framework this July, allowing retail participation.