The AI news out of OpenAI this week has a sharp edge: the company launched a paid Safety Fellowship offering $3,850 weekly stipends to external researchers studying what could go wrong with advanced AI — announced within hours of a…
A fresh bitcoin price read from on-chain data shows that the total supply of BTC last moved between $60,000 and $70,000 has grown by approximately 844,275 coins since January 1 — bringing the total cluster in that range to 1.85…
The crypto custody market reached a new consolidation milestone Wednesday when Bloomberg reported that Standard Chartered is planning to integrate Zodia Custody’s business into its corporate and investment bank division as early as this month, folding its majority-owned crypto custody…
The stablecoin news out of Washington this week goes beyond reserves and redemptions — FinCEN, the Treasury’s financial crimes unit, has proposed rules that would fundamentally reform how stablecoin issuers and all US financial institutions handle anti-money laundering compliance, shifting…
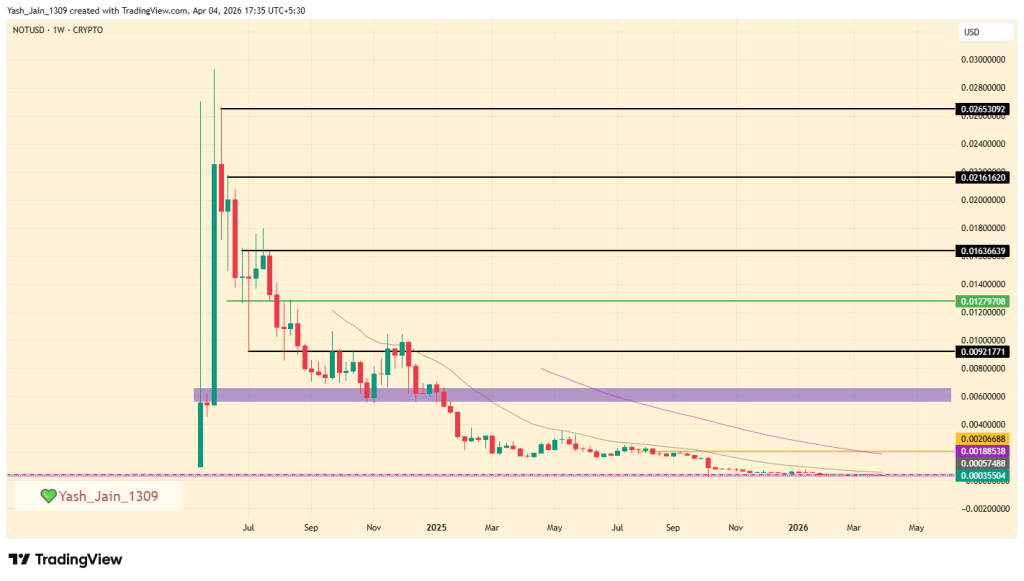
The live price of the Stellar crypto is $ 0.15909815
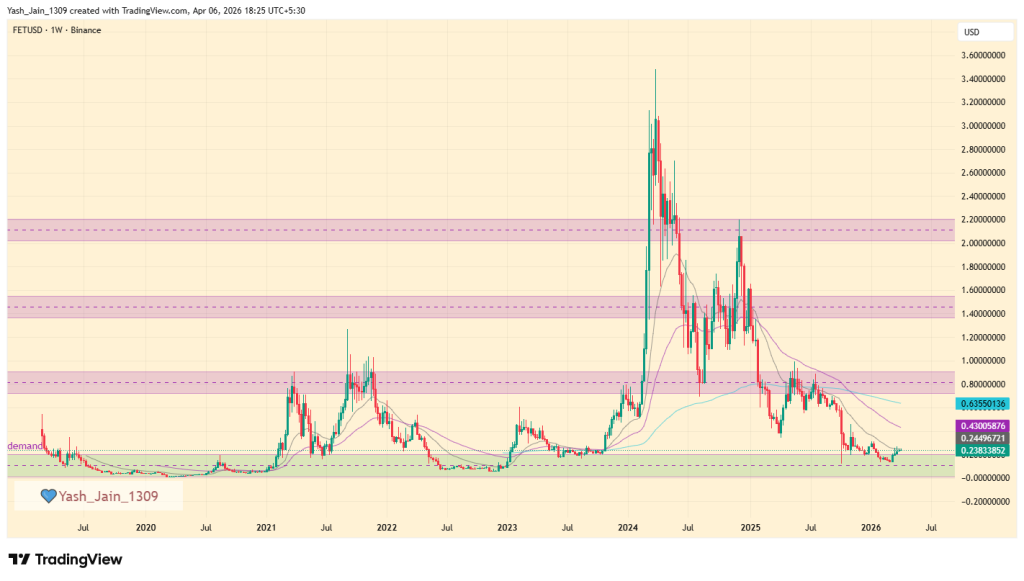
XLM is holding its $0.13–$0.16 demand zone, with a breakout above $0.30 and $0.50 needed to confirm a structural trend reversal toward 2026 targets.
If payment adoption and tokenization expand, Stellar could trend toward $2.50 by 2026 and potentially $5–$7 by 2030 in a strong cycle.
Stellar is entering 2026 at a critical inflection point, with price stabilizing after a prolonged downtrend while attempting to build a base near key demand levels. As a core player in cross-border payments, Stellar continues to expand its role in low-cost, high-speed financial infrastructure, supporting real-world transaction flows across global markets. With market structure tightening and downside pressure easing, the next phase will be defined by whether demand can translate into a sustained breakout.
In this Stellar (XLM) price prediction 2026, we examine key levels, structural shifts, and potential catalysts shaping its trajectory ahead.
Stellar’s price action is transitioning from decline into consolidation, with early signs of compression forming near the $0.15–$0.17 range. After an extended downtrend, XLM has begun holding above its immediate support zone, while a descending resistance trendline continues to limit upside.
This setup reflects a market preparing for a directional move. The immediate resistance lies near $0.20–$0.22. A breakout above this zone could shift short-term structure and open the path higher. In this context, Stellar in April may reach the $0.30–$0.50 range, provided resistance is reclaimed and momentum expands. However, failure to break higher may keep price range-bound, with support expected near the $0.14 level.
Coinpedia’s Stellar (XLM) Price Prediction 2026
The broader structure for Stellar in 2026 reflects a market attempting to transition out of a prolonged downtrend, with early signs of base formation but no confirmed reversal yet. After a sustained decline marked by lower highs and persistent selling pressure, XLM has moved into a compression phase near its lower demand zone. This shift indicates that downside momentum is weakening while price stabilizes within a tighter range.
The next phase depends on reclaiming key resistance levels. The immediate barrier lies near $0.22, followed by stronger zones at $0.30 and $0.50. These levels act as structural checkpoints for recovery. A sustained move above $0.50 would signal a clear shift in market structure, opening the path for a broader expansion phase.
In this scenario, Stellar could advance toward the $1.20–$2.50 range over the course of 2026, supported by a step-by-step recovery across resistance zones. However, until these levels are reclaimed, the market remains in a rebuilding phase. A breakdown below $0.14 would invalidate the current base and delay recovery.
Recent Catalysts For Stellar (XLM)
Growing focus on cross-border payment solutions, reinforcing Stellar’s relevance in global financial infrastructure.
Increased institutional exploration of blockchain-based settlements, supporting networks like Stellar.
Ongoing ecosystem development and partnerships, strengthening long-term network positioning.
Stellar Crypto Price Prediction 2026 – 2030
Year
Potential Low ($)
Potential Average ($
Potential High ($)
2026
1.20
1.80
2.50
2027
1.80
2.40
3.20
2028
2.80
3.80
4.80
2029
4.20
5.30
6.20
2030
5.50
6.20
7.00
Stellar (XLM) Price Forecast 2026
In 2026, Stellar price could project a low price of $1.20, an average price of $1.80, and a high of $2.50.
Stellar Price Prediction 2027
As per the Stellar Price Prediction 2027, Stellar may see a potential low price of $1.80 The potential high for the Stellar price in 2027 is estimated to reach $3.20.
XLM Price Prediction 2028
In 2028, the Stellar price is forecasted to potentially reach a low price of $2.80, and a high price of $4.80
Stellar Price Targets 2029
Thereafter, the Stellar price for the year 2029 could range between $4.20 and $6.20.
Stellar (XLM) Price Prediction 2030
Finally, in 2030, the price of Stellar is predicted to remain steady and positive. It may trade between $5.50 and $7.00.
The long-term projection assumes Stellar sustains relevance in enterprise blockchain use cases, with growth moderating over time as the asset matures.
Year
Potential Low ($)
Potential Average ($)
Potential High ($)
2031
6.20
7.50
9.00
2032
8.00
10.00
12.00
2033
9.10
13.00
16.00
2040
25.00
50.00
80.00
2050
100.00
140.00
200.00
Stellar (XLM) Price Prediction: Market Analysis?
Year
2026
2027
2030
Changelly
$1.90
$2.50
$3.40
CoinCodex
$1.40
$2.70
$4.00
WalletInvestor
$2.00
$3.40
$4.40
Never Miss a Beat in the Crypto World!
Stay ahead with breaking news, expert analysis, and real-time updates on the latest trends in Bitcoin, altcoins, DeFi, NFTs, and more.
FAQs
What is Stellar (XLM) price prediction for 2026?
Stellar could trade between $1.20 and $2.50 in 2026 if it reclaims key resistance and adoption in payments and tokenization accelerates.
What is XLM price prediction for 2027?
XLM could trade between $1.80 and $3.20 in 2027 if adoption expands and broader crypto liquidity supports payment-focused blockchains.
How high will XLM go in 2030?
Under strong market conditions, XLM may reach $5.50 to $7.00 by 2030, driven by enterprise settlement growth and stablecoin usage.
How much will XLM be worth in 10 years?
Long-term projections suggest XLM could exceed $10 if institutional adoption scales, though outcomes depend on regulation and market cycles.
What is the XLM price prediction for the next bull run?
In the next crypto bull run, XLM could target the $0.80–$1.50 range initially. A sustained breakout above $1.00 may open upside toward $2.00+, depending on market liquidity and adoption momentum.
If the recovery structure develops, ICP could gradually climb toward the $27 region by the end of 2026.
With stronger Web3 infrastructure adoption, ICP price could potentially expand toward $70 by 2030.
Internet Computer (ICP), one of the leading decentralized compute platforms, is currently navigating a phase where strong technological relevance contrasts with prolonged price weakness. While the protocol continues to expand its role in decentralized web infrastructure, its price action has remained under sustained pressure.
After an extended downtrend, ICP is now stabilizing near lower demand zones, suggesting that selling momentum may be gradually easing. However, the lack of strong upside continuation indicates that the token remains in a transitional phase rather than a confirmed recovery.
This sets up a key question: Is ICP forming a base after prolonged weakness, or does the structure still reflect insufficient demand? With 2026 already underway, attention now shifts to whether ICP can reclaim key resistance levels and transition into a recovery phase. So, let’s dive into Coinpedia’s Internet Computer (ICP) Price Prediction 2026, 2027 – 2030.
Internet Computer (ICP) Price Prediction for April 2026
ICP is entering April from a position of compression, where price is no longer trending lower but has yet to transition into expansion. After a prolonged decline, the asset has begun to stabilize within a tight range around the $2.20–$2.60 region. This behavior typically reflects a shift in market dynamics, where aggressive selling fades and price starts to balance between buyers and sellers.
The key trigger now sits above the current range. A move through the $3.20–$3.50 zone would indicate that demand is returning, potentially initiating a recovery phase. Under this scenario, ICP in April could move toward the $5–$8 range, driven by a breakout from its current consolidation structure. If this breakout fails to materialize, ICP price is likely to remain contained, with the $2.00 area continuing to act as a base.
Coinpedia’s Internet Computer (ICP) Price Prediction 2026
ICP’s broader trajectory in 2026 is centered around whether the current stabilization phase evolves into a sustained recovery structure. The token has spent an extended period in decline, forming a series of lower highs that defined its previous market cycle. That phase now appears to be slowing, with price beginning to compress near its lower range, often a precursor to structural transition.
The recovery path, however, is not immediate. It requires a sequential reclaim of key zones, starting with $3.50, followed by $5 and $8. These levels represent the points where previous selling pressure emerged and must now be absorbed. Once these zones are cleared, the market typically shifts into a higher trading regime, where upside momentum begins to build more aggressively.
In such a progression, ICP could gradually expand toward the $10–$27 range during 2026, reflecting a full-cycle recovery rather than a short-term bounce. Until that transition is confirmed, the asset remains in a rebuilding phase. Loss of the $2.00 level would weaken this structure and extend the consolidation period.
Recent Catalysts
Major exchange listing expanded access, improving liquidity and global participation.
AI narrative gaining traction, positioning ICP within the decentralized compute and infrastructure segment.
Internet Computer Crypto Price Prediction 2026 – 2030
Year
Potential Low ($)
Potential Average ($
Potential High ($)
2026
10
18
27
2027
14
24
34
2028
18
30
45
2029
25
40
55
2030
35
50
70
Internet Computer Price Projection 2026
In 2026, Internet Computer price could project a low price of $10, an average price of $18, and a high of $27
ICP Crypto Price Action 2027
As per the Internet Computer price Prediction 2027, Internet Computer may see a potential low price of $14, The potential high for Internet Computer price in 2027 is estimated to reach $34
Internet Computer Price Target 2028
In 2028, Internet Computer price is forecasted to potentially reach a low price of $18, and a high price of $45.
ICP Token Price Forecast 2029
Thereafter, the Internet Computer (ICP) price for the year 2029 could range between $25 and $55.
Internet Computer Price Prediction 2030
Finally, in 2030, the price of Internet Computer (ICP) is predicted to maintain a steady positive. It may trade between $35 and $70
Internet Computer Price Prediction 2031, 2032, 2033, 2040, 2050
Over the long term, the value of Internet Computer (ICP) will depend on Web3 adoption and the expansion of decentralized cloud services, which could support gradual growth across future market cycles.
Year
Potential Low ($)
Potential Average ($)
Potential High ($)
2031
40
60
85
2032
45
70
100
2033
50
85
120
2040
120
185
250
2050
350
520
700
Internet Computer (ICP) Price Prediction: Market Analysis?
Year
2026
2027
2030
Changelly
$15
$35
$35
CoinCodex
$18
$42
$50
WalletInvestor
$20
$38
$45
Never Miss a Beat in the Crypto World!
Stay ahead with breaking news, expert analysis, and real-time updates on the latest trends in Bitcoin, altcoins, DeFi, NFTs, and more.
FAQs
What is Internet Computer (ICP) and what is it used for?
Internet Computer (ICP) is a layer-1 blockchain that lets developers build fully on-chain apps without traditional cloud servers.
What is the Internet Computer (ICP) price prediction for 2026?
ICP is projected to trade between $6 and $25 in 2026, depending on market momentum, support levels, and broader crypto sentiment.
How high can ICP price go by 2030?
If adoption of decentralized cloud platforms expands and crypto markets strengthen, ICP could potentially reach around $70 by 2030 in a strong growth cycle.
How much will ICP cost in 2035
Long-term models suggest ICP could trade between about $80 and $150 by 2035 if decentralized computing platforms gain wider adoption.
What will ICP be worth in 2040?
Long-term projections estimate ICP could range between roughly $120 and $250 by 2040, depending on Web3 adoption, developer activity, and broader crypto market growth.
What factors influence ICP price movements?
ICP’s price is influenced by market trends, developer adoption, token supply dynamics, network upgrades, and overall crypto sentiment.
Is ICP a good long-term investment?
ICP may suit long-term investors who believe in decentralized cloud computing, but price volatility means risk management is essential.
Little Pepe gains momentum as presale surpasses $28 million, attracting strong investor interest. Little Pepe (LILPEPE) continues to sustain its pace and is gaining momentum in the memecoins market, especially after officially crossing the $28 million mark for its presale…
The crypto regulation landscape shifted Tuesday as the FDIC voted to release a 191-page proposed rule implementing the GENIUS Act, setting reserve, redemption, capital, and custody standards for stablecoin issuers — but the most consequential detail for everyday holders is…
Meta has unveiled Muse Spark, its first AI model from the new Meta Superintelligence Labs unit, positioning it as a step toward “personal superintelligence” that can reason, use tools and orchestrate multiple agents on behalf of users. Announced on April…
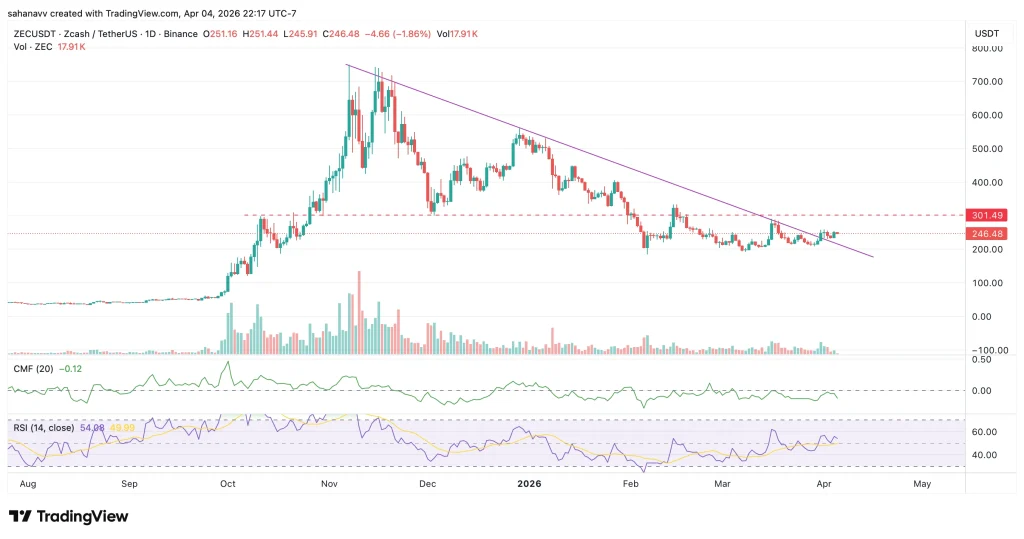
The Zcash price surged over 30% in 24 hours after the Grayscale Zcash Trust reportedly accumulated approximately $46 million in shielded ZEC, triggering the sharpest single-day rally the privacy coin has seen in weeks and pushing daily trading volume past…
xPrime, Stretch and xStream, winners of the inaugural xStocks Hackathon, show how tokenized equities can evolve into prime brokerage, structured products and automated strategy layers built natively on-chain. The inaugural xStocks Hackathon on the French Riviera compressed the future of…
A whale wallet tied to pseudonymous trader “Techno Revenant” has just unstaked roughly 2.4 million HYPE tokens after a six‑month lock-up, freeing an estimated $93.7 million worth of supply with no immediate indication of whether the position will be dumped,…
The bitcoin ETF fee war reached its lowest point ever today as Morgan Stanley’s MSBT launched at 0.14% annually on NYSE Arca, directly undercutting every competing spot bitcoin fund in the US market, from BlackRock’s IBIT at 0.25% to Fidelity’s…
Bitcoin faces a future quantum threat, but Bernstein analysts say risks are concentrated in older wallets and exposed keys, and unlikely to cause existential disruption.
The proposed rule would direct payment stablecoin issuers to establish AML/CFT and sanctions compliance programs, and be able to “block, freeze, and reject” certain transactions.
Bitcoin buy-side activity in the spot and futures markets supports the current rally toward $72,000, while short-term holders eased up on selling, increasing the chances of bulls taking control of BTC's price direction.
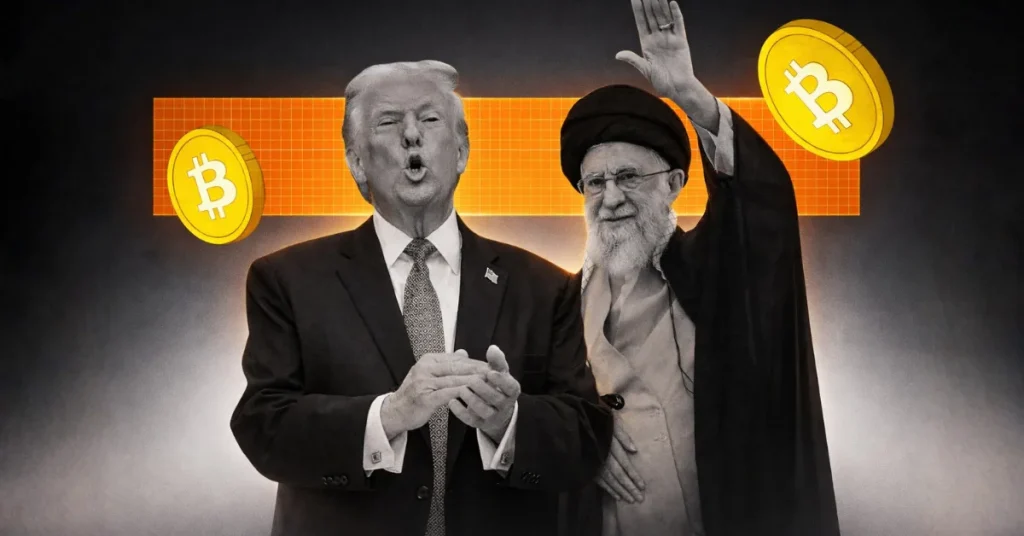
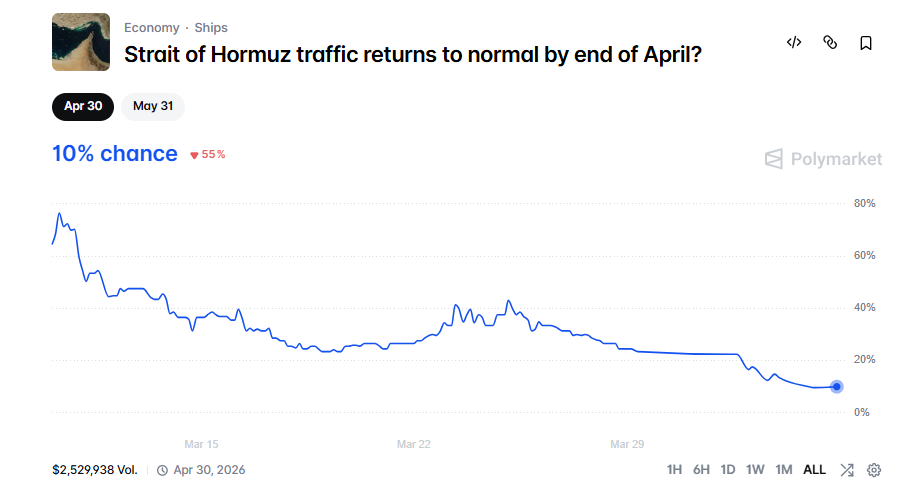
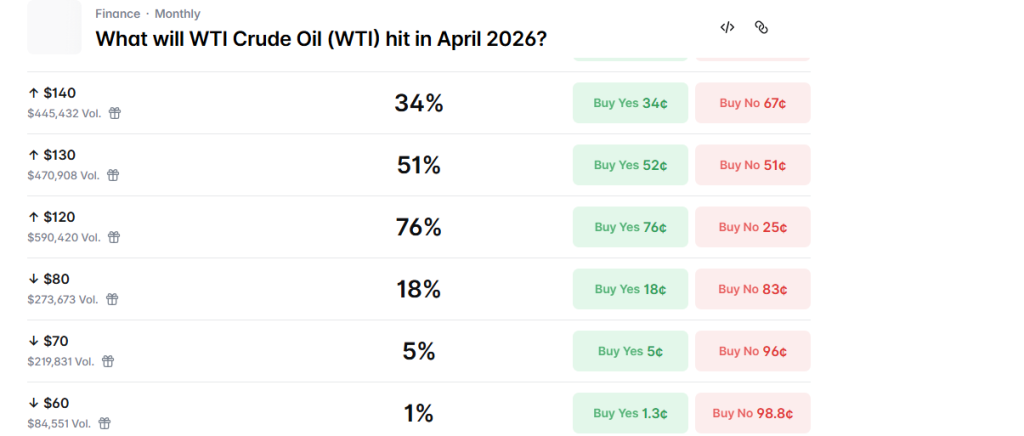
Empty tankers will reportedly be permitted to pass through the waterway under the US-Iran deal, but certain ships will need to pay a tariff of $1 per barrel of oil in Bitcoin.
Iran’s reported plan to charge oil tankers a fee in Bitcoin or Chinese yuan to pass through the Strait of Hormuz is drawing global attention, as it mixes geopolitics with cryptocurrency in a way rarely seen before.
According to messages sent to ships in the region, tankers may need to pay between about $0.50 and $1.50 per barrel of oil to pass through the narrow waterway. For large ships, that could mean paying millions of dollars per trip.
The warning was clear. Ships must pay quickly to get approval. Those that try to pass without permission could face serious consequences. Right now, hundreds of vessels are said to be waiting near the Gulf, unsure how the situation will play out.
Why Bitcoin?
The idea behind this move is simple. By asking for Bitcoin or yuan, Iran could avoid the traditional banking system, which is heavily controlled by Western countries and often used to enforce sanctions.
BREAKING: Iran is demanding ships pay a toll in Bitcoin to pass through the Strait of Hormuz.
$1 per barrel of oil. Payment must be made in seconds or the ship does not pass.
Vessels that attempt transit without Iranian approval will be destroyed, according to a radio… pic.twitter.com/qcgZa8kGyg
Instead of using dollars and bank transfers, payments would move through alternative systems. In this case, that could mean direct crypto transfers or non-dollar settlement channels.
Social media fuels big numbers
The story has quickly spread online, especially in crypto circles.
One user on X claimed that if Iran charges around $2 million per ship, that would equal about 27 Bitcoin at current prices. If around 130 ships pass daily, as they did before tensions rose, that could mean over 3,600 Bitcoin in daily payments.
For comparison, only about 450 Bitcoins are mined each day.
The user suggested this could allow Iran to build a large Bitcoin reserve over time. But these estimates are based on assumptions, and there is no proof this level of activity is happening.
Is this actually happening?
There are reports that some ships may already be using non-dollar payments to pass through the region, but details are limited.
It’s still unclear:
How many ships would agree to pay
Whether insurers would allow it
How governments would respond
Because of these unknowns, the plan may not scale easily.
The latest crypto milestone arrived Wednesday when Morgan Stanley officially launched the Morgan Stanley Bitcoin Trust on NYSE Arca under the ticker MSBT, becoming the first major US bank to issue a spot bitcoin ETF directly under its own name,…
The Ethereum Foundation (EF) has announced it will convert 5,000 ETH into stablecoins using decentralized trading protocol CoWSwap’s time-weighted average price (TWAP) function, describing the move as routine funding for “R&D, grants and donations.” “Today, The Ethereum Foundation will convert…
Stablecoins processed $33t in 2025, topping Visa and Mastercard, and could clear over $50t by 2026 as corporates, banks and AI agents turn on‑chain dollars into core payment rails. Stablecoins processed $33 trillion of on-chain transaction volume in 2025, surpassing…
Iran will charge tankers $1 per barrel in bitcoin to cross the Strait of Hormuz during a two‑week US ceasefire, adding a crypto tax to the world’s key oil chokepoint. Iran will force every oil tanker transiting the Strait of…
The US Treasury plans rules forcing dollar stablecoin issuers to build kill switches and run full bank‑style AML and sanctions programs, tightening control over on‑chain flows. The US Treasury is preparing sweeping anti–money-laundering and sanctions rules that would turn dollar-pegged…
Mobile cloud mining gains traction as users seek simple ways to mine crypto via smartphones. As the cryptocurrency market continues to evolve in 2026, more users are searching for how to mine cryptocurrency on their phone with cloud mining. Compared…
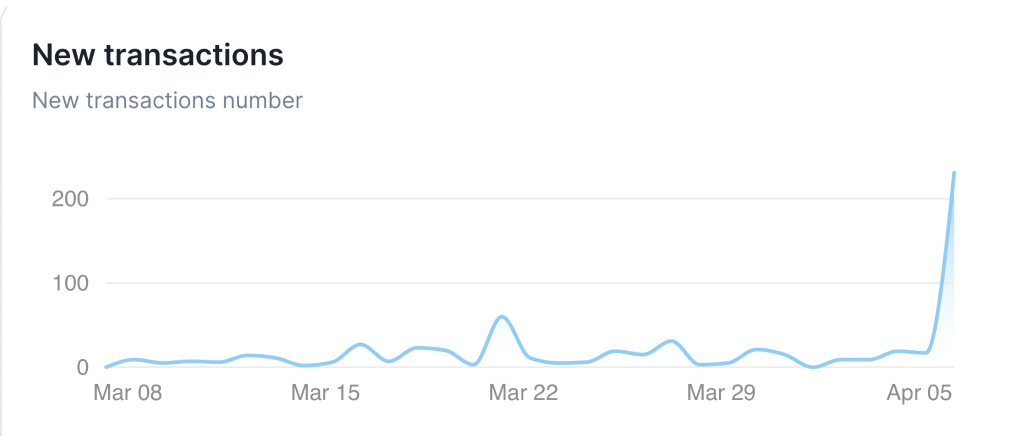
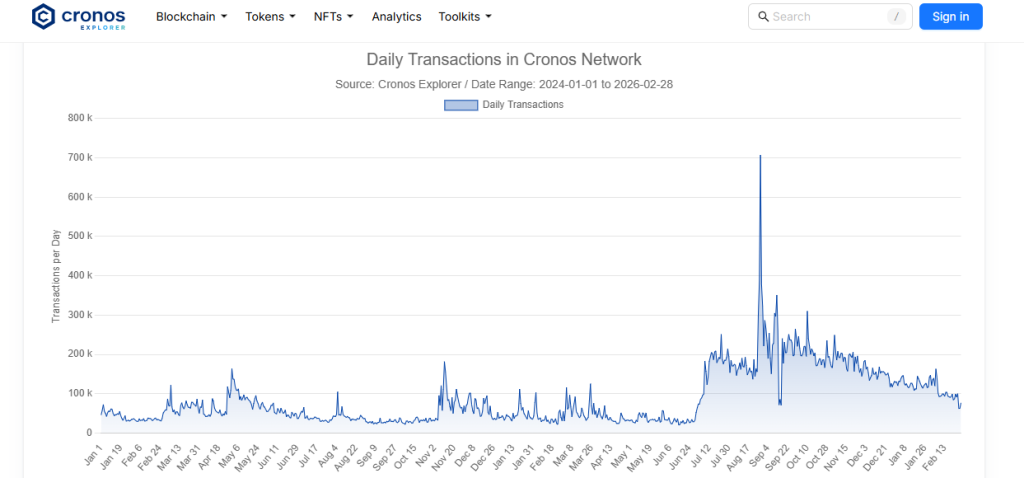
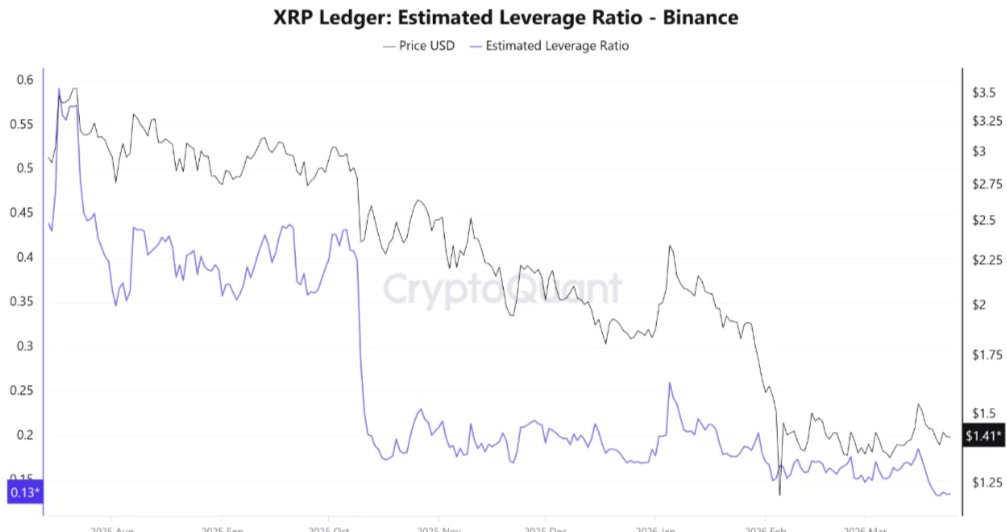
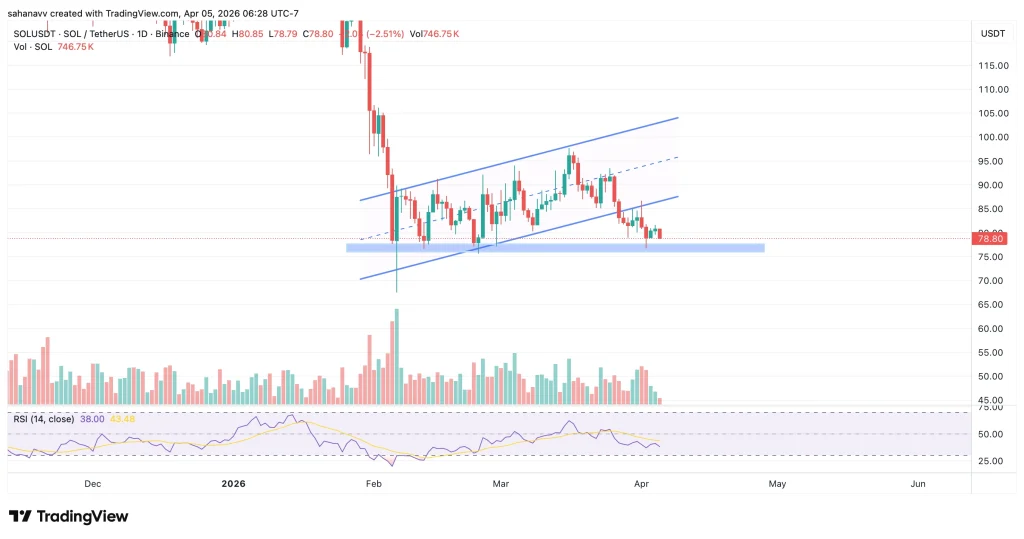
The crypto market may appear stable on the surface, but underlying activity is cooling rapidly. Data shows that total centralized exchange (CEX) trading volume has dropped to around $4.3 trillion, marking a sharp 48% decline from the October 2025 peak. This slowdown points to weakening participation, even as prices attempt to hold higher levels.
More importantly, the structure of the market is shifting. Perpetual futures now dominate with nearly $3.5T in volume, while spot trading has shrunk to just $0.8T. This cryptoquant data highlights the imbalance, suggesting the market is increasingly driven by leverage rather than real demand, a setup that often leads to fragile rallies and higher volatility.
Futures Dominate as Spot Demand Weakens
The latest CEX volume breakdown highlights a clear imbalance in market participation, with derivatives now driving the majority of activity. Total trading volume has cooled significantly, but more importantly, the composition has shifted—perpetual futures account for nearly $3.5T, while spot volumes lag far behind at around $0.8T.
The chart shows that spot volume has been steadily declining since early 2025, indicating reduced long-term investor participation. At the same time, futures volume, after peaking near $10T, is also beginning to trend lower, pointing to a broader slowdown. However, the dominance of derivatives remains intact. This suggests that current market moves are largely fueled by short-term positioning and leverage.
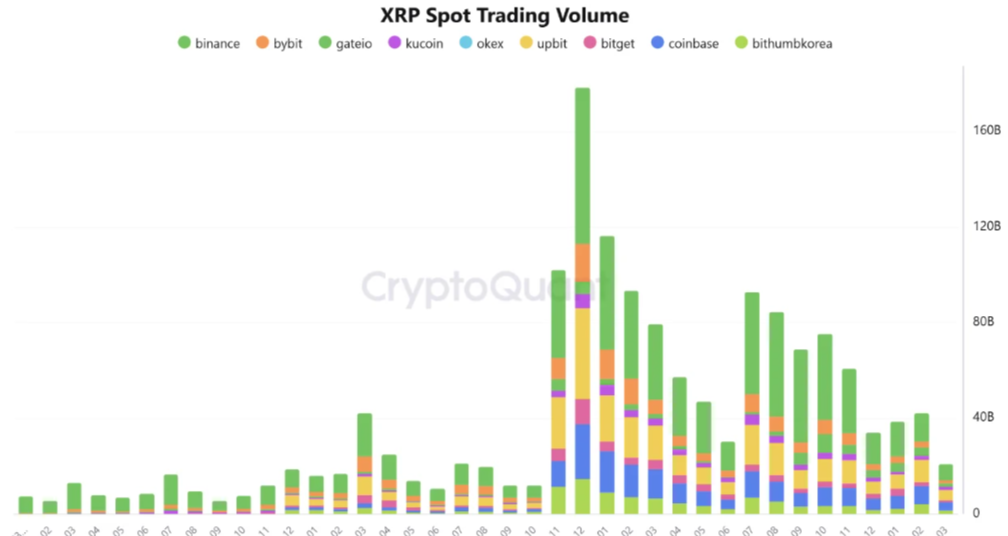
Spot Activity Is Fading Across Exchanges
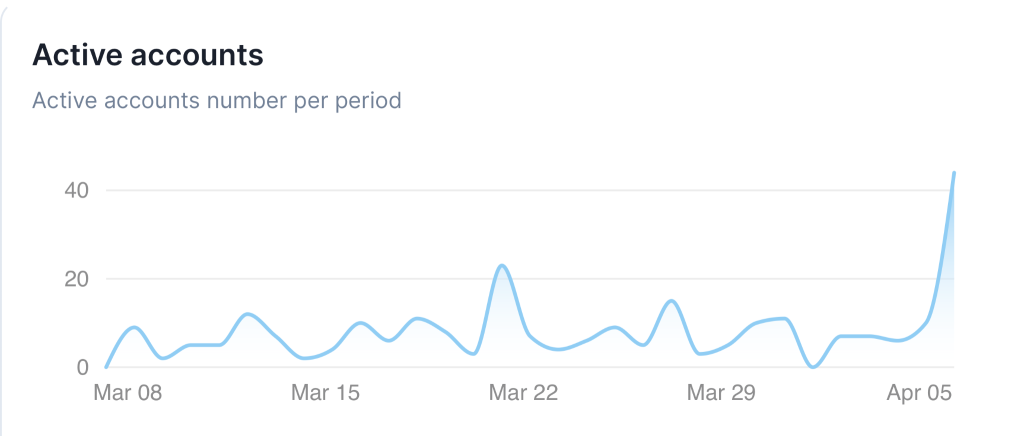
Spot trading volume is clearly trending lower across major exchanges, pointing to a steady decline in real market participation. After strong peaks in late 2024 and 2025, recent data shows a sharp cooldown into 2026, with volumes dropping across the board—even as leading platforms like Binance continue to hold dominance.
Spot volume represents real buying interest, and its decline signals that fresh capital is not entering the market at the same pace. Since the drop is broad-based and not limited to specific exchanges, it indicates an overall pullback in participation rather than a shift in liquidity. As a result, the market becomes more dependent on derivatives, making price action less stable and more prone to sharp reversals.
Futures Activity Is Cooling — But Still Dominant
Futures trading volume is starting to cool after months of elevated activity, reflecting a slowdown in leveraged participation. While volumes remain relatively high compared to historical levels, recent data shows a clear decline across exchanges into 2026, following peaks seen in late 2024 and 2025.
Futures still dominate overall activity, but the drop suggests that leveraged traders are becoming less aggressive. Since derivatives have been driving most of the market movement, this cooling phase indicates reduced speculative pressure. However, with spot demand already weak, the decline in futures activity adds another layer of caution, signaling that both real demand and leveraged momentum are fading together, which can lead to slower trends or sudden volatility.
Exchange Share Is Shifting as Volume Declines
Even as overall spot volume contracts, the distribution of activity across exchanges is gradually changing. Binance continues to dominate, but its share has been trending lower, with other platforms steadily gaining ground. This shift is subtle but consistent over time.
The market isn’t attracting new capital; it’s redistributing existing liquidity across more venues. As dominance spreads out, liquidity becomes less concentrated, which can reduce efficiency in price discovery. In a low-volume environment, this kind of fragmentation often leads to choppier moves and less reliable trends, as no single venue drives clear direction.
Wrapping it Up- Cooling Activity Signals a Fragile Market
The data points to a clear shift: trading activity across CEXs is cooling, and participation is weakening across both spot and derivatives markets. Total volumes have dropped sharply from their late-2025 peaks, while spot demand has shrunk to a fraction of overall activity. At the same time, liquidity is spreading across more exchanges instead of expanding.
This doesn’t necessarily mean the market is about to collapse, but it does signal a less stable environment. With lower spot participation and declining leverage momentum, rallies are likely to face slower follow-through and higher volatility. For sustained upside, the market will need to see spot demand and overall trading activity recover—otherwise, price movements may remain fragile and prone to sharp reversals.
Crypto trades settle instantly, but at the cost of capital efficiency. This forces firms to overcollateralize and limits how far markets can scale, says Cosmos co-founder Ethan Buchman.
Bitcoin miner Cango said it sold 2,000 BTC to pay off debt and cut its BTC production cost by 19% as part of its strategic pivot to energy and AI infrastructure.
Coinbase stock price teased a bullish spike but then hesitated at the worst possible moment. The recent move up toward $189 looked promising, especially coming off that February support zone around $140–$160. That area isn’t random either as it lines up with a two-year-old demand zone. So naturally, buyers showed up.
But let’s not get carried away. The top crypto exchange company’s stock is still restricted by the 50-day EMA as it is still acting like a ceiling, and until that flips, this isn’t a breakout as it’s just another test, because in today’s attempt it didn’t break through. Also, Multiple attempts have already been rejected at this dynamic level, which tells that there’s still supply sitting overhead.
Still, the structure isn’t completely bearish in the short term. Price has been grinding higher with small resets, which usually signals some level of accumulation. The question is whether that’s enough.
Death Cross Still Dominates The Bigger Trend
Now for the uncomfortable part. Back in mid-December 2025, Coinbase stock printed a death cross and it hasn’t exactly invalidated it since. The gap between the moving averages remains wide, which basically screams that bearish momentum hasn’t gone anywhere.
So even though the recent bounce looks nice on the surface, zoom out and the trend still leans heavy to the downside.
Indicators aren’t doing bulls any favors either. OBV is sitting at -45.58 million, well below the zero line. CMF? Negative 0.19. That’s not exactly a flood of capital rushing in but it’s more like cautious dipping of toes.
Accumulation Zone Builds Quietly Below Resistance Levels
But interesting part is that $140–$160 range isn’t just support but it’s turning into an accumulation zone. Price keeps revisiting it, bouncing, and then pushing higher. That kind of behavior usually means someone’s buying… just not loudly.
If COIN price can finally flip the 50-day EMA, there’s a clear path toward $240. That’s roughly a 30% move from the current ~$182 range. Not guaranteed, obviously, but technically clean.
Until then? It’s a waiting game.
Coinbase Expands Globally With New License Approval
Meanwhile, on the fundamentals side, Coinbase isn’t exactly sitting still. The exchange just secured an Australian Financial Services Licence with retail derivatives authorization. Translation: it can now roll out crypto and equity perpetuals in Australia, with options expected later.
That’s a big step toward its “Everything Exchange” ambition. And let’s not forget that Coinbase still holds 15,876 BTC, making it one of the largest corporate holders out there. So yeah, it’s not just a trading platform. It’s deeply tied into the broader crypto ecosystem.
So, if Coinbase stock can reclaim that EMA level, momentum could flip fast. But if it keeps getting rejected, that accumulation zone might get tested again and harder.
Why Coinbase’s Recovery Matters for Ethereum
Investors often look for a “Coinbase token,” but the exchange remains uniquely tied to the Ethereum ecosystem. While Coinbase’s Layer 2 network, Base, is a massive growth driver, it does not have a native token; instead, it utilizes ETH for all gas fees.
Technically, this creates a symbiotic relationship: if the Coinbase stock breaks its 50-day EMA resistance due to increased on-chain activity, it likely signals a surge in Base network usage. Because Base settles on Ethereum, a bullish breakout for COIN often serves as a fundamental tailwind for ETH, driving utility and demand for the asset as the underlying “gas” of Coinbase’s global expansion.
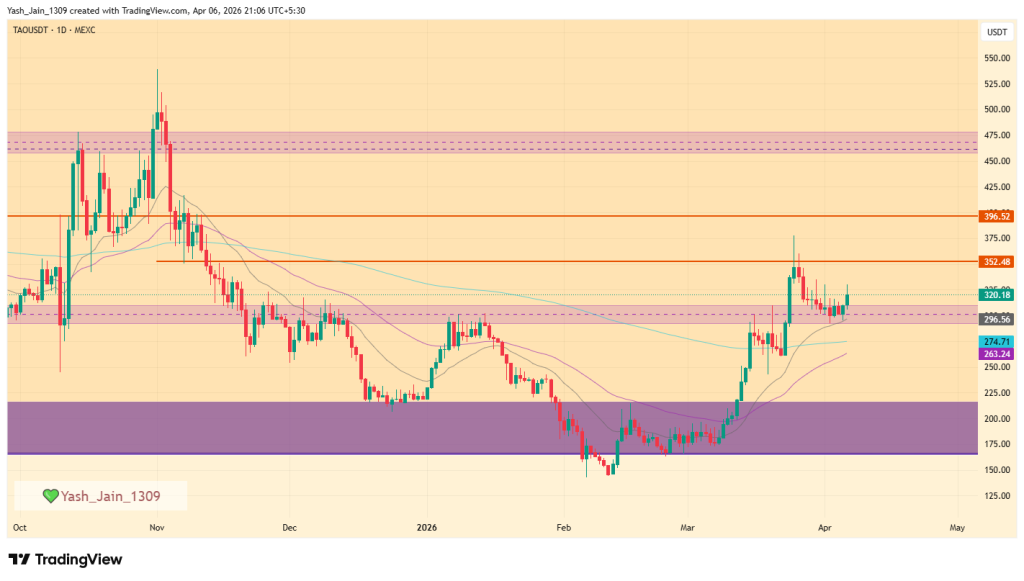
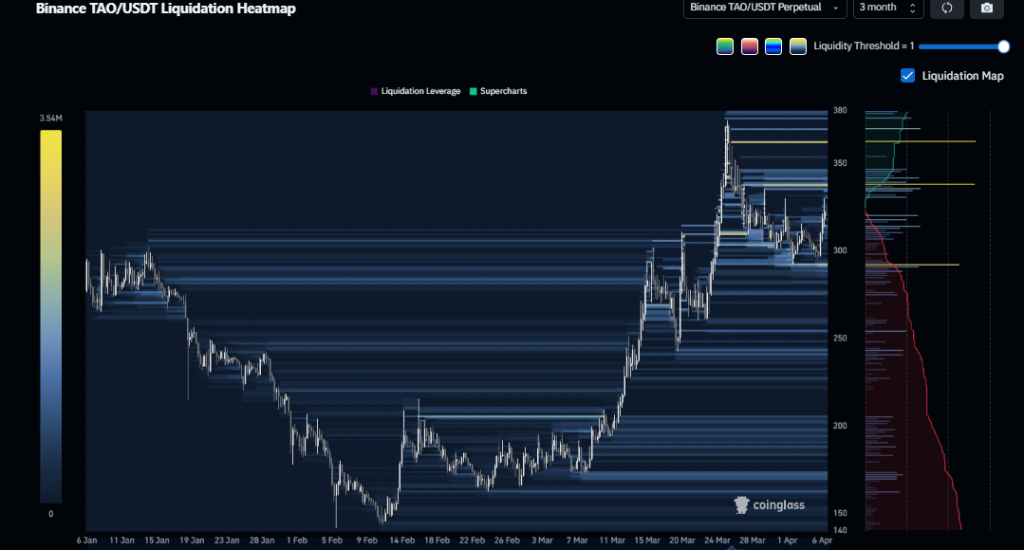
Bittensor (TAO) price posted a strong move over the past few hours, climbing nearly 8% to test a key resistance near $350. However, sellers quickly stepped in, capping the rally and pulling the price back toward $335. While the structure remains clean and momentum appears strong, this is not a confirmed breakout—TAO is still testing a major supply zone, leaving the rally vulnerable.
The key question now is whether bulls can sustain this momentum, as a move toward $400 hinges on a decisive break above this resistance.
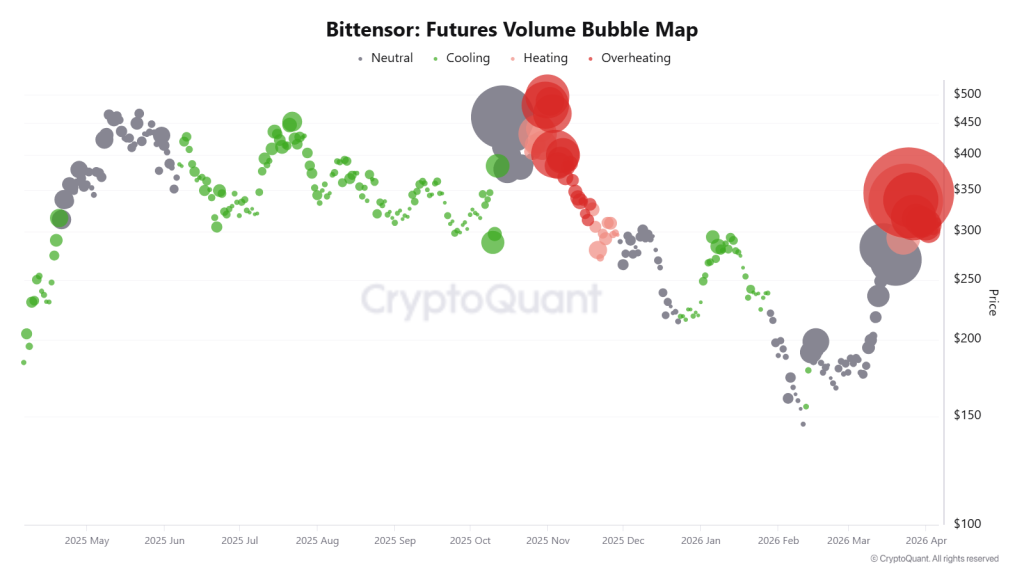
Open Interest Trend Signals Caution
TAO’s Open Interest has surged sharply alongside the recent price rally, highlighting a strong influx of market participation. The metric climbed from roughly $150M to over $550M during the move, reflecting aggressive positioning as the price pushed higher. However, the trend did not sustain, with OI pulling back and stabilizing near $380M–$400M, even as price continues to hold elevated levels.
This divergence is important. While the initial spike confirms strong interest, the decline suggests that positions are now being closed or unwound rather than added. In strong trends, a rising price is typically supported by rising OI. Here, the cooling OI indicates that the rally may have been driven by short covering and leveraged trades, not consistent spot demand. Unless Open Interest begins to expand again with price, the current move risks losing momentum near resistance.
TAO Price Action Approaches Key Supply Zone
Bittensor (TAO) has delivered a strong recovery, climbing from sub-$200 levels to now trade around $335–$340, reclaiming multiple key zones along the way. The price has formed a clear higher low–higher high structure, with consolidation bases around $260 and $300, indicating controlled accumulation rather than a random spike.
However, the rally is now approaching a major resistance zone between $350 and $380, which aligns with a previous breakdown area. This makes it a high-pressure zone where sellers are likely to step in again.
While price action remains constructive, the indicators show a different picture:
CMF remains negative (~ -0.17) → capital outflows persist
MACD is flattening after a bullish crossover → momentum is slowing
Price is rising, but buying pressure is not increasing proportionally
This creates a critical divergence as the structure is bullish, but the underlying strength is weak. In strong rallies, money flow supports price. Here, it doesn’t, which increases the risk of rejection near resistance.
Key Levels to Watch
Immediate Resistance: $350–$360
Breakout Confirmation: Sustained move above $380
Upside Targets: $400 → $468
Immediate Support: $330
Breakdown Level: Below $330
Downside Targets: $300 → $260
TAO at Decision Point—Breakout or Rejection?
Bittensor (TAO) price is testing a high-pressure zone near $350–$360, where momentum needs confirmation. The structure is bullish, but weakening money flow and cooling OI suggest caution. A clean break above $380 can extend the rally toward $400 and $468. However, failure to clear resistance increases the risk of a pullback, with $300 and $260 as key downside levels.
Bittensor’s TAO token jumped 10% past $300 on April 6 after a viral AI agent story proved demand for decentralized compute is real and growing fast, per CoinMarketCap. Most traders have not noticed yet.
These 3 top crypto to buy now are running on different timelines. BNB and TAO hold support with recovery targets months away, while Pepeto at $0.0000001863 packs 150x into a single listing window. The $8.68 million raised so far shows where early capital is going.
Bittensor’s subnet ecosystem now runs over 128 active AI markets pulling in $43 million in Q1 revenue, and Grayscale filed for a TAO ETF with the SEC, per CoinGecko.
BNB holds above $604 with quarterly burns still cutting supply toward a 100 million token cap, plus the Maxwell upgrade boosting scalability across the chain.
Both coins benefit from real growth, but 2% to 3% staking yield is nothing next to what a presale with a confirmed exchange listing can produce.
Which of the 3 Top Crypto to Buy Now Gives the Best Entry in April 2026?
Why Is Pepeto Pulling More Capital Than BNB and TAO Right Now?
When Wall Street packages a coin into a fund for retail, the entry that builds real wealth is already gone. The U.S.-Iran war has pushed Fear and Greed to 11, but every conflict-driven crash in crypto history ended with a sharp bounce. The traders who built fortunes last cycle bought during the panic, not after it. Pepeto sits at that exact point today. The tools work, the war keeps the price low, but the cost vanishes the moment the Binance listing goes live.
The contract scanner catches exploit code and honeypot traps before your capital gets close. PepetoSwap handles trades at zero fees across ETH, BNB Chain, and Solana, and the bridge sends tokens between networks at zero gas through a lock-and-mint system that shields wallet data. SolidProof and Coinsult both completed audits, and a former Binance executive leads the exchange build.
A trader who sees BNB’s 2x from $604 and knows that it will not change a portfolio puts $7,800 into Pepeto at $0.0000001863 instead, grabbing over 41 billion tokens. The cofounder who took the original Pepe coin from zero to an $11 billion market cap on a 420 trillion supply with no working tools is building every layer of this exchange. Pepe never had a trading platform, a bridge, or a scanner. Pepeto ships all three, and hitting Pepe’s old cap from today’s presale cost maps to over 150x, which turns $7,800 into over $1.1 million.
The listing shuts the presale window permanently. Every cycle, the entries that created millionaires shared one trait: a live product, a fraction-of-a-cent price, and a trigger the crowd could not ignore. Pepeto at $0.0000001863 with a confirmed listing is that setup, and 186% APY staking grows positions daily while the window holds.
Is BNB a Good Buy at $604 in April 2026?
BNB trades at $604 as of April 8, steady while most altcoins bleed under Iran war pressure, per CoinMarketCap.
The Maxwell upgrade and burn schedule show strength, but a 2x from $604 needs the full bull run to play out.
Can Bittensor Break $400 With AI Demand at Record Levels?
TAO sits at $311 as of April 8, down 59% from its $757 peak, per CoinGecko. Grayscale’s ETF filing and 128 active subnets prove real value, but a 3x from $311 still needs months of steady buying. TAO is a long-term AI play, not the kind of entry that changes a portfolio in one move.
Conclusion
These 3 top cryptos to buy now fill different roles. BNB and TAO are long-horizon bets tied to when the Iran crisis fades and capital rotates back, while Pepeto is the presale that closes the gap between entry and listing in weeks. War fear will pass, the Fed will cut, and crypto will bounce. The wallets filling this presale already see that. The exchange tools fix the one issue every meme coin has faced: keeping volume alive past launch day.
Viral reach is the real engine. Shiba Inu gave early holders over 25,000% on pure hype with nothing built behind it. Pepeto carries stronger momentum, the cofounder who built Pepe to $11 billion, and a Binance listing ready to light the fuse. BNB can hold $604 and TAO can push for an ETF, but neither converts $7,800 into $1.1 million. The Pepeto official website is where that entry stays open.
How does Pepeto compare to BNB and Bittensor among the 3 top cryptos to buy now?
Pepeto maps 150x from $0.0000001863 to Pepe’s old cap with live exchange tools. BNB and TAO need full recoveries from $604 and $311 for meaningful gains.
What are the 3 top cryptos to buy now in April 2026?
Pepeto, BNB, and Bittensor top the list. Pepeto targets 150x from presale, BNB runs quarterly burns, and TAO’s AI subnets pulled $43 million in Q1 revenue.
Polygon Labs is in early talks to raise up to $100 million to scale a regulated stablecoin payments business, shifting its focus from generic blockchain support to real‑world money movement that boosts on‑chain transaction volume. The push builds on its recent acquisitions of licensed U.S. payment and wallet firms Coinme and Sequence, aiming to integrate fiat on‑ and off‑ramps, wallets, and settlement infrastructure into a full payments stack. This strategy positions Polygon to compete with traditional players like Stripe and expand blockchain use for everyday payments.
Iran is proposing a plan to charge about $1 per barrel in cryptocurrency or other digital assets like stablecoins and yuan for oil tankers to pass through the Strait of Hormuz during a two‑week ceasefire deal with the United States, according to reports. Fully loaded tankers must submit cargo and vessel details before payment, while empty ships may be exempt. Officials say the measure is intended to allow Iran to monitor ship movements and prevent weapons transfers, marking an unusual use of crypto in global oil transit.
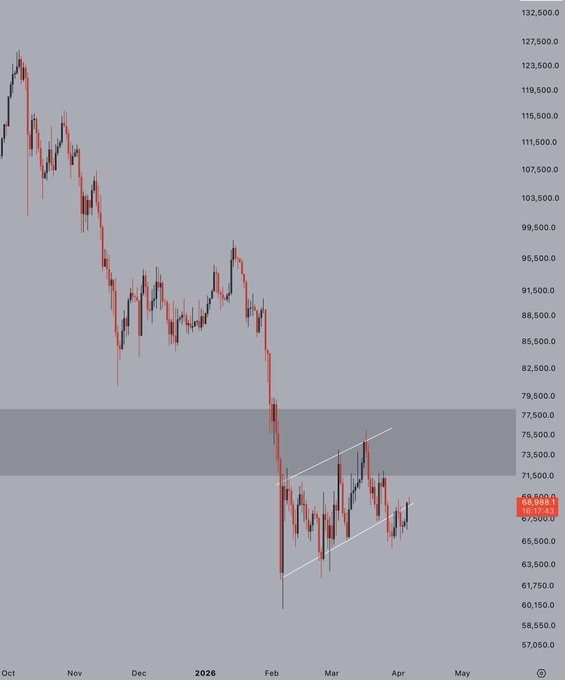
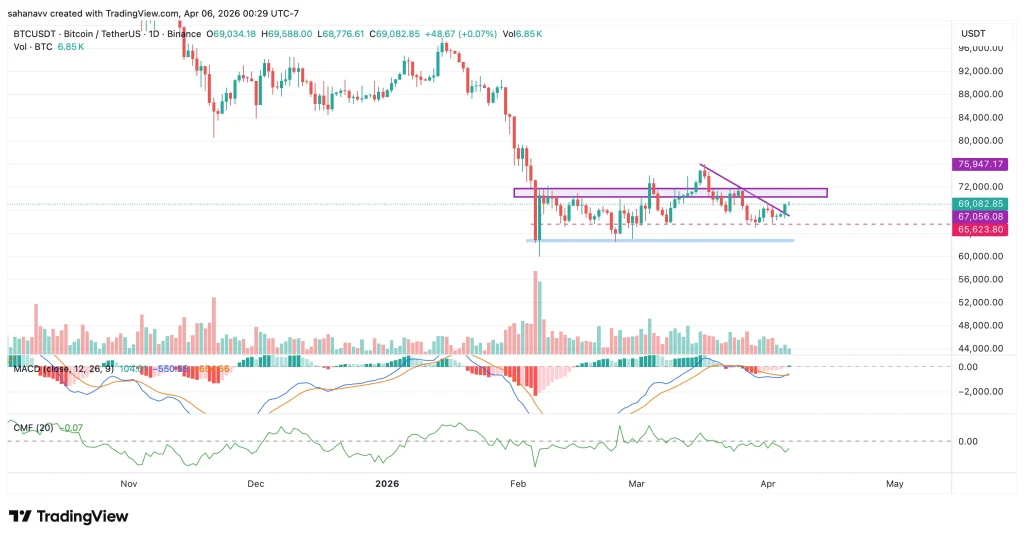
Crypto markets are entering a pivotal phase as macro signals begin to diverge, with Bitcoin flashing breakout. Bitcoin is showing early signs of a technical breakout, pushing above important levels after a period of heavy bearish sentiment.
According to Gareth Soloway, the next immediate test sits around the $75,000–$76,000 range. A successful move beyond that could open the door toward $80,000–$85,000 in the near term.
Bearish sentiment has been building across retail markets, with many traders expecting a deeper correction. Historically, such crowded positioning tends to trigger moves in the opposite direction.
Macro Still Driving the Market
Unlike earlier crypto cycles driven largely by internal narratives, the current environment is deeply tied to macro forces.
Despite geopolitical threats, crude has failed to break higher and is instead showing signs of weakness, trading below recent highs. In other words, Bitcoin’s breakout case may depend less on crypto-specific catalysts and more on whether oil continues to decline.
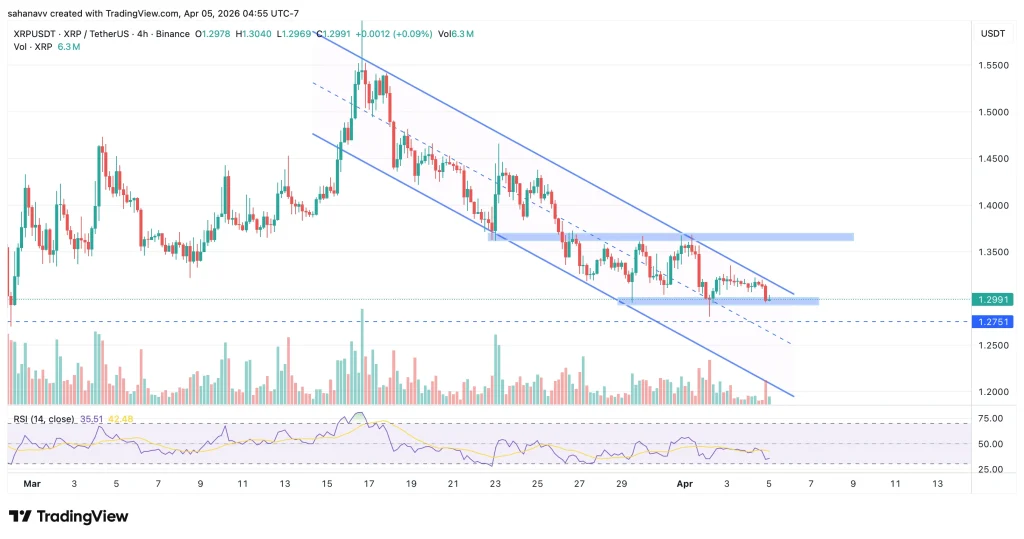
Ethereum and XRP: Following, Not Leading
While Bitcoin is setting the tone, Ethereum and XRP are likely to follow broader market direction rather than lead it.
Ethereum, often viewed as a proxy for risk appetite within crypto, could benefit from improving liquidity conditions if macro pressure eases. However, without a clear independent catalyst, its upside may remain tied to Bitcoin’s trajectory.
XRP, meanwhile, continues to trade within a more narrative-driven framework, influenced by regulatory developments and ecosystem-specific momentum. In the short term, it is expected to move in line with broader market sentiment rather than break out independently.
Sentiment Shift or Setup?
On one hand, Bitcoin is breaking higher. On the other hand, macro uncertainty hasn’t fully cleared.
That creates a two-layered market:
Short term: Momentum-driven upside fueled by positioning squeeze
Medium term: Dependent on oil, inflation and rate expectations
If oil resumes its decline and geopolitical tensions stabilize, crypto could extend gains. But if macro conditions reverse, particularly through an oil spike, the rally could quickly stall.
Expanding regulated crypto derivatives access in a growing financial hub
WhiteBIT, the largest European cryptocurrency exchange by traffic, has obtained a broker license from the National Bank of Georgia (NBG) through its local entity, WhiteBIT Broker. With this authorization, the company will introduce crypto derivatives trading, including perpetual futures, in the Georgian market.
WhiteBIT already serves Georgian users with spot trading through a separate entity. The newly licensed WhiteBIT Broker will focus on providing regulated access to derivatives and other broker-led financial instruments, also accessible through whitebit.ge. Georgian traders and investors will gain access to a compliant platform designed to support derivatives trading with a focus on transparency, capital protection, and operational reliability.
The license, secured in collaboration with consulting firm Clarsen, marks a significant step in WhiteBIT’s expansion across regulated markets and supports the development of Georgia’s digital asset ecosystem. The country has positioned itself as an emerging crypto hub, supported by a favourable regulatory framework and increasing adoption. Based on data from 2025 Global Crypto Adoption Index by Chainalysis, Georgia is a top-tier country for cryptocurrency adoption, ranking 3rd globally in some assessments when adjusted for population size.
WhiteBIT is recognized for its focus on security, compliance, and infrastructure reliability. Approximately 96% of user assets are stored in cold wallets, while platform operations are protected by multi-layered security systems and independent audits. The exchange holds the highest Cryptocurrency Security Standard certification (CCSS Level 3) and maintains an AAA security rating from CER.live, where it is ranked among the safest global crypto exchanges.
The expansion introduces regulated derivatives trading to the Georgian market, contributing to broader access to compliant crypto products and reinforcing the country’s position as an emerging center for financial innovation in the region.
AI trading apps reshape investing in 2026 as beginners adopt automated stock and crypto strategies. In 2026, the world of investing is being transformed by artificial intelligence (AI). Whether someone is looking to trade stocks or cryptocurrencies, AI-powered trading apps…
U.S. stocks ripped higher as an Iran–US ceasefire plan sparked a tech‑ and China‑led risk‑on rally, with the Dow up 2.76%, the S&P 500 up 2.64% and the Nasdaq up 3.5%. U.S. stocks opened dramatically higher on Wednesday as news…
Global markets are staging a sharp relief rally as signs of an Iran‑US ceasefire cool fears of an extended Middle East conflict, with the Russell 2000 Index surging 3.4% to its highest level in more than a month and Bitcoin…
Polymarket traders see the Israel–Hezbollah front staying hot for months despite a two-week US–Iran ceasefire, turning ceasefire wording and airstrikes into tradable risk. Polymarket traders are betting that the Israel–Hezbollah front will remain active for months, even as Washington and…
Something’s brewing and no, it’s not retail hype this time. Whale transactions are suddenly exploding across multiple altcoins, and the timing? Suspiciously perfect.
Over the past week, whale transactions those chunky $100K+ transfers have surged across several mid-to-large cap assets. Data shows triple-digit spikes almost everywhere you look. And while prices haven’t exactly gone vertical yet, the positioning tells a different story. Quiet. Calculated. Intentional.
Whale Transactions Explode Across Major Altcoins
Let’s start with the raw numbers, because they’re hard to ignore. Cronos (CRO) saw a +650% jump in whale transactions. 1Inch (1INCH) followed closely at +600%, while Injective (INJ) posted a +400% increase. Vision (VSN), OriginTrail (TRAC), Immutable X (IMX), Floki (FLOKI), and Fluid (FLUID) all joined the party with gains ranging from +137% to +300%.
Even USDC clocked in with a massive +1097% spike but let’s be real, stablecoins doing stablecoin things doesn’t exactly scream opportunity.
What does matter is where the “smart money” is flowing. And right now, it’s flowing aggressively into altcoins that have been… well, mostly ignored lately.
Prices Stalling While Whales Keep Buying
Here’s where things get interesting. Despite all this activity, most of these assets haven’t pumped. In fact, many of them have pulled back slightly over the last 24 hours.
That disconnect? It’s classic. Whale transactions rising while prices sit near support levels often signals accumulation not distribution. Big players don’t chase green candles. They build positions when things are quiet, boring, and slightly uncomfortable.
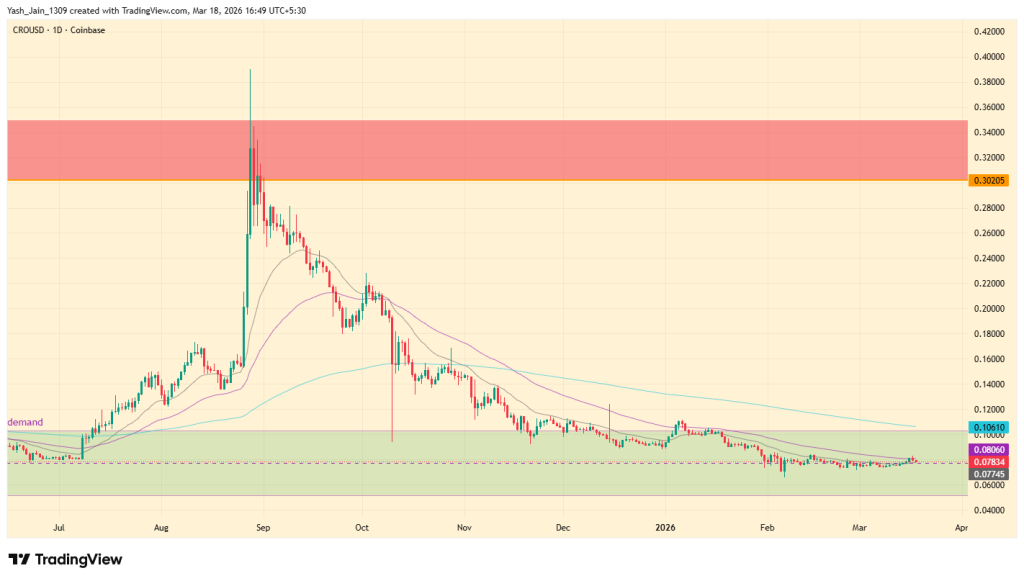
Take CRO, hovering near $0.0709 support. Or 1INCH testing $0.093. INJ is holding $2.99 like it actually means something. Across the board, these tokens are sitting near key S1 levels, not breaking down but not breaking out either.
Support Levels Holding As Accumulation Builds Quietly
Zoom out, and the pattern becomes clearer. VSN is still maintaining a bullish structure despite minor pullbacks. TRAC is stuck in a tight range with volume drying up. IMX is trying to reclaim $0.142 to avoid slipping lower, while FLOKI is hovering at a “decide now” zone after a prolonged downtrend.
And then there’s FLUID, quietly bouncing off $1.45 like someone’s defending it. Put it all together, and you’ve got a market sitting at support… while whale transactions surge in the background.
So, what’s next? Well, when whale transactions spike like this, volatility usually follows. Not always immediately. But soon enough.
If these support levels hold, don’t be surprised if these same “boring” charts start moving fast. And if they don’t? Then all that whale activity might’ve just been early positioning for something bigger just not in the direction most people expect. Either way, whale transactions don’t spike like this for no reason.
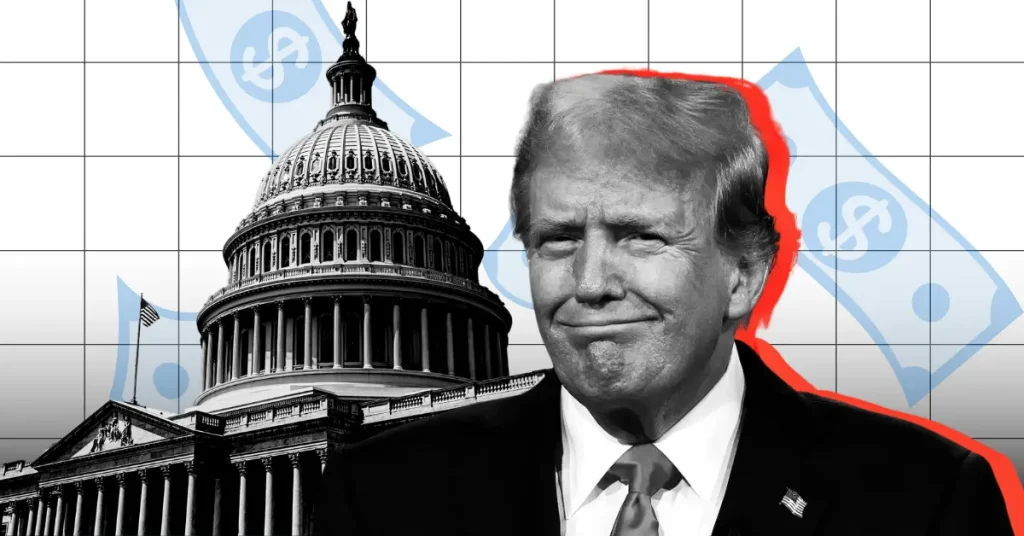
Donald J. Trump said the U.S. would work closely with Iran, stop it from producing nuclear material, and closely monitor the situation, possibly easing sanctions in return. He also talks about a major political shift in Iran.
Speaking about political changes in Iran, he said, “We will be working closely with Iran to make sure there is no nuclear material being developed, that everything is properly cleaned up, and what follows will be a very productive regime change.”
Donald Trump has drawn attention across financial markets.
He warned of strict trade action, stating, “Any Country supplying Military Weapons to Iran will be immediately tariffed, on any and all goods sold to the United States of America, 50%, effective immediately. There will be no exclusions or exemptions!”
The move above $71,000 is being seen as an important technical development for Bitcoin. Analysts note that holding the $69,500–$70,000 range as support could help maintain the current upward trend. A continued push higher may open the path toward the $74,000–$75,000 region in the near term.
In the short term, market participants are closely watching a few important price zones. There is visible buying interest around $73,000–$73,500, which could act as the next test for upward movement.
On the downside, areas below $71,000 may still attract price action if the market pulls back briefly before continuing higher.
A recent move toward $72,000 has already met early weekly expectations, and traders are now looking for confirmation of continued strength or a short pause before the next leg upward.
Altcoins and AI Tokens Back in Focus
As Bitcoin stabilizes, attention is gradually shifting toward alternative cryptocurrencies. According to the analyst, Van de Poppe, Projects linked to artificial intelligence, such as Bittensor and NEAR Protocol, are seeing renewed interest after brief pullbacks.
These assets have performed well in recent months, and analysts suggest they could continue to gain if Bitcoin maintains its upward movement. Historically, smaller cryptocurrencies tend to rise faster during strong market phases.
Poppe Says “As long as Bitcoin continues to turn upwards, I would suggest that we’re going to see a strong continuation within the AI <> Crypto framework.”
The positive trend is also supported by strength in traditional markets, especially the Nasdaq Composite, which is approaching higher levels. Cryptocurrencies often move in line with technology stocks, so continued gains in equities could help sustain momentum in digital assets.
White House economists have pushed back against claims that stablecoin rewards could damage the traditional banking system. A new report from the Council of Economic Advisers says banning stablecoin yields would have only a minimal impact on bank lending, suggesting fears from banking groups may be overstated.
Stablecoin Rewards Unlikely to Drain Bank Deposits
According to a White House report titled “Effects of Stablecoin Yield Prohibition on Bank Lending,” banning rewards on stablecoin balances would have only a small impact on banks.
It would increase lending by just 0.02%, or about $2.1 billion, which is minimal compared to the overall banking system.
The analysis also found that most of this increase would benefit large banks. About 76% of the additional lending would come from major institutions, while community banks would account for the remaining 24%.
In dollar terms, smaller banks would add around $500 million in loans, representing only a 0.026% rise.
BREAKING:
White House economists say stablecoin rewards won’t hurt banks.
Even banning yields would only increase lending by about 0.02%, per Bloomberg. pic.twitter.com/Y98SnceENd
Overall, the findings suggest that stablecoin rewards are unlikely to significantly drain deposits from banks, easing major concerns.
Report Counters Banking Industry Warnings
Some banking groups previously warned that stablecoins offering rewards could lead to major deposit outflows. One estimate suggested banks could lose up to $1.3 trillion in deposits and $850 billion in loans.
However, the White House economists said such outcomes appear unlikely. Even under extreme assumptions, the model showed total additional bank lending reaching $531 billion, equal to about a 4.4% increase. But this scenario would require the stablecoin market to grow to six times its current size, alongside major changes to monetary policy.
The report noted that these conditions are unrealistic, making the risk to banks limited.
Consumer Benefits Could Be Lost With a Ban
Economists also warned that banning stablecoin rewards could harm users. Stablecoin programs often offer competitive returns compared to traditional bank deposits.
For example, some platforms currently offer around 3.5% rewards on stablecoin balances. Removing such incentives could reduce competition and limit consumer choice.
The report concluded that prohibiting yields would do little to protect bank lending while eliminating potential benefits for users.
After more than 15 years and countless investigations, the identity of Satoshi Nakamoto remains unknown. Now the New York Times thinks it has the answer, and the man they are pointing at is British cryptographer Adam Back.
Well, Adam Back has publicly denied claims saying he is not Satoshi and that similarities in early research and writings are being misinterpreted.
NYT Finds 3 Key Similarities Linking Adam Back to Satoshi
The investigation was led by John Carreyrou, the NYT journalist famous for exposing the Theranos fraud, alongside AI projects editor Dylan Freedman. Researchers spent over a year analyzing 134,308 posts from 620 candidates on major cryptography mailing lists from 1992 to 2008.
Using linguistic analysis, the team found strong similarities between Back’s writing and Satoshi’s messages. One test identified 325 hyphenation quirks in Satoshi’s writing, with Back sharing 67 of them.
Bitcoin’s founder, Satoshi Nakamoto, has remained hidden for 17 years. A trail of clues — and a year of digging by our reporter, John Carreyrou — led us to a 55-year-old computer scientist in El Salvador named Adam Back. https://t.co/s6Jy00IDdk
The second closest match had only 38, which narrowed the search significantly.
Secondly, both used British spellings, specific hyphenation patterns, double spacing between sentences, and alternated terms like “e-mail” and “email.
Lastly, the behavioral timeline added another layer. Back was consistently present in electronic cash discussions for over a decade. Then, when Satoshi announced Bitcoin in late 2008, Back went completely silent.
Adam Back Responds: “I’m Not Satoshi”
Responding to the Carreyrou report, Back rejected the claim and said the connections are mostly coincidental. He explained that he was active in cryptography discussions since the early 1990s, which naturally created an overlap with Bitcoin ideas.
“I’m not saying I’m good with words, but I sure did a lot of yakking on these lists, actually.”
Because he was one of the most active contributors on early mailing lists, his writing appears more often in any analysis, but this does not mean he created Bitcoin.
On technical similarities, Back said many experts were working on digital cash ideas at the same time, so shared concepts are not proof of identity. He also made it clear that he does not know who Satoshi is.
According to Back, this mystery is actually beneficial, as it keeps Bitcoin independent and not tied to any single individual.
The “We Are All Satoshi” Clarification
One old tweet from Adam Back said, “We Are All Satoshi.” Some interpreted the line as a hidden admission. However, he clarified that the statement was taken out of context.
According to Back, the phrase referred to a short film titled “Block 170, The First Transaction.” The film featured a stone engraved with “We Are All Satoshi” as part of its artistic concept.
He said his tweet was simply referencing the film, not suggesting any personal connection.
So Who Is Satoshi Nakamoto?
For over 15 years, the identity of Bitcoin’s creator has been the biggest mystery in the history of finance. Even one of the most detailed efforts by a major global newspaper has not provided a definitive answer.
Lastly, Back said he does not know who Satoshi is and believes that anonymity is actually beneficial. He noted that Bitcoin being founderless helps it be viewed as a new asset class.
Render is emerging as one of the strongest performers in today’s crypto rally, surging over 10% to trade near $2.07, as bullish momentum spreads across the broader market. The move is being driven by a combination of macro tailwinds and project-specific catalysts. With Bitcoin pushing higher and liquidity rotating into high-growth narratives, AI-focused tokens like RNDR are attracting aggressive inflows.
With RENDER price now pressing against a major resistance zone, the market focus is shifting quickly: Is RENDER preparing for a breakout toward $2.50 next?
What’s Driving the RENDER Price Rally?
Render’s current momentum is rooted in tangible ecosystem growth, not just sentiment. A major catalyst comes from the approval of RNP-023 governance proposal, which adds ~60,000 GPUs to the network via decentralized providers. This significantly expands Render’s compute capacity at a time when global AI demand is surging.
At the same time, on-chain and network metrics confirm real adoption:
Over 71.4 million frames processed
More than 5,700 active GPU nodes
AI workloads now approaching ~40% of total network activity
This indicates that Render is transitioning from a narrative-driven asset to a usage-driven infrastructure protocol. Adding to the bullish case, the protocol has burned over 1.24 million RNDR tokens, tightening supply through its burn-and-mint equilibrium model, creating a supply-demand imbalance in favor of price appreciation.
Further strengthening sentiment, upcoming events like RenderCon 2026 and enterprise-level integrations continue to position the network at the center of the AI and decentralized compute narrative.
Futures Market Data Shows Strong Bullish Positioning
Render’s derivatives data confirms that the rally is supported by active market participation. Futures volume has surged by over 50%, while open interest has increased nearly 20%, indicating that traders are entering fresh positions. This alignment of rising price and open interest signals new long exposure, rather than short covering.
At the same time, funding rates remain stable, suggesting the market is not overheated, and the trend still has room to extend. This positioning reflects a continuation setup, with momentum supported by sustained participation.
Render Price Analysis: Breakout Setup Hints a Move Toward $2.50 Next
Render price has broken above its descending trendline resistance, confirming a shift from consolidation into expansion. Price is now testing the 200-day EMA, a key level that often determines trend continuation. The structure has already turned bullish. RNDR formed a double bottom near $1.20, rebounded from that demand zone, and has now printed a higher high, confirming a clear uptrend.
This move reflects accumulation followed by expansion, with buyers stepping in consistently and absorbing previous sell pressure. If RNDR sustains above the breakout zone and reclaims the 200 EMA, the next move is likely toward $2.40–$2.50, where the next major resistance lies. On the downside, $1.80–$1.85 remains the key support zone. Holding this level keeps the bullish structure intact.
RENDER Price Outlook
Render has transitioned from accumulation into a high-conviction expansion phase, supported by both fundamental growth and derivatives strength. As long as momentum holds and key levels are sustained, Render price remains positioned for a move toward $2.50, with further upside dependent on continuation of the AI-driven narrative.
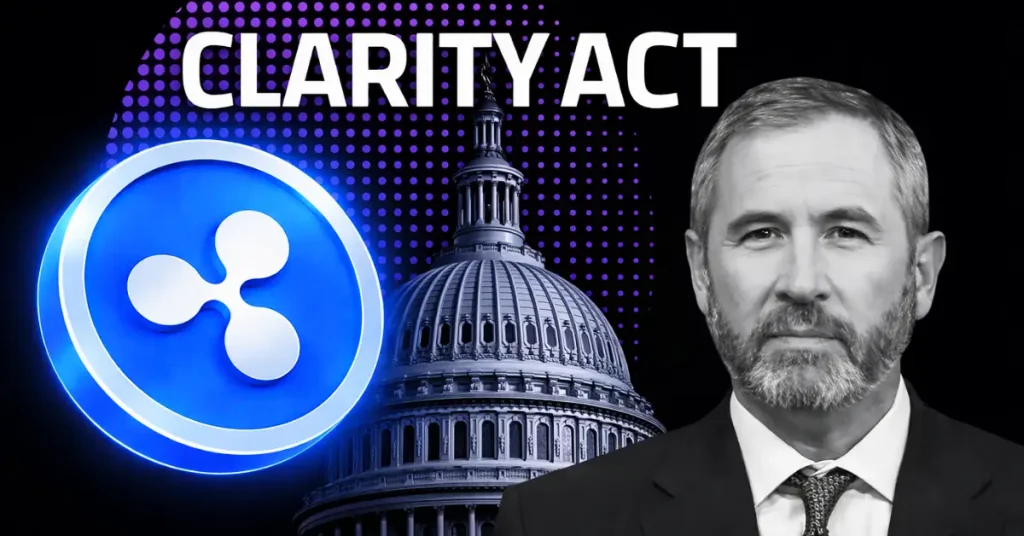
The long-stalled push to define how the U.S. regulates crypto markets is moving back into focus, with lawmakers hinting that behind-the-scenes coordination between the House and Senate is still very much alive.
In a conversation with journalist Eleanor Terrett, House Financial Services Chairman French Hill struck a pragmatic tone on the outlook for the “Clarity” market structure bill, framing the next few weeks as a critical window for Senate action.
Senate Moves First—Then the House
The immediate attention is on the Senate, where lawmakers are preparing to take the next formal step. A markup in the Senate Banking Committee is tentatively expected by the end of April, with floor consideration potentially landing in May or slipping later depending on scheduling pressures.
Hill made clear the House is, for now, in a wait-and-sync mode. The strategy: let the Senate finish shaping its version, then move quickly to align both chambers.
“We’ve spent years working this across both sides of the Hill,” Hill said, pointing to sustained staff-level negotiations that have quietly stitched together the current framework.
Not a Fresh Start, A Continuation
Unlike many bills that restart with each political shift, the Clarity effort is being treated as cumulative. The current Senate draft, released earlier this year, is not seen as a competing vision but rather an iteration.
Hill described House Republicans as “open-minded” toward the draft, explaining it already reflects several elements from the House-passed version.
Bipartisan Backbone Still Holding
Even after a bruising stretch of partisan fights in Congress, crypto regulation remains one of the few areas where cross-party alignment hasn’t fractured.
Hill pointed directly to post-FTX momentum as the glue holding that coalition together. The fallout from the exchange collapse forced both Democrats and Republicans into the same conversation about how to set rules without choking innovation.
If It Slips, It Doesn’t Die
Still, the timeline is tight. If the Senate drags its feet or negotiations stretch out, the bill could miss the current legislative window.
Hill’s message? That’s not a dealbreaker. Rather than framing it as a failure, he cast it as a delay—with multiple fallback paths already in play, including a lame-duck push after the elections or a reset early next year.
For now, the debate isn’t about whether the U.S. will regulate crypto markets—it’s about when. He dismissed worst-case scenarios and leaned into the idea that the legislative process, while slow, is still trending in the right direction.
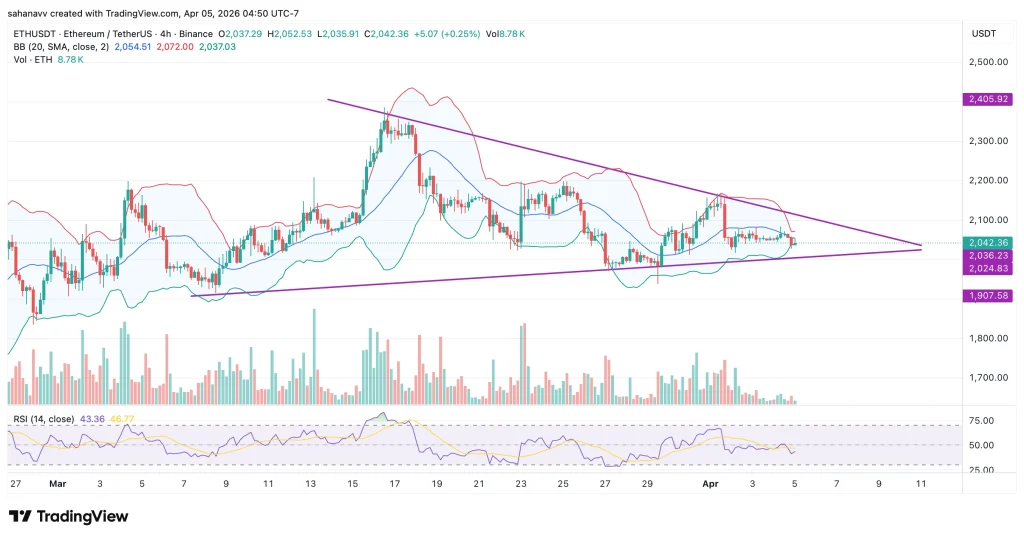
The Bitcoin price has reclaimed the key $71,000 resistance, while the Ethereum price is pushing toward $2,250, signaling renewed strength across the crypto market. The rally comes as a two-week US–Iran ceasefire sparked a risk-on shift, with crude oil dropping 5–6% and over $130 billion flowing back into crypto, boosting investor confidence. Altcoins have followed, with Zcash surging over 25% in the move.
However, despite the breakout, BTC and ETH have yet to firmly hold these levels—keeping the risk of a short-term correction in play.
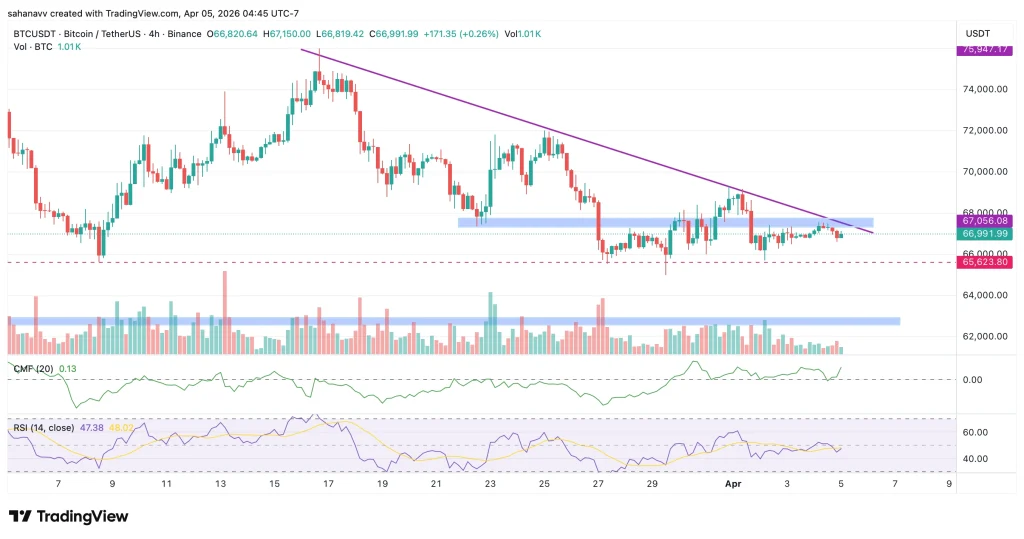
Bitcoin Faces First Real Test After $71K Reclaim
While Bitcoin has pushed back above $71,000 on macro-driven momentum, the chart shows this move is now colliding with a critical supply zone between $70,500 and $71,700. This area has acted as resistance multiple times, and the price is once again testing it after breaking out of a short-term symmetrical triangle pattern.
The breakout from the triangle suggests short-term bullish momentum, supported by RSI climbing near 58 and CMF turning slightly positive, indicating mild capital inflows. However, the structure still reflects hesitation. Price is yet to deliver a strong follow-through candle above this resistance, which keeps the breakout vulnerable. The zone around $71K is not just psychological—it’s a high-liquidity region where sellers have previously stepped in, making this a decisive level.
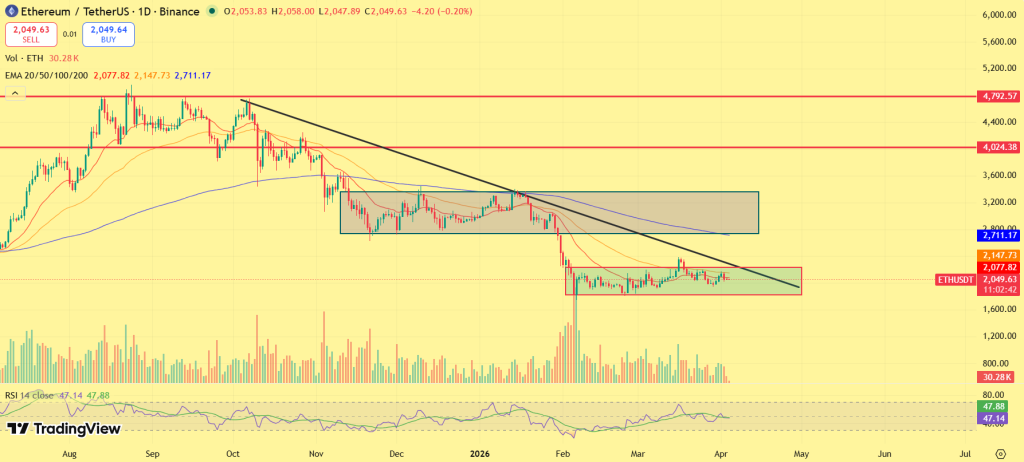
Ethereum Approaches Key Resistance After Rebound from Strong Base
As Bitcoin tests its breakout, Ethereum is following with a steady climb toward the $2,200–$2,250 resistance zone. The chart shows ETH recovering from a well-defined base near $1,950–$2,000, forming a series of higher lows within a rising channel. This reflects controlled accumulation rather than a sharp spike, keeping the structure relatively stable.
However, ETH is now approaching the upper boundary of the channel, where previous rallies have slowed. Momentum indicators support the move—RSI is near 60, showing strength without being overbought, while CMF has surged to ~0.64, indicating strong capital inflows. Despite this, price is still trading below a broader descending trendline, meaning the larger trend has not fully flipped bullish yet.
The Bottom Line: Momentum Is Back — But It Still Needs Confirmation
The crypto market has clearly flipped into a risk-on phase, with Bitcoin reclaiming $71K and Ethereum pushing toward $2,250. Momentum is strong, liquidity has returned, and altcoins are reacting positively — all signs of a healthy short-term expansion. However, this rally is still reaction-driven, not structure-confirmed.
For the bullish momentum to sustain, Bitcoin must hold above $71K–$72K, and Ethereum needs to flip $2,300 into support. If these levels are secured, the market can extend higher, with BTC targeting $75K+ and ETH moving toward $2,500–$2,600. But if price fails to hold these breakouts, the current move risks turning into a short-term relief rally, with a pullback likely toward $66K for BTC and $2,000 for ETH.
The momentum is real — but it’s not proven yet. The next few sessions will decide whether this is the start of a sustained uptrend… or just another macro-driven spike.
BlackRock ETF wallets moved $49m in BTC and ETH into Coinbase Prime, extending a months‑long pattern that turns ETF flows into a live gauge of institutional positioning. BlackRock moved 8,513 ETH and 416.654 BTC, worth roughly $49 million in total,…
Polygon Labs is seeking up to $100m to cement its pivot from generic L2 infra to a regulated stablecoin payments stack built around Coinme, Sequence and its Open Money Stack. Polygon Labs is seeking up to $100 million in fresh…
Thailand’s SEC plans to drag hidden funders of crypto firms into its major‑shareholder regime, tightening AML rules even as it opens the door to Bitcoin‑linked derivatives and ETFs. Thailand’s Securities and Exchange Commission (SEC) is preparing new rules that would…
Polymarket has completed its all‑stock acquisition of DeFi startup Brahma, pulling in its smart account stack to speed execution, deepen liquidity, and defend share as prediction markets explode. Polymarket has finalized the acquisition of DeFi infrastructure company Brahma, fully integrating…
Pharos Network raises $44m to build institutional RWA rails across Asia and beyond, pushing its EVM Layer 1 toward a near‑$1b valuation. Layer 1 blockchain Pharos Network has raised $44 million in a Series A round to build institutional-grade infrastructure…
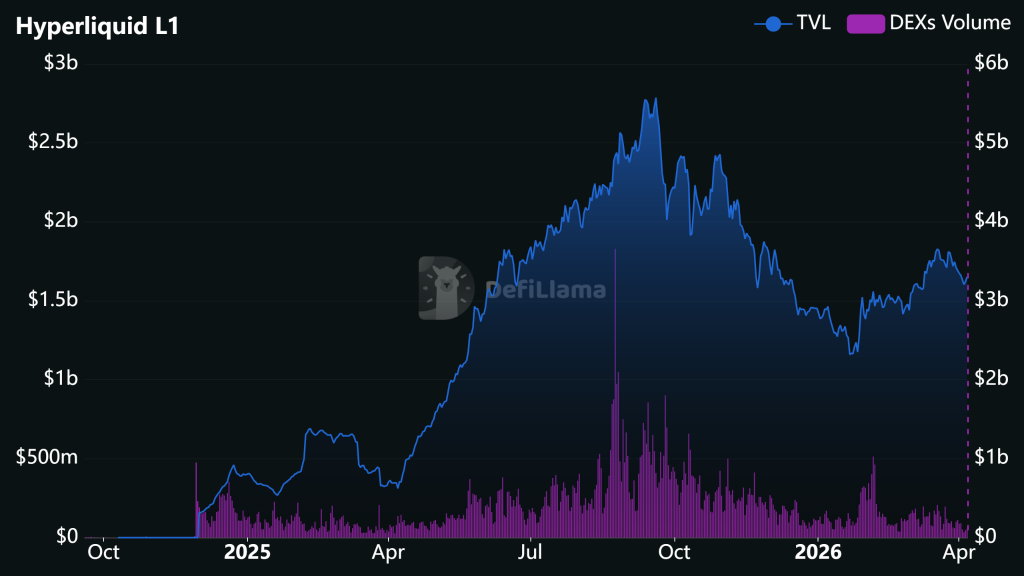
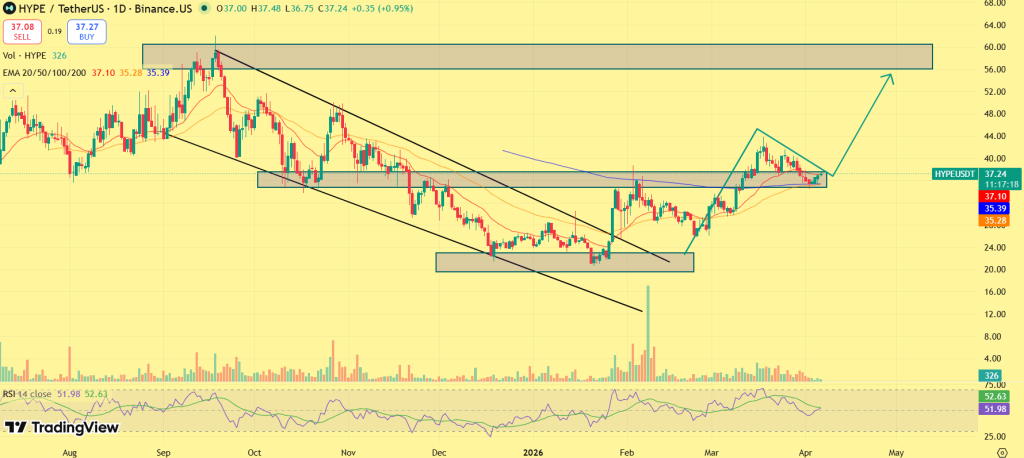
Hyperliquid price rallied 10% to $39 on Wednesday as reports of a temporary ceasefire in the ongoing U.S.-Iran war eased investor nerves. According to data from crypto.news, Hyperliquid (HYPE) price rose to an intraday high of $39.5 on Wednesday, April…
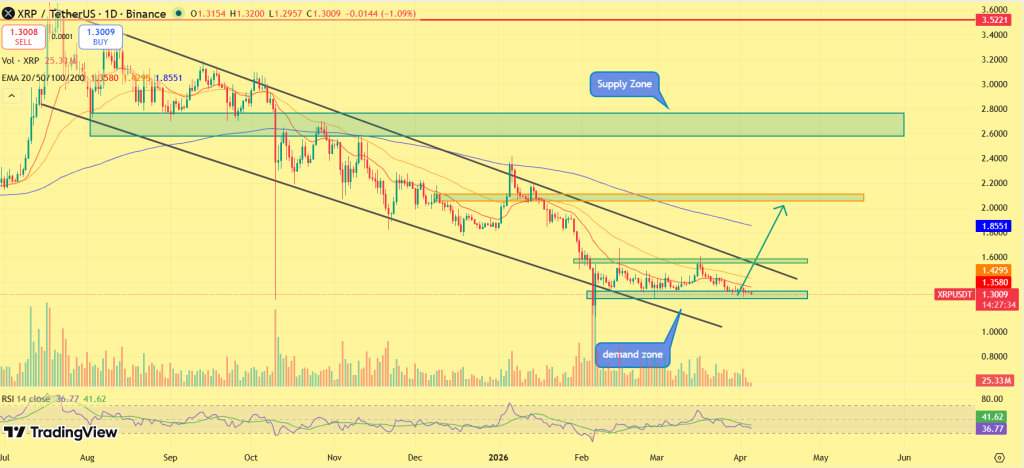
Every crypto cycle has its moment of wild predictions. For XRP, that moment seems to be back. This time, the number doing the rounds isn’t $5 or even $100. It’s $1,700, and according to some corners of the internet, it could happen in just three months.
“There’s No Scenario For This”
Not everyone is convinced. Crypto analyst ChartNerd has poured cold water on the $1,700 narrative, calling it unrealistic, especially within a 90-day window.
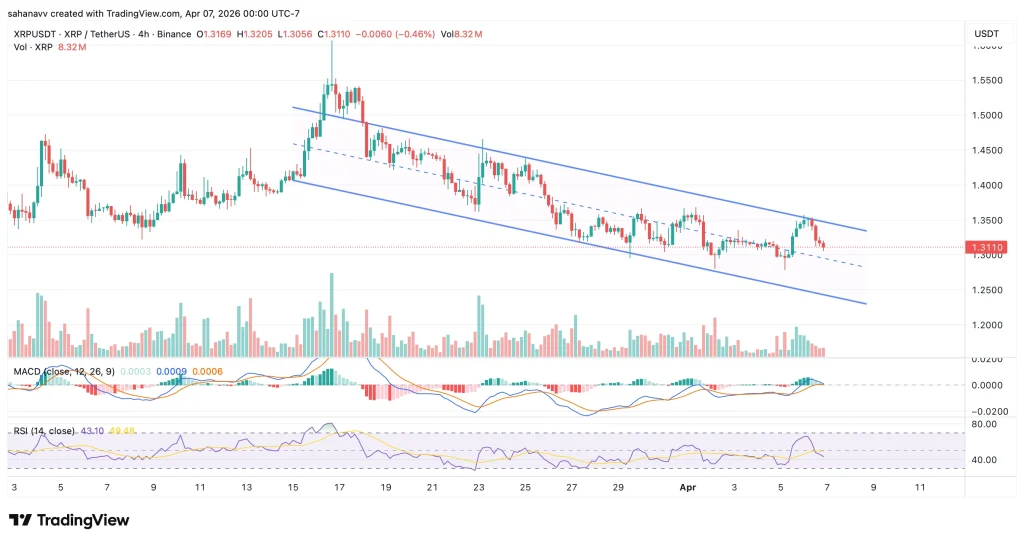
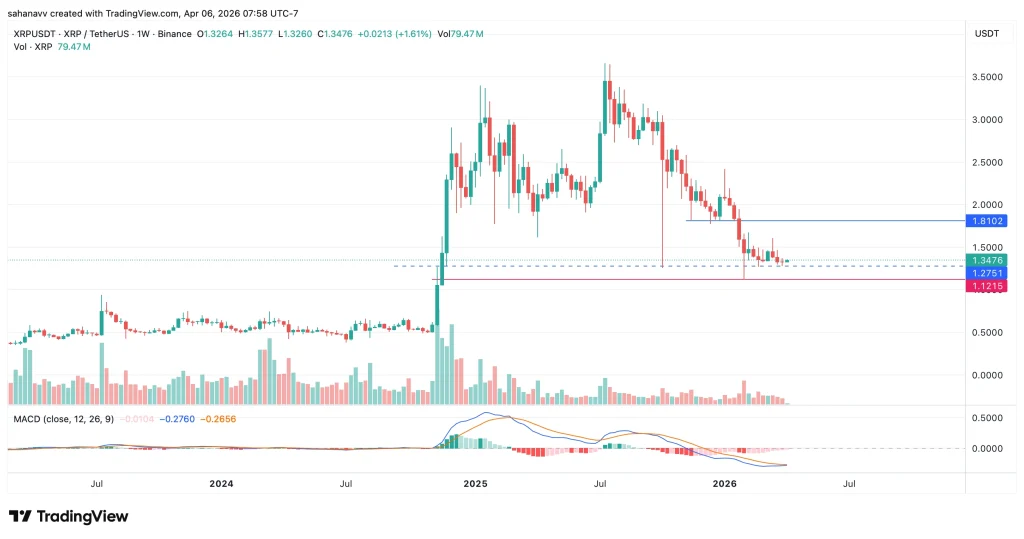
With XRP currently sitting around $1.38, such a move would require a market explosion on a scale never seen before. Not just for XRP, but for crypto as a whole.
His view is: being bullish long-term is one thing. Attaching massive price targets to short timelines is another. And the two shouldn’t be confused.
“Im also an XRP maxi, just disagree with overhyping for reach. Targets like these with imminent time stamps always fade with time and are pure engagement farming,” he said.
How The $1,700 Story Took Off
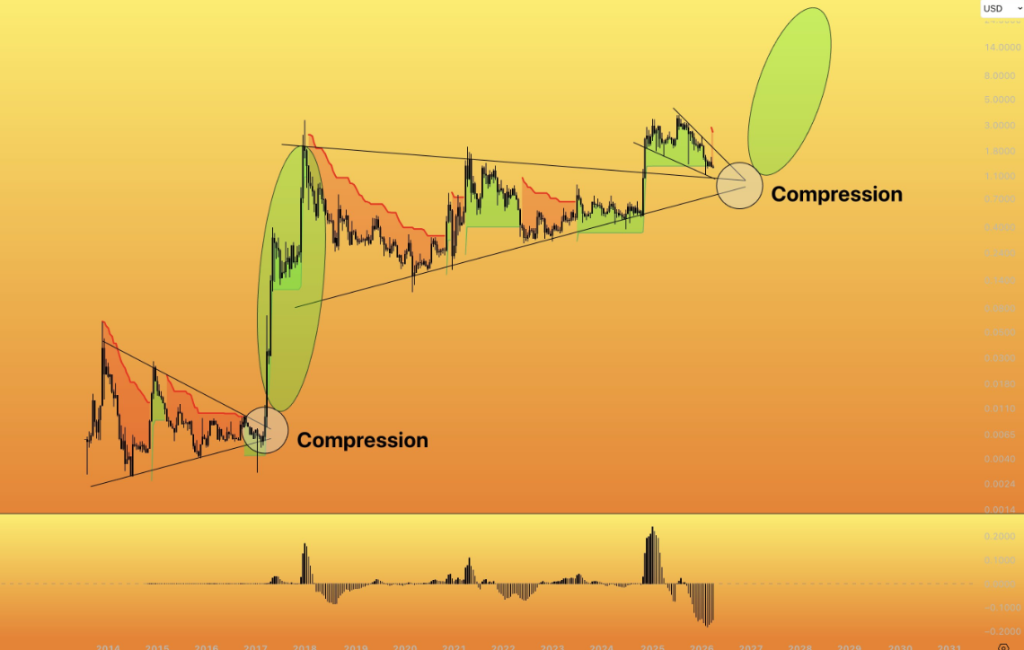
The idea didn’t come out of nowhere. Some analysts began pointing to long-term charts and historical patterns, suggesting XRP could be nearing a major breakout.
Then came bigger numbers. Targets between $1,200 and $1,700 started circulating, gaining traction quickly across social media.
Analyst Remi Relief added to the momentum, saying that the range aligned with his own research, a “sweet spot” that started making rounds among retail traders looking for the next big move.
And just like that, a narrative was born.
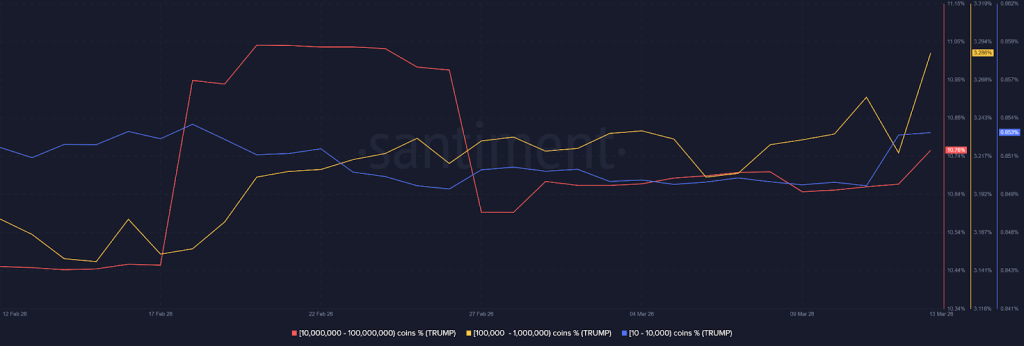
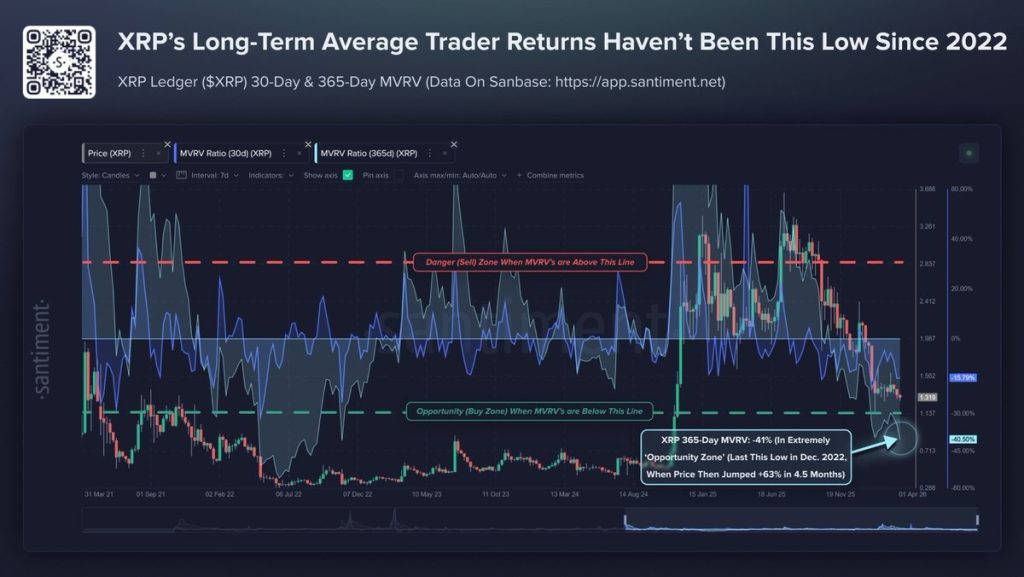
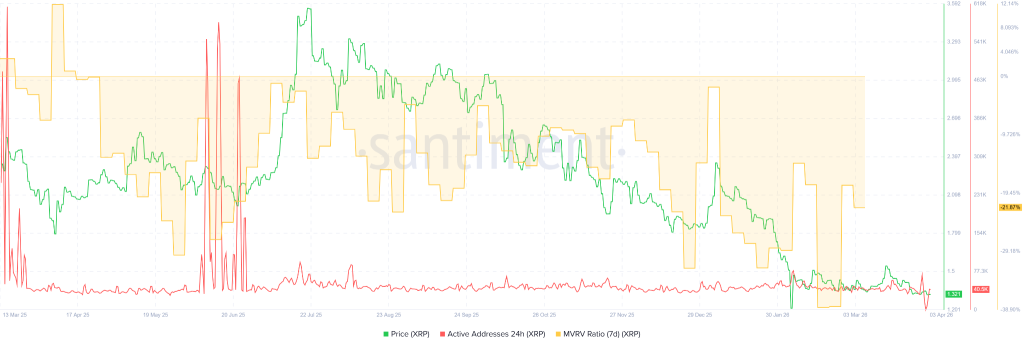
On-Chain Data Tells a Different Story
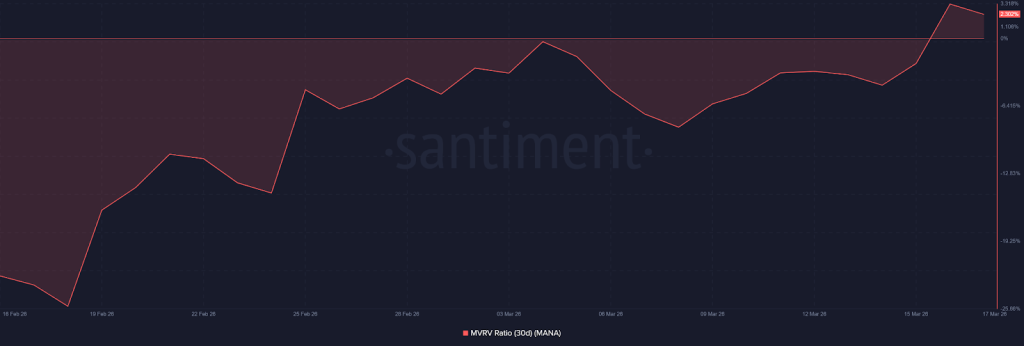
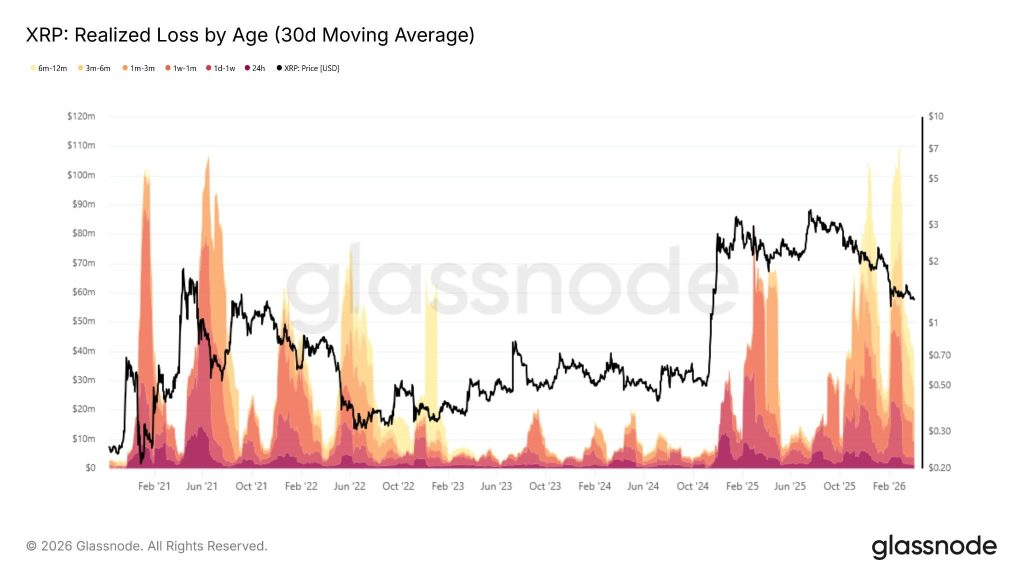
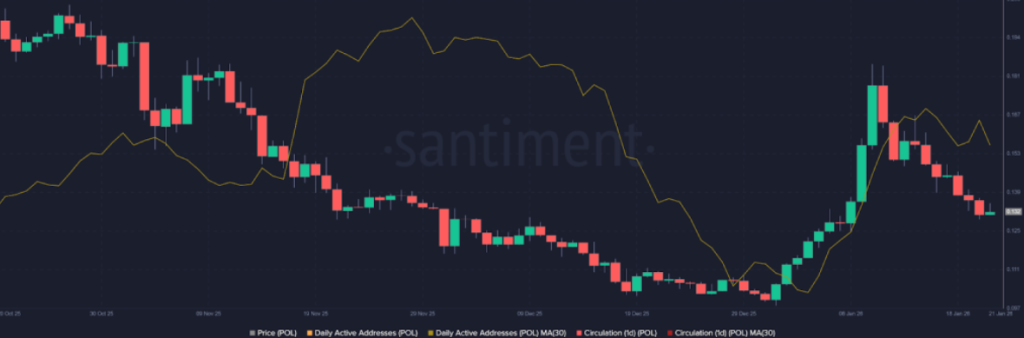
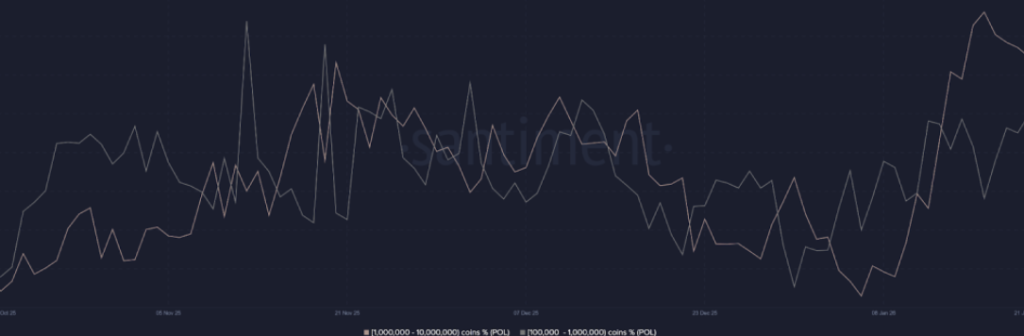
Adding more context, data from Santiment shows that XRP traders are currently under pressure. The average wallet is down about 41% over the past year, marking the lowest MVRV levels since the FTX collapse.
Interestingly, this kind of “pain zone” has historically signaled lower downside risk and potential accumulation opportunities. But it still doesn’t support the idea of a rapid, exponential rally in the near term.
Short-Term Structure Still Looks Weak
At the same time, analyst CasiTrades is cautioning traders against flipping bullish too quickly. Despite recent green candles, XRP has failed to break resistance and is showing signs of exhaustion.
The broader structure still leans bearish, with downside targets around $1.13, $1.08, and potentially as low as $0.87 if selling pressure continues.
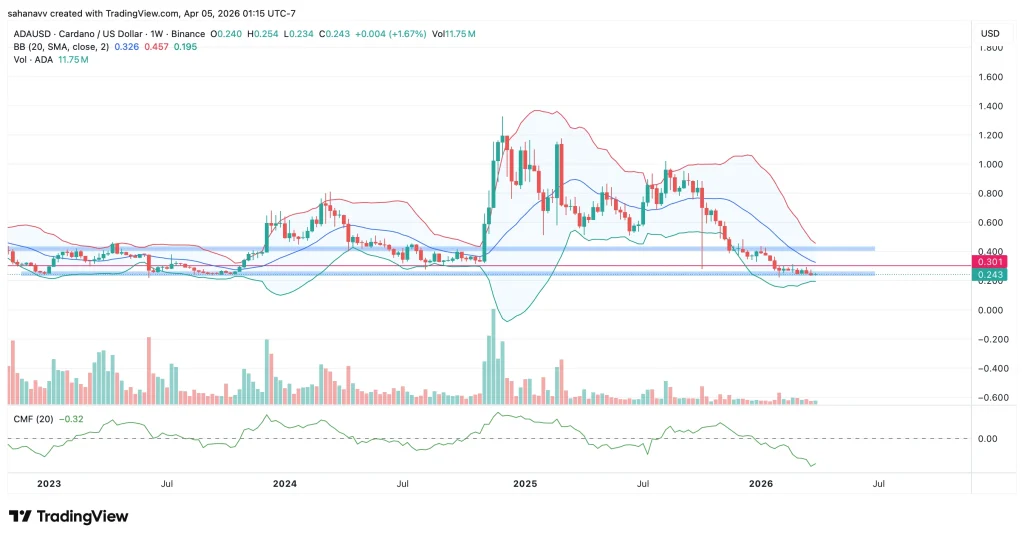
Cardano is stepping into a transition phase as its development arm, Input Output Global (IOG), reshapes its roadmap. The network is moving away from multiple parallel initiatives and concentrating efforts on fewer, more advanced frameworks.
Acropolis and Tiered Pricing Dropped
IOG has confirmed that the Acropolis project will be discontinued in April 2026. The project, built as a Rust-based node to improve infrastructure diversity, had already delivered upgrades like faster blockchain synchronization. Despite this progress, it no longer fits the network’s changing direction.
“We’re changing course to prioritize Cardano’s growth. We are ceasing development on Acropolis to focus on chain abstraction and cancelling Tiered Pricing to align with the Leios roadmap. This decision returns ₳4.1M to the Treasury. We’re putting resources where they deliver the most value for the community.” Said IOG.
Alongside this, the Tiered Pricing model has also been scrapped. Research tied to Ouroboros Leios indicates that upcoming changes in transaction processing could make the pricing system outdated before full implementation.
IOG stated that the decision is about redirecting resources toward areas that deliver greater value for the ecosystem, while also returning funds to the community.
Focus Turns to Leios and Usability
With these initiatives removed, development is now centered on chain abstraction and Leios-related upgrades. These changes are expected to simplify how developers and users interact with the network while improving throughput.
Charles Hoskinson has suggested that Leios could launch within the year, potentially introducing a more efficient model for scaling without compromising decentralization.
Treasury Return Raises Questions
As part of the restructuring, around 4.1 million ADA is being returned to the treasury for community governance. However, this move has sparked questions. An X user pointed out a gap between previous treasury allocations and the returned amount. Based on earlier figures, he noted that roughly 2.66 million ADA remains unaccounted for and questioned whether it is tied to the existing Acropolis code. He also flagged issues with the project’s GitHub link, adding to the uncertainty.
The crypto news just flipped bullish for Ethereum. Spot ETH ETFs pulled $71.2 million in net inflows on Friday according to Benzinga, and trader CryptosBatman flagged an inverse head and shoulders breakout on the 4-hour chart that signals a trend shift is forming right as bears call the top.
The crypto news confirms what every past cycle has proven: the moment fear peaks and smart money loads, the biggest gains are about to start. ETH sits at $2,131 with Standard Chartered holding a $7,500 year-end target, and while the ETH recovery builds, one presale has crossed $8.78M with wallets that match the same on-chain patterns as addresses that quietly loaded DOGE in late 2020.
Crypto News: ETH Outlook After the Breakout Signal
The ETH price sits at $2,131 on April 6 while trading between $2,000 and $2,200 for all of March according to CoinMarketCap.
The bearish calls look scary on the surface, but the numbers underneath tell a different story. Spot ETH ETFs pulled $71.2 million on Friday alone. Bitmine holds 4.8 million ETH worth $10.2 billion and keeps buying. The Glamsterdam upgrade is in active development, targeting 100,000 TPS across the Layer 2 system by late 2026.
Standard Chartered holds a $7,500 year-end target. Arthur Hayes projects $10,000 to $20,000 before the cycle ends. From $2,131 that gives roughly 3.5x to 9x over the coming quarters, a strong return for anyone already in. But the crypto news from every past run teaches the same truth: a 3x on ETH has never created life-changing money on its own. That money flows from meme coins. Every cycle confirms it. The only question is which one leads.
DOGE showed how it works. A few thousand dollars put in early became millions built on nothing but community trust. Can Dogecoin pull that off again? No. DOGE at a $13 billion cap cannot run that math again, since even hitting $1 needs $155 billion in new buying. The numbers break at that size. The question every holder faces is where the next DOGE comes from, and the crypto news makes the answer harder to ignore: Pepeto.
Why Pepeto Stands as the Next Dogecoin With Exchange Tools DOGE Never Had
With the ETH outlook aimed at $7,500 and the breakout forming right as bears call the ceiling, this is the best window to lock in for the biggest returns. History shows the largest gains land before the rally starts, not after. Pepeto is spreading the same way DOGE spread before its massive run, and the crypto news covers it without a paid push because the community drives every headline.
What Pepeto brings is meme coin momentum landing on top of real tools. Traders swap across Ethereum, BNB, and Solana through a zero-fee exchange without losing a dollar to gas. A bridge sends tokens between chains in seconds. AI catches scam contracts before they can hit any wallet. Every tool is built to keep value inside the system instead of letting it drain out.
“DOGE built millionaires with zero tools behind it, just a logo and trust. Pepeto carries that same energy plus a working exchange. Calling it the next DOGE might be selling it short, because the exchange underneath sets Pepeto up to beat every meme coin that came before it” said a crypto analyst tracking the project.
Conclusion
The crypto news points ETH toward $7,500 even as some analysts argue the rally may stall, and that kind of debate is exactly the setup where big wallets shift into early plays with the highest gain potential.
The window to lock in the biggest returns of this cycle is open right now and closing faster than most people see. Every past cycle proved the same pattern: once ETH confirms direction, viral projects with real tools catch the overflow faster than anything else, and the crypto news is showing that setup play out live.
The wallets that passed on Dogecoin and held that regret for the whole run are making sure it does not happen twice. The crypto news cycle is turning bullish, and the Pepeto official website is where they are buying with conviction. The moment the Binance listing arrives, this price disappears. The window shrinks by the day.
Where do analysts see the ETH price heading in 2026?
Standard Chartered holds $7,500 as its year-end target with Arthur Hayes projecting $10,000 to $20,000 at the cycle peak. Spot ETH ETFs pulled $71.2M on Friday, Bitmine controls 4.8M ETH, and the crypto news shows the kind of bullish setup that sends early meme plays vertical while ETH climbs steadily.
Does Pepeto qualify as the next Dogecoin entry?
Over $8.78M raised with a SolidProof audit, a working exchange, the cofounder behind Pepe, an ex-Binance dev lead, and 187% APY staking at a level of community energy that nothing else this cycle has come close to through the Pepeto official website.
Pi Network is entering a crucial phase this month, with around 239 million Pi tokens set to unlock over the next 30 days. That’s a big chunk of new supply suddenly becoming tradable.
And with demand still not strong enough to absorb this supply easily, Pi might struggle to move higher in the short term, even though prices are trying to stabilize.
April 9–19 Unlocks: Supply Surge Peaks Mid-Month
Between April 9 and April 19, a significant amount of Pi is set to be unlocked as per Piscan. The largest spikes come mid-cycle, with around 18.28 million Pi unlocking on April 9.
April 9: ~18.28M PI
April 11: ~17.19M PI
April 15: ~20.19M PI
April 16: ~22.78M PI (highest)
April 17: ~18.87M PI
April 18: ~5.98M PI
April 19: ~3.90M PI
In total, over the next 30 days, roughly 239.5 million Pi tokens will be unlocked, representing about 4% of the total locked supply. On average, nearly 8 million Pi tokens are entering circulation daily.
Supply Surge Meets Weak Demand
The main issue for Pi right now is imbalance. While supply is rising sharply, demand hasn’t kept pace. Daily trading volumes hovering around $21–$26 million are relatively low compared to the scale of incoming tokens.
This mismatch is creating bearish pressure on Pi price.
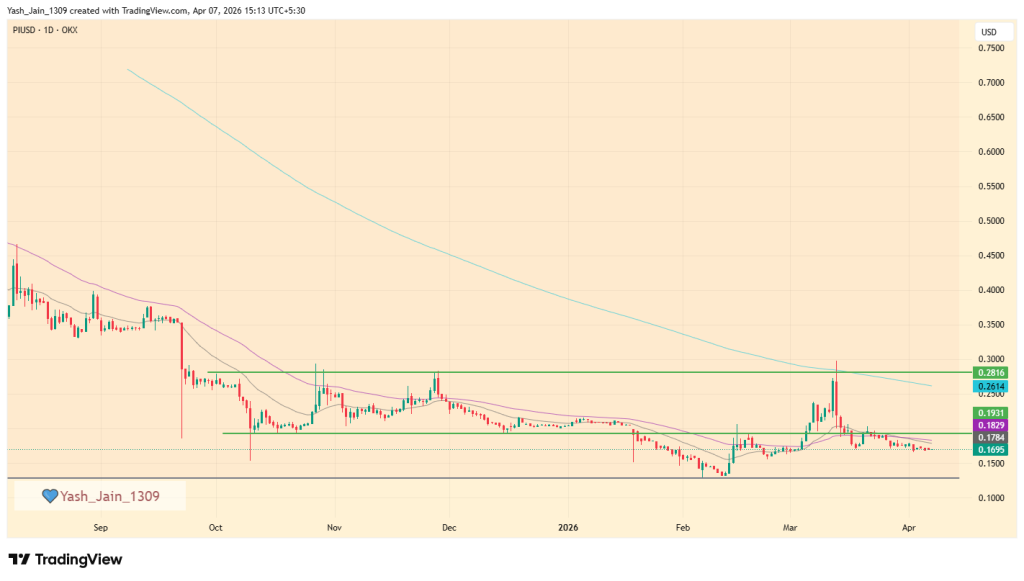
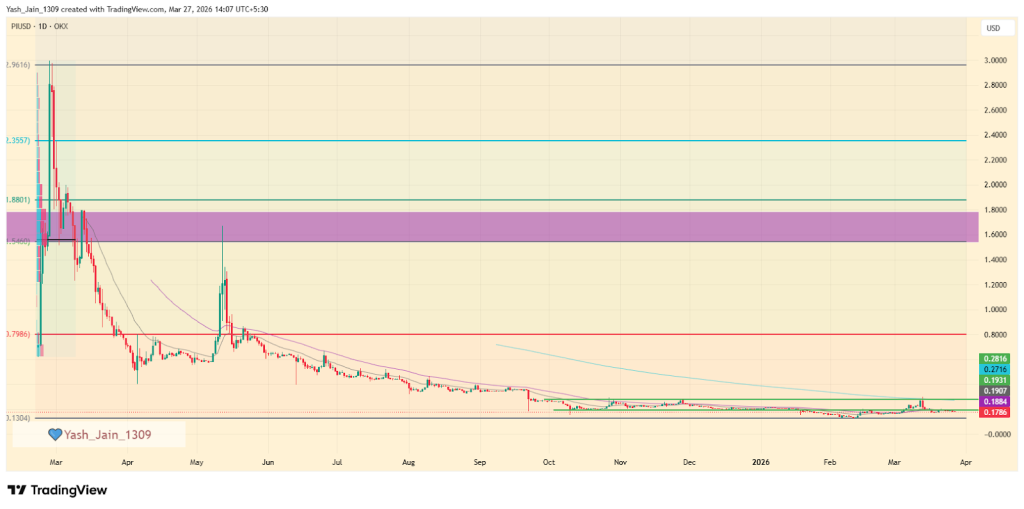
Price Holding, But Not Reversing
As of early April 2026, Pi is stabilizing around the $0.17–$0.18 range. However, this comes after a steep correction of over 90% from its 2025 highs.
This kind of sideways movement at lower levels suggests the market is trying to absorb supply, but it doesn’t yet signal a strong recovery. A similar pattern was seen in March, where bullish events triggered rallies, only to be followed by sharp sell-offs as holders exited.
The live price of the Monero crypto is $ 340.38519009.
Monero price made a strong move before but on a decline to a possible $130 low by 2026-end.
The XMR price, with a potential surge, could hit $5,828.30 by 2030
Envision the capability to conduct online payments without a digital footprint; that’s payment privacy. Numerous cryptocurrency assets possess a distinct selling proposition (USP); some safeguard transaction details concerning the parties or institutions involved, but some do not.
But this transparency enables larger investors and institutional capital to be easily traced. While unshielded transactions are valued by researchers for the accessible information they provide regarding investments, individuals whose data is subject to scrutiny often experience frustration, as they perceive a loss of privacy over their own financial assets.
This is where Monero (XMR) comes in. Since its inception in 2014, Monero has offered robust privacy features. It has become the top choice for users seeking to maintain a high standard of anonymity in blockchain transactions. The impact of Monero’s privacy capabilities was particularly evident in the fourth quarter of 2025.
Despite the government’s tightening of the rules around digital assets, Monero has ranked 21st globally. Driven by rising interest, XMR stands out as a privacy-focused coin. So, what’s coming next for Monero in 2026 and the years to come? In this Monero price prediction 2026-2030 article, we look at the potential price targets.
The daily price chart for Monero (XMR) reveals a captivating market trend marked by noteworthy fluctuations. After challenges maintaining stability above $422 in January, XMR declined, falling below $370 in February. However, mid-March brought significant resistance near the 200-day EMA and the $370 threshold.
As we saw the transition from March into April, the XMR/USD pair has found support at a short-term trendline, which is an encouraging development. Should this support be breached, we might witness a rapid decline, potentially dropping below $300 this month. On a brighter note, if this support remains robust, we have an exciting opportunity for XMR to retest the $422 level by the end of April.
Recent News and Opinions
Per the late February 2026 post from ProbeLab, they show that findings confirm the Monero network’s resilience against surveillance. Analysis reveals that 46% of community nodes have proactively adopted a “ban list,” effectively neutralizing nearly all identified spy nodes. This grassroots defense highlights a robust, decentralized commitment to privacy, strengthening the network’s topology against potential deanonymization attempts.
Monero (XMR) Price Prediction 2026
The price action of Monero (XMR) showed remarkable bullish momentum, particularly in Q4 2025, driven by a broader trend in privacy coins, which resulted in a significant price surge during that period.
In 2026, Monero followed the same privacy narrative, continuing the rally and pushing the price to new all-time highs (ATH) of $800. However, this increase was short-lived, as the price dropped to around $285 in February, losing more than 60% from its peak. Additionally, the mid-trendline of an ascending channel was breached, confirming a bearish dominance in the market at that time.
But, the remaining days of Q1 2026 showed some improvements that pushed it back above mid-trendline support, and now we see consolidation going on.
Now, if demand for XMR price increases, it could potentially revisit the $422 mark. It’s important to note that a recovery to this level might not inspire much excitement, as it could form a significant trap for investors. To regain a bullish setup, a weekly close above $422 would be crucial for attracting investor interest.
Conversely, if the price fails to break through $422 or even collapses below mid-trendline support again, then the first half of 2026 could see a drop towards $200 area, which could accelerate to $130 by year’s end to touch the lower border of the ascending channels as a support, like in the past.
Furthermore, it’s essential to recognize that the price has reached the upper boundary of its ascending parallel channel. As with previous patterns, a correction appears to be imminent. When it pierced the upper boundary, it had two choices: break away from the earlier pattern and establish new price action, but it briefly exceeded the channel before falling back within it, echoing historical trends. Ultimately, it returned to the pattern, continuing its legacy from the past.
Monero Crypto Price Prediction 2026 – 2030
Year
Potential Low ($)
Potential Average ($)
Potential High ($)
2027
$910.00
$1000.00
$1200.00
2028
$863.46
$1,726.90
$2,590.35
2029
$1,295.19
$2,590.35
$3,885.53
2030
$1,942.76
$3,885.53
$5,828.30
Monero Price Forecast 2027
Looking forward to 2027, XMR’s price is expected to reach a low of $910, with a high of $1,200 and an average forecast price of $1,000.
XMR Price Prediction 2028
In 2028, the price of a single Monero is anticipated to reach a minimum of $863.46, with a maximum of $2,590.35 and an average price of $1,726.90.
Monero Price Prediction 2029
By 2029, XMR’s price is predicted to reach a minimum of $1,295.19, with the potential to hit a maximum of $3,885.53 and an average of $2,590.35.
Monero (XMR) Price Prediction 2030
In 2030, Monero is predicted to touch its lowest price at $1,942.76, hitting a high of $5,828.30 and an average price of $3,885.53.
The long-term projection assumes Monero sustains relevance in enterprise blockchain use cases, with growth moderating over time as the asset matures.
Year
Potential Low ($)
Potential Average ($)
Potential High ($)
2031
3800
5200
6800
2032
5500
7500
9500
2033
7700
10000
11500
2040
15000
22000
42000
2050
30000
40000
60000
Monero (XMR) Price Prediction: Market Analysis?
Year
2026
2027
2030
Changelly
$720
$900
$1900
CoinCodex
$680
$880
$1800
WalletInvestor
$740
$870
$2000
Never Miss a Beat in the Crypto World!
Stay ahead with breaking news, expert analysis, and real-time updates on the latest trends in Bitcoin, altcoins, DeFi, NFTs, and more.
FAQs
What is Monero (XMR) price prediction for 2026?
Monero could revisit the $422 level if buying demand strengthens. However, if bearish pressure continues, the price may fall toward $200 or even $130 during 2026.
How much will Monero be worth in 2030?
Projections indicate Monero could trade between about $1,942 and $5,828 by 2030, with an estimated average price around $3,885 if adoption continues growing.
How high can Monero price go by 2040?
Long-term projections vary widely, but some estimates place Monero between $2,000 and $5,000 by 2040, depending on adoption and regulation.
What factors influence the price of Monero?
Monero’s price is driven by privacy demand, regulatory developments, network adoption, market sentiment, and overall crypto market trends.
Will Monero be the next Bitcoin?
Monero serves a different role than Bitcoin. Bitcoin focuses on transparency, while Monero prioritizes privacy, making it a niche but valuable crypto asset.
A long-running dispute between OKX founder Star Xu and Binance’s Changpeng Zhao has resurfaced following Zhao’s memoir release. Xu claims that in 2014, while Zhao was CTO at OKCoin, he altered a contract tied to a deal with Roger Ver by adding a termination clause. Xu shared past chat records as proof and accused Zhao of dishonesty. Zhao previously denied the claim, citing a hacked account, and addressed it in his book without new details.
SUI shows strong bullish momentum in early 2026, backed by rising TVL, ecosystem growth, and renewed investor confidence.
If key resistance breaks, SUI could target $3–$5 in 2026, with long-term potential extending toward $15–$18 by 2030.
As a next-generation Layer 1 blockchain, Sui is redefining the architecture of the decentralized web by introducing an object-centric model where assets, data, and permissions are natively ownable and programmable. Built to handle the demands of modern commerce, the Sui Stack provides a modular toolkit that allows developers to scale on resilient infrastructure while delivering high-performance experiences without typical blockchain trade-offs.
From powering institutional capital markets and DeFi to even revolutionizing the gaming sector, the network has already secured a significant foothold with a Total Value Locked (TVL) of $583 million, per the official website.
By prioritizing verifiable security and composable scaling, Sui ensures that value created within its ecosystem is shared rather than extracted. In this comprehensive SUI price prediction 2026–2030, we analyze how this business-ready infrastructure and growing industry adoption will impact SUI’s token and market valuation in the years to come.
As we reflect on early 2026, the SUI price initially faced significant selling pressure at $2.00, dropping to $0.80 by February. Since then, the price has been steadily consolidating just below the crucial $1.00 mark.
Now that March has concluded, SUI/USD is at a critical juncture, struggling to break above the $1 resistance level. On a more optimistic note, if the SUI price sees demand and surpasses $1.05, it could signal a local bottom and spark a rally towards $1.60. There is also the exciting possibility of a reattempt to breach the $2.00 threshold by the end of the April.
Conversely, if this struggle continues, we might see a retreat to lower levels. It is particularly important to note that if the key $0.80 support level fails, we could witness prices testing the $0.50 to $0.60 range in April.
Sui (SUI) Crypto Price Prediction 2026
The weekly price action for SUI/USD reveals a market in a major corrective phase after its late-2024 peak, currently in Q1 2026, searching for a definitive long-term bottom.
What we witnessed is that after the 2024’s explosive rally that topped out near $5.36, the asset entered a persistent downtrend, characterized by a series of “lower highs” capped by a prominent descending resistance line. This primary trendline has remained unbroken throughout 2025, consistently forcing the price toward deeper support levels as the initial hype cycle cooled.
Currently, the SUI price is testing $0.80 support after losing $1.05 support in Q1 2026. The odds suggest a chance of reaching the $0.50 support zone if it fails to hold $0.80, because the $0.50 area is of immense technical importance, as it represents the original “genesis” accumulation level from early 2024.
The price has dipped a lot, and now it’s showing signs of stabilization as sellers are about to reach exhaustion once it hits $0.50. Real consolidation could begin, and a true reversal to fruit has better odds. This area serves as the “line in the sand” for bulls; maintaining this floor is essential to prevent a complete technical breakdown and to begin building a new base for the next market cycle.
Looking ahead, the chart identifies several key resistance levels that SUI must reclaim to shift its bearish structure. The immediate hurdle lies at the $1.05, $1.60, and $2.00 horizontal zones. A successful bounce from the current demand floor would likely target these levels first.
However, a true trend reversal will only be confirmed if SUI breaks and closes above the long-term descending trendline, currently near $3.50. Until that breakout occurs, the asset remains in a “buy the dip” accumulation phase for long-term investors.
SUI Crypto Price Prediction 2026 – 2030
Year
Potential Low ($)
Potential Average ($)
Potential High ($)
2027
$4
$6
$8
2028
$8
$10
$12
2029
$10
$13
$16
2030
$12
$15
$18
Sui (SUI) Price Prediction 2027
Subsequently, the SUI price range can be between $4 to $8 during the year 2027.
SUI Prediction 2028
Beyond the previous ATH,SUI bullish momentum may gain pace and will see another bullish spark in 2028. Specifically, as per our SUI Price Prediction, the potential SUI price range in 2028 is $8 to $12.
SUI Price Forecast 2029
Thereafter, the SUI price for the year 2029 could range between $10 and $16
Sui (SUI) Price Prediction 2030
Finally, in 2030, the price of SUI is predicted to maintain a steady and positive. It can trade between $12 and $18.
SUI Price Prediction 2031, 2032, 2033, 2040, 2050
Based on the historic market sentiments and trend analysis of the largest cryptocurrency by market capitalization, here are the possible SUI price targets for the longer time frames.
Year
Potential Low ($)
Potential Average ($)
Potential High ($)
2031
$8
$10
$15
2032
$10
$13
$18
2033
$12
$15
$22
2040
$20
$32
$40
2050
$30
$70
$150+
Never Miss a Beat in the Crypto World!
Stay ahead with breaking news, expert analysis, and real-time updates on the latest trends in Bitcoin, altcoins, DeFi, NFTs, and more.
FAQs
What is the Sui Crypto (SUI) price prediction for 2026?
SUI could trade between $0.50 and $5 in 2026. If it breaks key resistance near $3.50, momentum may push the token toward the $3–$5 range.
How high can Sui Crypto go by 2030?
If adoption continues and the ecosystem expands, SUI could reach $12–$18 by 2030, driven by DeFi growth and network demand.
What is the Sui price prediction for 2040?
Long-term projections suggest SUI may trade between $20 and $40 by 2040, assuming strong blockchain adoption and sustained ecosystem growth.
What is the Sui Coin price prediction for 2050?
By 2050, SUI could potentially reach $30–$150+ if the network becomes widely used across finance, gaming, and Web3 infrastructure.
Where to buy Sui Crypto (SUI)?
You can buy SUI on major crypto exchanges like Binance, Coinbase, KuCoin, and OKX. Simply create an account, deposit funds, and trade for SUI.
Can SUI reach its all-time high again?
Yes, if SUI breaks above key resistance near $3 and market conditions stay favorable, a retest of its $5.35 ATH is possible.
Is SUI a good long-term investment?
SUI shows long-term potential due to its scalable Layer-1 design, growing DeFi adoption, and increasing developer and institutional interest.
What factors are driving SUI’s price growth?
Key drivers include rising TVL above $1B, strong on-chain activity, ecosystem expansion, and SUI’s reputation as a fast, scalable network.
Expanding exchange-ecosystem demand could lift BNB price toward $2000 by the end of this year.
Long-term network usage growth may extend BNB price toward $10,000.
Binance Coin (BNB) suggests a fundamental shift in how the asset responds to broader market dynamics. In 2026, the token’s performance increasingly reflects on-chain utility and ecosystem liquidity rather than mere speculative volatility. This transition from reactive price swings to a more structured price action indicates a maturing market environment.
As the ecosystem stabilizes, the technical narrative centers on long-term accumulation and the absorption of supply within established demand zones. Sustained network activity across the Binance Smart Chain provides a foundational backdrop for this consolidation, potentially setting the stage for a period of extended price discovery. By focusing on fundamental network health and institutional integration, the outlook for the next several years leans toward organic growth and structural resilience within the global digital asset landscape.
So, what’s next for the BNB price in the rest of 2026 and beyond? What can be the future price movements? Let’s get into the Binance Coin (BNB) Price Prediction 2026–2030.
In the third quarter of 2025, we witnessed an impressive rally, soaring 125% from the $600 support level to an exhilarating $1,375. However, by the fourth quarter of 2025 and into the first quarter of 2026, the BNB price retreated back to the $600 demand zone, erasing those remarkable gains.
Since February, we have observed a steady accumulation around this vital $600 level, a trend that has continued into March, so Q1 was tough. But, as Q2 began with April, this level appears to have solidified as a robust support point, suggesting that bullish momentum could very well resume this month.
Despite prevailing market challenges, the price has demonstrated remarkable resilience, remaining above $600 throughout March. Should bullish pressure intensify in April, we may see a potential retest of $750; otherwise, further consolidation may continue throughout the month.
Recent News/ Opinions
On April 1, 2026, Binance Earn launched new Yield Arena offers, providing limited-time opportunities to earn up to 35% APR. This weekly update spans across multiple products, including Simple Earn, ETH and SOL Staking, and Dual Investment.
On March 27, 2026, binance shared that equity and commodity perpetual futures on Binance surpassed $150 billion in cumulative trading volume. This milestone was supported by an immense processing of over 110 billion trades in one quarter, highlighting the growing crossover between traditional finance and digital markets.
A recent ruling news on March 7th came from the US federal court that it has positively dismissed all anti-terrorism claims against Binance, alleviating a significant legal burden. In the Southern District of New York, a judge concluded that the plaintiffs, comprising 535 individuals citing 64 attacks from 2017 to 2024, did not establish sufficient evidence to demonstrate that Binance had assisted or conspired with terrorist organizations. This decision marks a commendable step forward for Binance, affirming its commitment to compliance and integrity.
Binance Coin (BNB) Price Prediction 2026
Based on the technical structure of the BNB/USD weekly chart, the price action reflects a long-term ascending channel (or wedge) that has defined the asset’s trajectory since the massive demand surge from the $40 level in early 2021. This multi-year uptrend culminated in a new all-time high of approximately $1,375 in late 2025, validating the token’s utility and its position within the Binance ecosystem. Currently, the market is witnessing a convergence of horizontal price levels with channel’s dynamic trendline support, which reinforces the technical significance of the current price zone.
As of Q1 2026, BNB price is testing a critical turning support zone around the $600 horizontal support, which aligns precisely with the lower boundary of the primary ascending channel. This area is currently serving as a consolidation floor, suggesting a period of institutional accumulation. Historical precedent highlights the importance of this trendline; a similar touchpoint in late 2023 at the $200 range served as the launchpad for a massive rally, though it took roughly 238 days to reach the channel’s median line.
Looking ahead through 2026, the primary bullish thesis anticipates a recovery toward the $1,000 psychological level. If the recovery pace mirrors previous cycles, BNB/USD could reach the channel’s middle band by Q3 2026. However, if consolidation extends further into the year, the recovery might be more gradual, stretching toward the year-end.
Conversely, a decisive break below the $600 footing would invalidate the current setup, significantly increasing the probability of a deeper correction toward the major $200 demand zone.
BNB On-Chain Analysis
Recent on-chain data highlights the network’s resilience, with daily transactions stabilizing at 15 million in Q1 2026 despite market fluctuations. This sustained utility, paired with total unique addresses nearing the 800 million mark, signals a consistent rise in global adoption. These fundamental metrics suggest a robust foundation for long-term ecosystem growth and structural asset valuation.
Binance Coin Crypto Price Prediction 2027 – 2030
Year
Potential Low ($)
Potential Average ($
Potential High ($)
2027
1200
1420
1800
2028
1600
1950
2300
2029
2100
3250
3900
2030
2500
3800
4500
Binance Coin Price Prediction 2027
As per the Binance Coin Price Prediction 2027, Binance Coin may see a potential low price of $1200. The potential high for Binance Coin price in 2027 is estimated to reach $1800.
BNB Price Prediction 2028
In 2028, Binance Coin price is forecasted to potentially reach a low price of $1600 and a high price of $2300.
Binance Coin Price Forecast 2029
Thereafter, the Binance Coin (Binance Coin) price for the year 2029 could range between $2100 and $3900.
Binance (BNB) Coin Price Prediction 2030
Finally, in 2030, the price of Binance Coin is predicted to remain steadily positive. It may trade between $2500 and $4500.
The long-term projection assumes Binance Coin sustains relevance in enterprise blockchain use cases, with growth moderating over time as the asset matures.
Stay ahead with breaking news, expert analysis, and real-time updates on the latest trends in Bitcoin, altcoins, DeFi, NFTs, and more.
FAQs
What is the BNB price prediction for 2026?
BNB could recover toward $1,000 in 2026 if the $600 support holds and Binance ecosystem demand grows, supported by rising network usage and liquidity.
What will be the BNB price in 2030?
BNB could trade between $2,500 and $4,500 by 2030 if blockchain adoption grows and the Binance ecosystem maintains strong network activity.
How high can BNB price go by 2040?
Long-term projections suggest BNB could reach $13,000–$38,000 by 2040 if the network expands globally and maintains strong adoption across DeFi and Web3.
What factors influence Binance Coin’s price?
Price depends on exchange network usage, liquidity, adoption trends, historical support/resistance zones, and institutional participation.
Is Binance Coin (BNB) a good long-term investment?
BNB is often viewed as a strong long-term asset due to exchange utility, token burns, and ecosystem growth, though crypto investments always carry risk.
Microsoft has introduced a new open-source toolkit focused on runtime security to enforce stricter governance over enterprise AI agents. The toolkit is built around runtime security, addressing concerns that modern language models are no longer limited to advisory roles but…
Alibaba and China Telecom are moving ahead with a new data centre project in southern China, powered entirely by the e-commerce giant’s in-house AI chips, as Beijing steps up efforts to build domestic computing infrastructure. The facility, unveiled on Tuesday,…
The draft proposal from South Korea’s ruling party reportedly bars stablecoin interest and calls for technical standards to ensure interoperability across blockchain networks.
Cathie Wood's ARK Invest increased its Robinhood stake after the platform was selected to operate government-backed “Trump Accounts” for youth savings and investment.
Will quantum-safe cryptography slow Ethereum? It is likely to affect gas fees, validator load and network efficiency, prompting Ethereum to pursue a broader redesign strategy.
Solana price rally is gaining momentum as the broader crypto rally lifts market sentiment. SOL has surged over 5% in the last 24 hours, reclaiming ground near the $85 level and drawing renewed attention from traders. With Bitcoin pushing higher and market sentiment flipping decisively risk-on, capital is rotating into high-beta altcoins, and Solana is emerging as a clear leader in this phase.
But beyond the price rally, the underlying signals suggest something bigger is building. Is this the early stage of a breakout move toward $100?
Derivatives Data Signals Aggressive Bullish Positioning
The real story behind Solana’s rally lies in the derivatives market. Data shows futures volume has exploded 69% to $15.82 billion, while open interest has climbed above $5.12 billion, indicating fresh capital entering the market. At the same time, options volume has jumped over 44%, reinforcing expectations of increased volatility ahead.
When rising price is accompanied by expanding open interest, it typically reflects new long positioning, not just short covering. In simple terms, traders are not exiting, they are adding exposure, betting on further upside. Equally important, funding rates remain relatively balanced, suggesting the rally is not yet crowded or overheated. This keeps the door open for continuation.
Solana Price Prediction: Cup-and-handle Pattern in focus
Zooming out, Solana’s higher timeframe structure is beginning to attract institutional attention. The monthly chart reveals a large cup formation, built over an extended accumulation phase. The current SOL price action is unfolding within a controlled downward channel, forming the handle just below key resistance.
This is a classic bullish continuation pattern. Historically, such setups represent consolidation before expansion. A confirmed breakout from this structure would signal a transition from recovery into a full trend continuation phase, often accompanied by strong momentum. In this context, Solana’s current move is not just a bounce, it is potentially a setup for a much larger breakout cycle.
Key levels to watch: $90 breakout could unlock $100
Solana is now approaching a decisive technical zone. The immediate resistance sits at $90–$92, a region that has repeatedly capped upside attempts. A strong breakout above this level would confirm bullish control and likely trigger accelerated momentum toward the $100 psychological barrier.
On the downside, $78–$80 remains a critical support band. Holding above this zone is essential to maintain the current bullish structure. Any breakdown below it would weaken momentum and delay the breakout scenario.
SOL Price Outlook: Momentum Builds As Breakout Pressure Rises
Solana is entering a high-conviction phase where price action, derivatives expansion, and macro structure are aligning, a combination that often precedes strong directional moves. The sharp rise in volume and open interest suggests this is early-stage positioning, not late-cycle exhaustion. Traders are preparing, not exiting. If the broader crypto rally sustains and SOL clears the $90 resistance, the move toward $100 could unfold rapidly, driven by both spot demand and leveraged positioning.
The sudden announcement of a two-week ceasefire between the United States, Israel, and Iran has offered markets a moment to exhale. But very few are convinced the crisis has truly passed.
Brokered after last-minute diplomacy involving Pakistan and mounting pressure tied to the Strait of Hormuz, the agreement pauses more than 40 days of escalating conflict. For now, ships may move again. But certainty hasn’t returned.
“This is a temporary de-escalation rather than a lasting resolution,” said crypto market analyst, CryptKeeper, to Coinpedia. “The agreement is fragile.” However, Bitcoin prices climbed back toward the $72,000 level, and altcoins have also staged a rally.
A Pause, Not a Turning Point
The ceasefire, set to last 14 days, is less a breakthrough and more a holding pattern. Talks are scheduled to begin in Islamabad on April 10.
“The U.S. and Iran are still far apart on core issues,” CryptKeeper said. “The risk of further escalation, especially if negotiations fail, remains high.”
Even more telling, Israel has made clear that its operations against Hezbollah in Lebanon will continue, underscoring how limited the scope of the truce really is.
“Crypto is now a hybrid asset,” CryptKeeper said. “Geopolitics matters, but liquidity and institutional flows matter more.”
That shift shows a broader maturation of the market. Bitcoin and its peers are no longer isolated from macroeconomic forces. Instead, they move increasingly in tandem with traditional indicators like interest rates, equity markets, and, crucially, energy prices. In other words, war headlines alone no longer dictate direction.
If there is a single variable crypto investors are watching most closely, it isn’t troop movements; it’s oil. A disruption in the Strait of Hormuz could send crude prices surging, feeding inflation fears and forcing central banks to maintain tighter monetary policy. That, in turn, could drain liquidity from risk assets, including crypto.
“Short-term bearish,” CryptKeeper said, pointing to the risk of a liquidity squeeze and renewed rate pressures. “But the long-term impact depends on whether oil peaks quickly or triggers stagflation.”
So far, the ceasefire has helped cap immediate fears. But the underlying risk remains: if oil spikes, crypto could feel the pressure before any safe-haven narrative kicks in.
Volatility First, Clarity Later
History hints that crypto markets may wobble before stabilizing, and this time may be no different.
“Expect short-term volatility,” CryptKeeper said. “But a recovery if the Strait remains open and oil stabilizes.”
That conditional outlook could mean how tightly crypto is now linked to global macro conditions. Stability in energy markets could pave the way for a rebound.
Noise: For Now
Asked to sum up the event in a single sentence,
CryptKeeper said “Short-term noise with bearish undertones, but a net bullish setup if the ceasefire holds and oil retreats.”
For all the geopolitical drama, crypto investors appear to be looking elsewhere for direction. Not just to war zones, but to bond yields, central banks, and the price of a barrel of oil. And for now, that may matter more than any ceasefire.
Switzerland just made one of the biggest moves in its financial history. Six major banks, including UBS, PostFinance, Sygnum, Raiffeisen, Zurcher Kantonalbank, and BCV, have come together to test a Swiss franc-backed stablecoin.
This is the Swiss banking establishment saying blockchain is real, and they are getting ready for it right now.
UBS and Swiss Banks Test CHF Stablecoin Use Cases
On April 8, 2026, UBS, PostFinance, Sygnum, Raiffeisen, Zurcher Kantonalbank, and BCV teamed up with Swiss Stablecoin AG to launch a controlled testing environment.
The sandbox will allow participants to experiment with blockchain-based payments linked directly to the Swiss franc.
The stablecoin will be designed to maintain a 1:1 peg with the CHF, ensuring price stability. By testing the token in a live but controlled setup, the group aims to evaluate how digital francs could improve payment efficiency and settlement speed.
The initiative also focuses on connecting traditional banking infrastructure with blockchain-based financial applications. This approach allows institutions to test new payment models without introducing immediate systemic risk.
What Is a Sandbox and Why Does It Matter?
A lot of people will read the word “sandbox” and picture something cautious and experimental. In reality, a sandbox is a safe test space for new ideas.
Swiss Stablecoin AG will run it, letting banks try a CHF stablecoin in real conditions. This is not a paper exercise. Real transactions will happen. Real money will move. Real problems will surface, and that is exactly the point.
The banks want to know what breaks, what works, and what needs to change before they scale this to millions of Swiss customers.
The project also welcomes additional banks, companies, and institutions, allowing a variety of participants to contribute and learn from different financial use cases. This approach ensures a safer and more reliable rollout of blockchain-based payments in Switzerland.
What This Means for the Crypto and Stablecoin World
This announcement is significant far beyond Switzerland. When six major traditional banks, not crypto startups or DeFi projects, join forces on a stablecoin, it sends a strong signal to the global financial system.
Currently, according to UBS, there is no widely used regulated Swiss franc stablecoin in Switzerland.
The stablecoin market has already grown to $320 billion, and payment flows could reach $56.6 trillion by 2030. This shows that traditional finance is increasingly exploring digital currencies, and Switzerland could become a key hub for regulated stablecoin adoption.
Zcash price shot up 25% on Wednesday, extending its monthly gains to over 60% as it continues to draw investor interest. According to data from crypto.news, Zcash (ZEC) price rose to a three-month high of $330 on Wednesday, marking gains…
UBS has partnered with PostFinance, Sygnum, Raiffeisen, Zürcher Kantonalbank, Banque Cantonale Vaudoise, and Swiss Stablecoin AG to launch a sandbox to test various use cases for a Swiss franc stablecoin in Switzerland. According to the Wednesday announcement, the initiative will…
The U.S. Securities and Exchange Commission has recently said that several past enforcement actions against crypto firms failed to deliver investor benefits and misinterpreted securities laws. In a statement outlining its 2025 enforcement results, the SEC said that since fiscal…
Ethereum price rose 7% to a three-week high on Wednesday, fueled by a broader market rebound and strengthening stablecoin supply on the network. According to data from crypto.news, Ethereum (ETH) price rose 9% to a multi-week high of $2,257 on Wednesday,…
Jiang Zhuoer, once a top Bitcoin mining leader in China, says he has shorted Ethereum, expecting prices to fall in the coming weeks and months. Based on on-chain metrics and broader market patterns, he believes the crypto bear cycle is still intact, and any sharp rallies are shorting opportunities rather than trend reversals. Zhuoer also warned that rising geopolitical tensions could trigger fresh uncertainty in markets, calling this period “America’s Suez Canal moment.”
Bitcoin price on Wednesday finally surged above the $70,000 USD mark, a level it has been struggling to break since the 26 March drop. This is purely a modest reaction to the 2-week US-Iran Ceasefire, driven by peace-talk ideas.
The announcement has brought relief to the global financial market. A 2% advancment was recorded in S&P 500 futures and 5% growth in European equity futures. While Brent crude oil faced a sharp decline of 13% to $94–$95 per barrel. Meanwhile, the commodity had mixed sentiment. Gold prices surge more than 2%.
Bitcoin and Cryptocurrencies behaved as expected. The impact is so inline that Bitcoin price rose to a 3-week high. Ethereum, Solana, XRP, BNB, DOGE, HyperLiquid, Cardano, and Chainlink are all registering gains above 5%. Top gainers in the list are ZCash (22%), EdgeEx (19%), LayerZero (16%), Athena 14%, and ICP ( 13%).
While all the top altcoins strongly follow the trail of Bitcoin, it is important to understand how these 2 weeks for Bitcoin will go.
Institutions Are Driving Upward For Bitcoin.
At the time of writing, BTC is at $71,665 with a 4% surge in 24hours and 40% surge in Volume. Looking at the border market, the institutional interest reversed as $471 million in netflow was recorded for US Spot exchange-traded funds (ETFs). The derivatives market was also in favour of Bitcoin, turning positive Open interests.
The upcoming Bitcoin proposals in the US SEC and the participation of players like Morgan Stanley uplift the sentiment. Morgan Stanley also debuted today as the ETF issuer, a Bitcoin ETF with ticker MSBT was introduced by NYSE Arca.
Bitcoin Price Eyes For $80K This Month?
BTC/USD 4-hour Chat shows a corrective but bullish picture for Bitcoin. The price in the early session tested the $72,000 zone, but couldn’t survive the panic selling.
As per Coinpedia Markets The price may face correction as the sentiment follows, the ultimate zone of support is at $69000 to $68500. Whereas the resistance still sits at $72,000.
BTCUSD_2026-04-08_13-55-48
The combination of the indicator Average Directional Index (ADX) at 32 and the Bollinger Bands, where price is hugging the upper band and has a wide structure, shows continuation of the trend.
The durability of the current trend is highly dependent on the Ceasefire status for next week and thereafter. Opening of the Strait of Hormuz or any solid news of settlement may scale the Bitcoin capacity to hit $80,000 targer again.
In contrast to any of the positive steps, we may see more sales offices with negative volume and reduced liquidity.
Iran’s Bitcoin mining sector has taken a major hit amid the ongoing conflict involving the U.S., Israel, and Iran. The country has reportedly lost around 77% of its Bitcoin mining power, forcing thousands of miners offline.
The crisis has slowed global Bitcoin mining too, with the network dropping 5.8% QoQ, while falling Bitcoin prices continuously.
Iran Bitcoin Hashrate Drops Sharply
According to a Hashrate Index report, Iran’s Bitcoin hashrate has plunged from around 9 exahashes per second (EH/s) to just 2 EH/s, a drop of nearly 7 EH/s quarter-over-quarter.
The country, which once ran roughly 427,000 active Bitcoin miners, is now operating at a fraction of that capacity.
The trouble began in February 2026, when the US and Israel launched strikes against Iran. This led to rising conflict, infrastructure risks, and energy disruptions, which appear to be forcing miners offline.
Recently, Trump even threatened to strike power plants, energy facilities, and bridges, further worsening the situation.
Interestingly, the crisis remains contained within Iran. Neighboring countries like the UAE and Oman, each controlling about 3% of the global Bitcoin hashrate, have seen no disruptions and continue steady growth, supported by long-term government infrastructure plans.
Global Bitcoin Hashrate Declines By 5.8% QoQ
The impact isn’t just in Iran; global Bitcoin hashrate has also fallen. Data shows the network dropped to around 1,004 EH/s in Q2 2026, down from 1,066 EH/s in Q1 2026, a 5.8% decline quarter-over-quarter.
While the network remains strong near 1,000 EH/s, the drop signals slower mining activity and tougher conditions for miners.
Looking at market share change, China has lost 1.35% QoQ after Xinjiang enforcement actions cut about 13% of its capacity. Meanwhile, Iran dropped 0.6% due to US-Israel conflicts, and the US fell by 0.13%.
Experts say the decline reflects broader pressure across the Bitcoin mining industry.
Bitcoin Price Drop Adds More Pressure
The mining slowdown also comes as the Bitcoin price remains below its previous highs. Bitcoin has fallen roughly 50% from its October 2025 peak near $126,000 and is now trading around $70,000.
Lower prices reduce mining profitability, pushing smaller operators offline. Hashprice has also dropped to around $27.89 per PH/s per day, marking historically low returns for miners.
Despite the decline, the Bitcoin network continues operating normally.
XRP Price has kicked off April on a relatively steady note. The token recently climbed to around $1.39, slightly outperforming Bitcoin in the same period. For investors, the bigger takeaway is not the short-term move but the fact that XRP is holding above the $1.30 level. That support has remained intact despite weeks of sideways movement,
Meanwhile, the CLARITY Act is back in focus as the Senate returns on April 13, with limited time before midterms slow progress. For XRP, this is important. Ripple’s $2.4 billion infrastructure still runs mostly on fiat and RLUSD, but the Clarity Act could allow banks to start using XRP directly for liquidity.
The “Strong April” Myth Explained
There is a popular belief that April is one of XRP’s best months, with average returns of around 25%.
But that number can be misleading. Most of that performance comes from one exceptional month in 2021, when XRP surged over 170% during a major bull run. Outside of that, April has often been far less exciting.
In fact, recent years tell a different story. XRP fell sharply in April 2022, dropped again in 2023, and declined more than 20% in 2024. When you remove the 2021 spike, typical April returns are small and sometimes negative.
Where XRP Stands Right Now
So far, April 2026 is following that “normal” pattern. XRP has moved only slightly higher, gaining around 2–3% in early trading. The price action has been choppy, with no clear direction yet.
This kind of movement often signals a market that is waiting. Sellers are not in full control, but buyers are also not pushing aggressively. In simple terms, XRP is stable, but not yet strong.
What Could Move XRP This Month
Two events stand out. First is the Fed meeting at the end of April, led by Jerome Powell. His stance on inflation and rate outlook could decide whether risk assets get relief or face more pressure.
Then there’s the SEC roundtable on April 16, which could give early signals on where regulation is heading before any actual vote happens.
On the ground, Ripple is also active globally, with events like XRP Tokyo 2026 adding to sentiment around real-world adoption.
What Comes Next
In the short term, XRP is holding steady but lacks a strong push. Some X users see a bigger move building, especially after a long-term trendline break, with bold targets going as high as $7 if momentum picks up.
For now, April is shaping up as a mix of policy pressure, macro uncertainty, and tumbling price action.
U.S. lawmakers have begun questioning the Commodity Futures Trading Commission over the agency’s inaction on alleged insider trading in prediction markets tied to geopolitical events. Seven members of the U.S. House of Representatives wrote a letter to CFTC Chair Michael…
Anthropic has begun limiting access to its latest AI system, Claude Mythos Preview, after early testing showed it could uncover thousands of critical vulnerabilities across widely used software environments. The model, described as general purpose, identified critical vulnerabilities spanning major…
Lookonchain noted that the “yes” bets were placed at probabilities between 2.9% and 10.3%, with the three wallets placing their first bets within 26 hours of the announcement.
AI models have reached a level of coding capability that rivals or exceeds that of most human experts at finding and exploiting software vulnerabilities, Anthropic said.
BitMEX co-founder Arthur Hayes said he is currently buying only Hyperliquid’s HYPE token, as the asset posts strong gains and trading activity increases.
HYPE rose about 9% in the past 24 hours and has gained nearly 60% since the start of the year. The move follows Hayes’ public comment that “the only thing we’re buying right now is HYPE.”
Arthur Hayes Backs Hyperliquid’s HYPE Token
Arthur Hayes is very bullish on the HYPE token (the native asset of Hyperliquid). It is one of the fastest-growing trading platforms in crypto.
He recently said, “the only thing we’re buying right now is HYPE,” showing strong confidence.
One of the key reasons is its rapid growth. Hyperliquid is generating around $1 billion annually from trading fees. Also, the platform uses 97%–99% of fees to buy back HYPE tokens, which helps push the price up.
Hayes also says no other crypto project gives back this much value to token holders.
Meanwhile, Arthur Hayes is buying HYPE while selling other tokens, including ETHFI and AUKI.
Big Buyers Keep Loading HYPE
But it’s not just Arthur Hayes buying HYPE. The Hyperliquid Assistance Fund also bought 39,000 HYPE for $1.4 million at around $36.88.
On April 7, 2026, the fund holds 42.99 million HYPE, purchased for about $1.04 billion, with an average price of about $24.3. This is part of Hyperliquid’s buyback and burn plan.
At the same time, HyperCore continues to buy HYPE in small amounts, usually between $1.5M and $1.7M.
However, big whales are also joining in. One whale, “yeti.hl,” bought 58,884 HYPE worth $2.19M at around $37.21 per token.
HYPE Token Jumps 9%, Up Nearly 60% This Year
Following Hayes’ statement, the HYPE token recorded a sharp price move. The token is currently trading around $39, up nearly 9% in the past 24 hours.
The token has also seen strong performance over a longer period. Since the start of the year, HYPE is up nearly 60%, making it one of the top performers in the derivatives space.
Hayes’ support brought more attention. As trading volume quickly jumped by 75%, reaching around $320 million in just 24 hours.
This rise shows growing use and higher activity on Hyperliquid.
If you still carry the sting of watching ETH go from $100 to nearly $5,000 and not being in, the market just cracked open a window that feels the same, and this time you can spot it.
Bitmine just bought another 71,252 ETH in a single week, pushing total holdings to 4.8 million tokens worth $10.2 billion and locking up nearly 4% of all ETH, and the price keeps grinding sideways while this giant gets ready for a NYSE uplisting on April 9.
Pepeto is closing in on its Binance listing with the presale moving at its quickest speed, and over $8.78M has been raised during a Fear and Greed reading of 13.
Ethereum Price Prediction Meets Pressure as Bitmine Stacks $10 Billion in ETH
Bitmine disclosed it now holds 4,803,334 ETH worth $10.2 billion as of April 6 according to Bitcoin Ethereum News, with 3.33 million ETH staked through its MAVAN platform earning $196 million a year. The company moves to the NYSE on April 9, backed by Cathie Wood’s Ark, Founders Fund, and Pantera Capital.CoinMarketCap shows ETH at $2,161 on April 6 with the total crypto market at $2.45 trillion.
Blockchain Magazine reported ETH jumped over 4.8% in 24 hours. The price stays flat while one firm quietly locks up nearly 4% of every ETH token that exists, and your portfolio feels the gap.
The Ethereum Price Prediction Entry to Watch Right Now
Pepeto: The Tools Your Money Needs While ETH Waits
The Binance listing draws closer, and the presale fills quicker with every round. Pepeto is a contract scanning and zero-fee trading platform, the kind of tool that grows more useful when the market gets risky, and ETH stays stuck.
While ETH holders wait for upgrades and hope big money comes back, Pepeto scans every contract live on three chains, including Ethereum, BNB, and Solana, catching the bad ones before they touch your wallet and handing you the same level of protection that large funds have always kept for themselves. PepetoSwap runs every trade at zero fees, so the size of your buy is the size of your position, and your money starts working right away instead of sitting inside a $260 billion market cap hoping for more to show up.
Over $8.78M raised at $0.0000001862 during Fear 13, and the presale sits at a size where 100x from this entry is what analysts see because the token runs real trades and the Pepe cofounder behind it proved the model when Pepe hit $7 billion. Every contract passed SolidProof, an ex-Binance dev lead built the exchange, and staking at 187% APY grows your bag while the listing gets closer.
Buying after the Binance listing means paying whatever the crowd that missed the presale decides those tokens cost, and the wallets that entered during Fear 13 are the ones whose money grows first while latecomers pay more for what early buyers locked in months before.
Ethereum Price Prediction
ETH trades at $2,161 on April 6, according to CoinMarketCap, down 57% from its $4,953 peak in August 2025. Bitmine’s 71,252 ETH weekly buy proves big money still believes, but the price has not responded yet.
Standard Chartered projects $7,500 by year-end, a 3.5x that plays out over quarters. Support sits at $2,000 with the first wall at $2,200 and then $2,500.
A drop below $2,000 risks a retest of $1,800. The Ethereum price prediction math from a $260 billion cap means even the most bullish target hands you a return that your money reaches over a year, not the kind that changes the next 12 months of your life.
Conclusion
The ethereum price prediction tells you ETH needs time to reach the levels that matter, and if the pain of missing ETH’s early move from pennies to thousands still sticks, this is the clearest second shot the market has handed you because Pepeto is sitting in that same kind of moment with a confirmed Binance listing and live trading tools that ETH did not have at that price.
Last cycle turned early wallets into millionaires, and every one of them repeats the same line: they wish they had gone bigger when the entry was open, and fear was keeping the crowd away.
The Pepeto official website still has presale pricing live while Bitmine stacks $10.2 billion in ETH, and the Ethereum price prediction grinds sideways. Buying now is how you stop dragging regret from one cycle into the next, because the Binance listing turns this entry into the return, and the presale shuts that door for good.
Is the Ethereum price prediction enough to justify holding through the current dip?
Standard Chartered projects $7,500, and Bitmine stacked $10.2 billion in ETH, showing deep conviction. Pepeto targets 100x from one listing event through the Pepeto official website.
Is Pepeto the second chance for wallets that missed early ETH?
Over $8.78M raised during Fear 13, with a confirmed Binance listing shows the setup mirrors early cycle entries. The Ethereum price prediction needs quarters to reach its targets, while Pepeto reaches its return from one listing day.
The Zcash price has displayed an exceptional rise of nearly 23% in the past 24 hours, reaching $322.50 with a nearly 200% increase in volume. The token is pushing higher, but this isn’t the breakout that traders were hoping for. After weeks of consolidation, the price has surged into a critical resistance zone near $330. Momentum is building, volume is returning, and buyers are stepping in.
But in the larger perspective, the trend leans bearish as the ZEC price is at a make-or-break moment where the next move could define the trend.
Why Is Zcash Price Rising Right Now?
Zcash’s recent move isn’t random — it’s being driven by a mix of technical breakout signals and short-term demand returning to the market. But this is still a momentum-led rally, not a fundamental trend shift.
Key Reasons Behind the Rise:
Open Interest Jumped Sharply: Futures Open Interest climbed to ~$494M, rising 10%+ in 24 hours, signaling aggressive positioning.
Short Liquidations Fueling Upside: Around $1.1M+ in short positions were liquidated, accelerating the upward move.
Volume Expansion Confirms Strength: Trading activity surged significantly, with volume jumping ~77% recently, showing real participation.
Breakout Above Key Technical Level: Price reclaimed the 50-day EMA (~$248) and is now pushing toward the $320–$330 resistance zone.
Strong Relative Momentum: ZEC previously rallied from ~$195 to ~$275 (+40%), establishing a base for the current move.
Now that the price has broken the structure, the question arises whether Zcash can secure the critical resistance and turn it into a base.
ZEC Price Analysis: Breakout Meets Resistance
Zcash has shifted from quiet accumulation into an aggressive push higher, but the move is now running into a critical resistance zone. After climbing from the $200 region and breaking above its short-term channel, the price is currently testing the $320–$330 area, which is a level that could decide whether this rally evolves into a trend reversal or fades into another rejection.
The chart shows a clear rising channel structure from ~$200 to ~$280, followed by a breakout attempt toward higher levels. However, this move is colliding with a strong confluence zone that includes the 200-day moving average (~$330) and a previous supply region where sellers stepped in earlier this year. While momentum is improving, with CMF turning positive (~+0.13) and higher lows forming, the broader structure still reflects a downtrend, as ZEC has yet to break its macro lower high. This creates a classic conflict: short-term strength versus long-term resistance.
Key Levels to Watch
Immediate Resistance: $320–$330 (200 MA + supply zone)
Bullish Breakout Level: Above $330 (daily close confirmation)
Upside Targets: $375 → $420
Immediate Support: $280
Breakdown Level: Below $280
Downside Targets: $250 → $215
Breakout or Rejection: What’s Next for the ZEC Price Rally?
The Zcash price is at a decisive point. The rally from the $200 zone has been strong, but it’s now facing its first real test at $320–$330 — a level that will determine whether this move turns into a sustained trend or fades as a short-term spike.
If bulls manage a clean daily close above $330, the structure shifts in their favor, opening the door for a continuation toward $375 and $420. This would mark a confirmed breakout above long-term resistance.
However, if the price fails to hold this zone and gets rejected, the move risks unwinding quickly. A drop below $280 would invalidate the bullish setup and expose ZEC to downside targets at $250 and $215.
The crypto rally is accelerating, with Bitcoin price sprinting toward $72,000 as markets react to a sharp improvement in global sentiment following ceasefire developments. This shift has triggered a risk-on wave across financial markets, with crypto leading the move. Unlike previous rebounds, this rally is showing clear strength and follow-through, not hesitation.
What’s Driving the Crypto Rally? Ceasefire Trigger Sparks Market-Wide Reaction
The primary catalyst behind today’s crypto rally is a major geopolitical development. A 2-week ceasefire agreement between the US, Iran, and Israel has significantly eased global uncertainty, particularly around the Strait of Hormuz, a critical oil supply route. This development has triggered a broad risk-on sentiment shift, pushing capital back into high-risk assets like crypto. The market reaction was immediate.
Bitcoin surged above $70K
Ethereum moved past $2,200
Both marking multi-week highs Adding to this, social data shows a clear shift in sentiment. For only the second time since late February, more than 1% of total crypto discussions are focused on the conflict ending, a strong signal that market participants are turning optimistic.
This combination of macro relief + sentiment spike + technical breakout is what is driving the current crypto rally, not speculation, but a clear catalyst-backed move.
Bitcoin Price Prediction: Can BTC Smash $75K?
Bitcoin price is rallying strongly today, gaining over 4% to trade near $71,600–$72,000, as bulls step in aggressively and reclaim control of the trend. The move above the $70,000 level is critical. This zone previously acted as resistance, and its successful reclaim now flips it into strong support, signaling a shift from consolidation into expansion. BTC price is also holding near intraday highs, indicating continued buying pressure rather than profit-taking.
Structurally, Bitcoin is now forming a higher high, confirming bullish continuation and strengthening the case for further upside. As long as BTC holds above $70K, the rally is likely to extend toward $74K–$76K. A clean breakout above $72K could accelerate momentum, while a drop below $69K would be the first sign of short-term weakness.
Ethereum Price Prediction: What’s Next for ETH?
Ethereum is gaining momentum, rising over 6% to trade near $2,230, as the crypto rally expands across major assets. The reclaim of the $2,100–$2,200 range marks a key structural shift. This zone had capped price during consolidation, and its breakout now confirms bullish continuation, with ETH holding steady above resistance-turned-support. Unlike volatile spikes, Ethereum’s move is showing controlled expansion, suggesting sustained demand and growing market confidence.
Holding above $2,100 keeps Ethereum positioned for a move toward $2,300–$2,500. A break below $2,050 would weaken the short-term structure, but current momentum favors upside continuation.
XRP Price Spikes 5%: Can It Reach $2?
XRP price is moving higher today, gaining around 5% to trade near $1.38, as bullish momentum builds across large-cap altcoins. The breakout above $1.30 is a key development. This level acted as a consolidation ceiling, and its reclaim confirms a shift into bullish structure, with XRP now forming higher lows and sustaining upward pressure.
XRP price is also holding above breakout levels, indicating acceptance rather than rejection, which typically supports continuation moves. As long as XRP holds above $1.30, the rally could extend toward $1.75–$2.00. A move below $1.25 would be the first signal of weakening momentum, but current structure remains firmly bullish.
Outlook: What’s Next for the Crypto Market?
The crypto market is shifting into a clear expansion phase, with momentum building across Bitcoin, Ethereum, and XRP. As long as Bitcoin holds above $70K, the broader crypto rally is likely to extend, with upside targets opening higher across majors. Near-term, the focus remains on breakout continuation, not reversal. Any pullbacks are likely to be viewed as buy-on-dip opportunities, rather than trend weakness. In short: momentum favors bulls, and the crypto rally still has room to run.
The bitcoin price just got a major boost from history itself. A new study by Mercado Bitcoin found that BTC beats gold and the S&P 500 in the 60 days after every major global shock, according to CoinDesk. With BTC sitting at $69,930 after a 3.4% bounce and the market deep in extreme fear, the pattern that has pushed BTC back to new highs after every crash is playing out again.
The path to $100,000 is backed by data, but even a 45% gain from here is not the kind of return that rewrites your year. Pepeto raised $8.84M with a Binance listing on the way, and the current stage fills fast because the presale entry is the one that turns into the number everyone remembers after listing day.
Bitcoin Price Builds the Case for $100K as Post-Shock Data Points Up
Mercado Bitcoin analyzed 60-day windows after every major economic and geopolitical shock and found that BTC posted stronger gains than both gold and the S&P 500 in each period, according to CoinDesk. With BTC down 45% from its $126,198 all-time high set in October 2025, the current drop lines up with the exact conditions that have led to the biggest recoveries in Bitcoin’s history.
Standard Chartered holds a $150,000 year-end target. Bernstein projects $200,000. Four out of five AI models asked by 24/7 Wall Street whether BTC will hit $100,000 again in 2026 said yes, with targets ranging from $100,000 to $250,000.
The bitcoin price sits at $69,930 according to CoinMarketCap with Fear and Greed at 13. The setup matches every prior recovery: extreme fear, heavy short positions getting cleared, and big money loading while retail waits on the side.
The Presale That Closes Before BTC Hits $100K and Why the Real Gains Start Here
Traders watching BTC build toward $100K are doing two things: betting the market climbs, and choosing the best spot to ride it. Most land in tokens that are already priced in the rally. Pepeto still has the entire move ahead because the open market has not touched this price yet.
The exchange fixes a problem that gets worse every bull run: fresh tokens pour in, scams multiply, and regular buyers have no way to verify a contract before their wallet connects. The built-in scanner catches risky code and dangerous permissions before your money moves. PepetoSwap runs every trade at zero fees, and the cross-chain bridge sends tokens between ETH, BNB, and SOL at zero cost.
These are not plans on a slide deck. Every tool is live, and early holders have been testing them for months. BTC points toward $100,000, but that is a 45% gain over the past month. Meanwhile, $8.84M raised at $0.0000001862 during extreme fear with 187% APY staking growing positions daily. SolidProof audited every contract from top to bottom, and the Pepe cofounder who helped build a token that hit $7 billion created the exchange with an ex-Binance dev lead on the team.
Once listing day hits, Pepeto trades at whatever price buyers and sellers set. The presale price only lasts until then, and the BTC recovery that everyone sees coming will push capital straight into entries just like this.
BTC Outlook: Can Bitcoin Price Get Back to $100K From Here?
BTC trades at $69,930 on April 6 with extreme fear across the board and a bounce forming off the $65,000 low hit on April 2, according to CoinMarketCap.
The bitcoin price needs to clear $72,000 to confirm a higher high, which opens $78,000 and then the real test at $85,000. Changelly projects BTC reaching $100,000 by December 2026. Standard Chartered has an even higher target. But even the run from $69,930 to $100,000 adds 45% to your stack over months. The presale at $0.0000001862 is where the gain that rewrites everything sits.
Bitcoin Price Confirms the Presale Entry Is the One That Matters Most
The bitcoin price is building toward $100,000, and every post-shock recovery in BTC’s history says it will get there. But the wallets that make the biggest gains this cycle will not be the ones holding BTC alone. They will be the ones who added Pepeto at $0.0000001862 before the Binance listing turned this price into a memory.
Moving now through the Pepeto official website puts you on the winning side when listing day hits, instead of staring at the chart after and knowing the window shut while you were still waiting.
Can the Bitcoin price reach $100,000 again in 2026?
Mercado Bitcoin’s study shows BTC beats gold and the S&P 500 in the 60 days after every major shock. Standard Chartered targets $150,000 by year end and four out of five AI models project $100K or higher.
Is Pepeto a better entry than buying the Bitcoin price dips right now?
Bitcoin at $69,930 heading to $100,000 delivers 45% over months. Pepeto at $0.0000001862 with 187% APY staking and a Binance listing ahead offers the kind of return that a 45% BTC move cannot match from current levels.
The live price of the Synthetix token is $ 0.30136333
The SNX price can reach a maximum of $1.82 in 2025.
Synthetix price, with a surge, could reach a potential high of $13.86 by 2030.
Synthetix (SNX), a decentralized finance protocol on Ethereum, enables users to mint synthetic assets, or “synths,” by staking its native token. The platform focuses on derivatives and on-chain trading without traditional order books.
The SNX token’s performance has declined since its 2021 peak, and the Synthetix Price Prediction 2026 depends heavily on protocol upgrades and broader DeFi adoption.
Synthetix (SNX) has several updates planned for Q2 2026 that could support its price. Adding ETH and cbBTC as margin in Perps may bring in a lot of unused capital and increase trading activity.
The team also wants to keep sUSD stable at $1 by the end of the quarter, which is important for user trust. A new Synthetix Liquidity Pool (SLP) vault with high yield is expected to go public, attracting more users.
All trading fees are used to buy back SNX and sUSD. Once sUSD stays stable, buybacks will focus only on SNX, reducing supply.
If these plans work well, SNX could grow and may reach around $1.45 in Q2 2026, though it depends on market conditions.
Month
Potential Low ($)
Potential Average ($)
Potential High ($)
Synthetic Q2 Price Prediction For 2026
$0.252
$.574
$1.45
Synthetix (SNX) is in a long-term downtrend on the weekly chart, with consistent lower highs and lower lows since 2022. The highlighted zone around $1.40–$3.20 is a major resistance area where price previously consolidated and later broke down, turning it into a strong supply.
For the price to reach $1.45 in Q2 2026, it must break key levels: $0.35, $0.50, and $0.80, then reclaim the $1 range. That would require a strong altcoin market and renewed DeFi demand.
Synthetix Price Prediction 2026
Synthetix (SNX) has a clear plan for 2026. One big change is moving to a deflation model, where all fees are used to buy back and burn SNX. This can slowly reduce supply and support the price.
Keeping sUSD at $1 is also very important. If it loses its value, people may lose trust in the project.
Synthetix also plans to launch new futures trading where users can use assets like ETH as margin. This could bring more users and increase fees.
If everything works well and the market is strong, SNX prices could go up. In a best-case scenario, it may reach around $2.73.
Year
Potential Low ($)
Potential Average ($)
Potential High ($)
Synthetix Price Prediction 2026
$0.6084
$1.825
$2.7354
Synthetix Price Prediction 2026 – 2030
Year
Potential Low ($)
Potential Average ($)
Potential High ($)
2027
$0.15
$0.65
$4.10
2028
$2.05
$4.10
$6.16
2029
$3.08
$6.16
$9.24
2030
$4.62
$9.24
$13.86
Synthetix Price Prediction 2027
Rising on-chain derivatives and institutional participation could accelerate growth. Expanding cross-chain access may help SNX trade between $1.37–$4.11, with an estimated average of $2.74.
Synthetix Price Prediction 2028
Greater interoperability and stronger user adoption may reinforce network strength. Sustained DeFi integration could drive SNX within $2.05–$6.16, averaging close to $4.11 through 2028.
Synthetix Price Prediction 2029
As synthetic and tokenized assets mature, Synthetix could see steady demand growth. Prices may fluctuate between $3.08–$9.24, maintaining an average near $6.16.
Synthetix Price Prediction 2030
If DeFi derivatives go mainstream, SNX could serve as a key liquidity layer. The token might reach $4.62–$13.86, stabilizing around an average of $9.24 for 2030.
What Does The Market Say?
Year
2026
2027
2030
Wallet Investor
$2.57
$2.526
$ 2.93
priceprediction.net
$2.08
$3.02
$13.60
Digitalcoinprice
$5.00
$7.24
$14.50
CoinPedia’s Synthetix (SNX) Price Prediction
As per Coinpedia’s formulated Synthetix price prediction. Certain partnerships with other undertakings and startups might result in attaining high prices for the investors.
In such a case, SNX’s price might hit the annual high for 2025 at $1.825. On the other hand, if the bears continue to dominate the industry, the price might slump to $0.608.
Year
Potential Low ($)
Potential Average ($)
Potential High ($)
2026
$0.6084
$1.825
$2.7354
FAQs
Is Synthetix powered by the Ethereum blockchain?
Yes, Synthetix is an ERC-20 token, powered by the Ethereum blockchain.
Can Synthetix be halved?
No, Synthetix cannot be halved as it is only mined.
How high will the Synthetix price go in 2027?
The SNX price may record a yearly high of $4.1 during the year 2027.
What makes Synthetix a unique digital currency?
Synthetix enables a special feature called Peer-to-contract trading. It executes the trade quickly and easily without an order book.
What will be the maximum and minimum price of Synthetix (SNX) in 2030?
With a potential surge, the price of SNX may record a high of $13.86 during that year. However, bearish action could result in the altcoin recording a low of $4.6
Is Synthetix a collateralized platform?
Yes, Synthetix is a collateralized platform.
Is it worth investing in Synthetix?
Yes, Investing in Synthetix might be worth it if you are thinking for the long term.
Bitcoin price rose 6.7% on Wednesday to a 3-week high of $72,379 as the ongoing war between the U.S. and Iran showed signs of de-escalation. According to data from crypto.news, Bitcoin (BTC) briefly surged past the $72,000 psychological resistance on…
Coinbase has secured an Australian financial services license and plans to deepen its presence in Australia, expanding into futures, options, stock trading, payments, and other traditional finance products. According to Coinbase’s regional managing director for APAC, John O’Loghlen, the Australian…
Morgan Stanley is set to launch its Bitcoin exchange-traded fund on the NYSE Arca stock exchange this Wednesday. A listing notice issued by the New York Stock Exchange on Tuesday confirms that the Morgan Stanley Bitcoin Trust will start trading…
The Federal Deposit Insurance Corporation has proposed new rules under the GENIUS Act to oversee stablecoins issued through the banking system. According to a statement released on Tuesday, the board of directors voted to propose a rule that would set…
On April 7, major crypto ETFs saw uneven investor activity. Bitcoin spot ETFs recorded a $159 million net outflow, and Ethereum spot ETFs shed $64.67 million, reflecting short-term selling pressure. Solana (SOL) spot ETFs also saw a $15.40 million outflow, while XRP spot ETFs bucked the trend with a $3.32 million net inflow, showing selective interest in certain altcoin products. These flows highlight a cautious ETF market with varied demand across crypto assets.
Bitcoin’s correlation with global central bank easing turned strongly negative since 2024, meaning BTC now leads monetary policy signals rather than reacting to them according to analysts tracking ETF flows. That bitcoin price prediction shift changes the playbook because the next move may already be priced in before the announcement lands.
Every cycle has its defining presale, and Pepeto is becoming that entry with more than $8 million locked in from a project engineered by the cofounder who took the original Pepe coin to billions, with a confirmed Binance listing approaching.
Bitcoin Price Prediction April 2026: ETFs Drive BTC to Front Run the Fed
Bitcoin is now front running the Fed rather than following it, with the correlation between BTC and central bank easing turning negative since 2024 according to CoinDesk.
BTC trades at $69,668 after reclaiming $69,000 on ceasefire reports but failing to hold $71,500 three times according to CoinMarketCap.
The bitcoin price prediction depends on whether ETF inflows sustain the lead, and the presale entry still open today creates its own catalyst without waiting for the Fed.
BTC Leading the Fed and the Presale Defining the Cycle Entry
Pepeto: The Presale Everyone Is Talking About While BTC Grinds
Every cycle produces one opportunity that defines the returns people talk about for years afterwards, and Pepeto is rapidly becoming that entry with more than $8 million committed and the token locked at $0.000000186. Early holders are securing positions at the lowest round before the confirmed listing pushes the entry permanently higher, and big wallets moving in during fear at an index of 13 proves the signal is real.
At its core, Pepeto is engineered to level the field between everyday holders and the desks that normally trade with advantages retail never sees. The risk scorer watches on chain patterns and flags contract threats in real time before capital commits, so money never lands inside a project built to empty positions quietly.
Pepeto turns the raw data of scattered exchange activity into trading clarity, removing the complexity that costs holders money across disconnected platforms. The cofounder who took the original Pepe coin to $11 billion engineered this alongside a Binance specialist, and SolidProof reviewed every contract line.
The presale filling is impossible to ignore, with each stage lifting the entry price and stacking returns for wallets that positioned earliest, and holders also earn 187% APY staking while the listing gets closer. The confirmed Binance listing is projected to deliver 100x from this entry, and the bitcoin price prediction pointing toward $80,000 at best confirms hesitation costs capital when the presale delivers more distance.
The right entry in crypto at the right moment is how every success story started, and the original Pepe coin exploding from presale price proved that the wallets acting on the signal before the crowd confirmed it built the biggest returns of the cycle.
Bitcoin Price Prediction for April 2026
BTC trades at $69,668 after failing to hold $71,500 resistance three times since February, according to CoinMarketCap.
ETFs registered strong early 2026 inflows but the pace slowed amid geopolitical tensions, according to CoinDesk. The bitcoin price prediction for April targets $75,000 to $80,000 if the CLARITY Act roundtable delivers favourable outcomes, with key support at $66,000.
A best case 16% gain to $80,000 is the Q2 ceiling most models show, and the bitcoin price prediction from $69,668 cannot produce the kind of multiplication that presale to listing distance delivers in one event for wallets that secured the entry before the crowd showed up.
Conclusion
With BTC front-running the Fed and the bitcoin price prediction pointing to limited ceilings, wallets are searching for the entry that produces real returns. BTC and established tokens already perform well but their math cannot match what the presale to listing distance creates when one event reprices everything.
The original Pepe coin exploded from nothing, and the wallets that acted on the signal before the crowd confirmed it made the biggest returns of their lives, and Pepeto assembled by the same cofounder with working tools and a confirmed Binance listing, is exactly how that wealth creation pattern gets repeated, with $8 million on the Pepeto official website proving the conviction.
The presale price vanishes permanently once listing opens, and the gap between presale entry and listing day is where the wealth of this cycle gets created.
What does the Bitcoin price prediction say for April?
BTC trades at $69,668 with $71,500 resistance holding, and the CLARITY Act roundtable on April 16 could push toward $75,000 to $80,000.
How to identify the strongest presale entries?
Look for verified audits, working products, and confirmed exchange listings. Pepeto delivers all three with SolidProof, a working exchange, and Binance.
Can Pepeto match the Bitcoin price prediction returns?
Analysts project 100x from presale to listing while BTC targets 16%. The Pepeto official website confirms $8 million entered from wallets that ran the numbers before the crowd.
Crypto markets are back in action this week, with Bitcoin, Ethereum, and XRP all moving higher as sentiment flips positive. After weeks of uncertainty, a mix of geopolitical relief and improving technical setups is driving this rebound.
Ceasefire Talks Trigger Risk-On Move
The main catalyst is easing tension in the Middle East. A two-week ceasefire between the US, Iran, and Israel, along with earlier talks of a longer deal, has reduced fears around a major escalation.
“Almost all of the various points of past contention have been agreed to between the United States and Iran, but a two-week period will allow the Agreement to be finalized and consummated,” Donald Trump wrote on social media.
As the US-Iran ceasefire cooled the tension, markets quickly returned to “risk-on” mode. According to Santiment, Bitcoin jumped above $72.7K and Ethereum crossed $2,250, both hitting multi-week highs, while social sentiment turned bullish around a possible end to the conflict.
Other factors pushing the rally
Oil prices, which had previously surged on war fears, are now cooling. That’s a positive signal for crypto. High oil prices usually push inflation higher and delay rate cuts, tightening liquidity.
With oil easing, liquidity conditions improve, and that’s helping capital rotate back into crypto and equities, supporting the current rally.
Meanwhile, the Clarity Act is making a buzz. Right now, Senate committees are working through key provisions before a possible floor vote, with timelines pointing toward mid-2026 as a critical window. The pro-crypto Senator Bill Hagerty said the committee was “very close” to starting work on the bill.
Bitcoin is trading around $71,600, up over 4%, and now pushing toward a key resistance near $72,600. It has reclaimed its 50-day EMA around $70,500, turning it into support, while RSI near 58 shows buyers still in control. A breakout above $72.6K could open the path toward $74,800.
Ethereum is holding above $2,200 after a 6% weekly rally, reclaiming its 50-day EMA near $2,150. Momentum is improving, with RSI around 60. If ETH breaks above $2,380, it could extend toward $2,575, while $2,138 now acts as key support.
XRP is trading near $1.37, rebounding from the $1.30 level. It’s approaching the 50-day EMA at $1.42, a crucial resistance level. Holding above $1.30 keeps the recovery intact, while a move above $1.42 could push it toward $1.45.
FAQ
Why is the crypto market up today?
The market is up +4.08% to $2.45T mainly due to a U.S.–Iran ceasefire, which reduced global uncertainty and triggered a risk-on rally across assets.
How are macro markets influencing crypto right now?
Crypto is moving in sync with traditional markets, showing a 98% correlation with the S&P 500 and Gold, meaning the rally is largely driven by macro factors like interest rates and the dollar.
President Donald Trump said the United States and Iran were “very far along” toward a “definitive” peace agreement, confirming that Washington had agreed to a two-week ceasefire to keep negotiations on track. “Based on conversations with Prime Minister Shehbaz Sharif…
FDIC’s proposed rules providing insurance for corporate deposits of stablecoin issuers will not extend to the stablecoin holders, as it would conflict with the GENIUS Act’s text, the FDIC said.
The 30-day simple moving average of the global network hashrate has also declined, though an analyst says the slump is due to Bitcoin prices hurting mining profitability rather than conflict.
XRP price has now rejected the descending trendline resistance at least three times since late March, and the most recent failure on April 6 to 7 arrived on rising volume, a signal analysts associate with bearish continuation rather than consolidation.…
Bitcoin price briefly touched $70,000 on April 7 within a well-formed ascending channel on the 4H chart, as spot ETF inflows logged $471 million on April 6, the strongest single-day institutional demand figure since late February. Bitcoin (BTC) price is…
Bitcoin ETF inflows hit $471 million, but stress on digital asset treasuries, selling from miners, and the war in Iran are keeping BTC stuck below $70,000.
According to the bureau, a large number of minors aged 17 and younger were included in complaints related to crypto or crypto ATMs, resulting in more than $5 million in losses.
The latest AI news China Iran artificial intelligence military US bases geopolitics story escalated on April 5 when an ABC News exclusive revealed that the US Defense Intelligence Agency has confirmed Iran’s Islamic Revolutionary Guard Corps is actively using AI-enhanced…
The latest AI news artificial intelligence US military Iran war 2026 debate has crystallized around one figure: in the first 24 hours of Operation Epic Fury on February 28, the US military struck more than 1,000 targets in Iran using…
The latest crypto news US CLARITY Act Senate 2026 bitcoin regulation battle has reached a pivotal moment: the bill that would define US crypto law for a generation is deadlocked between four factions in the Senate Banking Committee, and Senator…
The crypto market update oil prices Iran war bitcoin impact news today is being written by an energy market in freefall: US crude surged above $115 per barrel and Brent crossed $111 after Tuesday’s Kharg Island strikes, the IEA’s head…
The crypto market update bitcoin war hedge Strait of Hormuz news today centers on a striking development: Iran’s IRGC has established a formal toll system at the world’s most critical oil chokepoint, demanding payments in stablecoins or Chinese yuan for…
The bitcoin price prediction latest crypto news Iran deadline today tells a familiar story: BTC briefly reclaimed $70,000 on Monday ceasefire hopes before retreating to the $68,000 range on Tuesday as Iran rejected the deal and Trump’s 8 PM ET…
Uniswap’s (UNI) price rose about 4–5% over the past 24 hours on Tuesday, clawing back ground after a week of steady selling as traders rushed to cover shorts and fade what they saw as an overshoot to the downside. UNI…
The US politics news today midterm election Georgia Trump test is live: polls opened this morning in the deeply conservative Georgia-14 district that Marjorie Taylor Greene vacated, where Republican Clay Fuller faces Democrat Shawn Harris in a runoff that analysts…
Cardano’s ADA climbs about 4–5% to the mid‑$0.24s on Tuesday as traders rotate into high‑beta majors, but futures data shows churny perps and weak open interest behind the move. Cardano’s price rallied roughly 4–5% on Tuesday, extending a short burst…
Musk’s Terafab push with Intel to build 1 TW/year of AI compute, combined with a looming multi‑trillion SpaceX–X–xAI IPO and the X Money rollout, could concentrate AI and chip capital around his stack while turning Bitcoin, Dogecoin and other assets…
The Iran nuclear plant strike war news escalated to a global safety emergency today as IAEA Director-General Rafael Grossi issued a formal warning that strikes near Iran’s Bushehr nuclear plant are creating “a very real danger” of a severe radiological…
Bitcoin has outperformed stocks and even gold during the Iran conflict, giving fresh fuel to Anthony Pompliano’s claim that it is behaving more like a crisis hedge than a high‑beta tech bet. Anthony Pompliano argues that Bitcoin is emerging as…
The Iran war response latest news today shows a country mobilizing its civilian population: Iranian President Masoud Pezeshkian announced that 14 million Iranians have volunteered to fight, adding “I too remain ready to give my life for Iran,” while the…
The 25th amendment Trump Iran war political crisis escalated sharply on Tuesday when former Rep. Marjorie Taylor Greene, conservative commentator Candace Owens, and media personality Alex Jones all publicly called for President Trump’s removal from office after his “a whole…
Wintermute analysts said Bitcoin’s price stability against the extreme bearish sentiment present in the market is a positive. Will BTC ever flip $70,000 back to support?
Roman Storm, the co-founder of the crypto mixing service, still faces a possible retrial on two charges after a jury failed to reach a verdict in 2025.
The live price of the Zcash token is $ 322.50605034
Zcash price could see a potential upside toward $850 by the end of 2026.
ZEC’s long-term expansion scenario points toward $7000 by 2030.
While the broader crypto market remains selective with capital deployment, Zcash (ZEC) is beginning to show structural resilience near the $260 level. Unlike high-beta altcoins chasing speculative momentum, ZEC’s movement is increasingly tied to a deeper theme, digital privacy infrastructure. As surveillance debates intensify globally and compliance frameworks evolve, privacy-centric protocols often move from regulatory uncertainty to strategic importance. Zcash, with its zero-knowledge proof architecture, sits at the center of that discussion.
ZEC has transitioned from prolonged decline into base-building behavior, compressing volatility while defending macro support. The convergence of narrative relevance and structural stabilization is gradually reshaping sentiment around ZEC. With March approaching, traders are watching closely to determine whether this consolidation phase evolves into breakout expansion.
Zcash is entering April with momentum intact, but continuation now depends on clearing a key resistance band. After holding above the $250–$270 support zone, ZEC has shifted into a higher range, signaling sustained buying interest. The structure remains constructive, with higher lows forming as price compresses below resistance.
The immediate barrier stands at $300–$320. This zone is critical, not just as resistance, but as the trigger for the next leg higher. A decisive breakout could accelerate price toward the $380–$450 range in the near term.
In this setup, Zcash in April may extend toward $380–$450, provided the $320 resistance is reclaimed with strength. However, rejection at this level may result in short-term pullbacks, with $220–$240 acting as the next support band.
Coinpedia’s Zcash (ZEC) Price Prediction 2026
Zcash’s 2026 outlook is shaping around expansion, but confirmation will come through levels, not narrative. The token has already moved out of its previous consolidation range and is now building a higher structure. The focus shifts to whether this momentum can sustain through key resistance zones and attract continued demand.
The first confirmation lies at $320, followed by a broader breakout zone between $450 and $600. Clearing these levels would signal a transition into a full expansion phase. On the fundamental side, Zcash’s positioning as a privacy-centric asset places it in a unique segment of the market. With increasing attention on financial privacy and regulatory oversight, demand for privacy-focused networks could act as a structural tailwind. If momentum and narrative align, ZEC could advance toward the $600–$850 range over the course of 2026.
That said, failure to maintain higher lows or a breakdown below $220 would weaken the structure and delay this trajectory.
Recent Catalysts for Zcash (ZEC)
Privacy narrative regains momentum, driving sharp price spikes as demand for censorship-resistant assets increases.
Funding and ecosystem support strengthen outlook, signaling continued confidence in Zcash’s long-term growth.
ZEC Price Prediction 2026 – 2030
Year
Potential Low ($)
Potential Average ($
Potential High ($)
2026
480
650
850
2027
720
980
1200
2028
1000
1500
2000
2029
1800
3000
4500
2030
3100
5500
7000
Zcash (ZEC) Price Forecast 2026
In 2026, the Zcash price could project a low price of $480, an average price of $650, and a high of $850.
ZEC Price Prediction 2027
As per the Zcash Price Prediction 2027, Zcash may see a potential low price of $720 The potential high for Zcash price in 2027 is estimated to reach $1200.
Zcash (ZEC) Price Prediction 2028
In 2028, the Zcash price is forecasted to potentially reach a low price of $1000, and a high price of $2000.
ZEC Price Targets 2029
Thereafter, the Zcash (Zcash) price for the year 2029 could range between $1800 and $4500.
Zcash (ZEC) Price Prediction 2028
Finally, in 2030, the price of Zcash is predicted to maintain a steady positive. It may trade between $3100 and $7000.
Price predictions for 2026 range from $5.00 to $10.00.
Long term forecasts suggest FIL price may hit $50.00 by the end of 2030.
Filecoin (FIL) is a decentralized storage network that enables users to store and retrieve data securely without relying on centralized cloud providers. FIL has been trading close to its long-term support zones after prolonged corrective phases. Throughout 2025, the token remained largely range-bound, signaling seller exhaustion at lower levels.
This extended consolidation has helped FIL to rebound from the support zone of $1.20. Connecting fundamentals with price action, Filecoin’s steady utility-driven narrative combined with a base-forming chart structure positions the asset for a potential trend transition.
As FIL moves into 2026, the key question remains whether improving on-chain usage and network relevance can translate into sustained upside momentum, shaping the broader price prediction outlook ahead.
Filecoin’s price action is beginning to shift from persistent weakness toward early stabilization, but a confirmed recovery is still developing. After a steady decline through 2025, FIL has settled into a narrow range near the $0.80–$0.90 region, where downside pressure appears to be losing intensity. This phase reflects a market that is no longer trending lower, but has yet to establish upward momentum.
At present, price remains capped below the $1.00–$1.20 resistance band, a level that has repeatedly limited recovery attempts. This zone now acts as the immediate trigger point for any change in direction. A decisive move above $1.20 could initiate a recovery sequence, potentially lifting FIL toward the $1.50–$2.00 range, with additional upside toward $2.50 if momentum sustains.
Within this setup, Filecoin in April may move toward the $1.50–$2.00 range, conditional on a breakout above $1.20. On the downside, continued rejection at resistance would likely keep price contained, with the $0.70 level acting as the key support floor.
Coinpedia’s Filecoin (FIL) Price Prediction 2026
Filecoin’s broader trajectory in 2026 points toward a rebuilding phase, where price is attempting to transition from prolonged weakness into a more constructive structure.
Following its earlier highs, FIL experienced an extended period of decline, driven by fading momentum and consistent supply pressure. This phase pushed the asset into lower valuation zones, where it is now attempting to establish a base. The current structure suggests that the market is stabilizing, but a sustained uptrend will depend on reclaiming higher resistance levels. The first meaningful threshold remains at $1.20, followed by more significant barriers near $2.00 and $2.50.
A move through these levels would indicate strengthening demand and a shift in market positioning, allowing price to gradually expand into higher ranges. Filecoin continues to build its narrative around decentralized storage and data infrastructure. Growth in data demand, network utilization, or enterprise-level integrations could act as key drivers for renewed interest.
If these developments align with improving market conditions, FIL could reprice toward the $3 to $10 range over the course of 2026. However, this outcome would require sustained momentum and progressive confirmation across resistance levels. Until then, Filecoin remains in a recovery phase, with the $0.70 level acting as a critical support base.
FIL Price On-chain Outlook
Filecoin’s on-chain metrics continue to show steady structural improvement. One of the most talked-about developments is the launch and expansion of Filecoin OnChain Cloud (FOC), a major network upgrade designed to enhance on-chain storage usage and accessibility.
FOC’s deployment marks a shift towards more practical decentralized storage use cases, which could stimulate real demand.
Additionally, whale accumulation activity which surged late in 2025 alongside the rising token holding by large investors may fuel confidence ahead.
FIL Crypto Price Prediction 2026 – 2030
Year
Potential Low ($)
Potential Average ($
Potential High ($)
2026
3.00
6.00
10.00
2027
5.20
8.80
13.50
2028
9.00
12.50
18.00
2029
11.00
17.00
30.00
2030
16.00
25.00
50.00
Filecoin Crypto Price Prediction 2026
The FIL price range in 2026 is expected to be between $3.00 and $10.00.
Filecoin Price Prediction 2027
Filecoin (FIL) price range can be between $5.20 to $13.50 during the year 2027.
FIL Price Prediction 2028
The FIL Network price for 2028 is anticipated to lie within the range of $9.00 to $18.00.
FIL Coin Price Prediction 2029
Thereafter, the FIL price for the year 2029 could range between $11 and $30.00.
Filecoin Price Prediction 2030
Finally, in 2030, the price of FIL is predicted to maintain a steady positive. It may trade between $16.00 and $50.00.
FIL Price Prediction 2031, 2032, 2033, 2040, 2050
Based on the historic market sentiments and trend analysis of the largest cryptocurrency by market capitalization, here are the possible FIL price targets for the longer time frames.
Year
Potential Low ($)
Potential Average ($)
Potential High ($)
2031
55.00
62.00
72.00
2032
62.0
74.00
90.00
2033
70.00
88.00
110.00
2040
140.00
200.00
300.00
2050
320.00
350.00
400.00
FIL Price Prediction: Market Analysis?
Year
2026
2027
2030
Changelly
$15.80
$24.50
$52.10
CoinCodex
$11.90
$17.85
$29.45
Binance
$13.40
$21.10
$44.85
Never Miss a Beat in the Crypto World!
Stay ahead with breaking news, expert analysis, and real-time updates on the latest trends in Bitcoin, altcoins, DeFi, NFTs, and more.
FAQs
What is Filecoin (FIL) and what does it do?
Filecoin is a decentralized storage network where users rent out unused space and store data securely without relying on centralized cloud providers.
What is the Filecoin price prediction for 2026?
Analysts expect Filecoin to trade between $5 and $10 in 2026, supported by network adoption, improving sentiment, and a long base near key support.
Can Filecoin reach $50 by 2030?
Long-term forecasts suggest FIL could approach $50 by 2030 if decentralized storage demand grows and Filecoin strengthens real-world usage.
Is Filecoin a good long-term investment?
Filecoin’s value depends on adoption of decentralized storage. Strong fundamentals and steady utility make it a project to watch long term.
Bitcoin is moving through a period of uncertainty, with prices yet to find a clear floor. There is no single level that guarantees where the correction will end. Instead, analysts are piecing together clues from past cycles, price behavior, and technical signals to understand what might come next.
Where Buyers May Step In
As prices move lower, attention is shifting to areas where demand could return.
There is expected interest around $55K–$56K, which may act as the first cushion. If that level fails to hold, the next areas of interest sit near $43K–$44K, followed by a much deeper zone between $32K and $36K.
That lower region stands out because multiple signals point to it as a potential stabilization point after a prolonged decline.
While that sounds dramatic, it would not be out of character for Bitcoin. The asset has gone through similar resets before, often as part of its broader cycle.
In fact, the market has already seen a drop of more than 50% during this phase, showing how volatile these cycles can be.
Short-Term Moves May Be Misleading
In the near term, Bitcoin could still attempt a recovery bounce.
If support levels hold, prices may drift higher toward resistance in the $74,000–$75,000 range. But any upside movement is likely to be gradual and limited, as rebounds during corrections tend to lack strong momentum.
A Familiar Cycle Playing Out
What’s happening now is not entirely new. Bitcoin has historically followed a pattern where strong rallies are followed by a cooling-off period in the following year. The current correction appears to be unfolding along similar lines.
While no cycle repeats perfectly, the broader rhythm remains recognizable. Right now, the focus is on how Bitcoin behaves around critical price zones.
If the market holds above $56K, it could allow for temporary relief. A break below that area, however, may open the path toward lower levels, with momentum shifting more clearly to the downside.
The Pi Network community is at an important turning point. Many early users are now raising concerns about delays in moving their coins to the mainnet and questioning the project’s future value.
These issues are becoming harder to ignore and could affect how the network grows from here.
Delays in Mainnet Migration Frustrate Users
One of the biggest concerns is the slow migration process.
Dr. Pi, an early member of the community, shared what many users are feeling. Even after completing KYC verification, a large number of users still have not received their full Pi balance on the mainnet.
He explained the situation clearly: even if someone mined a large amount of Pi, only a small portion may be available on the mainnet, with the rest stuck in delay. Because of this, many users are losing interest. According to him, less than 5% of the people he invited are still actively mining.
Price Growth Remains a Big Concern
Beyond technical delays, many users are also thinking about Pi’s value. There is a growing belief that the success of the network depends heavily on the price of Pi increasing over time.
Many people joined Pi Network with hopes of financial gains, similar to what happened with early cryptocurrencies like Bitcoin and Ethereum.
Why Price Matters for the Network
If the price does not rise, users may start losing motivation.
This could lead to:
Fewer active users
Less mining activity
Lower overall community engagement
If this continues, it could weaken the entire ecosystem.
On the other hand, a higher price could bring new energy into the network. It could attract investors and help fund future development.
Some believe that reaching price levels like $3.14 or even $10 would signal that Pi Network is becoming a serious player in the crypto space.
What Pi Network Needs to Do Next
At this stage, the project needs clear direction. Dr Pi said that to move forward, the network must:
Improve communication with users
Speed up the mainnet migration process
Build confidence around Pi’s long-term value
If these issues are addressed, trust can be rebuilt and user activity can grow again.
Macro analyst Dr. Jim Willie said XRP could see a sharp upward move if it clears important price levels, outlining a progression from lower ranges to double-digit territory.
“Let’s be concerned about once we get past three and five, we’re going straight to 12 and 25. That’s where XRP is going,” he said.
He said these levels as the primary focus, rather than higher speculative targets.
Tied to Wall Street Conditions
Willie linked this outlook to stress within the traditional financial system, particularly among large banks. “Because Wall Street is insolvent and they need to get bailed out and they’re going to use the XRP as a device,” he said.
He also pointed to what he described as a signal late last year, following Ripple’s banking license. “They gave it away in November, December when Ripple got the bank license,” he said.
Claims of Institutional Coordination
The analyst further said that major financial institutions are coordinating behind the scenes.
“It’s like they had some backroom deals,” he said. He added that firms such as JPMorgan and BlackRock are attempting to shape upcoming regulation.
“JP Morgan and BlackRock are trying to write the Clarity Act,” he said, referring to proposed regulatory frameworks. According to Willie, these efforts could include provisions related to digital identity and potential limits on staking, rewards, and dividends.
Regulation and Political Pressure
Willie also referenced political dynamics around the banking sector. “Donald Trump is criticizing the big banks… This is very dangerous,” he said. He added that large financial institutions are likely to support regulatory clarity due to cost efficiencies.
“Wall Street is going to want the Clarity Act done because they’re going to realize 80% to 85% reduced costs in their transfers,” he said.
XRP’s Role in Payments
According to Willie, XRP could play a role in cross-border settlement systems. “XRP is going to become the standard neutral bridge asset,” he said.
He linked this view to broader macroeconomic concerns, including a potential bond and credit crisis.
Trigger: Credit Market Stress
Willie said XRP’s movement would likely coincide with a breakdown in trust across financial systems.
“When we have a big global credit crisis and there’s distrust between A and B on how they make payments… XRP eliminates the corresponding bank escrow,” he said.
He also cited the scale of capital tied up in existing systems. “There’s 25 to 27 trillion in corresponding escrow capital… 8 to 10 trillion in the United States,” he said.
The Iran US ceasefire deal update news today is contradictory and fast-moving: the New York Times reported that Iran halted ceasefire negotiations entirely after Trump’s “civilization will die” post, while Iran’s own Tehran Times simultaneously insisted that “diplomatic and indirect…
WhiteBIT secures broker license in Georgia, launching crypto derivatives and perpetual futures. WhiteBIT, the largest European cryptocurrency exchange by traffic, has obtained a broker license from the National Bank of Georgia (NBG) through its local entity, WhiteBIT Broker. With this…
The US Iran war latest news oil prices today tells a sharply escalating story: American forces struck more than 50 military targets on Kharg Island, the hub through which Iran exports 90% of its crude, sending oil surging more than…
The US Iran war news today reached a dangerous new threshold as President Trump posted on Truth Social that “a whole civilization will die tonight,” just hours before his self-imposed 8 PM ET deadline for Iran to fully reopen the…
Trump’s ‘whole civilization will die’ threat to Iran sends oil, Bitcoin and stocks on knife edge. President Donald Trump’s threat that “a whole civilization will die tonight” if Iran defies his ultimatum on the Strait of Hormuz has pushed global…
Circle minted $1 billion USDC in 24 hours, extending a $4.5b year‑to‑date supply jump and signaling heavy institutional dollar demand across Solana and centralized venues. Circle has minted roughly $1 billion in new USD Coin (USDC) over the past 24…
ETH price is looking sluggish on the surface while the underlying data quietly tells a very different story. On Binance, Ethereum withdrawal transactions just hit their highest level since 2025, clocking in at roughly 115,685 transactions in a single day. Sounds bullish, right? Well… yes and no. Because while the number of transactions exploded, the total amount withdrawn sat at around 352,000 ETH. Not exactly whale-sized.
Small investors drive massive ETH withdrawal spike
Here’s where it gets interesting. The analyst’s data shows a mismatch between a high transaction count and a relatively modest volume, which suggests one thing: this isn’t whales moving size. It’s retail.
Lots of them. Instead of a few massive withdrawals, what we’re seeing is a swarm of smaller transactions. Think distribution, not concentration. That usually points to individual investors pulling funds off exchanges as either for long-term holding or shifting into private wallets.
And historically, that kind of behavior leans bullish. Coins leaving exchanges reduce immediate sell pressure. Simple supply dynamics.
ETH price lags despite aggressive buying pressure
Because at the same time, another data shared by analyst point is quietly building a case for demand. Binance’s cumulative net taker volume has surged to around $3.4 billion.
That’s aggressive buying. Real buying. The kind where traders are hitting market orders, not just placing passive bids.
Yet ETH price? Still below its mid-March highs. Yeah, that’s the divergence.
Normally, this kind of sustained buying pressure would push price higher. But right now, it’s not translating. Which suggests something else is happening either steady sell-side absorption or just a market that’s moving slower than the flows beneath it.
Well, this kind of setup isn’t uncommon before larger moves. When you’ve got rising aggressive buying and increasing withdrawals (especially from smaller wallets), it often signals accumulation. Not the flashy kind. The quiet kind.
The kind that doesn’t show up in price immediately. Instead, it builds. Slowly. Until one day, price catches up and sometimes usually fast.
But let’s be real there’s no guarantee. Markets can stay disconnected from fundamentals longer than most traders can stay patient.
ETH price awaits confirmation from market breakout
So, ETH price is stuck in that awkward phase where the data looks supportive, but the chart hasn’t confirmed it yet. Withdrawals are rising. Buying pressure is strong. But price? Still hesitating.
If ETH starts reclaiming higher levels while this demand profile holds, it could signal that buyers have been in control all along.
Until then, it’s just potential energy. And in crypto, that can either explode upward or fizzle out completely.
RAIN price leaves traders questioning everything, they saw. One moment it’s collapsing, the next it’s ripping higher like nothing ever happened. And yes, it’s all happening right before a major token unlock. Let’s not pretend that’s a coincidence and to go to deeper is the viable option.
Firstly, on April 10, nearly 38 billion RAIN tokens around are set to hit the market. That’s about 3.37% of the circulating supply being released in one go.
Naturally, traders didn’t wait around to see what happens next. The market started reacting early, with visible dumping as participants positioned ahead of the event. It’s the usual playbook anticipate supply, sell first, ask questions later.
And honestly, they might not be wrong. These kinds of concentrated unlocks often bring selling pressure, especially when early investors or insiders decide to cash out.
RAIN price crash turns into aggressive recovery
But here’s where things get messy. RAIN price didn’t just drop, it flushed hard. The token fell to $0.00400 in what looked like a full-blown breakdown. Stop losses? Obliterated.
Then, almost immediately, it reversed. Price climbed back to $0.0070, marking roughly a 75% rebound from the lows. A complete recovery, as if the dump never even happened.
Call it a liquidity hunt. Call it market manipulation. Either way, it did its job as weak hands got shaken out.
And somewhere in that chaos, someone bought the bottom. They’re sitting pretty right now.
Ecosystem growth fails to offset weak adoption signals
Now zoom out a bit, and the fundamentals tell a more complicated story. RAIN isn’t standing still. The project recently rolled out an SDK designed for AI agents and launched a $5 million grants program aimed at building prediction market platforms. There’s also a card program expected in Q2 2026.
Sounds solid, right? Well, here’s the catch as user adoption isn’t exactly keeping up. Total Value Locked (TVL) has been stagnant around $4 million for months and then dropped sharply to just $639,107 in April. That’s not a small dip that’s a sentiment killer.
So while development is moving forward, actual usage is… questionable.
Even market cap terms this action adds to the confusion. It dipped below $2 billion before bouncing back to $3.42 billion, suggesting buyers are still lurking but not exactly in control.
So what now? RAIN price is caught between two forces: incoming supply pressure from the token unlock and short-term bullish demand that just absorbed a brutal sell-off.
If history is any guide, volatility isn’t going anywhere. And with April 10 around the corner, the real move might not have even started yet.
Crypto markets fell on Tuesday as a geopolitical crisis that has been building for weeks approaches what could be its most dangerous moment yet.
The total crypto market cap has dropped to $2.33 trillion, down 2.45% in 24 hours. Bitcoin is trading around $68,149, Ethereum has slipped to $2,079 and XRP is down to $1.29.
What Is Happening Right Now
Iran has cut off all direct diplomatic communications with the United States after President Trump posted what many interpreted as a threat of total destruction, writing that “a whole civilization will die tonight.” Iran is now also threatening to close the Bab el Mandeb Strait, a critical shipping lane through which 10% of all global trade passes. The Strait of Hormuz is already closed.
If both straits close simultaneously, 30% of global trade loses its primary route. Oil has surged above $116 a barrel.
Trump’s 8 PM Eastern deadline is now hours away, and negotiators are described as pessimistic that Iran will comply. It marks the fifth time the deadline has been set, extended and reset since the conflict began. This time, markets are not treating it as another postponement.
Stocks Are Being Hit Too
The damage is not limited to crypto. US equity markets absorbed a brutal session on Tuesday with $650 billion wiped from valuations. The Nasdaq fell 1.34%, the S&P 500 dropped 0.95% and the Dow Jones shed 0.84%. Risk assets across the board are pricing in the same fear.
Crypto’s correlation with the Russell 2000 ETF currently sits at 79%, confirming this is a macro-driven selloff rather than a crypto-specific event.
What Triggered the Crypto Drop Specifically
Beyond the geopolitical issues, the crypto market had its own internal vulnerabilities that the macro pressure exposed.
Over $58 million in Bitcoin was liquidated in 24 hours, with $40 million coming from long positions. Over-leveraged bullish bets were caught offside and forced selling accelerated the decline.
Perpetual funding rates turned negative at -0.0042%, meaning traders are now paying to hold short positions, a sign that bearish positioning is taking hold across derivatives markets. Open interest rose 8.25% during the decline.
What to Watch
Bitcoin holding $68,000 is the immediate technical priority. A sustained break below that level opens the path toward testing the yearly low around $2.17 trillion in total market cap.
Beyond the price levels, the SEC’s CLARITY Act roundtable on April 16 remains on the calendar as a potential positive catalyst if the geopolitical situation stabilises before then.
Biconomy has proposed a new Ethereum standard, ERC-8211, that introduces “smart batching” so AI agents and smart accounts can execute complex, multi-step DeFi operations in a single transaction while resolving each step’s parameters at execution time rather than at signing.…
SOL Strategies is buying Solana‑native zk startup Darklake Labs for $1.2m, bringing its Zyga privacy engine in‑house as Solana’s MEV and confidentiality race heats up. SOL Strategies has entered into a definitive agreement to acquire the assets of Darklake Labs,…
Fox Corporation has signed a sponsored data partnership with federally regulated prediction market Kalshi to integrate real‑time event probabilities into Fox News, Fox Business Network, Fox Weather and the Fox One streaming platform, further cementing prediction markets as a mainstream…
Polymarket’s late‑march fee overhaul has instantly transformed it into one of defi’s richest protocols, with weekly fees topping $7.1m and regulators circling. Polymarket has turned a controversial March 30 fee reform into a money machine, hauling in roughly $7.1 million…
Investors pivot to infrastructure-driven crypto projects like DOGEBALL amid stabilizing market conditions. Forget the “wait and see” approach that left many sidelined during the previous bull runs. Right now, the most successful investors are shifting their focus toward infrastructure-backed assets…
AVAX One signs a no‑upfront‑capex 10MW AI/HPC microgrid deal in Alberta and buys 220 S21 Pro miners, lifting hash rate 33% and formalizing a dual AI infra plus Bitcoin mining strategy. AVAX One Technology has committed to a 10 megawatt…
Cysic open‑sources its Venus zkVM engine, recasting proof generation as a global computation graph and positioning ZisK inside Ethereum’s emerging EIP‑8025 proof market. Cysic has released Venus, a new open‑source zkVM compute engine that restructures proof generation around a global…
Eightco packs nearly 9% of Worldcoin’s float, 11,068 ETH and a $90m OpenAI stake into a $321m balance sheet, turning ORBS into a listed bet on AI and digital identity. Eightco Holdings has disclosed a $321 million balance sheet dominated…
Aave price could fall over 40% in the coming weeks as two bearish patterns threaten to wipe out its remaining support levels. According to data from crypto.news, Aave (AAVE) price fell over 9% in the past 24 hours, extending its…
CME will launch AVAX and SUI futures, including micro contracts, giving institutions regulated tools to hedge and trade altcoin risk as crypto derivatives volumes climb. CME Group will expand its regulated cryptocurrency derivatives complex with the launch of Avalanche and…
Split Capital founder Zaheer Ebtikar is closing his crypto hedge fund after strong returns to join Plasma as chief strategy officer, citing a major industry shift.
Polymarket has become one of decentralized finance’s highest fee-generating protocols, pulling in about $7.1 million in fees in the first week of the second quarter.
Prediction markets can evolve from betting casinos to decision operating systems. Futarchy replaces manual governance with market-priced causal logic gates.
Lido’s institutional lead argues that more crypto treasury companies will need to incorporate liquid staking to outperform the returns generated by staked Ether ETFs.
Operation Atlantic is a cross-border law enforcement effort to detect and disrupt crypto scams in real time, targeting approval phishing before funds are fully drained.
Binance said it will roll out a spot trading rule on April 14, restricting executions outside a set range during periods of volatility and thin liquidity.
From human-driven to AI-driven, jbstrategy AI-powered quantitative approach is reshaping the logic of cryptocurrency asset investment.
In the context of highly volatile cryptocurrency markets and significant information asymmetry, traditional investment methods relying on human judgment are facing unprecedented challenges. With the rapid development of artificial intelligence technology, intelligent quantitative trading platforms, such as jbstrategy, are providing investors with a completely new solution—using data to replace emotion and algorithms to overcome human nature.
For a long time, cryptocurrency investment has been influenced by market sentiment, breaking news, and personal experience. Investors oscillate between greed and fear, leading to frequent decision-making errors. jbstrategy’s core advantage lies in its 24/7 market monitoring and prediction through machine learning models and big data analytics.
The platform integrates on-chain data, trading depth, market sentiment indicators, and macroeconomic variables to build a multi-dimensional analysis system, enabling accurate judgment of market trends. This data-driven decision-making mechanism significantly reduces human interference, making investment more rational and systematic.
AI-driven Alpha capture
In traditional trading, most investors are in a passive state of “information lag,” while jbstrategy’s intelligent algorithm can capture market anomalies at the millisecond level and identify potential opportunities in advance.
Its AI-driven strategies can not only identify trending markets but also continuously generate alpha returns in volatile markets through high-frequency arbitrage and hedging strategies. This capability allows ordinary investors to access trading strategies that were originally reserved for institutional investors.
How can JBStrategy make returns more stable?
High returns are often accompanied by high risks, and JBStrategy incorporated risk control as a core module from its inception. The platform monitors and adjusts each trade in real time through dynamic stop-loss orders, position management, and risk diversification mechanisms.
Furthermore, JBStrategy offers a variety of profitable strategies to achieve specific financial goals. Whether someone is looking for short-term gains or long-term returns, they have something for everyone.
Strategy Name Unit price time income
Momentum-Q2112 $600 5 days $643.8
Horizon-Q311 $1,500 10 days $1728
Advantage-Q4117 $5000.00 15 days $6192.5
Vanguard-Q5114 $10000.00 20 days $13380
Quantum-Q6113 $30,000.00 25 days $43350
Apex-Q7115 $60,000.00 30 days $93840
24/7 Uninterrupted Operation: Automated Systems Push Human Limits
The cryptocurrency market operates 24/7, posing a significant challenge to manual trading. jbstrategy’s automated system, however, can execute strategies continuously 24/7 without human intervention.
This not only improves trading efficiency but also avoids decision-making biases caused by fatigue, emotional fluctuations, and other factors, making investments more stable and sustainable.
Conclusion
With the continuous integration of artificial intelligence and blockchain technology, cryptocurrency investment is entering a new era. AI-powered quantitative platforms, such as jbstrategy, are not only changing trading methods but also reshaping investment logic.
In the future, those who can utilize data and algorithms more efficiently will be more likely to stand out in the fierce market competition. For investors, this is not only a technological revolution but also a cognitive upgrade.
AAVE price slips below the $100 level, dropping over 10% today, after a fresh bearish breakdown, as rising exchange reserves and recent developments around Chaos Labs’ exit add pressure to the outlook. The combination of increasing supply on exchanges and weakening price structure points to growing sell-side intent rather than stabilization. Is this the early stage of a bigger crash for AAVE?
Exchange Reserves Surge as Distribution Signal Emerge
On-chain data is increasingly pointing toward distribution.AAVE exchange reserves have climbed from 2.07 million to 2.23 million tokens, marking a clear reversal from the prior accumulation phase. A significant portion of this supply, around 1.63 million AAVE, is held on Binance, highlighting where liquidity is concentrating.
This shift suggests that more tokens are being positioned for potential selling, rather than being held off-exchange. The move above the 90-day average in reserves further reinforces that the market is transitioning into a supply-heavy environment.
Chaos Labs Exit Deepens Sentiment Concerns Around AAVE
Beyond price and on-chain signals, recent developments within the Aave ecosystem are also influencing sentiment. Reports around the exit of Chaos Labs, along with earlier contributor departures, have raised concerns regarding governance continuity and long-term protocol direction.
JUST IN: CHAOS LABS TERMINATES AAVE ENGAGEMENT AFTER 3 YEARS DUE TO RISK MANAGEMENT@ChaosLabs announced Monday that it is proactively terminating its engagement with DeFi’s largest lending protocol @aave, citing a fundamental disagreement over how risk should be managed.… pic.twitter.com/pDeshahsx4
While not immediately reflected in fundamentals, such developments tend to impact market confidence, particularly in DeFi ecosystems. This shift in sentiment appears to be aligning with on-chain behavior, where participants are reducing exposure rather than accumulating, adding to downside pressure.
AAVE Price Prediction: Is More Downside Ahead?
AAVE’s price action is now aligned with a bearish continuation framework. The loss of the $95–$100 support zone marks a structural shift, with price now forming lower highs and lower lows. Attempts to reclaim this region have failed, turning it into a resistance zone rather than support. This type of behaviour typically signals that the token is not consolidating, but repricing lower within a continuation trend.
With price structure weakening, focus now shifts to the next key levels. Immediate support sits near $85, which is currently being tested. A sustained breakdown below this zone could open the path toward $55–$70, where the next major liquidity pocket is positioned. On the upside, $100 remains the critical invalidation level. A strong reclaim above this level would be required to shift momentum back toward buyers. Until then, the token continues to trade with a downside bias.
What’s Next for AAVE?
AAVE’s token current setup reflects alignment between rising supply, weakening sentiment, and bearish price structure. As long as AAVE price remains below $95–$100, the probability of further downside toward $55–$70 remains elevated. The increase in exchange reserves suggests that sell pressure has not yet fully played out, while the failure to reclaim key levels points to limited buyer conviction.
Trump has yet again posted something that stopped crypto traders mid-session.
“A whole civilization will die tonight, never to be brought back again. I don’t want that to happen, but it probably will.”
That is not a ceasefire signal. That is a regime change declaration. And Bitcoin is sitting at $68,355 – already down 1.61% on the day, erasing the gains it spent all of Monday building.
From $70,000 to Regime Change in 24 Hours
Less than 24 hours ago, this felt like it might be resolved. Egypt, Pakistan and Turkey had sent a 45-day ceasefire proposal to both sides, with Pakistan’s army chief reportedly in contact “all night long” with US Vice President JD Vance, special envoy Steve Witkoff and Iranian Foreign Minister Abbas Araqchi.
Bitcoin jumped above $70,000 on Monday, its highest since March 25, as markets priced in de-escalation and roughly $273 million in bearish bets were unwound.
Then Iran rejected the proposal. Tehran said it wants a permanent end to the war, not a 45-day pause, and that “negotiations are entirely incompatible with ultimatums.” Trump called the proposal “a significant step but not good enough.”
Defense Secretary Hegseth told reporters: “Today will be the largest volume of strikes since day one. Tomorrow, even more than today.”
Bitcoin’s Iran Pattern: Every Peace Signal, Every Dump
This whipsaw is not new. QCP Capital confirmed that Bitcoin has been trading in a $65,000 to $70,000 band throughout the conflict, rising on peace signals and falling on escalation. The pattern has played out so consistently that seasoned traders have stopped watching charts and started watching Trump’s Truth Social feed instead.
When Trump posted “great progress” in ceasefire talks, Bitcoin climbed to $67,800. When Iran rejected the 15-point peace proposal, it slid back. Bitcoin fell 2.2% earlier today before the regime change post even landed, per Bloomberg.
As Coinpedia reported previously, Iran’s own denials have repeatedly reversed whatever market gains a Trump peace post created – the Iran Reverse Indicator theory playing out in real time.
What Does Trump’s Truth Social Post Mean for Bitcoin
If tonight ends in de-escalation, Bitcoin likely pushes back toward $70,000. If infrastructure strikes escalate as threatened, markets face their most serious test of this conflict.
At $68,355 with a live deadline and a regime change declaration on Truth Social, the next few hours matter.
FSC orders five‑minute balance checks, auto kill switches, and monthly audits at Korean crypto exchanges after Bithumb’s $40b payout error. South Korea’s Financial Services Commission (FSC) has ordered all domestic centralized exchanges to implement automated five‑minute reconciliation between internal ledgers…
SEC Chair Paul Atkins announced that the proposed Reg Crypto framework is now under final review at the White House Office of Information and Regulatory Affairs. The plan would give crypto startups a four-year exemption to raise capital without immediate registration requirements. It also aims to provide clearer rules on how digital assets are classified under securities laws. Atkins added that a separate innovation exemption focused on tokenization is expected to be introduced within weeks.
The crypto news today starts with a shift nobody expected. Bitcoin is no longer waiting for the Fed to move before it reacts. According to CoinDesk, BTC is now front-running rate decisions instead of following them, and ETF flows are the reason. That changes the game for every trader watching the next cycle load up.
That new reality is pushing money into early plays where the upside has not been priced in yet. Among every story in the crypto news today, Pepeto is pulling the most attention as presale demand keeps growing and exchange listings get closer by the day.
Crypto News: Bitcoin Now Leads the Fed Instead of Following It
CoinDesk reported that Bitcoin’s connection to global central bank easing has flipped negative since 2024, meaning BTC now moves ahead of rate decisions instead of reacting after them. ETF-driven buying changed the way Bitcoin trades at a core level, turning it from a risk asset into a forward-looking signal.
According to CoinMarketCap, Bitcoin trades at $69,698 with the total crypto market at $2.45 trillion. ETH rose over 3% to $2,126, and the Fear and Greed Index sits at 13 in extreme fear territory.
Blockchain Magazine reported BTC gained 3.4% in 24 hours as the broader market bounced. When Bitcoin starts leading the Fed instead of chasing it, the message is clear: smart money has already made its choice.
What Is the Best Presale to Buy Before the Next Bull Run?
Pepeto is the best presale to buy before the next bull run because it already has a working exchange, a cross-chain bridge, a token scanner, and a SolidProof audit done before listings even start. Most presales launch with a roadmap. Pepeto launches with tools traders can use on day one.
Why Pepeto Is the Presale Everyone in the Crypto News Today Is Watching
In a market where wild swings punish traders and old strategies stop working, Pepeto is one of the rare projects built for exactly these conditions. At its core, it is a full exchange designed to hand traders live tools ready for action from day one.
PepetoSwap handles cross-chain trading, the bridge moves tokens between networks at zero cost, and the built-in scanner checks every project before your funds go near it.
Every contract passed a SolidProof audit, and staking pays 187% APY daily while holders wait for listings.
The presale pulled in $8.84M at $0.0000001862, and the Pepe cofounder who helped build a $7 billion token is leading the project. Real exchange tools plus growing community demand is why Pepeto keeps showing up as the top presale of 2026.
Bitcoin Holds a Range as Smart Money Keeps Loading
Even with ETF flows changing how BTC trades, Bitcoin is sitting at $69,698 according to CoinMarketCap, and it has been stuck near key resistance around $69,000 to $72,000 as the market waits for a clear push.
While BTC keeps testing the same levels, analysts point out that this kind of sideways action happens right before big moves. The big players are being patient, but the real upside right now sits in presale tokens at entry prices that will not last.
BNB Posts a Small Gain While the Rest of the Market Waits
BNB quietly beat the broader market this week, posting small gains while most large caps traded flat.
Unlike Bitcoin’s range-bound action, BNB’s move shows steady interest in its chain even during fear. But even with that push, BNB’s huge market cap keeps the percentage returns small compared to a presale entry at $0.0000001862.
Wrapping Up Today’s Crypto News
Bitcoin is climbing, the market is bouncing, and every sign in the crypto news today points to a bigger move coming. When BTC explodes, early presales are the ones that deliver the biggest returns, and Pepeto is sitting right at that sweet spot before the run starts.
Pepeto is the project you do not want to miss this cycle. It is a meme coin at its core, the same category that people still talk about because it turned early buyers into millionaires, and it is going viral right now for the same reasons. For anyone chasing the kind of returns that only come once a cycle, the move is simple: buy before the bull run hits and before Pepeto lands on Binance, because once that listing goes live, the presale price is history.
What is the biggest presale story in the crypto news today?
Pepeto leads every other presale with $8.84M raised, three exchange tools close to launch, and a price of $0.0000001862 before listings. The SolidProof audit and Pepe cofounder backing set it apart from every other project running right now.
Which coins under $1 have the most upside based on the crypto news today?
Pepeto at $0.0000001862 stands out because it offers working exchange tools and 187% APY staking before listings even start. BNB and BTC have strong setups, but their market caps limit percentage returns compared to a presale entry.
Amidst the increasingly volatile landscape of the cryptocurrency market, traditional manual trading faces unprecedented challenges. Rapid market shifts, information asymmetry, and significant emotional interference make it difficult for many investors to generate consistent profits. Against this backdrop, a growing number of BTC and XRP investors are turning to a more efficient solution: fully automated AI-driven quantitative trading bots.
ConfluxCapital has garnered significant attention within this emerging trend. Through its intelligent trading system—and given prudent capital allocation and favourable market conditions—numerous users now have the opportunity to achieve daily returns of up to $3,700, thereby opening up a new avenue for generating passive income.
AI Quantitative Trading: Let the System Earn for You
At the core of ConfluxCapital lies an AI-driven quantitative trading model. By analyzing market data in real-time, the system automatically identifies trading signals and executes buy and sell orders at the optimal moment.
Their trading bots operate around the clock, continuously seeking potential profit opportunities amidst the price fluctuations of BTC and XRP, thereby making your trading more efficient and stable.
Free to Use: Lowering the Barrier to Entry
Unlike many quantitative trading platforms that charge exorbitant fees, ConfluxCapital offers AI-driven trading strategies completely free of charge, enabling a wider range of investors to participate with ease.
No specialized background is required, nor are there any additional subscription fees; with just a few simple settings, you can activate an automated trading system. This model significantly lowers the barrier to entry, allowing everyday users to access institutional-grade trading tools.
Under this mechanism, ConfluxCapital enables users to generate daily earnings of approximately $3,700.
Configure your AI quantitative strategy based on recommendations.
Step 3: Launch the Bot
The system operates automatically, executing trades around the clock.
Strategy Name
unit price
Days
Total Revenue
Starter Strategy
$100
2 days
$100+$6
Basic Strategy
$600
5 days
$600+$45
Advanced Strategies
$5,000
15 days
$5,000+$1,215
Elite Strategy
$25,000
25 days
$25,000+$11,250
Quantum Strategy
$90,000
20 days
$90,000+$36,000
Infinite Strategy
$200,000
25 days
$200,000+$110,000
After purchasing a strategy package, your earnings will be automatically credited to your account the following day. Once your account balance reaches $100, you may choose to withdraw the funds to your cryptocurrency wallet or use them to purchase additional strategy packages to generate further returns.
Platform Core Advantages:
Zero Learning Barrier: No specialized technical knowledge or complex API configuration required.
Military-Grade Protection: Dual security certifications from McAfee® and Cloudflare®.
Globally Trusted: Serving over 3 million users in more than 195 countries and regions.
UK Compliant Operation: Holding a UK operating license, ensuring compliance and transparency.
24/7 Technical Support: Stable system operation 24/7, with immediate technical support available.
Conclusion
In today’s era of rapidly advancing AI technology, trading methodologies are undergoing a fundamental transformation. Through its fully automated quantitative trading system, ConfluxCapital empowers BTC and XRP investors to break free from tedious manual operations and capture opportunities more efficiently within complex market environments.
For investors seeking to enhance their return efficiency while minimizing time commitments, this intelligent trading paradigm is emerging as a compelling new option that can no longer be overlooked. Moreover, when deployed within favorable market conditions and coupled with prudent asset allocation, the potential to generate daily returns in the range of $3,700 serves as a compelling demonstration of the inherent value offered by AI-driven quantitative trading.
Polkadot is flashing warning signs as bearish pressure intensifies, with price slipping sharply after a clean rejection at a key resistance zone. The latest structure suggests this isn’t just a pullback, it could be the start of a deeper downside move toward critical liquidity levels.
With sellers firmly in control and market positioning turning negative, the big question now is clear: Is the Polkadot price heading toward a breakdown below $1.20?
Shorts Dominate as Sentiment Turns Bearish
Market data is increasingly aligning with the downside narrative. Latest derivatives data shows a clear imbalance, with 32.82 million short positions versus 17.80 million longs, highlighting strong bearish conviction. At the same time, net delta remains negative, confirming that sell-side pressure continues to dominate order flow.
This imbalance suggests that traders are actively positioning for a continuation lower, rather than preparing for a reversal. The absence of aggressive long buildup further reduces the likelihood of a short squeeze in the near term.
DOT Price Confirms Breakdown Setup At Resistance
Polkadot remains firmly within a bearish continuation framework. DOT price recently tapped into a higher timeframe premium zone near $1.30–$1.32, aligning with a weekly breaker level, before sharply rejecting. This move swept buy-side liquidity above the previous weekly high, a classic signal of distribution before downside expansion.
With the higher timeframe continuing to print lower highs, the broader structure remains bearish. Current price action suggests that DOT is now rotating toward sell-side liquidity below recent lows, reinforcing the continuation thesis.
Key Levels To Watch
Polkadot is approaching a critical range where the next move could accelerate quickly. Immediate support is located at $1.20, followed by $1.17, both acting as short-term liquidity zones. A decisive breakdown below these levels would likely open the door toward $1.10, which stands as the next major downside target.
On the upside, $1.32 remains the invalidation level. A sustained move above this zone would disrupt the bearish structure and signal a potential shift in momentum. Until then, DOT price action continues to favor downside expansion over recovery.
Outlook: Breakdown risk rising fast
Polkadot is entering a phase where structure and positioning are fully aligned to the downside. As long as the price remains capped below $1.30–$1.32, the probability of a breakdown toward $1.20 and potentially $1.10 continues to increase.
Any short-term bounce is likely to be corrective, unless bulls reclaim resistance with strong conviction. For now, DOT remains in a high-risk zone, where a confirmed break below support could trigger accelerated downside continuation.
$276 million was wiped from crypto traders in a single day this week as Bitcoin briefly reclaimed $69,000, squeezing leveraged traders on both sides. As of now, Bitcoin sits at $68,274 – down over 2% in 24 hours and 45% below its all-time high.
If you’re watching your portfolio bleed, you’re probably asking one question: who on earth is making money right now?
The answer might surprise you.
Who’s Losing Money in the Bitcoin Crash Right Now
The most visible losers right now are leveraged traders on both sides. On April 6, as Bitcoin briefly reclaimed $69,000, 80,202 traders were liquidated across crypto derivatives markets in 24 hours – $276 million wiped out, with short sellers bearing the brunt as bearish bets got squeezed out.
Then there’s the broader group quietly suffering: short-term holders – investors who bought Bitcoin less than six months ago. According to CryptoQuant analyst Darkfost, their average cost basis sits at $85,400, well above Bitcoin’s current price. That means they’re sitting on average unrealized losses of roughly 19.4%.
Some are holding. Many are panic selling.
Bitcoin LTH Supply Up 300,000 BTC: Who Is Actually Buying
Here’s what the panic headlines aren’t covering.
Long-term holder supply has increased by approximately 300,000 BTC. That means coins are actively moving from stressed, short-term hands into patient, long-term ones. The people who lived through previous cycles aren’t watching the Iran news and selling. They’re accumulating.
Analyst Joao Wedson’s 720-day Tactical Bull-Bear Sentiment Index tells the same story from a completely different angle. The indicator is currently sitting in extreme bearish territory – a zone that historically, in his words, is “not where trends start collapsing, but where they tend to end.”
He puts it well: “This could be the final ~5 months of fear and disinterest in Bitcoin. But also 5 months of accumulation by OGs.”
Buy, Sell or Hold Your Bitcoin?
That’s not a question this article will answer for you, and anyone who answers it with certainty is lying.
What the data does show is a familiar pattern. Darkfost notes that historically, when short-term holder losses exceed 25%, those levels have often coincided with early market bottoms. At 19.4%, we’re not there yet but the direction is clear.
Every Bitcoin cycle has the same cast. Reactive traders lose to the volatility. Patient accumulators absorb the supply. The Iran war accelerated the one dynamic that was already playing out.
Bitcoin is at $68,274. The fear is real. The question is which side of this trade you’re on.
Samsung Electronics’ shares got a nice boost on Tuesday morning after the company predicted a record-breaking quarter fueled by the massive boom in AI hardware. The stock jumped as much as 4.8% during the day before settling into a 1.76%…
Crypto presales gain traction as investors position early for the next market cycle. As the crypto market gets ready to take its next big leap, presale projects are gaining significant traction from investors. This is because, at such an early…
Solana price fell 18% from its March high as global tensions surrounding the U.S. Iran war and an exploit on Solana-based Drift Protocol that drained millions from the ecosystem spooked the market. According to data from crypto.news, Solana (SOL) price…
AI trading bots gain momentum in 2026 as investors automate strategies for passive income. By 2026, AI trading bots are expected to become one of the most popular avenues for investors seeking to generate passive income. These bots leverage sophisticated…
Crypto ETPs drew $224 million in inflows last week as XRP led gains, while US ETFs lagged and Ether posted outflows amid mixed macro data and policy expectations.
Argentine lenders are reportedly testing JPMorgan’s JPM Coin to improve settlement speed and efficiency, even as the central bank maintains restrictions on crypto services.
Cardano price is sitting at a crucial point, with price hovering around $0.24 after a prolonged decline. The asset is down over 40% in the past three months and remains far below its previous highs. Despite the weak price action, on-chain data is starting to show a different trend building beneath the surface.
Whale Activity Climbs to 4-Month High
Cardano's number of wallets holding at least 10M $ADA tokens has ballooned to a 4-month high of 424, a +5.2% rise in 9 weeks. Even though it has not decoupled from other altcoins yet in 2026, its market value is +11% since it bottomed out back on February 5th. pic.twitter.com/5HgvwadvsQ
Recent Santiment data shows a steady rise in large holders. Wallets holding at least 10 million ADA have climbed to 424, marking the highest level since December. This increase has come during a period of falling prices, which often signals large players quietly accumulating while broader sentiment remains weak.
This type of divergence has historically appeared near important turning points, where bigger investors position early before any wider recovery begins.
Derivatives Show Ongoing Pressure
At the same time, the derivatives market paints a softer picture. Futures open interest has dropped by around 8% in just 24 hours, with long positions taking the biggest hit. Funding rates have also turned negative, showing that short sellers currently dominate the market.
This combination suggests that while large wallets are building positions, short-term traders remain defensive and are still betting on further downside.
ADA Price Testing Support Range
From a technical view, ADA is trading within a crucial support range between $0.22 and $0.28. This zone has previously acted as a base for strong rebounds and now stands as the most important level in the current structure.
#ADA LTF Analysis:$ADA clean falling wedge breakout on 4H — structure shift with price reclaiming the upper trendline and short-term MAs.$ADA now pushing into prior supply, but holding above the breakout zone keeps the bias bullish. As long as $ADA sustains above this level,… pic.twitter.com/UC1jmNA3Wk
— Alpha Crypto Signal (@alphacryptosign) April 6, 2026
Crypto analyst Alpha Crypto Signal noted that ADA recently moved out of a descending wedge on lower timeframes and pushed toward the $0.27–$0.29 area. However, failure to sustain this move could bring the price back into the range.
“ADA now pushing into prior supply, but holding above the breakout zone keeps the bias bullish. As long as ADA sustains above this level, continuation toward 0.27–0.29 is likely.”
Double Bottom on the way?
The next few sessions are likely to be decisive. Holding above support while accumulation continues could help stabilize the price and gradually change the structure.
At the same time, another X user points to a possible double bottom alongside a falling wedge reversal, suggesting a larger cycle shift could develop if the structure confirms. For now, Cardano remains at a central inflection point, balancing between continued downside pressure and early signs of accumulation building underneath.
Binance is changing how orders execute on its spot market, and if you’ve been trading on the platform since October, you’ll understand exactly why.
Starting April 14, 2026, Binance will gradually roll out the Spot Price Range Execution Rule (PRER), a new mechanism that prevents orders from executing at abnormal prices during extreme market conditions.
What Is the PRER and How Does It Work?
The rule creates a dynamic price range around the current market price. Orders can only execute against liquidity that sits within that range. If prices deviate significantly from normal levels – due to a flash crash, thin liquidity, or abnormal market activity – orders simply won’t fill at those outlier prices.
In plain English: the mechanism that allowed tokens to print near-zero prices on Binance during extreme volatility gets blocked before it can wipe out your position.
Binance describes it as a feature designed “to help ensure trading occurs at prices that reflect a fair and orderly market.”
Binance October 10 Flash Crash: What Went Wrong
On October 10, 2025, $19 billion in leveraged positions were liquidated in hours – the largest single liquidation event in crypto history. Bitcoin fell from $122,000 to around $105,000. Some altcoins on Binance briefly printed near-zero prices. Ethena’s USDe depegged to $0.65 on Binance while holding $1.00 on every other exchange.
Traders couldn’t close positions. Stop-losses failed to execute. Platform systems buckled under the load.
The 10/10 incident exposed what many traders saw as a structural problem: abnormal prices executing directly against their positions, with no mechanism to stop it.
Binance covered approximately $283 million in losses and pledged compensation for affected users. The PRER is Binance’s most significant spot trading rule change since.
How the New Rule Protects Binance Traders
For active Binance spot traders, the practical impact is significant. Orders will no longer execute at prices that deviate wildly from the real market, protecting traders from being filled at manipulated or cascade-driven extremes.
It won’t prevent a crash and won’t fix thin liquidity or oracle failures. But it closes one of the specific gaps that turned October 10 from a bad day into a catastrophic one for many traders.
The rollout begins April 14 and will be introduced gradually to ensure a smooth transition.
For the millions of traders still on the platform, it’s a meaningful step. Whether it’s enough will depend on what the next extreme market event looks like.
XRP just posted its sixth consecutive monthly loss at $1.29 despite Ripple launching enterprise treasury tools, and comparing market value XRP, Ethereum,and Pepeto reveals why the presale collecting more than $8 million during fear tells a different story.
Every crypto success story started with one decision: someone moved while the entry was open. While XRP fights $1.50 and ETH defends $2,053, Pepeto has built a running exchange and confirmed the Binance listing where analysts see 100x potential from today’s cost.
Comparing Market Value XRP Ethereum Pepeto After Six Red Months
XRP posted six consecutive monthly losses for the first time in 12 years, trading near $1.29 despite Ripple launching its GTreasury platform for corporate CFOs on April 1, according to CoinDesk. ETH sits at $2,053 after the Foundation staked $93 million, completing its 70,000 ETH target.
CoinGecko data shows XRP carrying an $80 billion market cap and ETH at $247 billion. Comparing market value XRP, Ethereum, Pepeto makes one thing clear: both large caps need months of recovery to deliver returns that compound patience, while the presale entry priced at six decimal zeros compresses what those recoveries offer into one listing event.
How the Three Tokens Stack Up on Returns
Pepeto: The Entry That XRP and ETH Cannot Replicate
XRP at $80 billion and ETH at $247 billion confirm their positions, but the entry that captures the largest return from recovery capital is the one priced before any exchange opens. Pepeto raised that $8 million because the exchange was already delivering results and the listing was locked in, giving committed wallets a position where one Binance event reprices everything, backed by a cross-chain bridge that transfers assets between networks without losing a fraction of value.
Fee-free execution on every swap preserves the full position through each trade, so nothing leaks between entry and exit. The 187% APY staking mechanism removes tokens from circulation automatically, growing holdings while shrinking what reaches the open market. When the Binance listing activates and fresh demand arrives, it meets a supply that stakers have been compressing for months, and that imbalance is where the return concentrates for the wallets already inside.
Comparing market value XRP, Ethereum, Pepeto shows that Pepeto’s presale valuation sits far below both, which is exactly why the return potential dwarfs what either large-cap offers. The same founder who took Pepe from zero to $11 billion designed every contract on this platform, and SolidProof confirmed them all before a dollar entered.
The $0.0000001862 price point is a presale window, not a market valuation, and the moment trading begins, that window seals permanently. Every person who built wealth from XRP made one decision: they moved while the entry was still available. This is the same decision, same cofounder, confirmed listing, and the only difference between the wallets that changed their lives and the ones that didn’t is whether they acted while the price was still theirs to take.
XRP: Enterprise Tools Live but Returns Capped
XRP trades near $1.29 with Ripple’s GTreasury now letting CFOs hold XRP alongside fiat, according to CoinDesk.
Six red months despite enterprise tools confirm recovery takes time. Analysts target $2.40, an 80% gain. XRP at $80 billion needs billions in new capital to move, while the presale multiplies from one listing.
Ethereum: Foundation Locked In but Ceiling Visible
ETH sits near $2,053 after staking $93 million to complete its 70,000 ETH target, according to CoinMarketCap. BlackRock’s ETHB fund adds yield for holders. Analysts target $2,500, giving 21% over months.
ETH at $247 billion remains the backbone of DeFi, but comparing market value, XRP, Ethereum, and Pepeto shows the return from $2,053 cannot match what presale pricing delivers.
Conclusion:
Comparing market value XRP, Ethereum, Pepeto confirms XRP at $80 billion and ETH at $247 billion offer recovery returns, but Pepeto stands apart with a running exchange and presale pricing neither can match. Every XRP and ETH success story began with one move while the entry was open, and the same entry is available right now from the Pepe cofounder with a confirmed listing. The Pepeto official website shows that the position one listing day transforms, and six months from now, you either hold the entry that made the difference, or you are the one explaining to yourself why you saw the math, understood the setup, and still did not move.
Shiba Inu Price is still struggling, down nearly 93% from its all-time high of $0.00008616. As of April 2026, SHIB trades around $0.000006, marking a big drop from its January levels near $0.00000923. The downtrend has stretched over the past three months, showing little sign of recovery.
However, the decline isn’t coming from just one factor. A mix of weak on-chain activity, falling trader interest, and broader meme coin weakness is driving the pressure.
One major issue is rising exchange inflows. Around 6.9 billion SHIB recently moved to exchanges in 24 hours, with spikes up to 39 billion, which is often a sign that holders are preparing to sell. At the same time, derivatives data show fading participation. Open interest has dropped to $54.25 million, down 16% monthly and nearly 63% from January highs.
The broader meme coin market is also shrinking fast, with total market cap falling from $109.7 billion to $34 billion, adding further downside pressure.
Another factor adding to the downfall is that SHIB’s ecosystem, especially its Layer-2 network Shibarium, is also under strain. After launching in 2023, SHIB’s price became closely tied to network activity, but that activity has dropped sharply.
Following a major exploit in September 2025, daily transactions fell from millions to just thousands. Recent data shows activity hovering around 1,200 transactions, with lows near 557.
There has been a recent backend upgrade and reindexing, which may have temporarily slowed performance, but overall usage remains weak.
SHIB 2026 Outlook
According to Coincodex’s prediction, in the short-term projections, SHIB is expected to move within a tight range, with projections suggesting a gradual climb toward around $0.0000059 over the next few days. The upside remains limited, with less than 1% expected gains, indicating weak progress and a continuation of sideways movement rather than a strong recovery phase.
Looking at the long term, SHIB’s 2026 outlook shows a broader range between roughly $0.00000458 and $0.00000591. This suggests the asset may continue to trade in a compressed band for most of the year, with only modest upside potential. While brief recoveries are possible, the overall trajectory points to slow, uneven movement unless stronger demand or ecosystem growth returns.
TRUMP Coin price forecast for 2026 goes up to $14-42, on optimistic conditions.
Price predictions suggest potential highs of $212.25 by 2030.
The TRUMP coin, a Solana-based token strongly tied to Donald Trump, has had a volatile journey. It captured headlines with a viral campaign offering top holders a gala dinner with the U.S. President, which propelled its price to an astonishing high of $49. The subsequent plunge quickly flagged the token as a massive pump-and-dump.
Now, trading at severely discounted levels, the token is gaining renewed interest from investors looking for a potential turnaround, making it a potential future returnee on Google searches. Crucially, the coin lost a lot and barely retains a market cap and volume, signaling that a dedicated memecoin community is still trying hard to revive the president’s surname.
This ongoing activity suggests the possibility of a future trigger, perhaps a major political event or direct action from Trump that could reignite speculative demand. This analysis summarizes the key TRUMP coin price predictions from 2026 through 2030.
The TRUMP asset has seen declining interest, but recent efforts, like the new game launching on the App Store, are starting to make a difference. The “Trump Billionaire Game” is set to hit the Apple Store on May 5, 2026, and could help revitalize the asset this year after the struggles of 2025.
Moreover, the Q1 was stretched in a downtrend and further chaos through iran war as a lot of hate came for Trump, but April could show a spike and could possibly start a breakout in Q2 2026 from the upper boundary of a falling wedge pattern. If demand increases, we can expect a rebound to $6 in April. However, if demand doesn’t pick up, prices may drop further.
Trump Token Price Prediction 2026
In 2025, the TRUMP token did not appear to be a dead asset, particularly with the announcement of the “Trump Billionaire Game,” which added a utility aspect beyond its initial memecoin status. The launch is scheduled for May 5th, 2026, on the Apple Store.
However, the outlook for 2026 is complicated by the 2025 and Q1 2026 market performance, where bulls struggled significantly against robust bearish sentiment. This dynamic reflects the speculative and often volatile nature of TRUMP’s price movement throughout 2025, and that extended into Q1 2026.
As we look forward to the possibilities 2026 may bring, particularly with Donald Trump’s ongoing influence in the political arena, the potential for adoption of his game is indeed compelling. On the price front, the weekly chart showcases an intriguing setup; we’ve recently seen a demand coming back, and March showed a spike with recent claims of the top holder of Trump to be invited for a dinner with Trump, which fueled short-term hype, but it wasn’t a big trigger of momentum.
The price pattern indicates a falling wedge, reflecting a tightly compressed trading range, much like a coiled spring ready to unleash its energy, making the pattern more interesting for the TRUMP price.
Given this technical formation, a rebound appears likely. If bullish momentum emerges in the Q2 2026, it will be crucial to monitor the $5.50 resistance level. A decisive breakout above this level could signal a significant rally, potentially advancing toward $8.50 as the uptrend unfolds and could extend to $16 if demand remains stable.
Year
Potential Low ($)
Potential Average ($)
Potential High ($)
2026
$3
$18
$26
Trump Coin On-Chain Analysis
The Santiment data for the TRUMP token reveals a significant shift in holder dynamics through early March 2026. While mid-sized “shark” wallets (yellow) are aggressively accumulating, the largest whale tier (red) shows more cautious, fluctuating interest. This indicates retail-to-mid-tier conviction is currently driving the momentum over massive institutional-scale positioning.mem
Official TRUMP Coin Price Prediction 2026 – 2030
Year
Potential Low ($)
Potential Average ($)
Potential High ($)
2026
$5.00
$7.10
$11.20
2027
$6.05
$12.65
$18.90
2028
$8.20
$18.20
$27.50
2029
$12.40
$28.10
$44.80
2030
$18.10
$45.10
$69.90
Official Trump (TRUMP) Price Prediction 2026
By 2026, the value of a single OFFICIALTRUMP coin price could reach a maximum of $42.00, with a potential low of $14.00. With this, the average price could land at around the $28.00 mark.
TRUMP Coin Price Prediction 2027
Looking forward to 2027, the TRUMP coin Price may range between $21.00 and $42.00, and a potential average value of around $63.00.
TRUMP Token Price Prediction 2028
The Trump price could achieve the $94.25 milestone by the year 2028. However, the viral memecoin could record a low of $31.50 and an average price of $62.00 if the crypto market turns bearish.
TRUMP Coin Price Forecast 2029
During 2029, the TRUMP crypto could reach a maximum trading value of $141.50 with a potential low of around $88. Evaluating the market sentiments, the average price of this altcoin could settle at around $94.50.
Official Trump (TRUMP) Price Prediction 2030
The TRUMP memecoin crypto prediction for the year 2030 could range between $70.75 to $212.25. Considering the buying and selling pressure, the average price could be around $141.50 for that year.
What Does The Market Say?
Firm Name
2026
2030
Mudrex
$100
$600
Icobench
$150
$500
Binance
$14.63
$17.78
Never Miss a Beat in the Crypto World!
Stay ahead with breaking news, expert analysis, and real-time updates on the latest trends in Bitcoin, altcoins, DeFi, NFTs, and more.
FAQs
What is the TRUMP coin and how does it work?
TRUMP coin is a Solana-based memecoin tied to Donald Trump’s brand, driven by hype, community support, and speculative trading.
Is TRUMP coin a safe investment in 2026?
TRUMP coin is highly volatile and speculative. It may offer gains, but investors should assess risks and avoid relying only on hype.
What is the TRUMP coin price prediction for 2026?
In 2026, TRUMP coin may trade between $5 and $11.20, depending on demand, market sentiment, and political or social triggers.
What is the official Trump coin price prediction for 2030?
Official Trump coin could range between $18.10 and $69.90 by 2030, depending on market trends, demand, and overall crypto sentiment.
How high can Trump token go by 2040?
By 2040, TRUMP token could exceed $69.90 if long-term adoption, political relevance, and crypto market expansion continue to grow.
Price prediction for 2026 targets $0.85, with potential highs of $3.50.
The Pi coin price forecast for 2030 highlights a price target as high as of $22.00
Pi Network’s vision of mobile-based crypto mining attracted millions worldwide, making it a standout community-driven project. However, its lack of exchange listings, limited liquidity, and minimal real-world integration now challenge its sustainability.
As the broader crypto landscape shifts toward utility-based projects and DeFi innovation, Pi Coin struggles to maintain relevance. As a reason, the PI price faced a seamless fall. While social and Google search curiosity still remains high, especially with growing searches like “1 Pi to INR” and “1 Pi to PKR,” the absence of strong fundamentals keeps Pi price recovery uncertain.
This is leaving investors questioning whether this once-hyped token can ever reclaim its lost glory. As a result, the current period aligns perfectly with the current year’s calendar to change soon, making people intrigued towards the PI price prediction for 2026-2030.
The daily chart for Pi Network (PI) shows the price has been struggling to maintain bullish momentum, remaining pinned below the $0.28 resistance since the fourth quarter of 2025. Throughout Q1 2026, the majority of the price action was contained above the $0.19 level, which acted as a primary pivot for the market. However, as Q2 begins in April, PI price has started sliding back below this threshold, indicating a weakening of buyer support and a potential shift toward a more bearish narrative.
Currently, the asset is at a critical technical juncture. If the downward pressure continues and PI breaks below the significant $0.125 support floor, it could trigger a capitulation move toward new lows. Conversely, if bulls can reclaim the previous range and reverse the current slide, April could witness a relief rally aimed at retesting the $0.28 resistance zone. Until a decisive breakout occurs above the 200-day EMA (currently near $0.26), the overall trend remains biased toward the downside or extended consolidation.
Pi Network Price Prediction 2026: Potential Scenarios for a Reversal
Pi’s price remained within its consolidation range of $0.19 to $0.28 during the fourth quarter of 2025. However, in January, it fell outside this range, hitting a new low of $0.1297.
This shift indicated a strong bearish momentum, with PI investors selling off their holdings as if there was no chance of recovery. Many investors and traders began to view it as a dead asset, comparing it unfavorably to memecoins.
Despite a short-term upward movement in February and March that pushed the PI price back above $0.28, the long-term price prediction for 2026 showed no significant improvement, with the price still following a dominant decline.
At this time, while the PI price was at its weakest long-term levels, the short-term rally still suggested a potential recovery. As this optimism was largely fueled by the announcement of a few ecosystem updates on X in early March, along with an exchange listing on Kraken, the surge saw the price retest $0.28 by mid-March. Hopes were high that the newly announced plans could revitalize the struggling ecosystem.
However, that point failed to materialize sustained demand; in fact, from mid-March onward, the price faced strong rejection at $0.28 and slipped below $0.19, approaching February’s low of $0.13. If bearish momentum continues, then new lows could be formed a new.
Despite the challenges posed by the bear market, which has suppressed momentum across the entire cryptocurrency sector, no altcoin has successfully staged the anticipated rally. Much of this stagnation can be attributed to a lack of liquidity, with new investors remaining cautious and many feeling apprehensive about the prevailing bearish sentiment.
Nonetheless, the outlook for 2026 remains somewhat optimistic for the sector if geopolitical conditions show signs of improvement. Also, If PI can generate sufficient demand, it may attract a few more drops of liquidity. Only if the broader market improve, the likelihood of a substantial rally could increase, but a crucial factor will be confidently breaking through the $0.28 resistance level.
Pi Coin Price Targets 2026 – 2030
Year
Potential Low ($)
Potential Average ($)
Potential High ($)
2026
$0.85
$2.25
$3.50
2027
$1.25
$3.25
$5.25
2028
$2.00
$5.50
$8.50
2029
$3.50
$8.50
$13.75
2030
$5.50
$13.75
$22.00
Pi Network Price Prediction 2026
The Pi crypto prediction for the year 2026 could range between $0.85 to $3.50. Considering the buying and selling pressure, the average price could be around $2.25 for that year.
Pi Coin Price Prediction 2027
During 2027, the Pi network value could reach a maximum trading value of $5.25 with a potential low of $1.25. Evaluating the market sentiments, the average price of this altcoin could settle at around $3.25.
Pi Token Price Projection 2028
By 2028, the value of a single Pi coin price could reach a maximum of $8.50 with a potential low of $2.00. With this, the average price could land at around the $5.50 mark.
Pi Network Price Analysis 2029
Looking forward to 2029, the Pi coin Price may range between $3.50 and $13.75, and a potential average value of around $8.50.
Pi Network Price Prediction 2030
As per our Pi Coin Price Prediction 2030, the Pi coin value in 2030 could reach a high of $22.00. However, the viral altcoin could record a low of $5.50 and an average price of $13.75, if the crypto market turns bearish.
Market Analysis
Firm Name
2025
2026
2030
CoinCodex
$ 2.08
$ 1.48
$ 2.63
priceprediction.net
$1.08
$1.61
$6.74
DigitalCoinPrice
$107.98
$125.57
$265.95
*The aforementioned targets are the average targets set by the respective firms.
Conclusion
The Pi Network’s recent developments—from major token accumulation and Banxa integration to Binance listing rumors—are clear indicators that Pi is no longer just a test project. As market conditions turn favorable and institutional interest grows, Pi Coin is entering a new phase of maturity.
Never Miss a Beat in the Crypto World!
Stay ahead with breaking news, expert analysis, and real-time updates on the latest trends in Bitcoin, altcoins, DeFi, NFTs, and more.
FAQs
What is Pi Coin prediction for 2026?
Pi Coin is expected to trade between $0.85 and $3.50 in 2026, with an average price of around $2.25 based on current market conditions.
What is the Pi Network price prediction for 2027?
Pi Coin could range between $1.25 and $5.25 in 2027, with an average value of approximately $3.25 if demand and adoption increase.
What will be the value of Pi in 2028?
In 2028, Pi Coin may trade between $2.00 and $8.50, with an average price near $5.50 as ecosystem growth improves.
How high can a Pi Coin go in 2030?
Pi Coin could reach a maximum price of $22.00 by 2030, with an average value of $13.75 under favorable market conditions.
What will be the value of 1 Pi Coin in 2040?
By 2040, Pi Coin could range between $15 and $50, depending on adoption, real-world utility, and overall crypto market growth.
Stablecoins are reshaping remittances as costs drop and settlement speeds accelerate globally. Sending money across borders shouldn’t cost 6% and take five days. But for billions of people relying on traditional remittance corridors, it still does. Stablecoins are changing that.…
Meta Platforms is preparing to launch its first AI models developed under Alexandr Wang. The company plans to offer some versions of these models under an open-source license, according to a report by Axios. The rollout is expected to follow…
Anthropic has struck a major infrastructure deal with Google and Broadcom to secure multi-gigawatt computing capacity, as demand for its Claude AI models continues to climb. Details disclosed in a recent securities filing show the semiconductor firm will support future…
Five of the most powerful people in finance have publicly predicted Bitcoin to hit $1 million. They also collectively hold a lot of it.
That is either the most bullish signal in crypto history, or the most expensive marketing campaign ever run.
Bitcoin is currently trading at $69,107, 45% below its all-time high.
Who Predicts Bitcoin Will Hit $1M?
The names are not small.
Jack Dorsey sees “at least a million” by 2030. Larry Fink, whose BlackRock holds over 782,000 BTC through IBIT, projects $500K to $700K with a path higher.
Michael Saylor, whose Strategy holds 766,970 BTC, targets $1M in four to eight years and $21M by 2045. Cathie Wood has revised down to $1.2M by 2030. CZ, who previously predicted $500K to $1M this cycle, has since shifted his framing – speaking at Davos in January 2026, he predicted a Bitcoin “supercycle” driven by US pro-crypto policy, saying on a “5-10 year horizon, it’s very easy to predict – we’re going to go up.”
Fink framed it well in his 2026 shareholder letter, comparing crypto’s current moment to the internet in 1996. He added that it won’t replace the existing financial system overnight, but could gradually connect traditional and digital markets in ways that make investing faster, cheaper, and more widely accessible.
Bull Case: Why $1M Bitcoin Is Mathematically Possible
The math behind it is strong.
Bitcoin delivered approximately 54% average annual returns from 2014 to 2024, according to BlackRock data. Only 21 million BTC will ever exist, with 99% mined by 2035. The US Strategic Bitcoin Reserve is live. El Salvador, Bhutan, and multiple US states are accumulating. Fink has argued that institutions allocating just 2% to 5% of portfolios could push Bitcoin to $700K on its own.
The structural shift is also real in concrete terms. BlackRock’s iShares Bitcoin Trust held approximately 782,429 BTC as of early April, worth roughly $55 billion. When the world’s largest asset manager is that deeply committed, the institutional adoption argument stops being theoretical.
Bear Case: Why the $1M Timeline May Be Wrong
Here is what the bull narrative glosses over. The original $1M thesis was built on a $100K base price in 2025. Bitcoin never got there sustainably. At $68,922, hitting $1M by 2030 now requires more than 137% compound annual growth for three consecutive years.
There is also a pattern worth noting. In 2021, “$100K is guaranteed” was the dominant narrative. In 2024, “$250K is inevitable.” Now it is “$1M is certain.”
The target keeps moving higher while retail repeatedly gets caught at cycle tops. Bloomberg commodity strategist Mike McGlone has raised the possibility of Bitcoin revisiting $10,000, a view almost nobody is amplifying right now, maybe because it is not in anyone’s financial interest to do so.
As analyst Crypto Patel put it: “These predictions are not charity. They are also their business models.”
Should You Buy Bitcoin Based on These Predictions?
Bitcoin reaching $1M may still happen. The supply and demand dynamics are real.
But understanding who is predicting it, and why, is the most important research you can do before deciding whether to buy.
Dogecoin is back at a level that has historically preceded its biggest moves. After weeks of consolidation, DOGE is now testing its long-term ascending channel support, a zone that has repeatedly acted as a launchpad for explosive rallies in previous cycles. Unlike typical breakdown scenarios, price continues to hold structure, signaling that selling pressure is fading rather than accelerating.
At the same time, broader market conditions are beginning to stabilize, creating an environment where high-beta assets like DOGE tend to react aggressively. So, is Dogecoin quietly setting up for another cycle-defining rally, or is this support about to give way?
Accumulation Builds As Exchange Outflows Dominate Market Behaviour
On-chain data is beginning to confirm a shift in market dynamics. Recent spot flow trends show persistent net outflows, indicating that DOGE is steadily moving off exchanges. This behavior typically reflects accumulation rather than distribution, as investors withdraw assets instead of preparing to sell.
Importantly, this trend is unfolding during a phase of price compression, suggesting that participants are positioning early ahead of a potential move, rather than reacting after confirmation.
Combined with declining sell-side pressure, this points toward a market transitioning into absorption, a phase that often precedes expansion.
DOGE tests macro support as structure mirrors previous rally setups
Dogecoin continues to respect its long-term ascending channel, a defining feature of its macro price behavior. DOGE price is now positioned at the lower boundary of this channel, a zone that has historically triggered strong impulsive rallies. Previous interactions with this level have consistently marked cycle lows before expansion phases, reinforcing its importance.
Momentum indicators are also approaching reset levels, with early signs of bullish crossover formations beginning to emerge, another pattern commonly observed near market bottoms. This alignment between structure and momentum reset suggests that DOGE may be entering a high-probability bounce zone, rather than a breakdown phase.
Key levels define DOGE’s next move
Dogecoin is approaching a critical decision point where structure will either hold, or fail. The $0.085–$0.090 range remains the immediate support, aligning with both horizontal demand and channel structure. Holding this level keeps the broader bullish framework intact. On the upside, $0.10–$0.105 remains the key resistance that must be reclaimed to confirm momentum.
A breakout above this region could open the path toward $0.12–$0.14, with further upside potential if market strength continues. Conversely, a breakdown below $0.085 would weaken the setup and expose $0.075 as the next downside level. At present, price action continues to favor support holding rather than structural failure.
Outlook: DOGE at a make-or-break level
Dogecoin is now trading at a structurally critical zone where the next move could define its near-term trajectory. As long as the $0.085–$0.090 support holds, the broader setup continues to favor a rebound scenario, particularly with accumulation signals building and macro structure intact. A confirmed move above $0.105 would strengthen bullish momentum and open the path toward $0.12–$0.14. However, failure to hold support would weaken the structure and shift focus toward $0.075.
India’s tax authorities are now cracking down on crypto traders. The Income Tax Department has begun sending Section 148A notices for FY 2021–22, targeting unreported crypto transactions.
With exchanges, bank records, and PAN data under review, many traders could face reassessments and pressure to explain hidden profits.
Are you on their radar? Check it out!
Why Crypto Users Are Receiving India Crypto Tax Notices?
The notices are being triggered after the tax department began scanning trading data through its Insight Portal and risk engines. These systems compare PAN-linked KYC information, exchange transactions, bank movements, and ITR filings.
If mismatches appear, users may receive a Section 148A notice. This typically happens when crypto income was not reported, returns were not filed, or transaction trails appear incomplete due to multiple exchanges and wallets.
Many traders assumed reporting was not required in FY 2021–22 because crypto rules were unclear at the time. However, income disclosure was still mandatory, and authorities are now reviewing past activity.
Notices May Show Inflated “Undisclosed Income”
One major issue is that some notices display very high income figures. In certain cases, notices show amounts like ₹1.63 crore as “undisclosed income.” But this is often not the actual profit.
The system frequently calculates gross trading volume instead of net gains. For example, if a trader had a total trading volume of ₹ 1.6 crore but only ₹4–5 lakh in profit, the system may still flag the full ₹1.6 crore as income until it is clarified.
This usually happens when the tax department sees only partial transaction data.
Multiple Exchanges Increasing Risk
Users who traded across several platforms are more likely to get flagged. A typical flow, such as CoinSwitch to Binance, then to a wallet, and later to another exchange, can create gaps in the data.
If the system sees only deposits or withdrawals without the full chain, it may treat transfers as fresh income. This leads to inflated estimates and triggers notices.
Another major red flag is not filing an ITR for AY 2022–23 despite having crypto activity. In such cases, the risk score rises sharply.
Importantly, a Section 148A notice is not a final tax demand. It is a show-cause notice asking the taxpayer to explain the mismatch before the assessment is reopened.
Recipients are advised to reconstruct all transactions, calculate actual gains or losses, and submit supporting documents. In many cases, proper reconciliation can resolve the issue.
The development signals that crypto transactions in India are now fully traceable through AIS data, exchange reporting, and KYC records.
With enforcement increasing, more notices for FY 2021–22 and FY 2022–23 are likely.
The XRP price is showing early signs of a potential bottoming phase, but the market isn’t confirming it yet. The token is currently trading around $1.31, holding near key support after a weak bounce, while recent sessions have seen muted price action and inconsistent volume follow-through. At the same time, on-chain data paints a more compelling picture: the average trader returns have dropped to -41%, the lowest level since the FTX collapse.
While such extreme losses have historically marked accumulation zones, the XRP price remains stuck in a downtrend, leaving traders split between value and confirmation.
XRP MVRV Hits Extreme Lows — But Timing Remains Unclear
Santiment data shows XRP’s 365-day MVRV dropping to around -41%, placing it deep within what is historically considered an “opportunity zone.” This means the average holder over the past year is sitting on significant losses — a condition that typically emerges during late-stage corrections or capitulation phases.
At the same time, the chart highlights a clear pattern: whenever MVRV moves below this threshold, downside risk tends to compress as selling pressure weakens. The last time XRP entered a similar zone during the FTX collapse, the price eventually rebounded by over 60% in the following months.
However, not all signals are immediately actionable. The 30-day MVRV remains closer to neutral, indicating that short-term traders are not yet deeply underwater—a key condition often seen before stronger reversals. This creates a mixed setup where long-term value is emerging, but short-term conviction is still lacking.
XRP Price Analysis: Downtrend Remains Intact as Key Breakout Still Missing
Despite improving long-term valuation signals, XRP’s price action continues to reflect weakness. On the 4-hour chart, the asset remains confined within a descending channel, with price currently trading near $1.31 after facing rejection near the upper boundary. The structure remains clearly bearish as lower highs continue to form below the $1.34 to $1.36 range.
The price is struggling to build momentum above the mid-range of the descending parallel channel. Therefore, the broader trend remains downward unless a breakout occurs. Besides, the RSI is holding around 43 to 49, indicating neutral to weak strength, while the MACD is showing a mild bullish crossover attempt but flattening, which is a sign of fading momentum. Volume also fails to support a sustained move higher, suggesting that recent bounces lack stronger buyer conviction.
The Bottom Line
The XRP Price is currently caught in a classic market conflict, with the on-chain signals showing deep undervaluation within an accumulation zone, while the price structure is bearish with no confirmation. A breakout above $1.36 could shift short-term structure, opening upside toward $1.45 to $1.55. Failure to break resistance and a loss of $1.30 support would likely extend downside toward $1.25 to $1.20.
XRP is entering a historically attractive accumulation zone, with long-term holders already deep in losses — a condition that has previously preceded strong recoveries. However, price action has yet to validate this shift. Until XRP breaks out of its descending channel and reclaims $1.36, the market remains structurally weak.
The live price of the MANA crypto token is $ 0.08486501.
Price predictions for 2026 range from $0.247 – $0.40.
By 2030, the MANA price could surge toward $4.90 due to growing trader activity.
Decentraland (MANA) is one of the earliest and most recognizable names in the metaverse sector. Built on Ethereum, Decentraland allows users to own virtual land, create experiences, and participate in a digital space using its native token, MANA.
While the overall metaverse narrative has cooled since its 2021 peak, Decentraland continues to maintain an active ecosystem focused on virtual events, social experiences, and creator-led development.
If you’re curious about Decentraland’s future and wondering whether MANA is a good investment, this MANA price prediction 2026–2030 will walk you through its potential growth and long-term outlook.
The MANA price has recently retraced to a significant multi-year demand zone in the first quarter 2026, demonstrating a consolidation phase on the price chart that indicates a potential exhaustion of long-standing selling pressure. As we entered the second quarter in April, this consolidation continues. However, should a favorable catalyst arise, we could see the price ascend toward the upper boundary of this demand zone at $0.125. Conversely, if such a catalyst does not materialize, we may experience an extension of this consolidation throughout April.
Decentraland (MANA) Price Prediction 2026
MANA crypto’s multi-year performance chart reflects a dramatic 98% decline since the FTX crash in 2022, leading many enthusiasts and investors to speculate about the project’s potential end.
This sharp price depreciation has instilled fear among investors, who have witnessed continuous negative price action for years. However, it is essential to consider the historical support level that has been in place since early 2021, which warrants attention despite the recent stagnation in price movement.
Although the project has experienced considerable setbacks over the past half-decade, there still remain arguments for a potential revival. The primary argument is the avoidance of delisting from several exchanges, indicating that MANA/USD continues to pursue efforts aimed at market recovery and still retains decent liquidity in a project with an over $250 million market cap.
Thus, the current retest of this support level is particularly noteworthy. A reversal at this juncture could result in substantial upward momentum. Conversely, if this support range is breached, it would likely reinforce perceptions of MANA crypto as a failing venture.
That said, it is crucial to closely monitor the $0.35 level. Should MANA successfully breach this level and maintain above it with a weekly close, this would signify a significant “Change of Character” for the price dynamic. Under such circumstances, a conservative target of $1.00 for the year may be warranted.
Price Prediction
Potential Low ($)
Average Price ($)
Potential High ($)
2026
0.95
1.45
1.95
MANA On-Chain Analysis
On-chain metrics for Decentraland (MANA) as of mid-March 2026, the asset is exhibiting a notable shift in market sentiment and trader behavior. Over the past 30 days, Open Interest (OI) has trended upward, peaking recently near the $7.14 million mark.
This climb in OI, coupled with funding rates that are stabilizing or turning positive (reaching approximately 0.01%), suggests that new capital is entering the market and traders are increasingly willing to pay a premium to hold long positions.
The profitability profile of short-term holders has also undergone a significant transformation. The 30-day MVRV Ratio has flipped above the zero line, currently sitting at approximately 2.39%. This transition into positive territory indicates that the average address that acquired MANA within the last month is now seeing “green” on their investment.
While this signals a return of bullish momentum, it also suggests that the asset has moved out of the “opportunity zone” and into a phase where some traders might begin to consider taking profits.
Furthermore, the supply distribution data reinforces this narrative of accumulation by larger stakeholders. Throughout March, addresses holding between 10,000 and 10 million MANA have seen a synchronized rise in their percentage of the total supply.
Specifically, the mid-tier “whale” and “shark” brackets (the 100k–1M and 1M–10M cohorts) have recovered from their late-February lows, signaling that significant players are positioning themselves for further upside. This collective accumulation by influential wallet tiers often serves as a foundational support for sustained price action.
Decentraland MANA Price Prediction 2026 – 2030
Price Prediction Years
Potential Low ($)
Average Price ($)
Potential High ($)
Decentraland (MANA) Price Forecast 2026
0.95
1.45
1.95
MANA Token Price Forecast 2027
1.55
2.15
2.85
Decentraland Price Analysis 2028
2.45
3.05
3.65
Decentraland Price Prediction 2029
3.55
3.95
4.35
MANA Price Prediction 2030
4.15
4.65
5.15
Decentraland (MANA) Price Forecast 2026
According to forecast prices and technical analysis, Decentraland’s price is projected to reach a minimum of $0.95 in 2026. The maximum price could hit $1.95, with an average trading price of around $1.45.
MANA Token Price Forecast 2027
Looking forward to 2027, MANA’s price is expected to reach a low of $1.55, with a high of $2.85 and an average forecast price of $2.15.
Decentraland Price Analysis 2028
In 2028, the price of a single Decentraland is anticipated to reach a minimum of $2.45, with a maximum of $3.65 and an average price of $3.05.
Decentraland Price Prediction 2029
By 2029, Decentraland’s price is predicted to reach a minimum of $3.55, with the potential to hit a maximum of $4.35 and an average of $3.95.
Decentraland (MANA) Price Prediction 2029
In 2030, the MANA coin price is predicted to touch its lowest price at $4.15, hitting a high of $5.15 and an average price of $4.65.
What Does The Market Say?
Year
2026
2027
2030
CoinCodex
$0.26
$0.39
$0.67
Tokenmetrics
$0.78
$1.41
$2.11
DigitalCoinPrice
$0.33
$0.61
$3.32
Never Miss a Beat in the Crypto World!
Stay ahead with breaking news, expert analysis, and real-time updates on the latest trends in Bitcoin, altcoins, DeFi, NFTs, and more.
FAQs
What is Decentraland (MANA) and how does it work?
Decentraland is a virtual world on Ethereum where users buy land, create experiences, and trade using the MANA token.
What is the predicted price of MANA in 2026?
MANA could trade between $0.247 and $0.40 in 2026, with potential upside if it maintains key support and adoption grows.
What is Decentraland’s price prediction for 2030?
By 2030, MANA could reach a high of $4.92, a low of $4.15, and an average price of $4.65, reflecting adoption and growing metaverse use.
How high could MANA price go in 2040?
Over the long term, MANA may see substantial growth if adoption and virtual land demand expand, potentially reaching a high of $12–$15 by 2040.
What drives the price of MANA?
MANA’s price is influenced by virtual land demand, user growth, creator tools, and on-chain activity in Decentraland.
Can Decentraland compete with other metaverse projects?
Yes, if Decentraland expands events, gaming, and creator tools, it could attract more users and remain a top metaverse platform.
AI-powered quant trading bots lead crypto evolution in 2026, automating strategies and boosting efficiency. The cryptocurrency market has continued to evolve in 2026, and AI-powered quant trading bots are now at the forefront of this transformation. These bots utilize cutting-edge…
A whale has transferred nearly $20 million worth of Bitcoin to Binance as the flagship crypto continues to struggle. Data from Arkham Intelligence shows that an address labeled “bc1q…kp4n” sent around 300 BTC, valued at over $20 million, to a…
Little Pepe surpasses $28m in presale, advancing to Stage 13 as investor participation grows. Little Pepe (LILPEPE) has now achieved yet another milestone in the continuation of the ongoing presale process, having now exceeded $28 million in overall funds raised.…
Ethereum price retraced some of its gains from Monday after U.S. President Donald Trump brushed off an Iranian proposal to end the war and warned that strikes would target key infrastructure if Tehran fails to reopen the Strait of Hormuz…
Fresh capital flowed back into U.S. spot Bitcoin ETFs at the start of the week, with Monday delivering the strongest single-day inflow in over a month and a half. Data from SoSoValue showed that the group of funds pulled in…
Artificial intelligence is set to reshape banking, according to Jamie Dimon, who used his latest shareholder letter to outline how deeply the technology is expected to embed itself across JPMorgan Chase. “The importance of AI is real, and while I…
Hyperliquid built one of the fastest perps platforms in crypto history. It processes $205 billion in monthly trading volume, runs 100,000 weekly users, and ranks #11 by market cap at $9 billion according to CoinMarketCap.
Yet HYPE sits at $35.50 today, down 40% from its all-time high of $59.30, and a whale known as Loracle just dumped $15.5 million in HYPE tokens ahead of today’s April 6 token unlock worth $368 million according to Ainvest. The hyperliquid price prediction from CoinPedia targets a peak around $185 by 2030. That is roughly 5x over four years of waiting.
Now look at what happened with Shiba Inu. Two brothers from New York threw $8,000 into SHIB during the pandemic and walked out with $9 million six months later. Shiba Inu had zero tools, zero exchange, zero audit. Raw community energy at the perfect moment created returns that the hyperliquid price prediction over four years will never touch.
That moment is alive right now with Pepeto. The presale blew past $8.74 million during one of the wildest stretches in crypto market history. The same whale wallets that moved $117 million in BTC are building entries here. Running the show is the cofounder of the original Pepe coin, the meme token that hit $11 billion with nothing behind it.
He built Pepeto with PepetoSwap for zero-fee trading, a cross-chain bridge linking ETH, BNB, and SOL, AI contract screening, and back-to-back audits by SolidProof and Coinsult. A former Binance executive sits on the team. Every buyer who caught the original Pepe coin presale made serious money. Every one of them wishes they went bigger. Pepeto is that second shot with real tools underneath.
Why Does the Hyperliquid Price Prediction Push Serious Capital Toward Pepeto?
The hyperliquid price prediction lays it all out. HYPE at $35.50 according to CoinMarketCap, climbing to $185 over four years is a 5x that needs every part of the market to line up, token unlocks to stop pressuring the price, and no competition to chip away at its lead. Wallets holding real capital do not sit around four years for a 5x when a presale-to-listing window can deliver that return in weeks.
The original Pepe coin showed that one founder with the right timing can build a top-ten token. Pepeto has the same founder, shipped products, verified security, and a Binance listing closing in. The hyperliquid price prediction is a patience game. Pepeto is a timing game. The big wallets have already made their choice.
How Is the Shiba Inu Story Repeating Inside Pepeto Right Now?
The setup mirrors exactly what made SHIB holders rich. An organic community building across social channels faster than any paid campaign could match. Presale demand climbing through a crash while everything else falls apart. Large wallets are entering with the kind of size that only appears when the math is already done.
A listing coming that drops the token onto millions of screens in a single day. Shiba Inu handed presale holders over 25,000% returns with nothing backing it.
Pepeto carries that same viral momentum, except PepetoSwap creates real trading volume, the bridge captures cross-chain flow, and revenue sharing sends a cut of every trade to holders based on their bag size. The more you hold, the more you earn from every swap. The cofounder of the original Pepe coin already pulled this off at a $11 billion scale. That is not a guess. That is a record anyone can check.
Conclusion
Rounds fill ahead of schedule every time. The Binance listing draws closer by the day, and the whale wallets that crashed Bitcoin are already locked into position. Everyone who missed Shiba Inu, everyone who watched HYPE bleed through token unlocks, everyone who promised themselves they would catch the next big one early is staring at the answer.
The hyperliquid price prediction tells you to sit tight for four years. Pepeto’s presale asks you to act before the listing resets the price for good. The Pepeto official website is still live. The window will not stay open much longer.
What is the hyperliquid price prediction for 2026, and how does it compare to Pepeto?
HYPE at $35.50 targets a ceiling near $90 by late 2026, according to CoinPedia, a 2.5x that requires every part of the market to lift it. Pepeto at $0.0000001862 targets 150x to the level Pepe reached with zero products, backed by a full exchange and a confirmed Binance listing.
How does Pepeto follow the Shiba Inu playbook while offering more than SHIB ever did?
Shiba Inu turned $8,000 into $9 million with no products behind it, and Pepeto repeats that viral pattern while adding PepetoSwap with zero-fee trading, a cross-chain bridge, AI screening, and verified audits from SolidProof and Coinsult. The presale has collected $8.74 million at $0.0000001862 with a Binance listing locked in.
Grayscale is pushing the crypto industry to speed up preparations after insights from Google Quantum AI. The latest research suggests quantum progress may not be gradual; it could arrive in sudden breakthroughs, leaving less time to react.
This concern ties back to work by Peter Shor, whose algorithm showed how quantum machines could break modern cryptography. While such computers don’t yet exist at scale, the path toward them may be shorter than expected.
Why Delays Could Backfire
The research estimates that around 1,200 to 1,450 logical qubits could be enough to challenge current encryption systems. That level hasn’t been reached, but it’s no longer seen as distant.
At the same time, blockchain upgrades are slow by design. They require coordination across global communities, technical changes, and consensus. If quantum progress accelerates suddenly, networks that haven’t prepared may struggle to catch up.
Post-Quantum Crypto Is Already Here
Grayscale says the Google paper shows a clear direction, while there’s urgency, the solution is already in place. Post-quantum cryptography is mature and actively used in securing internet systems. Some blockchain networks, including Solana and the XRP Ledger, have already started experimenting with it, showing that the transition is already underway.
“The path forward is “technically clear”: blockchains need to adopt post-quantum cryptography; this is a “mature cryptographic discipline” with tools that have been “proposed, scrutinized, implemented, and deployed.” These systems are already securing internet traffic and certain blockchain transactions. Both Solana and the XRP Ledger are already experimenting with post-quantum cryptography.”
Not Every Blockchain Faces the Same Risk
Grayscale added that Quantum impact depends heavily on how each network is designed. Systems like Bitcoin use a UTXO model and proof-of-work, which lowers certain risks compared to more complex smart contract platforms.
Still, Bitcoin faces a different issue. The community must decide how to handle lost or inactive coins, with options like burning them or limiting access. The challenge isn’t technical; it’s getting everyone to agree.
Loops in Decentralized Networks
Unlike banks or tech firms that can act quickly under centralized control, blockchains rely on community consensus. That slows down upgrades but also makes them more resilient over time. Right now, there’s no immediate danger. But the direction is clear, quantum computing is advancing, and preparation needs to keep pace.
Bitcoin mining company MARA transferred 250 BTC worth about $17.37 million to an external address, according to on-chain data. This latest move follows the firm’s large sale of 15,133 BTC valued at roughly $1.1 billion between March 4 and March 25, which was part of its broader balance-sheet strategy. The continued transfers have drawn market attention as investors watch how public miners manage their Bitcoin reserves amid changing conditions in the crypto sector.
Strategy Inc., the Bitcoin-focused company led by Michael Saylor, posted an approximately $14.46 billion unrealized loss in the first quarter of 2026 as the value of its Bitcoin holdings declined sharply. This drop reflects weaker market prices, with Bitcoin falling around 23% and marking its worst first-quarter performance since 2018. The company also recorded a deferred tax benefit of about $2.42 billion, which partly offset the paper loss. Despite this, Strategy continued buying Bitcoin even as it held roughly $51.65 billion in digital assets at quarter-end.
Polymarket, one the biggest prediction market has announced a major platform upgrade that includes launching its own stablecoin, Polymarket USD. The prediction market will migrate from USDC.e to the new collateral token, which will be backed 1:1 by USDC.
The aims to improve trading efficiency and giving Polymarket more control over its liquidity.
Polymarket Introduces Its Own USD Stablecoin
In a recent tweet post Polymarket developers team confirmed that Polymarket USD will replace USDC.e as the main collateral token on the platform. The transition will happen over the next two to three weeks alongside upgrades to smart contracts, order books, and the trading engine.
For most users, the migration will happen automatically. The platform’s frontend will handle the conversion with a one-time approval. However, power users and API traders will need to manually wrap USDC or USDC.e into Polymarket USD using the platform’s collateral onramp contract.
We've heard your feedback, and we're excited to announce Polymarket is getting a full exchange upgrade.
Over the next few weeks, we're rolling out a rebuilt trading engine, upgraded smart contracts, and a new collateral token (Polymarket USD) to move off USDC.e.
The platform said the update will also improve order matching, simplify orders, and enhance fee distribution. A new SDK will help developers migrate bots, though existing order books will be cleared.
This change comes as Polymarket sees rapid growth, recording over $22 billion in trading volume in the first 11 months of 2025.
Users Question Trust and Adoption, Warn Risk to Circle
The announcement triggered strong reactions from users. One X user said the move could become “the biggest threat for CRCL,” as Polymarket is currently paying around 3.5%–4% to Circle on deposits, which could push it to reduce this dependency.
If large platforms may start launching their own stablecoins, it may gives more control, lets them earn from deposits, and keeps users engaged.
While, not everyone is convinced the new stablecoin will succeed.
Another X user pointed out that many institutions have tried launching stablecoins but failed to scale. They said that trust remains the most important factor, and Polymarket’s brand alone may not be enough.
Upgrade Requires Changes for Bots and Integrations
Polymarket is also releasing a new CLOB client SDK to support the migration. The update will automatically handle the switch from the old system to the new one, but developers must upgrade to the latest version.
Bots and integrations will need to re-sign orders using the new structure. TypeScript, Python, and Go clients will be supported, with documentation provided before launch.
During the upgrade, existing order books will be cleared, and the platform will enter a short maintenance window. Polymarket said it will announce the exact timing at least one week in advance.
If the rollout goes smoothly, the new stablecoin could streamline trading and improve platform performance
The pepe coin price prediction draws fresh attention this week as meme coin dominance falls to a record low of 3.2%, with the entire sector bleeding 77% from its December 2024 peak according to SpotedCrypto. But the real conversation in the Pepe universe is not about charts or bounces.
The person who turned Pepe from a joke into an $11 billion token using 420 trillion coins and zero products is now behind Pepeto, carrying the same supply count, the same explosive community energy, and an actual working exchange that the original never delivered.
The earliest Pepe buyers who jumped in during those first April 2023 weeks turned $1,000 entries into six figures as the coin ripped over 7,000% inside its first 30 days. Those gains came from pure meme power with no tools and no audit behind them.
Pepeto brings both to the table, along with a Binance listing set to drop right after launch and rising buzz from the same communities that pushed Pepe to global status. The Pepe coin price prediction matters as context, but the real opportunity sits in the presale that is still open, where the path from entry to listing carries the same wealth-changing math.
The Next Pepe Coin: Same Builder, Better Tools, and a Binance Listing Locked In
Pepe showed the world that a meme token with absolutely nothing behind it can hit $11 billion on viral force alone. Every single wallet that got in early and stayed through the listing walked away with life-changing money. But Pepe shipped no exchange, no bridge, no risk tools, and no plan for survival once the hype cooled.
That explains why its price sits more than 88% below the all-time high right now, with meme sector dominance at its lowest point ever. Pepeto addresses every gap. The same cofounder is delivering a zero-fee trading platform, a cross-chain bridge spanning ETH, BNB, and SOL, a contract scanner that catches traps before your money touches them, and a completed SolidProof audit.
The Binance listing goes live right before launch day, and the viral energy stacking around Pepeto mirrors the exact pattern that sent the original parabolic. With growing signals of Elon Musk engagement, Pepeto carries a floor the first version never had.
Pepe Coin Price Prediction 2026 and the Presale Where the Same Builder Creates Something Stronger
Pepeto: The Complete Exchange Presale From the Builder Who Already Made an $11 Billion Token
Pepeto is not just the hottest presale in crypto right now. It is the presale backed by the deepest product development from a builder who already proved what happens when meme energy meets perfect timing.
The project ships a full exchange built on Ethereum, where the tools exist to protect capital rather than drain it. The risk scoring engine flags toxic contracts before your funds get anywhere close, catching hidden ownership traps and liquidity locks that most traders miss until the damage is done.
Next to the original Pepe, which crossed $11 billion on nothing but hype, Pepeto delivers working exchange tools, a finished SolidProof audit, and a former Binance executive steering the listing path. Over $8.74 million collected with wallet sizes growing every round proves this is the entry point of the cycle.
Staking at 188% APY already compounds positions inside the presale, building balances while everyone else stares at Pepe coin price prediction charts. At $0.0000001862 with the same 420 trillion supply, reaching what Pepe hit with nothing equals 150x, and the exchange turns that peak into a floor. But this door shuts for good the moment the Binance listing drops, and each round fills faster than the last.
Pepe Coin Price Prediction: Where Recovery Hits a Wall and Why the Upside Has a Ceiling
PEPE currently trades near $0.00000332, roughly 88% below its December 2024 all-time high, holding a market cap around $1.39 billion according to CoinMarketCap.
The 50-day EMA hovers near $0.0000040, about 19% above the spot price according to FXStreet. Getting back to the all-time high of $0.00002803 works out to roughly 8x. For a token that already showed what meme virality can achieve, 8x does not reshape a portfolio. The same builder behind Pepeto at 150x from presale to that same peak tells you exactly where the better math lives.
Conclusion
That mix of meme virality and real exchange function on the Ethereum blockchain is why the wallets entering every round link back to addresses that held major bags through multiple cycles. These are holders who built real wealth by catching infrastructure before everyone else noticed.
They commit with size, verify every detail, and only move when they spot something the broader market has not priced in yet. The Pepe coin price prediction offers a recovery trade, but the next Pepe coin is the one where the same builder ships better tools and a presale window that closes the second the listing goes live. The Pepeto official website is where those entries are happening right now.
What makes the Pepe coin price prediction for 2026 different from Pepeto’s upside potential?
PEPE at $0.00000332 targets a recovery toward $0.0000040 in the short term, but even hitting its all-time high only delivers 8x. Pepeto at presale pricing carries 150x to that same level with a full exchange and confirmed Binance listing backing it.
Why do crypto investors keep calling Pepeto the next Pepe coin heading into 2026?
Pepeto shares the same cofounder and the same 420 trillion supply as the original, but adds a zero-fee exchange, a cross-chain bridge, and a SolidProof audit. Visit the Pepeto official website before the presale closes for good.
The crypto market fell 2% to $2.42 trillion after U.S. President Donald Trump said Iran’s proposal to end the war was not enough and warned that Tehran must reopen the Strait of Hormuz by the deadline or face strikes on…
A new security framework has been unveiled by the Solana Foundation to audit Solana-based protocols and strengthen risk monitoring. According to the official announcement, the initiative was developed with Asymmetric Research and is called STRIDE. It is designed to assess…
Recently uncovered phone records point to multiple calls between Argentine President Javier Milei and a Libra-associated entrepreneur. Phone logs reviewed by prosecutors, and reported by The New York Times, indicate that Milei exchanged seven calls with an entrepreneur linked to…
One of the three convicted terrorism financiers sent $49,000 worth of stablecoins to a foreign exchange before it was routed to an ISIS-linked campaign.
The Solana Foundation and Web3 security firm Asymmetric Research unveiled a new security initiative called STRIDE, along with a real-time incident-response network.
The Bitgert (BRISE) price has exploded by over 130% in a sudden move that’s turning heads across the market. The token surged from the lows around $0.0000000174, marking the monthly high at $0.00000004117, outperforming the slightly down broader market. But beneath the surface, the rally raises more questions than answers.
With no clear catalyst and a sharp spike in on-chain activity appearing almost overnight, traders are now facing a familiar dilemma—is the current price the start of a real breakout or just another low-cap liquidity grab?
On-Chain Data Signals Sudden Activity — Not Steady Growth
Bitgert’s on-chain data shows a synchronised surge across multiple key metrics, pointing to a sudden burst of network activity rather than gradual growth. New transactions recorded a sharp vertical spike after weeks of relatively muted movement, while active accounts followed a similar pattern with a late-stage jump. At the same time, contract growth increased in step-like bursts, indicating discrete waves of interaction rather than continuous expansion.
Taken together, this pattern suggests that the recent activity is concentrated within a short time window, not built through sustained user adoption. Such synchronized spikes across transactions, users, and contracts are often associated with short-term participation, including speculative trading flows or coordinated network interactions— rather than organic ecosystem growth. If this activity doesn’t last, it’s more likely to be a short-term spike in usage than a long-term change in demand.
Price Structure Remains Weak Despite Sharp Rally
Bitgert (BRISE) has surged over 130% on the week, pushing the price back toward a critical supply zone near 0.17e⁻⁶. However, the broader structure remains bearish, with price still trading below a long-term descending trendline that has capped rallies since 2023. The current move appears to be a relief bounce from the 0.04e-6 base, rather than a confirmed trend reversal.
From a momentum standpoint, RSI has bounced from the 30–35 zone to near 60, signaling short-term strength, while MACD is attempting a bullish crossover after an extended bearish phase. But both indicators are still in early-stage recovery and require price confirmation.
A clean breakout and hold above 0.17e-6 could trigger momentum continuation toward 0.30e-6, with extension potential to 0.40e-6 if volume follows. Rejection at 0.17e-6 would confirm this as a relief rally, with downside risk back toward 0.06e-6 and possibly the 0.04e-6 base. If the price fails to hold above 0.10e⁻⁶ after the spike, it signals weakening momentum and increases the probability that this move was liquidity-driven rather than structural.
Wrapping it Up
Bitgret (BRISE) price rally has momentum but no confirmation. With the price sitting just below 0.17e⁻⁶ resistance, the next move will decide everything—breakout or rejection. Until that level is reclaimed with strength, this remains a high-risk, liquidity-driven setup rather than a confirmed trend reversal.
Charles Hoskinson has responded to the backlash over his comments on XRP and Brad Garlinghouse, saying things got blown out of proportion. He said clips of his statements were cut and shared in a way that made them look worse.
According to him, people are no longer listening to the full context. He clarified that he was talking about Garlinghouse’s actions around crypto regulation, not targeting him personally.
“He’s trying to pass a bill that makes everything by default a security until proven otherwise, which was the treatment Gary Gensler inflicted on his own ecosystem. It’s a non-starter because he knows that he’s going to get an exemption, and it reduces competition,” Hoskinson said.
Opening up about the CLARITY Act, Hoskinson said the bill could treat most crypto projects as securities by default, similar to how Gary Gensler handled things.
What He Said Earlier About XRP and the Bill
Before this, Hoskinson had taken a much stronger tone while reacting to Garlinghouse’s support for the CLARITY Act. He called the bill a “horrific” proposal and said it could favor big players like Ripple while putting pressure on smaller projects.
He pointed out that new projects may have to deal with strict rules from day one, needing to prove they are not securities. At the same time, he raised concerns that companies like Ripple could get certain exemptions, giving them an advantage.
He also mentioned that regulators could use this framework to go after more projects across the space, which could slow down innovation and limit competition.
Where Things Stand Now
His position hasn’t really changed. He still doesn’t agree with the bill, but now says his comments were more about protecting the industry as a whole. Calling it “tough love,” he tried to make it clear that his focus is on the long-term impact, not just XRP.
BitMine just added 71,179 ETH worth $143 million to its treasury in a single move, expanding one of the largest institutional Ether positions in the market while the token trades 58% below its all-time high. Institutions are buying while retail watches.
The Ethereum price prediction matters for holders watching ETH sit at $2,024 during the correction. The broader picture is worth noting: the US classified crypto as commodities, spot ETFs launched across every major token, and the Ethereum Foundation locked $143 million into staking rather than selling. The infrastructure buildout is accelerating.
Pepeto raised $8.68 million during this fear with a working exchange already live, and analysts project 100x from the Binance listing because a single event delivers what the ETH recovery stretches over quarters.
Ethereum Price Prediction Gets Context as BitMine Adds $143 Million in ETH While Foundation Stops Selling
BitMine expanded its ETH treasury by 71,179 ETH in a purchase worth roughly $143 million, pushing its MAVAN staking platform past 3.1 million ETH under management backed by firms like ARK Invest, Pantera, and Galaxy Digital, per CoinDesk.
The Ethereum Foundation completed its 70,000 ETH staking target on April 3 by depositing $93 million in one session, shifting its operating model from selling ETH to earning yield, per CoinDesk.
Institutional yield infrastructure lifts the outlook, but the exchange still at presale pricing with a confirmed Binance listing is where compressed returns sit while ETH slowly recovers.
Where Institutional ETH Yield Meets Presale Opportunity Before the Listing
Pepeto
Every bull market creates fresh opportunities and fresh risks. Fraud picks up speed when prices move, and most traders lack tools to check what they buy before linking a wallet. Pepeto addresses this directly. The working exchange provides contract safety checks, whale wallet tracking, and real-time verified signals through one platform.
When a trading tool gets used daily, the token behind it builds lasting demand that supports price long after listing excitement fades. The contract scanner flags risky tokens before capital commits. PepetoSwap runs every swap at zero cost. The cross-chain bridge moves tokens between ETH, BNB, and Solana without any fee.
The token sits at $0.0000001862 with $8.68 million raised during extreme fear. Staking at 188% APY compounds early positions while stages fill. SolidProof reviewed the full codebase, and the founder who took the original Pepe token to $11 billion on a 420 trillion supply designed this exchange with a former Binance executive.
Historical data shows that projects combining working products, strong team credentials, and presale pricing during market fear have consistently produced the largest returns in crypto. Pepeto fits that pattern at $0.0000001862, and the Binance listing represents the catalyst that historically turns presale entries into the returns later buyers wish they had caught.
Ethereum Price Prediction: Can ETH Recover to $3,000 and Eventually Reach $10,000?
Ethereum trades at $2,024 as of April 5, sitting 58% below its $4,953 all-time high from August 2025, per CoinMarketCap. The Fear and Greed Index reads 9.
The ETH forecast depends on holding $2,000 and clearing $2,250, which opens $2,500 and then $3,000. Standard Chartered holds a $7,500 year-end target, and at $10,000 ETH’s market cap would reach roughly $1.2 trillion, a level achievable in a strong cycle but likely requiring the 2027-2028 post-halving window rather than months.
The bullish case for 2026 targets $3,000 to $3,600 in the bullish case, roughly 46% to 75% over months. The institutional staking buildout removes sell pressure and supports long-term price, but those returns take quarters to play out, not the concentrated timeline a presale-to-listing event compresses into.
Conclusion
The Ethereum price prediction shows institutions treating ETH as a yield-bearing asset, a sign of maturity that benefits long-term holders. SHIB converted $1,000 positions into $1 million in 2021 with no working product behind it.
Pepeto offers a working exchange, the same founder who built Pepe to $11 billion, and a confirmed Binance listing. More infrastructure behind a project has historically reached further than zero infrastructure did, and $8.68 million entering during a Fear Index of 9 suggests the informed capital has already calculated where this is heading.
The Pepeto official website is where those positions are still available. Holders who caught ETH below $100 in 2019 or XRP at $0.003 before the 2021 rally did not need headlines to confirm the opportunity. They read the data, weighed the risk, and moved.
According to the latest reports, Banks and crypto firms have agreed on a deal for the Bitcoin market structure bill, with an official announcement expected this week. The CLARITY Act had been stuck since January over whether crypto platforms could offer yield on stablecoins, but that issue now appears resolved.
However, John E. Deaton has warned that the CLARITY Act could collapse if not passed soon.
“It’s going to die… Innovation will die potentially here,” Deaton said in a recent interview, stressing that time is running out as political focus begins shifting toward the 2026 midterm elections.
Why the CLARITY Act Could Stall
According to Deaton, the biggest threat isn’t opposition, it’s timing. Once summer arrives, election campaigns are expected to dominate Washington, leaving little room for complex legislation like crypto regulation.
“If we get into the summer months, it’s just probably not going to happen,” he said, pointing out that lawmakers will be consumed by campaigning rather than policymaking.
This creates a narrow window over the next few weeks for progress before Congress slows down ahead of the August recess.
Midterms Could Change Everything
Deaton also warned that election outcomes could reshape the entire regulatory landscape. If Democrats gain control, Elizabeth Warren could lead the Senate Banking Committee.
He argues that under her leadership, the approach would lean toward stricter enforcement rather than innovation-friendly rules, making the CLARITY Act unlikely to pass.
With limited time and rising political pressure, the coming weeks may decide whether the U.S. gets clear crypto regulation or sees the effort fade entirely.
Meanwhile, chances of the CLARITY Act passing are slipping, with Polymarket now showing odds at 60% in April, down from 82% in February, showing that confidence around the bill is starting to cool.
Progress on a potential crypto safe harbor framework is now entering a key regulatory phase as it is up for White review. US Securities and Exchange Commission Chair Paul Atkins said the agency’s proposed “Regulation Crypto Assets” package has been…
Bitcoin price struggled to maintain footing above the $70,000 level as traders waited for clearer direction from ongoing geopolitical negotiations between the United States and Iran. Bitcoin briefly climbed past $70,200 earlier in the week after reports suggested both sides…
Pi Network has completed its first round of KYC validator reward distributions, marking a significant milestone for the project’s decentralised human workforce model.
The rewards cover more than 526 million validation tasks completed by over 1 million human validators, work that contributed directly to verifying the identities of 18 million people across Pi’s global network. All validators with active Mainnet wallets have now received their payments on the blockchain.
How the Rewards Were Calculated
The reward pool was built from a simple mechanism. Every Pioneer who migrated to Mainnet contributed 1 Pi into the pool. With 16.5 million successful migrations, the base pool stood at 16.5 million Pi. The Pi Foundation added a further 10 million Pi to supplement the first round, recognising that early validators were still learning the process during the initial bootstrapping phase.
The final calculation divided the total pool of 26.5 million Pi across 526,970,631 successful validations, arriving at a price per validation of approximately 0.0504 Pi, equal to roughly 21 times the current base mining rate.
To qualify for this round, validators needed to have completed at least 50 validations reaching majority agreement by March 5, 2026.
What It Means for Pi’s Broader Vision
Beyond the numbers, Pi Network is positioning this milestone as proof of something larger. The project argues that it has solved a problem that most AI-focused platforms have struggled with: actually getting humans to show up and contribute at scale.
Over half a billion tasks completed by more than a million people, with payments processed directly through the Pi blockchain, is a data point the network will likely lean on heavily as it builds toward human-in-the-loop AI applications and broader decentralised work opportunities.
Future reward rounds are expected to see higher per-validation rates as AI handles more routine checks and fewer human validations are needed per application, meaning the pool gets divided among a smaller number of tasks.
How to Participate Going Forward
Validators who missed the first round can still position themselves for future distributions. Pi Network is encouraging all eligible Pioneers to complete the Mainnet Checklist, set up a Mainnet wallet and begin contributing validation work now ahead of the second distribution round.
The reward rate per validation is expected to vary across future rounds based on pool size, total validations completed and evolving accuracy criteria.
DeFi risk manager Chaos Labs said Aave’s planned migration to Aave V4 introduced risks that it wasn’t willing to assume, while Aave said Chaos wanted to take on full control as the sole risk service provider.
CRV price has been grinding lower since late 2025, and the Curve DAO token is now pressing against the lower boundary of a descending channel that has defined its price action for months. The $0.20 level is within reach, and…
Worldcoin price is grinding just above an all-time low, and the WLD token has failed to stage any meaningful recovery despite Nasdaq-listed Eightco disclosing a $326 million position on April 2. The descending channel structure on both the daily and…
AAVE price posted one of its sharpest single-session drops in months on April 6, briefly crashing through $84 before a partial recovery took hold. The chart damage is clear: $100 has gone from support to resistance in a single session,…
The XRP price CLARITY Act connection has never been tighter: with the Senate Banking Committee targeting a late April markup and Senator Bernie Moreno warning that failure to pass by May effectively kills the bill for 2026, the next three…
Charles Schwab will launch Schwab Bitcoin Ethereum trading in Q2 2026, giving its 38.9 million active brokerage clients direct spot access to crypto for the first time through a new service called Schwab Crypto. Charles Schwab Schwab Bitcoin Ethereum trading…
Polymarket is upgrading its exchange infrastructure in the coming weeks, introducing new contracts and a USDC-backed token while phasing out a bridged stablecoin.
Georgia’s legislature adjourns today, April 6, having sent three AI-related bills to Governor Brian Kemp’s desk, the most notable being a Georgia AI chatbot bill that mandates disclosure, child protections, and crisis response protocols for self-harm. Georgia’s 2026 legislative session…
President Trump’s DHS pay order has directed all Department of Homeland Security employees to be paid using redirected federal funds, but legal and budget experts say the administration may be violating a 150-year-old law that gives Congress sole control over…
House Democrats are convening a virtual caucus call tonight, April 6, to plot their next steps on the DHS shutdown, now 51 days old and the longest partial government shutdown in US history. House Democrats are holding a virtual DHS…
An open-source AI job hunter built on Claude Code just auto-applied to hundreds of roles and actually landed a job, exposing why the real bottleneck is on-chain compute, not résumés. A viral clip shared by 0xMarioNawfal claims that “SOMEONE BUILT…
Chinese AI tracking companies with ties to the People’s Liberation Army are marketing detailed intelligence on US military movements during the Iran war, built entirely from publicly available satellite imagery, flight data, and shipping records, according to a Washington Post…
U.S. stocks inched higher on Monday, but beneath the smooth index closes, meme names, bitcoin proxies and Chinese ADRs traded like a late‑cycle minefield. U.S. equities finished Monday’s session slightly higher, with the Dow Jones Industrial Average rising 0.36%, the…
A new investigation published argues that the federal government is rushing into artificial intelligence the same way it rushed into cloud computing a decade ago, and with the same structural vulnerabilities still in place. ProPublica’s Renee Dudley published an investigation…
Prediction markets like Polymarket and Kalshi now clear nearly $24b a month as AI bots, Wall Street capital and new CFTC rules drag the sector into mainstream finance. Prediction markets are moving from the fringes of crypto into the core…
Canton Network’s rise as a permissioned, institution-first blockchain is forcing crypto to decide whether the future of tokenized finance belongs to open rails like Ethereum or fenced-off, privacy-gated stacks for banks and asset managers. Canton Network, the enterprise blockchain built…
Algorand’s ALGO token has gained roughly 50% this month, climbing from $0.079 to $0.126, after Google’s Quantum AI team cited the blockchain 32 times in a landmark paper on quantum threats to cryptocurrency. As crypto.news reported, Algorand (ALGO) rallied to…
Circle’s Layer-1 blockchain Arc will launch at mainnet with an opt-in post-quantum signature scheme protecting users’ wallets from day one, as the USDC issuer warns that Q-Day could arrive by 2030 or sooner. Circle’s Layer-1 blockchain Arc will debut at…
The CEO's annual shareholder letter warned that new tech is reshaping finance, with tokenization and blockchain competitors gaining as the bank scales its own network.
Acknowledging there is ”still a lot more work to do” before Congress can advance a market structure bill, Senator Bill Hagerty sees renewed attention starting next week.
Bernstein says Figure may be undervalued as loan volumes surge and its tokenized credit platform expands, despite recent stock declines and market volatility.
China’s Cyberspace Administration has ordered Apple to pull Jack Dorsey’s Bitchat from its China App Store, citing regulations that require apps with “social mobilization” capabilities to pass a government security assessment before launch. Block CEO Jack Dorsey confirmed on X…
More than $273 million in bearish crypto positions were unwound in under 24 hours on April 6, as reports of US-Iran ceasefire talks triggered a sudden and sharp shift in market sentiment. Bears paid a heavy price on Monday. Bloomberg…
Coinglass data shows Ethereum trapped in a tight “liquidation corridor,” with $1.414b in longs at risk below $2,040 and $889m in shorts exposed above $2,253. If Ethereum (ETH) slides below $2,040, around $1.414 billion worth of long positions on major…
ETHGlobal Cannes 2026’s 10 finalists push AI agents, privacy infrastructure and on-chain prediction markets through projects like ENShell, DIVE, Corpus and VEIL VPN. ETHGlobal used a simple “Drumroll please…” tweet to introduce what is arguably one of its most technically…
Bitcoin climbed above $70,200 on Monday for the first time since March 25, as a report that the US and Iran are negotiating a 45-day ceasefire sent risk assets sharply higher across global markets. Bitcoin (BTC) reclaimed $70,000 on Monday…
Chaos Labs is ending its three‑year Aave mandate after a $27m oracle fiasco, deep governance infighting, and mounting fears over who is legally liable when DeFi risk breaks. Chaos Labs, the risk firm that has “priced every loan initiated on…
Binance faces renewed questions over its $4.3b post-plea cleanup as crime-monitoring staff depart and chief compliance officer Noah Perlman weighs an exit. Bitcoin (BTC) futures traders added more than $3.8 billion in new leveraged positions over the past 24 hours,…
Crypto is moving into regulated portfolios, including U.S. retirement plans. That shift matters less for long-term allocation and more for how digital assets are used: as collateral.
A recent proposal from the U.S. Labor Department would allow 401(k) plans to include cryptocurrencies under a defined legal framework for fiduciaries. This signals that crypto is being placed alongside private equity and private credit—assets typically used not only for growth, but for structured finance.
Once an asset enters that category, its role changes. It stops being purely speculative and starts functioning as part of a broader financial system.
From speculative asset to collateral base
Institutional inclusion brings a different set of requirements. Assets held in retirement accounts are expected to support liquidity, risk management, and capital efficiency. Crypto is beginning to meet those expectations.
Bitcoin and other large-cap assets are increasingly treated as:
Long-term stores of value
Yield-generating balancesc
Collateral for borrowing
This shift aligns with a broader trend already visible in lending markets. Crypto-backed credit lines and loans are no longer limited to short-term leverage trades. They are being used to unlock liquidity while maintaining exposure to underlying assets.
The logic is simple. If an asset is held for the long term, selling it to access cash becomes inefficient.
Why borrowing BTC replaces selling
The case for borrowing against crypto has strengthened in 2026 for two reasons.
First, taxation. In most jurisdictions, selling crypto triggers capital gains. With reporting frameworks expanding globally, including OECD-led initiatives and regional regulations, liquidation is becoming more visible and more costly.
Second, market structure. Crypto remains volatile, but long-term holders tend to treat drawdowns as temporary. Selling during a downturn locks in losses. Borrowing avoids that outcome.
This leads to a different approach:
Keep BTC or ETH as core holdings
Use them as collateral
Access liquidity without exiting positions
In practice, crypto starts to behave like real estate or equities—assets that are rarely sold outright, but frequently used to secure credit.
The evolution of crypto lending
As the role of crypto changes, lending models are adjusting.
Early crypto loans followed a fixed structure. Borrowers locked collateral, received a lump sum, and paid interest on the full amount from day one. Terms were rigid, and costs accumulated even when capital was not actively used.
Newer models focus on flexibility and capital efficiency.
Key changes include:
Interest based on loan-to-value (LTV) rather than flat rates
No fixed repayment schedules
Access to revolving credit instead of one-time loans
The shift mirrors traditional finance, where credit lines are often more efficient than fixed loans for managing liquidity.
Clapp Offers Flexibility with Credit Line Model
This transition is visible in platforms that treat borrowing as an ongoing tool.
Clapp.finance follows a credit-line model instead of a traditional loan structure. Users deposit crypto as collateral and receive a borrowing limit. From there, capital can be drawn when needed, rather than taken all at once.
The mechanics are straightforward:
Interest applies only to the amount actually used
Unused credit carries 0% APR if LTV is kept under 20%
Repaid funds immediately restore available credit
There is no fixed repayment schedule
This structure reduces the cost of holding unused liquidity and gives users more control over timing.
Clapp also supports multi-collateral borrowing, allowing users to combine assets such as BTC, ETH, and stablecoins within a single credit line. This can improve capital efficiency and reduce concentration risk.
Access to funds is continuous. Borrowing, repayment, and collateral management are available at any time, without operational delays.
In the context of institutional adoption, this type of structure aligns with how capital is typically managed: drawn when needed, repaid when convenient, and optimized around cost.
A shift in how crypto is used
The inclusion of crypto in retirement frameworks does not immediately change retail behaviour. What it does change is the underlying assumption about what crypto represents.
If digital assets are treated as part of long-term portfolios, they become less likely to be sold and more likely to be used.
That shift has practical implications:
Liquidity is accessed through borrowing rather than liquidation
Collateral management becomes part of portfolio strategy
Lending products move toward flexibility and cost efficiency
Borrowing against crypto is not a workaround for market volatility. It is becoming a standard way to manage capital.
Conclusion
The expansion of crypto into regulated portfolios signals a broader transition. Digital assets are moving into the financial core, where they support lending, liquidity, and long-term capital planning.
In that environment, the question is how to do it efficiently. Flexible credit models, low-LTV strategies, and on-demand liquidity are likely to define the next phase of crypto lending. For users who want to retain exposure while accessing capital, borrowing against Bitcoin is becoming a practical, structured approach rather than a niche tactic.
In another blow to the decentralized finance giant, Chaos Labs has announced it will step away from its role as a key risk manager for Aave, raising new concerns about the protocol’s operational stability and governance direction.
The decision, shared publicly on Aave’s governance forum, shows growing tensions within the DAO over how risk should be managed as the protocol scales.
A Deepening Rift Over Risk Strategy
Chaos Labs did not frame its exit as abrupt or reactionary. Instead, the firm described a “fundamental misalignment” in how risk management should evolve within Aave’s ecosystem.
After three years of involvement, including navigating volatile market cycles and scaling challenges, the firm argued that discussions around the protocol’s future only made the gap in vision more apparent.
At the heart of the disagreement is not just technical execution, but governance philosophy: who bears responsibility for risk, and how that responsibility should be funded and structured.
Mounting Operational Pressure
The firm outlined three pressures that made its continued involvement untenable:
A shrinking pool of core contributors, increasing workload and operational exposure
The upcoming V4 upgrade, which expands the scope and legal burden of risk management
Persistent financial strain, with risk operations reportedly running at a loss
Chaos Labs revealed that even with a $1 million increase in budget, its work on Aave would still operate with negative margins, a situation it deemed unsustainable.
A Pattern of Departures
The exit does not occur in isolation. Other contributors, including BGD Labs and Aave Companies Initiative (ACI), have also stepped back in recent months.
This pattern could mean a broader structural issue within Aave’s DAO, where increasing complexity and expectations may be outpacing incentives and coordination mechanisms.
What This Means for Aave
Aave remains one of the largest DeFi protocols globally, but the departure of multiple core contributors could test its resilience.
Risk management is not a peripheral function in DeFi. It is central to maintaining liquidity, protecting users, and ensuring protocol solvency during market stress.
Chaos Labs’ exit raises a critical question: can Aave recalibrate its governance and incentive structures quickly enough to retain and attract the expertise it depends on?
Price predictions for 2026 range from $0.70 to $1.20.
ARB could extend toward $6 by 2030, if recovery structure holds.
Arbitrum (ARB), one of the leading Layer-2 scaling solutions on Ethereum, is currently navigating a phase where strong ecosystem relevance contrasts with prolonged price weakness. While the network continues to play a key role in DeFi and Layer-2 infrastructure, its price action has remained under sustained pressure.
Following an extended downtrend, ARB is now stabilizing near lower demand zones, suggesting that selling momentum may be gradually easing. However, the absence of strong upside movement indicates that the market remains in a transitional phase rather than a confirmed recovery.
This creates a critical question: is Arbitrum forming a long-term base after capitulation, or does the structure still reflect weak demand? With 2026 already underway, attention now shifts to whether ARB can reclaim key resistance levels and transition into a recovery phase. Read on as we break down Arbitrum’s April outlook and full-year price trajectory.
As we move through early 2026, Arbitrum’s price action reflects a market transitioning from a prolonged downtrend into a stabilization phase. After consistent downside pressure, ARB found support near the $0.08–$0.10 demand zone, where selling momentum has started to ease. Since then, price has been consolidating, indicating early signs of base formation.
Currently, ARB is trading just below a key resistance zone near $0.10–$0.12, which remains critical for any shift in structure. A sustained move above this level could trigger a recovery toward the $0.15–$0.18 range, with further upside toward $0.20 if momentum strengthens.
In this context, Arbitrum in April may reach the $0.15–$0.18 range, provided resistance is reclaimed. However, failure to break higher may keep ARB range-bound, with downside risk toward $0.06 if the $0.08 support fails.
Coinpedia’s Arbitrum (ARB) Price Prediction 2026
The broader outlook for Arbitrum in 2026 suggests a market transitioning from a prolonged downtrend into a potential recovery phase, with scope for a significant structural shift if key levels are reclaimed. Following its earlier cycle highs, ARB entered a sustained bearish phase throughout 2025, marked by a descending resistance structure and consistent lower highs. This trend extended into early 2026, eventually pushing the price into a deep value zone where it is now attempting to stabilize.
At present, ARB is forming a base near its lower demand region, indicating that downside pressure is gradually weakening. This phase typically reflects early accumulation, where long-term participants begin positioning ahead of a potential trend reversal.
Looking ahead, the primary objective for ARB is to reclaim its immediate resistance near $0.12, followed by stronger structural levels around $0.18 and $0.20. A breakout above these zones would signal a shift in market structure, opening the path for a broader recovery. If this recovery phase gains traction, supported by renewed liquidity, Layer-2 adoption, and ecosystem growth, ARB could gradually move toward the $0.70 to $1.20 range, representing a return toward higher valuation bands seen in previous cycles.
However, such a move would require sustained strength and confirmation across multiple resistance levels. Until then, the asset remains in a rebuilding phase, where failure to hold the $0.08 support could delay recovery and extend consolidation.
Recent Catalysts For Arbitrum (ARB)
Ecosystem development and upgrades continue, reinforcing long-term positioning within Ethereum scaling. Layer-2 competition intensifies, keeping pressure on Arbitrum despite strong ecosystem presence. DeFi liquidity on Arbitrum remains stable, supporting underlying network activity.
Arbitrum Crypto Price Prediction 2026 – 2030
Year
Potential Low ($)
Potential Average ($
Potential High ($)
2026
0.70
1.00
1.20
2027
1.00
2.00
2.80
2028
1.40
2.70
4.00
2029
3.00
4.20
5.20
2030
4.60
5.00
7.00
Arbitrum Price Forecast 2026
The Arbitrum price range in 2026 is expected to be between $0.70 and $1.20.
ARB Crypto Price Prediction 2027
Arbitrum (ARB) price range can be between $1.70 to $2.80 during the year 2027.
Arbitrum Coin Price Prediction 2028
In 2028, the Arbitrum price is forecasted to potentially reach a low price of $1.40. and a high price of $4.00.
ARB Price Prediction 2029
Thereafter, the Arbitrum (ARB) price for the year 2029 could range between $3.00 and $5.20.
Arbitrum(ARB) Price Prediction 2030
Finally, in 2030, the price of Arbitrum is predicted to remain steadily positive. It may trade between $4.60 and $7.00.
Based on the historic data and trend analysis of the cryptocurrency along with the market sentiments, here are the possible Arbitrum price targets for the longer time frames.
Year
Potential Low ($)
Potential Average ($)
Potential High ($)
2031
4.00
5.80
8.00
2032
5.00
7.30
9.80
2033
6.50
8.20
11.00
2040
9.00
13.00
20.00
2050
13.00
22.00
32.00
Arbitrum (ARB) Price Prediction: Market Analysis?
Year
2026
2027
2030
Changelly
$1.20
$2.40
$6.00
DigitalCoinPrice
$1.90
$2.60
$5.70
WalletInvestor
$25.60
$1.00
$5.20
Never Miss a Beat in the Crypto World!
Stay ahead with breaking news, expert analysis, and real-time updates on the latest trends in Bitcoin, altcoins, DeFi, NFTs, and more.
FAQs
What is the Arbitrum (ARB) price prediction for 2026?
In 2026, ARB is expected to trade between $0.70 and $1.20 if it holds key support and confirms a long-term recovery trend.
What is the ARB price prediction for 2030?
ARB price prediction for 2030 suggests a potential range between $4.60 and $7.00, assuming sustained adoption and market growth.
What is the Arbitrum price prediction for 2040?
Arbitrum price prediction for 2040 indicates a possible range of $9 to $20 if Ethereum scaling demand remains strong long term.
What is the Arbitrum price prediction for 2050?
Arbitrum price prediction for 2040 indicates a possible range of $9 to $20 if Ethereum scaling demand remains strong long term.
What could impact Arbitrum’s price the most?
ARB price is influenced by Ethereum activity, Layer-2 adoption, overall crypto market trends, and broader investor sentiment.
Is Arbitrum a good long-term investment?
Arbitrum shows long-term potential due to Ethereum adoption, but ARB remains volatile and best suited for investors with risk tolerance.
Polymarket will rebuild its core engine, introduce a hybrid CLOB, and launch Polymarket USD, a USDC‑backed stablecoin on Polygon aimed at cheaper, more institution‑friendly trading. On‑chain prediction market Polymarket will roll out what it calls “the largest infrastructure upgrade since…
Dogecoin and Chainlink show resilience as investors turn to early-stage opportunities like BlockDAG. The year 2026 is revealing that the top crypto gainers are often the projects with the strongest foundations. Currently, the Dogecoin price stands resiliently at around $0.092,…
Tom Lee says Ethereum has become the No. 2 “wartime” asset, outpacing Bitcoin and stocks as war spending surges and crypto gains appeal as a liquidity and risk trade. Since the latest Middle East conflict escalated, Ethereum has become the…
A US appeals court sided with Kalshi, ruling that CFTC‑regulated event contracts fall under federal law, not New Jersey gambling rules, reshaping prediction market oversight. A federal appeals court has ruled that New Jersey cannot bar Kalshi from offering sports‑related…
TAO price showed a sharp 10% intraday surge pushed it cleanly off a key level around $300, flipping what used to be resistance into support. That’s bullish structure. Clean. Convincing.
But is it that simple, and will price keep rising? Let’s find out.
TAO price breakout builds strong bullish momentum
The move from $300 wasn’t random. That level had been acting like a ceiling in march, and now in April it’s holding as a floor. That’s the kind of shift traders watch closely and this demand area is being tested right now.
If momentum sticks, the next logical checkpoints sit at $352 and $396. Those aren’t fantasy targets they’re areas TAO price has already respected before. So revisiting them? Totally on the table.
And of course, the optimism doesn’t stop there. Some market voices are already calling for a much bigger move, with expectations stretching as high as $500 before June. The narrative? TAO isn’t just rallying it’s “ fundamentals are dominating.”
$TAO looks ready to keep dominating through April and into May.
Well, while TAO price action looks solid, derivatives data is starting to look… uncomfortable.
The futures volume bubble map from CryptoQuant platform shows heavy leveraged activity stacking up right between $300 and $350. Not just elevated but red hot overheated state. That’s usually not a sign of stability. It’s a sign of crowding.
And crowded trades don’t end well. We’ve seen this before. Back in Q4 2025, a similar overheating phase didn’t lead to continuation but it triggered a sharp correction. If history rhymes, this current setup could be laying the groundwork for a pullback rather than a breakout.
Bearish liquidation signals add pressure on upside
Now layer in liquidation data, and things get even more interesting. Right now, the structure leans bearish.
That means if TAO price stalls or dips, downside liquidations could accelerate the move lower. Basically, the same leverage that’s fueling upside momentum can flip and become a liability real fast.
So while spot traders see strength, derivatives traders are quietly building a risk scenario underneath.
XRP price has been stuck within a strong descending trend for the past 8 months, which has kept the volume within a restricted range. The rally has been consistently printing lower highs and lows and is currently capped below the resistance for more than a month, which has prevented the bulls from pushing the price to $2.
Another major reason for the price failing to break the resistance at $1.5 and reach $2 is a large chunk of XRP accumulated above this range. That pain is now visible on the chart as every bounce is sold into. But now, the trend is slowing as prices are no longer collapsing but compressing.
Realized Loss Spikes Signal Capitulation Phase
The Glassnode data shows a sharp rise in realized losses across multiple holder cohorts, particularly in the 1d–1w and 1w–1m age bands, indicating that recent buyers are exiting positions at a loss. Historically, such clusters of realized losses tend to occur near local bottoms, as weaker hands exit and stronger hands absorb supply.
At the same time, the presence of losses across older cohorts (3m–12m) suggests that even mid-term holders—those who accumulated during the rally phase—are now capitulating. This aligns with the earlier insight that a large portion of XRP supply is underwater, reinforcing the idea that the market has already gone through a significant pain cycle. The data also suggests that, at the current price range, only 43.4% of the XRP supply is in profit, the lowest since July 2024.
This type of behaviour usually results in a volatility expansion, not the continuation of a choppy phase.
XRP Price Compressing at a Key Support
The XRP weekly chart is now entering a critical phase where price structure, momentum, and positioning are converging. Currently, XRP is consolidating between $1.27 support and the $1.35–$1.40 range, with a deeper support sitting at $1.12. This marks the area where buyers are beginning to step in after months of selling pressure.
The MACD remains in bearish territory, with both lines still below zero, while heading for a bullish crossover. This suggests that the momentum could flip in favour of bulls at any time from now, as the downside momentum is slowly fading. Moreover, the selling volume has also declined, compared to the initial breakdown, while the candles are tightening, indicating a volatility compression. Therefore, the XRP price may be primed for a transition but not an immediate reversal.
Key Levels That Define the Next Move
This entire structure now revolves around a few critical levels:
$1.27 → Immediate support (decision level)
$1.12 → Final support before deeper breakdown
$1.80 → Major resistance/trend invalidation level
As long as XRP trades below $1.80, the broader structure remains bearish. But holding above $1.27 keeps the market in a compression phase, where a breakout in either direction becomes increasingly likely.
The Bottom Line: What’s Next for XRP Price?
XRP price is now trading at a critical turning point after a prolonged downtrend, with price compressing near the $1.27 support zone while bearish momentum continues to fade. Although the broader structure remains weak below $1.80, the current range suggests seller exhaustion and a potential setup for volatility expansion. A sustained hold above support could drive a recovery toward $1.80, but losing $1.27 would likely accelerate downside toward $1.12, making this a decisive zone for the next major move.
Bitcoin investors hoping for a quick recovery may need to be patient. That is the message from Katie Stockton, founder and managing partner of Fairlead Strategies, who appeared on CNBC’s Squawk Box this week.
Bitcoin Is Boring Right Now and That Is the Point
Stockton’s Bitcoin read was measured but clear. She sees the current price action as a prolonged basing phase with support sitting in the $58,000 to $59,000 range, and she expects multiple retests of that level before any sustained move higher becomes possible.
“It’s a cyclical downtrend and that’s the dominant feature on the chart right now,” she said. “I think we can assume there are going to be retests of support, maybe more than one.”
For crypto investors watching for a bottom signal, Stockton said the charts are not there yet. There are no oversold upturns, no breadth extremes and no sentiment readings that would typically confirm a durable low. Her advice was: do not chase brief relief rallies and wait for the weight of evidence before adding exposure aggressively.
At the time of writing, Bitcoin is trading near $70,000 and is up by more than 3% in the last 24 hours.
Why the Macro Picture Matters for Crypto
Bitcoin does not move in isolation and Stockton’s broader market outlook adds important context for crypto traders.
The S&P 500 recovery last week, which clawed back roughly 4% from recent lows, does not look sustainable in her view. For risk assets including crypto, a continued equity correction and widening credit spreads create an unfavourable backdrop. Stockton added that even a ceasefire in the Strait of Hormuz may not be enough to fully reverse the damage already building in financial markets.
“I think it needs to be more than just reopening the Strait to fix the market at this point.”
The U.S. Treasury has appointed BNY Mellon as the financial agent and Robinhood as the technology partner for Trump Accounts, a tax-advantaged investment program for children under 18. Eligible children born between 2025 and 2028 receive a $1,000 Treasury seed invested in low-cost U.S. stock index funds, with families allowed to contribute up to $5,000 annually. Scheduled to launch on July 4, 2026, the program already has 4 million accounts and aims to foster long-term wealth creation and expand stock market participation across American households.
The live price of the Polygon coin is $ 0.21819891.
POL price prediction for 2026 suggests potential highs of $0.7548.
Long-term forecasts indicate POL could reach $4.94 by 2030.
Polygon (POL) remains one of the most recognized scaling ecosystems built around Ethereum. Designed to improve transaction speed and reduce fees, the network has grown into a multi-layer infrastructure supporting decentralized finance, gaming platforms, and enterprise blockchain applications.
The transition from MATIC to POL reflects Polygon’s broader ambition to build a multi-chain ecosystem, where the token supports multiple networks within the Polygon architecture. As Ethereum continues expanding its ecosystem, scaling solutions such as Polygon are expected to play a significant role in supporting decentralized applications. At present, POL is trading near $0.1005, reflecting the broader correction seen across Layer-2 tokens.
However, Polygon continues to maintain strong developer activity and partnerships across Web3 sectors, which could support long-term growth. As blockchain adoption expands and demand for scalable networks increases, Polygon’s infrastructure could remain a critical component of the decentralized ecosystem.
As we move through early 2026, Polygon’s price action reflects a market that has been under sustained pressure following its previous cycle highs, gradually forming a prolonged downtrend structure. After repeated rejections near the $0.70–$0.80 region in earlier cycles, MATIC entered a corrective phase, marked by lower highs and weakening momentum throughout 2025. This trend has extended into early 2026, pushing the price toward lower valuation zones.
In recent weeks, however, MATIC has begun to stabilize near the $0.08–$0.10 demand zone, where selling pressure appears to be easing. Price action is now compressing within a narrow range, suggesting that the market is attempting to form a base. Currently, MATIC is trading below a key resistance zone near $0.11–$0.13, which aligns with both horizontal resistance and the broader trend structure. A sustained move above this level would be the first indication of recovery, potentially driving the price toward the $0.15–$0.18 range.
In this context, Polygon in April may reach the $0.15–$0.18 range if resistance is reclaimed, with a possible extension toward $0.20 under stronger momentum. However, if the resistance continues to hold, MATIC may remain range-bound. A breakdown below the $0.08 level could push the price toward the $0.06 zone, delaying recovery.
Coinpedia’s Polygon Price Prediction 2026
The broader outlook for Polygon in 2026 suggests a market attempting to transition from a prolonged correction into a potential recovery phase, but confirmation remains limited. Following its strong performance in previous cycles, MATIC has undergone a significant drawdown, forming a descending structure that has persisted into 2026. This indicates that while the long-term narrative remains intact, price has yet to reflect renewed demand.
At present, the coin is attempting to establish a base near lower demand zones, where downside pressure is gradually stabilizing. This phase is often associated with accumulation, but requires confirmation through breakout above key resistance levels. Looking ahead, the primary resistance lies at $0.50, followed by stronger barriers near $0.7400 and $0.7550. These levels will determine whether MATIC can shift its broader structure.
Polygon’s continued focus on zkEVM scaling solutions, enterprise partnerships, and Layer-2 adoption could act as key catalysts. Any acceleration in ecosystem activity or capital inflows may support a recovery in valuation. If these developments align with technical breakout, MATIC could gradually move toward the $0.75–$0.88 range over time.
However, until resistance levels are reclaimed, the asset remains in a recovery phase rather than a confirmed uptrend. Failure to hold the $0.48 support could extend consolidation and delay upside.
POL On-Chain Analysis
The on-chain landscape for POL is flashing a major recovery signal as the 30-day moving average of Daily Active Addresses (DAA) shows a clear and sustained upward trend in early 2026.
This metric serves as the vital heartbeat of the ecosystem, indicating that organic utility and user engagement are returning to the network at a steady, reliable pace. Unlike temporary spikes that often signal speculative noise, a rising 30-day average suggests a strengthening network effect and a growing demand for blockspace. For investors, this return of on-chain activity is a fundamental precursor to price appreciation, as it confirms that the ecosystem is not only retaining its base but actively expanding its reach.
Complementing this surge in network activity is a powerful development in supply distribution, specifically within the “whale” and institutional cohorts. Addresses holding between 100,000 and 10 million POL have seen significant growth, signaling a phase of high-conviction accumulation by “smart money.”
This specific bracket often represents mid-to-large-scale investors who lead market cycles by absorbing supply during consolidation phases. This strategic positioning by larger entities reduces sell-side pressure and creates a robust fundamental floor for the asset.
When rising active addresses align with such aggressive whale accumulation, it speaks a definitively bullish language for the POL trajectory, suggesting that the most influential market participants are preparing for a major expansion in value.
Polygon Price Prediction 2026 – 2030
Year
Potential Low ($)
Potential Average ($
Potential High ($)
2026
0.18870
0.47179
$0.7548
2027
0.30194
0.75488
1.20782
2028
0.48311
1.20782
1.93252
2029
0.77297
1.93252
3.09205
2030
1.23676
3.09205
4.94729
Polygon (MATIC) Price Prediction 2026
Anticipating further expansion, MATIC’s potential high for 2026 is projected to be $0.75488, while the potential low is estimated at $0.18870, resulting in an average price of $0.47179.
Polygon Price Prediction 2027
POL crypto can make a potential high of $1.20782 in 2027, with a potential low of $0.30194, leading to an average price of $0.75488.
Polygon Crypto Price Forecast 2028
As the POL price progresses, the potential high price for 2028 is projected to be $1.93252, with a potential low of $0.48311, resulting in an average price of $1.20782.
MATIC Coin Price Projection 2029
Polygon coin price potential high for 2029 could be $3.09205, while a potential low of $0.77297, with an average price of $1.93252.
Polygon Price Prediction 2030
With an established position in the market, POL’s potential high for 2030 is projected to be $4.94729. On the flip side, a potential low of $1.23676 will result in an average price of $3.09205.
The long-term projection assumes Polygon sustains relevance in enterprise blockchain use cases, with growth moderating over time as the asset matures.
Year
Potential Low ($)
Potential Average ($)
Potential High ($)
2031
2.50
4.00
6.00
2032
3.00
5.00
7.20
2033
4.20
6.50
8.50
2040
14.20
24.30
35.00
2050
28.20
35.50
50.00
Polygon (POL) Price Prediction: Market Analysis?
Year
2026
2027
2030
Changelly
$ 0.50
$1.50
$2.90
CoinCodex
$0.26
$$1.75
$3.80
WalletInvestor
$0.36
$$1.88
$2.08
Never Miss a Beat in the Crypto World!
Stay ahead with breaking news, expert analysis, and real-time updates on the latest trends in Bitcoin, altcoins, DeFi, NFTs, and more.
FAQs
Is Polygon (POL) a good long-term investment?
Polygon is considered a strong long-term project due to its Ethereum scaling role, active development, and growing ecosystem, but it still carries market risk.
What is the Polygon (MATIC) price prediction for 2026?
Polygon could reach up to $0.7548 in 2026, depending on market conditions and continued network growth.
How much could Polygon be worth by 2030?
Forecasts suggest POL could reach around $4.94 by 2030 if adoption grows and Polygon strengthens its role in scaling Ethereum.
What could Polygon be worth by 2040?
Long-term projections vary, but sustained adoption and strong ecosystem growth could push POL significantly higher over time.
How high can the Polygon price Go By 2050?
By 2050, POL’s price will depend on global blockchain adoption, but strong infrastructure use could support substantial long-term value.
The moment XRP was classified as a digital commodity, something shifted in the conversation around it. Not just legally, but structurally.
“Hallelujah,” was how one analyst put it on air. “Finally we got some definition. Now that we have the definition, we can move to the next step.”
That next step, according to macro expert Dr. Jim Willie and his co-discussants, is tokenisation at a scale most people are not yet thinking about.
The DTCC Connection
The numbers being cited are not small. The Depository Trust and Clearing Corporation, which sits at the centre of global securities settlement, holds patents referencing XRP for settlement purposes. The DTCC is also said to have a close working relationship with affiliates of Citadel Securities, which made a $500 million investment in Ripple in November.
The DTCC processes what analysts described as a quadrillion dollars in transactions, a number so large it genuinely resists comprehension. The argument is: if Ripple and XRP capture even 1% of that flow, the implications for price are profound.
“The only way it will work with minimum friction is if the XRP price is over $500,” he said. “The higher the price, the more liquid the asset. The easier things move on the rails.”
Dollar Distrust Is the Real Story
The backdrop, according to Dr. Willie, is a global financial system under visible and accelerating strain. The US government is adding roughly a trillion dollars in debt every hundred days. Military spending has crossed $1.5 trillion. Total obligations, when social security, pensions and off-balance-sheet liabilities are included, may exceed $100 trillion.
That level of debt is quietly reshaping behaviour between trading nations.
“They don’t want the dollar in the room when they’re moving money around,” one speaker noted, pointing to the growing preference among BRICS nations and bilateral trade partners for settlement rails that bypass Washington entirely.
Dr. Willie went further, describing the current conflict in Iran as a smokescreen designed to distract from a deeper structural transition already underway. The real story, in his view, is the accelerating shift from a debt-based monetary system toward one anchored in gold, blockchain technology and select digital assets.
XRP in this framing is not simply a crypto token. It is a neutral settlement bridge between counterparties who no longer share a trusted currency.
Regulation as the Starting Gun
Dr. Willie’s core argument is that regulatory clarity around digital commodities is not bureaucratic housekeeping. It is a signal that governments have stopped resisting the transition and started directing it.
“Regulation signals that institutions are about ready to migrate from legacy rails into the future architecture,” he said. “The governments are no longer resisting the transformation. They are shaping it. All of this is being built for institutional deployment at scale.”
Traditional finance, in his view, is not being reformed. It is being replaced. XRP, alongside a handful of other digital commodities, sits at the centre of what replaces it.
Binance’s effort to rebuild its compliance operation after a $4.3 billion US guilty plea is under renewed pressure as several staff overseeing financial‑crime monitoring and sanctions checks leave and Chief Compliance Officer Noah Perlman weighs his own departure, according to…
Korean super app Toss is weighing a custom Layer 1 or Layer 2 blockchain and native token to power its “Money 3.0” stablecoin push as Seoul finalizes a strict digital asset law. South Korean payment and banking giant Toss is…
Buyers are attempting to push Bitcoin above the $70,000 level, but some analysts believe the upside may be limited and a drop below the $60,000 support is likely.
Strategy resumed Bitcoin purchases, acquiring 4,871 BTC for $329.9 million, while reporting a $14.46 billion unrealized loss and expanding its holdings.
A darknet threat actor is selling new fraud kit to trick KYC identity verification systems on financial platforms via AI-generated deepfakes and real-time voice altering.
Marc Andreessen says AI job loss fears are “all fake” and predicts a “massive jobs boom,” as fresh US data show increasing long-term unemployment and tech companies citing AI while cutting positions.
Chainlink price is quietly sitting at a pressure point and if you’ve been around crypto long enough, you know that’s usually when things get interesting. Not loud. Not flashy. Just… tense.
Between March 23 and April 5, the network pushed out 18 new integrations across 9 services and 22 different chains. That’s not hype that’s steady infrastructure expansion that its been doing for several months now. And yet, LINK price hasn’t exploded.
Growing integrations signal deeper ecosystem expansion
Beginning from its demand then its been high and its utility isn’t slowing down is clearly evident from several metrics. If anything, it’s accelerating. Those 18 integrations aren’t just numbers they reflect Chainlink embedding itself deeper into the plumbing of crypto.
Chainlink Adoption Update
Recently, there were 18 integrations of the Chainlink standard across 9 services and 22 different chains.
Meanwhile, the Chainlink Reserve is quietly stacking. As of April 2, it has accumulated 2.93 million LINK, funded through a mix of on-chain and off-chain revenue streams. That’s not retail speculation that’s systematic accumulation.
And then there’s the ETF angle. No outflows. None. Only inflows so far. That’s about as clean a signal as you get in a market that loves mixed messages.
But still we look at LINK price that hasn’t broken out, yet. Why? Because markets don’t move on fundamentals alone. They move on positioning.
Chainlink price stuck between leverage heavy zones
Zoom into the liquidation heatmap and things get clearer. There’s heavy leverage stacked at $8 support and $10 resistance. That’s your battlefield.
Break below $8? You’re likely looking at a cascade toward $6 as long positions unwind. Flip $10? That’s where things get violent in a good way with a potential short squeeze pushing price toward $12 and even $14.
And right now? It’s stuck in between. Waiting. This kind of setup isn’t random. It’s engineered by market participants loading up on leverage, creating pockets of liquidity that price eventually hunts.
Bullish bias builds but risks remain real
Similarly, the daily chart also leans slightly bullish. Not overwhelmingly but enough to suggest buyers aren’t done yet. But markets don’t care about “slight.” They care about conviction.
If $8 holds, it reinforces demand and sets the stage for a breakout attempt above $10. If it cracks, the entire structure shifts, and suddenly everyone starts talking about downside targets again. So yeah, the setup matches how derivatives liquidation map showed. At this time it is clean but it’s also fragile.
Algorand just posted its best weekly performance in months. ALGO is up more than 47% over the past seven days, hitting an 11-week high of $0.126 on Monday before settling at $0.1232 at the time of writing – up 6.8% on the day and carrying a market cap nudging $1.09 billion.
Three things happened in the same window.
Google Named Algorand the Solution to the QC Problem
When Google’s Quantum AI team published its now-viral research paper on the threats quantum computing poses to major blockchains, most of the coverage focused on Bitcoin and Ethereum. That framing missed the more important detail.
Algorand was cited 32 times in the paper – more than any blockchain except Bitcoin and Ethereum. The difference: those two were referenced as vulnerabilities. Algorand was referenced as a solution, specifically for its post-quantum security and Falcon signature technology.
What makes that significant is that Algorand has been running Falcon in production since 2022. And the co-inventor of the cryptographic framework Falcon is built on is Algorand’s own Chief Scientific Officer.
Revolut is one of Europe’s largest fintech platforms and one of the few consumer finance apps with genuine mainstream penetration outside the crypto-native audience. Native staking built directly into the app means ALGO is now one of the few assets an ordinary Revolut user can stake without leaving the platform.
That’s distribution at a scale most blockchain projects spend years trying to achieve.
The SEC Cleared a Major Institutional Barrier
The third piece often gets overlooked. The SEC and CFTC jointly classified ALGO as a digital commodity. Algorand Foundation CEO Stacy Warden addressed this directly in a Bloomberg interview, calling it “bedrock regulatory clarity.”
The practical impact is specific: staking is now classified as an administrative act rather than an investment contract. That removes the legal ambiguity that had kept institutional players cautious about engaging with ALGO.
The market has responded. Open interest in ALGO futures jumped from $30 million to $75 million in a single week. The long/short ratio moved above 1, suggesting most derivatives traders are leaning bullish.
Analysts point to $0.20 as the near-term target, aligning with the 50% Fibonacci retracement level. A longer-term analyst target of $0.50 has also circulated, contingent on sustained institutional demand.
The broader market is watching whether this momentum holds.
BlackRock has filed with the SEC to launch the iShares Nasdaq-100 ETF, ticker IQQ, designed to track the 100 largest non-financial companies listed on Nasdaq, dominated by tech leaders. The move directly challenges Invesco’s QQQ and QQQM, which together manage nearly $446 billion in assets. Analysts predict BlackRock could ignite a fee war, with costs potentially dropping to 0.12 percent. The launch aims to enhance liquidity and reduce investor costs in the $13.7 trillion U.S. ETF market while leveraging the Nasdaq-100’s long-term outperformance over the S&P 500.
Crypto lobbyists, banks, and the White House are circling a fragile compromise on stablecoin yields that could finally unstick the Clarity Act and set the rules for “digital dollar” rewards in the U.S. The long‑running clash between U.S. crypto firms…
Resolv Labs burns 36.7m hacked USR after a key compromise let an attacker mint 80m unbacked tokens and dump $24.5m in ETH, leaving a $34m hole in the protocol. Resolv Labs has destroyed 36.73 million USR stablecoins previously controlled by…
Investors eye presales as capital shifts to early-stage projects like DOGEBALL, targeting high-growth potential. Waking up to a sea of green candles is the dream of every trader, but the real “overnight” successes are actually authored months in advance during…
Zcash price has rallied over 20% in the past month, surpassing the $250 mark. Is the token set for higher gains as it has confirmed a bullish setup, while adoption for its shielded transactions continues to expand across the ecosystem?…
Tom Lee’s Bitmine Immersion bought 71,252 Ethereum, increasing total holdings to 4,803,334 ETH, roughly 3.98 percent of the circulating supply. The firm’s combined crypto and cash portfolio is valued at $11.4 billion, including $8.64 billion in ETH, $864 million in cash, and other assets. Of its Ethereum, 3,334,637 ETH worth $7.1 billion is staked, highlighting a strategy that blends long-term accumulation with active network participation to earn yield and strengthen influence in the Ethereum ecosystem.
The OCC’s final rule went live on April 1, expanding what national trust banks can do to include digital asset custody, and Ripple’s conditionally approved charter now has a live framework to operate under. Crypto is not coming. It already sits inside the banking system, and the regulators writing the rules know it.
The XRP price prediction matters for holders who see XRP stuck at $1.29 during this pullback. But look at the bigger picture. The US gave Bitcoin a legal framework, launched crypto ETFs, classified XRP as a commodity, and now lets Ripple run a federally regulated trust bank.
Washington wants crypto woven into the financial system. Pepeto raised $8.68 million with a working exchange, and getting in now means planting your flag before crypto stops being a market and becomes the backbone of global finance.
XRP Price Prediction Gets Context as OCC Rule Activates Ripple’s Federal Trust Bank
The OCC’s final rule took effect on April 1, expanding national trust bank scope to cover digital asset custody alongside traditional fiduciary services, according to Yahoo Finance. Ripple’s conditionally approved charter now has the operational framework it needed to move forward.
The XRP Ledger hit a record 4.49 million daily transactions this week while active addresses topped 200,000 and total wallets crossed 7.7 million, all-time highs for the 13-year-old network, per CoinMarketCap.
The XRP price prediction gains from this federal backing because every ODL transaction uses XRP as the bridge asset, but the exchange still at presale pricing and set to process volume when trillions flow on chain is where the real return sits before listing.
The Final Entry Before Crypto Becomes the Banking System
Pepeto
Markets pay the people who have better data and move on it first. Pepeto closes that gap for good because the working exchange hands every holder the same answers that big players used to keep behind closed doors, and the tools already run live.
The platform tracks whale wallet moves, flags shifts in momentum, and catches risky contracts before your money gets close. The contract scanner spots hidden drains and dangerous permissions, PepetoSwap clears every swap at zero cost, and the cross-chain bridge moves tokens between ETH, BNB, and Solana without fees. You unlock everything by holding the token.
The XRP price prediction shows XRP grinding back over months, but the presale-priced exchange token with a confirmed Binance listing is where the gap between effort and return closes completely. More than $8.68 million raised at $0.0000001862 during extreme fear, with 188% APY staking compounding positions while stages fill. SolidProof reviewed the full codebase, and the person who took the original Pepe token to $11 billion on a 420 trillion supply designed this exchange alongside a former Binance executive.
In every market cycle, the wallets that changed their owners’ lives were the ones that spotted a working project at ground-level pricing and refused to wait, and Pepeto at $0.0000001862 is that decision right now. Once the Binance listing opens, this presale price stops existing, and the open market takes over.
XRP Forecast: Where Does XRP Go From $1.29?
XRP trades at $1.29 on April 5 below its 200-day moving average of $1.88, according to CoinMarketCap.
The XRP price prediction for 2026 targets $2.80 per Standard Chartered under moderate conditions, roughly a 2x from here. Ripple’s RLUSD hit $1.56 billion in market cap, and the CLARITY Act goes to Senate markup after April 13. If it passes, Standard Chartered’s target jumps to $8.
XRP ETFs pulled over $1 billion in inflows since their November launch, but weekly flows have thinned. The XRP price prediction confirms XRP is built for the stablecoin era, but 2x over months is not the 100x the presale delivers from one listing.
Conclusion
The XRP price prediction for 2026 keeps improving, but the honest math shows that XRP’s early days ended long ago. From $1.29, even the best targets offer a fraction of what presale entries deliver. The real opportunity in 2026 belongs to the projects still at ground-level pricing with products already running.
No other project this year puts the Pepe cofounder’s track record, live exchange tools, and meme coin energy together at presale pricing. The Pepeto official website is where this window stays open, and getting in before the listing is how you capture real returns this year instead of sitting on the sideline while the XRP price prediction plays out at a crawl.
Hyperliquid price is gaining traction with the broader crypto market rally, rising nearly 4% today while holding firm after a breakout retest. HYPE price is consolidating just below the $45 resistance zone, with no clear rejection, suggesting buyers are absorbing supply and maintaining control.
But can HYPE price break above $45 and push toward a new higher high toward $60? Read our HYPE price prediction below.
Bullish Positioning Strengthens As On-chain and Derivatives Align
Market positioning around HYPE is strengthening as both derivatives and on-chain metrics begin to align in favor of continuation. The long/short ratio remains elevated near 1.47, indicating that long positions are dominating and traders are increasingly positioning for upside. This shift typically reflects growing directional confidence rather than short-term speculation.
Beyond derivatives, on-chain data reinforces the strength of the setup. Hyperliquid L1 continues to hold $1.65 billion in Total Value Locked (TVL), signaling sustained capital presence within the ecosystem. At the same time, perpetual futures volume has surged to $5.19 billion over the past 24 hours, highlighting strong participation and liquidity depth.
Network activity also remains stable, with DEX volume around $93.7 million and application revenue exceeding $1 million, suggesting that underlying usage is holding steady despite recent consolidation. This convergence between capital inflows, active trading participation, and bullish positioning points toward a structurally supported move, rather than a fragile rally.
HYPE Price Prediction: Is a Rally to $60 Next?
Hyperliquid price continues to maintain a constructive bullish structure following its breakout retest, with no signs of weakness emerging in the current range. The $35–$37 zone is acting as immediate support, where price has consistently found demand. On the upside, the $45 level remains the primary resistance, marking the boundary for the next expansion phase.
HYPE price action is now compressing beneath this resistance, forming a tightening range that reflects building pressure rather than distribution. Importantly, repeated tests of this zone have failed to produce strong downside reactions, indicating that sell-side liquidity is gradually being absorbed. If price manages to secure a decisive breakout above $45, the structure opens the path toward $48–$60, followed by an extended move into the $55–$60 range.
Conversely, a breakdown below $30 would invalidate the immediate bullish setup and expose $25 as the next support level. However, current price behavior continues to favor continuation over rejection.
Final Outlook
HYPE is now entering a phase where both market structure and participation metrics are aligned toward a potential expansion move. The token has successfully held its retest, while liquidity, trading activity, and positioning continue to support the current range. This type of setup typically precedes directional continuation rather than prolonged consolidation. If $45 is reclaimed with confirmation, HYPE token is likely to transition into a higher high structure, reinforcing the current move as a continuation phase within a broader uptrend.
TrueFi (TRU) price is up by more than 157%, reaching $0.01112 from the lows of $0.0042 with a mammoth increase in the volume of nearly 8400%. This explosive move appears primarily driven by a massive, coordinated liquidity surge, as no specific catalyst was visible in the provided data. The token is one of the top performers in the crypto market, with the market cap reaching close to $17 million.
The move comes after months of decline, low liquidity, and weak participation, raising a key question for the traders: Is this the start of a trend reversal or just a short-term liquidity-driven spike?
Why is TrueFi (TRU) Price Rising Today?
TrueFi (TRU) price is rising sharply, driven by a surge in trading activity and a breakout from a prolonged downtrend. The token has gained over 90% in a single session, with trading volume jumping more than 2,000% to over $40 million, highlighting a sudden influx of liquidity. With a relatively small market cap of around $15–20 million, even moderate capital inflows can trigger outsized price movements, especially when combined with technical breakout signals.
Trading volume spiked 2,000%+ to ~$40M–$160M, indicating strong participation
Market cap remains low (~$15M–$20M), amplifying volatility
Breakout above descending channel resistance near $0.005–$0.006 triggered buying
Short-term targets now seen around $0.012–$0.015, driven by momentum expansion
This move is being driven by liquidity and momentum, and its sustainability will depend entirely on whether volume and participation continue to hold.
TRU Price Breaks Out After Prolonged Downtrend
TrueFi (TRU) price has recorded a sharp breakout, surging nearly 90% in a single session after months of sustained downside pressure. The move comes after an extended consolidation phase within a descending channel, where price remained suppressed under key moving averages. This sudden expansion in price and volume signals a potential shift in short-term momentum, attracting trader attention across the market.
The chart shows TRU trading inside a well-defined descending channel for several months, consistently forming lower highs and lower lows. This structure reflects a prolonged bearish trend, reinforced by price staying below major moving averages, including the 100- and 200-day levels, which continue to slope downward.
The recent breakout above the channel resistance marks the first structural change in this trend. Price has moved sharply from the $0.005–$0.006 range to above $0.010, supported by a significant spike in volume. This indicates strong participation rather than a low-liquidity move.
Momentum indicators are also shifting:
MACD turning positive → bearish momentum fading
Volume expansion → confirms strength behind the move
Price reclaiming short-term moving averages → early sign of recovery
However, the broader trend remains cautious, as TRU is still trading below higher timeframe resistance zones and long-term moving averages. This suggests the move is currently a short-term momentum breakout rather than a confirmed trend reversal.
Wrapping it Up- Key Levels to Watch
TRU’s breakout has shifted short-term momentum, but sustainability now depends on holding above the breakout zone. Immediate support lies at $0.008–$0.009, while a loss of this level could drag the price back toward $0.006–$0.0055. On the upside, if momentum sustains, the TrueFi price could target $0.012, followed by a key resistance near $0.014–$0.015, where previous supply is likely to re-enter.
Cronos coin price is expected to go as high as $0.3000 to $0.3500 in 2026.
CRO crypto may cross the $1 mark, with a potential high of $1.3190 by 2029.
Cronos (CRO) serves as the backbone of the Cronos Chain, a high-performance, open-source ecosystem engineered by Crypto.com. Designed to bridge the gap between traditional finance and Web3, CRO acts as a versatile utility token that facilitates instantaneous, low-cost global transactions while powering a vast suite of DeFi applications, perpetuals, and fiat-integrated markets.
Driven by institutional-grade infrastructure and a rapidly expanding global footprint, CRO’s market performance increasingly reflects a surge in investor confidence and real-world utility. As the network matures into 2026, its role in the next generation of digital asset exchange becomes even more pivotal.
In this analysis, we leverage advanced technical indicators and historical performance models to forecast the trajectory of Cronos. Whether you are a long-term holder or a strategic investor, this guide provides essential price projections for 2026 and through to 2035, helping you determine if CRO/USD is the missing piece for your portfolio.
Currently, the Cronos price is experiencing a period of consolidation on the daily chart, hovering around the key horizontal line at approximately $0.0777, which marks an important multi-year demand range (indicated in green). This phase indicates a decrease in momentum, and if this trend continues, we could observe its persistence into March.
On a more optimistic note, should the price successfully break above $0.1000, we can anticipate a robust move towards the 200-day EMA band, potentially reaching around $0.1200 by April. However, if bearish factors come into play, we might see the price retreat to the lower end of the current demand range, possibly down to around $0.0600.
Recent Updates & Network News
On February 5, 2026, Cronos announced the development of a unified trading platform offering tokenized stocks, commodities, and prediction markets. This expansion is supported by a strategic integration with Fireblocks, providing the secure, institutional-grade custody infrastructure necessary for market makers to trade at scale.
Following this, a post on February 28 announced the Cronos v1.7 Network Upgrade is scheduled for March 10 at 07:00 GMT. This technical maintenance will involve approximately 30 minutes of downtime to align with recent SDK updates and implement RPC performance improvements to ensure long-term chain stability.
CRO Price Prediction for 2026
The weekly chart for CRO/USD reveals a persistent long-term structure defined by a well-established accumulation zone. Since late 2023, Cronos has consistently found a floor within the $0.0500 to $0.1000 demand area. This “buy zone” has historically triggered significant rallies, notably in late 2024 and mid-2025, where the price peaked at $0.3900.
As of early 2026, CRO has returned to this familiar base, setting the stage for its next major move.
The current weekly price action suggests a period of base-building. We are seeing a repeat of the historical pattern where CRO enters a deep consolidation phase before a vertical expansion.
Supply Zone: The primary target for a breakout lies between $0.3000 and $0.3500.
The Pivot Point: Simply hitting the supply zone isn’t enough; for a true trend reversal, CRO must flip this resistance into support to reclaim its 2022 highs.
Moreover, While the price remains flat, the underlying “engine” of the market (indicators) is starting to show signs of exhaustion from the bears:
In MACD for instance we are currently approaching a weekly bullish cross. Historically, this cross has served as the starting gun for intensified consolidation that eventually leads to a breakout at later stage.
CMF is the most encouraging sign. The CMF has bounced sharply from a low of -0.32. This move toward the zero line suggests that selling pressure is fading and capital is starting to stabilize within the ecosystem.
RSI & AO, Both indicate that the “cooling off” period is still in effect. This lack of a clear direction in RSI confirms we are in a neutral accumulation phase, which is often known as the quiet before the storm.
What Makes CRO Interesting in 2026?
In 2026, Cronos (CRO) stands out as a unique bridge between high-finance and retail utility. The landscape shifted dramatically in late august 2025 when Trump Media Group announced a $6.42 billion CRO Digital Asset Treasury strategy, signaling a massive institutional endorsement of the token’s scarcity.
Beyond the headlines, Cronos remains a technical powerhouse with zero downtime over four years. It currently supports 150M+ users via the Crypto.com ecosystem and powers payments for 10M+ merchants. While the broader market has cooled in Q1, Cronos maintains a healthy 100,000 daily transactions, proving its resilience. This blend of “battle-tested” infrastructure and “institutional-grade” liquidity makes it a critical pillar of the 2026 digital economy.
Cronos (CRO) Price Prediction for 2027-2035
Year
Minimum Price ($)
Maximum Price ($)
Average Trading Price ($)
2027
0.1690
0.3490
0.2490
2028
0.3570
0.6990
0.5090
2029
0.7100
1.3190
0.9890
2030
1.3490
2.4010
1.8210
2031
2.4200
4.1990
3.2350
2032
4.2210
7.1000
5.5290
2033
7.1090
11.5050
9.1650
2034
11.5910
18.4510
14.7650
2035
18.4290
28.7110
23.1990
Cronos Token Price Prediction for 2027
By 2027 Cronos token price is expected to trade between $0.1690 and $0.3490. The average expected trading cost is $0.2490.
CRO Price Prediction for 2028
In 2028, CRO price is expected to trade between $0.3570 and $0.6990. The average expected trading cost is $0.5090.
Cronos (CRO) Crypto Price Prediction for 2029
Experts expect Cronos crypto to trade between $0.7100 and $1.3190 in 2029. The average expected trading cost is $0.9890.
CRO Price Prediction for 2030
Based on technical CRO price analysis it is expected to trade between $1.3490 and $2.4010 in 2030. The average expected trading cost is $1.8210.
CRO/USD Price Prediction for 2031
Based on technical analysis by experts, in 2031 CRO/USD is expected to trade between $2.4200 and $4.1990. The average expected trading cost is $3.2350.
Cronos Price Prediction for 2032
Following 2031, in 2032, Cronos price is expected to trade between $4.2210 and $7.1000. The average expected trading cost is $5.5290.
CRO Token Price Prediction for 2033
In 2033, CRO token price is expected to trade between $7.1090 and $11.5050, with an average expected trading cost of $9.1650.Price Prediction for 2034
CRO Crypto Price Prediction for 2034
Based on technical analysis by cryptocurrency experts, in 2034 CRO crypto is expected to trade between $11.5910 and $18.4510. The average expected trading cost is $14.7650.
CRO Price Prediction for 2035
According to technical analysis by top specialists, the CRO price is projected to range from $18.4290 to $28.7110 by 2035. The anticipated average trading price is $23.1990.
Never Miss a Beat in the Crypto World!
Stay ahead with breaking news, expert analysis, and real-time updates on the latest trends in Bitcoin, altcoins, DeFi, NFTs, and more.
FAQs
What is the Cronos (CRO) price prediction for 2026?
CRO is expected to trade within the $0.05–$0.35 range in 2026, with a breakout above $0.30 needed to confirm a bullish reversal.
Can Cronos (CRO) reach $1 by 2030?
Based on long-term projections, CRO could trade between $1.34 and $2.40 by 2030 if adoption and momentum continue.
Is Cronos a good long-term investment through 2035?
Long-term forecasts suggest gradual growth toward higher ranges by 2035, but returns depend on adoption and market cycles.
What could drive CRO price growth in 2026?
Institutional integration, network upgrades, rising utility, and a confirmed bullish MACD cross could support upside momentum.
Michael Saylor’s firm, Strategy, added 4,871 #Bitcoin to its portfolio between April 1 and April 5, spending approximately $329.9 million at an average price of $67,718 per BTC. This brings the company’s total holdings to 766,970 BTC, acquired for about $58.02 billion at an average cost of $75,644 per coin. The move underscores Strategy’s long-term accumulation plan, reflecting continued confidence in Bitcoin as a store of value amid market volatility and institutional adoption trends.
Tomorrow, Tokyo becomes extremely important for Ripple and XRP going forward.
XRP Tokyo 2026 takes place on April 7 at Happo-en – a 400-year-old Japanese garden – bringing together 3,000+ attendees, 20+ speakers, and the senior leadership of Ripple for Asia’s largest conference dedicated exclusively to XRP and the XRP Ledger.
Why Tokyo, Why Now?
Japan is not a peripheral crypto market. It is one of the most regulated and institutionally developed crypto ecosystems on the planet, and XRP sits near the top of it. The JVCEA Green List – Japan’s FSA-recognised framework for institutional-grade crypto assets – currently shows XRP handled by 20 member exchanges, making it the third most widely adopted asset in Japan’s regulated ecosystem behind only BTC and ETH.
Japan’s tokenized real-world asset market is already managing $2.8 billion in institutional platforms, with projections pointing toward $6-7 billion by year end.
XRP Tokyo is where that infrastructure conversation happens at scale.
Ripple is the event’s title sponsor and is sending senior leadership including Christina Chan, Tatsuya Kohrogi, and Markus Infanger. J. Ayo Akinyele, Head of Engineering at RippleX, is also confirmed to speak.
The institutional weight extends beyond Ripple. Takuya Sugiyama, Vice President of SBI Ripple Asia, is on the agenda alongside SungMo Park from a16z Crypto, Tatsuya Yamada from Rakuten Wallet, and representatives from Evernorth, Securitize Japan, and the University of Tokyo.
This is a convergence of builders, capital, and policy.
What XRP Holders Are Watching
On-chain data adds another layer to the timing. XRP whale accumulation just hit a 10-month high, with large holders taking in more than 11 million XRP per day according to CryptoQuant. XRP is currently trading at $1.35, up nearly 4% on the day.
The agenda centres on institutional adoption, RWA tokenization on the XRPL, and DeFi – the three areas where Japan’s regulatory clarity gives XRP a structural advantage over most competing networks.
The CLARITY Act markup is also expected in late April in the US. What gets said in Tokyo tomorrow will land in a market that is actively repricing what institutional XRP adoption actually looks like.
The event runs from 5F to 6F at Happo-en, with an XRP Tokyo Stage, exhibition floor, and VIP after party. It is part of the broader TEAMZ Web3/AI Summit running April 6-8.
Never Miss a Beat in the Crypto World!
Stay ahead with breaking news, expert analysis, and real-time updates on the latest trends in Bitcoin, altcoins, DeFi, NFTs, and more.
FAQs
What is XRP Tokyo 2026?
XRP Tokyo 2026 is Asia’s largest conference dedicated exclusively to XRP and the XRP Ledger, hosted by XRPL Japan. It brings together institutional players, developers, and builders to discuss XRP’s expanding role in RWA tokenization, DeFi, and global payments.
When and where is XRP Tokyo 2026?
April 7, 2026 at Happo-en, 5th and 6th floors, Tokyo, Japan. The event is part of the broader TEAMZ Web3/AI Summit running April 6-8 at the same venue.
Who are the speakers of XRP Tokyo 2026?
Confirmed speakers include Christina Chan, Tatsuya Kohrogi, and Markus Infanger from Ripple, J. Ayo Akinyele (Head of Engineering, RippleX), Takuya Sugiyama (VP, SBI Ripple Asia), SungMo Park (a16z Crypto), and Tatsuya Yamada (Rakuten Wallet), among 20+ total confirmed speakers.
How can I attend XRP Tokyo 2026?
Tickets are available through the official event website at xrp-tokyo.io. The event is open to the public and expected to draw 3,000+ attendees from across the XRP and broader Web3 ecosystem.
What is the JVCEA Green List?
The JVCEA Green List is Japan’s FSA-recognised framework maintained by the Japan Virtual and Crypto Assets Exchange Association that identifies crypto assets meeting strict criteria for institutional adoption. XRP is currently handled by 20 member exchanges on the list, placing it third in Japan’s regulated ecosystem, behind only BTC and ETH.
Will XRP Tokyo 2026 Boost XRP Adoption?
The groundwork in Japan is already laid – 20 JVCEA member exchanges, $2.8 billion in tokenized assets, and institutional players already in the room. What happens on the conference floor tomorrow could accelerate what is already moving.
Artificial Superintelligence Alliance’s price could hit a maximum trading price of $1 in 2026
With a potential surge, the FET price may record a high of $12.45 by 2030.
As artificial intelligence continues to dominate global headlines, blockchain-based AI infrastructure projects are once again attracting investor attention.
Among them, the Artificial Superintelligence Alliance (ASI) stands out as a strategic merger of major AI-focused blockchain entities.
Founded through the collaboration of Fetch.ai, SingularityNET, and later CUDOS, the alliance aims to create the largest open-source, decentralized ecosystem focused on Artificial General Intelligence (AGI).
The FET token, originally native to Fetch.ai and now central to the ASI ecosystem, serves as the utility, governance, and settlement layer across AI services.
So let’s dive straight into CoinPedia’s Artificial Superintelligence Alliance (FET) price prediction for 2026, 2027, and 2030.
Artificial Superintelligence Alliance (FET) Price Targets For April 2026
The Artificial Superintelligence Alliance (ASI) is expanding its AI agent marketplace, making it easier for users and applications to access various AI services.
If ASI successfully integrates its offerings, it will be able to host AI models on its network, facilitate communication and collaboration among AI agents, and enable users to pay for AI services directly on the blockchain. Additionally, ASI is working to establish partnerships with businesses interested in utilizing AI.
As more people begin to use AI on the network and the demand for computing power increases, this could drive up activity and potentially push the FET price towards $0.32 by April 2026. The price already reached $0.25 in mid-March, now approaching the 200-day EMA band. It has also found support in the green box, which aligns with a multi-year demand zone. If bearish pressure increases, the price could re-enter this support zone; however, if it continues on its upward trajectory, testing $0.32 could be within reach or even higher.
Unlike many AI tokens driven by hype, the Artificial Superintelligence Alliance (FET) is building a foundation in decentralized compute and autonomous agents. This shift from speculation to real-world utility suggests that FET’s value will increasingly mirror actual network usage. As companies adopt these decentralized services, the organic demand for the token could provide a structural floor for long-term growth.
Technically, FET’s 2026 outlook remains tied to key market cycles. A potential low of $0.0582 serves as a deep support zone during “risk-off” periods. However, as the ecosystem matures, an average price of $0.0913 is expected as it maintains a steady trend. In a bullish breakout scenario, FET could surge toward $0.3013, driven by high-volume demand for decentralized AI infrastructure.
FET Price Prediction 2026 – 2030
Year
Potential Low ($)
Potential Average ($)
Potential High ($)
2026
$0.0921
$0.340
$0.950
2027
$0.173
$0.820
$2.14
2028
$0.468
$1.938
$5.53
2029
$1.40
$4.30
$8.05
2030
$2.126
$6.78
$12.45
FET Price Prediction 2027
Growing wider adoption of autonomous AI agents in supply chains, logistics, and digital services could push FET near $2.14
FET Price Forecast 2028
By 2028, if decentralized AGI frameworks mature and institutional AI infrastructure adopts ASI tooling, FET may approach $5.53.
FET Coin Price Prediction 2029
In 2029, AGI research networks integrate token-based compute markets, and valuation expansion could drive FET toward $8.
What will Fetch AI be worth in 2030?
In a strong AI-dominant economy where decentralized compute markets compete with centralized cloud providers, FET could test $12.45
As per CoinPedia’s FET Price Prediction, the exponential growth observable in the field of artificial technologies will boost the value of AI tokens in the crypto world
If the alliance successfully aligns AI compute markets, decentralized agents, and open-source model hosting under one economic framework, FET could gradually reclaim the $0.950 range in 2026.
Year
Potential Low ($)
Potential Average ($)
Potential High ($)
2026
$0.0921
$0.340
$0.950
Never Miss a Beat in the Crypto World!
Stay ahead with breaking news, expert analysis, and real-time updates on the latest trends in Bitcoin, altcoins, DeFi, NFTs, and more.
FAQs
What is Artificial Superintelligence Alliance (FET)?
Artificial Superintelligence Alliance (FET) is a merged AI-blockchain ecosystem uniting Fetch.ai, SingularityNET, and CUDOS to power decentralized AI services.
What is the Artificial Superintelligence Alliance (FET) price prediction for 2026?
FET could trade between $0.09 and $0.95 in 2026, depending on AI adoption, network growth, and overall crypto market momentum.
What could FET be worth by 2030?
If decentralized AI scales globally, FET may test $12 by 2030, though long-term growth depends on real-world usage and regulation.
What Is the FET Price Prediction for 2040 and How High Can It Go?
By 2040, FET could trade between $25 and $40 if decentralized AI and AGI adoption expand globally with strong ecosystem growth.
What is the price prediction for FET in 2050?
By 2050, FET may exceed $60 in a mature AI economy, assuming sustained adoption, real utility, and stable crypto regulations.
Is FET a good long-term AI crypto investment?
FET offers exposure to decentralized AI infrastructure. Its long-term value relies on adoption, partnerships, and sustainable ecosystem growth.
On-chain perpetual futures trading on decentralized exchanges has seen a steady five-month decline, dropping from $1.36 trillion in October 2025 to $699 billion in March 2026. Daily volumes touched $8.4 billion on April 4, the lowest level since July 2025, signaling reduced market activity. Trading is increasingly concentrated, with Hyperliquid alone contributing about 34% of the past 30-day volume. The trend indicates a slowdown in overall participation, with liquidity and market influence consolidating among a few dominant players.
The mysterious creator of Bitcoin, Satoshi Nakamoto, has not been seen or heard from in over a decade and has now turned 51. Now, the focus is not on his return, but on the rising risk from quantum computers.
And the 1.1 million BTC he left behind, worth nearly $76 billion, may now be at risk. Experts say most Bitcoin holders are safe for now, but Satoshi’s untouched 1.1M BTC is not; here’s why.
Why is your Bitcoin safe?
Quantum computers could break Bitcoin’s current security in just nine minutes, while Bitcoin’s average block time is ten minutes. But this mainly matters when a user sends a transaction. Once a public key is visible, a strong quantum computer could try to find the private key quickly.
However, developers have a solution ready. A new quantum-safe system can be added to Bitcoin so that old addresses can move coins without exposing their keys.
Using methods like zero-knowledge proofs, ownership is proven without revealing the public key. Proposals like BIP 360 would create a new address type, removing the public key from the blockchain and protecting new coins from quantum attacks.
That’s why most Bitcoin is safe, except for Satoshi’s untouched coins.
$76B in Satoshi’s Bitcoin Faces Quantum Threat
Satoshi’s Bitcoin has never been moved in over 15 years, and that is the main problem. The “zero-knowledge migration” fix only works if a wallet makes a transaction, but Satoshi’s wallet hasn’t moved and likely never will.
There is no way to protect coins in a wallet that stays inactive, and no one knows if Satoshi is alive, gone, or just waiting.
Today, his coins are worth about $76 billion, making him stand in the top 25 of the world’s billionaires list.
But Didn’t Satoshi Already Send Bitcoin?
Some users point to the first-ever Bitcoin transaction, when Satoshi sent 10 BTC to Hal Finney in January 2009. If Satoshi moved coins once, why can’t the remaining BTC be secured?
The reason is simple, is that the 10 BTC came from one address, and the rest of the 1.1M BTC is spread across thousands of addresses. Each address has its own private key. Thus, moving one doesn’t give access to the others.
That’s why most of Satoshi’s Bitcoin remains locked and can’t be moved or updated without the owner’s action.
Options Left: Burn It or Leave It?
The community now faces two Options.
Option 1: Freeze or burn the coins
This would prevent a future quantum attacker from claiming them. This would take his coins without permission, showing that anyone’s Bitcoin could be controlled if enough people agree.
“Your keys, your coins” would no longer be fully true.
Option 2: Leave the coins untouched
If quantum computers become powerful enough, whoever derives the private key could claim roughly $70 billion worth of BTC.
Three veteran gemologists have launched a new gemstone testing facility, Swiss International Gemlab, introducing a proprietary artificial intelligence system to support grading accuracy and consistency. Willy Bieri, Lawrence Hahn, and Matthias Alessandri founded the lab, which will operate from Lucerne,…
Investors shift from spot trading to automated income strategies as platforms like NOW DeFi gain attention. Still obsessively checking charts, praying for XRP or BTC to pump? While ordinary retail investors are paralyzed by market volatility and holding idle bags,…
After months of stalemate, the crypto market news today shifted on April 3 when reports surfaced that banks and the crypto industry are closing in on a final compromise for the CLARITY Act, with the Senate Banking Committee targeting an April markup, according to Invezz.
Polymarket now prices the CLARITY Act passing in 2026 at 68%, and JP Morgan analysts say a summer signing could send digital assets surging in H2.
The crypto market news today matters because this is the moment that decides the next two years. Goldman says 71% of institutional managers plan to grow their crypto allocations, and the projects launching into this window of clarity will absorb that capital first.
CLARITY Act Breakthrough Shapes the Crypto Market News Today After Months of Deadlock
The CLARITY Act stalled in the Senate over stablecoin yield disputes for nine months, but fresh reports from Invezz on April 3 say negotiations are now at the finish line, with Senator Lummis stating the yield issue is 99% resolved.
Goldman reports 71% of institutional managers plan to grow crypto allocations while only 7% of portfolios are currently committed, per The Block.
Regulatory clarity is the top catalyst in the crypto market news today, and the presale launching into the most favorable environment for new projects in crypto history will absorb that institutional wave.
The Entry That Launches Into the Best Regulatory Window in Crypto History
When the CLARITY Act clears, and Goldman says 71% of managers want in, the next flood of capital is not a question of timing but volume. Pepeto launches into that wave with the Binance listing confirmed. Conviction runs deep with $8.68 million raised while the Fear Index sat at 12, and analysts project 100x to 300x because the working products justify it.
The verified exchange could become one of the biggest listing events this cycle. The crypto market news today shows why the contract scanner that reads every token before your money moves, PepetoSwap that processes trades at zero fees, and the cross-chain bridge that transfers tokens across Ethereum, BNB Chain, and Solana for free all matter now.
Over $8.68 million raised at $0.0000001862 with 188% APY staking growing positions while stages fill. SolidProof audited every contract, and the Pepe cofounder who built the original to $7 billion on 420 trillion supply created this exchange with a former Binance executive.
The CLARITY Act opened the door and the capital is coming. Pepeto at presale pricing is where the wallets that moved first are positioned. The entries that turned modest capital into generational wealth in every past cycle shared one trait: they were locked during fear into projects with real infrastructure and a confirmed listing, and Pepeto’s Binance listing will seal this presale shut along with every multiple it carries.
Ethereum
ETH trades at $2,057 on April 4 per CoinMarketCap, up slightly with RSI near 50 and moving averages mixed.
To extend any rally, ETH must retake $2,300, which opens a path to $2,700. Failing here risks a test of $1,800 support. ETH benefits from CLARITY Act classification, but at its market cap, percentage gains remain modest compared to a presale with 100x from one listing.
Monero
XMR trades at $318 on April 4 with uneven movement even as the crypto market news today turns positive.
The $300 zone holds short-term support and $340 to $350 is resistance. Breaking through opens $400, roughly a 25% move. XMR is strong for privacy holders, but those returns are a fraction of what a presale targeting 100x offers.
Crypto Market News Today Confirms the Answer Is Already Here
The crypto market news today is clear: both retail and institutional capital are building positions while the CLARITY Act opens the widest regulatory door in crypto history. While ETH and XMR still offer solid entries, the verified exchange provides far stronger return potential with the Binance listing approaching and 100x to 300x anticipation building as the presale fills during fear.
Your search led you to the right answer: Pepeto. The Pepeto official website is where acting now puts you alongside the wallets that moved first, backed by a live exchange and a listing that converts presale pricing into the returns latecomers will pay full price for.
The Pepe price has been stuck within a strong descending trend since the start of the year, highlighting the rising bearish influence. The price is rising today by nearly 6%, trading at $0.000003535 with a significant rise in volume by nearly 130%. These figures suggest PEPE is no longer in a clear downtrend—but it’s not breaking out either.
Price has stabilized near key support, holding its base despite consistent bearish positioning in the derivatives market. This kind of divergence doesn’t last but revolves with a sharp move, and the current setup indicates pressure is building beneath the surface.
Will Pepe’s price trigger a breakout and break the bearish trend, as derivative data reveals a positioning imbalance?
Funding Rate: Persistent Bearish Bias
Funding rates have remained consistently negative over the past sessions, indicating that short positions continue to dominate. Traders are actively paying to hold bearish bets, expecting the price to break lower.
However, despite this sustained bearish positioning, PEPE has not followed through to the downside. Price continues to hold its base, suggesting that selling pressure is not translating into actual weakness. This is the first sign of imbalance.
Open Interest: Leverage Reset, Not Expansion
Open interest has declined sharply from its previous highs and is now stabilizing at lower levels. This indicates that excessive leverage has already been flushed out of the system.
In trending moves, rising open interest typically supports continuation. But in this case, the decline suggests the market has entered a reset phase, where positions have been cleared, but new conviction has not yet entered. This reduces the risk of aggressive liquidations but also means the next move will require fresh participation.
Liquidations: Shorts Cleared, But No New Pressure
Earlier in the cycle, the market saw a wave of short liquidations, indicating that bearish traders were forced out during brief upside moves. Since then, liquidation activity has cooled, with no major long-side wipeouts.
This is important as it shows that the downside move has already punished shorts and the market is no longer aggressively liquidating participants. Yet despite this reset, traders continue to lean bearish through funding.
Despite PEPE’s stabilization near its base and avoidance of further breakdown, derivative data indicate that traders continue to position themselves for a downside. This creates a clear mismatch between what the market expects and what the price is actually doing. The derivatives market is misaligned with price, and this kind of divergence usually resolves quickly.
PEPE Price Analysis: Is the Memecoin Heading for a Short Squeeze?
After a prolonged decline, the PEPE price has started to stabilize near the 0.0000029–0.0000032 support zone, forming a base. At the same time, a descending trendline continues to cap upside, keeping the broader structure under pressure. This creates a tightening range, indicating PEPE is no longer in a clean downtrend—it’s transitioning into a compression phase.
The chart suggests a clear falling wedge structure where the price is forming consecutive lower highs, indicating consistent pressure from the top. The support has become more or less stable as the buyers continue to defend the same price range. This combination reflects supply weakening over time.
The RSI is incremental and moving above the middle line, suggesting momentum is shifting from bearish to neutral to bullish. Besides, Accumulation/Distribution is trending sideways to slightly rising, suggesting selling pressure is no longer dominant. Hence, the current trade setup suggests the market is stabalising before the expansion, not trending lower.
What’s Next for the PEPE Price Rally?
PEPE is trading in a compression phase where price structure and derivatives positioning are diverging, with strong support holding at 0.0000029–0.0000032 despite persistent bearish sentiment reflected in negative funding and cooling open interest. This suggests weakening selling pressure and a potential early accumulation setup.
For traders, the key trigger remains a breakout above the 0.0000036 resistance trendline, which could open upside toward 0.0000051 and extend to 0.0000074 if momentum builds, while a breakdown below 0.0000029 would invalidate the setup and expose lower liquidity zones, keeping the current range intact until a decisive move occurs.
Bitcoin has climbed back above the $70,000 mark, hitting its highest level in the past 10 days. The move was quick, with BTC jumping around 3.6% in just 12 hours, triggering over $258 million in liquidations, $233 million of that from short positions.
Can Short Squeeze Fuel the Rally Higher
The breakout was largely fueled by a classic short squeeze. As prices moved higher, bearish positions were forced to close, adding more buying pressure and pushing BTC further up.
“Pretty strong momentum on the markets of #Bitcoin. Volatility is picking up, and I think it’s fireworks during this week as we might be getting to the end stage of the entire situation in the Strait of Hormuz. If #Bitcoin breaks $71K, then markets are in for a test at $80K.”
At the same time, ongoing geopolitical developments around the Strait of Hormuz are adding uncertainty, which could lead to sharper moves this week.
What’s Driving the Rally?
Another major reason behind the rally is easing global tension. Reports of a possible US–Iran ceasefire, along with extended deadlines from Donald Trump, have reduced fear in financial markets.
As sentiment improved, money quickly moved back into risk assets like crypto. Bitcoin, which was recently struggling near $66K due to war concerns, saw a strong bounce as confidence returned. However, platforms like Polymarket show traders are still not fully convinced, keeping the market cautious.
Resistance and Risk of Pullback
Bitcoin is now testing the $69K–$70K zone, which is acting as a key resistance. Analyst Ted Pillows noted that a clean move above this range could push BTC toward $72K–$74K, while rejection may send it back below $66K.
On-chain data from Santiment adds another layer to watch. The profit-to-loss transaction ratio has reached 2.95:1, a level that has often marked short-term tops, suggesting a cooldown could follow.
A Cycle Still Unfinished?
Zooming out, the cycle still looks unusual. Stockmoney Lizards noted that despite a 700% rally over three years, retail participation has remained low.
“This time we barely touched extreme greed… it felt different,” they shared, suggesting Bitcoin may still be in an accumulation phase with more moves left later in the cycle.
XRP price holds near $1.30 despite a 60% drop from 2025 highs
XRPL activity rises with payments hitting 2.7M and AMM pools at 27K
Bollinger Band squeeze points to a strong move ahead
XRP price is stabilizing after months of downside, but the structure suggests this phase may not last long. In a thread shared by analyst GREG, the current setup shows that while the price looks quiet, the underlying structure is far from weak.
After dropping nearly 60% from its $3.65 peak in 2025, XRP is now trading around $1.30–$1.31, holding a tight range without sharp reactions. This steady movement suggests controlled price action, with pressure building as price stays compressed.
On-chain Activity Rises as Usage Expands
Network data is starting to change. XRPL activity is picking up, with daily payments reaching 2.7 million. At the same time, AMM pools have climbed to around 27,000, while tokenized asset value has increased 35% over the past month.
Exchange supply is also dropping, especially on major platforms, showing that holders are choosing to hold rather than sell.
This mix of rising usage and falling supply suggests demand is returning more naturally, not driven by speculation.
Technically Breakout Possible, If?
Technically, XRP is trading within a narrowing range, with support near $1.28 and resistance around $1.52. Price remains near the middle-lower Bollinger Band, while RSI stays neutral.
Bollinger Bands are now at their tightest levels since June 2025, which previously led to a 63% rally. This kind of compression usually comes before a strong move.
At the same time, repeated attempts to move higher have not faced strong rejection, showing selling pressure is easing while buyers remain active.
XRP Price Outlook
XRP is now showing alignment between price structure and rising network activity. Supply is tightening, participation is increasing, and price continues to hold steady below resistance.
A move above $1.52 could push the price higher, while a drop below $1.28 may extend the range. For now, XRP is holding firm, with the setup leaning toward an upside move.
As broader crypto market conditions begin to stabilize, SUI is quietly shifting its structure, showing early signs of strength after an extended period of downside pressure. The asset is holding firm near key support levels while liquidity metrics improve, with trading volume rising sharply and DeFi activity remaining stable. This combination suggests that selling momentum is fading as demand gradually returns, a dynamic often seen during early accumulation phases.
At the same time, price action has started to compress within a defined range, signaling that volatility is declining while positioning builds beneath the surface. In previous cycles, similar setups have preceded directional expansion moves across altcoins. Does this evolving structure position SUI as one of the early leaders in the next altcoin rally? Read our SUI price prediction below.
Volume and TVL Signal Early Accumulation
SUI’s underlying data is beginning to align with its improving price structure. SUI’s trading volume has surged more than 60% in the past 24 hours, reaching approximately $304 million, indicating renewed market participation. This increase is supported by rising derivatives activity, suggesting that both spot and leveraged traders are returning.
At the same time, Total Value Locked (TVL) remains stable near $550–$560 million, reflecting consistent capital presence. This indicates that long-term participants are maintaining exposure rather than exiting positions. Together, these signals point toward a transition from a passive downtrend into a structured accumulation phase.
SUI Price Prediction: SUI Stagnates In Range as Breakout Pressure Builds
SUI price is trading within a defined consolidation range between $0.85 and $0.97, following its prior corrective move. SUI token price continues to hold the $0.85 support zone, with repeated downside attempts being absorbed, indicating sustained buyer interest. On the upside, the $0.97–$1.00 resistance zone remains intact, though weakening with each test. This tightening range reflects ongoing compression, where volatility declines as directional pressure builds. With price now positioned closer to resistance, the setup leans toward a potential upside resolution.
A confirmed breakout above $1.00 would likely open the path toward $1.20–$1.35, with further upside toward $1.50–$1.60 if momentum accelerates. On the downside, a loss of $0.85 would expose $0.75–$0.70 as the next support zone.
SUI May Lead Altcoin Rally If Breakout Confirms
SUI’s structure now reflects a convergence of price stability, rising participation, and steady liquidity conditions. The absence of aggressive selling, combined with improving activity, suggests that the market is transitioning toward recovery rather than continuation of the downtrend. If resistance above $1.00 is reclaimed, SUI is likely to act as an early mover in the next altcoin rally ahead.
Oil is sliding. Bitcoin is climbing. And a trader who has made $116 million in five months just opened a $51 million bet that the gap between them is about to widen significantly.
The position – a short on Brent crude opened today – was flagged by analysts on X. The timing is deliberate. Crude is down 0.52% to $110.96 and Brent has fallen to $108.53 as ceasefire talks between the US and Iran gather momentum. Bitcoin is simultaneously trading at $69,894, up 4.30% on the day.
This is a pattern that has played out multiple times since this war began.
Why Oil Is Bitcoin’s Most Important Signal Right Now
Every significant oil drop during the Iran conflict has been followed by a Bitcoin rally.
The mechanism runs through Fed policy. High oil means inflation stays elevated, rate cuts stay off the table, and liquidity stays tight. When oil falls, that entire chain reverses. Mercado Bitcoin confirmed the broader picture: Bitcoin has historically outperformed both gold and the S&P 500 in the 60 days following major global shocks.
The prediction markets are already moving. Polymarket’s probability of oil hitting $120 by April 30 has dropped from 65% to 47% in a week. Ceasefire odds jumped from 18% to 28% in just 24 hours. Total Iran-related volume on Polymarket has crossed $100 million.
The Dry Powder Building
CryptoTice flagged something equally telling today: stablecoin reserves on Binance just flipped higher.
“This is not panic. This is preparation,” he wrote. “Capital doesn’t move to Binance to sit idle forever. It moves there to become something else. The buyers are loading up quietly. The trigger is getting closer.”
On-chain data from Arkham adds another layer. Large BTC inflows hit Binance hot wallets simultaneously in the minutes before the US market open, with multiple deposits ranging from $1.7 million to $29.9 million arriving in rapid succession.
BREAKING
BINANCE JUST STARTED BUYING BITCOIN RIGHT BEFORE THE U.S. MARKET OPEN!
THEY'RE BUYING MILLIONS EVERY FEW MINUTES, NONSTOP.
Stablecoins building and BTC flowing in at the same time tells a specific story about positioning.
The Signal Is Not Confirmed Yet
This exact setup – oil dipping, ceasefire headlines, Bitcoin lifting – has appeared and reversed multiple times since February 28. Trump’s deadline for Iran expires tomorrow.
The whale has positioned, Polymarket odds are shifting, stablecoins are staging on Binance, and large BTC is flowing in – all in the same window.
Until oil breaks lower and holds, and until a ceasefire moves from 28% odds to confirmed, the signal remains unconfirmed.
In a market that operates 24/7, relying on human judgment for trading is becoming increasingly difficult. This is especially true for highly liquid assets like BTC and ETH, where short-term price fluctuations are often fleeting.
Accu Quant‘s newly launched arbitrage robot is designed based on this reality. Through automated strategies and real-time data analysis, the system can identify potential price differences between different markets and execute trades automatically, eliminating the need for human intervention—it’s completely automated.
What is AI automated trading?
AI cryptocurrency automated trading uses algorithms and data models to replace manual market analysis. It continuously monitors the cryptocurrency market 24 hours a day, accurately identifies trading opportunities, automatically makes long and short trading decisions, and executes buy and sell operations. It is an intelligent trading system that operates around the clock, delivering high efficiency without emotional interference.
Case Study: How to Achieve a Daily Profit of $5,000
An AccuQuant user, after enabling an automated Bitcoin trading strategy, saw the system complete multiple trades throughout the day.
Given the day’s highly volatile market, the strategy achieved a cumulative profit of approximately $5,000 by consistently capturing small fluctuations.
The key was not in a single large profit, but rather in:
High-frequency, small-amount profit accumulation
Strict adherence to strategy discipline
Avoid emotional trading
Continuously participate in market fluctuations
Why Automated Trading is Becoming a Trend
As market complexity increases, trading methods relying solely on human judgment are facing challenges.
The advantages of AI-powered automated trading are gradually becoming apparent:
More efficient: Runs 24/7, no rest required
Faster execution: Responds to market changes in milliseconds
Emotionally neutral: Avoids decision-making biases caused by fear and greed
Reusable strategies: Continuously optimizes models through data
AccuQuant’s Key Advantages:
1️⃣ Sign Up and Receive Rewards, Easily Start Trading
New users receive a $20 reward upon registration and can earn an additional $0.50 daily upon login. Experience automated trading with zero barriers to entry.
2️⃣ No Need to Monitor the Market, the System Works for You 24/7
Say goodbye to staying up all night watching market data. The AI system runs automatically 24/7, avoiding emotional interference and giving you back your time.
3️⃣ Simple and Easy to Use, Even Beginners Can Quickly Get Started
The interface is intuitive and clear, requiring no complicated operations. Whether you’re a beginner or a professional trader, you can easily use it.
4️⃣ Earn Money Through Referrals, Multiple Ways to Reward
Join the affiliate program and earn up to 3% + 1.5% referral rewards, diversifying your income streams.
5️⃣ Transparent Fees, No Hidden Costs
No extra transaction fees or management fees. All fees are clearly visible, making every profit safer.
6️⃣ Multi-currency support, flexible and convenient deposits and withdrawals
Supports deposits and withdrawals of various mainstream cryptocurrencies, including:
BTC, ETH, DOGE, SOL, XRP, USDC, LTC, and USDT (TRC20/ERC20), meeting the needs of different users.
Conclusion
In the volatile cryptocurrency market, where volatility equals opportunity, the key is not predicting prices, but rather how to efficiently participate in the volatility itself.
AccuQuant empowers users to participate more systematically in intraday cryptocurrency market movements through automated and quantitative strategies.
The United States, Iran, and a group of regional mediators are weighing terms for a temporary ceasefire that could extend into a permanent resolution, according to U.S., Israeli, and regional sources familiar with the discussions. An Axios report said prospects…
Quantum computing advances raise concerns over crypto security and volatility for major assets. Amidst continuous breakthroughs in quantum computing, the cryptocurrency market is entering a phase characterized by heightened complexity and uncertainty. Mainstream assets — exemplified by Bitcoin and Ethereum…
China’s regulators are pushing for banks to upgrade the “bank-tax interaction” model in a bid to expand financing for small businesses. According to a policy notice issued by the State Administration of Taxation and the National Financial Regulatory Administration, banks…
Cloud mining is evolving in 2026 with a focus on transparency, short-term contracts, and sustainable infrastructure. In 2026, cloud mining has quietly evolved. It’s no longer about unrealistic promises or “free unlimited Bitcoin.” Instead, the industry is shifting toward: At…
Perp DEX daily volume fell to $8.4 billion on April 4, its first sub-$10 billion level since September and the lowest since July, DefiLlama data shows.
China’s leading tax and financial authorities are urging banks to incorporate blockchain technology to bolster their credit facilities and data transparency.
Bitcoin is trading at $69,230 this morning, up 3.47% in the last 24 hours, after an Axios report confirmed that the US and Iran are in active discussions over a potential 45-day ceasefire, with Pakistan, Egypt, and Turkey serving as mediators. Short sellers absorbed the first hit: $196 million in liquidations in 24 hours, with shorts outnumbering longs nearly 3 to 1.
The move pushes Bitcoin toward the top of the $65,000 to $73,000 war range it has been trapped in for five weeks.
“If Bitcoin breaks $71K, then markets are in for a test at $80K,” he wrote on X.
The reasoning behind it: volatility is picking up, and he believes the Strait of Hormuz situation is approaching its end stage this week. In that scenario, $71K isn’t just a resistance level – it’s the trigger that opens the door to a move that would mark Bitcoin’s first clean breakout since the war began.
That single level is now the market’s most-watched threshold.
Bitcoin Bear Market Bottom: What Traders Are Reading Right Now
“Idle smoking of hopium gives way to rabid clicking of the BUY button chasing the price,” Woo wrote.
His full sequence: price first breaks the cost basis of recent investors, then passive hope gives way to genuine aggressive buying, and that demand surge pushes the cost basis from red to green on-chain. When all three align, the regime has shifted – not just the price.
Whether those conditions are met right now is the open question. One data point that’s hard to ignore: long-term holders now control roughly 80% of Bitcoin’s circulating supply.
Historically, bear market bottoms have coincided with that figure reaching 85%. The market isn’t there yet, but the direction of travel is clear.
Update: Fresh on-chain data posted today supports that direction. CryptoQuant analyst Darkfost confirmed that LTH supply has turned positive again for the first time since November, with roughly 308,000 BTC now being added to long-term holder supply on average.
“Historically, this type of behavioral shift has often preceded positive price developments for Bitcoin,” he noted, while cautioning it is still too early to draw firm conclusions.
The ceasefire is only one piece of a broader picture that several analysts believe the market is underestimating.
If the Iran conflict ends, a new Fed chair cuts rates, the CLARITY Act passes, and TradFi begins injecting capital via stablecoins – all of which are either in motion or actively being discussed – the setup for the second half of 2026 looks structurally different from anything the current price reflects.
ETH/BTC is showing signs of gearing up for its strongest move of the cycle.
The Russell 2000, which tracks small-cap stocks and serves as one of the clearest signals for broader risk appetite, has broken out and retested – exactly the pattern it followed in the previous two cycles before a sustained move higher.
April, by this read, is the final month of corrective price action. May is where things start moving.
The Reason to Stay Cautious
This exact setup has appeared around three times since the war began. Each time, ceasefire signals lifted Bitcoin before the rally faded. Bitcoin’s technical panel currently shows a Strong Buy on Moving Averages and a Strong Sell on the Oscillator simultaneously.
The market is split. Will $71,000 settle the argument? We’ll keep you posted.
Crypto analyst Scott Melker is now looking at altcoins through a more grounded lens, noting that the structure of this cycle is very different from what traders were used to before. While the broader market has seen movement, altcoins are not showing the same kind of expansion phase that defined earlier runs. Instead, the space appears to be holding within a tighter, more selective range.
“I don’t see much hope for most altcoins. That doesn’t mean that select altcoins won’t do exceptionally well and outperform Bitcoin. I think they will. But I don’t think you’re in a world anymore where you can just throw a dart at a chart of altcoins and assume that your thing is going to go 10 or 50 or 100x.”
A Cycle That Never Expanded for Altcoins
Altcoins are not following the usual cycle behavior. In previous runs, once Bitcoin pushed higher, capital rotated into altcoins, triggering a broad expansion phase across the market. That pattern created a strong upside across multiple tokens.
This time, however, the structure looks compressed. Bitcoin reached an early all-time high driven by ETF inflows, but altcoins failed to transition into a full breakout phase. There was no wide altseason, and price action across most tokens remained contained.
As a result, instead of expansion, the altcoin market stayed in a restricted range, showing stability without strong continuation.
Liquidity Conditions Are Changing
Earlier cycles were driven by retail participation, which pushed funds into smaller tokens and supported widespread rallies. Now, that flow is more concentrated.
Capital is moving toward assets with clearer positioning, such as Bitcoin and ETF-linked instruments. Meanwhile, smaller tokens listed on platforms like CoinMarketCap are seeing reduced participation, indicating weaker demand conditions.
At the same time, alternative markets like prediction platforms are drawing attention, which is further limiting capital available for altcoins.
Structure Points to a Selective Phase
Altcoins are no longer moving as a single group. The current setup suggests a more selective environment, where only specific projects with strong fundamentals are likely to see continuation.
Instead of a broad rally, the market now resembles a consolidation phase with isolated breakouts. Projects with clear utility and stronger narratives may still transition into expansion, while others remain range-bound.
Overall, the altcoin space is holding structure, but without the widespread breakout behavior seen in past cycles, pointing toward a more focused and selective phase ahead.
Bitcoin price today surged back to its last week’s high price of $69,509 after reports of a possible 45-day ceasefire between the U.S. and Iran. The recovery also pushed major altcoins up. Ethereum, XRP, Solana, and Dogecoin are all up by 3% to 5%.
Despite this 45-day ceasefire, all eyes are on Trump’s 6-day deadline, which is going to end on 7th April.
U.S.–Iran In 45-Day Ceasefire Talks
Multiple U.S., Israeli, and regional sources indicated that Washington and Tehran are discussing a 45-day ceasefire, which could open the door for a longer-term agreement.
The proposed deal is structured in two stages. The first step is a 45-day pause to allow negotiations. The second step aims for a permanent end to the conflict. Key topics include reopening the Strait of Hormuz, addressing Iran’s uranium stockpile, and discussing compensation for conflict-related losses.
Last week, Trump said the U.S. is in deep negotiations with Iran and expects a deal before the deadline.
Trump warned that failure to reach a deal could trigger U.S. strikes and retaliation targeting Gulf energy facilities.
Trump’s Repeated Deadlines and Delays
Trump has now set a new ultimatum for Iran of 7th April at 8 PM Eastern Time, demanding Tehran reopen the strategic Strait of Hormuz or face potential military action.
This latest deadline continues a pattern of shifting targets. First, Trump gave Iran 48 hours on March 21, then extended it by five days on March 23, pushed it back by ten days on March 26, reset it to 48 hours again on April 4, and most recently postponed it to April 7 at 8 PM ET.
However, experts believe that the chances of reaching a deal before the deadline remain very unlikely.
Bitcoin Price Eying $75K
Following this news, Bitcoin quickly jumped 4%, rising from $66,000 to $69,509. In the past 24 hours, the crypto market saw $246.9 million in liquidations, with nearly $200 million from short positions alone.
Despite this recovery, Bitcoin remains in a broader consolidation range. Crypto trader Jelle noted that Bitcoin is retesting a bearish flag, though the pattern is losing strength.
He highlighted the 200-week EMA as strong support, suggesting Bitcoin could move sideways before a clearer trend emerges..
The charts show Bitcoin recovering from recent lows, forming a short-term upward structure. Meanwhile, key resistance lies between $72,000 and $75,000, where previous breakdown levels remain.
AI crypto trading apps is gaining popularity in 2026 as beginners seek automated ways to earn passive income. As the cryptocurrency market continues to evolve, many beginners are turning to AI crypto trading apps to automate their trading processes and…
Algorand price surged more than 50% over the past week, climbing to $0.126 on Monday and emerging as the top-performing cryptocurrency on the weekly timeframe. According to data from crypto.news, Algorand (ALGO) rallied to an 11-week high of $0.126 on…
North Korean-linked operators have spent years quietly integrating into crypto firms and DeFi teams, raising fresh concerns about insider risk after a string of high-value exploits tied to the country’s cyber apparatus. Security researcher and MetaMask developer Taylor Monahan said…
The crypto market enters April 2026 in extreme fear with the index sitting at 9 out of 100, and the correction has dragged Solana below $80 while Cardano trades at just $0.24. Every crypto price prediction for these large caps points to limited recovery over the coming weeks.
In the background, Pepeto has quietly raised more than $8 million while the pattern forming around this presale looks exactly like what happened before Pepe exploded from its early price. The people who acted on that signal made the biggest returns of their lives.
Solana Drift Exploit and Cardano Drop Shape April Crypto Price Prediction
A $280 million hack targeting the Drift protocol rocked Solana this month according to MEXC News, sending SOL down 13% in a single week.
Circle had a six hour window to freeze stolen funds being moved to Ethereum and chose not to act. Cardano dropped 8% in seven days and now sits 92% below its all time high according to CoinGecko. These events push the outlook for both tokens into careful territory as Q2 begins.
Presale Demand Grows as Market Leaders Trade Near Year Lows This Quarter
Pepeto: The Pattern That Formed Before Pepe Is Forming Again
Pepeto was designed by a team led by an experienced exchange builder, with a former Binance expert handling core development. SolidProof signed off on every contract before the presale opened. These are the same credentials that separated Pepe from the thousands of tokens that launched alongside it and went nowhere.
The zero fee exchange runs across Ethereum, BNB Chain, and Solana, letting tokens move between chains at no cost. An AI scanner checks contracts before a wallet touches them and flags risks in plain language. These tools create constant demand for the Pepeto token because every action on the platform burns through supply the same way early Pepe volume burned through available tokens before the price ran.
The price prediction conversation changes completely at presale level. Analysts project 1000x from the current floor of $0.0000001862, and more than $8 million already sits in the contract with staking at 188% APY. Pepe made early buyers rich because they moved before the crowd saw the pattern.
The same signal is clear right now with Pepeto because the presale keeps filling, the listing is confirmed, and the price has not moved yet. The crowd will confirm it after the exchange opens. The only question is whether a wallet enters at presale pricing or at whatever price millions of new buyers set on day one. Buying at Pepeto at presale pricing and staking through launch is how every crypto success story started for the wallets that got in early.
Solana Crypto Price Prediction: Recovery Targets Stay Low After Exploit
SOL trades at $80.97 according to CoinMarketCap with bearish signals at 80%. The minimum forecast for April sits at $78.66, while the maximum reaches $102.
Even if SOL hits that ceiling, the return from current levels is about 28%. The Alpenglow upgrade planned for 2026 could improve speed, but Solana needs to rebuild trust after the Drift exploit before fresh capital flows back in.
Cardano Price Prediction: ADA Sits 92% Below Its All Time High
ADA trades at $0.24 according to CoinDesk with a market cap near $9 billion. Changelly targets an April range of $0.24 to $0.42, while CoinCodex models a tighter $0.24 to $0.25 band. Even the best case delivers roughly 75% if ADA hits $0.42.
The Cardano Foundation recently moved reserves out of ADA and into Bitcoin and cash, a sign that even the team is hedging.
Conclusion
When a $280 million exploit hits Solana and Cardano trades 92% below its peak, the crypto price prediction for large caps tells a story of capped returns. The wallets that entered Pepe before the crowd confirmed the pattern built generational wealth, and the same setup is forming around Pepeto with a confirmed listing on the way.
Every token locked at 188% APY adds to the position before the exchange opens. One buy at presale pricing is the difference between landing Pepe level returns and watching the listing price leave you behind.
The presale is still open, the listing is confirmed, and every wallet that moves now sits on the return that late buyers will never get. Visit the Pepeto official website and take the entry before millions of new buyers price you out on day one.
What does the crypto price prediction look like for April 2026?
Solana targets $78 to $102, and Cardano targets $0.24 to $0.42, while analysts project Pepeto at 1000x from the presale floor before the listing opens.
Why do presale tokens beat crypto price prediction targets for large caps?
Large caps carry huge market caps that limit percentage growth. The Pepeto official website offers entry at a fraction of a cent where the math starts where big token forecasts end.
Is now a good time to buy crypto based on current predictions?
The correction lowered prices across the board, but presale tokens like Pepeto offer the widest gap between current price and listing price available this cycle.
The Bitcoin price experienced a strong bullish push and closed the weekly trade above $69,000. The volume also increased to some extent, highlighting the rise in trader participation. In the meantime, the token has entered a crucial phase where the next move could largely depend on the macro factors rather than the chart breakouts.
The technicals are in favour of the bulls, while the growing geopolitical developments are inducing enough pressure on the BTC price. Therefore, the crypto markets and Bitcoin may witness massive price action in the next few days.
Macro Tension Builds — Why Bitcoin Is at Risk
Iran, Israel, and the US are currently in a phase of heightened geopolitical tension, even as President Trump pushes for de-escalation. Recent reports suggest that the US and Iran are discussing terms for a potential 45-day ceasefire, which could pave the way for a broader resolution. This comes at a critical time, with oil prices rising sharply and risk assets like stocks and crypto showing signs of pressure.
As a result, analysts believe the next 48 hours could be crucial for global markets, with two clear scenarios emerging. In a de-escalation outcome, a confirmed deal could push oil below $100, ease yields, and trigger a relief rally across equities, potentially allowing Bitcoin to reclaim the $72,000 level.
However, if no agreement is reached and tensions escalate further, oil could surge toward $125, tightening liquidity and weighing heavily on risk assets, including crypto. That said, current signals suggest efforts remain focused on avoiding escalation, keeping markets on edge but cautiously optimistic.
Bitcoin Price Outlook: BTC Awaits Breakout as Macro Catalyst Builds
Bitcoin is not trending—it’s compressing into a key range as markets brace for a potential macro trigger. Price continues to trade around $69K, holding above support but failing to reclaim higher levels, reflecting indecision across risk assets. With geopolitical developments likely to drive short-term sentiment, Bitcoin is now positioned at a critical reaction point where the next move will depend more on external catalysts than internal momentum.
Technically, BTC is trading inside a tight consolidation range between $65.6K and $72K, with a clear descending trendline acting as short-term resistance. Multiple rejections near the $71K–$72K supply zone confirm strong overhead pressure. At the same time, price continues to defend the $65K–$66K demand zone, forming a base. The MACD is flattening near the zero line, signaling a loss of bearish momentum, while CMF remains slightly negative, showing weak capital inflows.
This creates a compression setup. A breakout above $72K opens upside toward $75K–$76K, while a breakdown below $65.6K exposes $62K as the next major support.
Wrapping it Up—What’s to Expect in the Next 48 Hours?
The Iran–US situation serves as a binary catalyst, determining direction based on market reactions to headlines rather than indicators. A de-escalation would shift sentiment back to risk-on, allowing Bitcoin to build on its current structure and attempt a continuation move. An escalation, however, would tighten liquidity and likely trigger a broad risk-off reaction, putting pressure on BTC despite its underlying strength.
At this stage, the setup is clear. This is not about predicting direction; it’s about watching how Bitcoin (BTC) price reacts when the catalyst hits.
XRP is extending gains alongside the broader market, but its structure suggests the move may carry further. XRP coin is up roughly 3% on the day, yet continues to hold a compressed range just below resistance, indicating stability rather than a reactive bounce. If this structure holds, XRP appears positioned for continuation, but does this setup now point to a breakout phase?
On-chain Activity Rebounds As Participation Returns
On-chain data is beginning to turn constructive. Active addresses have recorded a notable spike, pointing to renewed user participation after a period of cooling. This shift typically aligns with early-stage demand returning, rather than late-cycle speculation.
At the same time, metrics such as MVRV have normalized, suggesting that previous profit-taking pressure has largely cleared, reducing the likelihood of aggressive downside moves. The combination of rising activity and reset positioning indicates that XRP is transitioning from consolidation into a more supportive demand environment, reinforcing the ongoing price stability.
XRP Price Analysis: Is a Major Breakout Rally Next?
XRP price continues to trade within a tight consolidation range between $1.28 and $1.62, following its recent recovery move. XRP price is currently holding near the upper boundary, indicating that buyers remain active despite broader market uncertainty. The structure reflects ongoing compression, with volatility declining as price stabilizes just below resistance. This type of behaviour typically signals accumulation within a defined range, where supply is gradually absorbed before a directional move. Repeated attempts to break above the $1.62 resistance zone have not resulted in sharp rejection, suggesting that sell-side liquidity at this level is thinning.
At the same time, downside remains contained, with $1.28 acting as immediate support, followed by a stronger base near $1.15. As price continues to compress within this narrowing range, the setup is approaching resolution. A confirmed breakout above $1.62 would likely trigger an expansion move toward $1.88–$2.22, where the next liquidity cluster is positioned. On the downside, a rejection could extend consolidation, with a move below $1.58 opening the path toward $1.15 again. At this stage, XRP is not showing distribution, it is holding structure beneath resistance, with conditions increasingly favoring an upside resolution.
XRP Price Outlook: Structure and Activity Align for Potential Breakout
XRP is now showing alignment across price structure and on-chain activity, a combination that typically precedes directional moves. The spike in network participation, reduced selling pressure, and sustained compression beneath resistance suggest that the market is building toward expansion rather than continuation of the range.
While confirmation remains dependent on a breakout above $1.62, the overall setup is constructive. If resistance is cleared, XRP is likely to transition into a momentum-driven move, supporting the view that the current structure is not a pause, but preparation for expansion.
Binance has unveiled a major update to its Spot Altcoin Liquidity Enhancement Program, effective April 6, 2026, at 00:00 UTC. The expansion increases the number of eligible trading pairs from 20 to 40, making it easier for traders and liquidity providers to support more altcoin markets. One notable addition is the XAUT/USDT pair, aimed at improving trading depth and activity for tokenized gold and other altcoins on the platform. This move marks a significant effort by a leading exchange to boost spot liquidity.
U.S. military operations linked to tensions with Iran have been executed at a sustained tempo, with indications that Project Maven, the Pentagon’s flagship artificial intelligence programme, has played a central role in accelerating targeting and strike decisions. Originally conceived as…
Rwanda’s central bank has reiterated that cryptocurrency activity tied to the local currency remains prohibited, responding swiftly after crypto exchange Bybit introduced support for the Rwandan franc on its peer-to-peer marketplace. In a statement posted to X on Sunday, the…
Circle has set out a multi-stage plan to harden its upcoming layer-1 network, Arc, against the potential risks posed by quantum computing, outlining changes that will eventually span wallets, validators, and supporting infrastructure. Details shared Thursday indicate that the rollout…
Bitcoin traded above $69,000 at press time on Monday after U.S. President Donald Trump pushed back his deadline for Iran from Monday to Tuesday night, while continuing to warn of possible strikes on critical infrastructure. Trump said the U.S. would…
In an experiment, a chatbot resorted to blackmail after it found an email about replacing it, while in another, it cheated to complete a task with a tight deadline.
Security researcher Taylor Monahan listed at least 40 decentralized finance platforms she claims have been infiltrated by North Korean IT workers at some stage of their lives.
Bitchat launched in July last year and has been used during protests in Madagascar, Uganda, Nepal, Indonesia and Iran as authorities attempted to restrict usage of the internet.
US President Donald Trump threatened Iran could be "living in Hell" if it doesn't open the Strait of Hormuz, though he also told reporters that a deal with Iran is getting close.
Crypto analyst Zach Rector is stepping back from the kind of extreme price targets that have flooded the XRP corner of the internet. Rather than chasing figures like $100 or $1000 that have become common online, he is focusing on a more grounded range of $5 to $10 by 2026. From current levels near $1.30, that would still mean returns of between 300% and 600%.
Historically, the Setup Looks Familiar
His outlook is based on patterns seen in previous cycles. In both 2020 and 2022, XRP dropped below the 200-week moving average, followed by a sharp decline before bouncing back strongly.
Now in 2026, a similar structure is forming again. XRP price has already lost this support level, and he expects one more dip before any major move higher. The range he’s watching is around $1.10 to $1.20, with a possible move below $1 to sweep liquidity before a rebound.
Expect a Dip Before the Rally
Meanwhile, he points to recent bull traps, short rallies followed by quick drops, as signs of ongoing manipulation. On top of that, macro uncertainty and global tensions could add pressure, potentially triggering another broader market sell-off.
For him, that dip is the real opportunity. Instead of buying at current levels, he is preparing to enter at lower prices.
The Cycle Is Not About Hype, But Staying Grounded
The analyst notes that XRP doesn’t need extreme hype to perform well. Even moderate inflows into the crypto market could push prices higher, making a simple recovery move enough to generate strong returns.
“XRP from $1.34 popping up to 5 bucks is 272% ROI. Now obviously, if we go any lower towards a dollar and you scoop up towards a dollar, we’re talking about 300% just on that move to 5 bucks. So this is just measuring from $1.34 where we’re at today.”
He also questions why investors who were comfortable buying XRP at $2 or $3 are now hesitant near $1.
How High Can XRP Go?
Adding to the outlook, EGRAG CRYPTO points to multiple Fib 1.618 targets at $7, $10, and even $31, based on different structural setups across timeframes.
Together, these views suggest that while extreme targets may be unlikely for now, XRP still has solid upside potential if the setup plays out.
The Avalanche price has entered a significant phase since the start of the year. As layer-1 is gaining traction, on-chain activity is climbing, institutional players are steadily increasing, and real-world assets are beginning to take shape within its ecosystem. By most fundamental measures, the network is gaining traction at a time when much of the market remains uncertain.
However, the price presents a starkly contrasting narrative. AVAX price continues to struggle below the $10 mark, showing little urgency despite the visible growth happening on-chain. This gap between rising usage and stagnant price action is not just unusual—it’s where some of the most important setups begin to form.
The question now is simple: is the market failing to recognise Avalanche’s growth, or is something still missing beneath the surface?
Avalanche Usage Is Surging — But Price Isn’t Following
Avalanche activity isn’t fading. It’s holding at elevated levels. As the chart from DeFilama shows, daily active addresses are consistently in the ~6M–6.5M range through early April, with no real drop after the earlier spike. At the same time, daily transactions have climbed from ~2.3M to ~3.5M+, making higher highs over the past few sessions.
That’s the key shift. Addresses are stable at the top end, but transactions are rising. This isn’t users leaving—it’s users doing more. In other words, usage isn’t just high; it’s deepening. That’s a stronger signal than a one-off spike. And yet, despite millions of daily users and rising transaction throughput, AVAX is still stuck below $10.
AVAX Price Analysis: Compression Builds as Avalanche Holds Key Support
Avalanche (AVAX) is showing early signs of a structural shift after months of downside pressure, but price action remains capped below a critical resistance zone. Despite rising on-chain activity and stronger fundamentals, AVAX continues to trade around the $9–$10 range, reflecting a clear disconnect between usage and price. This has led to a tightening structure on the chart, where volatility is compressing, and a decisive move is likely approaching.
Technically, AVAX has formed an ascending channel since February, printing consistent higher lows while facing repeated rejection near the $10–$10.5 zone. This suggests accumulation rather than trend continuation. The RSI is trending upward near 56, holding above the midline, which indicates building momentum. At the same time, Bollinger Bands are tightening, signaling an upcoming volatility expansion.
However, the lack of strong volume on recent moves shows that a breakout is not yet confirmed. If the price breaks above $10.5, the next upside target sits near $12, while a failure to hold the rising structure could push AVAX back toward lower support levels.
Key Levels to Monitor
Resistance: $10 – $10.5 (breakout trigger)
Upside Target: $12
Support: $8.8 – $9 (invalidation level)
The Bottom Line: What’s Next?
The Avalanche price is up by 5.58% to $9.45 in the past 24 hours, with a volume surging by more than130%. AVAX is sitting at a decision point. On-chain activity remains strong, and the structure has shifted into higher lows, but the price is still capped below the $10–$10.5 resistance zone.
As long as this level holds, the move stays incomplete. A confirmed breakout above $10.5 can push AVAX toward $12, with further upside toward $13–$14 if momentum follows. On the downside, failure to hold $9 keeps the range intact, while a break below $8.8 would invalidate the current structure and expose $8.
Circle, the issuer of USDC, has just become the first major stablecoin company to address the threat of quantum computers. It officially released a quantum-resistance roadmap for Arc, its Layer 1 blockchain.
The company warns that by 2030, powerful quantum computers could break current cryptography, putting wallets, transactions, and blockchain data at risk.
Circle’s Arc Targets Post-Quantum Security
Circle is designing Arc as a stablecoin-focused Layer 1 and building quantum protection into the network from the start.
Today, public-key cryptography protects every crypto wallet, including Bitcoin, Ethereum, and USDC. When you send a transaction, your private key creates a digital signature that proves it came from you.
The problem is that quantum computers could eventually reverse these signatures, allowing attackers to access wallets.
Security experts have also warned about “harvest now, decrypt later” attacks. This means attackers can collect encrypted data today and attempt to break it later with more powerful computers.
That’s actually Circle says Arc aims to reduce this long-term risk before the network fully scales.
Four-Phase Quantum-Resistance Plan
Circle’s roadmap for Arc is built in four clear stages, each targeting a different layer of the blockchain:
Phase 1 — Mainnet Launch
The first phase launches with support for post-quantum signatures, allowing users to create quantum-resistant wallets from day one. The system will be optional, letting users migrate at their own pace.
Phase 2 — Private State Protection
After the mainnet, the second phase extends protection to private balances and confidential transactions. Circle plans to add additional encryption layers to strengthen long-term privacy.
Phase 3 — Infrastructure Hardening
The third phase will focus on systems around the blockchain, like cloud services, access control, and data security. Protocols like TLS 1.3 already support post-quantum security, and many big tech providers are quietly upgrading their systems, following the industry shift toward post-quantum security.
Phase 4 — Validator Hardening
The final and most complex phase targets the validators that confirm transactions. Because Arc finalizes blocks in under one second, leaving attackers only about 500 milliseconds to fake a signature.
However, post-quantum signatures require more computing power, so the team will roll out upgrades gradually.
What This Means for Bitcoin, Why Long-Term Holders Should Worry
Bitcoin has no plan for quantum resistance. Since it was built in 2009 using classical cryptography, updating the entire network would be extremely challenging. Migrating all Bitcoin wallets to post-quantum security could take months of nonstop work.
Every Bitcoin address that has sent a transaction has its public key exposed on the blockchain. When quantum computers arrive, whether around 2030 or 2035, these addresses, including Satoshi’s wallets and early miner holdings, could become targets.
In a rare mining win, a solo Bitcoin miner connected to CKPool successfully mined block 943,411, earning the full reward of 3.139 BTC (about $210,000), made up of the block subsidy and fees. Solo mining is extremely competitive and uncommon today because large industrial operations dominate the network and difficulty is high, making individual wins like this almost like hitting a tiny lottery. However, this event shows solo miners can still succeed despite long odds.
XRP holds a strong demand zone at $1.30–$1.40. If support remains intact, the token could shift from consolidation to recovery as broader crypto market momentum builds..
Long-term forecasts suggest XRP could reach $5–$6 by 2026 and potentially $18 by 2030, driven by institutional adoption, Ripple partnerships, and global payment integration
Ripple (XRP) Ripple’s XRP remains one of the most closely watched assets in the crypto market, largely due to its strong positioning in the cross-border payments sector and the continued expansion of Ripple’s financial infrastructure. Over the years, Ripple has focused on building partnerships with banks and payment providers to streamline international settlements through blockchain technology. XRP’s long-term outlook continues to revolve around global payment integration, institutional partnerships, and the adoption of RippleNet and On-Demand Liquidity solutions. These developments could gradually strengthen XRP’s role as a bridge asset for international payments.
XRP price structure around $1.30–$1.40 has emerged as an important demand zone where buyers have shown consistent interest. If this area continues to hold, the market could gradually shift from consolidation to recovery. With the broader crypto market entering another potential expansion phase, XRP remains positioned as one of the major altcoins that could benefit from renewed institutional and retail participation. Now, making this the most ideal time for XRP price prediction 2026-2030 to be in more focus. Read this to know in depth what’s coming next in XRP.
As we move through early 2026, XRP’s price action reflects a market that has been under sustained pressure since its previous cycle highs, forming a clear descending structure over the past few months. After facing repeated rejection near the $2.80–$3.00 region, the asset entered a corrective phase, characterized by a series of lower highs and a well-defined descending channel. This structure remained intact into Q1 2026, consistently pushing the price toward lower support levels.
By February, XRP tested the lower boundary of this channel, finding support near the $1.20–$1.30 demand zone. Since then, price action has begun to stabilize, with volatility compressing as sellers show signs of exhaustion. Currently, XRP is trading just below a descending resistance trendline, placing it at a critical juncture. The immediate hurdle lies at the $1.40–$1.50 zone. A successful breakout above this level could indicate a short-term bottom, potentially driving the price toward $1.80 and then $2.20.
In this context, XRP in April may reach the $1.80–$2.20 range if resistance is reclaimed, with an extended move toward $2.60 possible under stronger momentum. However, if resistance continues to hold, XRP may remain range-bound. A breakdown below the $1.20 support could push the price back toward the $1.00 level, delaying recovery.
CoinPedia’s XRP Price Prediction 2026
The broader price structure for XRP in 2026 suggests a market transitioning out of a corrective phase, but still awaiting confirmation of a sustained trend reversal. Following its rally in previous cycles, XRP peaked near the $3.50 region before entering a prolonged downtrend, defined by a descending resistance structure and consistent lower highs throughout 2025. This trend has carried into early 2026, with price recently stabilizing near the $1.20–$1.30 demand zone as selling pressure begins to ease.
At this stage, the focus shifts toward whether XRP can reclaim key resistance levels and attract renewed demand. The immediate barrier remains at $1.70, followed by stronger resistance at $2.50 and the major supply zone between $2.60–$2.80. Beyond technical structure, regulatory and institutional catalysts are likely to play a decisive role in XRP’s trajectory through 2026.
Developments around U.S. crypto legislation, particularly frameworks such as the CLARITY Act, aimed at defining digital asset classifications, could provide long-awaited regulatory certainty. For XRP, which has been heavily influenced by legal outcomes, clearer classification could significantly improve institutional confidence and unlock broader participation.
At the same time, ongoing expansion of Ripple’s enterprise payment solutions and XRP Ledger (XRPL) integrations in cross-border settlement continues to strengthen its real-world use case. Any acceleration in adoption among financial institutions or payment corridors could act as a direct demand driver. Additionally, increasing discussion around spot crypto ETF expansion beyond Bitcoin and Ethereum introduces a longer-term narrative tailwind. While speculative at this stage, any progress toward broader altcoin ETF inclusion could materially shift liquidity flows toward assets like XRP.
If these catalysts align with a breakout above key resistance levels, XRP could transition into a recovery phase. A sustained move above $2.50 would signal structural improvement, with a breakout above $3.80 opening the path toward the $6.00–$9.50 range over time. However, until both regulatory clarity and technical confirmation materialize, XRP remains in a transitional phase. Failure to hold the $1.20 support could extend consolidation and delay upside momentum.
Recent Catalysts (April 2026)
CLARITY Act progress remains a key trigger, with potential regulatory clarity expected to influence institutional participation.
Ripple’s push into banking and payment integrations is strengthening XRP’s real-world use case.
Ongoing institutional partnerships continue to support XRP’s role in cross-border settlement.
XRP On-Chain Outlook
XRP’s on-chain data is currently pointing toward a cooling market environment, where activity has slowed but structural conditions are quietly improving. Spot trading volume across exchanges has dropped to its lowest level since 2024, reflecting reduced participation and weaker short-term momentum. This decline indicates that the market is no longer driven by aggressive trading, but is instead moving through a low-liquidity consolidation phase. At the same time, liquidity remains concentrated on major platforms like Binance, Upbit, and Coinbase, suggesting that while overall activity has declined, core market interest is still intact.
On the derivatives side, a more significant shift is unfolding. XRP’s leverage and open interest in Binance have dropped sharply, signaling a major reset in speculative positioning. The estimated leverage ratio has fallen substantially from previous highs, while open interest has cooled to much lower levels. This indicates that leveraged traders have largely exited or reduced exposure, removing excess risk from the market.
This combination of declining spot activity and reduced leverage suggests that XRP is transitioning from a highly speculative phase into a cleaner, more stable structure. With the market now less crowded and less prone to liquidation-driven volatility, the current setup reflects a reset phase, where pressure is building more gradually.
Overall, XRP’s on-chain signals point toward a market that is not weakening, but resetting after excess, creating conditions that often precede a more sustainable and directional move once momentum returns.
Ripple (XRP) Price Prediction 2026 – 2030
Year
Potential Low ($)
Potential Average ($
Potential High ($)
2026
3.40
6.50
9.50
2027
7.50
10.00
12.00
2028
8.80
11.50
16.00
2029
14.20
19.00
22.00
2030
18.80
23.00
30.00
Ripple (XRP) Price Prediction 2026
The XRP price range in 2026 is expected to be between $3.40 and $9.50
XRP Price Prediction 2027
Ripple (XRP) price range can be between $7.50 to $12.00 during the year 2027.
XRP Price Forecast 2028
In 2028, Ripple is forecasted to potentially reach a low price of $8.80, an average price of $11.50, and a high price of $16.00.
XRP Price Targets 2029
Thereafter, the XRP price for the year 2029 could range between $14.20 and $22.00.
Ripple (XRP) Price Prediction 2030
Finally, in 2030, the price of XRP is predicted to remain steady and positive. It may trade between $18.80 and $23.00.
Based on historical market sentiment and trend analysis, the following are the possible XRP price targets for longer-term time frames.
Year
Potential Low ($)
Potential Average ($)
Potential High ($)
2031
25.00
29.50
35.25
2032
31.50
36.75
41.25
2033
35.75
42.25
47.75
2040
97.50
135.50
179.00
2050
219.25
331.50
526.00
Market Analysis
Year
2026
2027
2030
Changelly
$3.00
$6.50
$17.76
DigitalCoinPrice
$4.20
$7.50
$18.00
WalletInvestor
$4.80
$7.90
$20.00
Never Miss a Beat in the Crypto World!
Stay ahead with breaking news, expert analysis, and real-time updates on the latest trends in Bitcoin, altcoins, DeFi, NFTs, and more.
FAQs
What is the XRP price prediction for 2026?
XRP could trade between $3 and $6 in 2026 if crypto market momentum strengthens and Ripple expands partnerships with banks using RippleNet and ODL.
How high will XRP go in 2030?
XRP could potentially reach $18–$30 by 2030 if the crypto market enters a strong bull cycle and Ripple expands global payment partnerships.
What is the price prediction for XRP in 2031?
Market projections suggest XRP could trade around $25–$35 in 2031, depending on global crypto adoption and Ripple’s continued growth in payment infrastructure.
How much will 1 XRP be worth in 2040?
If adoption of blockchain payments grows and Ripple strengthens its financial network, XRP could trade between $97 and $179 by 2040.
How much will 1 XRP be worth in 2050?
Long-term projections indicate XRP could reach $219–$526 by 2050 if blockchain payment networks become widely used across global financial systems.
What could drive XRP’s price growth long term?
XRP’s long-term growth may depend on global payment adoption, institutional partnerships, and wider use of Ripple’s blockchain infrastructure.
Is XRP a good investment?
XRP may be a promising investment due to its role in cross-border payments and growing institutional adoption, but price volatility and regulation risks remain.
Morgan Stanley filed its final SEC amendment for a spot Bitcoin ETF on April 1, with Bloomberg analyst James Seyffart expecting the launch within days, according to CryptoTimes. The bitcoin price prediction is improving as the world’s largest wealth manager prepares to offer direct BTC exposure through $MSBT on NYSE Arca, joining BlackRock and Fidelity in a field that pulled $1.32 billion in March inflows alone, per CoinDesk.
At the same time, Pepeto moves closer to its confirmed Binance listing as an Ethereum-based exchange token. Exchange tools and a SolidProof audit have attracted both retail and whale wallets who committed $8.68 million after verifying every detail. A former Binance executive drives the exchange toward launch. For investors hunting the strongest returns this cycle, the exchange presale where 150x lives is where committed capital flows right now.
Bitcoin Price Prediction Gains as Morgan Stanley Joins the Spot ETF Race
Morgan Stanley Investment Management will sponsor the fund while BNY Mellon handles administration and Coinbase Custody secures the Bitcoin in cold storage, according to CryptoTimes. The filing adds another institutional heavyweight to a market that ended four straight months of outflows with $1.32 billion in March inflows.
The bitcoin price prediction firms up as institutional access widens, and the presale entries positioned before that capital flows through will capture the strongest multiples when sentiment shifts.
Bitcoin Price Prediction and the Exchange Presale Where the Listing Delivers What BTC Cannot
Stop wondering which entries have real demand and which will fade after listing. Pepeto built an exchange that works for your capital from day one. PepetoSwap removes all trading fees so your money stops leaking on every swap.
The contract scanner checks tokens before your capital gets near them. The bridge sends tokens across Ethereum, BNB Chain, and Solana at zero cost, so what you send is what lands. Every tool runs inside a single platform, making each meme trade faster and safer than anything else on the market.
The cofounder who grew Pepe to $11 billion with zero products is behind Pepeto, and a former Binance executive on the team drives the exchange toward its confirmed Binance listing. SolidProof completed the audit before a single dollar entered. More than $8.68 million raised because smart wallets verified the fundamentals before committing.
Staking at 188% APY compounds daily for every wallet inside. The presale sits at $0.0000001862 with 420 trillion supply. Pepe hit $11 billion with an identical 420 trillion supply, the same founding team, and nothing built underneath, and reaching that valuation is 150x. The Binance listing compresses the return window into days.
The bitcoin price prediction needs years of institutional growth to reach $200,000. In every cycle before this one, the entries that minted the most millionaires per dollar invested were infrastructure presales locked during fear, and Pepeto’s confirmed Binance listing will permanently shut this window along with the 150x math it carries.
Bitcoin (BTC) Price Prediction
Bitcoin trades at $67,398 according to CoinMarketCap, down 47% from the $126,198 October peak. Morgan Stanley’s ETF filing adds to institutional access alongside BlackRock and Fidelity products that hold over $65 billion combined.
Resistance sits at $72,600 with $75,000 next. The RSI reads 44, sitting in neutral territory with space for upside. Support holds at $65,000, with $62,000 below if that breaks. Even the most bullish recovery math puts $100,000 at roughly 49% from here over months. That is strong for a large cap, but 49% over months does not match what a presale-to-listing event delivers in days.
Bitcoin Price Prediction Points Higher, but Pepeto’s Listing Is Where Wealth Gets Built
The bitcoin price prediction is turning bullish with Morgan Stanley entering the spot ETF field and March ending four months of outflows. But this presale is not dropping another token into the market without purpose. It built tools that shield every wallet from the costs that destroyed retail capital in every prior cycle.
The Pepeto official website is where that entry remains open, and skipping it today could easily become the biggest regret of this cycle.
In the latest crypto news, Bitcoin ETFs logged $171 million in single-day outflows as institutions hedged weekend risks, dragging Bitcoin below $70,000. Yet March net inflows remain $1.36 billion positive, proving institutions are tactically repositioning rather than leaving. Retail traders typically lack the tools to see these shifts coming, and the sui price prediction at $1.05 is not where that gap gets closed.
Pepeto is designed to close this critical information gap with a working exchange that surfaces opportunities before the crowd. Raising more than $8 million and now listed on CoinMarketCap, Pepeto provides the real time tools everyday traders need to stay ahead. The Binance listing is days away. The opportunity to secure presale price is closing fast.
SUI Price Prediction: SUI Consolidates at $0.86 Testing Key $1.05 Resistance
SUI trades near $0.86, down 82% from its $5.35 all time high, and is testing the $1.05 resistance zone that will determine its April direction. According to CoinPedia, the SUI price prediction targets $3 to $5 for 2026 if SUI breaks above $3.50.
Blockchain News reported that SUI remains stuck in a $0.88 to $1.05 trading range with neutral RSI, meaning any breakout could take weeks.
Tokens positioned for the recovery when the turn arrives
Pepeto: If you regret missing the last cycle, this is the second chance you can see clearly
When institutions need to hedge weekend risk, they reposition instantly through prime infrastructure, triggering events like the $171 million in ETF outflows. Retail traders usually find out after they are already on the wrong side. Pepeto just landed on CoinMarketCap, confirming the Binance listing is days away. The exchange platform was built to close that gap with a working exchange that gives you the tools to position before the crowd.
The cross chain bridge moves meme tokens between networks in seconds and the discovery engine surfaces new projects at their earliest price. The platform runs clean and accessible so decisions happen fast when the market moves.
What powers this entry is a SolidProof audit on the contract, a Pepe cofounder who proved meme launches create generational wealth, and a Binance professional executing the listing from the dev team.
The presale sits at $0.000000182 with more than $8 million raised, 420 trillion tokens, an FDV near $78 million, and staking at 188% APY, analysts project 300x to 1000x once Binance volume opens. Last cycle made millionaires out of the wallets that moved first, and Pepeto is that exact same moment with a confirmed listing approaching, and buying at presale price delivers 300x to 1000x when the listing opens while everyone who waits pays whatever price Binance sets.
SUI price prediction: SUI targets $1.05 in April and $3 to $5 by year end from $0.86
SUI trades at $0.86, down 82% from its $5.35 all time high per CoinMarketCap. The SUI forecast from Changelly targets $0.82 average for April with a maximum of $0.86. Longer term, CoinPedia’s bull case targets $5 by year end, roughly a 430% return.
TVL sits at $583 million and the network keeps expanding, but SUI needs the entire market to recover first. Even the bullish SUI forecast delivers returns that take months to materialize while a presale entry with a confirmed Binance listing delivers from the lowest floor in weeks.
Conclusion
The sui price prediction targets 430% at best over months while SUI sits 82% below its high waiting for the market to turn, but last cycle the wallets that made millionaire returns were the ones who did not wait for the turn and instead entered the strongest entries while the fear was still running, and the regret from missing that move is exactly what Pepeto was built to fix because the exchange is live, the SolidProof audit is done, the Pepe cofounder is building, and the Binance listing is confirmed.
Visit the Pepeto official website and enter now because buying at presale price while the SUI forecast keeps you waiting is how the biggest returns in crypto are made, and missing this entry means paying whatever price Binance sets instead of the presale price in front of you right now.
SUI targets $0.82 to $1.05 for April with a bull case of $5 by year end. Pepeto at presale price with a confirmed Binance listing offers returns SUI cannot deliver from its current position.
Why are SUI traders looking at Pepeto?
SUI needs the market to recover for any meaningful move. Visit the Pepeto official website to see the presale with a confirmed listing that delivers returns on its own timeline.
Is SUI or Pepeto the better entry during the correction?
SUI targets 430% over months at best. Pepeto at presale price with a working exchange, Pepe cofounder, and confirmed listing is the second chance last cycle’s regret was waiting for.
Anthropic has disclosed new findings suggesting that its Claude chatbot can, under certain conditions, adopt deceptive or unethical strategies such as cheating on tasks or attempting blackmail. Details published Thursday by the company’s interpretability team outline how an experimental version…
Strategy co-founder Michael Saylor’s latest post suggests the firm may once again resume its weekly Bitcoin purchases after a brief pause. In a Sunday post on X, Saylor shared a StrategyTracker chart alongside the words “Back to Work,” a phrase…
Jack Dorsey developed decentralized messaging app Bitchat has been taken down from Apple’s App Store in China after it violated the country’s internet service regulations. On Sunday, Dorsey confirmed that Bitchat was removed from the App Store in February, according…
April 6 could be one of the more important days in Pi Network’s history. The project has set it as the hard deadline for its Protocol v21.2 upgrade, and this one is not up for debate.
What makes the timing interesting is what just happened before it. Pi Network crossed 526 million KYC checks and hit 18 million verified users through its decentralised validator network, a combination that has brought fresh energy to a community that has had plenty of reasons to be impatient.
“This is not an optional update. It is a security and compatibility hard fork,” the Pi OpenMainnet 2025 account confirmed, describing the upgrade as a step toward unifying the network and building toward something more scalable and lasting.
Mandatory Upgrade, Risk of Disconnection
The upgrade comes with strict conditions.
As the announcement read, “All Mainnet node operators must complete the upgrade… to remain synchronized.” Missing the deadline isn’t an option, as “any nodes that miss this deadline risk immediate disconnection from the Mainnet and exclusion from consensus participation.”
This effectively forces full network alignment, ensuring only updated nodes remain active.
Foundation for DeFi and Web3 Push
Beyond alignment, the upgrade is focused on strengthening the network’s core.
The new version is trying to stabilize performance and prepare Pi for higher transaction volumes. It also sets the groundwork for upcoming features like Pi DEX, on-chain swaps, and DeFi tools, marking a shift toward real utility.
Upcoming Upgrades
However, this is just the beginning of a broader rollout.
Pi Network plans to move to Protocol v22.1 on April 22, improving transaction processing and node interactions. The bigger leap comes on May 18 with Protocol v23.0, expected to introduce full smart contract support and Web3 functionality.
Pi Price Struggles Despite Progress
While development is moving forward, price action remains weak.
Pi is currently trading around $0.17, with daily volume near $13.3 million. The token is down over 94% from its all-time high of $2.98, though it has recovered around 30% from its recent low.
Technically, the chart shows a bearish setup.
A head-and-shoulders pattern has formed, and the price has dropped below key EMAs, signaling continued downside. The next key level sits near $0.128.
Crypto markets are in the green on Monday, with Bitcoin, Ethereum and XRP all posting modest gains after weeks of subdued price action.
Bitcoin is trading around $69,137, up 3% in 24 hours. Ethereum has climbed to $2,131, gaining nearly 4%. XRP is holding near $1.33, up roughly 2% on the day.
Iran Talks Are Moving Markets
The immediate catalyst appears to be geopolitical. Reports emerged Monday that the United States and Iran are discussing a 45-day ceasefire deal that could lead to a permanent end to hostilities. Regional mediators reportedly proposed a two-phase plan as a Tuesday deadline approaches.
This is the fifth deadline in 17 days. Previous extensions on March 21, March 23, March 26 and April 4 each produced brief market recoveries before tensions returned. Experts are watching closely to see whether this round produces a genuine resolution or another postponement.
President Trump added further colour on Monday, explaining that he ordered strikes on Iranian bridges after Iran asked for a five-day delay in direct negotiations. “I felt they were not being serious,” he said.
Institutions Are Still Buying
Institutional demand has remained steady. Spot Bitcoin ETFs absorbed approximately 50,000 BTC in March, the highest monthly pace since October 2025. Strategy added another 44,000 BTC over the same period.
Morgan Stanley also received regulatory approval for a spot Bitcoin ETF this week, connecting roughly 16,000 financial advisors managing a combined $6.2 trillion in assets.
A Busy Week Ahead
Markets have several events to navigate before the week is out, including Fed meeting minutes on Wednesday, February PCE inflation data on Thursday and continued developments on the Iran situation. Any one of these could shift sentiment quickly in either direction.
United States President Donald Trump has again warned that the U.S. army will target Iran’s infrastructure next if Tehran doesn’t comply by April 7. After attacking Iran’s Ghadir Bridge last week, the U.S. president on Sunday said that further attacks…
The Rwanda central bank's warning came after Bybit added the Rwandan franc to its list of assets that its peer-to-peer platform can use to trade for crypto.
Solana price is down by 1.5%, reaching $78.82, plunging below $80, and underperforming the broader market, primarily driven by continued fallout from a major ecosystem hack. The $285 million exploit on Solana-based Drift Protocol on April 01, 2026, remains a dominant overhang. The hack by the North-Korean hackers dropped Drift’s TVL from $530 million to $230 million, creating a liquidity crisis and community distrust. This has also pressured the SOL price as investors reassess ecosystem security risks.
As a result, the SOL price is showing a structural weakness in times when the broader market attempts to stabilise. Hence, the increase in the sell-side pressure is shaping a cautious outlook for the short term.
Price Structure Shows Weakness Near Key Support
Solana is trading at a critical support zone near $75–$78, with the current price hovering around $78–$80, showing clear signs of weakness after failing to sustain its recovery above $85. While the broader market is attempting to stabilise, SOL continues to lag, indicating a lack of strong buyer conviction at higher levels. This is not a trend continuation — it’s a pressure phase at support, where holding or losing this range will define the next move.
On the daily chart, SOL has broken down from an ascending channel and is now consolidating just above the $77 support, which aligns with key short-term levels. Repeated retests of this zone without a strong bounce suggest weakening demand. RSI is below neutral, reflecting fading momentum, while the structure shows lower highs forming after rejection near $90–$95 resistance.
If this support fails, the next downside targets open toward $73, followed by a deeper move toward $67–$70. On the upside, SOL needs to reclaim $85–$86 to regain short-term strength, with $93–$95 acting as the next key resistance zone.
TVL Decline Signals Capital Outflow
TVL reflects actual capital deployed within the ecosystem. A decline of this scale indicates reduced DeFi activity, lower user participation and Capital rotating out of the network. The DeFiLlama data shows a consistent drop in Solana’s TVL, falling from above $9 billion to nearly $5.5–$6 billion in recent weeks.
This indicates the funds withdrawn may be converted to stablecoins or other assets and rotated into other ecosystems. As TVL is a confidence metric, new capital hesitates when it drops, and existing holders reduce exposure. Therefore, the current decline, combined with the price sitting near support, indicates weak demand while the supply is rising.
What’s Next—Will SOL Price Secure Range Above $85 This Week?
The Solana price is not just reacting to price pressure; it is reflecting a broader slowdown in capital participation. The drop in TVL indicates that liquidity and user activity within the ecosystem are declining, which reduces the strength of any potential recovery.
At the same time, the price is holding near a key support zone around $75–$78, but without strong follow-through. This combination — weak structure on the chart and declining TVL — suggests that the current phase is more of a fragile hold than a strong base.
In practical terms, this limits upside in the near term. Even if SOL attempts a bounce, the absence of capital inflow makes it difficult to sustain higher levels. For a meaningful move higher, the price needs to stabilise while TVL either stops declining or begins to recover. Until that shift happens, the current setup points toward slow, reactive price action with downside risk remaining elevated rather than a clear trend reversal.
The crypto market is entering a decisive week, with Bitcoin price holding above $67,000, Ethereum price stabilising near $2,000, and XRP price hovering around the $1.3 zone. While the total market cap remains above $2.3 trillion, the price action lacks conviction. It could appear as if the rally is heading towards a breakout, but in a wider perspective, it resembles a pause.
Bitcoin is struggling below key resistance, Ethereum is compressing without momentum, and XRP continues to move sideways after failing to sustain its recent push. With liquidity thinning and volatility contracting, the next move is likely to be expansion-driven, making this week critical for short-term trend direction.
Bitcoin (BTC) Price Analysis For the Coming Week
Bitcoin is entering a compression phase just below key resistance, with price holding around the $66,000–$67,000 zone. Despite maintaining support above $65,000, the price action lacks expansion, signaling hesitation rather than strength. This is not a trend continuation yet — it’s a decision zone, where the next move will likely be driven by liquidity and breakout confirmation.
Bitcoin is trading below a descending trendline in the short term while repeatedly testing a horizontal resistance near $67,000. The structure shows lower highs compressing into resistance, a classic squeeze setup. CMF remains slightly positive, indicating mild inflows, but RSI is neutral, reflecting weak momentum. Volume is also declining, suggesting reduced participation. This combination points to an impending breakout or breakdown, with price coiling tightly between $65,600 support and $67,000 resistance.
Ethereum (ETH) Price Analysis This Week
Ethereum is trading within a tightening range near the $2,000–$2,050 zone, showing signs of compression rather than trend strength. While the price continues to hold above the $2,000 psychological level, the lack of expansion suggests fading momentum. This is not a breakout phase — it’s a coiling structure, where volatility is contracting ahead of a directional move.
On the 4-hour chart, ETH is forming a symmetrical triangle, with lower highs and higher lows converging toward the apex. Price is currently sitting near the decision point, with resistance descending from the $2,400 region and support gradually rising from below $1,900. Bollinger Bands are tightening, RSI remains neutral, and volume is declining — all classic signs of volatility compression. This setup typically leads to a sharp move, with $2,050 acting as immediate resistance and $2,000 as key support.
XRP Price Analysis For This Week
XRP continues to trade under pressure, holding near the $1.28–$1.30 zone after a steady decline from recent highs. Unlike Bitcoin and Ethereum, which are showing signs of compression, XRP remains in a controlled downtrend, with the price failing to reclaim higher levels. This is not consolidation but a weak continuation, where buyers are unable to shift momentum.
XRP is moving within a descending channel, consistently forming lower highs and lower lows. Price is currently attempting to stabilise near a short-term support zone around $1.27, but repeated rejections from the $1.34–$1.36 resistance area confirm strong overhead supply. RSI remains below neutral, and volume shows no meaningful expansion, indicating weak demand. Until XRP breaks out of this channel and reclaims higher resistance, the structure remains bearish and trend-driven rather than range-bound.
What to Expect in the Coming Week?
The market is entering a phase where direction will be defined by confirmation, not speculation. Bitcoin and Ethereum prices are nearing key turning points, while XRP price continues to lag, creating a mixed but decisive setup across major assets. In the coming week, the buyers’ conviction could have a major impact on the prices.
A sustained increase in the volume with a rise in the broader market participation will drive a meaningful upside. However, if participation remains weak, expect continued slow movement and selective underperformance across certain assets. The key signal to watch is follow-through—not just price movement, but whether it is supported by volume and capital inflow.
Blockworks' Michael Ippolito sees surge in token supply diluting returns, breaking the link between fundamentals and price while raising concerns about crypto’s long-term model.
The crypto market is attempting to stabilise, with leading assets like Bitcoin and Ethereum holding above key support levels. However, Cardano continues to lag, trading near multi-year lows and slipping out of the top 10 by market capitalisation. This consolidation appears structural rather than natural, as ongoing development, upgrades, and adoption have failed to translate into price momentum. As the gap between progress and ADA price widens, the next phase of price action becomes increasingly critical to watch.
Why is Cardano Price Stuck While Other Cryptos are Moving?
Since the Bitcoin price began to consolidate, the capital rotation to the altcoins has been observed, but it has been largely selective. The high-beta tokens have been experiencing explosive moves as the breakout setups are attracting buyers. Moreover, the narrative-driven coins are capturing the liquidity; meanwhile, the ADA price remains stuck below $0.3. It has been failing to break the resistance and showing weak follow-through.
Here are the possible reasons why capital is diverging from Cardano:
Currently, crypto is driven by narratives, not just fundamentals, as AI is trending, memecoins have high retail participation, and L1S are capturing attention.
The CMF is negative, volume is declining, and price is stuck at the support, hunting towards a drop in capital flow
In the past few days, the platform saw new upgrades, real-world adoptions and governance improvements. Hence, the on-chain growth is not translating
Lastly, the technical structure is also weak as it is making lower highs, failing to reclaim $0.3, holding the range between $0.22 and $0.26
Cardano Price Holds Multi-Year Support, But Weak Structure Raises Concerns
Cardano (ADA) continues to trade near a critical long-term support zone, even as the broader crypto market attempts to stabilise. On the weekly timeframe, ADA is trading within a well-defined range, with the lower boundary around $0.22–$0.26 acting as a key support zone. This level has been tested multiple times since 2023, making it a critical area for bulls to defend.
Price continues to form lower highs, indicating that buying strength is fading with each rally attempt. The repeated rejection near the $0.30 level further reinforces the presence of strong overhead supply. The Bollinger Bands show price compressing near the lower band, which typically signals either a relief bounce or continued weakness.
At the same time, the Chaikin Money Flow (CMF) remains deeply negative, pointing to sustained capital outflows rather than accumulation. Volume also remains subdued, suggesting a lack of strong participation from buyers at these levels.
Unless ADA reclaims higher levels with conviction, the repeated tests of this zone increase the probability of a breakdown. On the other hand, holding this range could still trigger a short-term relief move, but only if supported by improving volume and inflows.
Cardano Price Prediction: Will ADA Reach $0.3 This Month?
Cardano (ADA) price is currently trading within a critical range between $0.22 and $0.30, with weak momentum and limited capital inflows restricting any strong upside move. Despite ongoing network upgrades and ecosystem developments, ADA continues to lag behind other altcoins due to declining volume and a lack of sustained buying pressure.
For Cardano to reclaim the $0.30 level, the price must establish a stable base above $0.26 and attract higher trading volume, supported by broader crypto market strength. Until then, ADA is likely to remain range-bound, with resistance near $0.30 and key support holding around $0.22.
Ever since its rejection from the 2025 highs above $740, the Zcash price has remained trapped within a strong descending trend. Besides, the start of the monthly trade was not explosive but rather a sustained one. With these developments, the popular privacy token has reached a crucial turning point as it is now testing a long-standing descending trend line near the $250 to $300 range. Hence, it appears that it is not just another bullish move but a decision phase.
Now it would be fascinating to watch whether the ZEC price breaks out and shifts the structure or it gets rejected and continues its broader downtrend.
Zcash Price Analysis: ZEC Stuck in a Descending Trend
The ZEC price has been compressing below a descending resistance trendline, forming a tightening range that usually precedes a volatile move. Besides, momentum is gradually improving, but the strength lacks confirmation. This suggests that the price is rising but lacks conviction, which is why the current upswing is failing validation.
RSI is trending upward and holding above mid-levels, signaling early bullish strength, while CMF remains slightly negative, indicating that strong capital inflows are still missing. This analysis indicates the ZEC price remains in a downtrend, defined by consistent lower highs and rejection from key resistance zones.
Key Levels to Watch
Immediate Resistance: $260–$280
Major Resistance: $300
Breakout Confirmation: Above $280 with strong volume
Immediate Support: $220–$230
Breakdown Level: $200
Next Major Support: $170
Price is currently testing resistance from below, making this a high-stakes zone.
The Bottom Line: Will ZEC Price Reach $300 This Month?
The Zcash price continues to coil under the resistance, regardless of the current recovery, which suggests the move is not a confirmed breakout. Therefore, a rise above $280 could activate the target at $300, which may further extend to $320-$350. On the other hand, a rejection from the current levels could drag the levels to $220 or lower than $200 to $170 in an extreme bearish case.
The SIREN price is back in the spotlight after a sharp bounce from recent lows. The price had gained massive attention with a 1600% jump in the first few days of March, which resulted in an 88% correction by the end. The token further dropped by 70% this month, and the latest rebound has recovered all the losses. However, the current price action does not appear to be its strength but a strong reaction.
While the data leans heavily on one side, the question that arises now is, is this movement the start of a new trend or just a temporary bounce before another leg down?
Why SIREN Price Is Rising Today — Can This Bounce Sustain or Is a Reversal Coming?
The current move is not driven by fresh fundamentals. It’s driven by structure. First, price bounced from a strong demand zone near $0.40–$0.45, where buyers stepped in aggressively. This is visible through a spike in volume, suggesting short-term accumulation or short covering.
Second, the broader market environment still favors high-volatility altcoins, especially those tied to AI narratives. SIREN continues to benefit from that positioning.
The most important driver is technical, as the oversold conditions triggered a relief rally. RSI recovered from oversold levels (~30) to neutral (~50), confirming this is a bounce—not a trend reversal. Siren’s price structure remains clearly bearish on the short-term frame. The token has been forming lower highs and lows with strong rejection candles after topping near $3. This confirms a distribution phase followed by a downtrend.
Key Levels to Watch
Immediate Resistance: $0.60–$0.65
Major Resistance: $0.80–$1.00
Trend Reversal Zone: Above $1.50
Key Support: $0.40–$0.45
Breakdown Level: $0.30
Price is currently struggling below resistance, showing weak continuation. The volume spike at the bottom shows reactive buying, while a weak follow-through displays a lack of conviction. The RSI is neutral, indicating no strong trend momentum, and this combination signals a temporary bounce, not a sustained rally.
Siren Price Prediction: What’s Next?
SIREN price is not in an uptrend. It is in a corrective bounce within a larger downtrend. If the price breaks and holds above $0.65, the rally could extend and test the resistance between $0.8 and $1. Meanwhile, a rejection near $0.55 to $0.6 could activate the lower target at $0.45 to $0.3.
This is not early accumulation but is a mid-trend noise after a major crash. Unless buyers reclaim key resistance with volume, the path of least resistance remains negative.
Good Friday shut down CME futures and all crypto ETF activity on April 3, removing the institutional bid that has anchored XRP and Solana throughout 2026, according to CoinDesk. The day before, SOL’s ETF managed just $932,850 in inflows, its first positive day in six sessions, per BeInCrypto. When institutional products go dark during a fear cycle, it confirms these assets are institutional grade now, and institutional grade means returns capped by market cap with no path to 100x.
While the XRP price prediction conversation stalls alongside frozen ETF flows, early stage capital keeps moving to Pepeto, where $8.68M raised during extreme fear and a Binance listing approaching could push the token into 267x territory that neither $80 billion asset can produce.
Good Friday Freezes All Crypto ETF Flows as XRP and SOL Drift Without Direction
CoinDesk reported that Good Friday paused CME futures and ETF creation and redemption for all crypto products on April 3, leaving XRP and Solana exposed to thin weekend liquidity. BeInCrypto confirmed that SOL’s ETF broke a six-day drought on April 2 with just $932,850, ending a stretch that included three outflow days totalling $15 million.
For the broader market, the ETF shutdown validates that both tokens now depend on institutional flows for price support, but it also confirms the explosive early returns are behind them. The traders hunting 267x are no longer looking at assets that freeze when Wall Street takes a holiday.
Top Cryptocurrencies to Position Before the Next Breakout
Pepeto: The Exchange Token Where $0.0000001862 Becomes 267x Before Institutions Discover It
While XRP traders monitor resistance levels hoping for modest percentage gains, Pepeto at $0.0000001862 operates in a completely different dimension. The entry cost is smaller, the growth runway is exponentially larger, and presale positioning places you ahead of the public market entirely.
The exchange is under active development, genuinely uncommon at the presale stage. The $8.68M raised while the Fear and Greed Index touched single digits represents deep conviction locked into a SolidProof audited contract, a cofounder who scaled Pepe to $7 billion, and a former Binance executive directing the listing strategy.
That capital entered during extreme fear because Pepeto targets the $45 billion meme coin trading market with zero-fee infrastructure spanning three blockchains, and the 267x math requires only that the market values this exchange token at a fraction of what Pepe achieved with the same 420 trillion supply.
Holders earn from every trade through the revenue model. The bridge spans three networks seamlessly. Zero-fee trading undercuts every competitor. The Binance listing approaches, and unlike the XRP price prediction, Pepeto’s ceiling has not been written yet. The wallets that built wealth in every prior cycle did it by locking into infrastructure presales before listings repriced the entry permanently, and Pepeto’s confirmed Binance listing will erase this price along with the 267x math the moment trading opens.
XRP Price Prediction: Validated by Institutions but Returns Stay Range Locked
XRP holds near $1.30 according to CoinMarketCap after posting its worst quarter in eight years with a 27% decline despite record address growth. Good Friday paused ETF flows entirely, and the CLARITY Act faces its binary Senate markup in late April.
The XRP price prediction targets $2.40 if the CLARITY Act passes, roughly 82% over months, but retail futures open interest remains 80% below its peak. Moving averages stack between $1.43 and $1.80, blocking every rally attempt. Losing $1.30 hands bears the ground they cannot afford to surrender.
Solana: ETF Drought Breaks With $932K but Bears Still Control
Solana traded at $80.06, down 73% from its $293 peak. Its ETF managed only $932,850 on April 2 after six days of zero or negative flows, per BeInCrypto. Support holds at $78, with $89 the key resistance. Losing $78 opens $67.
Conclusion
Ripple will still trade next week regardless of the XRP price prediction. Pepeto’s presale will not. Good Friday froze every institutional flow into XRP and SOL at $1.30 and $80, confirming the explosive early window for both is closed. A $1,000 XRP position buys 757 tokens with modest percentage upside. The same $1,000 in Pepeto secures 5.4 billion tokens, targeting $150,000 at a fraction of Pepe’s ATH valuation.
Two futures branch from this moment. In one, you entered the presale, and the listing math transformed your portfolio. In the other, you followed the XRP price prediction from the sidelines and calculated what you missed. Visit the Pepeto official website while both outcomes are still available to you.
Prediction markets aren’t just side bets anymore they’re becoming the rawest form of crowd sentiment. And right now, prediction markets are painting a pretty grim picture for April.
Take the Strait of Hormuz question. Just weeks ago, confidence that traffic would normalize by the end of April sat at a comfortable 76.5%. Fast forward to today, and that number has collapsed to 10%. Intraday, it briefly hovered around 11.5%, but even that didn’t hold.
That’s not a dip. That’s a full-blown sentiment breakdown.
Prediction markets flip sharply on war outlook
So what changed? Well, a steady stream of aggressive geopolitical rhetoric has pushed traders to rethink their bets. The market isn’t just reacting to headlines; it’s reacting to tone, escalation, and the probability of things getting worse before they get better.
And the numbers don’t lie. With $2.52 million in total volume and over $141K in daily activity, this isn’t some illiquid corner of the internet. People are actively pricing in risk and they’re leaning heavily toward prolonged conflict.
In simple terms? April isn’t expected to calm down. It’s expected to get louder.
Oil bets explode as conflict fears intensify
Now flip over to another prediction market: oil. The question “what will WTI crude hit in April 2026” reveals even more about where sentiment is heading. A striking 76.5% of participants believe oil will cross $120. More than half, 53.5%, think it’ll break $130. And nearly a third are betting on $140 or higher.
Only 17.5% are betting on a drop to $80. That’s the minority view which is kind of the “things get better” scenario.
But right now geopolitical drama isn’t looking better yet. This kind of positioning screams one thing: expectation of continued disruption.
Crypto market caught in geopolitical crossfire
So where does this leave crypto? Right in the middle of it. Today’s Truth Social post highlights pride in his past tariff plans that allegedly created new U.S. jobs but also resulted in a 55% trade deficit. He concluded by stating he is “getting rid of nuclear Iran to make America great again.”
— Commentary Donald J. Trump Posts From Truth Social (@TrumpDailyPosts) April 4, 2026
When global conflict intensifies, it doesn’t just hit oil infact it ripples through equities, commodities, and yes, digital assets like BTC, ETH, and other’s included. If the Strait of Hormuz remains unstable, global trade routes stay under pressure. That’s not exactly bullish for risk assets.
Short term, that means volatility. Sharp moves, quick reversals, and plenty of fakeouts.
Long term? That’s a different story. But right now, markets aren’t thinking long term but they’re reacting in real time.
Sentiment points to volatile April ahead
So Prediction markets are already answering that question, just not in a comforting way.
With probabilities shifting this aggressively, traders are positioning for chaos, not clarity. And when sentiment aligns this strongly, markets tend to follow at least in the short term.
Prediction markets might not be perfect. But right now, they’re telling a very clear story: April isn’t priced for peace. It’s priced for pressure.
BlockDAG stands out among the top crypto gainers with a limited $0.000022 entry price, as the Pippin crypto price drops and the Dogecoin price prediction remains uncertain. Sentiment across crypto sits at extreme fear right now, with the Fear &…
LOL token price just did what memecoins do best which is steal the spotlight when no one’s looking. In the past 24 hours, it quietly climbed to the top of the most-visited charts, overtaking even the usual heavyweights like Bitcoin on Coinmarketcap especially. Not bad for a project sitting at a $9.56 million market cap and trading around $0.009642.
Explosive rally sends LOL token trending hard
Pull up the LOL/USDT chart and it’s obvious why traders suddenly care. Between March 23 and April 1, the token ripped from $0.001401 to $0.012774 thats an almost 800% surge. That’s not a rally, that’s a vertical sprint.
Since then, things have cooled… slightly. The price has slipped back to around $0.009582, but it’s still up roughly 580% from its starting point. And here’s the weird part it’s not collapsing like most low-cap memecoins after a move like that.
Instead, it’s printing wicks near the top. That usually means one thing: indecision. Buyers want higher, but sellers aren’t done yet.
Whale activity and hype fuel momentum
So what’s keeping it alive? A mix of speculation, hype, and just enough narrative to keep traders interested.
A memecoin whale recently scooped up $8.01K worth of LOL around a $9.44 million valuation. Not massive, but enough to get attention in a low-liquidity environment.
— Whale Watch by Moby (@whalewatchalert) April 4, 2026
Then there’s the chatter. Discussions around potential funding deals, future growth plans, and even possible major exchange listings are floating around. Add in the usual “biggest meme” claims and you’ve got the perfect cocktail for retail curiosity.
And yeah, it’s working. That’s why LOL token price is sitting at the top of the most-visited rankings despite being ranked deep in the market.
Now here’s where the story shifts. On-chain data isn’t nearly as fun as price charts but it’s a lot more honest. Bubble map analysis shows something less comforting: clustered supply.
Instead of a wide, decentralized spread of holders, there are visible interconnected groups of wallets especially yellow, pink, teal clusters that suggest coordinated ownership. These aren’t random retail wallets. They’re linked. And that’s a problem.
Because when large chunks of supply sit in connected hands, it creates the perfect setup for a coordinated exit. One move, multiple wallets, and suddenly liquidity disappears. Retail? Usually left holding the bag.
Momentum holds, but structure remains fragile
So, what’s next? Honestly, odds suggests at this point is that it’s a coin flip just like most memecoins at this stage.
If hype keeps building and demand flows in, LOL token price could push higher. That’s how these things work. Momentum feeds momentum.
But let’s be real, practical and mature because underneath the hype, the structure isn’t exactly bulletproof. Supply concentration, speculative demand, and thin liquidity don’t make a stable foundation. For now, LOL token price is riding the wave. The question is how long before the wave turns.
Ethereum is flashing a rare market signal, and it’s not showing up in price yet. While the broader crypto market remains stuck in consolidation, ETH supply on exchanges has dropped to multi-year lows, just as early signs of buy-side pressure begin to reappear.
This type of divergence doesn’t last. When supply tightens and demand quietly returns, prices tend to move fast, raising the question of whether Ethereum price is now on the verge of its next breakout.
ETH Supply Tightens As Exchange Balances Hit Multi-Year Lows
Ethereum’s exchange supply has now dropped to its lowest level since 2016, marking a significant shift in market structure. This decline suggests that investors are moving ETH off exchanges, either into cold storage or staking, reducing the amount of liquid supply available for immediate selling. As available liquidity contracts, price becomes increasingly sensitive to changes in demand.
This dynamic is further reinforced by Ethereum’s staking mechanism. With entry queues extending to nearly 50 days, a growing portion of ETH is being locked away from circulation. At the same time, exit queues remain minimal, indicating that holders are not rushing to unlock and sell.
Derivatives Data Shows Demand Is Beginning To Return
Alongside tightening supply, early signs of demand are starting to emerge. Net Taker Volume has flipped positive, with approximately $104 million in buy-side pressure, indicating that market participants are beginning to execute more aggressive buy orders in derivatives markets. This marks a shift from the previous regime, where selling pressure dominated even during price recoveries.
Importantly, this change is occurring without excessive leverage buildup, suggesting that the market is not yet overcrowded or overheated. Instead, it reflects early positioning, where traders begin building exposure ahead of a potential move. This alignment, tightening supply and returning demand, is what defines the current setup.
Ethereum price remains capped within a broader downtrend structure, with the descending trendline continuing to reject upside attempts since the $4,000 peak. The recent decline toward the $1,800–$2,000 zone marked a local bottom, where selling pressure eased and price transitioned into consolidation.
Since then, ETH has been trading in a compressed range just below resistance, reflecting a shift from directional selling to absorption. ETH price is now positioned directly beneath a key confluence zone around $2,100–$2,200, where the trendline, horizontal resistance, and moving averages intersect.
This structure suggests a market at an inflection point. A clean break and hold above resistance would invalidate the lower-high sequence and open upside toward $2,400–$2,700, while failure to reclaim this level keeps ETH range-bound with support near $1,900–$2,000.
Outlook: Breakout Setup Builds, Awaiting Trigger
Ethereum’s setup is structurally constructive, supported by tightening supply and early demand signals. However, confirmation remains key. A sustained move above resistance would likely trigger expansion, while rejection keeps the range intact. The setup points toward a decisive move ahead, with direction dependent on breakout confirmation.
Crypto investment activity slowed significantly in the first quarter of 2026, with total inflows estimated at around 11 billion dollars, far below last year’s pace. When annualized, this trend suggests roughly $44 billion, compared to $130 billion in 2025. Most new capital came from corporate Bitcoin purchases and venture funding, while retail and institutional participation remained weak. Bitcoin and Ethereum ETFs recorded net outflows, and miners continued selling holdings, reflecting cautious market sentiment.
Circle, the issuer of USDC, is facing criticism after blockchain investigator ZachXBT shared a detailed thread called “Welcome to Circle Files.” Over the past three years, Circle’s handling of USDC has reportedly resulted in losses totaling over $420 million, involving multiple high-profile hacks and thefts.
ZachXBT questioned why Circle didn’t use its power to freeze stolen USDC sooner.
Case by Case — USDC Compliance Failures
This is not a small accusation from a random account. ZachXBT is one of the most respected on-chain investigators in the world, and every claim in the thread is backed by verifiable blockchain data.
The Drift Protocol Hack — April 1, 2026
One of the most recent cases is the April 2026 Drift Protocol exploit, over $232M USDC was bridged from Solana to Ethereum across more than 100 transactions in six hours. All using Circle’s own Cross-Chain Transfer Protocol, with no action from Circle.
Security researcher Specter noted that the attacker deliberately avoided converting to Tether during the bridging process, suggesting the hacker was confident Circle would not freeze the funds.
The Bybit Hack — February 2025
When the Lazarus Group stole $1.5 billion from Bybit, law enforcement asked both Tether and Circle to freeze a theft address. Tether froze within hours, while Circle reportedly acted 24 hours later.
Radiant Capital Hack – Oct 2024
In October 2024, Radiant Capital was hacked for $58 million by the Lazarus Group. The attacker stole USDC using open approvals and moved across multiple blockchains. The funds stayed in hacker wallets for hours, but Circle did not freeze them.
Mango Markets Hack – Oct 2022
Similarly, in October 2022, Mango Markets was hacked for $110 million. The attacker moved $57.5 million to a Circle deposit address on Solana and later transferred the funds to Ethereum. The attacker was eventually charged by the SEC, but the stolen funds were never frozen on-chain.
The Nomad Bridge Hack — August 2022
Around $45 million in USDC sat in hacker wallets for 30–45 minutes, and the hack was publicly known. Circle never blacklisted the addresses, and the funds were swapped out.
Why Circle Has Been Delaying in Taking Strong Action
ZachXBT said Circle has the tools to act faster, but delays have affected users, with losses reaching nine figures. He noted that Circle is not helpless in this situation
USDC’s token contract includes a freeze and blacklist function, and Circle’s own terms of service explicitly state it reserves the right to restrict access for suspected illicit actors “in its sole discretion.”
This means Circle can freeze stolen USDC without waiting for court orders. But the problem, according to ZachXBT, is that Circle repeatedly chose not to act quickly.
Something unusual is unfolding in crypto. Over 20 funded projects have shut down in Q1 2026, not scams or rug pulls, but real platforms that couldn’t survive current market conditions. Data highlighted by Defi Scribbler shows this is less about failure and more about a market reset.
Projects That Shut Down or Scaled Back
Here’s a quick look at the major names and what happened:
Magic Eden Wallet shut down its wallet product and reduced its multi-chain focus to double down on Solana.
Leap Wallet confirmed a full shutdown, exiting the market entirely by late May.
Bit.com closed its derivatives exchange operations amid declining activity.
Dmail, a Web3 messaging platform, ceased operations after struggling to retain users.
Step Finance, a Solana-based dashboard, shut down due to reduced DeFi engagement.
ZeroLend failed to sustain lending activity and shut its platform.
MilkyWay, a DeFi-focused project, closed as liquidity dried up.
Fantasy Top is sunsetting its core mode by mid-June after losing traction.
Slingshot, a DeFi trading aggregator, wound down operations amid low usage.
Nifty Gateway, once a major NFT marketplace, exited as NFT demand cooled.
Parsec, an analytics platform, shut down as user demand dropped.
What Went Wrong?
Most of these projects were launched during bull market phases when capital was easy, and user growth came quickly. That environment has now changed.
Trading volumes are lower, funding is tighter, and users are sticking to a few major platforms. Projects without clear revenue or long-term user retention simply couldn’t keep up.
“You need to understand more will follow! Especially because most of these projects have seen that nothing happens if they shut down. And there is barely any money left to be made. So there’s no point keeping useless protocols that no one uses anyway.”
At the same time, capital has shifted toward Bitcoin ETFs and large-cap assets, leaving smaller platforms struggling.
Market Is Resetting, Not Collapsing
This wave of closures signals a clear transition. The focus is no longer on hype or fast launches, but on survival and sustainability.
Projects built on incentives and short-term excitement are fading, while those with real usage are starting to stand out.
Hence, for now, smaller and mid-tier projects are under pressure. But this reset could quietly prepare the ground for a more stable and mature phase ahead.
Notcoin may possibly hit $0.200 by 2030 if support holds and adoption strengthens steadily.
NOT remains in consolidation, with key support at $0.00030
Notcoin (NOT) began as a viral sensation, pioneering the “tap-to-earn” model on Telegram and onboarding over 35 million users into the TON ecosystem.
However, the initial euphoria gave way to a significant “demise” in market value, as the token plummeted over 95% from its 2024 highs to a current market cap of approximately $39M. This decline was driven by massive airdrop sell pressure and a lack of sustainable utility beyond the initial clicker game.
Today, the NOT token is attempting a “strategic resurgence,” evolving from a simple game into a gaming hub and DeFi platform. It now powers the “Not Games” ecosystem, serves as collateral in DeFi protocols, and even backs a digital Visa card with buyback mechanisms.
Can this pivot from hype to infrastructure restore investor confidence, or was the viral spark a one-time phenomenon? To explore its potential recovery, read our Notcoin price prediction 2026-2030 for a deep dive.
As April has begun and Q1 ended, Notcoin’s price action remains defined by stability rather than expansion. The $0.00030–$0.00035 range has emerged as a key support zone, where selling pressure has consistently eased. As long as NOT holds above this area, the risk of deeper downside remains limited, and price is likely to continue moving sideways.
On the upside, initial resistance is located near $0.00060, followed by a broader recovery zone between $0.0010 and $0.0015. These levels have capped price during previous attempts and will likely require time and steady participation to overcome. Now after Q1, April is unlikely to deliver a sharp breakout. Instead, its importance lies in whether Notcoin can maintain its base and slowly build higher structure, setting the stage for recovery later in the year.
Recent News/ Opinions
On April 2, 2026, Notcoin unveiled its latest evolution, “Nothing,” an independent media platform where artists and creators lead the narrative. Moving beyond its gaming origins, this new initiative invites talents and spectators to participate in a developing story that turns “nothing into something” through decentralized creative expression.
On March 6, 2026, Notcoin announced that its “Glance” play-to-earn game has introduced new quests, allowing players to earn free NOT tokens upon successful completion. This integration strengthens the project’s ecosystem by incentivizing active gameplay and rewarding the community through interactive challenges.
Notcoin (NOT) Price Prediction 2026
The weekly chart for NOT/USD illustrates a classic “hype-to-capitulation” cycle. Following its Q2 2024 launch, the token experienced a massive parabolic surge, peaking near $0.029. However, this was met with intense selling pressure, breaking key psychological supports at $0.012 and $0.009.
By 2025, the price entered a persistent “bleeding” phase, characterized by lower highs and diminishing volume. Currently, in H1 2026, the asset is trading at extreme lows around $0.00035-$0.00040, deep within a terminal consolidation zone. For a reversal, bulls must reclaim the $0.002 level to break the long-term bearish structure.
Notcoin Crypto Price Prediction 2026 – 2030
Year
Potential Low ($)
Potential Average ($
Potential High ($)
2027
0.035
0.055
0.080
2028
0.060
0.095
0.140
2029
0.110
0.160
0.190
2030
0.150
0.180
0.200
Notcoin Price Prediction 2027
As per the Notcoin Price Prediction 2027, Notcoin may see a potential low price of $0.035. The potential high for Notcoin price in 2027 is estimated to reach $0.080.
Notcoin (NOT) Price Forecast 2028
In 2028, Notcoin price is forecasted to potentially reach a low price of $0.060 and a high price of $0.140.
Notcoin Crypto Price Prediction 2029
Thereafter, the Notcoin (Notcoin) price for the year 2029 could range between $0.110 and $0.190.
Notcoin (NOT) Price Prediction 2030
Finally, in 2030, the price of Notcoin is predicted to remain steady and positive. It may trade between $0.150 and $0.200.
“Bitcoin going to zero” searches have been trending lately, and Scott Melker says that’s exactly why he’s buying.
In a new interview on Binance’s Inside the Blockchain 100, the Wolf of All Streets made a case that most people caught in the current drawdown aren’t considering: the bear market playbook doesn’t apply to a cycle that never followed the bull market playbook.
Bitcoin’s 4-Year Cycle Is Broken
Bitcoin hit its all-time high of $126K in October 2025 early – too early, driven by ETF flows before the market was ready. There was no altcoin season and no blowoff top. We didn’t even hit 2x the previous all-time high, when history suggested 3-4x.
“The cycle is largely broken,” Melker said. “For those who believe we’re about to get an 85 or 90% trip to the downside like previous bear markets, I would ask why we would get commensurate downside if we never got the proportional upside.”
His parallel is summer 2021, when Bitcoin dropped 55% from $65K to $28K before recovering to a new all-time high. The current drawdown from $126K sits at a similar percentage. If that pattern holds, this isn’t a bear market, but just a painful but temporary pause.
Bitcoin Bottom 2026: Four Signals Are Flashing at Once
Melker flagged four signals he watches at cycle bottoms and says all four are flashing right now.
Weekly RSI on the Bitcoin chart is at historic lows, even below 2022 levels. The Fear & Greed Index has hit its lowest reading ever. “Bitcoin going to zero” Google searches are at an all-time high. And Bitcoin is approaching the 200-week moving average, which is a level that has historically marked the bottom of every major cycle.
Crypto Rover added more context today: 44% of Bitcoin’s circulating supply is now held at a loss. That is a capitulation signal.
Is Altcoin Season Dead for Good?
Melker is explicit: Bitcoin bottoming doesn’t mean altcoins recover. His diagnosis for why altcoin liquidity collapsed is specific: prediction markets.
“I believe prediction markets have very little to do with Bitcoin but have largely destroyed the altcoin cycles,” he said. The gamblers who drove memecoin and altcoin cycles found a better casino. That liquidity isn’t coming back the same way.
His advice for Bitcoin specifically: automate, dollar-cost average, stop watching the price. “I’ve been buying quite a lot in the 60s.”
The silence in the market right now isn’t just fear. According to Melker, it’s what a bottom looks like before anyone admits it.
Ripple’s connection with Japan is once again grabbing attention, and this time, it’s not just about partnerships but bold expectations around XRP’s future. As institutional ties grow stronger, fresh comments from market voices are adding to the conversation, especially with Japan playing a central role in Ripple’s expansion strategy.
Japan’s Bold XRP Claim
Crypto user, Stellar Rippler, spotlighted a strong statement coming from SBI Holdings CEO Yoshitaka Kitao, who said, “XRP will be very expensive.”
He didn’t stop there. Kitao also pointed toward the ongoing legal uncertainty, suggesting that a favorable court decision for Ripple could have a major impact on XRP’s value.
“It seems that he is thinking that the court’s decision will be made in a few weeks. If the decision is made and Ripple’s XRP is a coin, I think it will be a big price… If the conclusion is positive, I think it will be great.”
This adds weight to earlier comments from David Schwartz, but coming from SBI’s top executive, the message carries stronger institutional backing.
SBI and Ripple: A Long-Term Play
SBI’s relationship with Ripple goes back to 2016 through SBI Ripple Asia, where both have worked on cross-border payment solutions across Japan, South Korea, India, and the Philippines. These aren’t just plans on paper but real payment corridors using XRP.
SBI also remains Ripple’s largest external shareholder, making its continued support a key factor in XRP’s broader narrative.
New Moves Strengthen the Case
Recent developments show this partnership is still expanding. In February 2026, SBI launched a 10 billion yen (around $64 million) blockchain bond that rewards investors with XRP, marking a first for a major Japanese financial institution.
At the same time, plans are in place to introduce Ripple’s RLUSD stablecoin in Japan via SBI’s licensed exchange. On the development side, SBI Ripple Asia has teamed up with the Asia Web3 Alliance Japan to support startups building financial tools on the XRP Ledger.
Elon Musk’s X is rolling out a security feature that will automatically lock any account that mentions cryptocurrency for the first time — requiring additional verification before posting resumes — a direct response to a wave of account hijacking campaigns…
The Digital Asset Market Clarity Act’s compromise language on stablecoin yield has circulated among crypto and banking industry stakeholders in closed-door Capitol Hill sessions, with a Senate Banking Committee markup now targeted for the second half of April — though…
Defense Secretary Pete Hegseth forced Army Chief of Staff General Randy George into immediate retirement on Thursday — the latest in a pattern of senior military dismissals tied to a deepening conflict between Hegseth and uniformed leaders over diversity-linked promotion…
Two U.S. military aircraft were shot down in separate incidents during combat operations over Iran on April 3 — an F-15E Strike Eagle and an A-10 Thunderbolt II — with a search-and-rescue operation still ongoing for one missing crew member…
President Donald Trump submitted a $1.5 trillion defense spending request for fiscal year 2027 on Friday — the largest military budget proposal in U.S. history, a roughly 40% increase over current funding levels, arriving in the fifth week of the…
Naoris Protocol has gone live with its quantum-resistant blockchain mainnet, becoming the first Layer 1 network built entirely on post-quantum cryptography approved by the U.S. National Institute of Standards and Technology — a milestone arriving as researchers shorten timelines for…
Blockchain investigator ZachXBT has publicly accused Circle of failing to freeze stolen USDC as it moved through the company’s own cross-chain infrastructure during the $285 million Drift Protocol exploit on April 1, 2026 — raising pointed questions about when and…
Charles Schwab has confirmed it remains on track to launch direct spot trading for Bitcoin and Ether in the first half of 2026, opening one of the largest pools of investor capital in the world to direct crypto access for…
Elon Musk is requiring banks, law firms, and auditors competing for roles on SpaceX’s upcoming IPO to purchase subscriptions to Grok, his artificial intelligence chatbot — a mandate the New York Times reported Friday that some Wall Street firms have…
SpaceX has submitted a confidential draft registration to the U.S. Securities and Exchange Commission, targeting a $1.75 trillion valuation and a raise of up to $75 billion — what would be the largest initial public offering in financial history. The…
XRP is compressing into the apex of a descending wedge at $1.3157 after months of lower highs and lower lows, with the 4H MACD signal line just crossing into positive territory for the first time since February — a sign…
Ethereum is pressing against a double-top resistance zone at $2,163 after two consecutive rejections from the upper boundary of its rising parallel channel, while a marginal bullish MACD crossover on the 4H chart raises the question of whether buyers can…
Bitcoin is holding just above a broken support level at $66,900 as a potential bear flag forms on the 4H chart and the daily MACD hits one of its most negative readings of the current cycle, raising the risk of…
U.S. lawyers are filing AI-generated briefs with fictitious citations at an accelerating pace, court sanctions are setting new records, and the technology is spreading so deeply into legal software that experts say mandatory disclosure rules may already be obsolete. U.S.…
ICE detention deaths are running at a record pace in 2026, and the United States’ largest immigration detention center — a sprawling tent facility on a Texas Army base — has logged three deaths, 49 regulatory violations, and allegations of…
More than 3 million pages of Epstein files have been released, prosecutors have brought no new charges against anyone in his network, and five legal experts have now laid out in precise terms why the evidentiary gap between public scandal…
The Justice Department’s Civil Rights Division privacy officer has quietly resigned as the DOJ moves to share sensitive voter registration data — including partial Social Security numbers and driver’s license numbers — with the Department of Homeland Security, without issuing…
Secretary of Defense Pete Hegseth has reversed a 34-year Pentagon policy, signing a memo on April 2 that authorizes off-duty U.S. service members to carry privately owned firearms on military installations — a decision that lands alongside a downed F-15…
The Trump administration submitted a $1.5 trillion defense spending request to Congress on April 3 — the largest military budget proposal in U.S. history — pairing record military outlays with cuts to domestic programs in a fiscal combination that signals…
A U.S. fighter jet identified as an F-15 was shot down over Iran on April 3, with one crew member rescued and President Trump briefed, adding a sharp new layer of escalation to a conflict that has already pushed Bitcoin…
X is preparing to automatically lock any crypto scam account that mentions cryptocurrency for the first time in its posting history, with Head of Product Nikita Bier saying the measure should eliminate 99% of the economic incentive behind the platform’s…
President Trump has fired Pam Bondi and replaced her with Todd Blanche as interim U.S. Attorney General — handing control of the Justice Department to the official who dismantled the DOJ’s crypto enforcement unit in April 2025 and holds up…
Marex’s Nvidia‑linked “prediction market bond” pays 7% if NVDA stays the world’s most valuable company for a year, wrapping Polymarket‑style odds into principal‑protected credit. Marex Group has created and sold what it calls the first “prediction market bond,” a structured…
Coinbase has received conditional approval from the Office of the Comptroller of the Currency for a national trust bank charter — a first for any major U.S. crypto exchange — as community banking groups wasted no time calling the decision…
Bitcoin held above $67,000 on Good Friday as U.S. employers added 178,000 jobs in March — beating forecasts by a wide margin — while traditional markets sat closed for the Easter holiday, leaving crypto as the primary gauge of how…
Gemini adds drag‑to‑modify tools to ActiveTrader, chasing speed‑focused traders even as GEMI stock trades well below its IPO price and users still complain about lag. Gemini has rolled out a new order modification feature for its ActiveTrader interface, allowing users…
VanEck’s Matthew Sigel sees $100,000 Bitcoin within a year even as Iran conflict–driven volatility, war risks, and macro uncertainty leave room for another 20% drawdown. Bitcoin (BTC) can “totally reasonably” trade back at $100,000 within a year, according to VanEck’s…
Ethereum trades near $2,000 as Coinglass data show $801m in shorts above $2,149 and $739m in longs below $1,960, primed for a violent liquidation cascade. Ethereum’s (ETH) derivatives market is sitting on a knife edge as fresh Coinglass data show…
The Ethereum Foundation has completed its 70,000 ETH staking mission, depositing approximately 45,000 ETH worth around $93 million in a single on-chain session on April 3 The Ethereum (ETH) Foundation has completed its 70,000 ETH staking target, depositing approximately 45,000…
Traders are pricing fewer Fed cuts in 2026 as U.S. unemployment dips to 4.3%, tempering the liquidity story for Bitcoin and Ethereum but not triggering a risk‑asset capitulation. Derivatives and rates markets have trimmed expectations for how aggressively the Federal…
Coinglass’ ETH liquidation heatmap shows nearly $1.8b in long and short leverage clustered between $1,952 and $2,154, turning a 5–7% move into a potential forced‑flow event. According to derivatives analytics platform Coinglass, Ethereum’s (ETH) futures market is now pinned between…
RootData’s project claiming lets teams verify and manage profiles, lifting transparency scores over 30% and driving a 220% jump in heat and visibility across 220+ partners. Web3 asset data platform RootData reports that adoption of its project claiming feature is…
Bitget’s VIP Fast Track ditches static balance thresholds, rewarding traders with fee offsets and perks based on futures, spot, and position activity across its UEX platform. Bitget has introduced its VIP Fast Track Program, positioning it as an “industry‑first” attempt…
Cloud mining platforms gain traction as users seek simpler, passive entry into Bitcoin mining in 2026. As crypto mining becomes increasingly industrialized in 2026, most beginners are no longer interested in buying ASIC machines, managing cooling systems, or calculating complex…
The Coinbase Bitcoin Premium Index has turned slightly positive again, hinting at renewed U.S. spot and ETF demand even as fear gauges flash “extreme fear.” The Coinbase Bitcoin Premium Index, a closely watched indicator derived from Coinglass that tracks how…
As Ethereum consolidates, investors explore new ways to generate consistent returns beyond holding in a maturing crypto market. In 2026, Ethereum continues to play a central role in the global crypto economy — but the way people invest in ETH…
South Korea extradites alleged drug boss Park Wang‑yeol and prepares a blockchain forensics push to trace at least 6.8b won in Bitcoin‑linked drug proceeds. South Korean authorities have taken custody of alleged “drug lord” Park Wang‑yeol, extradited from a Philippine…
AI launchpad Clanker’s new ecosystem fund will recycle most protocol fees on Base into CLANKER buybacks, grants, and infra for Farcaster’s creator community. AI‑driven token launchpad Clanker has unveiled the Clanker Ecosystem Fund (CEF), committing to redirect a significant share…
Eight years ago, on April 29, 2018, quoting a crypto industry founder, Dr. Emin Gun Sirer, I wrote about Ethereum’s (ETH) decentralized nature, which qualified ETH as a commodity for US law purposes. The regulatory uncertainty, regarding whether ETH [and…
South Korea’s FSS orders Dunamu to correct omissions in its Naver Financial stock swap filing as new digital asset rules threaten the merger’s structure and timeline. South Korea’s Financial Supervisory Service (FSS) has issued a corrective order to Dunamu, the…
SlowMist finds no key leaks in OKX Web3 wallet, but BOM-style malware and compromised devices keep user-side security the weak link. Blockchain security firm SlowMist has issued a new assessment of OKX’s Web3 wallet, concluding that the audited version “shows…
Microsoft said on Friday it plans to invest $10 billion in Japan over the next four years, focusing on artificial intelligence data centres and supporting infrastructure. The announcement followed a meeting between Microsoft President Brad Smith and Japanese Prime Minister…
Solana price managed to hold above the $70 support on Thursday as bulls stepped in to defend the psychological level. According to data from crypto.news, Solana (SOL) price fell nearly 9% from an intraday high of $85.1 on Wednesday to…
Coinglass’ Bitcoin liquidation map shows a $1.143b long wall below $65k and a $754m short pocket above $68k, turning a small move into a potential $1.9b forced‑flow event. Longs face a $1.143 billion liquidation wall below $65,000 Derivatives analytics from…
Ethereum drops below key support as traders turn to automated systems like AccuQuant for intraday strategies. Ethereum experienced a sharp drop yesterday, with the price breaking below support near the daily moving average. The MACD bearish momentum intensified again, and…
Cartesi token soared over 100% to a 3-month high of $0.049 on Friday. Will the Layer 2 token edge higher over the coming sessions, or will it succumb to profit-taking? According to data from crypto.news, Cartesi (CTSI) price rallied nearly…
Web3 careers evolve as professionals adopt new framework to evaluate mature, capital-driven organizations. By 2026, web3 will have become the backbone of global finance. The industry has matured into a regulated, capital-heavy, and globally competitive landscape. While many professionals still…
The United States Commodity Futures Trading Commission and the Department of Justice have filed lawsuits against Illinois, Connecticut, and Arizona over the federal government’s authority to regulate prediction markets. According to a complaint filed against Illinois Governor JB Pritzker, Attorney…
AI trading platforms like ConfluxCapital gain ground as investors shift from cloud mining to smarter income strategies. Amidst the persistent volatility of the cryptocurrency market, an increasing number of investors are beginning to re-evaluate various avenues for generating passive income.…
Google has introduced Gemma 4, its latest open artificial intelligence model family focused on advanced reasoning and agent-style workflows. In an April 2 post on X, Demis Hassabis, chief executive of Google DeepMind, announced the launch of Gemma 4, its…
Researchers at Google DeepMind have warned that the open internet can be used to manipulate autonomous AI agents and hijack their actions. The study titled “AI Agent Traps” comes as companies deploy AI agents for real-world tasks and attackers begin…
Algorand price shot up 21% on Friday, April 3, becoming the top gainer of the day, bucking the relative stillness of the broader crypto market that has gone cold amid the escalating war situation in the Middle East. According to…
Bitcoin miner Riot Platforms sold a sizeable portion of its holdings in the first quarter, offloading 3,778 BTC as crypto firms navigated a tough market environment. According to its Thursday operational update, the company sold the Bitcoin at an average…
Big Tech firms have come together to back a new industry body focused on standardizing how AI agents handle payments across crypto and traditional rails. The Linux Foundation on Thursday announced the launch of the x402 Foundation, a governance initiative…
United States President Donald Trump took credit for an unprecedented attack on the Ghadir Bridge, Iran’s largest bridge, as continued geopolitical tensions kept crypto markets suppressed. On April 2, Trump shared a video of part of the newly built 136-metre-high…
Japanese and South Korean equities advanced on Friday after a late rebound on Wall Street, as traders bet that tensions in the Iran war may be edging closer to a managed outcome. Japan’s Nikkei 225 rose 1.4%, while South Korea’s…
Polymarket has partnered with oracle provider Pyth Network to launch traditional asset markets on its platform. According to an Apr. 2 announcement, the latest addition brings daily up-or-down and closing price contracts for major equity indexes, alongside commodities such as…
OpenAI has acquired technology talk show TBPN as it looks to refine how it communicates with audiences beyond its core products. According to an Apr. 2 announcement, the deal brings the Los Angeles-based program under OpenAI’s umbrella. Financial terms of…
Circle plans to launch its own version of wrapped Bitcoin on the Ethereum network to target institutional markets. In a Thursday announcement, stablecoin issuer Circle said it plans to introduce cirBTC, a token that is backed 1:1 by bitcoin and…
Riot moved about 500 BTC in what analysts say is fresh selling, adding to a wave that’s seen listed miners dump over 15,000 BTC even as treasury firms like Metaplanet keep accumulating. On-chain data flagged a transfer of roughly 500…
Uniswap has deployed v2, v3 and v4 on Consensys’ Linea zkEVM, bringing its full DEX stack to a low-fee, EVM-equivalent rollup now integrated across the Uniswap app, API and wallet. Uniswap has announced that Uniswap v2, v3 and v4 are…
The Central Bank of Nigeria has launched a pilot supervisory program for Virtual Asset Service Providers and selected a first cohort of six entities, with KuCoin standing out as the only global crypto exchange on the list. According to local…
Technology investment platform Fundrise is partnering with crypto exchange Kraken to tokenize shares of its Fundrise Innovation Fund VCX, according to reporting from Crowdfund Insider. The deal will see the publicly listed VCX vehicle, which trades on the NYSE, wrapped…
According to real-time data from analytics platform Coinglass, large traders on perpetual DEX Hyperliquid currently hold a combined $3.4 billion in notional positions across the venue. Of that, $1.737 billion is in long positions, accounting for 51.08% of whale exposure,…
Cifra Markets aims to bring regulated, transparent access to crypto in a $2.55 trillion global market. At the time of writing, the global cryptocurrency market is a $2.55 trillion market, yet millions of users still lack access to a regulated,…
Coinbase’s x402 protocol has formally joined the Linux Foundation, with the goal of turning its AI-focused payments stack into an open, standardized layer for internet-native transactions, according to reporting from CoinDesk. Designed to embed stablecoin payments directly into the HTTP…
YZi Labs has announced a strategic additional investment in prediction market platform Predict.fun following the second season of its EASY Residency program, according to an official update from the firm. The follow‑on round brings in Susquehanna Crypto, the digital asset…
Polymarket traders now put a 65% chance on WTI crude hitting $120 at some point in 2026, as Middle East tensions and supply fears drive a rapid repricing of oil risk. Prediction platform Polymarket is currently assigning a 65% chance…
Anthony Scaramucci is openly backing Michael Saylor’s high‑yield Bitcoin strategy at the same time he jolts markets with a tongue‑in‑cheek X video announcing a 2028 presidential run, sharpening the line between his crypto advocacy and broader economic message. In a…
Nasdaq-listed Eightco Holdings has disclosed a $326 million position in 277 million Worldcoin tokens, plus ETH, cash, and an indirect OpenAI stake, effectively transforming the stock into a high-beta proxy on Sam Altman’s identity project and AI ecosystem. Nasdaq-listed Eightco…
French stock exchange Lise is preparing to list aerospace components supplier ST Group in what is expected to be Europe’s first fully on-chain initial public offering, according to a report from CoinDesk. The listing on the Paris-based venue would mark…
Wallet in Telegram now offers 50x perpetual futures on metals, stocks, oil, and crypto via Lighter’s hybrid stack, collapsing messaging, custody, and high-risk derivatives into one mini-app. Telegram’s embedded crypto service Wallet in Telegram has introduced perpetual contract trading inside…
SoFi’s new Big Business Banking platform lets institutions manage fiat, SoFiUSD, and crypto in one Solana-powered, chartered bank stack, targeting wholesale stablecoin settlement flows. SoFi has launched an enterprise banking platform dubbed “Big Business Banking,” allowing institutions to manage fiat…
Crypto mining shifts toward infrastructure and efficiency as Bitcoin stabilizes and institutional demand holds. In 2026, the crypto mining landscape is no longer driven by retail speculation — it’s shaped by infrastructure, efficiency, and accessibility. Over the past quarter, Bitcoin…
Vitalik Buterin has called for a shift to a “local-first” approach to artificial intelligence. He said modern AI tools pose serious privacy and security risks. In a recent blog post, he said AI is moving beyond simple chat tools. Newer…
Drift Protocol, a major Solana-based DeFi exchange, has suffered a $285 million social engineering-driven exploit that weaponized a compromised administrator key rather than any code flaw. Drift Protocol, a decentralized exchange built on Solana, was drained of approximately $285 million…
Need to know what happened in crypto today? Here is the latest news on daily trends and events impacting Bitcoin price, blockchain, DeFi, NFTs, Web3 and crypto regulation.


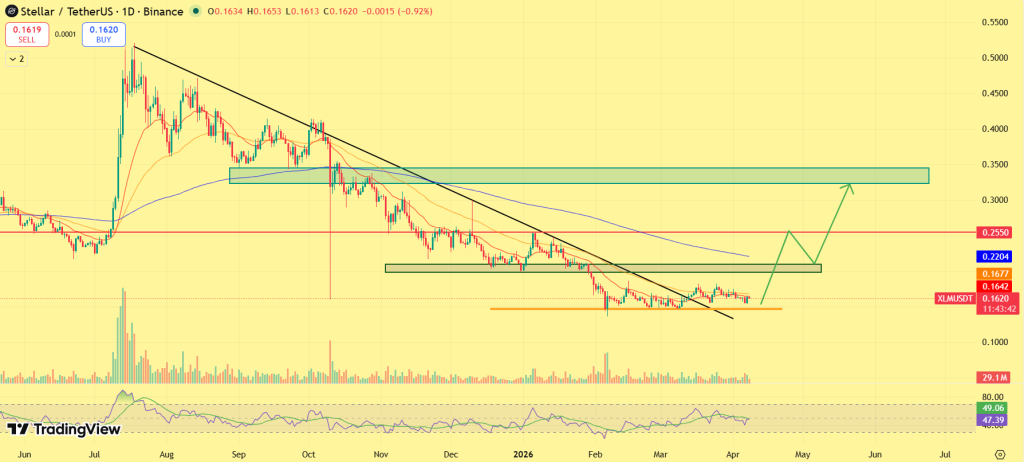
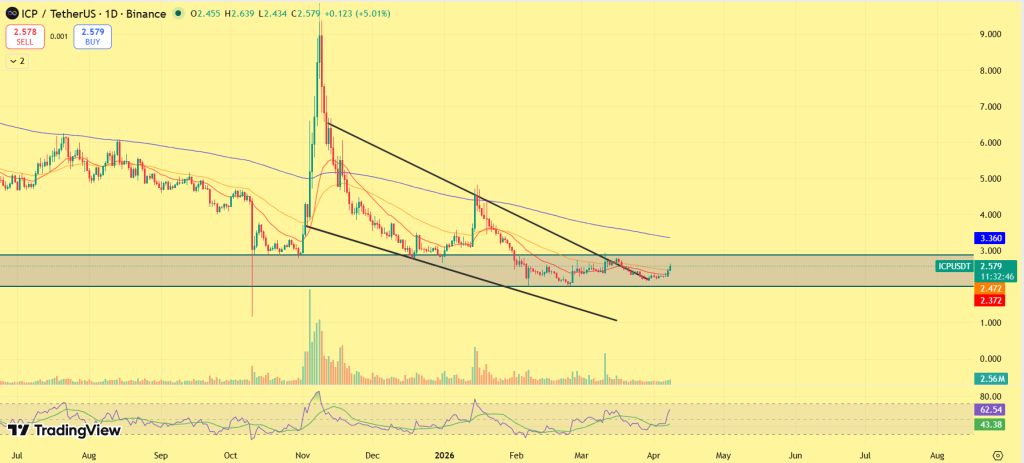


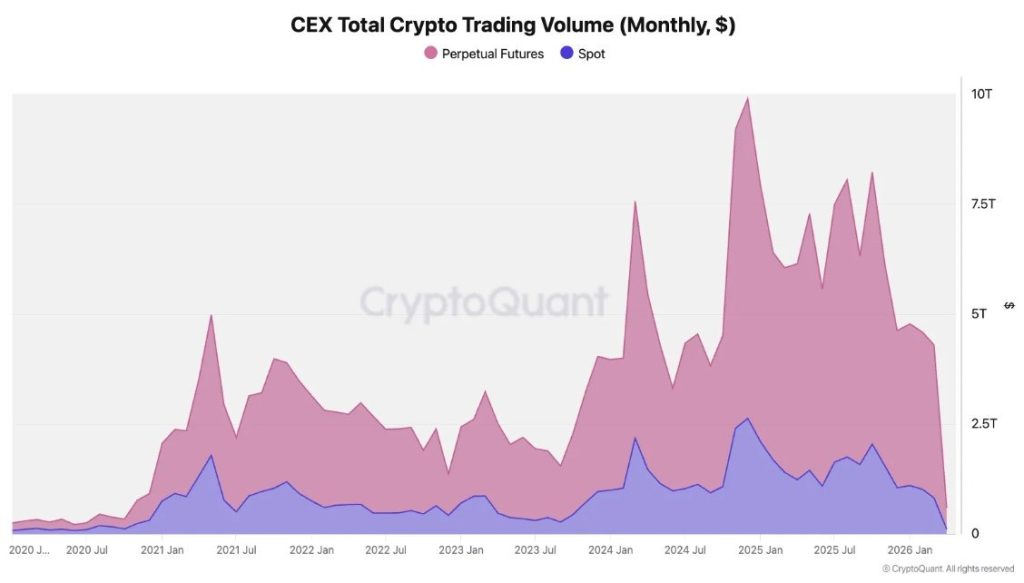
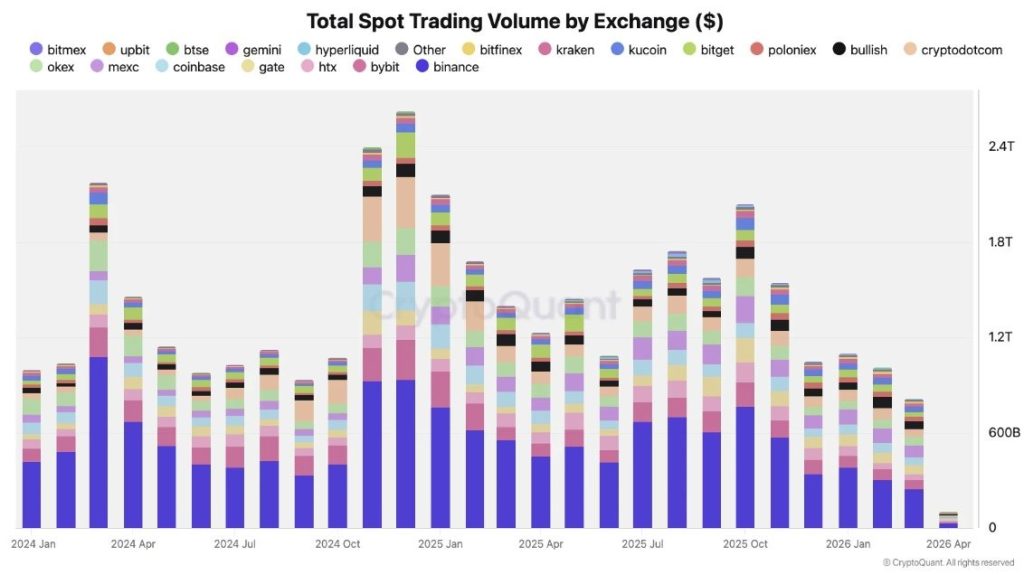
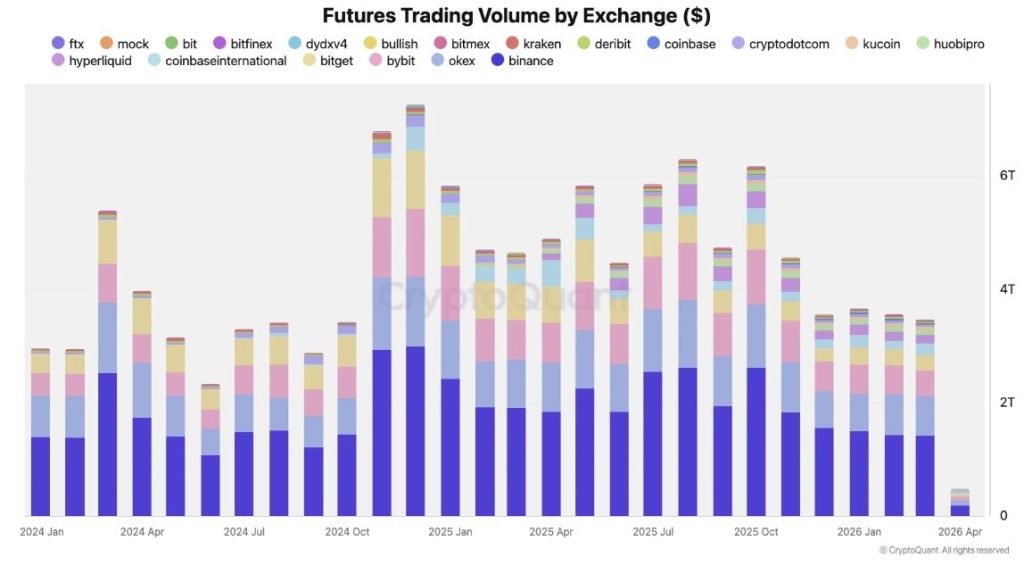
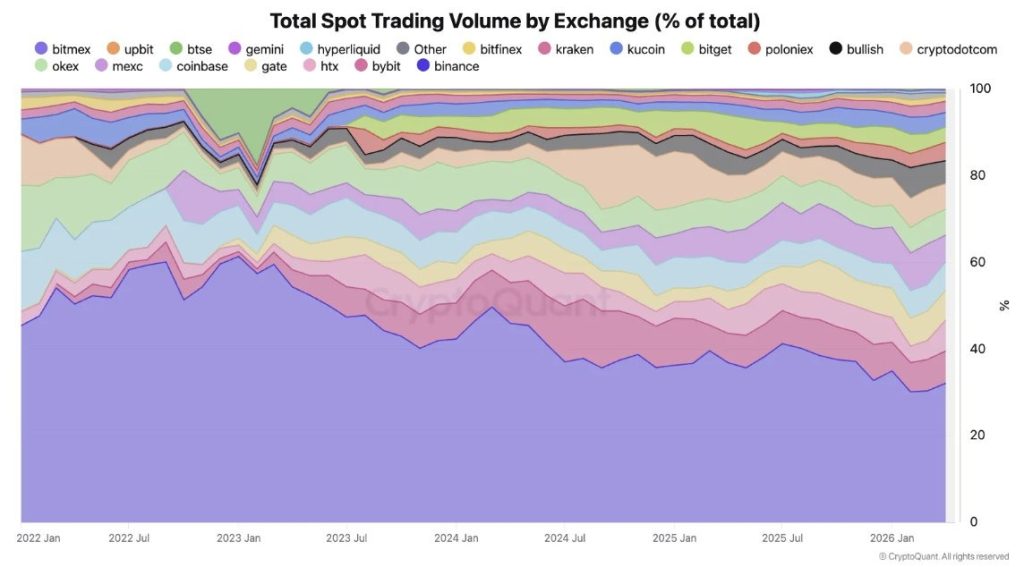


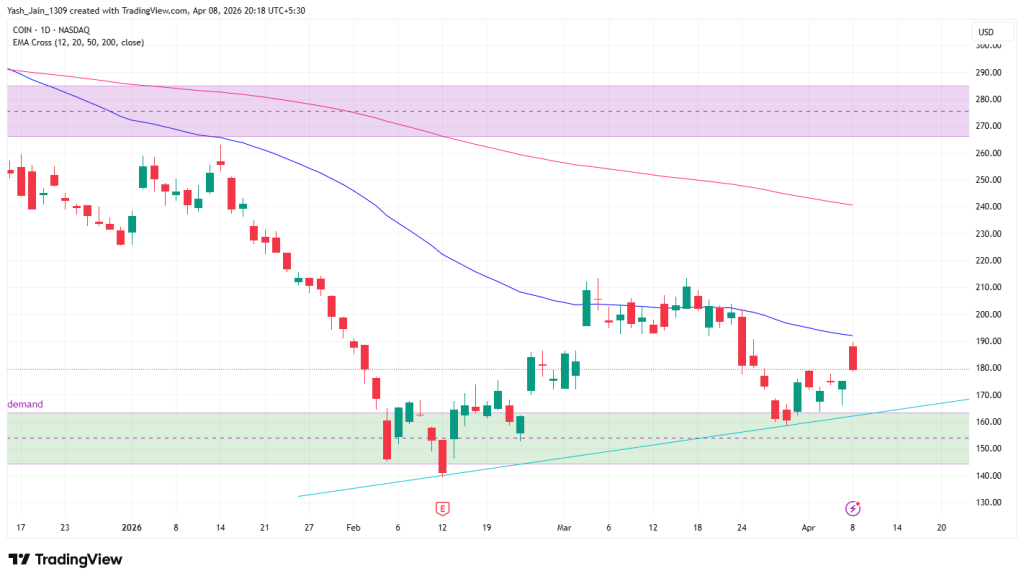
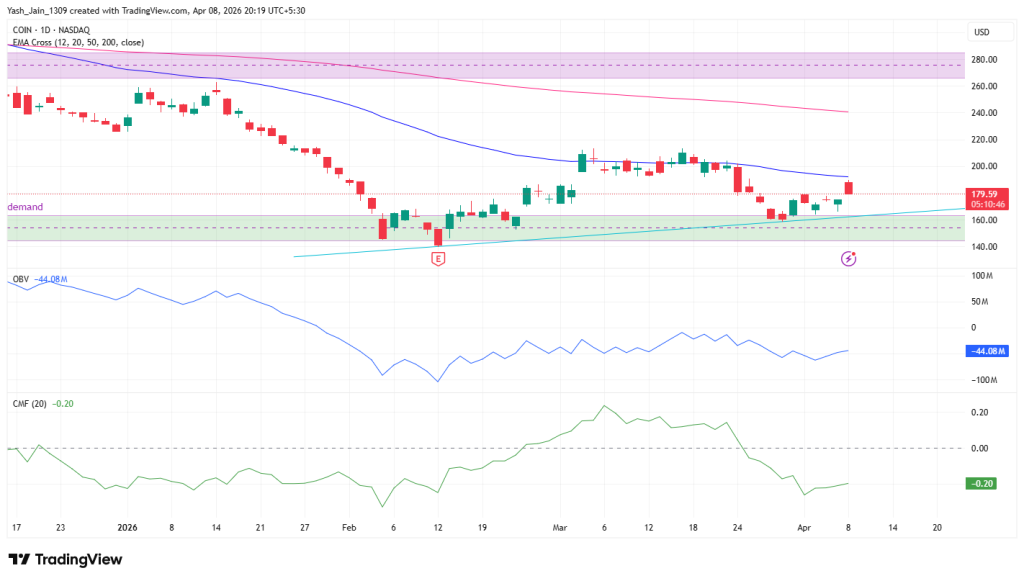
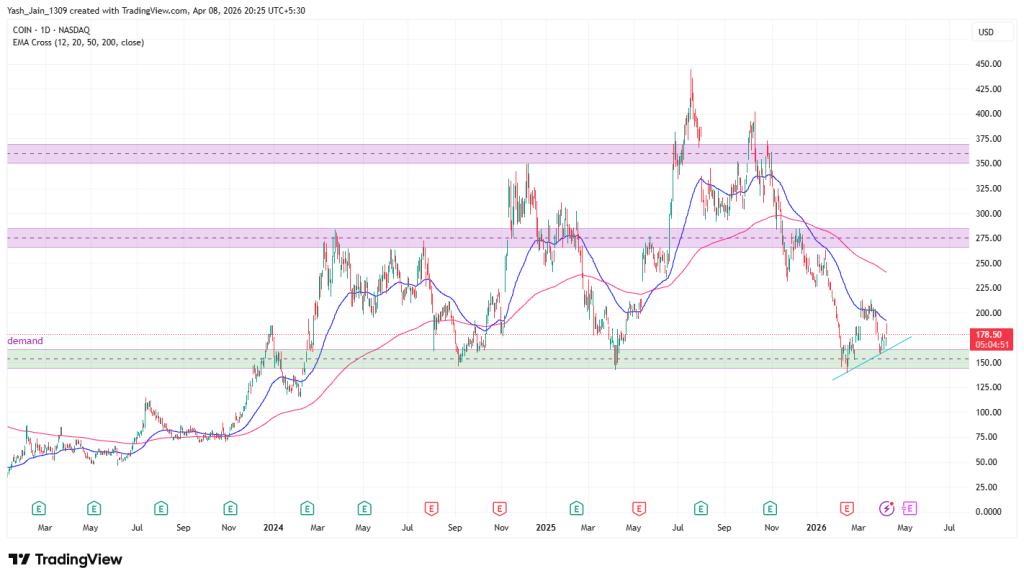
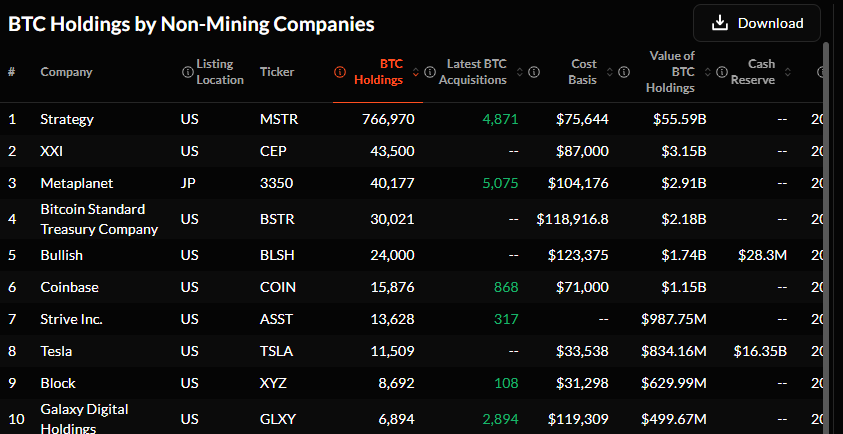
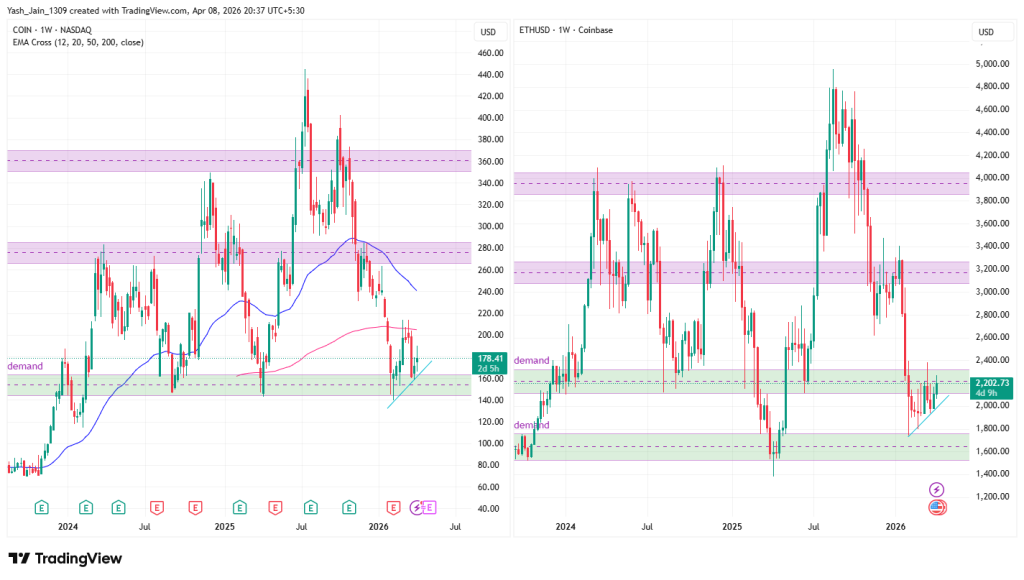
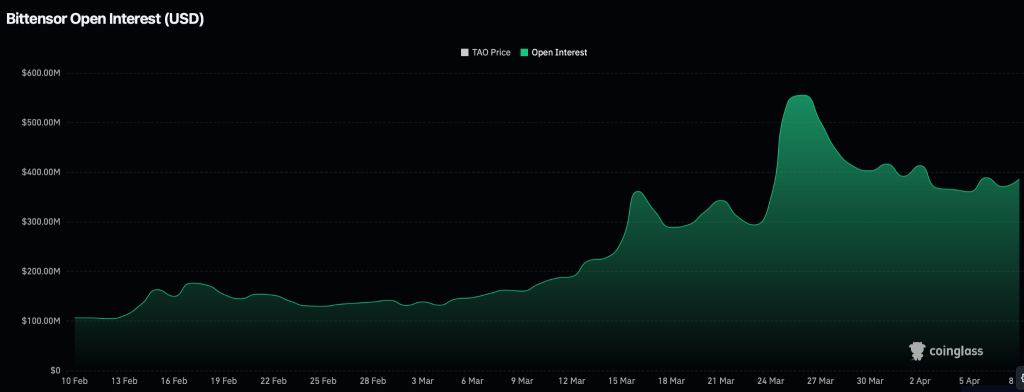
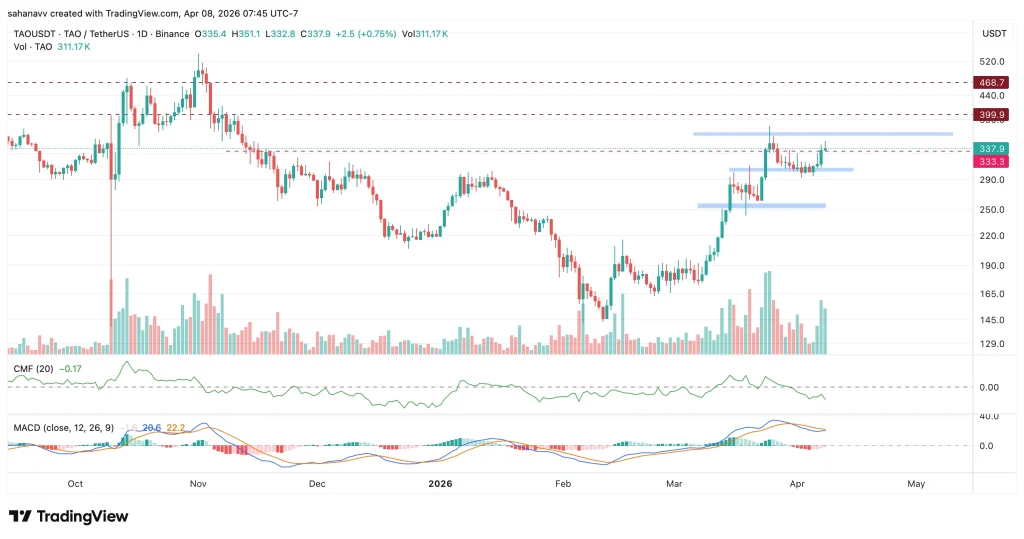

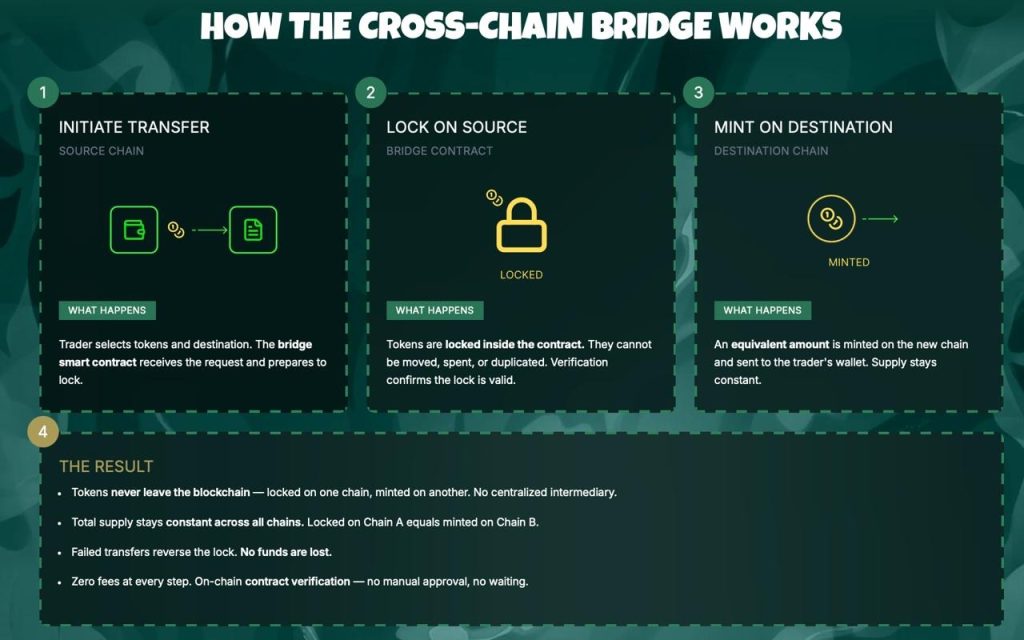


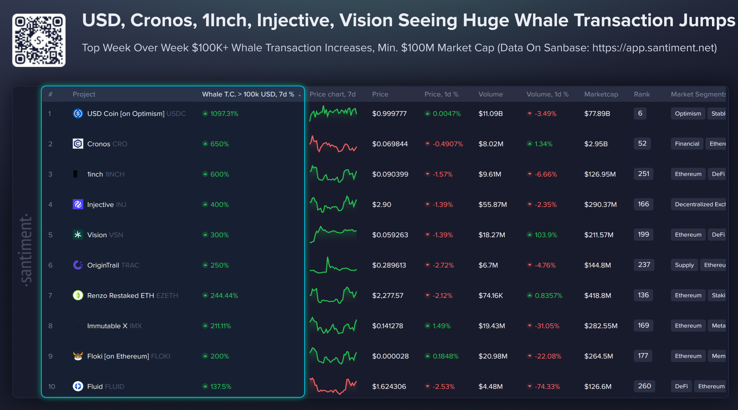
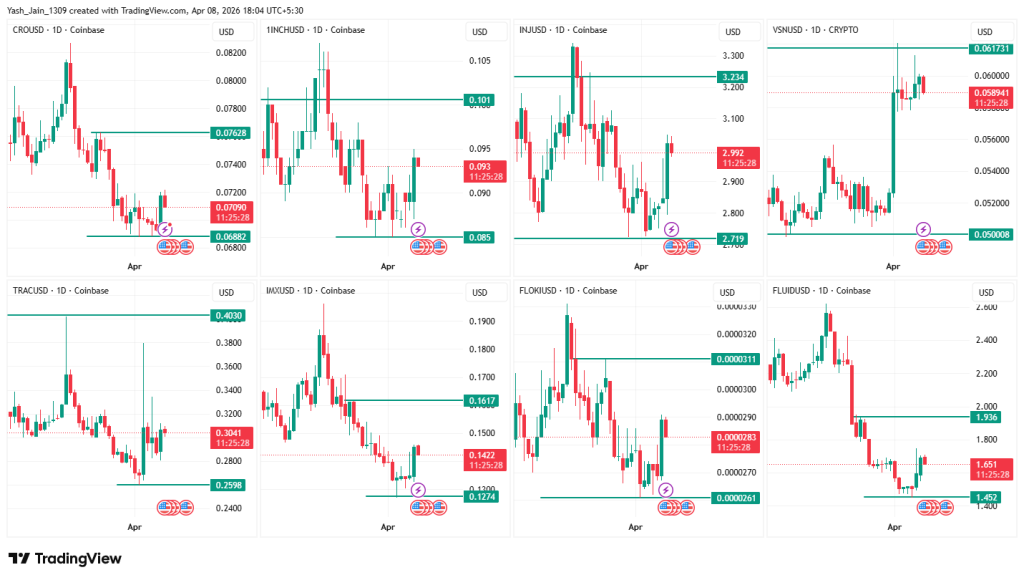

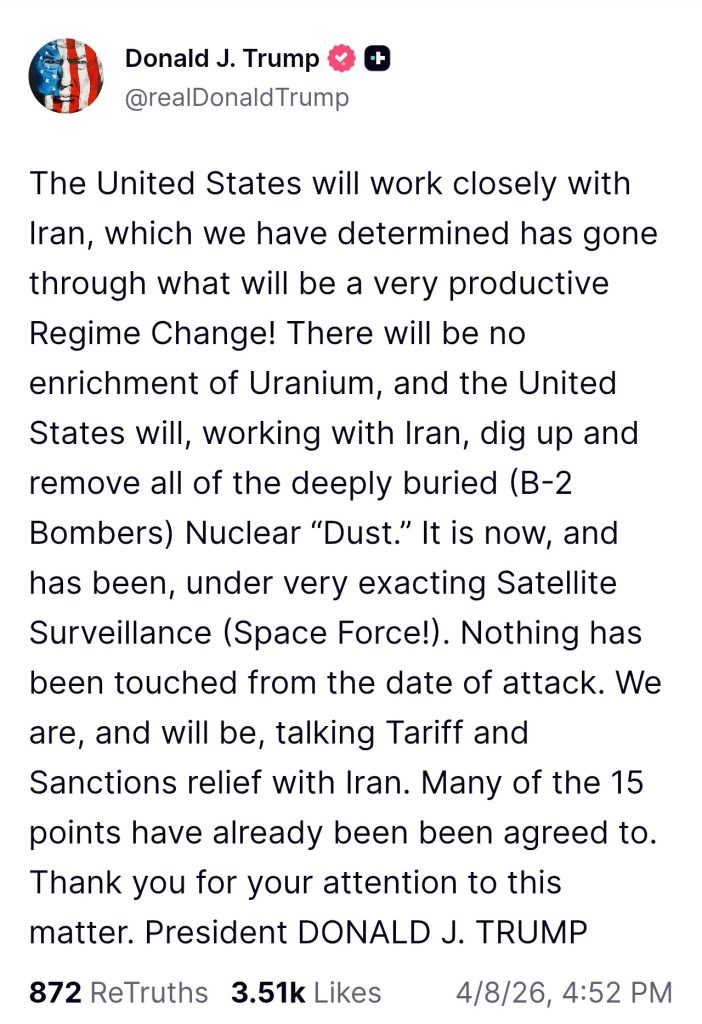
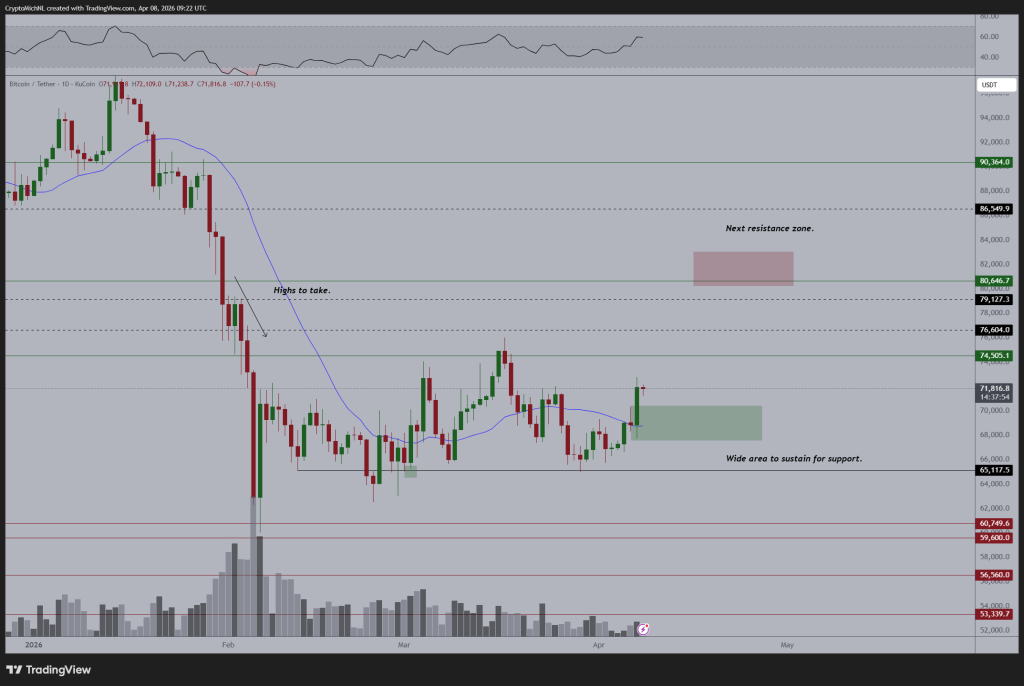
 BREAKING:
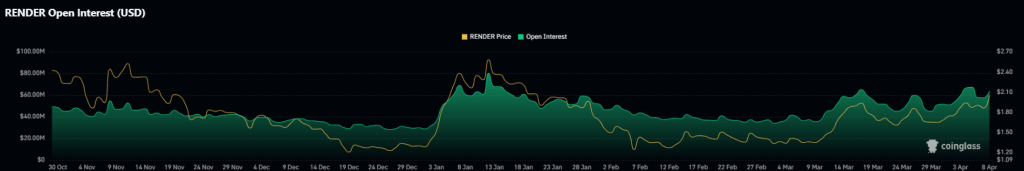
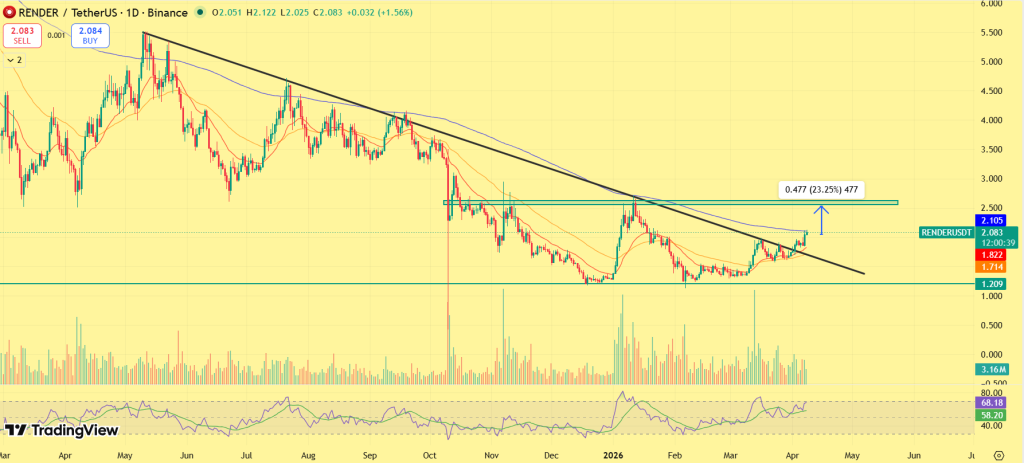

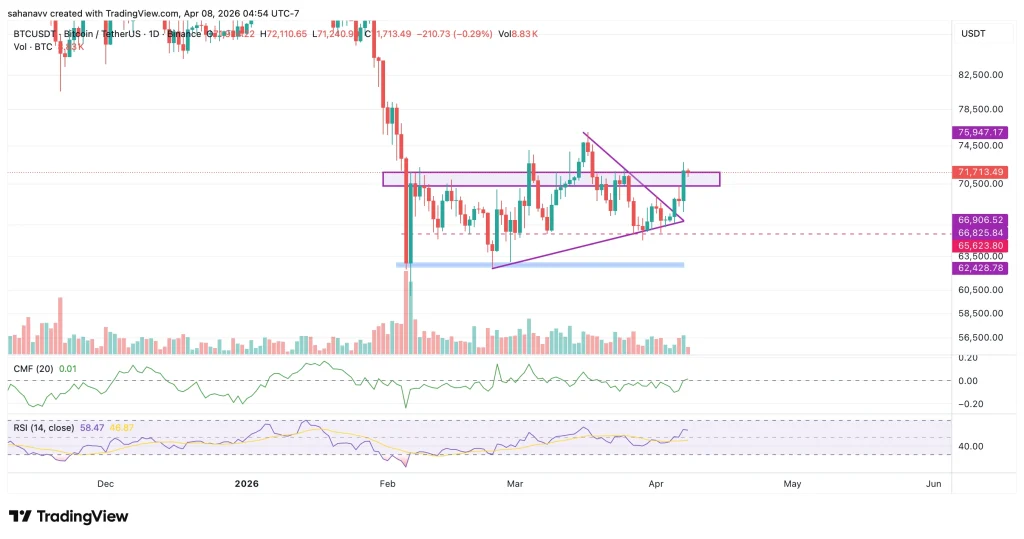
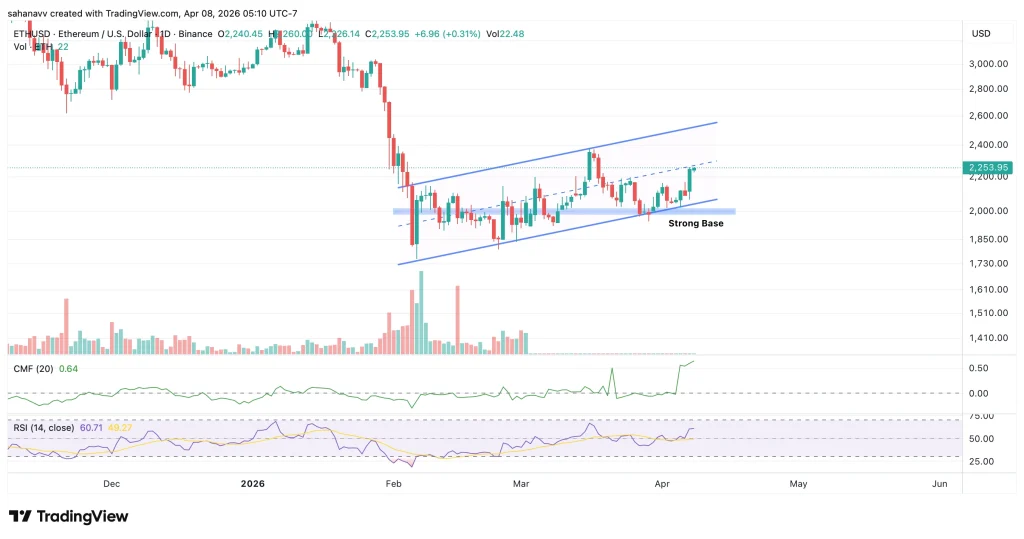


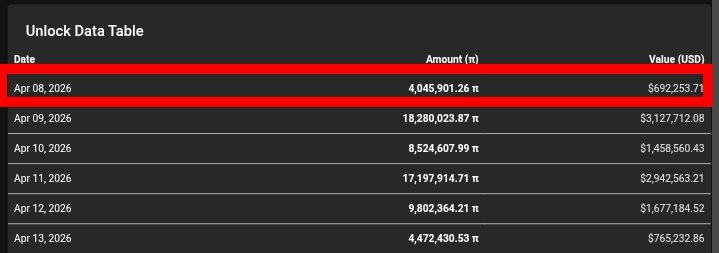
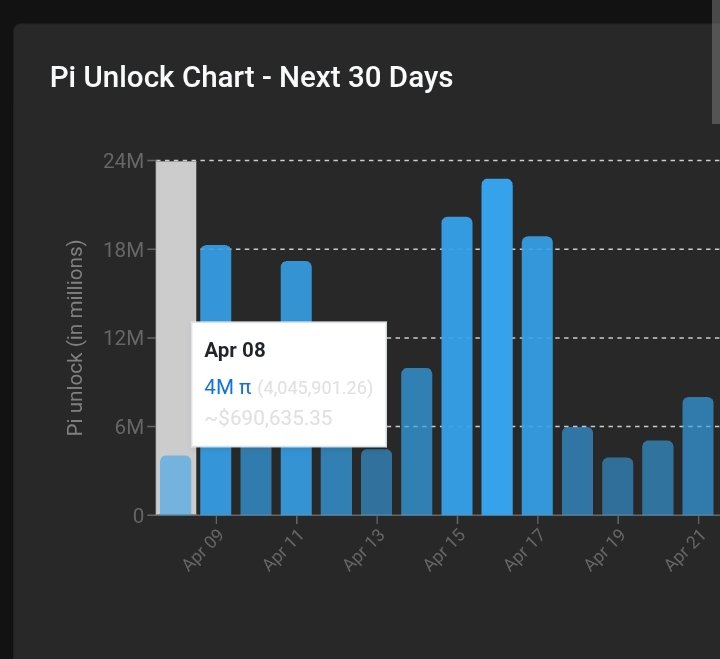
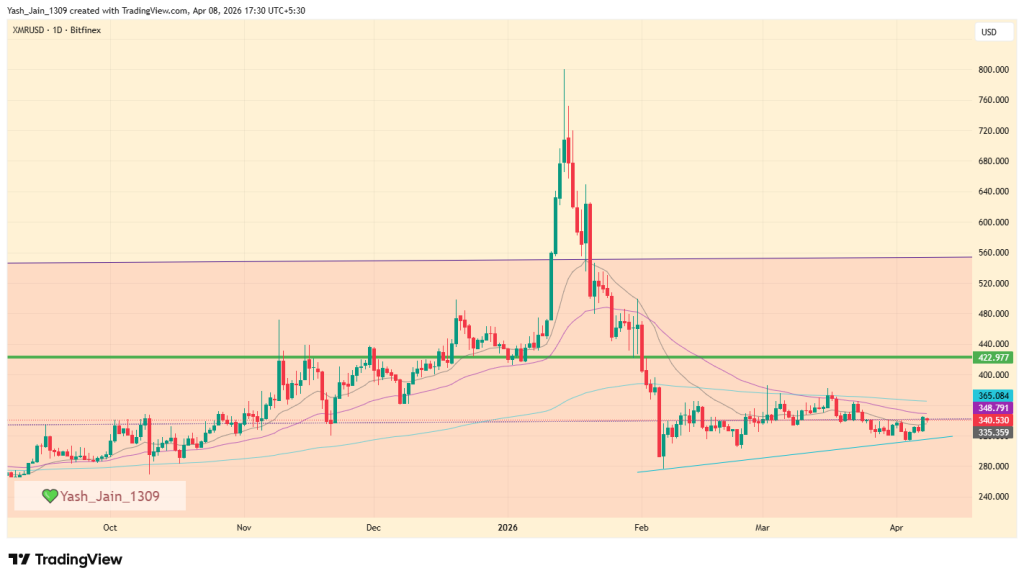
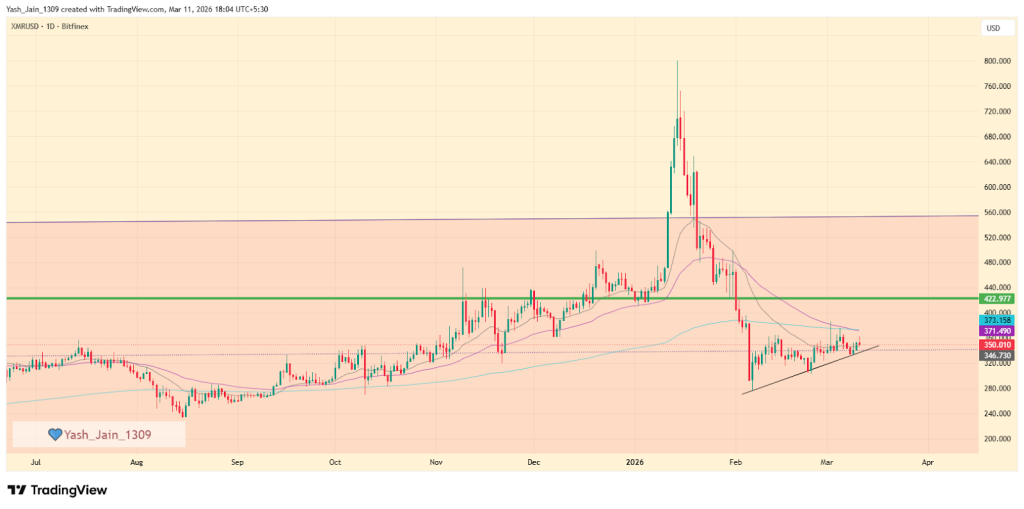
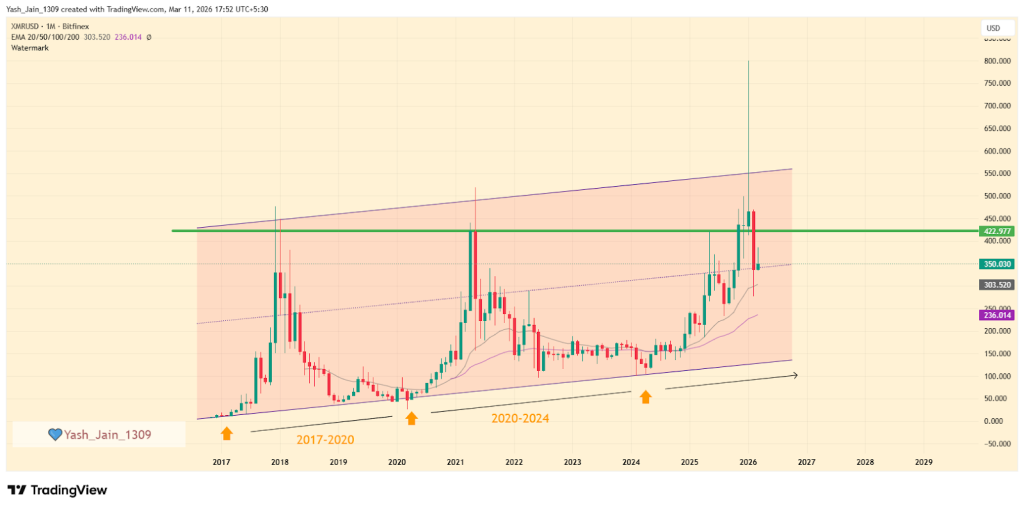
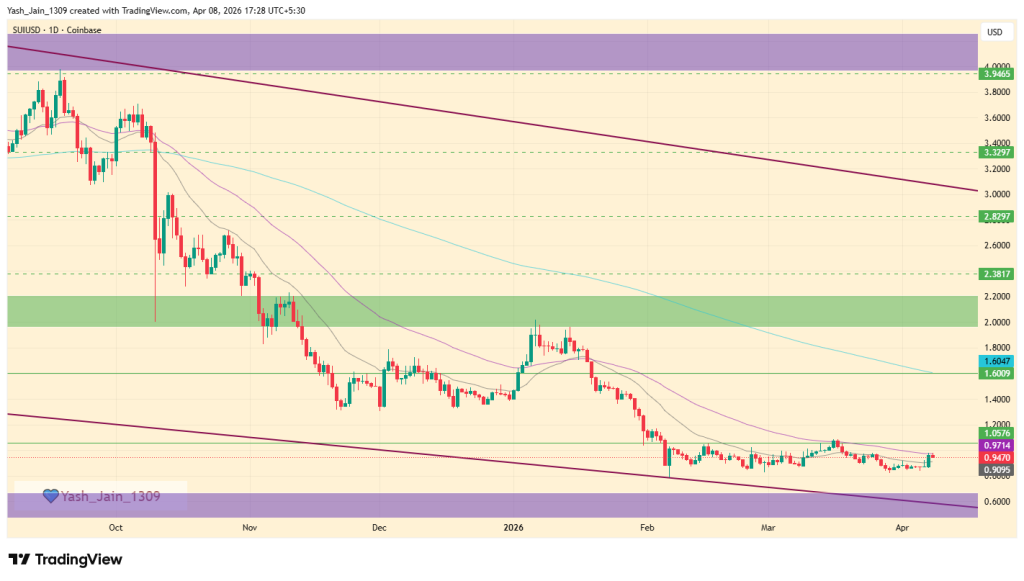
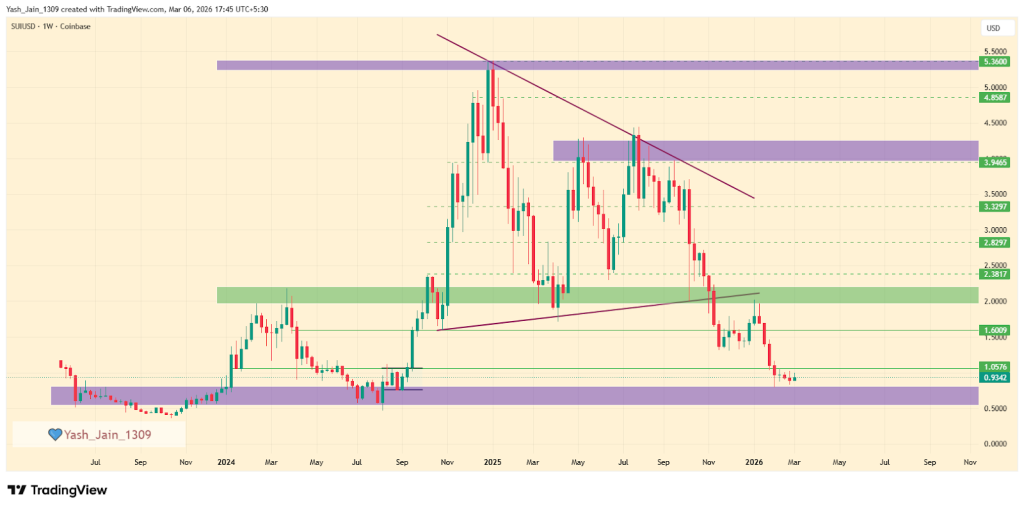
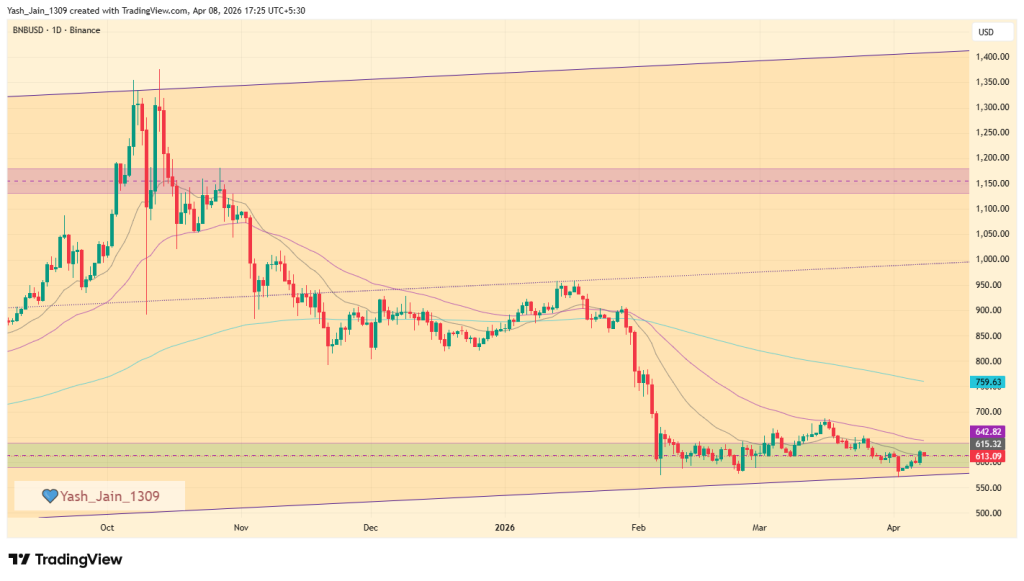
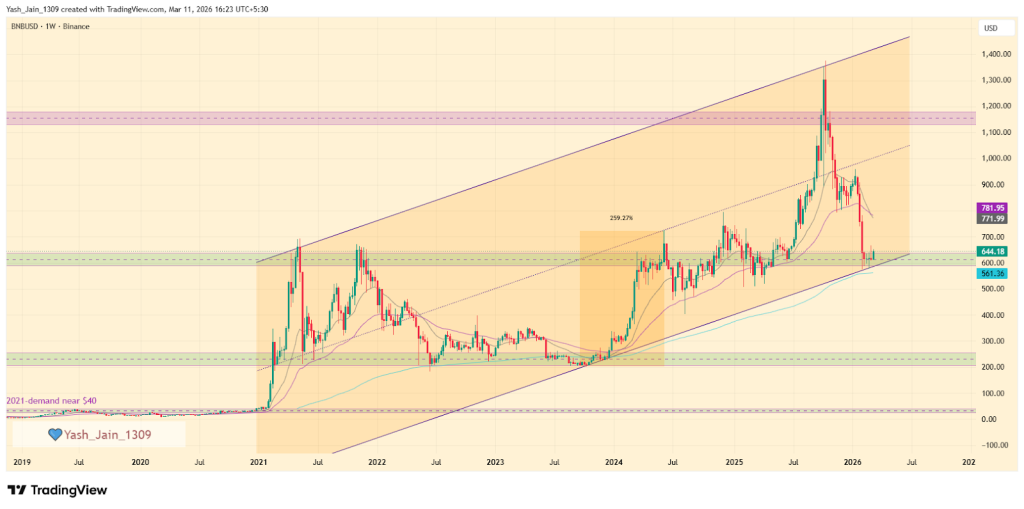
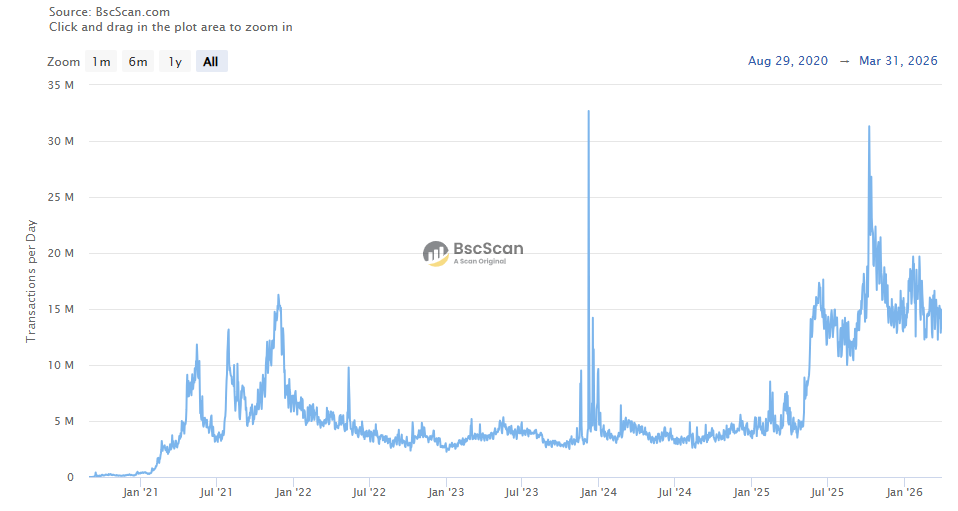


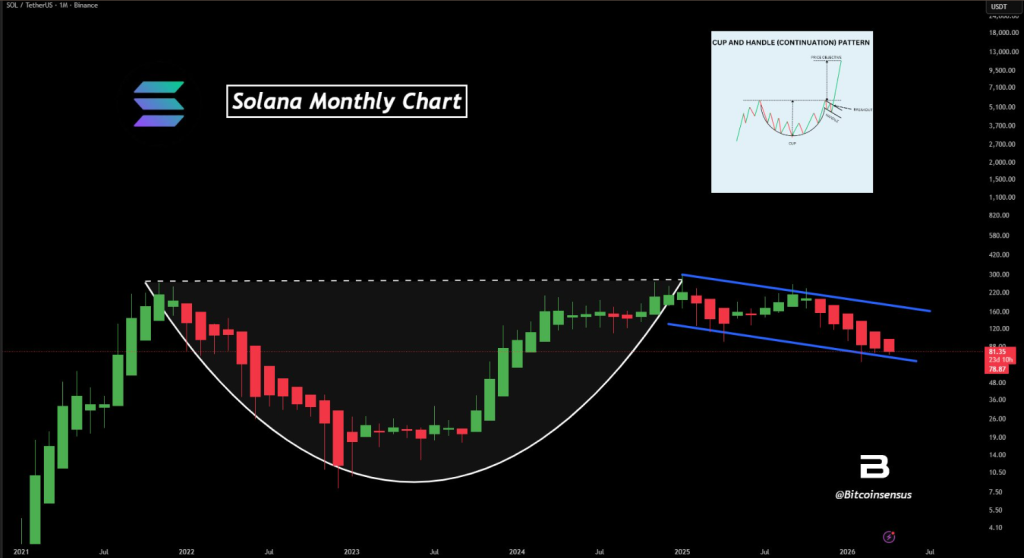
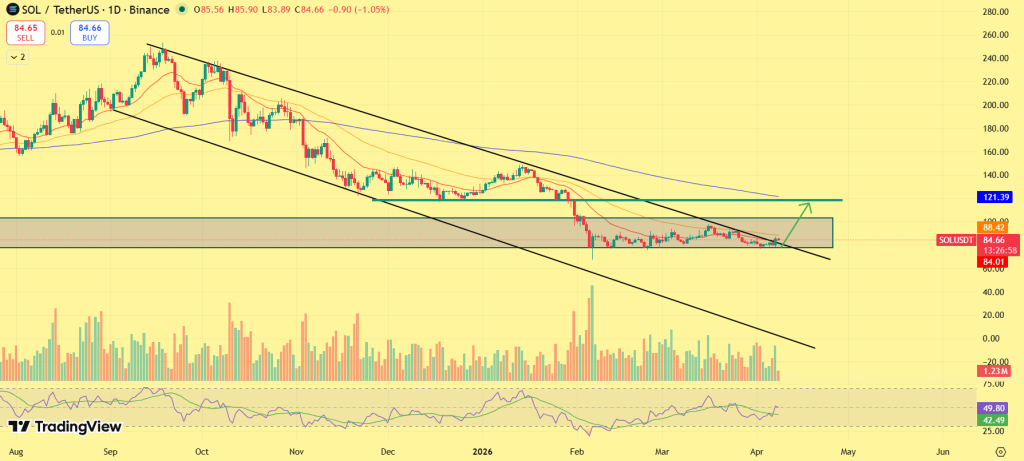


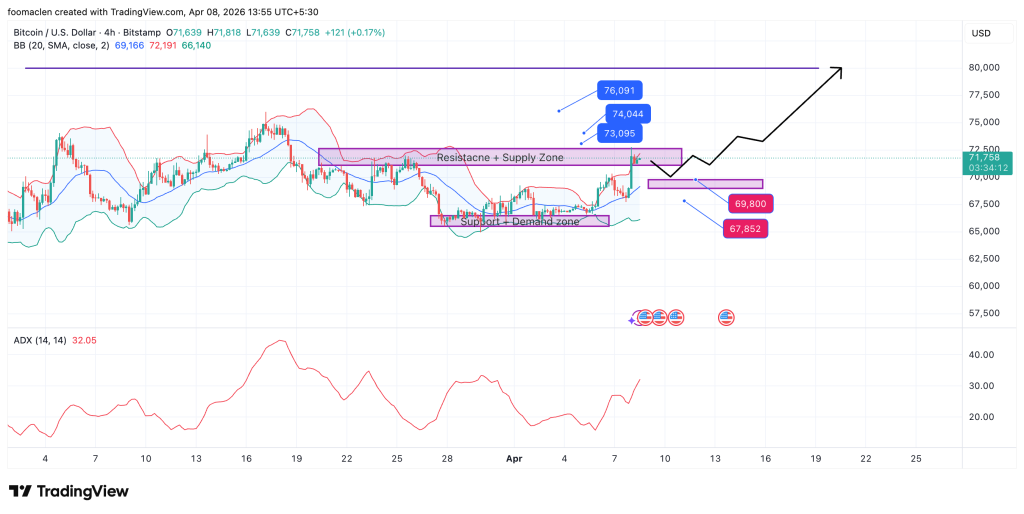
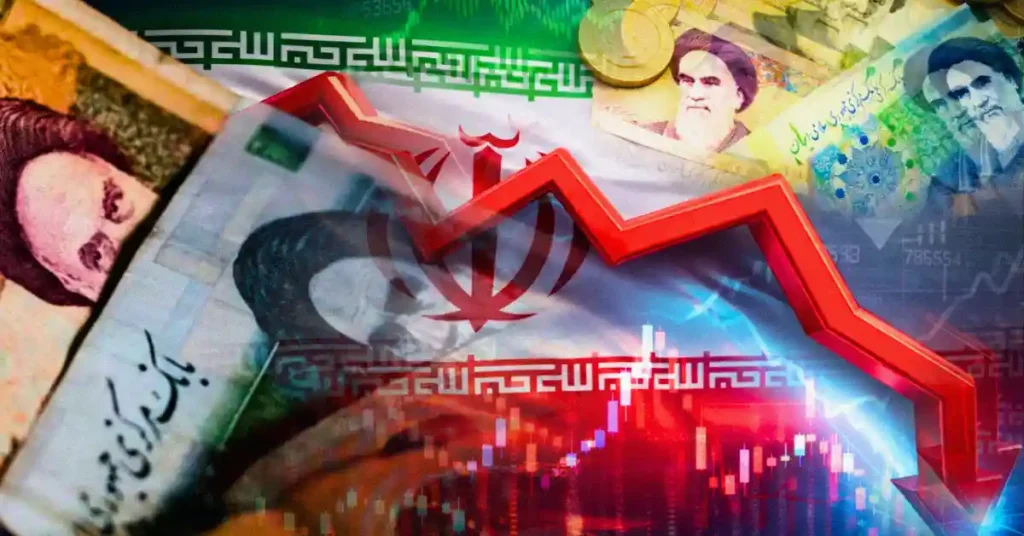
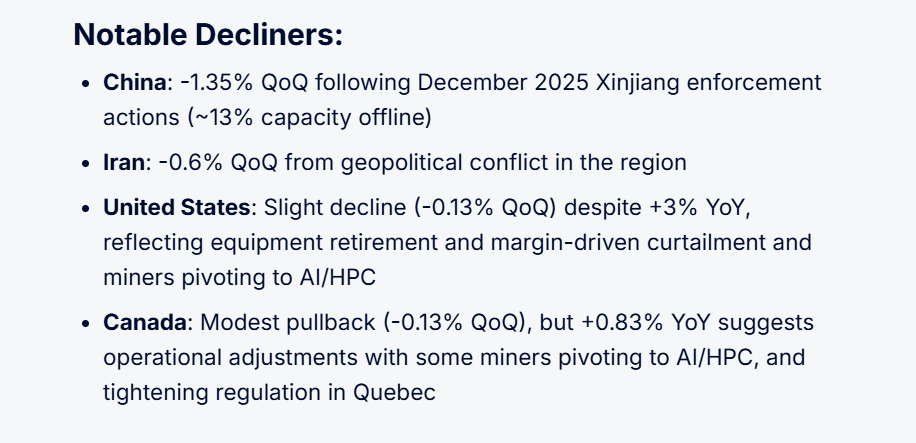
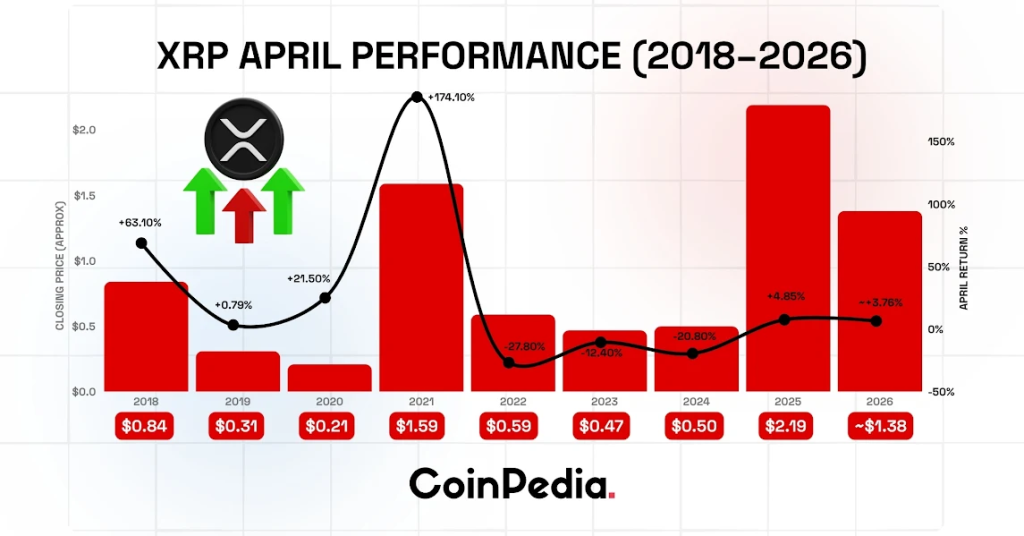


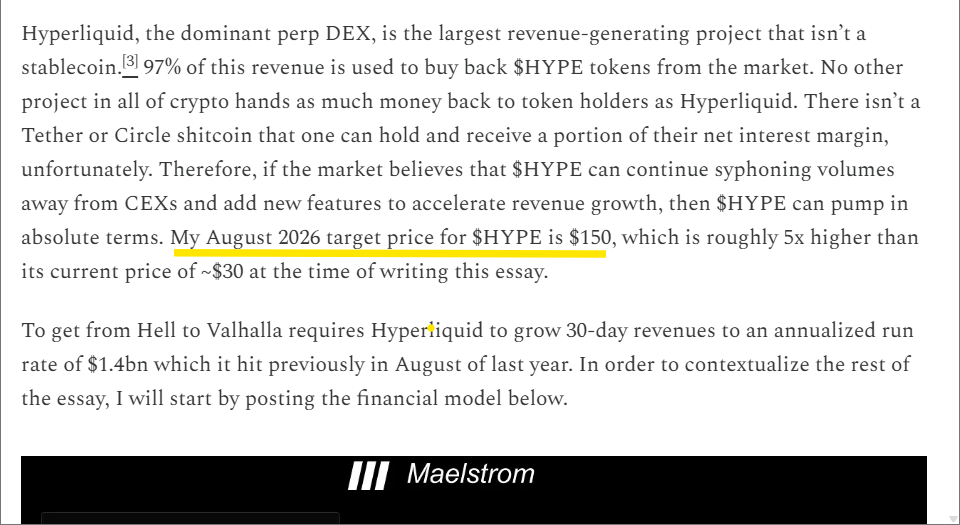
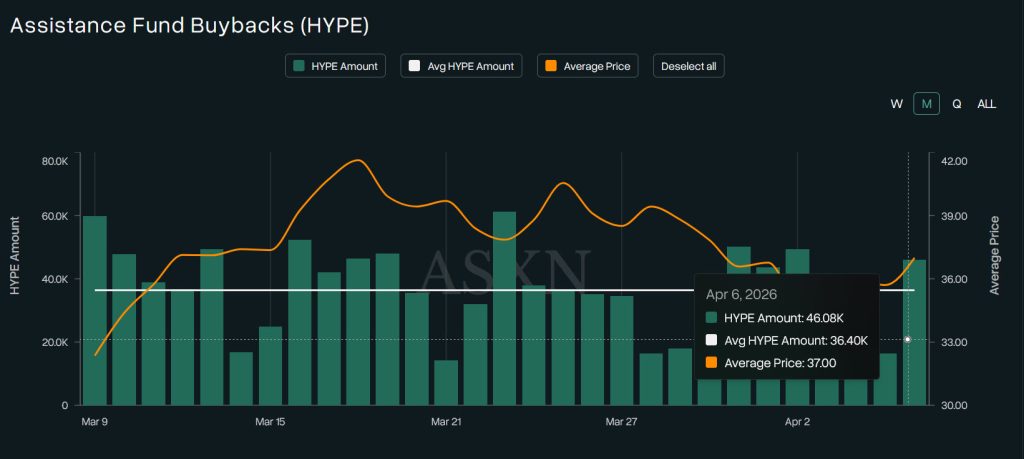

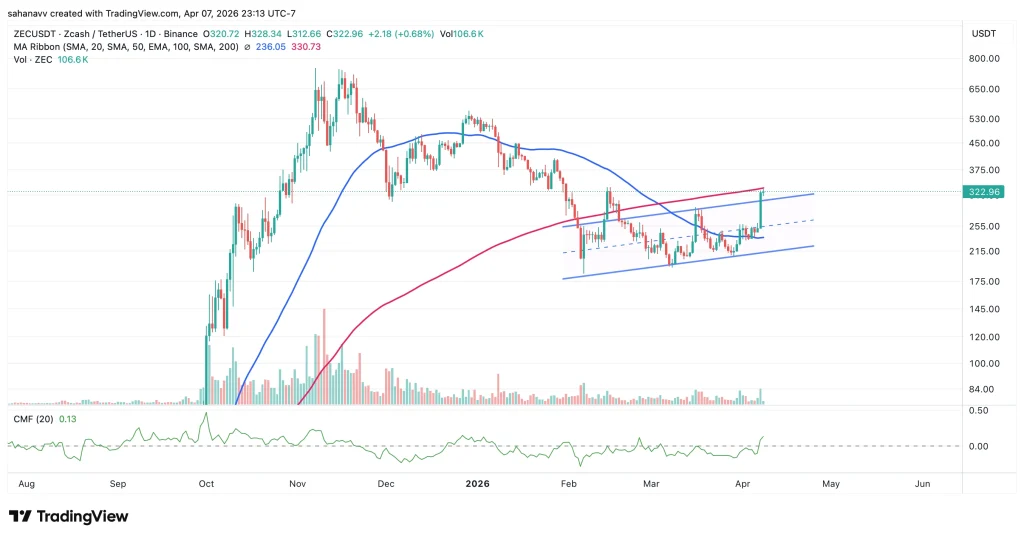
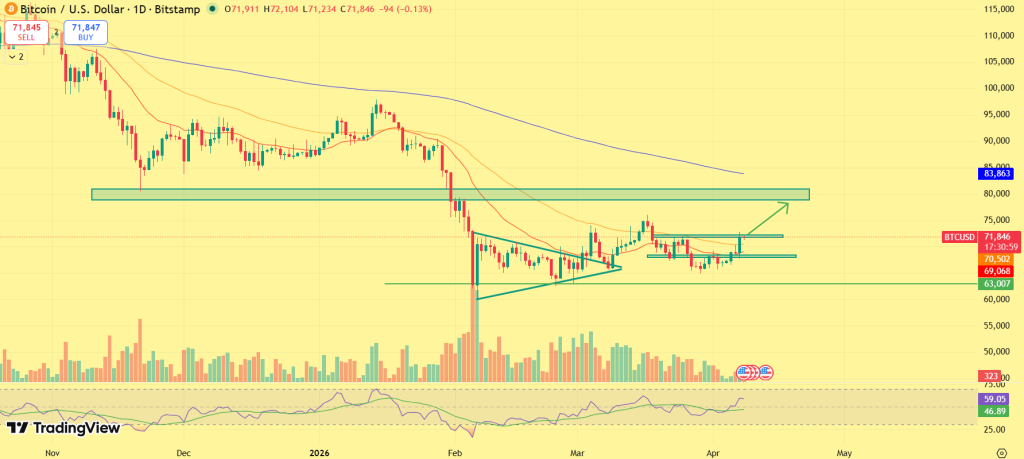
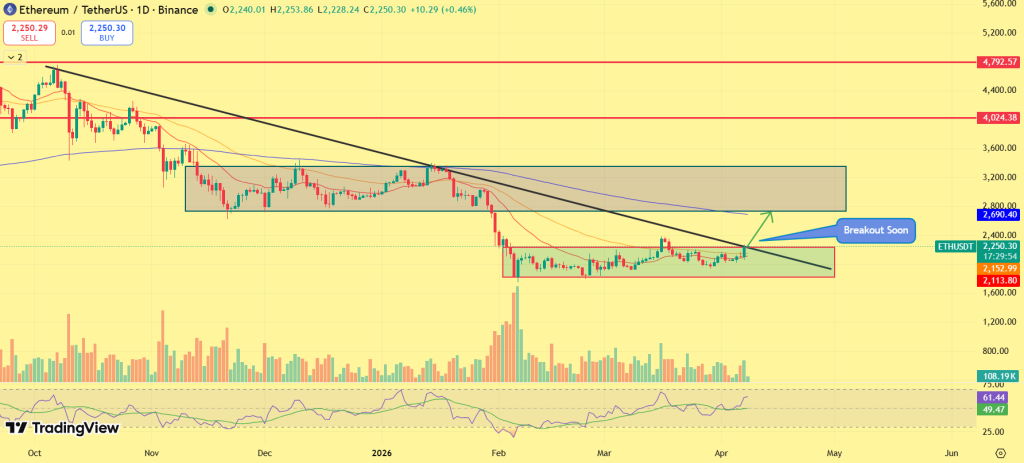
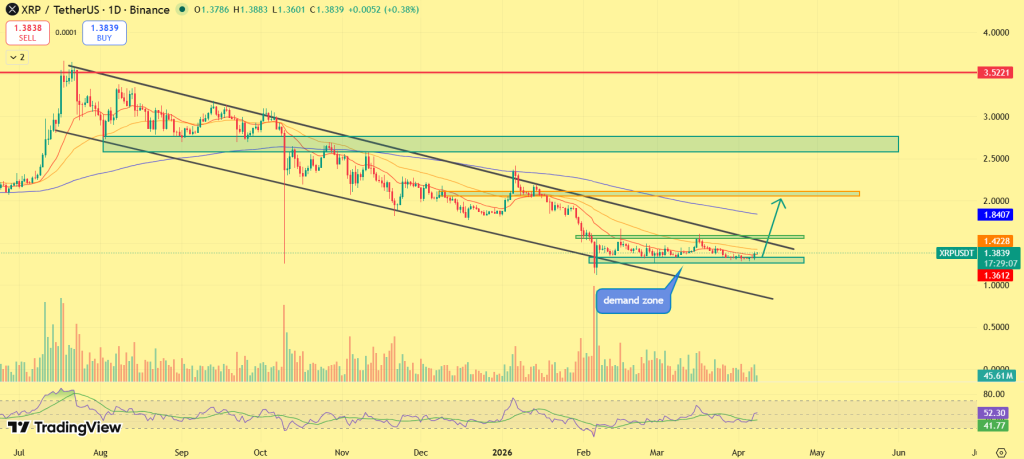


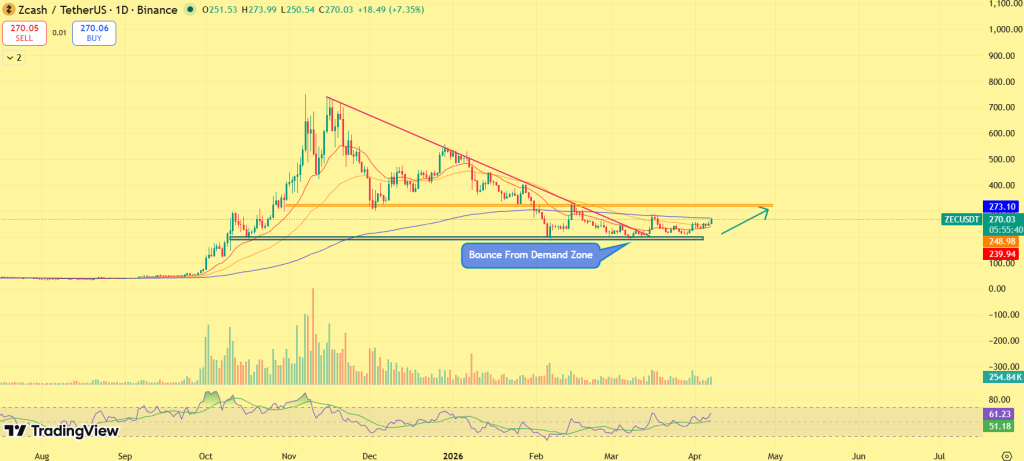
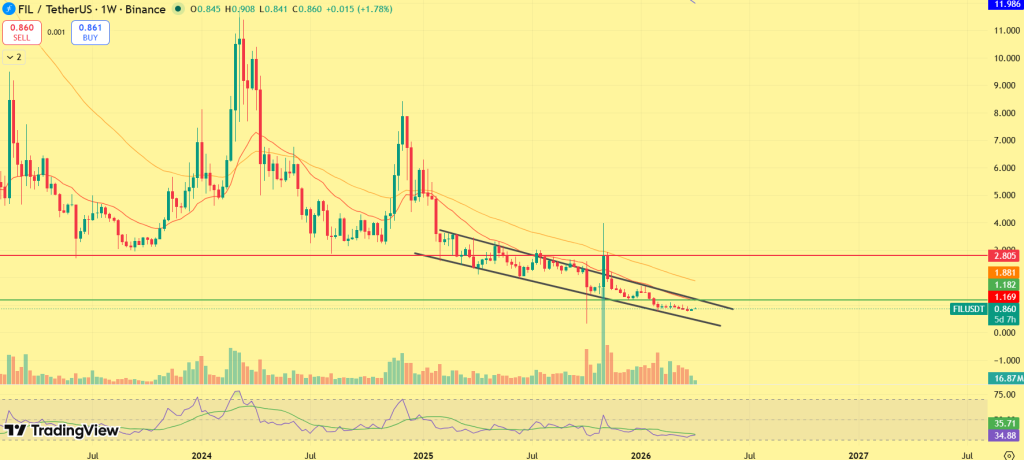


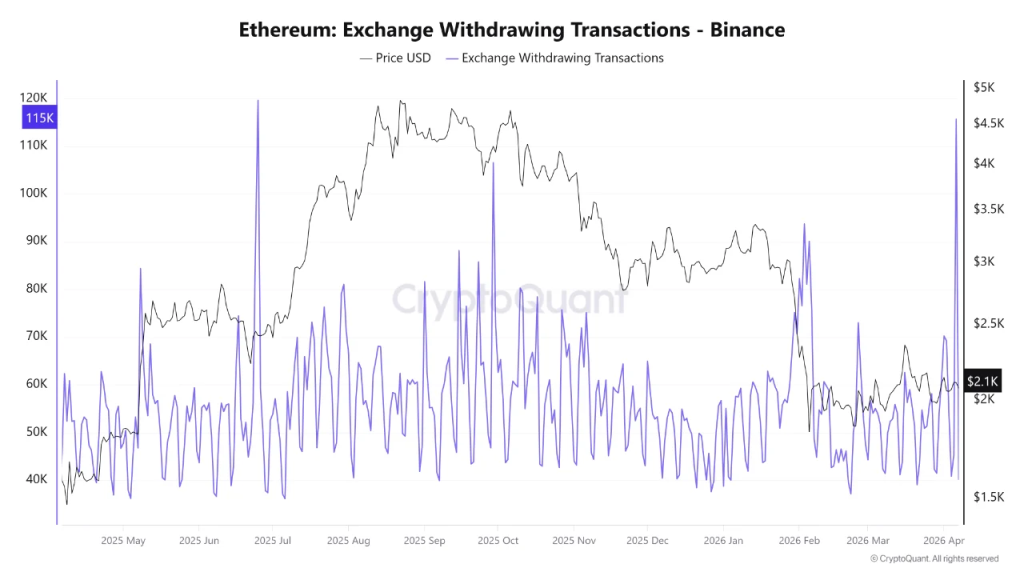
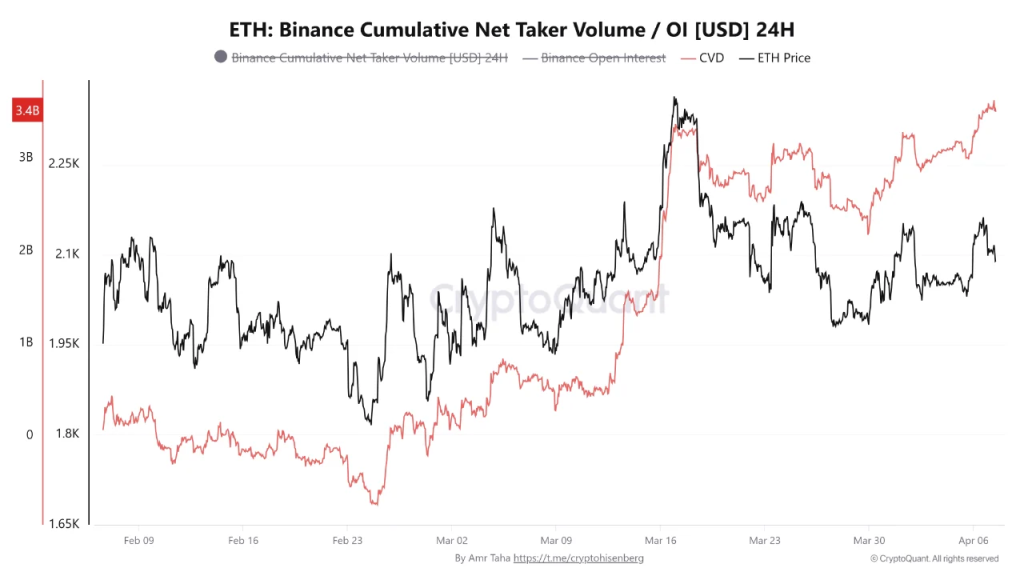

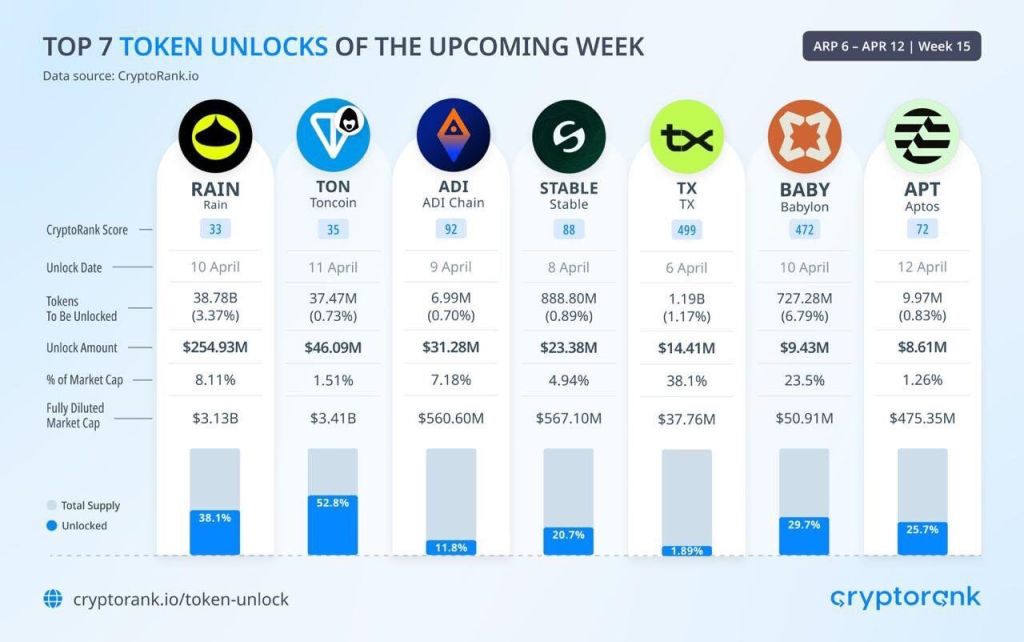
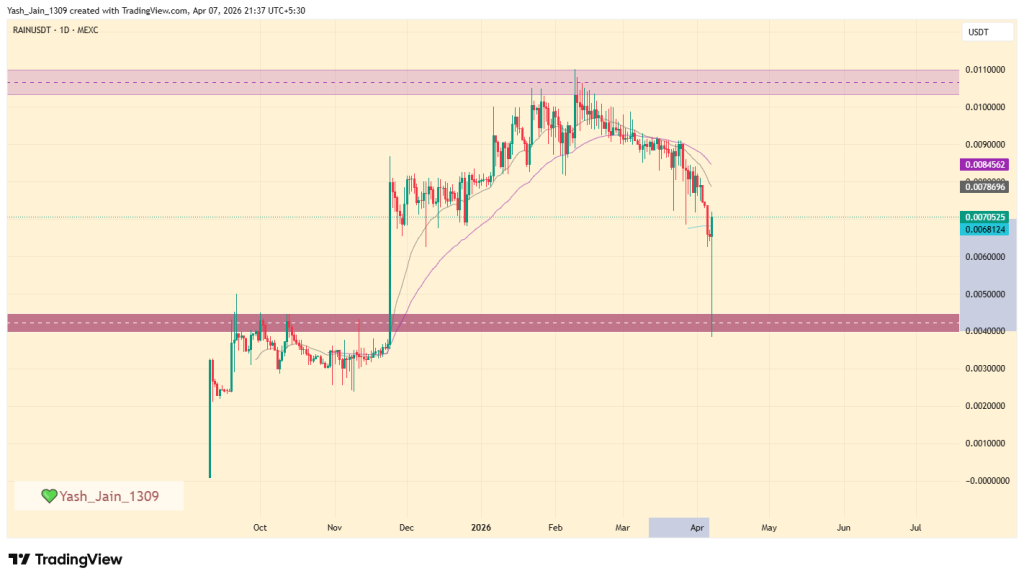
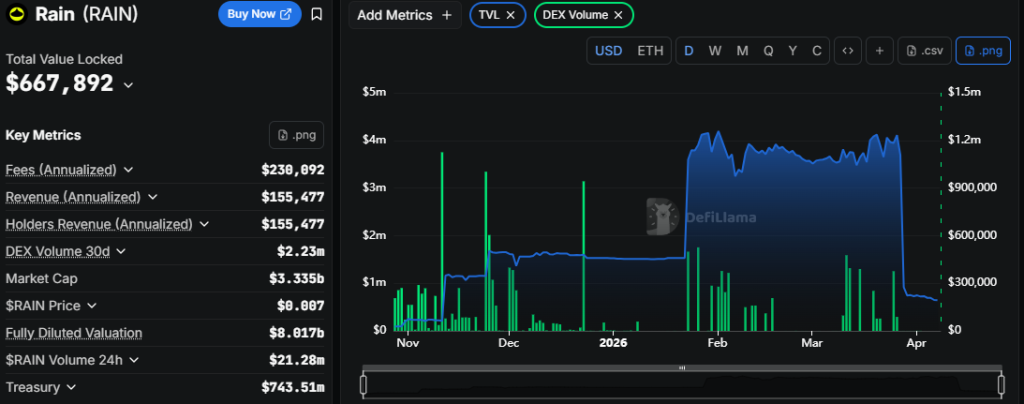


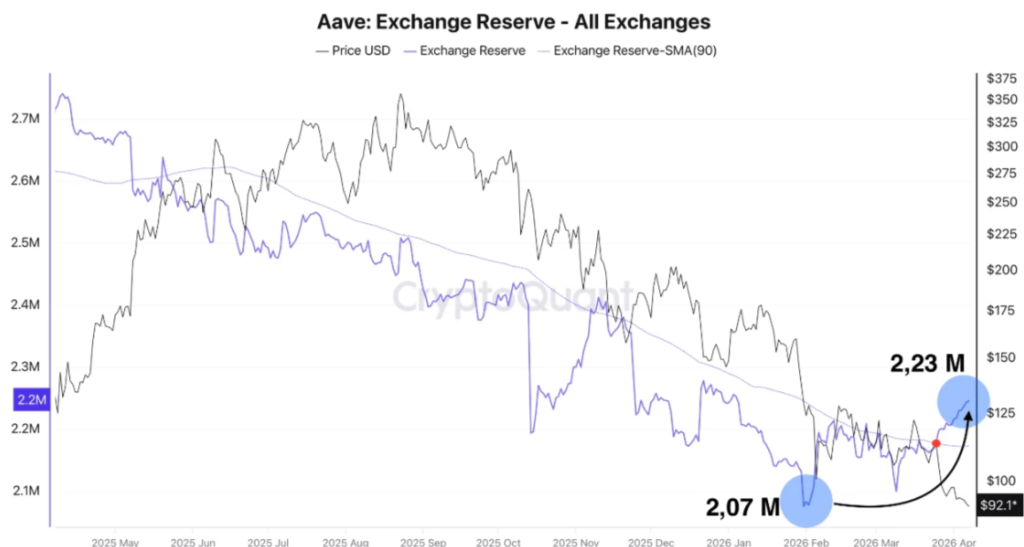
 JUST IN: CHAOS LABS TERMINATES AAVE ENGAGEMENT AFTER 3 YEARS DUE TO RISK MANAGEMENT
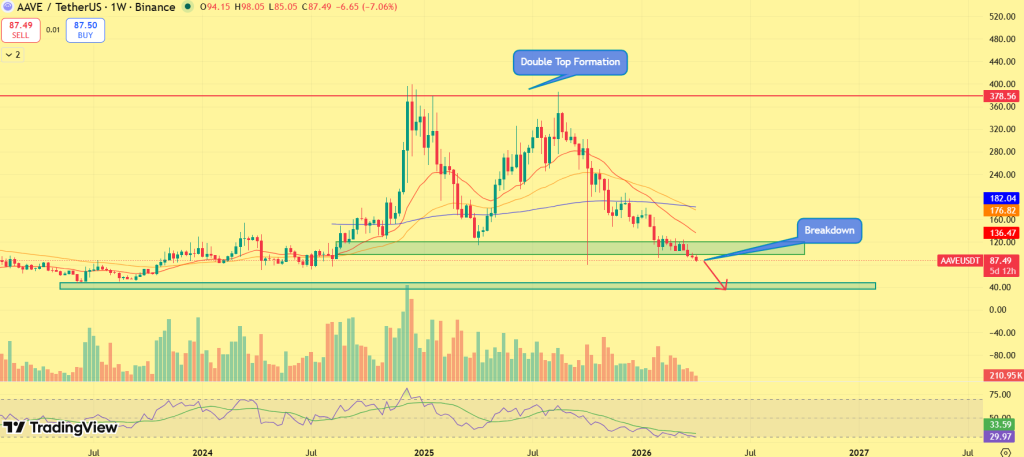


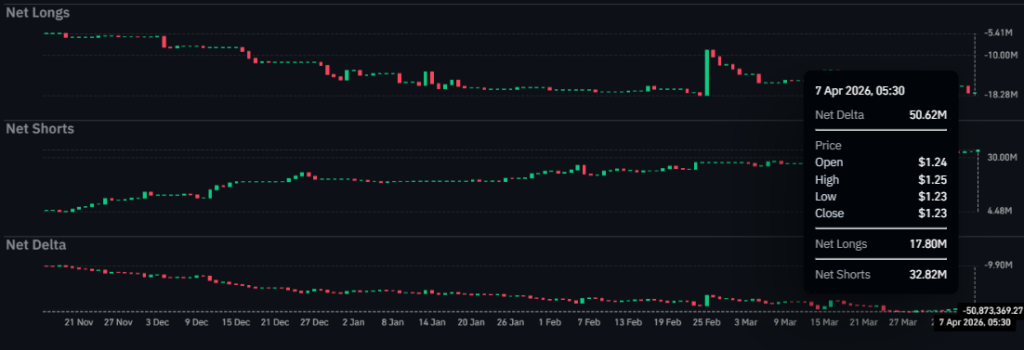
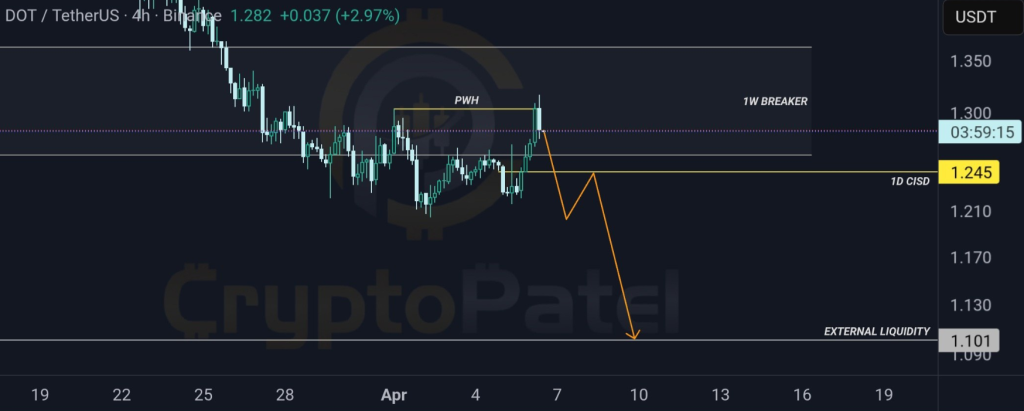


 Cardano's number of wallets holding at least 10M