Jack Dorsey’s Block to cut 4,000 jobs in AI-driven restructuring

In a shareholder letter, Dorsey said he expects other companies to follow suit soon and reduce headcount in the wake of AI advancements.
In a shareholder letter, Dorsey said he expects other companies to follow suit soon and reduce headcount in the wake of AI advancements.

Bitcoin bulls are chasing after $70,000 but cautious signals from the futures and derivatives market could explain why success remains elusive.

The post Investigator Reveals Year-long Insider Trading at Axiom DEX Platform appeared first on Coinpedia Fintech News
On Thursday, crypto investigator ZachXBT published an exposé in which he accused employees at Axiom decentralized exchange (DEX) of conducting insider trading since early 2025.
According to the ZachXBT report, Axiom staff members utilized their unrestricted access to internal company tools to conduct the fraud. The employees researched, tracked, and compiled financial information from the private wallets of key opinion leaders in the crypto industry. Several persons whose wallet information had been leaked via screenshots corroborated this narrative, as stated in the report.
The investigation further details a conspiracy involving an employee named “Broox”, where another co-conspirator was set to profit $200,000 from insider trading. ZachXBT notes that precise evidence of such happenings would require access to Axiom’s employee logs.
1/ Meet @WheresBroox (Broox Bauer), one of the multiple @AxiomExchange employees allegedly abusing the lack of access controls for internal tools to lookup sensitive user details to insider trade by tracking private wallet activity since early 2025. pic.twitter.com/KwICQMJL1q
— ZachXBT (@zachxbt) February 26, 2026
Following its debut in 2024, Axiom quickly gained traction due to its focus on crypto meme coins and perpetuals. Its revenues to date are now over $390 million, and it is ranked the second-best revenue-generating dApp on Solana with $15.36 million in monthly revenue.
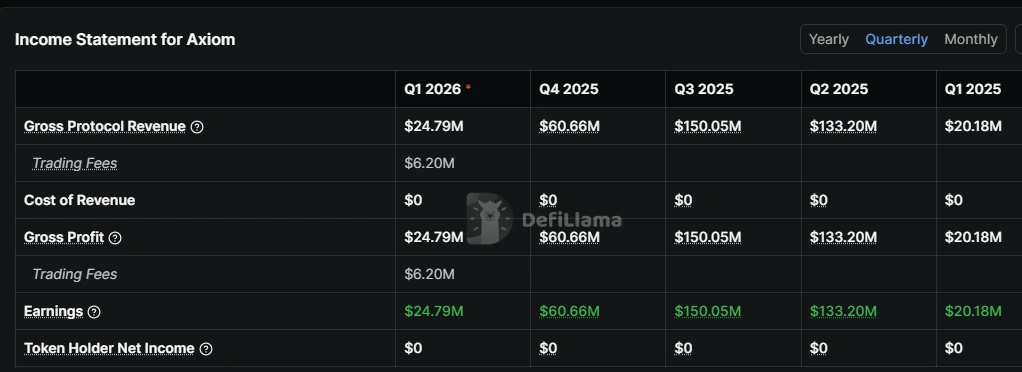
Source: DefiLlama
Regarding the recent investigation, Axiom has expressed disappointment in employee misconduct, adding that it has removed access to the tools enabling insider trading.
On Polymarket, the title “Which crypto company will Zach XBT expose for insider trading?” saw $27.6 million in trading volume prior to the investigation’s release. One trader even made a $39K profit from the same, which ZachXBT said could be one of the investigation’s informants.
The Axiom investigation is one among many that reveal potential insider trading within crypto platforms. Another prominent case is that of Jane Street, in which the company was accused of market manipulation and insider trading, leading to the Terra-Luna collapse.
Observers have pointed out the possibility of algorithmic 10:00 am dumps by the company, in addition to possible involvement in the October 10 flash crash. The latter shook the crypto industry, with the blame still shifting from Binance to Wintermute to some offshore macro hedge fund. However, Bitwise CIO Matt Hougan believes the recent market volatility is just a classical crypto winter.

The industry-supported Promoting Innovation in Blockchain Development Act could be a solution by Congress to push back against criminalizing writing code.
ETH bulls briefly pressed the price above the $2,000 to support, but will a positive funding rate and increase in holder profitability generate sufficient momentum to hold the level?
The proposal would allow a US exchange to trade shares of a fund holding JitoSOL, representing the first SEC exchange filing for a liquid staking token ETP.

Bitcoin trades below most holders’ cost basis, but a rally above $74,500 could change everything. Can the bulls pull it off?

Bloomberg and Kaiko aim to embed licensed financial data directly on blockchain networks, targeting institutional tokenized Treasurys and repo markets.

Bitcoin institutional flows are cooling while its long-term holders and network participants absorb the supply. In a range-bound regime, these are the key signals to watch.

As US policymakers scrutinize prediction markets platforms, many Polymarket users won bets over speculation as to which insider trading an online sleuth had exposed.


The post American Bitcoin Reports 159% YoY Revenue Amid Trump Crypto Controversies appeared first on Coinpedia Fintech News
The Trump-backed Bitcoin miner, American Bitcoin Corp. (NASDAQ: ABTC), has today revealed a 159% year-on-year (YoY) revenue upsurge in its Q4, 2025 earnings report. The company also saw a 22% quarter-on-quarter increase in revenue to $78.3 million, just 6 months after its debut on the US stock markets.
The firm’s Bitcoin holdings have risen by over 60% to a current stash of 6,235+ BTC, making it the 17th largest publicly traded Bitcoin holder worldwide.
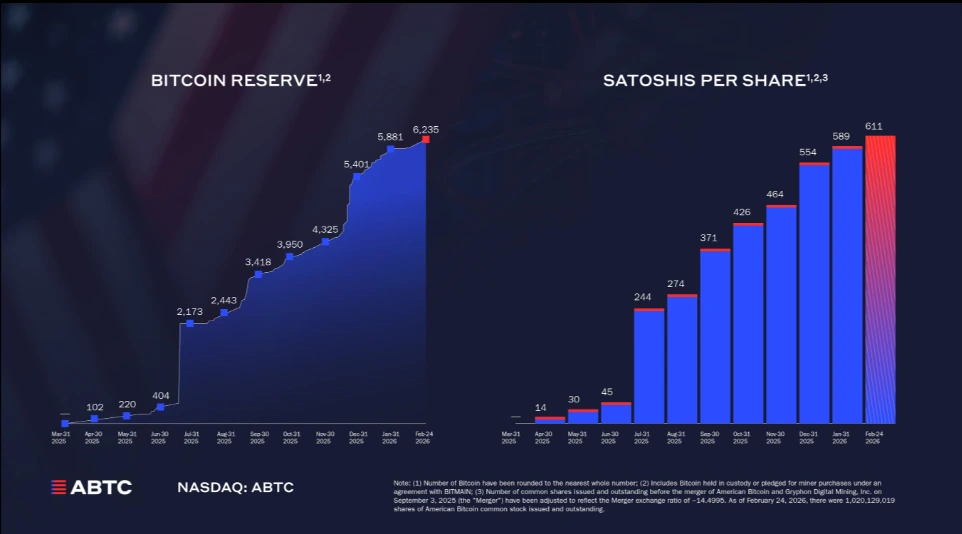
Source: PR Newswire
Despite the news, American Bitcoin stock was trading at $1.015 at press time, having declined 3.33% in the past day, and an overall 75.8% year-to-date. Meanwhile, WLFI token was trading at $0.1165, down 26.14% in the past month.
This is a reflection of its $59.5 million net loss due to recent crypto market volatility. ABTC is also moving in tandem with the greater US stock market, which has seen a recent downturn after Nvidia failed to meet investor expectations in its latest earnings report.
American Bitcoin and the DeFi protocol World Liberty Financial (WLFI) are both co-founded by Eric Trump and Donald Trump Jr., while their father, President Donald Trump, is named Chief Crypto Advocate.
The pair has increasingly come under public scrutiny for security breaches, ethical compliance, and conflicting interests.
The president's meme coin and cryptocurrency ventures create the possibility of serious conflicts of interest and corruption, all with minimal public insight. That's a huge ethics issue.https://t.co/aKd7PqnC57
— Citizens for Ethics (@CREWcrew) April 13, 2025
Hackers have allegedly used co-founder accounts and the Trump campaign website multiple times for market manipulation and fake token promotion.
Additionally, the Trump family makes 10X their real estate income from WLFI alone, something that critics say blurs the lines between the presidency and personal business.
In 2025, the US Senate launched an investigation into WLFI token transfers to Iran, Russia, the North Korean hacker entity Lazarus Group, and crypto mixer Tornado.
When compared to other crypto ventures, WLFI takes a more centralized approach by capping public voting rights, performing random Treasury reshuffles, and freezing wallets it considers disdainful.
Additionally, Trump’s pardoning of major crypto players and donors like Binance’s CZ and Crypto.com has fueled corruption rumors. His reduction of regulatory oversight in the crypto industry, while allegedly using taxpayers’money to fund volatile crypto ventures, are actions viewed as economically damaging by critics.


The GIF ETF combines nine leveraged single-stock strategies into a fund designed to generate weekly income through covered call options.

AI and crypto-linked issuers are paying up to 9% for debt as lenders demand higher returns than traditional utilities.

Amid reports that the White House will not consider a presidential pardon, the convicted former FTX CEO continues his efforts in court.

Ether looked bullish, with onchain data showing that the ETH price may have hit a macro bottom as a key support level holds.

In an interview with Cointelegraph, CEO Nic Puckrin breaks down the forces behind Bitcoin’s bear market and what could come next in 2026.

Bitcoin price strength failed to reclaim a key support zone with traders still expecting the bear market to match previous cycles.

Crypto traders blame Jane Street for a daily 10 a.m. Bitcoin dip after a Terraform lawsuit claimed dubious trading practices, but analysts say timing matches broader risk repricing.

American Bitcoin posted a $59.5 million Q4 loss while its revenue rose and its Bitcoin stack topped 6,000 coins, as peers pivot to AI and sell down treasuries.

MetaMask Card goes live in the US, with first-time availability across 49 states, including New York, following initial pilots over the past two years.

DefiLlama data shows derivatives contribute heavily to DeFi’s $1 billion-plus quarterly revenue as lending and trading infrastructure converge.

Cryptocurrency exchanges are moving to block scam-linked transfers before funds leave their platforms as fraud losses continue to climb.

US President Donald Trump has influenced cryptocurrency market movements through his policies and speeches declaring ambitious crypto goals.

Telegram’s crypto wallet introduces self-custodial vaults, letting users earn yields on Bitcoin, Ether and USDt directly inside the messaging app.
The post Is Canton Replacing XRP at the DTCC? Here’s What the Debate Is Really About appeared first on Coinpedia Fintech News
A fresh discussion is taking place in the XRP community: Is the Canton Network quietly replacing XRP in institutional finance?
The question gained traction after Apex Crypto Insights’s Jesse addressed growing claims that Canton could take over roles tied to the DTCC, the financial giant that processes trillions of dollars in securities transactions every year.
But according to Jesse’s breakdown, that narrative misses a point.
Canton and XRP were built for very different jobs.
The Canton Network, launched in 2023 by Digital Asset, is designed for institutional finance. Its main focus is tokenizing real-world assets like U.S. Treasuries, bonds, and other securities — while keeping data private and compliant with regulatory rules.
In simple terms, Canton helps institutions move and manage tokenized assets securely.
It emphasizes:
Its native token is mainly used to pay network fees and support system activity. It was not designed to act as a neutral bridge currency for cross-border liquidity.
And that’s where XRP comes in.
XRP was explicitly designed as a bridge asset.
The XRP Ledger enables instant conversion from one currency to another — for example, converting U.S. dollars into XRP and then into pesos in seconds, without the need to pre-fund accounts around the world.
This is what Ripple calls On-Demand Liquidity.
Instead of parking money in foreign accounts and waiting days for settlement, XRP can provide liquidity in real time.
That’s a very different function from what Canton is trying to do.
The DTCC plays a central role in post-trade settlement. It processes enormous volumes of transactions annually, including cross-border flows.
Some have speculated that Canton’s growing institutional footprint means XRP is being sidelined. But Jesse argues that the two networks serve complementary roles, not competing ones.
Canton focuses on tokenizing and settling assets within regulated financial ecosystems. XRP focuses on liquidity bridging — especially when value needs to move across currencies and borders.
Those are not interchangeable tasks.
One of the biggest differences is liquidity.
XRP relies on global exchanges, market makers, and deep liquidity pools to function as a bridge between currencies, particularly in corridors where direct fiat pairs are thin or inefficient.
Canton, by contrast, depends on institutional participants building liquidity within specific asset environments. It is more U.S.-centric and geared toward tokenized securities and stablecoin-backed settlement.
That makes it powerful for asset tokenization — but not necessarily for global liquidity bridging.
The more realistic scenario is not “Canton replacing XRP.”
Instead, institutions like the DTCC could theoretically use:
In that model, XRP would still handle liquidity bridging, while Canton manages the asset layer.
They operate in different lanes.
Whether institutions ultimately deploy one, both, or neither at scale remains to be seen. But based on their architecture and use cases, they are solving different problems — not fighting for the same one.
The post Crypto News Today: XRP Spot Buys Surge 212% as Institutional Inflows Top $1.1 Billion appeared first on Coinpedia Fintech News
Trading activity around XRP has picked up sharply, with new data from Bitrue showing a significant jump in spot purchases.
According to the exchange, XRP spot buy volumes recently climbed 212%, with buying pressure more than doubling the sell side. The spike comes as institutional interest in XRP has been steadily building, particularly following the launch of XRP-linked exchange-traded products.
The surge follows a broader market shakeout in mid-February, when roughly $1.9 billion in realized losses were recorded across crypto markets. That flush forced out heavily leveraged positions and reduced immediate selling pressure.
With weaker hands cleared from the market, order books appear cleaner. The environment has created space for capital to rotate into assets showing fresh momentum.
Over the past five weeks, approximately $3.8 billion has reportedly flowed out of Bitcoin-focused ETFs. During the same period, XRP-linked investment products have attracted about $1.1 billion in net inflows.
That shift also shows some investors are diversifying exposure away from Bitcoin and into alternative large-cap digital assets.
Data cited by Bitrue indicates XRP has recorded consistent positive weekly inflows, with only a handful of days showing net outflows. Combined institutional and retail participation appears to be strengthening overall demand.
Retail buyers, in particular, are stepping into what traders describe as a less crowded market structure after the recent correction. When leveraged positions unwind, it often reduces short-term volatility and lowers resistance levels for renewed accumulation.
As long-time supporters of #XRP, we're watching this very closely at #Bitrue
— Bitrue (@BitrueOfficial) February 26, 2026You should too
Stay tuned as we prepare something special for the #XRP community
Shout-out to @murtuza_merc for the mention! https://t.co/QEy11aVMPn
If inflows continue while available supply on exchanges tightens, some analysts believe XRP could see upward pressure in the coming months.
Beyond price action, activity within the XRP Ledger ecosystem has also expanded. Tokens operating within the XRPL environment, including RLUSD, are increasingly being integrated into trading pairs and liquidity pools on various platforms.
Exchanges are adjusting strategies to align with this growth, aiming to position themselves as liquidity venues for XRP and related assets.

The post Aave Surpasses $1 Trillion in DeFi Lending appeared first on Coinpedia Fintech News
Aave, the DeFi lending platform founded by Stani Kulechov in 2020, has surpassed $1 trillion in cumulative loans across multiple blockchains, up from $500 billion just months ago. The platform leads DeFi with $27.4 billion in total value locked and $83 million in recent fees. Its Horizon platform attracts institutions using tokenized assets like U.S. Treasurys as collateral. Active loans currently stand at $17 billion, highlighting Aave’s growing influence in decentralized finance.


The post Avalanche Price Prediction 2026, 2027 – 2030: Will AVAX Price Hit $100? appeared first on Coinpedia Fintech News
Aave (AAVE) is a decentralized finance protocol built on Ethereum that facilitates permissionless lending and borrowing through smart contracts. After witnessing a strong expansion in the previous market cycle, AAVE entered a prolonged correction phase, with price gradually retracing from its earlier highs. Throughout 2025, AAVE remained in a consolidation structure, reflecting a period of market digestion rather than trend continuation. While short-term momentum has cooled, the broader technical structure suggests that AAVE may be transitioning into a new accumulation phase.
As volatility contracts and price holds above long-term demand levels, attention is now shifting toward whether 2026 can trigger the next major price discovery cycle.
| Cryptocurrency | Avalanche |
| Token | AVAX |
| Price | $9.2771
|
| Market Cap | $ 4,005,600,120.23 |
| 24h Volume | $ 398,220,173.4497 |
| Circulating Supply | 431,771,961.1772 |
| Total Supply | 463,441,061.1772 |
| All-Time High | $ 146.2179 on 21 November 2021 |
| All-Time Low | $ 2.7888 on 31 December 2020 |
AVAX price is currently testing the $9 mark in late February, following resistance faced at $15 in January. A recovery is anticipated in March, with optimistic expectations for the first quarter of 2026 to see a good recovery to reclaim some of its previous levels. Based on the chances of a recovery, experts are targeting $20, with the potential to reach $28. If it surpasses $28, it could climb to $44 by mid-year. However, if $28 proves to be a strong resistance level, consolidation may continue.
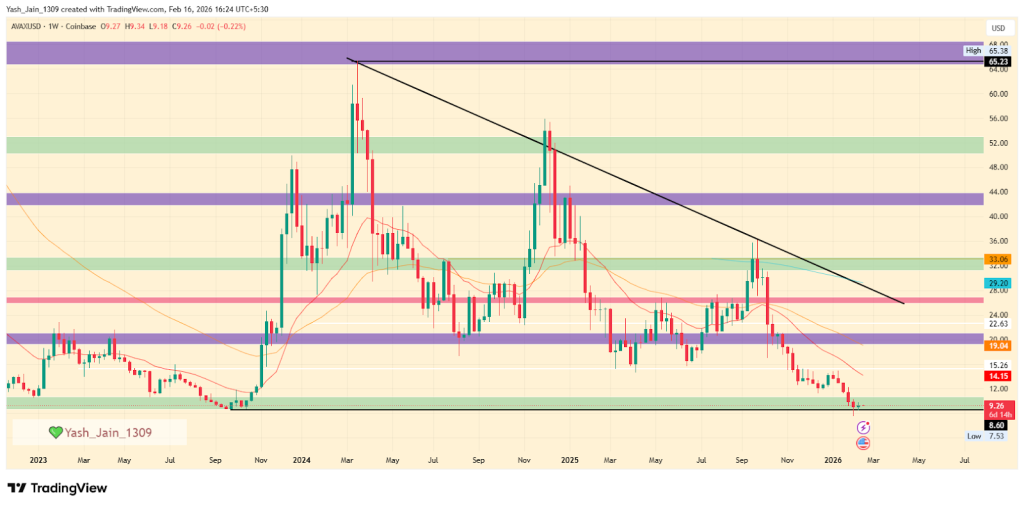
The price action of AVAX hasn’t been so great since its Q1 2024 high of $65; it has been in decline ever since. Most of 2024 and all of 2025 were in decline.
Even in 2026, this bearish momentum’s shadow didn’t lift; it worsened, with the broader market in turmoil. In January, the AVAX price faced rejection from $15 and slipped to $9 support zone after hitting a low of $7.53 in February. But things can change this time around. Since Q1 still has several days left, a recovery remains an option, as it has been testing a demand area of $9 that ignited the late 2024 rally. Sustained demand here could signal a reversal.
Now, expectations for its recovery, which are gaining momentum in Q1 2026, are significantly higher. Now, it appears AVAX may not have performed in the past two years, but it was all about establishing a base, and it seems it has done so. Now, an impressive rally ahead is a strong possibility.
For Q1, we expect $20 with potential to test the pattern’s upper border at $28. However, if it clears the upper border, we can expect AVAX to hit $44 by the end of the first half. But if $28 repels, then the first half could see consolidation stretching.
| Year | Potential Low | Potential Average | Potential High |
| 2026 (conservative) | $25 | $33 | $50 |
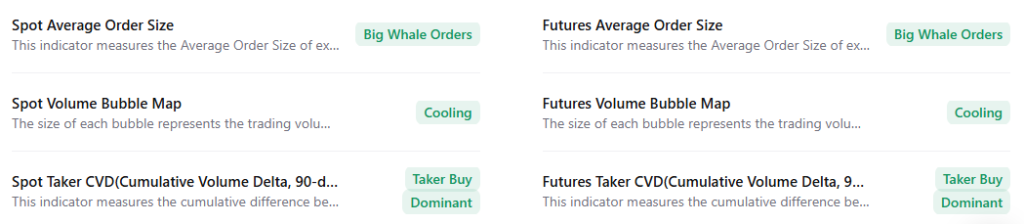
AVAX shows a highly bullish sentiment. Big Whale Orders in both spot and futures indicate strong institutional accumulation. With Taker Buy Dominance at 90 days, aggressive buyers are in control, while the Cooling volume bubble map suggests a healthy consolidation phase. Collectively, major metrics point to a bullish rally ahead.
| Year | Potential Low ($) | Potential Average ($ | Potential High ($) |
| 2026 | 400 | 500 | 600 |
| 2027 | 550 | 690 | 820 |
| 2028 | 650 | 830 | 980 |
| 2029 | 740 | 950 | 1100 |
| 2030 | 820 | 1000 | 1200 |
Looking ahead to 2026, AVAX’s potential price is anticipated to rise even further, with a projected low of $20.00 and a high of $80.00. The average price for AVAX in 2026 will likely be $50.00.
In 2027, the analysis suggests a continued upward trend in AVAX’s value, with the price potentially ranging between $31.50 and $126.50. Based on the calculated figures, the average price is projected to be approximately $79.00 during this period.
By 2028, AVAX’s price could potentially experience further growth, falling within the range of $50.50 and $202.50. The average price during this period, calculated from the data, is expected to be around $126.50.
Moving forward to 2029, AVAX’s price is predicted to ascend between $81.00 and $324.00. The average price during this period is estimated at around $202.50 based on calculated figures.
By 2030, AVAX’s price is forecasted to soar between $129.50 and $518.50. Further, the average price during this period, calculated from the data, could stand at $324.00.
Based on the historic market sentiments and trend analysis of the largest cryptocurrency by market capitalization, here are the possible AAVE price targets for the longer time frames.
| Year | Potential Low ($) | Potential Average ($) | Potential High ($) |
| 2031 | 890 | 1100 | 1350 |
| 2032 | 920 | 1200 | 1500 |
| 2033 | 1100 | 1350 | 1780 |
| 2040 | 1600 | 2200 | 3000 |
| 2050 | 2600 | 3300 | 4500 |
| Year | 2026 | 2027 | 2030 |
| Changelly | $500 | $750 | $1100 |
| DigitalCoinPrice | $480 | $680 | $1000 |
| WalletInvestor | $520 | $650 | $1250 |
Stay ahead with breaking news, expert analysis, and real-time updates on the latest trends in Bitcoin, altcoins, DeFi, NFTs, and more.
AAVE shows long-term growth potential if it breaks key resistance levels. However, price depends on market conditions and DeFi adoption.
Watch support near $135–$150, resistance above $250, overall market trend, and activity within the Aave protocol.
Key drivers include DeFi expansion, institutional adoption, subnet growth, and overall crypto market recovery cycles.
The AVAX price prediction for 2026 suggests a potential range between $400 and $600 if market momentum and network growth remain strong.
AVAX coin price prediction for 2030 points to a possible range of $820 to $1,200, assuming sustained adoption and favorable market conditions.
Avalanche price prediction for 2040 estimates a broad range between $1,600 and $3,000 if long-term blockchain adoption accelerates globally.
The post XRP Price Slumps as Open Interest Flashes Warning Signs appeared first on Coinpedia Fintech News
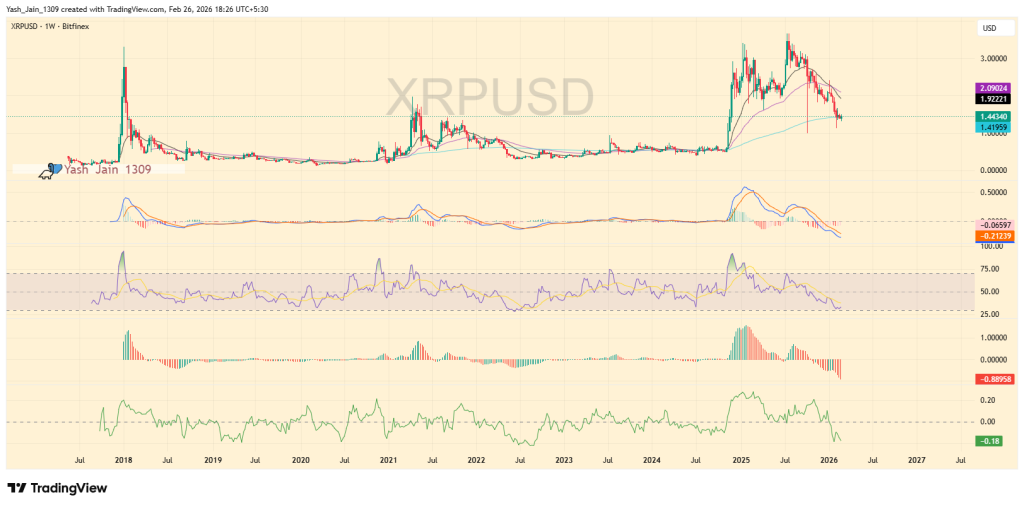
The XRP price isn’t exactly inspiring confidence right now. After a powerful 2025 rally that pushed XRP/USD above the $3 mark, the mood has shifted and not subtly. Price has rolled over hard, now hovering near the $1.44 zone, with momentum indicators tilting south.
On the weekly XRP price chart, that vertical breakout from late 2024 into 2025 looks impressive in hindsight. But markets don’t reward nostalgia. Since topping above $3, XRP price has been printing lower highs, slipping beneath key moving averages, and losing steam.
And the derivatives market? It’s not exactly stepping in to save the day.
Take a look at the oscillators. MACD has crossed lower, histogram bars are bleeding red, and RSI has drifted toward the lower half of its range. That’s not capitulation, not yet, but it’s clear the euphoria phase has passed.
More importantly, the broader XRP price chart shows that the explosive upside move has been fully retraced in sentiment terms. The aggressive buyers that drove the spike have faded.
Which brings us to leverage.
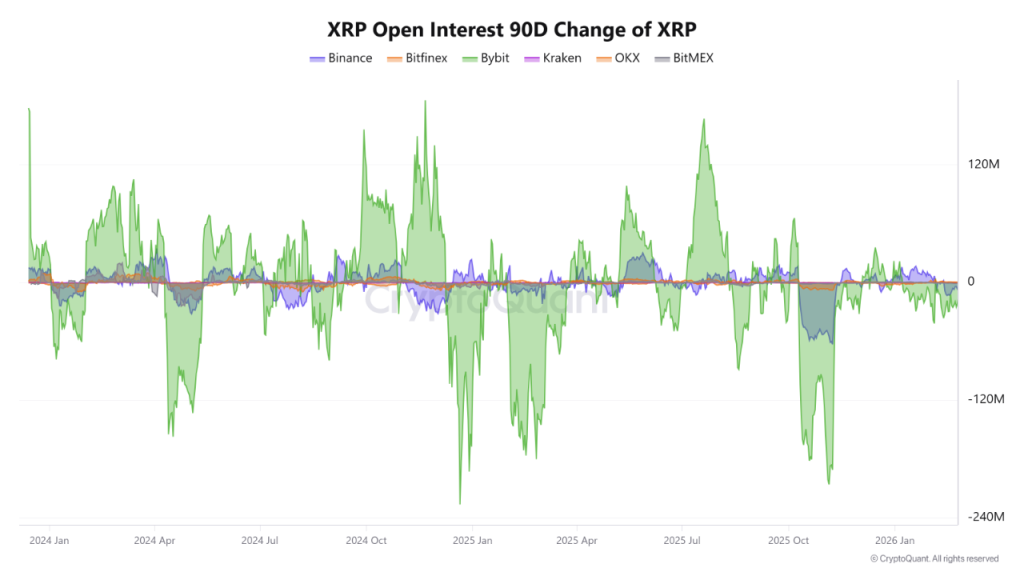
The 90-day change in XRP open interest across major exchanges shows something telling. Large spikes in positioning were followed by sharp contractions. On some platforms, swings reached deeply negative territory before stabilizing.
That kind of volatility in open interest suggests traders piled in aggressively during the rally and then pulled risk just as quickly. In other words, conviction didn’t stick.
When open interest compresses while price trends lower, it often means leverage is being flushed out rather than added. For any XRP price prediction to turn convincingly bullish again, sustained positioning growth would need to return.
Right now, that’s not happening.
So where does that leave XRP/USD?
Technically, price is sitting near the $1.40–$1.45 area after rejecting from the $3 zone earlier in the cycle. The structure no longer screams breakout. It looks like digestion maybe even distribution.
Well, here’s the uncomfortable part. Big vertical rallies rarely drift sideways forever. They either re-accelerate with fresh momentum or correct deeper to reset sentiment completely.
Open interest volatility, weakening momentum, and fading upside pressure point toward caution.
That doesn’t guarantee a collapse. But it does mean the easy money phase is over.
For now, the XRP price is stuck proving it can stabilize before anyone seriously talks about new highs again.

The post Hedera Price Prediction 2026, 2027 – 2030: Will HBAR Price Hit $0.5? appeared first on Coinpedia Fintech News
Hedera has been making waves in the cryptocurrency space, with a fast and secure blockchain that offers a distinct approach to transaction processing compared to Ethereum and other smart contract chains. It’s permission-only, meaning the blockchain is managed by private companies. Limiting what types of decentralised applications are allowed is what makes Hedera stand out from the rest.
Having entered the top 20 digital assets by market cap in 2024, it is now eyeing a potential leap into the top 10 by the end of 2025. Hedera has also recently ramped up its development activities for its ecosystem. Its ecosystem is strengthening, despite its capped price action. With increasing real-world use cases, institutional interest, and strategic partnerships, many are closely tracking HBAR price chart 2025 to gauge how high the token can rise.
With major companies like Google, IBM, and Chainlink Labs backing the project, and discussions about SEC approved HBAR ETF would flood string liquidity. Many are intrigued that: Will the HBAR Price Reach $1? Let’s discuss this in our Hedera price prediction 2025 article.
| Cryptocurrency | Hedera |
| Token | HBAR |
| Price | $0.1025
|
| Market Cap | $ 4,408,450,379.78 |
| 24h Volume | $ 111,017,804.6739 |
| Circulating Supply | 43,003,421,564.3178 |
| Total Supply | 50,000,000,000.00 |
| All-Time High | $ 0.5701 on 16 September 2021 |
| All-Time Low | $ 0.0100 on 02 January 2020 |
HBAR fell below $0.100 by early 2026 and recently tested key dynamic support in February, suggesting potential demand. To maintain a bullish outlook for March, it needs to reclaim the $0.120 level; otherwise, it may pull back to $0.0800. In the long run, holding above $0.0800 is crucial to avoid a drop to $0.0453.
Previously, the HBAR price began a prolonged period of consolidation below $0.120, lasting nearly 2 years from 2023 to the third quarter of 2024. Then a rally in Q4 2024 pushed it to $0.4010. But the surprising part is that by the end of 2025, it is back below $0.120, and by the end of January 2026, it has even slipped below $0.100 in February. The question is whether it is an opportunity or something else.
Since the extended decline of 2026 has retested a key support that strongly aligns with the lower border of the pattern, and some reaction from this level confirms the presence of demand at this dynamic support. That makes the current price action an important play that could shape the next big move.
Also, it has an ETF, where odds are suggesting that once a catalyst arrives inflows could resume sooner or later, and the price of HBAR, which is currently experiencing lower demand, that could change. Also, this setup of falling wedge still looks intact with bears ruling for now, and it cannot be confirmed yet whether the recent support taken changes towards the bullish wind. So far, only on the micro level is it bullish, but the long-term chart still doesn’t care about micro momentum because the larger momentum is still dominated by bears, and this needs a big catalyst to break the range.
In the short term, either it will claim its position back above $0.1200 and aim for $0.1836, or it will take a pullback from $0.1200 back to $0.0800.
However, for the majority of this year, holding on to $0.0800 is key; if that’s compromised, it will be very hard to stop HBAR from testing $0.0453 support. Right now in Q1, the initial rally that fruited in late 2024 began from this zone, and if demand manifests, this could be a possible opportunity to accumulate, but caution still comes first.
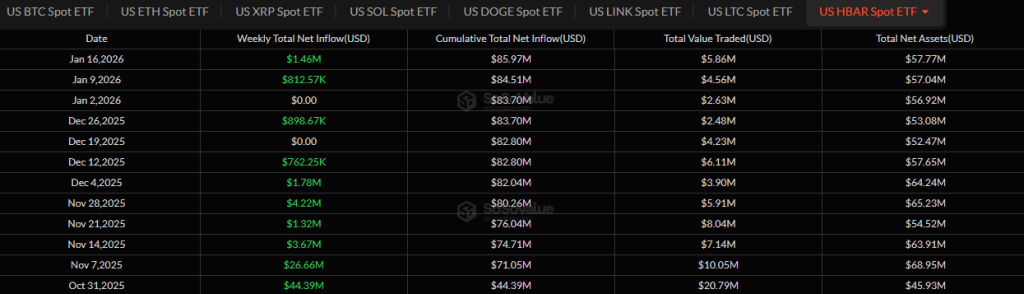
The HBAR ETF is gaining momentum once again, with $1.46 million in inflows this week. The last time we saw such significant inflows was in early December, when it reached $1.78 million. This suggests liquidity is flowing into HBAR, potentially signaling a price rise.
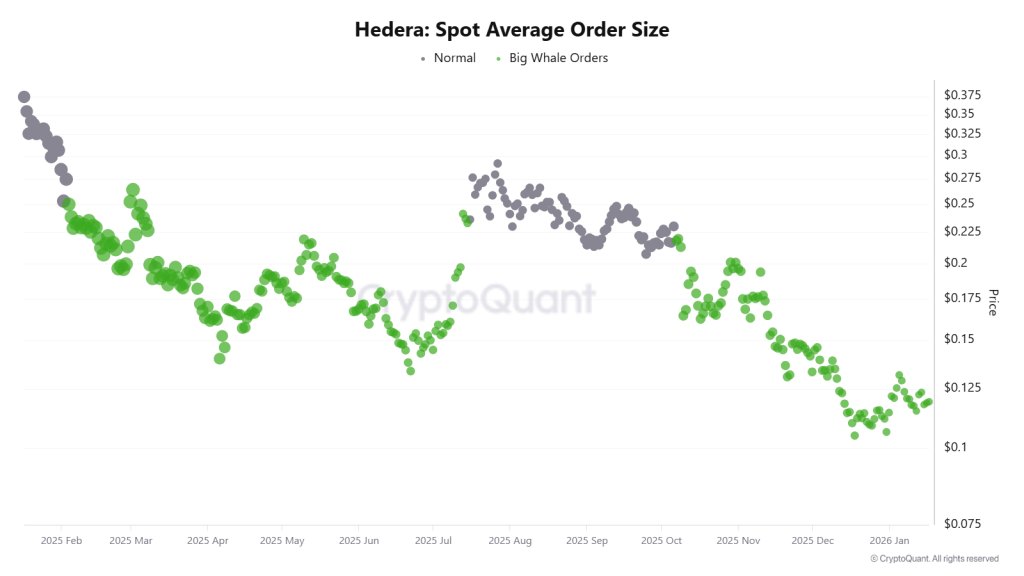
Also, large orders from whales have been increasing since mid-October, suggesting that they are purchasing HBAR on every price decline.
| Year | Potential Low | Potential Average | Potential High |
| 2026 (conservative) | $0.15 | $0.40 | $0.75 |
| Year | Potential Low | Potential Average | Potential High |
| 2026 | $0.45 | $0.80 | $1.05 |
| 2027 | $0.60 | $0.95 | $1.20 |
| 2028 | $0.65 | $1.10 | $1.40 |
| 2029 | $0.70 | $1.35 | $1.60 |
| 2030 | $0.95 | $1.70 | $2.20 |
Moving forward to 2026, forecast prices and technical analysis project that Hedera’s price is expected to reach a minimum of $0.45. The price could escalate to $1.05 on the higher end, with an average trading price hovering around $0.80.
Looking ahead to 2027, the optimism around Hedera will lead to steady growth. Hence, the HBAR price is forecasted to reach a low of $0.60, with a potential high touching $1.20 and an average forecast price of $0.95.
As we advance to 2028, with moderate gains, the HBAR predictions indicate that the price of a single HBAR could reach a minimum of $0.65, with the ceiling potentially rising to $1.40. Within the range, the average price will be $1.10.
By the time 2029 rolls around, it’s predicted that Hedera’s price will maintain its upward trajectory, reaching a minimum of $0.70, with the maximum price possibly reaching $1.60 and an average of $1.35, reflecting cautious optimism.
By the end of this decade, HBAR is predicted to touch its lowest price at $0.95, aiming for a high of $1.70 and an average price of $2.20. Hence, the prediction suggests stable long-term growth for Hedera’s market value.
| Firm | 2026 | 2030 |
| Changelly | $0.370 | $1.74 |
| priceprediction.net | $0.40 | $1.99 |
| DigitalCoinPrice | $0.50 | $1.07 |
By the end of 2025, the recovery run in HBAR prices is expected to continue with a gradual rise in momentum. Hence, by the end of 2025, Coinpedia’s HBAR price forecast expects a potential high of $0.80 with a solid support at $0.40, making an average of $0.60.
| Year | Potential Low | Potential Average | Potential High |
| 2025 | $0.40 | $0.60 | $0.80 |
Stay ahead with breaking news, expert analysis, and real-time updates on the latest trends in Bitcoin, altcoins, DeFi, NFTs, and more.
HBAR price in 2026 is projected to trade between $0.45 and $1.05, with an average near $0.80 under favorable market conditions.
By 2030, HBAR price could rise to around $2.20 if network growth, partnerships, and broader crypto adoption continue steadily.
Hedera shows long-term potential due to enterprise adoption, real-world use cases, and strong governance, though price cycles still affect returns.


Escalating US-Iran tensions are boosting safe-haven demand, with gold attracting investors while equities and Bitcoin face pressure.

The return of spot Bitcoin ETF inflows may fuel a BTC price recovery, as signs of a potential rebound to $75,000-$80,000 emerge.

Indiana’s HB 1042 cleared both chambers and heads to Governor Mike Braun, limiting crypto-specific taxes and opening the door to crypto options for retirement accounts.

The license allows Gate to execute payment transactions in the EU, including direct debits and credit transfers under PSD2 rules.

Fresh inflows lift US Bitcoin ETFs toward a potential first weekly gain after five consecutive weeks of outflows totaling $3.8 billion.
The post Hyperliquid Price Prediction 2026, 2027 – 2030: Will HYPE Price Hit A New ATH? appeared first on Coinpedia Fintech News
The crypto market is buzzing with excitement over Hyperliquid and its native token, HYPE. As a decentralized, paperless alternative to platforms like Binance and Coinbase, Hyperliquid is quickly gaining traction, prompting investors to look closely at the HYPE price prediction for 2026 and beyond.
With its unique “HyperBFT” consensus mechanism, lightning-fast transactions, and zero KYC hurdles, Hyperliquid is rewriting the rules of perpetual trading. Beyond its consensus mechanism, Hyperliquid also allows users to trade crypto perpetual futures, including major assets like BTC, ETH, SOL, AVAX, and SUI, even without owning the underlying asset.
As the platform gains traction for its streamlined trading experience, many investors are now turning to analyze the HYPE token price outlook. But does its innovative model signal long-term growth for HYPE Token Price?
In this article, we dive deep into market sentiment and Hyperliquid price projections from 2026 to 2030.
| Cryptocurrency | Hyperliquid |
| Token | HYPE |
| Price | $28.1166
|
| Market Cap | $ 7,266,147,912.84 |
| 24h Volume | $ 278,444,564.5744 |
| Circulating Supply | 258,429,533.8960 |
| Total Supply | 957,895,982.7399 |
| All-Time High | $ 59.3926 on 18 September 2025 |
| All-Time Low | $ 3.2003 on 29 November 2024 |
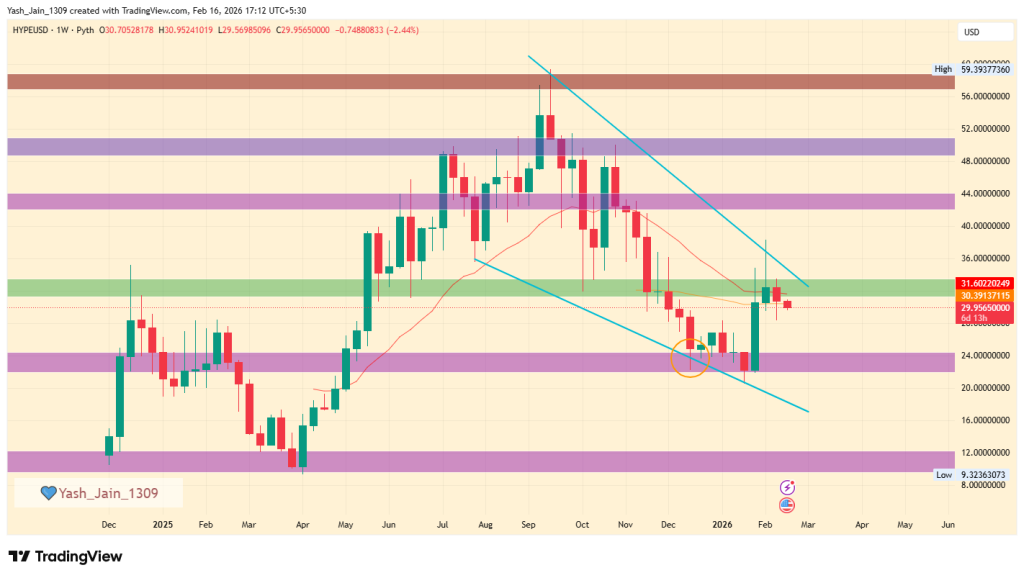
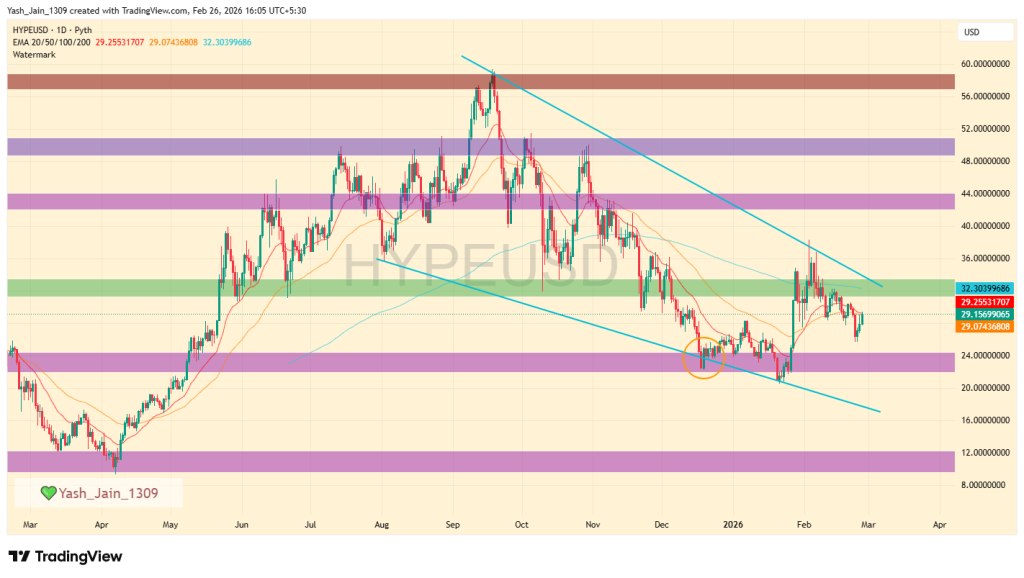
In 2026, HYPE retested support at $21 and rose to $38 but now faces resistance at the upper wedge boundary around $32. If it breaks $32, it could reach $44 or $50; otherwise, it may fall below $21 to $18.
In February, HYPE’s price fell from its $38 peak and is now 30% lower at $26. But late February saw a faint demand again, which pushed the price back up to retest the 20-day and 50-day EMA bands. If it crosses, in March, a retest of $32 could be possible, or even a breach, with targets at $44. But, if $32 repels, then it could hit $21.
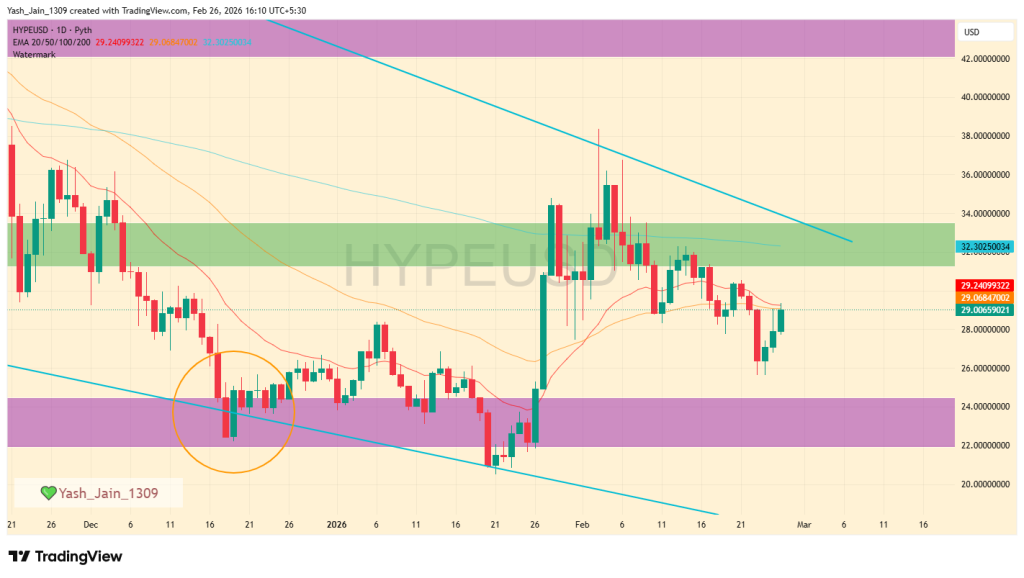
In 2026, the HYPE price experienced a significant retest of dynamic support at $21, coinciding with the lower boundary of a falling wedge pattern, subsequently rising to $38 by early February. However, the upper boundary of the falling wedge acted as dynamic resistance, preventing further upward movement.
The price is currently consolidating within this narrowing wedge, with the trading range declining each month. At present, the HYPe price is fluctuating around the 20-day and 50-day EMA bands.
In the short term, it may test the upper boundary of the falling wedge once again at approximately $32. If the price successfully breaks through and sustains above this level, it could initiate a rally towards $44 or $50. Conversely, should it face rejection at $32, the price could decline below $21, potentially reaching as low as $18.
| Year | Potential Low | Potential Average | Potential High |
| 2026 (conservative) | $15 | $35 | $80 |
The Dune analytics dashboard provided an quick on-chain overview of the utility metrics of the Hyperliquid token (HYPE), which appears to be improving significantly with each passing month.
HyperEVM total transaction fees have surpassed 235.57K and are at an ATH, and total trading volume has crossed $3.64 trillion and is at an ATH. Even its revenue has reached an ATH, crossing $993 million.

All the major metrics suggest that it is experiencing great adoption among peers, and its on-chain metrics are proof of that, suggesting that if the rally occurs, then 2026 might end on very good numbers.
| Year | Potential Low ($) | Potential Average ($) | Potential High ($) |
| 2026 | 25 | 50 | 90 |
| 2027 | 40 | 75 | 105 |
| 2028 | 55 | 95 | 130 |
| 2029 | 85 | 110 | 155 |
| 2030 | 105 | 125 | 185 |
By 2026, the value of a single Hyperliquid token price could reach a maximum value of $90 with a potential low of $25. With this, the average price could land at around the $50 level.
During 2027, the HYPE could reach a maximum value of $105 with a potential low of $40. Considering this, the average price of this altcoin could settle at around $75.
The Hyperliquid price could achieve the $130 milestone by the year 2028. On the flip side, the altcoin could record a low of $55 and an average price of $95.
The HYPE crypto prediction for the year 2029 could range between $85 to $155 and the average price could be around $110.
Looking forward to 2030, the Hyperliquid Price may range between $105 and $185, and a potential average value of around $125.
| Firm Name | 2025 | 2026 | 2030 |
| Binance | $37 | $63 | $164 |
| DigitalCoinPrice | $76 | $54 | $97 |
*The aforementioned targets are the average targets set by the respective firms.
This Layer-1 project has taken the crypto market by storm within a short time frame. With a market cap of over $7 billion, this altcoin has successfully secured a position in the top 25. Moreover, with the mass adoption, this altcoin could claim a spot in the top 10 during the upcoming bull run.
If the bullish sentiment intensifies, the Hyperliquid price will reach a high of $41.39 this year. On the flip side, if the market experiences unfavorable events, this could result in this altcoin settling at a low of $14.65.
| Year | Potential Low | Potential Average | Potential High |
| 2025 | $14.65 | $28.02 | $41.39 |
Stay ahead with breaking news, expert analysis, and real-time updates on the latest trends in Bitcoin, altcoins, DeFi, NFTs, and more.
Hyperliquid is a fast, decentralized trading platform with no KYC and low fees, making HYPE popular among traders seeking speed and independence.
HYPE price in 2026 is projected to range between $25 and $90, with an average near $60 if adoption and trading volumes keep rising.
Long-term projections suggest HYPE might reach an average of $125 by 2030, with possible highs near $185 if platform usage keeps expanding.
HYPE may appeal to long-term investors due to strong platform growth, but like all crypto, it carries risk and requires careful research.

The post Telegram’s TON Wallet Adds Crypto Yield Feature appeared first on Coinpedia Fintech News
Telegram’s TON Wallet has introduced an Earn feature that lets users deposit BTC, ETH, or USDT into decentralized finance vaults to earn yield. Through partners such as Morpho and TacBuild, users can earn up to 18 percent on USDT, about 3 percent on ETH, and around 2 percent on BTC, with rewards accumulating in real time on the TON blockchain. TON Wallet CEO Andrew Rogozov says this move brings everyday holders into DeFi using Telegram’s vast global reach.
The post Why the $35T U.S. Debt Problem Has Crypto Analysts Talking About XRP and Ripple? appeared first on Coinpedia Fintech News
Rising concerns around America’s $35 trillion national debt have sparked intense debate about the future of the global financial system. While policymakers continue relying on traditional tools like rate adjustments and monetary expansion, some crypto analysts argue that bigger structural changes may already be underway.
Among them, Edo Farina has floated a bold theory: that XRP could eventually play a role in a broader financial reset, not as a speculative coin, but as infrastructure within a new settlement framework.
From the beginning, XRP has faced skepticism. Critics have questioned its role, its ties to institutions, and whether it can truly differentiate itself from thousands of other digital assets. Yet, supporters argue that its long-term positioning has always centered on cross-border settlement and financial plumbing rather than retail hype cycles.
Farina frames the discussion around macro reality. The U.S., he argues, cannot sustainably manage its debt through endless money printing or higher taxation. Inflation erodes purchasing power, and confidence in fiat systems is gradually weakening.
“A new financial system is emerging where debt is being tokenized onto blockchain rails,” Farina says. In that environment, he believes XRP could serve as a neutral bridge asset, facilitating value transfer between institutions and even sovereign entities.
He emphasizes that governments may eventually need to participate directly in digital asset ecosystems to maintain influence. “If you want control, you have to participate,” he argues, suggesting that ignoring blockchain infrastructure may no longer be an option for major economies.
Farina ties his thesis to accelerating de-dollarization trends and record central bank gold accumulation. Around the world, nations are diversifying reserves and reducing reliance on the U.S. dollar for trade settlement.
“There will be an intersection between precious metals and blockchain technology,” he claims. He outlines two possibilities. Tokenized gold operating on blockchain networks like the XRP Ledger, or digital assets indirectly linked to commodity-backed systems.
In his view, a split global financial order, with competing currency blocs, could increase demand for neutral settlement layers that are not directly controlled by any single nation.
However, going deep inside, Farina’s argument is not about short-term price targets. It is about positioning. If global finance shifts toward tokenized assets, real-time settlement, and commodity-linked digital rails, assets designed for liquidity bridging could become strategically important.
Whether XRP ultimately plays that role remains speculative. But as debt levels climb and monetary systems evolve, discussions about blockchain-based settlement are no longer fringe; they are increasingly part of mainstream macro conversations.
Stay ahead with breaking news, expert analysis, and real-time updates on the latest trends in Bitcoin, altcoins, DeFi, NFTs, and more.
Supporters believe tokenized debt and cross-border payments may require fast settlement layers, where XRP could provide liquidity.
Some analysts suggest blockchain networks like XRP Ledger could host tokenized gold or assets tied to commodities.
No. The theory is speculative. While XRP targets cross-border settlement, adoption depends on regulation and institutions.
The post Are Active Addresses Raising Concerns for TRX? Could TRX Price Drop by 50%? appeared first on Coinpedia Fintech News
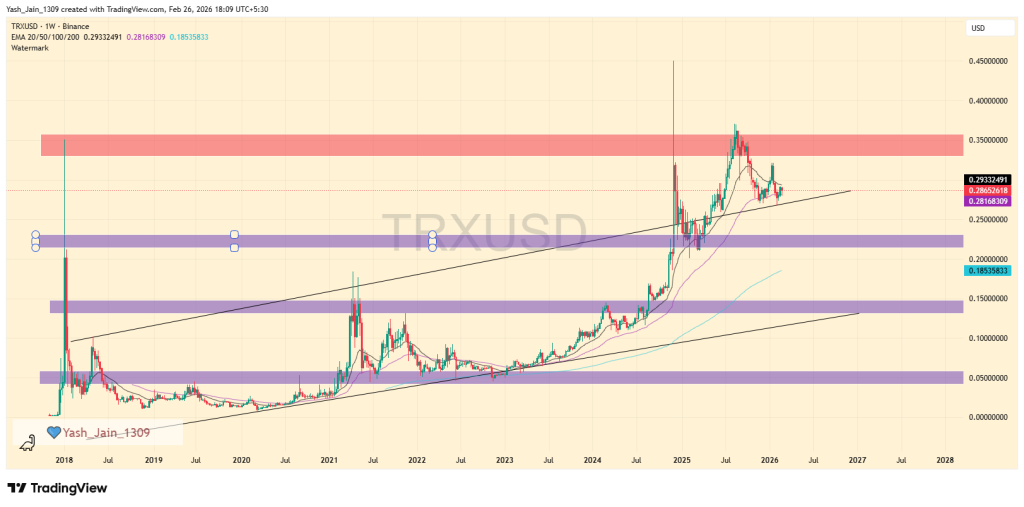
The TRX price topped out at $0.3695 in Q3 2025 and that’s where the music stopped. Since then, momentum hasn’t just cooled, it’s stalled. The $0.3339–$0.3500 range has quietly turned into a major brick wall, turning sellers back into control.
That zone isn’t random noise on the TRX price chart. It’s become the dominant supply area, and rejections spree from it are already unfolding. At current levels near $0.2864, TRX/USD is stuck beneath a ceiling it hasn’t been able to crack.
And when rally pushed back from that pressure its generally a top and that’s rarely a bullish tell.
Now here’s where things get technical. TRX broke out of a long-term ascending channel in 2025 which was a bullish development at the time. But markets have a sense of humor. That former breakout level, the upper border of the channel, is now being tested as support.
If it holds, structure survives. If it breaks, TRX price re-enters the channel.
And that’s where the downside math starts getting uncomfortable. A confirmed slip below that wedge support opens the path toward $0.2215. Lose that, and $0.1354 becomes the logical endpoint of a broader correction phase. From $0.2864, that’s roughly a 50% haircut.
So when traders talk about a bearish TRX price prediction, this is what they’re looking at this structure, not emotion.
But price doesn’t move in a vacuum. The previous rally wasn’t built on hype alone. It was driven by increased USDT activity on the network. More stablecoin transfers meant higher blockchain utility, which meant more active addresses.
In February, active addresses peaked at 5.60 million. They’ve since dipped to 4.74 million. The decline isn’t dramatic or big. In fact, the broader multi-year rising trend in active addresses is still intact. It’s been tested several times and hasn’t broken.
Still, here’s the uncomfortable truth: the more a trendline is tested, the more fragile it becomes.
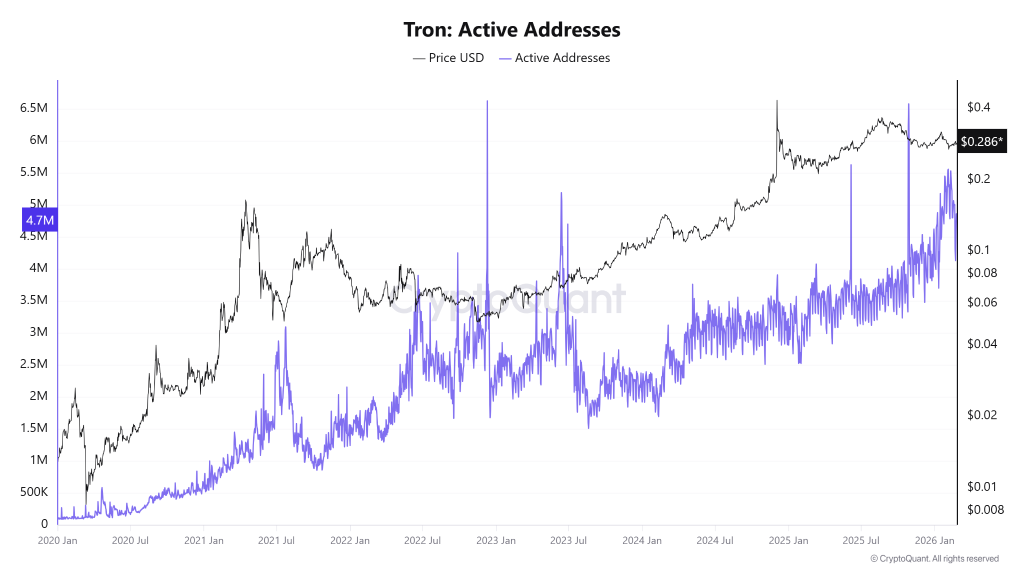
Q1 2026 could mark another retest of that rising active address trend. If the metric breaks down decisively, especially below the psychological 4 million level it suggests declining network utility.
And that could have serious consequences. As stablecoin plays a big part, if Lower stablecoin transfer activity is materialized that means reduced liquidity. Reduced liquidity tends to hit price. Hard.
So what’s next? Everything hinges on support both on the TRX price chart and in active addresses. If both crack, a full correction toward $0.2215 and even $0.1354 isn’t far-fetched.
At this point, the TRX price isn’t crashing. But it’s standing on a trapdoor.

The post Saylor Leaves XRP Out, Backs Solana and Ethereum for Digital Credit Future appeared first on Coinpedia Fintech News
Michael Saylor has built his reputation as one of Bitcoin’s most vocal supporters. For years, his message was simple: Bitcoin is digital property, and companies should hold it.
But at the recent Strategy World 2026 conference, Saylor shifted the conversation.
This time, he wasn’t just talking about Bitcoin. He spoke about the future of digital credit — and said it will run on blockchains like Solana and Ethereum.
Interestingly, XRP didn’t come up.
Saylor described a future where credit isn’t tied to traditional banking systems. Instead of loans moving through legacy rails, he sees them issued directly on blockchains as programmable digital instruments.
In simple terms, credit could become tokenized.
He suggested that lending products in the future may look more like software than paperwork, with built-in yield settings, liquidity controls, and adjustable terms coded directly into the asset. Rather than calling it a new asset class, he framed it as a new financial building block.
And in his view, networks like Solana and Ethereum already have what’s needed: liquidity, scale, and active developer ecosystems.
The reaction was immediate.
Solana jumped more than 13% within 24 hours of his comments, pushing its market value close to $50 billion. Ethereum also saw renewed buying interest as traders interpreted Saylor’s remarks as institutional validation.
When someone with Saylor’s track record talks about infrastructure, markets tend to listen.
For years, Solana and Ethereum have competed to position themselves as the foundation for decentralized finance. Saylor’s comments added fuel to that narrative, especially as institutions explore tokenized assets and on-chain lending.
The real question now is whether this vision turns into action.
It’s one thing to outline a future where credit lives on blockchain networks. It’s another to see major banks or asset managers actually launch large-scale products on those chains.
If that happens, it would mark a major shift in how traditional finance interacts with crypto infrastructure.
For now, Saylor has broadened the conversation. He’s still bullish on Bitcoin — but when it comes to programmable credit, he’s looking at Solana and Ethereum as the rails of the future.
Stay ahead with breaking news, expert analysis, and real-time updates on the latest trends in Bitcoin, altcoins, DeFi, NFTs, and more.
Tokenized credit turns loans into digital assets with coded terms, yield settings, and liquidity rules built directly on-chain.
Smart contract bugs, market volatility, and regulatory uncertainty remain key risks in on-chain lending systems.
Traditional loans rely on banks and paperwork, while tokenized credit uses smart contracts for automation and transparency.
Yes. If large institutions issue on-chain credit products, it could accelerate mainstream blockchain integration.

The post Is the Crypto Bottom In? Jane Street Sued and 2 More Signals Flagged appeared first on Coinpedia Fintech News
The crypto market just staged one of its strongest single-day recoveries in weeks. Bitcoin surged from $63,000 to above $68,000, altcoins posted double-digit gains, and nearly $400 million in short positions were liquidated in 24 hours.
In a recent video analysis, crypto analyst Dan Gambardello connected three signals behind the move: the Jane Street lawsuit, historically oversold RSI levels, and macro indicators most traders are ignoring.
Terraform Labs’ estate filed a lawsuit against Jane Street, alleging the trading firm used insider information to profit from the $40 billion TerraUSD collapse in 2022. According to the suit, Jane Street sold its UST holdings on May 7, 2022, just hours before the stablecoin lost its peg.
What caught Gambardello’s attention was the timing. The day after the lawsuit dropped, the recurring “10 AM manipulation” pattern that traders had been tracking for months reportedly stopped. BTC jumped $2,000 and $120 million in shorts were liquidated.
He was clear that this is conspiracy-level speculation, not a confirmed thesis. Jane Street has called the allegations “baseless” and “desperate.”
Bitcoin’s weekly RSI has dropped to around 25.6, the most oversold reading in BTC’s entire history. The only two times it fell below 30 before were January 2015 near $200 and December 2018 near $3,500. Both came right before cycle bottoms.
But Gambardello warned against jumping to conclusions. In 2022, a similar oversold signal appeared, but the actual bottom came months later.
“Don’t sit here and be so certain the bottom is in. Time to go 10x, 20x, right? We’ll track that journey as it happens, but manage your risk,” he said.
Also Read: Bitcoin Bear Market Bottom or Another Leg Down? 5 Signals That Will Decide
XRP gained 7%, ADA surged 12%, LINK jumped 13%, and ETH climbed 9%. The OTHERS/BTC chart is sitting at record oversold levels, and the MACD line has crossed above the signal line for the first time in months.
That said, BTC dominance still has not broken down. The Altcoin Season Index is at 35, well below the 75 mark needed to confirm an altseason.
Gambardello also pointed to the Russell 2000 mirroring 2015-2017 pre-breakout structure, a pattern that has historically lined up with altcoin bull runs. PMI data arriving Monday could be the next macro trigger.
Bitcoin is currently trading at $68,190. The Jane Street legal battle continues, PMI data lands Monday, and whether this bounce turns into a real reversal comes down to follow-through.
“We are, in my opinion, nowhere near the top of the move, even though maybe it looks like it,” Gambardello said.
Stay ahead with breaking news, expert analysis, and real-time updates on the latest trends in Bitcoin, altcoins, DeFi, NFTs, and more.

The post Ethereum Price Analysis: Whale Accumulation and Rising Volatility Put ETH at Crossroads appeared first on Coinpedia Fintech News
Ethereum is once again at a critical juncture. After a strong rebound, ETH price is trading near $2,100, posting sharp short-term gains while on-chain and derivatives data flash mixed but powerful signals. On one side, large whales are stacking ETH aggressively. On the other, volatility has expanded to levels last seen nearly a year ago.
This combination often precedes major price expansion, but direction is rarely obvious upfront. With buyers and sellers both becoming more active, Ethereum now sits at a crossroads where the next move could define the near-term trend.
Whale activity shows a clear shift in behavior among large Ethereum holders. One high-profile wallet recently swapped 240 $BTC (worth over $16 million) into $ETH, signaling a direct rotation from Bitcoin into Ethereum.
Whale 0x2bd7 swapped 240 $BTC($16.28M) for 8,152 $ETH yesterday.
— Lookonchain (@lookonchain) February 26, 2026
He then borrowed 36M $USDT from #Aave to buy another 17,284 $ETH at an average price of $2,083.
The liquidation price is $1,705.65.https://t.co/QoXtONM8jmhttps://t.co/srSxqHYkMv pic.twitter.com/xEsoZmRXKo
That same whale then borrowed $36 million in USDT from Aave to buy an additional 17,000+ $ETH at an average price near $2,083. The liquidation price for this leveraged position sits around $1,705, well below current market levels, indicating strong confidence in ETH holding higher ground.
Whale 0x166f withdrew 20,000 $ETH($38.25M) from #Binance and #Deribit in the past 2 hours.https://t.co/fxxyTcIHtN pic.twitter.com/EFkHMHnpw2
— Lookonchain (@lookonchain) February 25, 2026
In another development, a separate whale withdrew 20,000 ETH (roughly $38 million) from Binance and Deribit within a short window. Large exchange withdrawals of this scale typically reduce near-term selling pressure and often point toward longer-term holding or strategic positioning. Taken together, these moves suggest whales are not hedging risk, they are leaning into Ethereum as volatility rises.
Ethereum’s 30-day realized volatility has climbed sharply, reaching its highest level since March 2025. This signals that ETH has transitioned from a period of relative calm into a high-activity phase, where price ranges expand and momentum builds. Such volatility spikes usually occur:
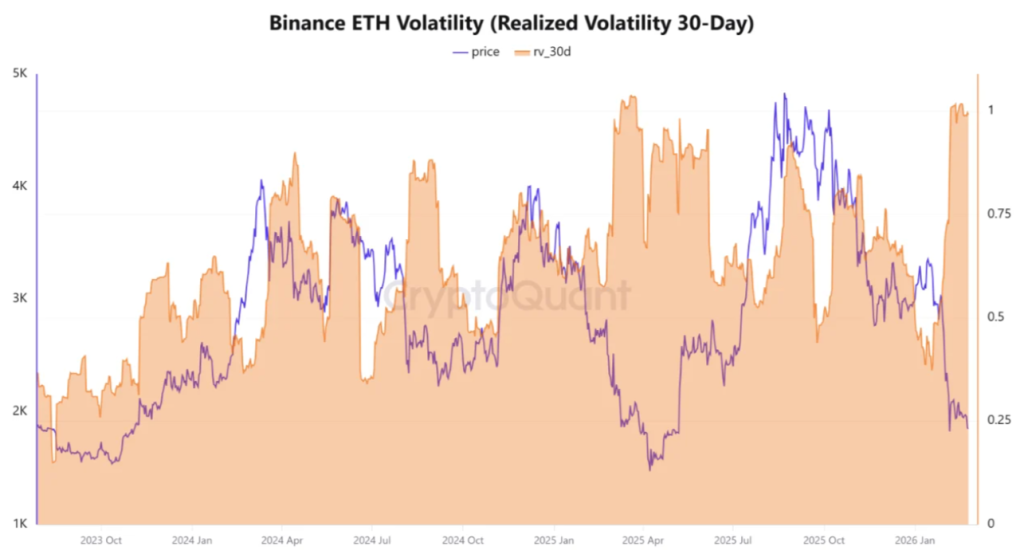
Despite the volatility jump, ETH continues to consolidate above $2,000, implying that buyers are absorbing supply instead of capitulating. This balance between aggressive positioning and controlled price behavior often acts as the final compression before expansion.
Ethereum’s price analysis highlights a pattern the market has seen before, right before major upside moves. According to the analysis, ETH is holding above a long-term ascending support trendline on the monthly chart, a structural level that has guided Ethereum’s biggest rallies in the past. This is not a short-term signal, but a macro support line that has repeatedly acted as a base for sustained bullish phases.
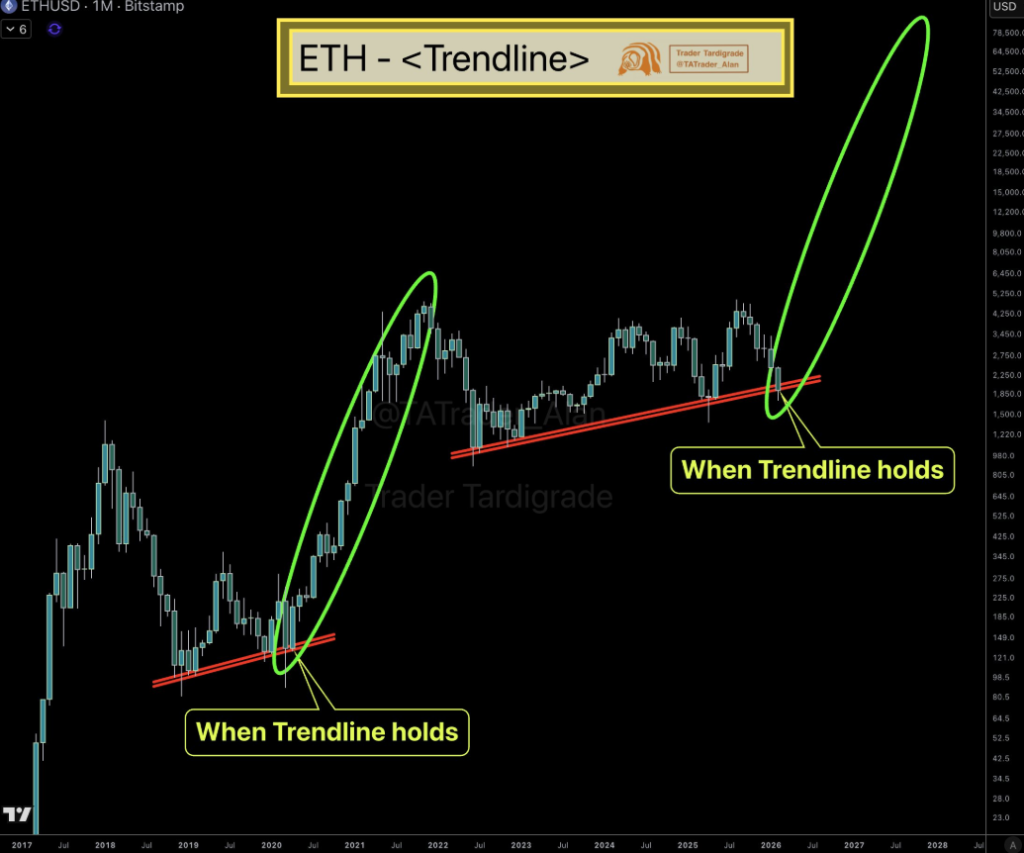
The key observation is that Ethereum is testing this trendline without breaking down, even as volatility rises. Instead of sharp sell-offs, price is consolidating near the $2,000–$2,100 zone, suggesting that buyers are absorbing pressure rather than exiting positions. Historically, when Ethereum has respected this trendline, most notably in 2020, it didn’t just bounce briefly. Price transitioned into a strong upward cycle. If this structure continues to hold, the broader setup favors expansion rather than exhaustion.
While short-term fluctuations are expected, the bigger picture suggests Ethereum is building strength at a critical level, not weakening. For now, this trendline remains the line that separates consolidation from the next major move.
For now, Ethereum price sits at a crossroads. Whale accumulation, leveraged positioning, and rising volatility all point to an important inflection point. While short-term pullbacks remain possible, the broader data suggests that smart money is preparing for expansion rather than exit.
The direction will likely be decided not by headlines, but by how price reacts around $2,000 support and $2,200 resistance in the coming sessions. One thing is clear: Ethereum’s next move is unlikely to be small.

The post Telegram Wallet Launches DeFi Vaults With Up to 18% APY on BTC, ETH, and USDT appeared first on Coinpedia Fintech News
Telegram’s crypto wallet just went from a simple send-and-receive tool to a full DeFi gateway. Wallet in Telegram has rolled out on-chain yield vaults through its self-custodial TON Wallet, letting Bitcoin, Ethereum, and USDT holders earn returns directly inside the app.
The top USDT strategy delivers a blended APY of up to 18%, powered by Re7’s DeFi strategy. ETH and BTC vaults are also live, though their yields are variable and no specific rates were shared.
Three protocols run the backend. Morpho, a lending network sitting on over $10 billion in deposits, provides the infrastructure. TAC, an EVM execution layer, brings wrapped Ethereum (wETH) and Coinbase-wrapped Bitcoin (cbBTC) into the TON network. Re7 handles risk management and curates the yield strategies.
The timing here matters. After the tap-to-earn gaming craze flooded Telegram with mini-apps in 2024, user interest dropped off fast once the token reward hype cooled. The TON ecosystem has been searching for a reason to keep people engaged.
This vault launch looks like the answer. Two weeks ago, Wallet in Telegram added cross-chain deposits through MoonPay, allowing users to fund their TON Wallet with crypto from Ethereum, Solana, Tron, and other major chains. Now those users have somewhere to deploy that capital.
Andrew Rogozov, founder and CEO of The Open Platform and Wallet in Telegram, said, “With Vaults in TON Wallet, we are bridging the gap between sophisticated DeFi protocols and hundreds of millions of users.”
“Access to self-custodial vault strategies for ETH, BTC and USDT directly within TON ecosystem is a massive step toward making decentralized finance truly universal,” he added.
The vaults are self-custodial, so users keep control of their assets. But the 18% APY on USDT is a blended rate from Re7’s strategy, not a fixed guarantee. Returns shift based on market conditions and strategy performance.
BTC and ETH vaults carry the same variable structure. No fixed numbers were announced for either.
Wallet in Telegram plans to let users deposit native BTC and ETH directly, with automatic conversion to cbBTC and wETH once inside TON Wallet.
The platform currently has over 150 million registered users, positioning it as one of the largest crypto wallet operations tied to a messaging app.
Stay ahead with breaking news, expert analysis, and real-time updates on the latest trends in Bitcoin, altcoins, DeFi, NFTs, and more.
It’s a self-custodial feature that lets BTC, ETH, and USDT holders earn on-chain yield directly inside Telegram’s TON Wallet app.
Yes. Users keep control of their private keys and funds, meaning assets stay in their custody, not Telegram’s.
Soon. Telegram plans native BTC and ETH deposits with automatic conversion into wrapped assets inside the TON ecosystem.

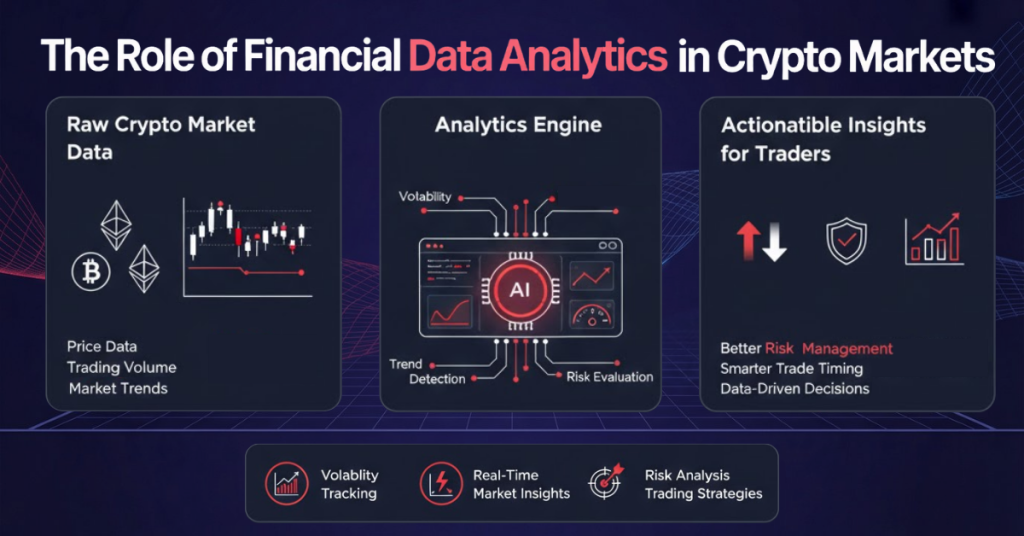
The post The Role of Financial Data Analytics in Crypto, Forex, and Commodity Markets appeared first on Coinpedia Fintech News
Modern financial markets don’t wait for anyone. Bitcoin can drop 15% before your morning coffee gets cold. The euro shifts against the dollar the moment a central bank speaks. Gold prices spike when geopolitical tension rises, and oil reacts to a tweet. For traders, investors, and fintech platforms operating in this environment, gut instinct alone is no longer enough. Real-time data and the ability to make sense of it quickly have become the defining edge, the difference between a well-timed position and a painful loss.
The challenge isn’t access to data, but that markets generate huge volumes of it every single second. Crypto exchanges broadcast price ticks around the clock. Currency pairs update in milliseconds. Gold and oil prices shift with every trade. The real problem is that raw numbers don’t tell you anything on their own. A price without context is just noise. What separates successful market participants from the rest is the ability to transform that constant stream of crypto prices, exchange rates, and commodity valuations into meaningful, actionable insights.
This article breaks down exactly how financial data analytics works across three of the most active and volatile asset classes: cryptocurrency, forex, and commodities. You’ll learn what financial data analytics actually means in plain terms, why real-time market data is critical to every layer of modern finance, and how analytics powers smarter trading, better forecasting, and stronger decision-making. Whether you’re building a fintech product, managing a portfolio, or simply trying to understand how institutional platforms stay ahead, this is where it starts.
At its core, financial data analytics is the process of collecting, organizing, and examining market data to find patterns, trends, and useful insights. Think of it as the difference between watching a stock ticker scroll by and actually understanding what those numbers mean:
It works across several types of data: real-time price feeds showing what an asset is worth right now, historical data revealing how it has behaved over days, months, or years, and volume data showing how much is being traded at any given time. When you combine these data points, you begin to see the bigger market picture, not just isolated numbers.
In practice, financial data analytics is used by traders looking for entry and exit signals, by fintech apps displaying live market data to users, by analysts building economic forecasts, and by financial institutions managing risk across large portfolios. Any platform that analyzes crypto prices, exchange rates, and gold or oil trends is performing financial data analytics continuously and at scale.
Speed and accuracy are everything in financial markets. When Bitcoin dropped over 30% in a single day in May 2021, traders who had analytics systems tracking momentum, volume spikes, and sentiment indicators responded within minutes. Those relying on manual observation reacted far too late. Analytics doesn’t just help you react faster; it also helps you anticipate market moves.
Risk reduction is another major benefit. Analysts track correlations between assets, such as how gold tends to rise when equity markets fall or how oil prices influence inflation-linked currencies. These relationships, when identified through data, allow investors to hedge more effectively and avoid concentrating risk in assets that move together.
Market trend identification is where analytics shines most visibly. Platforms process live market data from multiple sources, detect patterns across asset classes, and surface trends that would take a human analyst hours to spot manually. Data-driven investing, once the domain of large hedge funds, is now accessible to individual investors through retail trading apps that run analytics in the background.
When forex volatility spikes due to a surprise central bank decision, or when gold prices shift sharply during an inflation report, analytics platforms flag these movements in real time and help users understand their implications not hours later, but as they happen.
Crypto markets operate 24 hours a day, seven days a week, with no closing bell. This creates a continuous stream of price data, trading volume, order book activity, and on-chain metrics that never stops. For traders and platforms operating in this space, financial data analytics isn’t optional. It’s the engine that makes the market navigable.
Real-time crypto price tracking allows exchanges and trading dashboards to give users accurate, up-to-the-second valuations across hundreds of tokens. Beyond price, market sentiment analysis pulls signals from social media, search trends, news mentions, and on-chain activity to gauge whether market participants are feeling bullish or bearish, often before that sentiment shows up in price.
Volatility analysis is especially critical in crypto markets because price swings are much sharper than in traditional assets:
Trading signals and predictive insights are the downstream output of all this analysis. Portfolio tracking apps surface when a holding is diverging from its typical pattern. Exchange platforms alert users to unusual volume spikes. Trading dashboards generate buy and sell signals based on technical indicators calculated from live data. All of it runs on financial data analytics, working continuously in the background.
The foreign exchange market is the largest and most liquid financial market in the world, with over $7 trillion traded daily. Exchange rate data sits at the center of forex analytics, as every trade, every hedge, every international transaction depends on accurate, real-time currency valuations. When that data is stale or inaccurate, the consequences ripple across every decision built on top of it.
Currency fluctuation analysis looks at how pairs like EUR/USD, GBP/JPY, or USD/TRY move relative to economic indicators, interest rate decisions, and geopolitical events. Analytics platforms track these correlations and flag when a currency pair is approaching a historically significant level or when volatility is expanding unexpectedly.
Global economic impact on forex trends is one of the most complex areas of financial data analytics. A jobs report in the US, an inflation print in the eurozone, or a rate decision from the Bank of Japan all move currency markets within milliseconds. Fintech platforms rely on accurate exchange rate data sources to ensure their analytics models are working from current, reliable inputs. Using outdated exchange rate data can quickly lead to misleading insights and poor financial decisions.
Real-time currency tracking also matters for businesses beyond pure trading. Multinational companies monitor exchange rates to manage FX risk on international revenue. Payment platforms use live rate data to price cross-border transactions fairly. All of these use cases depend on the same foundation: accurate, low-latency forex data feeding into well-built analytics systems.
Commodity markets carry some of the most important price signals in the global economy. Gold, oil, natural gas, wheat, and copper are not just trading instruments. They’re indicators of economic health, inflation expectations, supply chain stability, and geopolitical risk. Financial data analytics turns commodity price data into a window onto these broader dynamics.
Gold price analytics is a prime example. Gold has historically served as a safe-haven asset when inflation rises, when currencies weaken, or when equity markets fall sharply. Gold tends to attract capital. Analytics models track these correlations, helping investors time gold allocations relative to macroeconomic conditions. During periods of high inflation in 2022, gold analytics helped portfolio managers understand when the metal was pricing in rate expectations versus acting as a pure inflation hedge.
Oil market trend analysis is equally rich with signals. Crude oil prices react to OPEC decisions, geopolitical conflicts in major producing regions, global demand forecasts, and inventory reports from the US Energy Information Administration. Analytics platforms tracking commodity price data from reliable providers allow analysts to overlay these factors and build forward-looking price models rather than simply reacting to yesterday’s close.
Commodity price forecasting combines historical price data, seasonal patterns, supply and demand models, and macroeconomic inputs. The inflation-commodity correlation is one of the most studied relationships in financial analytics. Rising commodity prices, particularly oil and food, are often early indicators of broader inflationary pressure. When analysts track these inputs systematically, they gain a significant lead on markets that are still reacting to lagging data.
There’s a fundamental difference between static data and live data, and in financial markets, that difference is everything. Static data shows where prices were, while real-time data shows where the market stands right now. Analytics built on yesterday’s close is useful for research. Analytics built on live price feeds is what drives actual trading decisions.
Live price feeds give analytics models the inputs they need to stay accurate. When a model is calculating momentum, it needs current prices. When a risk system is checking exposure limits, it needs to know what assets are worth right now, not two minutes ago. Even a small data latency introduces inaccuracy that compounds across a portfolio.
The quality of forecasting and decision-making is directly linked to data freshness. Analytics models trained on historical data but fed live inputs can detect when current market behavior is diverging from established patterns. That divergence is often where the most important signals live, a crypto asset breaking out of its trading range, a currency pair approaching a key technical level, or a commodity price reacting to a supply shock in real time. Without live data, those signals arrive too late to act on.

The practical applications of financial data analytics have expanded dramatically as fintech infrastructure has matured. What once required dedicated quantitative teams at large institutions now runs inside consumer-facing apps used by millions of retail investors.
Trading apps use analytics to generate signals, display market context, and help users make faster decisions. Investment platforms track portfolio performance against benchmarks in real time and surface rebalancing opportunities based on market movements. Robo-advisors apply analytics continuously to manage asset allocation automatically, adjusting portfolios as market conditions shift without requiring manual input from users.
Financial dashboards aggregate data across multiple asset classes, such as crypto, forex, and commodities, into a single interface, using analytics to highlight what matters most at any given moment. Risk management systems are perhaps the highest-stakes application: they monitor exposure across positions, calculate value-at-risk in real time, and trigger alerts when predefined thresholds are breached.
What all of these platforms share is a dependence on high-quality analytics working continuously behind the scenes. The user experience, clean charts, helpful alerts, and automated decisions are the surface. Financial data analytics is the infrastructure that makes it all function.
The next chapter of financial data analytics is being written by artificial intelligence and machine learning. AI-driven analytics systems go beyond predefined patterns. They can discover new trends in data automatically and adapt to market conditions that have never appeared before. Predictive market modeling is becoming more sophisticated, with models that incorporate alternative data sources like satellite imagery of oil storage facilities, shipping traffic as a proxy for trade volume, and real-time news sentiment alongside traditional price and volume inputs.
Cross-market analysis examining crypto, forex, and commodity markets simultaneously to identify inter-asset relationships is an increasingly important frontier. When Bitcoin rallies alongside gold during periods of dollar weakness, or when oil prices and inflation-linked currencies move in sync, analytics systems that watch multiple markets at once can surface insights that single-asset analysis misses entirely.
The result is an emerging data-driven financial ecosystem where analytics is embedded at every layer, from individual trade execution to institutional portfolio construction to macroeconomic forecasting. The tools will become more powerful and more accessible simultaneously, democratizing insights that were once available only to the most resourced players in global markets.
Financial data analytics connects crypto, forex, and commodity markets through a common thread: the ability to turn constant streams of price data, exchange rates, and market signals into clear insights. Whether it’s a trader monitoring Bitcoin volatility, an analyst tracking gold during an inflationary cycle, or a fintech platform giving users live currency conversion rates, the same analytical infrastructure is at work processing, interpreting, and surfacing what matters.
As global markets grow more interconnected and data volumes continue to expand, the competitive advantage will belong to those who can move from raw data to insight faster and more accurately than everyone else. This isn’t a future state; it is already the reality for leading trading platforms, fintech companies, and institutional investors. The gap between data-driven participants and those operating without analytics support will only widen.
Financial data analytics is no longer a technical advantage reserved for large institutions. It is the foundation of modern financial decision-making, the layer beneath every informed trade, every accurate price displayed to a user, and every risk management system keeping portfolios from catastrophic loss. For any platform, investor, or analyst operating in today’s markets, it isn’t optional. It’s essential.
Financial data analytics is the process of analyzing market data like prices, trading volumes, and exchange rates to find patterns and insights that help traders, investors, and businesses make better decisions. Instead of looking at raw numbers, analytics turns those numbers into a clear story about where markets have been, where they are now, and where they might be heading.
In crypto markets, financial data analytics powers real-time price tracking across hundreds of tokens, volatility analysis to help traders manage risk in fast-moving markets, and market sentiment analysis that draws signals from social media and on-chain activity. Trading platforms also use analytics to generate trend predictions and buy or sell signals based on live market data.
Real-time data ensures analytics models are working from accurate, current inputs rather than outdated information. In fast-moving markets, even a short delay in price data can lead to wrong signals, mispriced risk, or missed opportunities. Live price feeds allow platforms to detect market movements as they happen, making forecasting and decision-making faster and more reliable.
Financial data analytics draws on a range of data types, including real-time market prices, historical price data, exchange rates between currencies, trading volume, order book depth, and commodity prices for assets like gold and oil. Analytics models combine these inputs, often alongside macroeconomic data and news sentiment, to generate actionable insights across asset classes.
Absolutely. For traders, analytics provides the signals and market context needed to make faster, better-informed decisions. For investors, it supports portfolio monitoring, risk management, and the identification of market trends before they become obvious. Whether you’re an active trader or a long-term investor, analytics removes guesswork and replaces it with data-driven confidence.
The post Dogecoin Approaches Multi-Year Compression Breakout—Is a Major Move Brewing? appeared first on Coinpedia Fintech News
Dogecoin (DOGE) price is entering a critical structural phase on the weekly timeframe as price compresses inside a multi-year descending wedge. After months of lower highs, the asset is now trading near a key macro support zone between $0.065 and $0.08. The price is up by 5.16%, reaching $0.098 in the past 24 hours. The trading volume has increased by more than 113%, reaching $1.84 billion.
A notable short squeeze, with $4.09 million in DOGE shorts liquidated, has amplified the 113% spike. With volatility tightening and the DOGE price nearing the apex of the wedge, a decisive move may be approaching.
The $0.065–$0.08 region has repeatedly acted as a strong demand zone across the past cycle. Despite prolonged corrective pressure, sellers have not managed to force a sustained breakdown below this area. As long as this support holds, Dogecoin retains the structural possibility of upside expansion. However, a weekly close below $0.065 would invalidate the compression thesis and open room for deeper downside continuation.
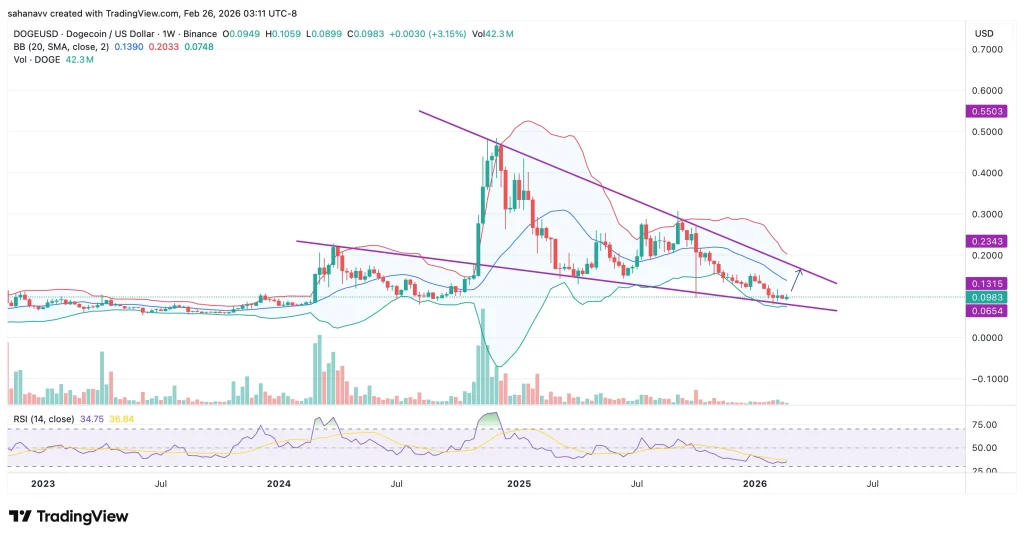
The dominant structure on the weekly chart is a descending resistance trendline extending from the 2024 highs. Price has consistently formed lower highs against this barrier. For a confirmed breakout, DOGE must break above descending trendline resistance, reclaim $0.1315 as support and build momentum toward $0.2343
Bollinger Bands on the weekly timeframe are tightening, reflecting declining volatility. Such compression phases often precede sharp directional moves. At the same time, the weekly RSI sits near the mid-30s, indicating momentum remains weak but not deeply oversold. This suggests Dogecoin is stabilizing rather than aggressively reversing. The current setup presents a classic high-risk, high-reward environment.
A breakout above descending resistance could trigger acceleration toward $0.13, followed by $0.23. Under strong market conditions, an extended upside toward the $0.50–$0.55 region becomes structurally possible. Besides, a failure to hold $0.065–$0.08 support would invalidate the wedge structure and likely extend the broader downtrend.
The Dogecoin price is not yet in a confirmed breakout. It remains compressed inside a multi-year corrective structure. However, with weekly support intact and volatility tightening, the setup now demands attention. The next major move may depend on whether resistance gives way or support finally fails.


The post Fact Check: Is China Launching a “Chinese Bitcoin” 10X Cheaper and Faster Than BTC? appeared first on Coinpedia Fintech News
A viral claim is circulating on social media platforms like X and Telegram claiming that China is planning to launch a “Chinese Bitcoin” that is 10X cheaper and 10X faster than Bitcoin.
The claim has created excitement and confusion, especially as China continues to work on digital currency projects.
Therefore, Coinpedia decided to fact-check whether this claim is real or just another rumor.
The claim was made by Chinese crypto whale Wei Zhao, who said that China is launching a “Chinese Bitcoin” that is 10X cheaper and 10X faster than Bitcoin. Although these claims do not cite any official Chinese government announcement,
But is all this claim true? Let’s break it down.
No Official Announcement from the Chinese Authority
There is no official announcement from the People’s Bank of China or state-backed blockchain projects about launching a “Chinese Bitcoin.”
The claim appears to come only from social media rumors and influencers, not from any official announcement or policy.
China Has Banned Bitcoin and Private Cryptocurrencies
Until now, China has maintained a strict ban on cryptocurrencies. The government already declared all crypto transactions illegal and banned trading, mining, and exchange activity.
Instead of promoting Bitcoin alternatives, China has focused on expanding its state-controlled digital yuan system.
China Is Developing a Digital Currency, But It’s Not Bitcoin
China has already developed its own state-backed digital currency called the digital yuan (e-CNY), issued directly by the People’s Bank of China. This is a central bank digital currency (CBDC), not a decentralized cryptocurrency like Bitcoin.
The Chinese government believes in a centralized powered token; therefore, they won’t be launching such a token that they cannot track and maintain control over.
| Claim Made by Theory | Coinpedia’s Counter-Evidence |
| Is China launching Chinese Bitcoin | No official announcement from a government body |
| Does China support any digital assets? | Yes, the digital yuan, which operates as a centralized legal tender backed by China’s currency, is not a Bitcoin competitor. |
| China is supporting decentralized crypto | No, because China banned Bitcoin, which is a decentralized cryptocurrency. |
| Claim | Is China launching a “Chinese Bitcoin” that is 10X cheaper and faster than Bitcoin? |
| Verdict |  False False |
| Fact-Check by Coinpedia | As per Coinpedia’s research and review of the official Chinese government policy, there is no verifiable evidence that China is launching a decentralized Bitcoin competitor.Until official confirmation is provided by Chinese authorities, this claim remains false and misleading. |
The post Cardano Attempts a Breakout Above $0.30 While Broader Downtrend Remains Intact—What’s Next? appeared first on Coinpedia Fintech News
Cardano price is showing early signs of momentum recovery as the price pushes toward the $0.30 resistance zone. While short-term strength is building, the broader daily structure still reflects a descending trend, placing the current move at a turning point.
The next few sessions may determine whether the ADA price can extend higher or whether the recovery stalls under persistent bearish pressure.
On the daily timeframe, Cardano has climbed back toward the $0.30–$0.31 zone, an area that previously acted as support before breaking down. That level has now flipped into resistance, making it a decisive test for bulls.
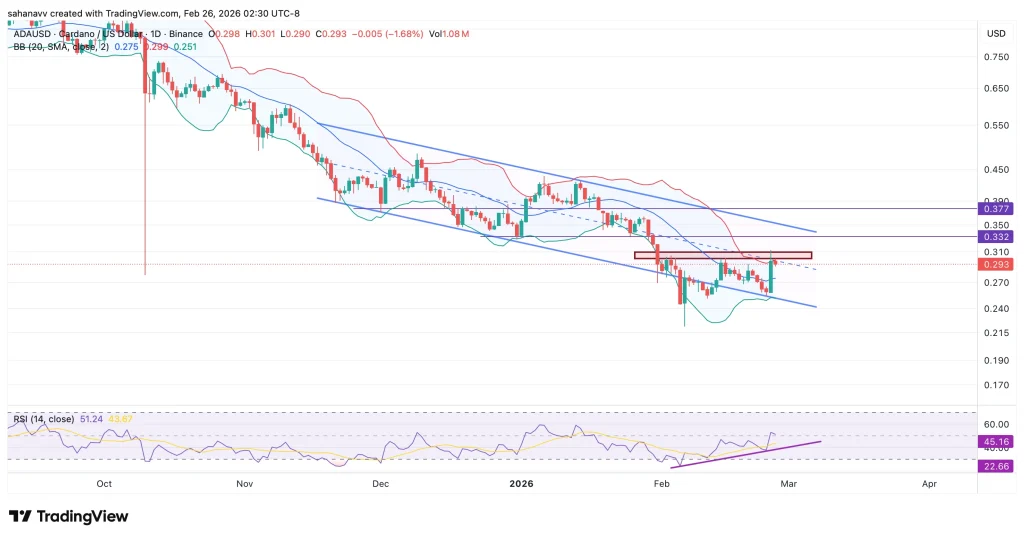
The move toward this zone comes after a series of higher lows from recent swing bottoms, signaling that buyers are attempting to stabilize price action. However, ADA remains below the descending channel resistance and short-term moving averages, which continue to cap upside attempts.
A sustained daily close above $0.31 would mark the first meaningful structural improvement in weeks.
The Relative Strength Index (RSI) has recovered above the 50 mark on the daily chart, reflecting strengthening momentum. Notably, RSI formed higher lows even as price tested recent downside levels, a constructive divergence that supports the current bounce.
Still, momentum improvement alone does not confirm a trend reversal. Cardano price continues to trade within a broader descending channel, with lower highs defining the macro structure. Until that pattern breaks decisively, rallies remain vulnerable to rejection.
If Cardano price holds above $0.31 with strong follow-through, the next resistance levels to watch are
A break above these levels would begin shifting the broader structure away from lower highs and toward potential range expansion. Failure to reclaim $0.30–$0.31 would reinforce the existing bearish trend.
In that scenario:
Without confirmation above resistance, the current rally may remain corrective rather than transformative.
Cardano price is showing early signs of strength, but the broader downtrend remains intact. The market is at a transition zone, where short-term recovery meets long-term resistance.
Much like Bitcoin’s battle near $70,000, ADA now faces its own structural decision level.
Whether this develops into a sustained breakout or another lower high will depend on how the ADA price behaves around $0.30 in the coming sessions.
The post Bitcoin Options Expiry Looms as $8.8B BTC & ETH Contracts Could Trigger Volatility appeared first on Coinpedia Fintech News
As the crypto market extends its rebound, traders are now turning cautious ahead of a major derivatives event. Bitcoin options expiry tomorrow could act as a near-term catalyst for volatility, with billions in BTC and ETH contracts approaching settlement. While spot prices look strong for now, history shows that options expiry often brings sharp intraday swings, fake breakouts, or sudden reversals.
At the time of writing, Bitcoin is holding near $68,000, up nearly 4% on the day, while Ethereum has surged close to $2,100, posting an even stronger 8% rally. The question now is whether this momentum can sustain after expiry, or if the market sees a brief volatility shakeout.
According to data from Deribit, more than $7.8 billion in Bitcoin options and around $1 billion in Ethereum options will expire at 08:00 UTC on February 27. Current positioning shows:
— Deribit (@DeribitOfficial) February 26, 2026
Options Expiry Alert
At 08:00 UTC tomorrow, over $8.8B in crypto options are set to expire on Deribit.$BTC: ~$7.8B notional | Put/Call: 0.76 | Max Pain: $75K $ETH: ~$961M notional | Put/Call: 0.77 | Max Pain: $2,200
Call OI dominates across both assets, with BTC carrying… pic.twitter.com/5r8MjeQtJ9
Such skew suggests traders are positioned for higher prices, but it also increases the risk of short-term pullbacks once hedges unwind post-expiry.
Bitcoin’s recent upswing has reclaimed a critical zone between $67,000 and $68,000, an area that previously capped upside during the pullback. Holding above this range into and after expiry would signal that spot demand is absorbing derivatives-driven pressure. From a downside perspective, failure to maintain acceptance above $67,000 could invite a quick retracement toward $65,500–$66,000, where prior accumulation occurred. Such a move would likely reflect expiry-related positioning rather than a broader trend breakdown.
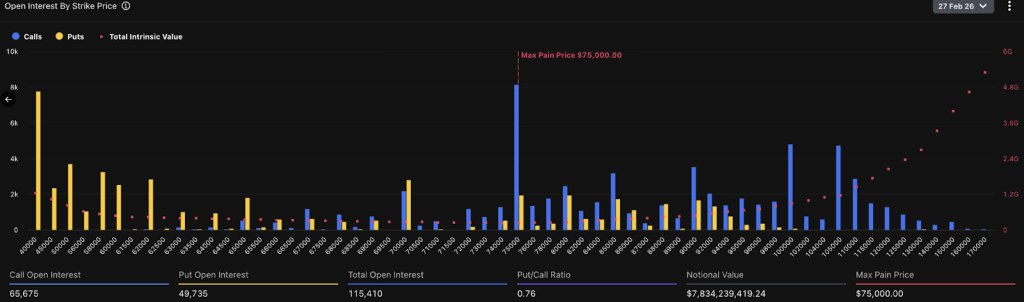
On the upside, a post-expiry hold above $68,000 opens the door for a challenge of the $69,500–$70,000 resistance zone. A clean break and hold beyond that area would confirm that Bitcoin’s recovery is extending beyond derivatives noise.
Ethereum’s price action stands out ahead of expiry. Trading near $2,100, ETH has delivered an 8% rise today, supported by stronger spot participation and improving sentiment across large-cap altcoins. However, Ethereum options positioning suggests a nearby max pain zone around $2,200, which could act as a short-term gravity point during expiry-related volatility. If ETH continues to hold above $2,000, the structure remains constructive, even if short-term pullbacks occur.
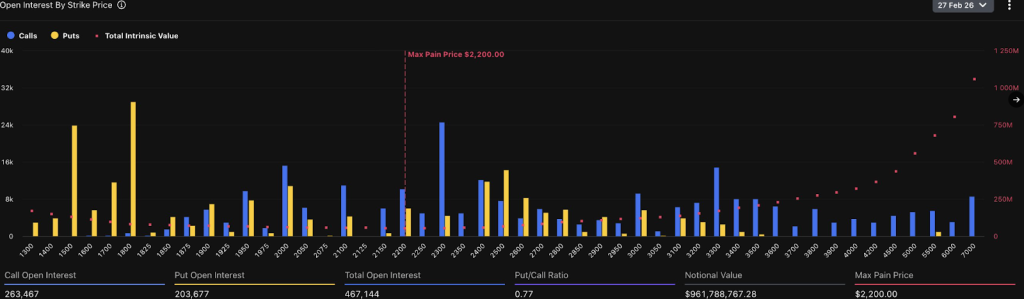
A rejection below $2,000 after expiry would likely signal temporary cooling rather than a trend reversal, with deeper support resting near $1,920–$1,950. Sustained acceptance above $2,100–$2,150, on the other hand, would reinforce Ethereum’s leadership in the current recovery phase.
Bitcoin options expiry tomorrow is more about volatility than trend change. With BTC at $68K and ETH near $2.1K, the market is entering a decision phase. Short-term turbulence is likely around expiry, but if prices stabilize afterward, the broader bullish structure could remain intact. Traders should expect fast moves, stay cautious around key levels, and wait for confirmation after the expiry dust settles.

The post Why Is Cardano (ADA) Price Up Today? 16% Rally Pushes ADA Back Into Top 10 appeared first on Coinpedia Fintech News
Cardano (ADA) has jumped back into the top 10 cryptocurrencies by market cap after a strong 16% rally today. The token climbed from a low of $0.25 to nearly $0.312, pushing its total market value to around $10.6 billion.
Here’s what is actually driving the Cardano ADA price up today?
One of the main reasons behind this rally is the overall recovery in the crypto market. The total market cap has climbed to $2.34 trillion, up 4.4%. This strong move lifted major coins like Bitcoin, Ethereum, XRP, Solana, Dogecoin, and Cardano.
After the sharp recovery, Cardano surged 16%, rising from a low of $0.25 to around $0.312.
Another major reason behind Cardano’s rally is strong accumulation by whales and large investors. According to Santiment data, wallets holding between 100,000 and 100 million ADA have accumulated over 819.4 million ADA in the past six months.
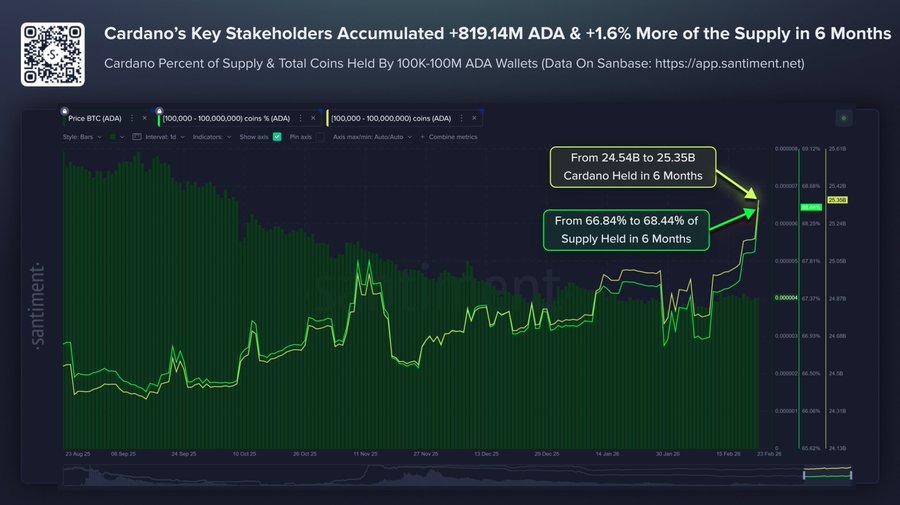
This amount is worth about $213.9 million and represents around 1.6% of Cardano’s total supply. Such accumulation has historically marked early recovery phases in crypto markets.
Another slight push came from Cardano price, which saw a massive surge in 24-hour trading volume, which spiked 181% to $1.15B, indicating strong buying pressure and validating the price move.
Interestingly, Cardano’s price also saw a strong liquidation of $2.4 million in the last 24 hours. Most of the liquidation, around 75%, came from short liquidation.
Looking at the Cardano daily chart, ADA shows early signs of a potential breakout after months of steady decline. Price has been trading inside a descending trendline since late 2025, forming lower highs and lower lows.
Recently, ADA compressed into a tight triangle pattern near the $0.27–$0.28 support zone, indicating reduced volatility and buildup for a larger move.
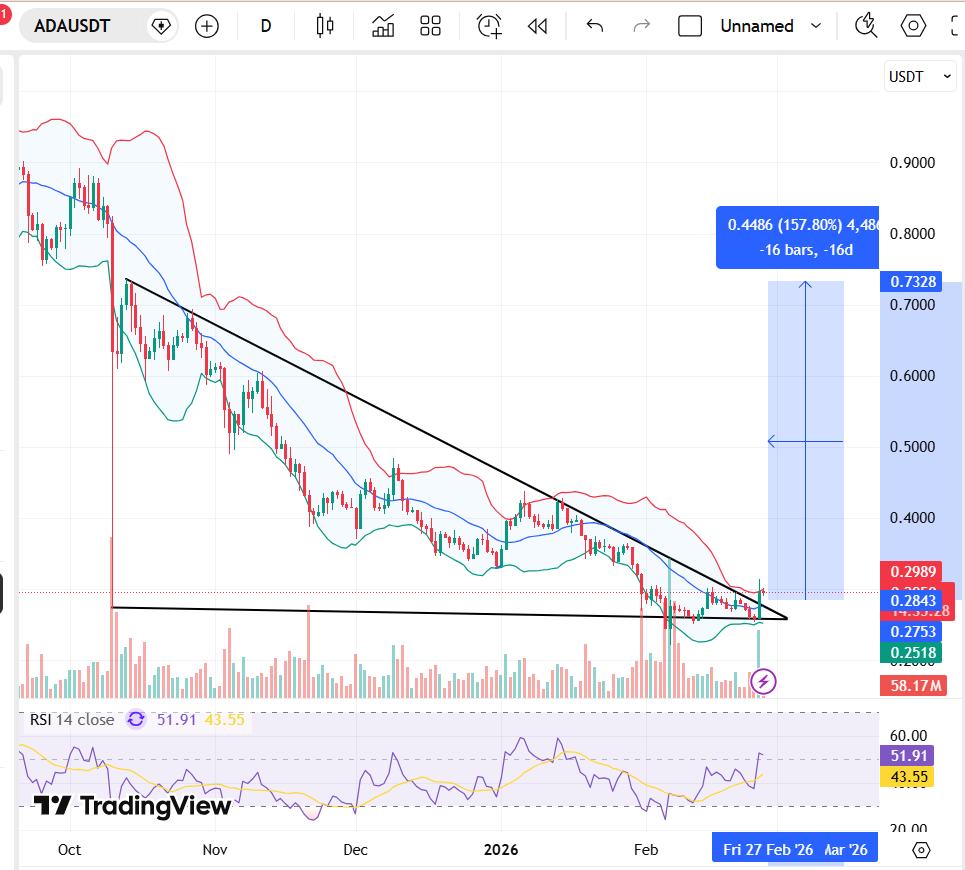
The price is now attempting to break above the short-term downtrend line around $0.29. A confirmed daily close above $0.35 could open the path toward $0.40, followed by a stronger resistance zone near $0.50.
The projected move on the chart suggests a possible upside toward the $0.70–$0.73 area if bullish momentum strengthens.
Stay ahead with breaking news, expert analysis, and real-time updates on the latest trends in Bitcoin, altcoins, DeFi, NFTs, and more.
Cardano is up 16% due to a broader crypto market recovery, strong whale accumulation worth $213M, rising trading volume, and short liquidations.
Yes. Large wallets accumulated over 819 million ADA in six months, signaling confidence and often marking early recovery phases.
If ADA closes above $0.35, it could target $0.40, then $0.50. Strong momentum may even push it toward $0.70–$0.73.
The post Walletverse Launches 1inch Swaps In-App, Unlocking Aggregated Liquidity, Better Execution, and Cross-Chain Exchanges appeared first on Coinpedia Fintech News
Walletverse today announced that 1inch is now live inside the Walletverse app, enabling users to swap crypto using one of the most widely used DEX aggregation infrastructures in DeFi. 1inch is designed to search across multiple liquidity sources and route swaps to improve execution compared with relying on a single venue.
With the integration, Walletverse users can access:
The feature is fully live and ready to use.
In decentralized markets, the final price you get depends on liquidity depth, routing, slippage, and how your trade is executed. DEX aggregators exist to solve this by splitting a trade across routes and venues when necessary to improve price and reduce slippage. 1inch’s routing approach (often referred to via its Pathfinder routing logic) is designed specifically for this “best-path” execution problem.
By bringing 1inch in-app, Walletverse aims to make that execution quality accessible in a simpler user flow, so users can swap without manually comparing routes or jumping between tools.
1. Better pricing through aggregated liquidity. Instead of relying on a single DEX, 1inch aggregates liquidity and can route across multiple sources to find more efficient execution.
2. Reduced slippage on many swaps. When liquidity is fragmented, splitting swaps across routes can reduce price impact versus one-shot execution in a thin pool (especially for larger orders).
3. Cross-chain capability designed for modern multi-network users. Cross-chain swaps are becoming a default user expectation. 1inch has developed intent-based mechanisms (Fusion / Fusion+) intended to simplify cross-chain execution while improving user experience (including approaches that can reduce user overhead like gas handling, depending on the mode).
4. Reliability signals: security programs and published audits. For users, reliability is not only uptime it’s confidence that protocols are engineered and reviewed seriously. 1inch maintains active bug bounty programs (including rewards up to $500K for certain scopes) and also maintains a public repository of audit reports for multiple 1inch smart contract systems.
5. A more consistent swapping experience across major chains. As crypto becomes increasingly multi-chain, users want one place to manage assets and execute swaps. DEX aggregation is one of the most practical ways to deliver consistent execution across networks, without requiring users to learn different DEX interfaces for each chain.
Walletverse built the integration to keep swaps straightforward while still taking advantage of aggregator routing logic under the hood. Users can choose assets, review details, and complete swaps in one flow, without needing to navigate separate dApps or manually assemble routes.
Quote (Walletverse product manager):
“This integration is about execution quality and user confidence: better routing, lower friction, and cross-chain flexibility inside a single app experience.”
The 1inch integration is available now in the Walletverse app.
Users can open the Swap feature, select assets and networks, review the quote, and confirm the transaction.
1inch is a DeFi aggregator built to help users trade tokens more efficiently by routing across multiple liquidity sources and optimizing execution.
Walletverse is a non-custodial crypto wallet that supports 1500+ crypto assets and provides access to DeFi features, along with built-in AML and KYT tools designed to support safer crypto activity.

The post WBT Price Analysis: WhiteBIT Token Tests Critical $50 Support. Can Bulls Reclaim the All-Time High? appeared first on Coinpedia Fintech News
WBT consolidates near $50 after a 21% pullback from ATH. A $4.1B token unlock on March 13 looms as the defining catalyst, while WhiteBIT’s U.S. and Saudi Arabia expansion provides fundamental support.
STORY HIGHLIGHTS
| WBT PRICE | MARKET CAP | 24H VOLUME | ATH DISTANCE |
| $50.45 | $10.8B (#10 to #12) | $63.5M (down 25.5%) | 21.3% below ATH ($64.11) |
WhiteBIT Coin (WBT) is the native token of Europe’s largest crypto exchange by traffic, and it’s sitting at a pivotal level right now. The token is trading around $50.45, carrying a market cap of over $10.8 billion with roughly 213.7 million WBT in circulation. Depending on the aggregator, that places it somewhere between the 10th and 12th largest crypto asset globally.
Over the past week, WBT has shed about 2.3%, and over the past month it’s down 8.4%. Daily trading volume came in at roughly $63.5 million, which is 25.5% lower than the day before, pointing to fading short-term interest. The fully diluted valuation sits at around $16.1 billion if all 400 million tokens were in circulation.
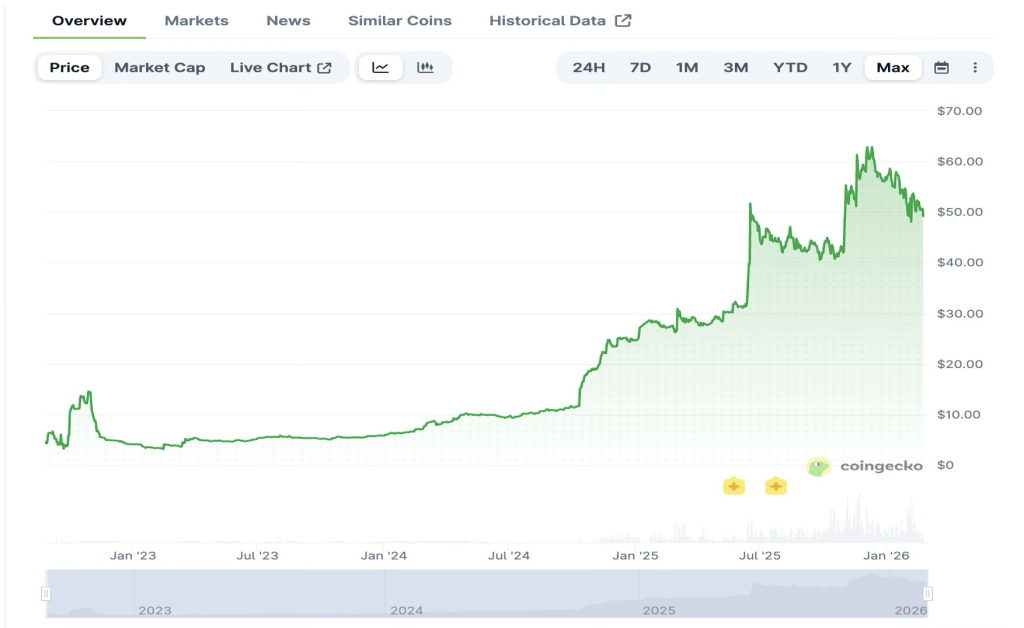
The max chart tells quite a story. WBT launched in August 2022 and bottomed out at $3.06 in February 2023. For the next two years, it traded in a tight range between $4 and $12 with very little excitement. The real breakout kicked off in early 2025 when WhiteBIT started announcing major partnerships and geographic expansion. That sent WBT from around $10 in January 2025 all the way to $64.11 by December 2025. A 540%+ rally in under 12 months.
Since that December peak, the price has given back a good chunk of those gains, losing the $55 and $52 levels before settling into the $48 to $50 range. WBT is now testing $50 for the fourth time. This level has held since mid-2025, and the longer it stays here without a strong bounce, the more vulnerable it becomes to a breakdown.
On the year, WBT is down about 8.9%. But zoom out and the picture looks very different: the 1-year return is around 84 to 90%, and the 3-year return exceeds 1,170%.
| LEVEL | PRICE | SIGNIFICANCE |
| Resistance 3 (ATH) | $64.11 | December 2025 all-time high. Needs major volume to reclaim. |
| Resistance 2 (Upper BB) | $62.04 | Upper Bollinger Band. Sellers have historically stepped in here. |
| Resistance 1 (50-day MA) | $54.07 | First real hurdle. A daily close above this flips the short-term bias bullish. |
| Current Price | ~$50.45 | Consolidation zone. Fourth test of this level since mid-2025. |
| Support 1 (200-day MA) | $49.79 | Long-term trend support. The line in the sand for swing traders. |
| Support 2 | $48.00 | Breakdown trigger. Losing this opens the door to $40 to $42. |
| Support 3 | $40 to $42 | Next major demand zone if $48 gives way. |
MACD (12, 26 close)
The MACD is showing a slight bearish lean, with the signal line at –0.183 and the MACD line at –0.166. That said, momentum is shifting. The MACD is creeping back toward the mean line, and the histogram bars are starting to turn green. If the MACD line crosses above the signal in the coming sessions, that would be an early sign that buyers are stepping back in.
RSI (Relative Strength Index)
RSI is sitting at around 57.5, just above the neutral 50 mark. WBT is neither oversold nor overbought, which lines up with the consolidation story. A push above 60 would give the bulls more confidence, while a drop below 45 would hand control to the sellers.
Bollinger Bands & Volume
Price is trapped between the lower Bollinger Band at $53.86 and the 200-day MA at $49.79. The bands are narrowing, which usually means a big move is coming. Volume has dropped to about 80% of the daily average (~$104.8 million), another classic sign that a breakout is loading. The question is direction.
Key Risk Event: March 13 Token Unlock
This is the big one. According to CoinGecko, 81.5 million WBT tokens (roughly 25% of total supply) are set to unlock on March 13, 2026 under the Funds 2 tranche. At current prices, that’s about $4.1 billion worth of tokens hitting the market.
For context, the current circulating supply is around 210 million WBT. Adding 81.5 million tokens represents a nearly 39% increase in available supply. That’s significant. Large unlocks tend to create selling pressure as early backers and funds look to take profits.
The counterargument is WhiteBIT’s ongoing burn program. The exchange runs weekly token burns with a stated target of eventually destroying at least half of all WBT. If they ramp up burns around the unlock or introduce new staking lockup incentives, the net impact on circulating supply could be more muted than the headline number suggests. Either way, the two to three weeks leading up to March 13 will be critical to watch.
Fundamental Catalysts Behind WBT’s Rise
The technicals are uncertain, but the fundamental story is the strongest it’s ever been. WhiteBIT had a breakout year in 2025 on the business side, and that’s what drove WBT from $10 to $64 in the first place.
WhiteBIT US Launch (December 2025)
WhiteBIT officially entered the U.S. market in December, setting up WhiteBIT US as an independent, New York-based entity. They’ve already secured operational licenses and launched with spot trading, instant exchange, and fiat on/off ramps. The plan is to expand across all 50 states with institutional custody and liquidity products. They even ran a Times Square billboard campaign to announce the launch. This isn’t a soft entry; they’re going all in.
Saudi Arabia Strategic Partnership
Earlier in 2025, WhiteBIT signed a cooperation agreement with Durrah AlFodah Holding, backed by His Royal Highness Prince Naif Bin Abdullah. The partnership covers blockchain infrastructure, CBDC frameworks, tokenization, and data infrastructure, all tied to Saudi Arabia’s Vision 2030. This isn’t your typical crypto partnership announcement. It carries sovereign-level weight and gives WhiteBIT a foothold in one of the wealthiest markets on the planet.
S&P Crypto Index Inclusion & Ecosystem Growth
WBT got added to five S&P Cryptocurrency Indices last year. That’s a big deal for institutional visibility and benchmark tracking. The W Group ecosystem (WhiteBIT’s parent) now serves 35 million users across 150+ countries and moves around $3 trillion in annual trading volume. Add in partnerships with Juventus, FC Barcelona, Visa, and TradingView, and you’ve got a brand that’s showing up well beyond the crypto-native crowd.
Platform Development & Products
WhiteBIT shipped a lot in 2025. The Nova debit card crossed €50 million in cumulative volume, averaging €750 per user per month. They launched WB Check for simplified crypto transfers, grew their mining pool (WhitePool) to over 10 EH/s, and rolled out Hedge Mode for futures. The infrastructure handles over 1 million operations per second. The product side of the business is keeping pace with the BD and marketing push.
WBT Tokenomics: The Deflationary Edge
WBT has a hard cap of 400 million tokens. No more will ever be minted. Right now, about 213.7 million are circulating (total supply is around 320 million), with 81.5 million locked until the March unlock. What makes the tokenomics interesting is the weekly burn program. WhiteBIT has committed to burning tokens until at least half of the total supply is destroyed. That’s a structural deflationary mechanism that most exchange tokens don’t have.
On the utility side, holding WBT gets you up to 90% off taker fees, up to 100% off maker fees, free daily ERC-20/ETH withdrawals, free AML checks, 50% higher referral rates, and boosted staking yields on USDT lending. As of mid-February, roughly 99.52% of the circulating supply is in profit. Holders are clearly sitting tight despite the correction.
The token lives on Ethereum, TRON, and WhiteChain (WhiteBIT’s own chain), and has been audited by Hacken.
WBT is at a crossroads. The $50 level is being tested for a fourth time, the MACD is showing early recovery signals, and the RSI is neutral. But volume is thinning and the March 13 unlock could flood the market with $4 billion worth of new supply.
On the other hand, WhiteBIT’s expansion into the U.S. and Saudi Arabia, five S&P index inclusions, the weekly burn mechanism, and platform metrics (35 million users, $3 trillion annual volume, zero security incidents) give WBT a fundamental backing that most tokens in this market cap range simply don’t have.
For bulls: Hold above $48 is the baseline. A daily close above $54 (the 50-day MA) with strong volume would confirm a reversal and put the $62 to $64 ATH zone back in play. Some analysts are targeting $70 to $72 if momentum returns after the unlock.
For bears: A daily close below $48 on rising volume would break the structure that’s held since mid-2025. That opens the path to $40 to $42, especially if early investors start front-running the unlock with heavy selling in early March.
The next three weeks will likely decide WBT’s direction for the rest of Q1. Keep an eye on any burn schedule announcements, staking incentives, or strategic allocation plans from WhiteBIT as March 13 approaches. Those details will matter more than the unlock itself.

The post Why Is Bitcoin Dropping? South Korea’s Record KOSPI Rally Shows Where Crypto Capital Is Going appeared first on Coinpedia Fintech News
Bitcoin has lost 45% of its value since October, currently trading at $68,617. The Crypto Fear & Greed Index dropped to 5 this month, its lowest reading ever recorded. Meanwhile, South Korea’s stock market just hit a new all-time high.
The KOSPI index broke past 6,000 this week, now up nearly 175% over the past year. That makes it one of the strongest rallies among major global markets right now. And it is being fueled largely by one sector: semiconductors.
Chipmakers Samsung Electronics and SK hynix carry massive weight inside the KOSPI. When semiconductor earnings expectations rise, the entire market moves higher.
South Korea’s early February data backs this up. Daily average exports surged +47% year-over-year, even with fewer working days due to the Lunar New Year holiday. Semiconductor exports alone jumped +134% YoY, making up more than a third of total shipments.
Since semiconductor exports directly drive revenues for Korea’s largest listed companies, rising global AI demand is quickly translating into higher earnings expectations across the stock market.
South Korea has historically been one of the most retail-driven crypto markets in the world. During bull markets, local demand often gets so strong that Bitcoin trades at higher prices on Korean exchanges compared to global markets. This price gap is known as the Kimchi Premium, and it has long been viewed as a sign of aggressive retail money entering crypto.
That premium has now compressed significantly.
Since the October crash, retail capital that previously flowed into crypto appears to be shifting toward domestic equities, particularly AI and semiconductor stocks tied to the global AI investment boom.
The retail money in Korea hasn’t disappeared. It may simply be chasing AI instead of crypto.
On the regulatory side, South Korean lawmaker Kim Seung-won introduced a proposal that would require crypto influencers to publicly reveal their holdings and any compensation received for promoting projects. Violations would carry penalties on par with market manipulation and unfair trading practices.
Also Read: South Korea Nears Landmark Crypto Regulation With Digital Asset Basic Act
South Korea’s stock market is breaking records. Bitcoin is still trying to recover from its worst drawdown since 2022. And the retail capital that once powered the Kimchi Premium is fueling a very different rally in 2026.


The post Is Wall Street Capping Bitcoin Every Morning? Bitwise Breaks Silence appeared first on Coinpedia Fintech News
A new theory has been making the rounds online: that Bitcoin is being deliberately pushed down every day at 10 a.m. Eastern Time.
Some social media users have pointed fingers at Jane Street, claiming the firm used an algorithm to sell Bitcoin at the same time each morning, triggering retail liquidations, scooping up coins at lower prices, and repeating the cycle. According to the narrative, the pattern mysteriously stopped once legal scrutiny intensified, and Bitcoin has since posted one of its strongest days in months.
But Jeff Park, an advisor at Bitwise Asset Management, says there’s simply no evidence to support it.
Park pushed back on the idea that institutions are coordinating to suppress prices during U.S. morning trading hours.
Instead, he argues that many observers are misunderstanding how Bitcoin ETFs and institutional trading actually work.
At the center of the confusion is the structure of spot Bitcoin ETFs. When demand for ETF shares increases, large firms known as authorized participants step in to create new shares. But they don’t always rush out and buy spot Bitcoin immediately.
Often, they hedge exposure first using futures or derivatives. The actual spot buying may happen later. That timing gap can make price action look strange in the short term — especially during heavy trading hours.
According to Park, what some are calling manipulation may simply be ETF mechanics and arbitrage doing what they’re designed to do.
There’s also a bigger market reality at play.
Ten o’clock in the morning comes shortly after U.S. stock markets open at 9:30 a.m. That’s when trading volumes surge, portfolios are adjusted, and institutional desks rebalance positions. Bitcoin has shown a strong correlation with the S&P 500, so equity-driven flows can spill into crypto almost instantly.
Bitcoin trades around the clock, but liquidity conditions change throughout the day. When U.S. participation ramps up, order books can shift quickly, making routine moves look more dramatic than they are.
The idea of a coordinated “10 a.m. dump” is easy to share and hard to prove.
Markets move in patterns. Algorithms trade at set times. Liquidity shifts when major financial centers come online. That doesn’t automatically mean there’s a coordinated effort to cap prices.
For now, the viral theory remains just that — a theory.
And according to Park, the simpler explanation is often the right one: market structure, ETF flows, and macro trading dynamics are more than enough to explain the volatility.
Stay ahead with breaking news, expert analysis, and real-time updates on the latest trends in Bitcoin, altcoins, DeFi, NFTs, and more.
There’s no verified evidence of coordinated 10 a.m. price suppression. Most moves align with U.S. market open volatility and ETF trading flows.
10 a.m. ET follows the U.S. stock market open. Higher trading volume, portfolio rebalancing, and ETF hedging can trigger short-term swings.
Algorithmic trading is common, but timing patterns alone don’t prove manipulation. Market structure and liquidity shifts explain most moves.
Bitcoin often reacts to macro trends and risk sentiment. When stocks move after market open, crypto can follow due to shared investor flows.
The post Bitcoin Faces Crucial $70,000 Test—Can Bulls Secure the Level and Shift Momentum? appeared first on Coinpedia Fintech News
Bitcoin is approaching one of its most important technical levels in recent weeks as the price gravitates toward the $70,000 mark. After stabilizing above short-term support, the crypto market now faces a decisive test that could determine whether the current recovery develops into a sustained breakout or fades into another lower high within a broader downtrend.
With whale activity increasing and funding rates turning deeply negative, $70,000 has become the structural pivot for the next major move of the BTC price rally.
The $70,000 zone is not just a psychological milestone. It represents a convergence of multiple technical factors. First, the area previously acted as support before the recent breakdown. That support has now flipped into resistance, making it a natural battleground between bulls and bears.
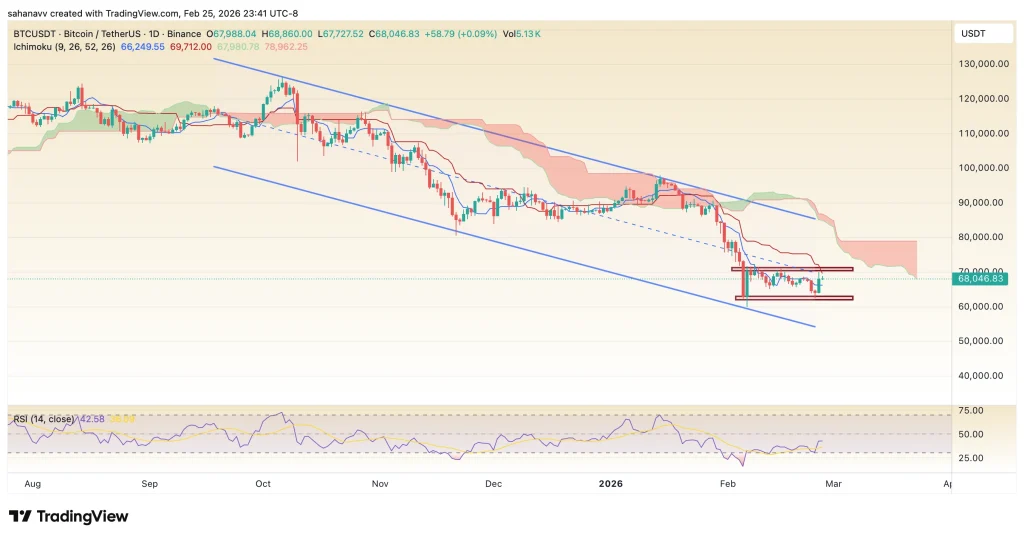
Second, on the daily timeframe, the Bitcoin price continues to trade inside a descending channel. The $69,500–$70,000 region aligns closely with the mid-range of that channel and the lower-high structure formed during the ongoing correction.
Third, the Ichimoku indicator shows the price still below the cloud, while the levels converge, raising hopes for a bullish crossover. A decisive reclaim of $70,000 would signal a recovery of short-term equilibrium, something that has yet to be achieved. In short, $70,000 is not just resistance. It is a structural checkpoint.
On-chain data shows a noticeable presence of large spot orders in the $60,000–$80,000 range, indicating active participation from bigger players. This suggests that significant capital is positioning around current levels.
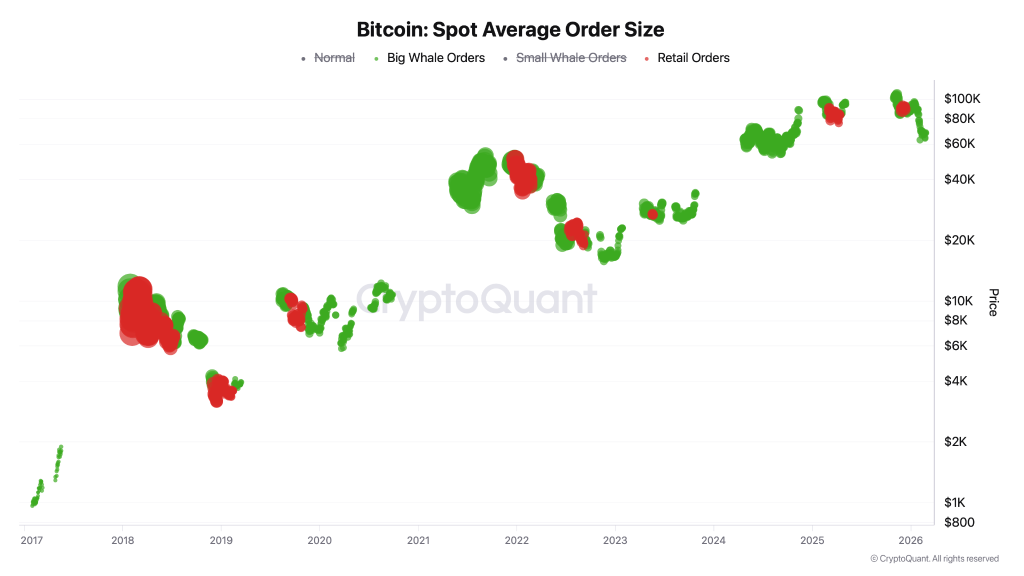
At the same time, funding rates across major exchanges have turned negative, with recent readings around -0.007. Negative funding means short traders are paying to maintain their positions, reflecting persistent scepticism despite price stabilization.
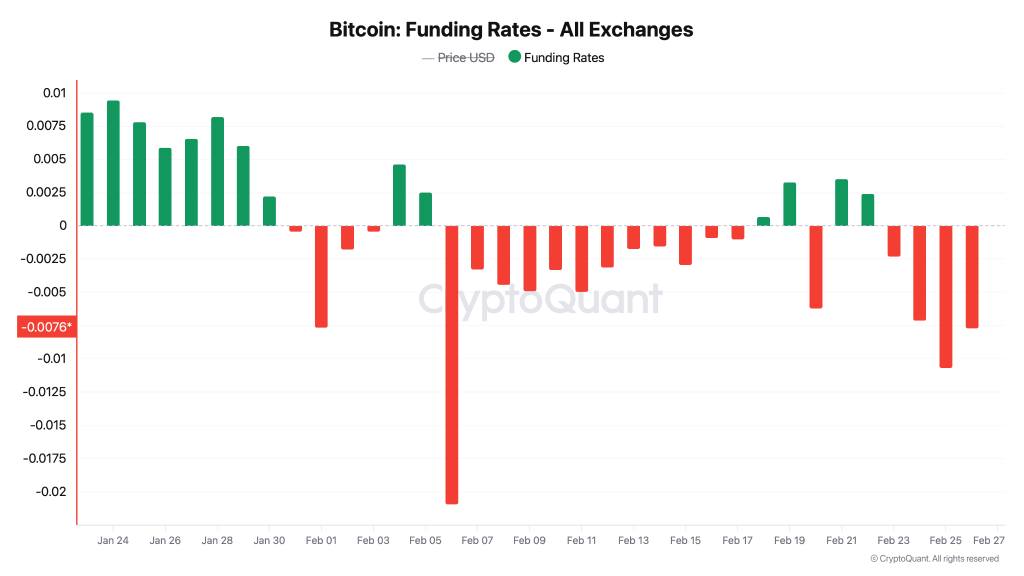
This combination, whale activity alongside short-biased derivatives positioning, creates a compressed setup. Such environments often precede sharp directional moves.
For bulls, simply wicking above $70,000 is not enough. The key requirement is a strong daily close above the level, ideally followed by sustained acceptance.
If Bitcoin price secures $70,000:
A clean hold above $70,000 would weaken the lower-high structure and shift short-term momentum in favor of buyers.
If BTC price fails to reclaim $70,000 and forms another lower high, the broader descending structure remains intact.
In that scenario:
A rejection at $70,000 would confirm that the recent recovery was corrective rather than the start of a new upward leg.
Bitcoin is not yet in a confirmed bullish breakout. Nor is it in panic mode. The market is compressed, sentiment remains cautious, and leverage positioning leans short.
That makes $70,000 the defining level for the BTC price.
A sustained move above it could reshape short-term structure and trigger upside expansion. Failure to secure it would reinforce the current downtrend dynamics. The next few daily closes may determine which side wins the battle.
The post Altcoins Rally Today: DOT, NEAR, UNI & APT Jump as Crypto Market Turns Bullish appeared first on Coinpedia Fintech News
The altcoin rally is firmly back in focus today, as the broader crypto market turns green and risk appetite returns. After days of extreme fear and defensive positioning, improving market conditions triggered a sharp shift in trader behavior. As Bitcoin stabilized and selling pressure eased, capital rotated rapidly into higher-beta assets, igniting a powerful altcoin rally across major tokens. Let’s break down the data and see how each altcoin is positioned.
Data from Santiment shows that today’s altcoin rally is broad-based, not limited to a single token or narrative. Key signals behind the altcoin rally:
— Santiment (@santimentfeed) February 25, 2026
Following @realDonaldTrump's State of the Union, crypto markets have SKYROCKETED to their best daily collective jumps of the year. The altcoin charge breakout is being led by notables like $DOT (+23%), $UNI (+19%), $AVAX (+17%), $LINK (+15%), $NEAR (+15%), & $LTC (+14%). pic.twitter.com/NlHMjtHzQu
Data from Santiment shows that Polkadot (DOT), NEAR Protocol (NEAR), Uniswap (UNI), and Aptos (APT) are among the top gainers, each rallying between 14% and 25% in a single session. The surge is backed not just by price, but also by a noticeable spike in social volume, a classic signal of renewed market interest. This alignment between price and sentiment suggests the altcoin rally is being fueled by real participation rather than short-lived speculation.
Polkadot is leading today’s altcoin rally, surging over 23% and outperforming most peers. DOT broke decisively above a prolonged consolidation range, triggering strong follow-through buying. Momentum strengthened further as ETF-related optimism entered the narrative, following reports that 21Shares filed an amended S-1 registration statement with the U.S. SEC for a Polkadot ETF. While approval is not guaranteed, the filing highlights growing institutional interest in DOT.
Polkadot (DOT) Price key levels:
NEAR gained around 15%, benefiting directly from the improving sentiment driving the altcoin rally. NEAR price rebounded from a key demand zone of $1.00 and reclaimed short-term resistance, signaling a potential trend shift after an extended corrective phase.
NEAR Protocol (NEAR) key levels
Uniswap surged nearly 19%, confirming that the altcoin rally is expanding into the DeFi sector. UNI broke above a descending trendline that had capped price for weeks, flipping prior resistance into support, a typical early signal of DeFi rotation during market recoveries.
UNI key levels
Aptos posted gains of roughly 17%, acting as a high-beta accelerator within today’s altcoin rally. The move followed a prolonged compression phase, resulting in a sharp, impulsive breakout as speculative capital re-entered the market.
APT key levels
Today’s bullish price action confirms the altcoin rally is more than a short-lived bounce. As fear fades and confidence returns, traders are rotating capital into higher-momentum altcoins. Polkadot, NEAR, Uniswap and Aptos are leading this phase, supported by technical breakouts, rising social engagement and, in DOT’s case, emerging institutional narratives.
If broader market conditions remain supportive, the altcoin rally could extend further, keeping large-cap altcoins firmly in focus in the near term.

The OCC’s proposal to implement the GENIUS Act would bar yield on payment stablecoins and introduce a rebuttable presumption against common issuer-affiliate reward structures.

A massive leveraged long in the ARC perpetuals market collapsed on Lighter, triggering auto-deleveraging but limiting liquidity provider losses to about $75,000.

Initially available to institutions via the AllUnity Mint Platform, CHFAU stablecoin launches under MiCA compliance after securing a license from the German regulator, BaFin.

A convincing bullish reversal setup and hints of easing whale distribution may push the price of XRP up by 20% or more in March.

The Swiss crypto bank will handle strategic asset allocation for corporate crypto treasuries and is already actively managing $200 million in volume at launch.

World Liberty Financial’s USD1 is the fifth-largest stablecoin by market capitalization at $4.7 billion, while USDT is the market leader, followed by USDC.

“They’ve heard the promises of institutional adoption for so long that they no longer register," said Bitwise's Matt Hougan.


The post Bitcoin Jumped to $69K, But Analysts Warn of Strong Resistance Ahead appeared first on Coinpedia Fintech News
After a week of heavy selling, Bitcoin price has finally bounced back strongly, jumping 6% to to its previous 2021 high near $69,000. The sudden move forced bearish traders to close short positions, triggering total liquidations of about $571 million.
Despite this strong recovery, analysts say it is too early to confirm a long-term trend reversal, as key resistance levels are still intact.
Today’s crypto market rally was not driven by bullish news or new regulations. The main reason was forced liquidations. In the past 24 hours, more than 132,000 traders were liquidated, with total losses reaching about $571 million.
Bitcoin alone saw around $231 million in liquidations, while Ethereum recorded over $202 million. Most of these liquidations, more than 85%, came from short positions. Following this, the Fear & Greed Index jumped to 18, showing that traders are regaining confidence.
Another key reason behind the rally is strong inflows into Spot Bitcoin ETFs. On February 25, ETFs saw $506.6 million in inflows, bringing total inflows to about $54.57 billion.
The recovery has not been limited to Bitcoin. Major large cap crpytocurreny such as Ethereum, XRP, Solana, Dogecoin, and Cardano have also recorded a rise of 6 to 12% momentum.
Additionally, crypto-related stocks have also seen a sharp recovery. Coinbase shares rose 14%, Strategy, the largest corporate Bitcoin holder, gained 9%, and even the Metaplanet saw a jump of 10%, trading around $331.
Similarly, Stablecoin company Circle surged 34% following strong earnings.
As the crypto market started to recover, crypto analyst Joel Kruger advised traders to stay careful. He believes the market is still in a bearish phase. According to him, another drop is possible if Bitcoin fails to break key resistance levels.
The first major resistance zone is between $70,000 and $72,000. Bitcoin has been rejected in this area three times before, and each time the price fell back below $65,000.
Another important level is near $78,000. This level reflects Bitcoin’s estimated fair value based on on-chain capital flow data. If Bitcoin breaks above $78,000, it would show strong bullish momentum.
Until that happens, the market may continue to move sideways in a consolidation range.
The post TRON (TRX) Price Prediction 2026, 2027 – 2030: How High Can TRX Go? appeared first on Coinpedia Fintech News
TRON (TRX) is trading near $0.2855 at a time when infrastructure-focused assets are quietly regaining strategic importance within the crypto ecosystem. While high-volatility tokens rotate aggressively with short-term narratives, TRX’s valuation continues to be anchored to measurable network throughput.
TRON remains one of the leading settlement layers for stablecoin transfers, particularly USDT. That consistent on-chain activity provides structural backing that speculative assets often lack. As global digital payment flows expand and stablecoin adoption deepens, TRON’s infrastructure role becomes increasingly relevant.
Looking toward 2026, the combination of sustained utility and technical compression creates a credible pathway toward higher valuation zones, provided resistance levels are reclaimed.
| Cryptocurrency | TRON |
| Token | TRX |
| Price | $0.2865
|
| Market Cap | $ 27,138,030,584.34 |
| 24h Volume | $ 577,437,194.6366 |
| Circulating Supply | 94,738,161,859.67 |
| Total Supply | 94,738,160,501.5909 |
| All-Time High | $ 0.4407 on 03 December 2024 |
| All-Time Low | $ 0.0011 on 15 September 2017 |
Coinpedia’s price prediction for Tron (TRX) depends on current structural compression and sustained network throughput. TRX price could approach $1.20 by 2026 if resistance above $0.50 converts into long-term support. Looking toward 2030, continued stablecoin settlement dominance and broader crypto market expansion could position TRON near $4 under favorable conditions.
With March approaching, TRX is pressing against the $0.32–$0.35 resistance cluster that has capped recent recovery attempts. Buyers have repeatedly defended the $0.25–$0.27 demand region, establishing a stable structural floor.
As long as this base holds, downside risk remains contained within the broader consolidation framework. A decisive weekly close above $0.35 would shift short-term momentum and open the door toward $0.45. Beyond that, $0.50 becomes the structural pivot level. Acceptance above $0.50 would invalidate the extended consolidation pattern and signal the beginning of a broader expansion phase.
If resistance continues to hold, price may remain range-bound through early Q2 before the next breakout attempt. March, therefore, represents a potential trigger month rather than the final destination.
The path toward $1.20 by 2026 is rooted in three pillars:
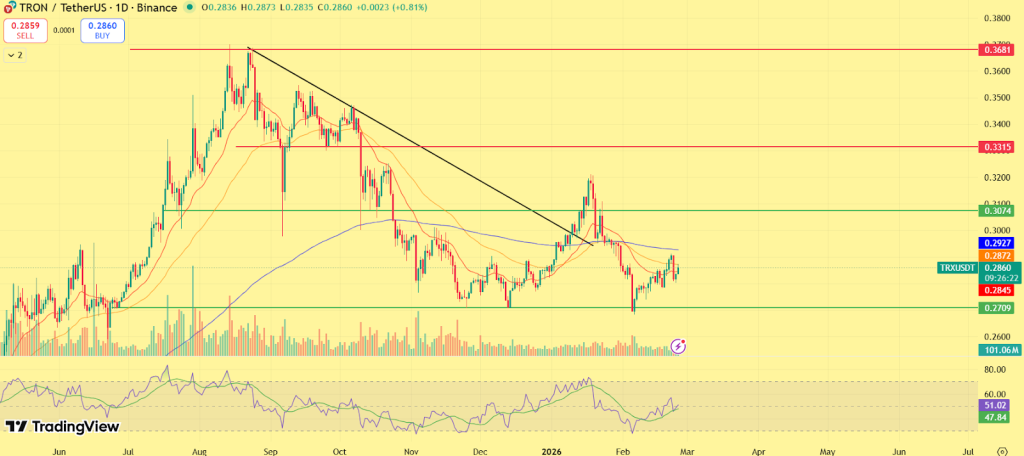
Under a healthy 2026 crypto cycle, a move toward $1.20 represents a measured expansion rather than an extreme projection. That would imply roughly a 4x appreciation from current levels, consistent with mid-cycle growth for established infrastructure assets
| Year | Potential Low ($) | Potential Average ($ | Potential High ($) |
| 2026 | 0.80 | 1.00 | 1.20 |
| 2027 | 1.10 | 1.50 | 1.90 |
| 2028 | 1.80 | 2.30 | 2.80 |
| 2029 | 2.50 | 3.20 | 3.70 |
| 2030 | 3.20 | 3.60 | 4.00 |
In 2026, the Tron price could project a low price of $0.80, an average price of $1.00, and a high of $1.20.
As per the Tron Price Prediction 2027, Tron may see a potential low price of $1.10. The potential high for Tron price in 2027 is estimated to reach $1.90.
In 2028, the Tron price is forecasted to potentially reach a low price of $1.80 and a high price of $2.80
Thereafter, the Tron (Tron) price for the year 2029 could range between $2.50 and $3.70.
Finally, in 2030, the price of Tron is predicted to maintain a steady positive. It may trade between $3.20 and $4.00.
The long-term projection assumes Tron sustains relevance in enterprise blockchain use cases, with growth moderating over time as the asset matures.
| Year | Potential Low ($) | Potential Average ($) | Potential High ($) |
| 2031 | 3.50 | 4.30 | 5.20 |
| 2032 | 4.50 | 6.00 | 7.00 |
| 2033 | 9.00 | 11.00 | 15.00 |
| 2040 | 20.00 | 28.00 | 38.00 |
| 2050 | 80.00 | 110.00 | 150.00 |
| Year | 2026 | 2027 | 2030 |
| Changelly | $0.95 | $1.50 | $2.20 |
| CoinCodex | $1.00 | $1.80 | $3.00 |
| WalletInvestor | $1.50 | $2.00 | $3.50 |
Stay ahead with breaking news, expert analysis, and real-time updates on the latest trends in Bitcoin, altcoins, DeFi, NFTs, and more.
TRX could trade between $0.80 and $1.20 in 2026 if it breaks above $0.50 and maintains strong stablecoin settlement growth.
In 2027, TRX could trade between $1.10 and $1.90 if network growth continues and broader crypto market conditions remain favorable.
TRX may reach $0.94–$2.07 in 2028, with an average price of $1.50, driven by growing network usage and stablecoin dominance.
TRX may reach up to $4.00 by 2030 under strong ecosystem expansion, stablecoin dominance, and sustained crypto market growth.
By 2040, TRX could trade between $20 and $38 if global blockchain adoption expands and TRON remains a major settlement network.
In a strong long-term adoption scenario, Tron may range between $80 and $150 by 2050, assuming sustained utility and ecosystem growth.
TRX shows strong long-term potential, with projected growth through 2030, backed by real-world use in payments, stablecoins, and global adoption.
Yes, TRX reaching $1 is possible if resistance flips to support and network activity, especially USDT transfers, keeps expanding.

The post Indiana Crypto Bill Heads to Governor’s Desk appeared first on Coinpedia Fintech News
HB 1042 has passed both chambers of the Indiana Legislature and now awaits the signature of Eric Holcomb. The bill defines cryptocurrency under state law and requires certain public retirement plans, including PERF and TRF annuity accounts, to offer self-directed brokerage options with crypto investments by July 1, 2027. It also prevents state and local agencies from restricting crypto payments, self-custody, mining, or staking, while banning discriminatory taxes or fees.

The post Pi Network News: One Year Later, Is Pi Quietly Building a Real Blockchain Ecosystem? appeared first on Coinpedia Fintech News
Pi Network has completed one year since launching its Open Network, and its founders used the milestone to stress that their focus remains on building infrastructure and real-world use cases rather than chasing short-term price action.
From the very beginning, the project has faced doubt and controversy. Questions about its structure, rollout, and long-term vision have followed it closely, making its first year in the open market anything but quiet.
Pi Co-founder Dr. Nicolas Kokkalis boosts the Pi community with a detailed roadmap of ongoing work on KYC, migration, developer tools, protocol upgrades, and broader ecosystem growth.
While the project’s native token has experienced volatility, the core team continues to push forward with long-term development goals. In a recent video update, Kokkalis laid out how the team is prioritizing work that matters most to Pioneers and builders alike.
According to Kokkalis, the immediate priorities remain KYC verification and mainnet migration, which he described as fundamental to Pi’s broader vision. He explained that the team is increasing KYC throughput and speeding up verification processes, including “unblocking more users” and integrating advanced technologies like AI into the flow. This, he noted, will help more Pioneers fully participate in the Mainnet ecosystem without unnecessary delays.
“KYC and migration remain a top priority,” Kokkalis said, highlighting that completing identity verification is essential for ensuring the network’s integrity and enabling real usage of Pi tokens. He also mentioned expected KYC validator rewards coming soon, which aim to incentivize community participation and broaden verification coverage.
Beyond migration and identity work, Kokkalis stressed the importance of improving developer tools that make it easier to build on Pi’s blockchain.
“We’re lowering the barrier to building on Pi,” he said, noting that new utilities such as faster payment integrations and expanded development environments will help creators launch real applications.
This push aligns with the broader ecosystem’s growth; recent data shows Pi’s Mainnet now supports hundreds of live apps, and over 300 applications are reported running on the network.
Kokkalis also touched on deeper technical work, including upgrades to the network protocol, node infrastructure, and future decentralized exchange (DEX) and liquidity pool components. These upgrades aim to transition Pi from a mobile mining project toward a fully functioning blockchain capable of supporting broad decentralized finance and commerce activity.
Founders have repeatedly stressed that Pi’s approach is about utility and real use cases rather than speculation. This philosophy underpins the network’s design choices, from fully KYC-verified participation to ecosystem token models tied to real application usage rather than simple trading.
Stay ahead with breaking news, expert analysis, and real-time updates on the latest trends in Bitcoin, altcoins, DeFi, NFTs, and more.
The Pi Network Open Network is the mainnet phase where Pi transitions from an enclosed system to a fully functional blockchain, enabling real-world transactions and external connectivity.
KYC verification is essential for ensuring network security and compliance, allowing Pioneers to migrate to the Mainnet and safely transact Pi tokens within the ecosystem.
Developers can build apps using Pi’s expanding toolkit, which includes faster payment integrations and development environments designed to lower technical barriers for creators.
The project prioritizes long-term utility and real-world use cases over short-term price action, focusing on building infrastructure to support commerce and applications.

The post Crypto News: From Prison, SBF Applauds Trump’s Crypto Bill, But Warren Calls It a Red Flag appeared first on Coinpedia Fintech News
Senator Elizabeth Warren said Sam Bankman-Fried’s public backing of the CLARITY Act should “set off alarm bells” for lawmakers and regulators.
Elizabeth Warren delivered a sharp criticism of the bill after it received surprising praise from Sam Bankman-Fried, the former FTX executive who is currently serving a 25-year prison sentence for fraud.
The back-and-forth unfolded publicly on X, where Bankman-Fried called the legislation a major milestone for the crypto industry and credited the White House for helping move it forward. The debate escalated further when SBF portrayed the bill as a response to what he had previously described as excessive regulatory action by SEC leadership.
Warren responded, arguing that endorsement from a convicted figure tied to one of crypto’s largest collapses should raise serious concerns.
Warren, a longtime critic of the digital asset sector, framed the situation as a warning sign rather than a coincidence. In her view, any legislation governing crypto markets must prioritize consumer safeguards, financial system stability, and taxpayer protection above industry expansion.
She stressed that any new regulatory framework should help prevent another collapse like FTX, not open gaps in oversight that could put investors at greater risk.
The CLARITY Act aims to clearly define which agencies oversee different parts of the crypto market, including the role of the SEC and other regulators. Supporters say setting clearer boundaries would reduce confusion and encourage innovation. Critics, including Warren, argue that the bill could limit enforcement powers and weaken investor protections.
Tony Edward, host of the Thinking Crypto Podcast, responded sharply on X, pointing to Bankman-Fried’s history of political donations. He argued that the outrage feels selective, pointing out that Bankman-Fried donated millions of dollars to Democratic candidates and political committees in the past.
Edward also said that regulators, including former SEC Chair Gary Gensler, did not act quickly enough to examine FTX before it collapsed.
Political analyst John Hawkins shared a similar view, noting that Bankman-Fried was one of the Democratic Party’s biggest donors during the 2022 election cycle. He openly questioned whether some of the lawmakers now criticizing SBF had previously accepted or benefited from his political contributions.
Bankman-Fried’s past donations have remained a sensitive topic since FTX collapsed. Court records and public disclosures show that he directed large sums of money to political campaigns and committees in the months leading up to the exchange’s downfall.
With the CLARITY Act still under discussion, the political and crypto communities appear locked in a broader battle over credibility, accountability, and the future direction of digital asset regulation.
Stay ahead with breaking news, expert analysis, and real-time updates on the latest trends in Bitcoin, altcoins, DeFi, NFTs, and more.
The CLARITY Act aims to define which agencies oversee crypto markets, seeking clearer rules for innovation and enforcement.
Supporters say it brings regulatory clarity, while critics warn it could weaken enforcement and reduce investor protections.


The post Indiana Opens Door for State Investment Option appeared first on Coinpedia Fintech News
Indiana has passed House Enrolled Act 1042, giving cryptocurrency an official legal definition. The law describes crypto as a digital asset that works without central control and uses encryption to create units and verify transfers. Payment stablecoins are not included. The measure also requires the state retirement board to offer at least one crypto investment option through a self-directed brokerage account by July 1, 2027. Officials say the step is meant to update financial rules and give investors more choice as interest in digital assets continues to grow.
The post Crypto Market Update Today: Bitcoin Stabilises While DOT, UNI, ADA Lead Broader Crypto Recovery appeared first on Coinpedia Fintech News
The crypto market turned positive over the past 24 hours, with broad participation across major assets and legacy altcoins. Total market capitalisation rose fro $2.19 trillion to $2.35 trillion as Bitcoin price stabilized above $68,000, and established tokens like Polkadot (DOT), Uniswap (UNI), and Cardano (ADA) posted notable gains.
Besides, the Ethereum price secured $2000, XRP $1.44, BNB $600 and Dogecoin $0.1. In the meantime, Solana price surged past $87 and is heading towards $90 while Cardano approaches $0.3 and reclaims the top 10th position, flipping Bitcoin Cash. Moreover, the ADA price is currently the best performer among the top 10 cryptos.
The rebound comes amid a wave of short liquidations and renewed inflows into spot Bitcoin ETFs, suggesting a mix of mechanical short squeezes and fresh institutional demand behind the move.
Bitcoin traded within a firm range over the past 24 hours, recovering from recent volatility and holding above key short-term support levels. The BTC price is up by 4.52%, reaching $68,297 in the past 24 hours after marking an intraday high at $69,953. The volume also increased prominently by more than 27%, rising over $50 billion, which helped to mount enough buying pressure.
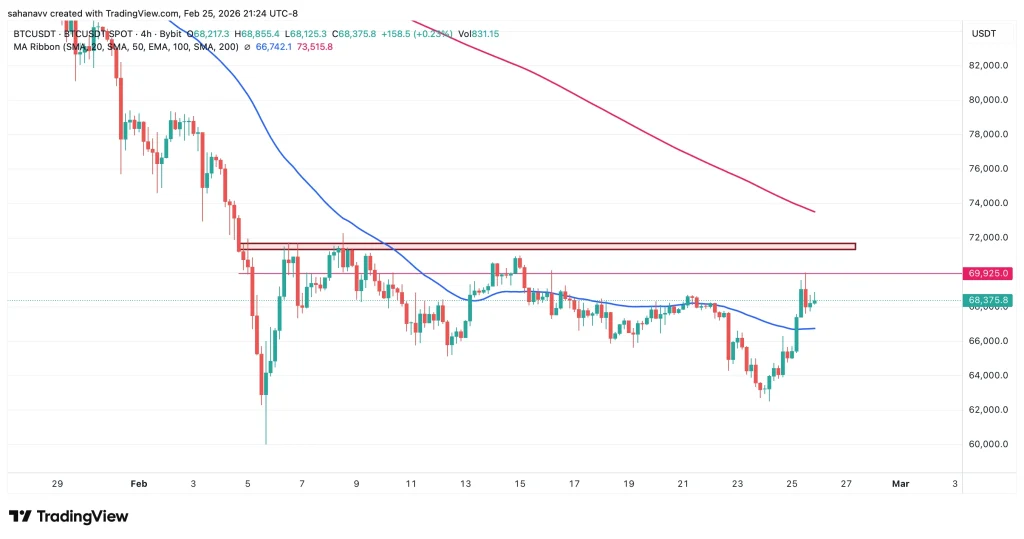
The short-term price action of BTC shows the bulls gaining huge strength, but they failed to push the crypto beyond the crucial resistance at $69,925 or $70,000. However, the bullish momentum has not faded yet, as the rally has surged above the 50-day MA, which may act as a support in case of a correction. The chart patterns suggest a breakout could be nearby, but rising above the resistance zone between $71,374 and $71,681 is extremely important to validate the beginning of a recovery phase.
Ethereum mirrored Bitcoin’s stabilization, posting moderate gains and maintaining strength above recent support zones. However, the real momentum shift was visible in established altcoins. Rather than speculative meme tokens leading the rally, capital rotated into older, structurally established projects.
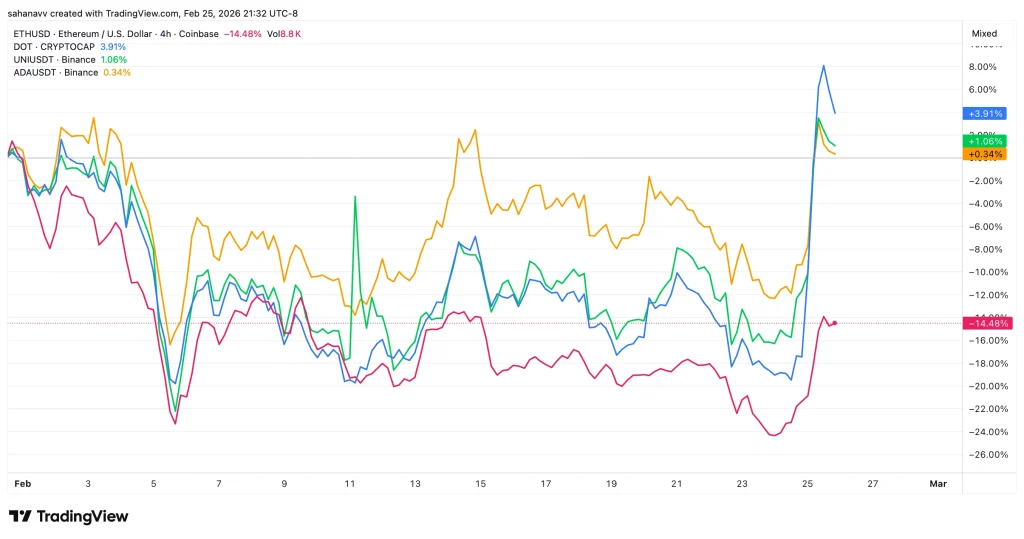
Several long-standing cryptocurrencies outperformed the broader market:
The participation of these “old guard” tokens suggests the move is not isolated to Bitcoin alone. Broader risk appetite appears to be returning to the fundamentally strong projects, suggesting the market participants are now rising above short-term trends.
One of the biggest drivers behind the recent bullish push is the short liquidations that occurred in the past 24 hours. The crypto market witnessed over $573 million in liquidations, of which the shorts account for nearly $468.5 million.
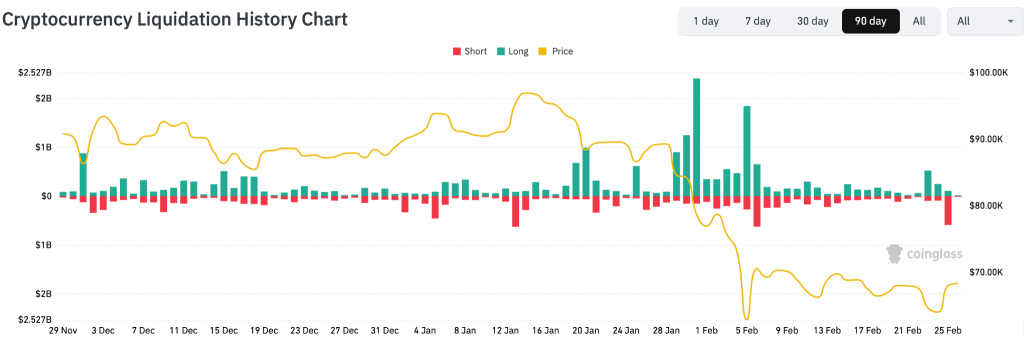
Of $468.5 million, nearly $233.25 million in shorts were liquidations of Bitcoin alone, and the largest single liquidation order happened on Hyperliquid with a value of $10.41 million. Yet another major bullish factor behind the recent surge is the rising ETF inflows. The net inflows surged above $697 million, of which the BTC ETFs account for more than $500 million.
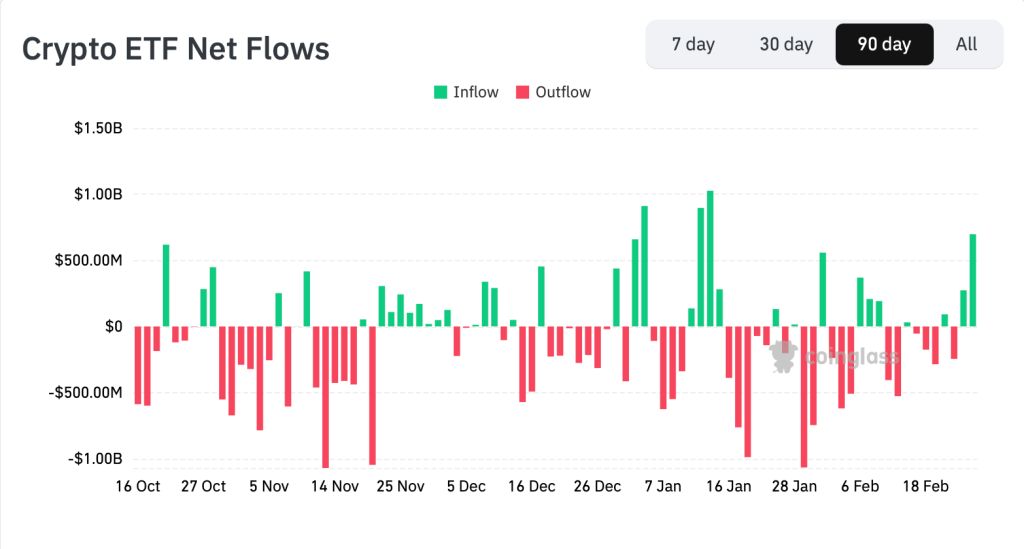
Top institutions like BlackRock, Fidelity, Bitwise, 21Shares, and VanEck are recording positive change, while Grayscale remains negative. ETF inflows represent real spot buying rather than leveraged speculation, adding credibility to the rebound. While one day of inflows does not confirm a long-term trend reversal, it signals that institutional appetite has not disappeared.

Stripe executives Patrick and John Collison expect blockchain network demands to increase significantly as adoption and use of AI agents grow in the future.

“The goal is to decouple slots and finality, to allow us to reason about both separately,” explained Ethereum co-founder Vitalik Buterin.

Aave continues to lead DeFi lending, with $27.2 billion in user value secured and $83.3 million in fees over the past 30 days, nearly four times more than its closest competitor.

ETHZilla will now go by Forum in its second rebrand in less than 12 months as it looks to catch a windfall from the hype around tokenization.

The Reform UK party was the first to accept crypto donations in May last year, with leader Nigel Farage announcing the group is accepting Bitcoin and other cryptocurrency contributions.
The post Crypto Rally Alert: Expert Reveals How High Bitcoin, Ethereum and XRP Prices Could Climb appeared first on Coinpedia Fintech News
The crypto market is showing fresh signs of strength, and veteran trader Gareth Soloway says a short-term rally may have more room to run, even though he is not calling for a full bull market just yet.
“Charts are unbiased,” he explained. “If I see a bullish pattern, I trade it long. If I see a bearish pattern, I go short.” Right now, he sees a bullish setup forming.
Bitcoin recently rebounded strongly after dipping near $60,000. According to Soloway, the recovery created a classic bullish consolidation pattern.
After a sharp sell-off, Bitcoin printed a strong reversal candle and then began moving sideways in a tight range. This type of pattern often signals that buyers are quietly building positions before another upward push.
Soloway says Bitcoin is more likely to reach $80,000 before $50,000 in the short term.
He points to:
He sees a realistic target zone between $80,000 and $85,000, depending on momentum and possible positive crypto legislation developments.
However, he stresses this does not necessarily mean a new long-term bull market has begun. It could be a powerful relief rally within a larger cycle.
Ethereum is also showing strength. ETH recently moved back above $2,000 and formed what Soloway describes as a “bull flag” pattern — a common breakout setup.
If the breakout holds, he believes Ethereum could quickly climb toward $2,600 to $2,800.
That would represent a potential 27% to 35% upside move in the near term.
However, he warns that heavy resistance sits in that zone. If ETH reaches $2,600–$2,800, traders may see strong selling pressure.
On the downside, major long-term support remains near $1,500. If the broader market turns sharply lower, that area could become important again.
XRP, currently trading near $1.40, is in a more delicate position.
Soloway says XRP recently broke below a major support trendline, which shifts the chart slightly to the weaker side. However, a rebound is still possible.
Key resistance sits between:
If XRP can break above $2 and hold that level, Soloway believes a much larger move could follow. A move toward $1.60–$1.90 could represent an 11% to 33% gain from current levels, but the true breakout would only happen above $2.
The market may be anticipating positive regulatory developments, especially with upcoming crypto-related discussions in Washington.
When sentiment becomes overwhelmingly negative, it often sets the stage for sharp upside moves. Short squeezes can happen quickly in crypto, pushing prices higher in a short period.
Stay ahead with breaking news, expert analysis, and real-time updates on the latest trends in Bitcoin, altcoins, DeFi, NFTs, and more.
The rally is fueled by positive regulatory discussions in Washington, extremely negative sentiment that often precedes short squeezes, and large accumulation between $60K and $70K.
While a short-term rally to $85,000 is possible, experts caution that this may be a powerful relief rally within a larger cycle, not necessarily the start of a new long-term bull market.

The post Vitalik Buterin Sells Another $8.9M in ETH as Ethereum Surges 8% appeared first on Coinpedia Fintech News
Vitalik Buterin is continuing his planned Ethereum sales, even as the market rallies sharply. According to on-chain tracking platforms Lookonchain and Onchain Lens, Buterin recently sold another 4,458 ETH worth approximately $8.92 million.
This latest transaction brings his total progress to 97% completion of a previously disclosed plan to sell 16,384 ETH.
Only 504 ETH, valued at just over $1 million, remains to be sold.
Data shows that since February 2, Buterin has sold 15,479 ETH for around $30.94 million, at an average price close to $1,999 per ETH.
Over the past seven days alone, he reportedly converted more than $8.6 million worth of ETH into various stablecoins, including PYUSD, EURC, LUSD, and GHO.
Despite the sales, Buterin still holds approximately 259,350 ETH, worth nearly $500 million, spread across multiple wallets.
Interestingly, the selling activity has not slowed down Ethereum’s price momentum.
Ethereum is up about 7.5% in the past 24 hours, trading near $2,058. The rally significantly outperformed Bitcoin, which gained around 3.4% during the same period.
Trading volume has surged, showing strong buying interest and investor confidence.
The price recently touched a range high near $2,150 before pulling back slightly.
In the short term, Ethereum appears to be consolidating after its strong rally.
Levels to watch:
If ETH holds above the $1,990 level, analysts say another push toward $2,200 could be possible. However, a break below support may increase the risk of a deeper pullback.
Some experts are also watching for confirmation of a full five-wave upward move, which would strengthen the bullish case.

The post Ethereum Releases “Strawmap” for Scaling, Privacy, and Quantum Resistance appeared first on Coinpedia Fintech News
The Etherem Foundation (EF) has released a decade-long roadmap dubbed the “strawmap” that is designed to scale the ecosystem, while improving privacy and quantum resistance.
More specifically, the project intends to bring up the transaction speeds of L1 and L2 protocols to 10,000 transactions per second (TPS) and 10 million TPS, respectively. This will happen through technologies like embedded zero-knowledge provers (zkEVMs) and data availability sampling.
The strawmap’s second objective would be to improve privacy by enabling users to conceal their balances and transaction histories.
Most notably, Strawmap would address security threats through quantum-resistant cryptography such as hash-based schemes.
The roadmap estimated a total of seven Ethereum forks by the end of 2029 to incorporate these developments.
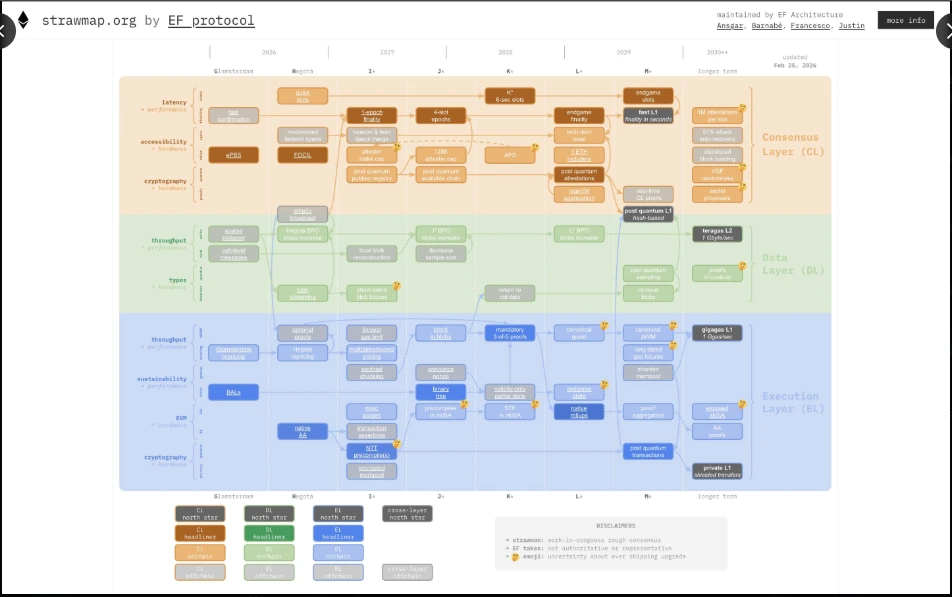
Source: X
Most experts and crypto proponents, such as Strategy’s Michael Saylor, believe that we are still years away from any considerable quantum threats to cryptographic systems. However, Ethereum creator and co-founder Vitalik Buterin has warned that quantum risks could emerge as early as 2028. Ripple’s David Schwartz concurred, emphasizing the need for Bitcoin to make a quantum-proof fork.
Such opinions have sparked community and developer engagement, with the intention of building quantum-hard networks. Bitcoin, for instance, has proposed the BIP-360 upgrade, which will introduce post-quantum cryptography to the network following its implementation.
In support of similar measures for the Ethereum ecosystem, Vitalik has been structurally liquidating part of his Ethereum portfolio amid the recent crypto downturn.
In the past month, the developer has liquidated about 11,000-17,000 ETH ($23 million to $43 million), leaving behind about 224,000 ETH. On-chain data shows he periodically does this in small batches to prevent drastic negative price impacts on ETH.
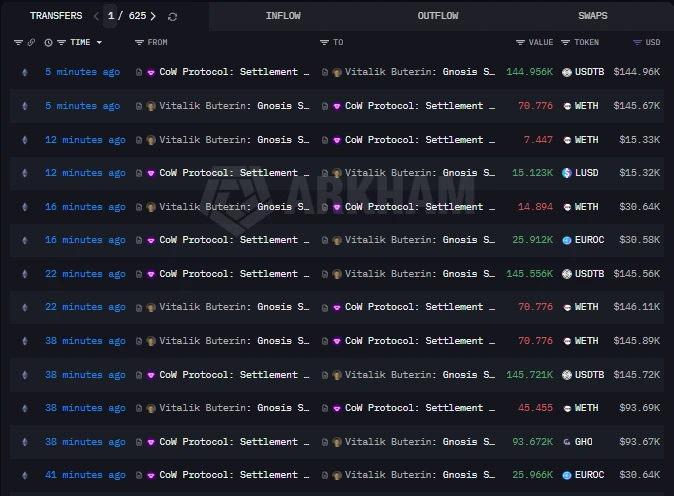
Source: Arkham Intelligence
Supporters view the tactic as a philanthropic way to uphold Ethereum through internal resources rather than external debt, while critics see it as a gradual exit from the blockchain.
As of Thursday, February 26, ETH was trading at $2,106, having gained 13.78% in the past day. The price reflects a broader market-wide upside momentum amid renewed institutional risk appetite for cryptocurrencies.

CFTC chair Mike Selig said the agency established a prediction markets advisory to help catch insider traders, warning there would be consequences.

Bitcoin markets are bracing for Friday’s $10.5 billion monthly options expiry. Does the data show bulls or bears at an advantage?

The AI and digital marketing company acquired its 7,500 Bitcoin in September 2025, amid a market-wide collapse in Bitcoin treasury company mNAVs.
![Why Is Crypto Crashing Today [Live] Updates](https://image.coinpedia.org/wp-content/uploads/2026/02/23165659/Why-Is-Crypto-Crashing-Today-Live-Updates-1-1-1024x536.webp)
The post Ethereum Undervalued, Bitcoin & XRP Remain Neutral Amid Recent Bullish Reversal appeared first on Coinpedia Fintech News
Based on the 30-day Market Value to Realized Value (MVRV) Ratio, Ethereum (ETH) is mildly undervalued at -5.5%. Bitcoin (BTC), XRP (XRP), and Chainlink (LINK) remain neutral at -1.4%, -0.1%, and +3.3%, respectively. By contrast, Cardano (ADA) is mildly overvalued, with an MVRV ratio of +6.8%.
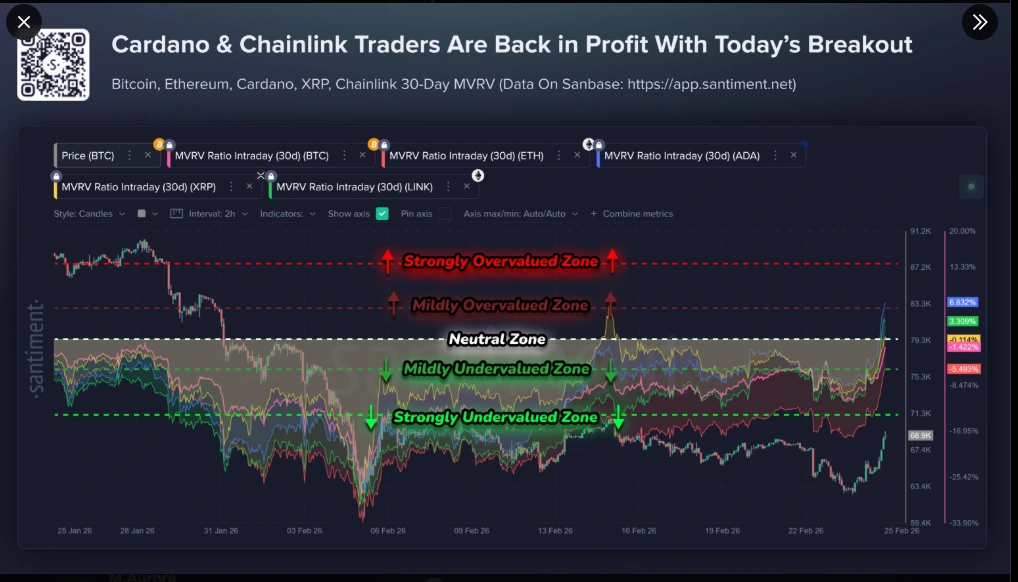
Source: Santiment
The past day has seen an upward trend reversal in the broader cryptocurrency ecosystem, despite recent bearish momentum and sentiment.
Data shows that the average Moving Average Convergence Divergence (MACD) indicator has slightly surpassed its 9-day average, indicating a weak bullish momentum reversal.
BTC was up 7.78% in the past day to trade at $69,050 as ETH gained 13.31% to reclaim its $2,000 psychological level. Meanwhile, XRP and LINK gained +9.37% and 16.07%, respectively. Uniquely, Cardano has experienced a striking 20.07% upsurge to trade at $0.3115.
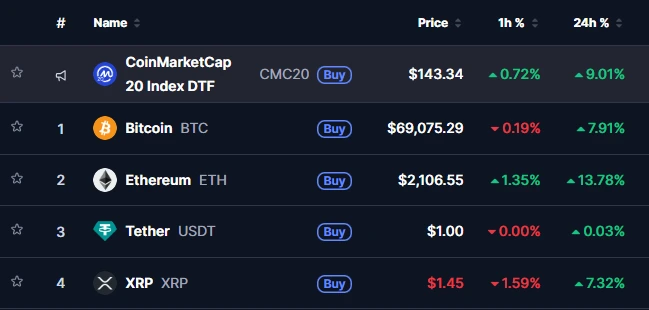
Source: CoinMarketCap
Tech company Nvidia recently reported record-breaking earnings driven by demand in artificial intelligence (AI). Due to the strong correlation (98%) of crypto with the S&P 500, the news fueled renewed risk appetite in investors of both stocks and crypto.
Capital rotation from BTC to altcoins has contributed to their recent rallies as investors seek higher returns from riskier assets. Bitcoin dominance is now at 58-60%, while the Altcoin Season Index reads 34/100, indicating a mixed market for Bitcoin and Altcoins.
This week, Bitcoin ETFs saw $257.7M in net inflows, effectively ending a five-week outflow streak.
At press time, the overall crypto market cap totaled $2.38 trillion, having gained 7.50% in the last 24hours.
Should the current rally hold, the crypto market could test the $2.59T (50% Fibonacci) level. Falling below $2.35T (78.6% Fib) would indicate a loss in momentum, validating a weak bullish theory.

The crypto exchange’s new Flexline product lets Pro users borrow against digital assets at fixed rates of 10%–25% APR for terms of up to two years.

Bitcoin bulls rushed toward $70,000, and ETH reclaimed $2,000 following a drastic improvement in investor sentiment, but will the gains hold?

The Bitcoin miner's digital asset losses mounted, even as it advanced a 15-year, $7 billion AI data center lease.

Bitcoin rallied above $69,500 after US stocks turned green on US policy clarity and strong earnings results. Will bulls target $70,000 next?

The post USDC Stablecoin Issuer Circle Reports 77% Revenue Upsurge in Q4, 2025 appeared first on Coinpedia Fintech News
USDC stablecoin issuer Circle Internet Group Inc. (NYSE: CRCL) has posted $2.7 billion (+64% YoY) in full-year revenue and reserve income for 2025.
More specifically, the company saw $770 million (+77% YoY) in revenue and $133 million in net profits in Q4 of 2025. Its flagship stablecoin USDC saw annual transaction volume skyrocket by 247% to reach $11.9 trillion.
At press time, CRCL shares were trading at $82.22, having surged 33.97% in the past 24 hours following the company’s financial report. This also represents a massive 156% hike in value from $31 during the June 2025 initial public offering (IPO).
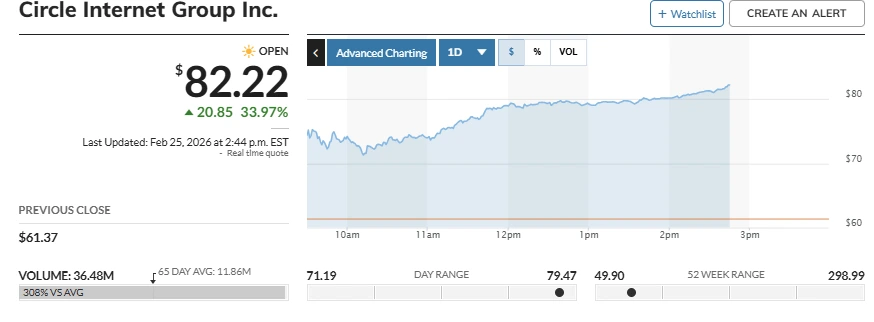
Source: MarketWatch
Meanwhile, USDC’s total market cap is now at $75.4 billion, up 16.55% in the past 24hours.
Under the helm of CEO Jeremy Allaire, Circle became a publicly traded company and moved its headquarters from Boston to New York City to better position itself at the heart of global finance.
The company also diversified its revenue sources with its cross-border payments system, Circle Payments Network (CPN), achieving $5.7 billion in annualized transaction volumes. Its other stablecoin, the euro-backed EURC, now has €310 million worth of assets under management (AUM), while its tokenized Treasury product USYC boasts $1.5 billion AUM.
Even more, Circle integrated USDC into Brazil and Mexico payment systems while developing partnerships with notable financial conglomerates like Visa and Intuit. In late 2025, the firm’s Arc blockchain testnet saw considerable onboarding from noteworthy institutions looking to engage with tokenized financial products.
Regulatory-wise, Circle was the first of its kind to obtain operational licenses in European markets. Compliance with the GENIUS Act in the US has positioned it as a safe financial harbor, increasing its adoption as a payments stablecoin.
While the rest of the market experienced what many perceived as a crypto winter, stablecoins surged in volume to about $400 billion following heightened adoption.
— Stripe (@stripe) February 24, 2026
Still, their earnings pale in comparison to payment giants like Visa, which reported $20.1 billion in GAAP net income on $40 billion in net revenue for the 2025 fiscal year.
In the future, Circle plans to broaden its outreach by enabling the use of its stablecoins by artificial intelligence (AI) agents.

The post ‘OG-Crypto’ is Back in Action—Polkadot (DOT) Price Breaks Out of Consolidation appeared first on Coinpedia Fintech News
Polkadot price is back in action as the ‘OG-Crypto’ has gained huge attention following a breakout from a prolonged bearish trend. The breakout is driven by the change in market sentiments, which turned slightly bullish with the Bitcoin price heading towards the crucial barrier at $69,000 and the Ethereum price recovering above $2,000. Amid the rising optimism among the traders, the strong altcoin rotation seems to have favour the DOT price, which leads the top gainers for the day.
The DOT price is trading at $1.53 with a jump of over 23% in the past 24 hours, outperforming the broader crypto market. On the daily timeframe, DOT has decisively broken above a multi-month descending channel that had capped price action since late 2025.
Key technical developments:
This marks the first meaningful structural shift in months. Still, confirmation requires follow-through above nearby resistance.
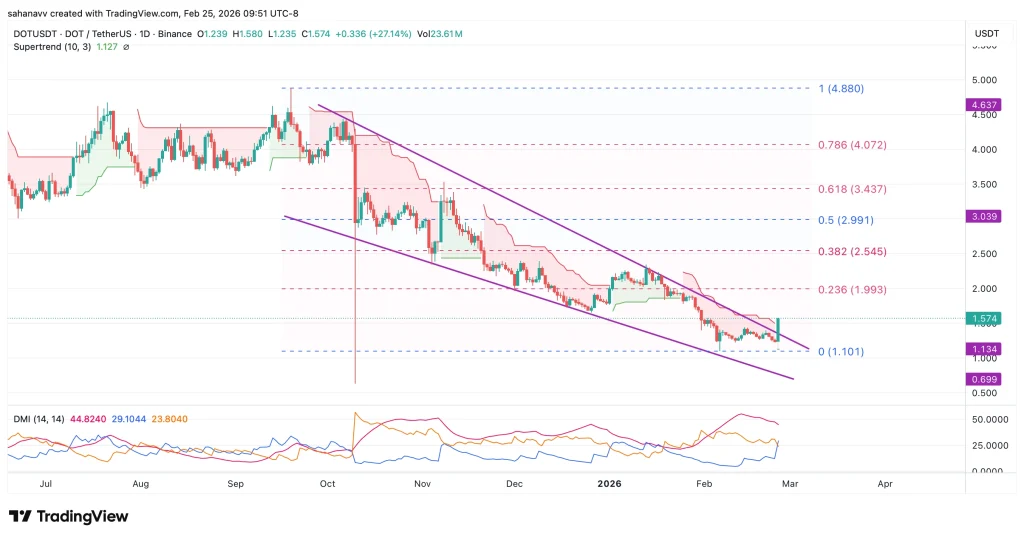
The DOT breakout is not isolated. Bitcoin has stabilized above key demand, Ethereum is rebounding after a leverage reset, and several mid-cap tokens are posting double-digit gains. This suggests a short squeeze across altcoins, capital rotating into oversold legacy names and risk appetite improving.
However, true bullish regime confirmation would require major assets reclaiming macro resistance levels and derivative open interest expanding sustainably.
If the Polkadot price holds above $1.5 and clears the resistance at $1.99, then the token may head towards the upside targets at $2.54 and later at $2.99. On the other hand, if it fails to hold and breaks back into the previous channel, then the breakout risks turning into a false move, with support at $1.13 becoming extremely critical. Besides, with more than a 23% rise in action, the profit-taking may also rise.


The post Why XRP Price Could Soon Target $4 and Beyond appeared first on Coinpedia Fintech News
XRP is gaining strength again. The token is up about 6% in the past 24 hours, trading near $1.43, slightly outperforming the broader crypto market rally.
While the move may look modest on the surface, several factors say XRP could be setting up for a much larger breakout, potentially toward the $4 level and above.
One reason behind XRP’s recent strength is its high correlation with the stock market.
Data shows XRP has a 94% correlation with the S&P 500, meaning it is closely moving with traditional equities. As stock markets rally, crypto assets like XRP are benefiting from renewed risk appetite among investors.
In simple terms, when money flows into stocks, it is also flowing into crypto.
According to one market analyst, the recent pullback appears to have “swept the downside liquidity.” That means most of the selling pressure below current levels has already been absorbed.
Technically, XRP pulled back to the 50% Fibonacci retracement level near $1.31, which is considered a strong support zone. The correction looked controlled and orderly rather than a panic-driven selloff.
If support continues to hold, it increases the chances that the recent correction is complete.
Here is where things get interesting.
Above the current price, there is reportedly a large number of short positions. These are traders betting that XRP will fall.
If XRP starts moving higher and breaks resistance levels, those short sellers may be forced to close their positions. When shorts close, they must buy back the asset — and that buying pushes the price even higher.
This is known as a short squeeze. In a strong squeeze, price can move very quickly because:
If that happens, analysts say XRP could quickly spike toward $4.20 or higher.
For a stronger bullish confirmation, analysts are watching several levels:
A clear break above these resistance levels could signal that a new upward wave has started.
While the recent bounce does not yet fully confirm a long-term reversal, the price structure remains constructive. The correction unfolded in a controlled, three-wave pattern, which often keeps the door open for another upward move.
The post Why Owning 100 XRP Could Become Increasingly Difficult in a Shrinking Supply Market appeared first on Coinpedia Fintech News
The claim sounds dramatic at first: one day, owning just 100 XRP might feel like holding something scarce. But that’s the argument gaining attention after a recent breakdown by Edo Farina, and he insists it’s less about moon-talk and more about simple math.
XRP is trading around $1.37 during a broader market cooldown. Nothing explosive on the surface. But Farina says the price today is a distraction. What matters, in his view, is who could end up holding the supply tomorrow.
Farina’s core argument starts with global banking plumbing.
Banks currently park massive sums of money in what are known as nostro accounts — prefunded pools used to settle cross-border payments. Trillions of dollars sit idle in that system worldwide. If XRP were used as a bridge asset to replace that structure, he argues, financial institutions would need to hold significant reserves.
His rough model goes like this:
If around 150 central banks held 100 million XRP each, that alone would absorb 15 billion tokens. Add roughly 25,000 private banks holding 1 million XRP each, and another 25 billion tokens would be tied up. Combined, that’s about 40 billion XRP — nearly half of the total 100 billion supply.
Whether those numbers are realistic is up for debate. But the point he’s making is simple: institutional reserves could dramatically thin out the liquid supply.
Farina doesn’t stop at banks. He layers in consumer adoption through central bank digital currencies and stablecoins potentially operating on the XRP Ledger. If even a fraction of the global population needed XRP to activate wallets or maintain reserve balances, that demand would add up quickly.
For example, if 800 million users held just five XRP each to operate wallets, that would remove 4 billion tokens from active circulation.
It’s not just accumulation, either. Every transaction on the XRP Ledger burns a tiny amount of XRP. Over time, that mechanism slowly reduces total supply. The burn rate is small, but across large-scale usage, it compounds.
The bullish case is clear. If institutions lock reserves, retail users hold base balances, and transaction activity continues to chip away at supply, fewer tokens would remain freely tradable. In theory, prices would need to rise to balance shrinking availability with steady or growing demand.
The counterargument is just as straightforward. These projections assume widespread institutional adoption, coordinated accumulation, and heavy retail usage. That’s a tall order. Global banks move cautiously. Governments move slower. And crypto adoption rarely follows a clean, linear path.
Still, the idea sticks because it reframes the conversation. Instead of asking whether XRP can reach a certain price, it asks how much of the supply could realistically stay liquid if large players begin holding it long term.
If that shift ever materializes, 100 XRP might not sound like pocket change.
For now, it remains a theory built on potential structural demand.

The post Hyperliquid News: HYPE Tops Treasury Rankings as Shorts Pull Back appeared first on Coinpedia Fintech News
In the downtrend, HYPE has climbed to 8.2% of circulating supply held by digital asset treasuries, overtaking major crypto assets in just 12 months. At the same time, derivatives data show a sharp reduction in large short positions, signaling a potential shift in market sentiment.
Hyperliquid is rapidly reshaping treasury allocation charts.
According to data shared by CryptoRank, HYPE has moved from near-zero treasury presence to leading all major digital assets in circulating supply held by digital asset treasuries. By February 2026, 8.2% of HYPE’s circulating supply was held in treasury structures, nearly double Bitcoin’s 4.2% and far ahead of BNB’s 0.5%.
While broader markets remain volatile, this metric signals strong ecosystem-level positioning.
In just one year, HYPE transitioned from minimal strategic allocation to the top spot in treasury concentration. Treasury holdings often represent long-term ecosystem conviction rather than speculative trading flows. That makes this shift notable.
Unlike Bitcoin’s widely distributed supply model, HYPE’s higher treasury share suggests coordinated allocation, potentially tied to ecosystem incentives, liquidity management, or long-term growth planning. The numbers alone show aggressive accumulation relative to peers.
The key question now is whether this represents structural adoption or concentrated positioning during an early growth phase.
Beyond treasury data, derivatives metrics add another layer. Insights from HyperInsight show that the largest short seller significantly reduced HYPE short exposure by nearly 98,713 contracts, worth roughly $2.94 million.
Total open interest currently sits above $10.4 million, with an average entry price near $30.70. The reported position shows a sizable unrealized profit of over $1.43 million, while the liquidation level is far above current pricing levels. The sharp reduction in short contracts could indicate profit-taking or shifting conviction, potentially easing immediate downside pressure.
HYPE’s rise to the top of treasury accumulation rankings signals strong internal alignment and growing ecosystem strength. At the same time, high treasury concentration and leveraged derivatives activity can amplify volatility in both directions.
For now, HYPE stands at a pivotal moment. Treasury dominance highlights confidence. Short reductions hint at changing sentiment. Whether this momentum evolves into sustained structural growth remains the market’s next big question.
The post Crypto Market News: Bitcoin Tops $67K; Ethereum Reclaims $2K And XRP Surges as $150B Floods Back appeared first on Coinpedia Fintech News
The cryptocurrency market staged a strong comeback over the past 24 hours, with major digital assets posting sharp gains and adding nearly $150 billion to total market capitalization.
Market leaders Bitcoin and Ethereum broke key psychological levels, while XRP and several large-cap altcoins followed with solid advances. The rally also triggered liquidations of bearish positions, signaling a sudden shift in short-term market sentiment.
Bitcoin climbed above the important $67,000 level, trading near $67,482 at the time of writing. The asset gained more than 7% in 24 hours, adding roughly $100 billion to its market capitalization.
Bitcoin’s total market cap now stands around $1.34 trillion, with daily trading volume exceeding $41 billion. The sharp upward move forced many short sellers to close their positions, contributing to the rapid price increase.
While the breakout is encouraging for bulls, Bitcoin must maintain strength above this level to confirm sustained upward momentum.
Ethereum outperformed Bitcoin on a percentage basis, rising more than 11% to trade above $2,000. The asset added approximately $23 billion to its market value in a single day.
Ethereum’s market capitalization now sits near $244 billion, supported by trading volume of over $20 billion in 24 hours. The $2,000 level is widely viewed as both a psychological and technical threshold. Holding above it could strengthen investor confidence in the near term.
XRP also moved higher, trading around $1.44 after gaining nearly 7% during the rally.
XRP’s market capitalization stands close to $88 billion, with daily trading volume surpassing $3 billion. Solana, Dogecoin and Cardano also added more than 10% in the last 24 hours.
The rally led to nearly $300 million in short liquidations, meaning traders who had bet on falling prices were forced to close their positions. Such forced buying can accelerate price movements and amplify volatility in the short term.
Despite the strong rebound, broader sentiment indicators remain cautious. The Crypto Fear & Greed Index continues to reflect extreme fear, suggesting that many investors are still hesitant.
The total cryptocurrency market capitalization is now around $2.33 trillion. Analysts are monitoring the $2.35 trillion level as a major resistance point.
If the market breaks above this threshold with strong trading volume, it could signal the beginning of a more sustained recovery. However, failure to hold gains may result in renewed volatility.

The post Ethereum Price Rebounds 6% as Leverage Resets—Can ETH Break $2,200 Resistance? appeared first on Coinpedia Fintech News
Ethereum price rebounded over 6% in the past 24 hours, climbing back toward the $2,000 level after a sharp liquidation-driven decline earlier this month. However, despite the relief move, ETH remains below a critical resistance zone near $2,200 that continues to cap upside attempts.
The recent rebound comes as derivative leverage resets and funding rates normalize, suggesting the worst of the forced positioning flush may be over. The key question now is whether the ETH price is forming a base—or simply printing another lower high within a broader downtrend.
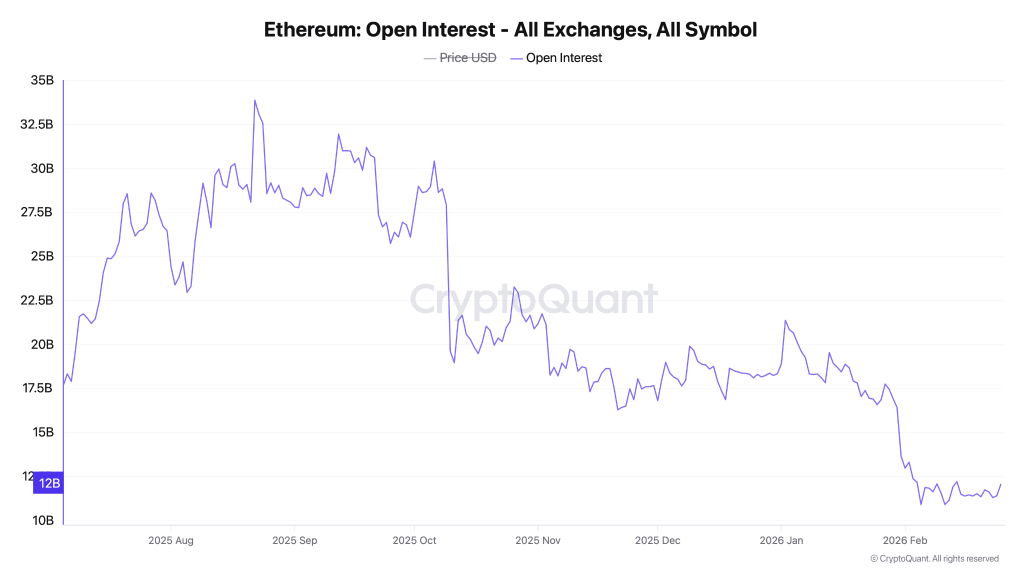
Data across exchanges shows Ethereum’s open interest has fallen sharply from previous highs, representing a significant leverage reset. While falling OI reduces cascading liquidation risk, it also signals reduced speculative aggression. A sustained breakout would require renewed positioning while the levels are attempting to rise. Currently, the OI sits around $12 billion; a rise above $13 billion is required to flip the trend, while a surge above $17.5 could validate a rise in confidence among the traders.
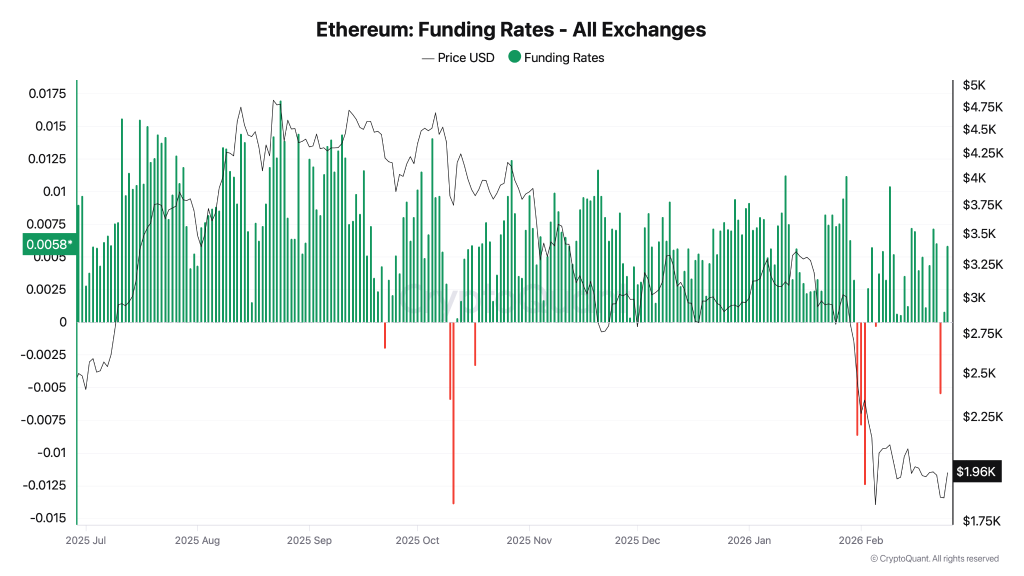
Funding rates recently turned deeply negative during the Ethereum price drop, reflecting aggressive short positioning. They have now flipped mildly positive, suggesting extreme bearish sentiment has cooled, short squeeze pressure has diminished, and positioning is closer to neutral. This environment often supports short-term stabilization rather than immediate trend reversal. When the market is bullish, the funding rate is typically positive and increases over time, meaning long traders pay the funding fee to the short traders.
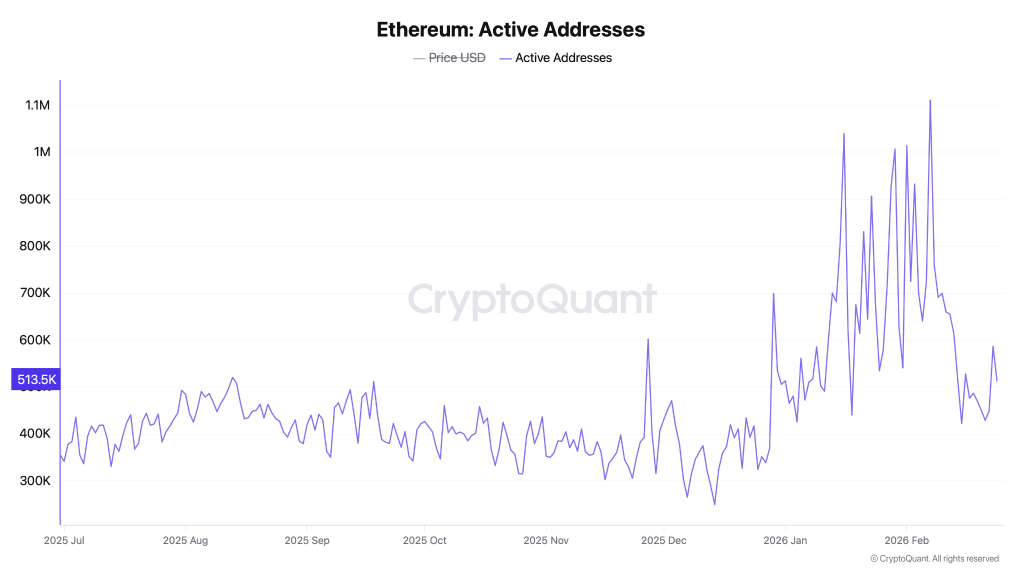
Active addresses surged during the recent volatility phase, signaling heightened network engagement. However, activity has begun to cool from its peak but maintains a significant upswing. For a structural bullish case to strengthen, on-chain participation would need to expand alongside price recovery. At present, the data reflects stabilisation, not expansion.
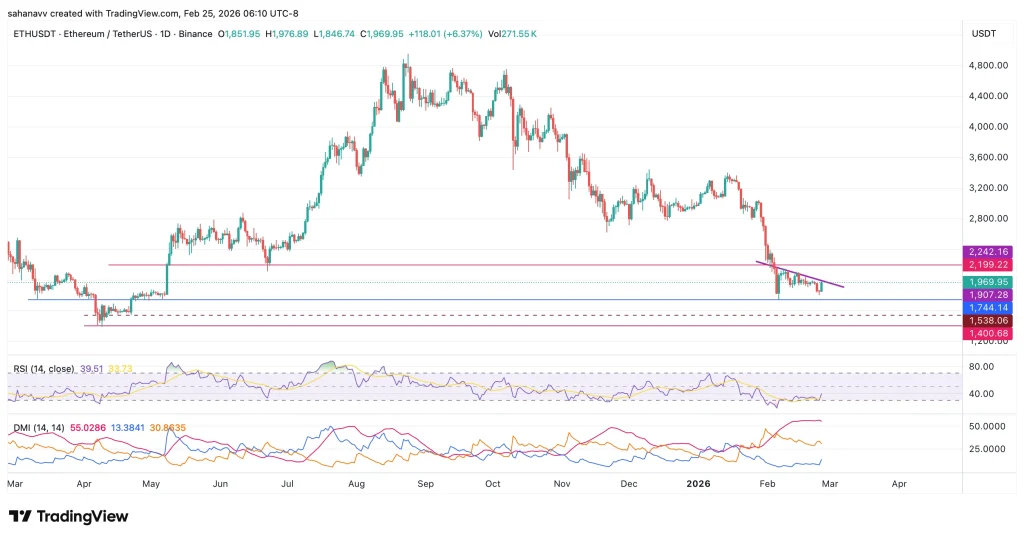
On the daily timeframe, the Ethereum price remains structurally weak. Price is still trading below the $2,200–$2,240 resistance band, a descending short-term trendline, and the 50 RSI threshold. After breaking down from the $2,200 region earlier, ETH flushed toward the $1,900 zone before stabilizing. As long as $2,200 remains unclaimed, the broader trend bias stays bearish.
The Ethereum price is currently trying hard to break above the descending trend line and reclaim $2200. If this move materialises with a strong volume, then the rally may test the upside targets at $2400 initially and later at $2600. However, a breakout accompanied by rising open interest would signal a transitional phase.
On the other hand, if the ETH price fails to break $2,200, the downside risk may drag the levels to $1,744, and if the pressure increases, it may eventually reach close to $1500. Therefore, securing this range is extremely important for the bullish continuation; otherwise, the rally may continue to print lower highs and lows.

The tokenized US Treasury market had a market capitalization of under $4 billion at the start of 2025 and has been gradually rising.

Solana price eyes a potential rise toward the $110-$115 range, according to a confluence of bullish technical and onchain indicators.
The stablecoin issuer reported $770 million in revenue for the final 2025 quarter, beating forecasts as full-year sales rose 64% and USDC circulation topped $75 billion.

Bitcoin began an assault below the 200-week exponential moving average in fresh signs of upward BTC price momentum at the start of the US session.

21Shares debuts the Strategy Yield ETP on Euronext Amsterdam on Thursday, giving Europe regulated access to Strategy’s preferred stock, which is heavily backed by Bitcoin.

The UK Financial Conduct Authority selected Monee, ReStabilise, Revolut and VVTX to test stablecoin issuance and payments in its regulatory sandbox beginning in Q1 2026.


The post Major Cryptocurrencies Drop 11% Over the Past Week as Mutuum Finance (MUTM) Reports $20.6 Million Raised appeared first on Coinpedia Fintech News
Major cryptocurrencies have declined between 7% and 11% over the past week as bitcoin remains confined to a $60,000–$70,000 range, trading near $62,900 and struggling to establish upward momentum. Ethereum, XRP, Solana and dogecoin have underperformed, reflecting broader risk aversion and elevated sell-side pressure across the market. Analysts warn that bitcoin’s prolonged inability to break higher is increasingly tilting the short-term technical outlook toward the bears.
Amid this environment, on-chain data also show selective capital flows into specific projects. While large-cap assets consolidate under macro and technical pressure, newer utility-focused protocols such as Mutuum Finance (MUTM) have continued to report inflows, highlighting a divergence in positioning during the broader market slowdown.
Major cryptocurrencies declined between 7% and 11% over the past week as bitcoin remained locked inside a $60,000–$70,000 trading range. Bitcoin traded near $62,900 on Tuesday, down 2.1% on the day and roughly 7.5% on the week, extending a gradual downturn that has yet to produce either a decisive breakdown or a sustained rebound. Ethereum fell about 8% over the same period to around $1,829, while XRP dropped 10.8%, Solana lost 11.3%, and dogecoin retreated nearly 10%, reflecting broader weakness across large-cap altcoins.
On-chain data indicate elevated sell-side pressure, particularly among altcoins, where distribution has reached five-year highs according to CryptoQuant. The current decline has been characterized by steady structural selling rather than sharp liquidation events, resulting in a slower drawdown that has not triggered aggressive dip-buying activity. Analysts note that bitcoin’s inability to reclaim higher levels is shifting the short-term technical bias toward the downside, with a break below the mid-$65,000 area potentially confirming further weakness, while a move above $70,000 would invalidate bearish formations.
Broader macro factors are also weighing on sentiment. A renewed “AI scare trade” in equities has prompted risk-off positioning across technology-linked assets, indirectly affecting crypto markets. Bitcoin now trades approximately 48% below its October all-time high and remains beneath its 2021 peak of $69,000. The longer price action remains confined within the current range without establishing higher ground, analysts warn, the more the technical outlook tilts toward continued downside pressure.
Mutuum Finance has reported more than $20.6 million raised to date, with over 19,000 holders of its native MUTM token, currently priced at $0.04. The team also stated that the Sepolia beta environment has surpassed $90 million in testnet total value locked (TVL), reflecting simulated liquidity activity during early-stage testing.
The project’s V1 protocol is now live on the Sepolia testnet, where users can mint supported assets including USDT, ETH, WBTC, and LINK. The beta version allows participants to interact with core lending and borrowing mechanics in a test environment before full mainnet deployment.
On-chain data further indicate that shortly after the beta release announcement, larger transactions were recorded, including transfers exceeding $240,000 in value from a single investor wallet.
Prior to the V1 protocol release, the lending and borrowing smart contracts underwent a security audit conducted by Halborn. The review was completed before the beta deployment, with the firm verifying the core contract logic and risk parameters ahead of public testing.
In addition to the protocol-level audit, the MUTM token smart contract was previously reviewed by CertiK. The assessment resulted in a Token Scan score of 90 out of 100.
Mutuum Finance is a decentralized lending and borrowing platform built on the Ethereum network. The protocol allows users to supply and borrow crypto assets in a non-custodial environment, meaning participants retain control of their wallets and interact directly with smart contracts.
When users deposit assets into the platform, they receive corresponding mtTokens on a 1:1 basis. For example, supplying ETH results in the issuance of mtETH, which represents the depositor’s position in the liquidity pool and accrues interest over time.
mtTokens can also be staked within the ecosystem. Under the project’s model, a portion of revenue generated from protocol activity is allocated to purchasing MUTM tokens on the open market. These tokens are then distributed to users who stake their mtTokens, creating an additional reward mechanism tied to platform usage.
The total supply of MUTM is capped at 4 billion tokens. According to the project’s token allocation framework, 5% of the total supply has been designated for incentives. This allocation is intended to support community initiatives, including giveaways, leaderboard rewards, and other participation-based programs within the ecosystem.
Major cryptocurrencies closed the week lower, with price action remaining confined within established technical ranges amid continued macro uncertainty. Selling pressure has been more pronounced in large-cap altcoins, while bitcoin remains range-bound without a confirmed breakout in either direction.
At the same time, selected projects continue to report capital inflows and development updates, indicating that market activity has not fully stalled despite the broader pullback. The direction of the next move will likely depend on macro catalysts and whether Bitcoin can decisively exit its current trading range.

The post Virtuals Protocol (VIRTUAL) Price Leads the Top 100 with Over 20% Surge—Is This a Breakout or Bull Trap? appeared first on Coinpedia Fintech News
Virtuals Protocol (VIRTUAL) price has emerged as the top performer with more than a 20% jump since the early trading hours. With this surge, the token has outperformed the major cryptos like Bitcoin, Ethereum, and XRP. The price has surged by nearly 20%, reaching $0.6924, and the trading volume increased by over 180%, reaching over $165 million.
This high-volume move and absence of a specific news catalyst suggest strong speculative interest or accumulation following a prolonged compression in the lower range over the past 30 days. The key question now appears to be whether this is the start of a structural breakout or another lower high within a broader downtrend.
VIRTUAL has been trading under a well-defined descending resistance trendline since peaking near the $1.90 region. However, recent price action formed a tight accumulation range between $0.60 and $0.70. The current breakout attempt marks the first meaningful push above this consolidation. If sustained, this could signal a shift in short-term structure.
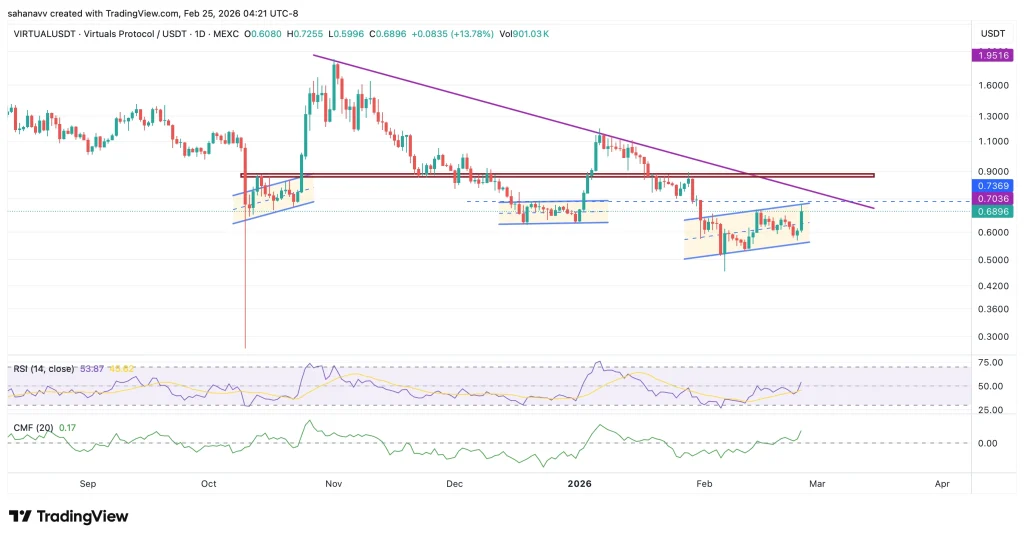
The daily RSI has reclaimed the 50 level and now sits near 54, indicating momentum expansion rather than overbought exhaustion. Additionally, Chaikin Money Flow (CMF) remains positive, suggesting net capital inflows are supporting the move. This combination reduces immediate reversal risk.
The VIRTUAL price has now rebounded from the structural base at $0.57 and has entered above the accumulation base at $0.6. The levels around $0.7 could be a breakout point that may push the price to the $0.8 to $0.85 price range, which is the immediate supply zone. However, $0.9 is still the major resistance that needs to be broken to reach the psychological barrier at $1.
The current surge seems to be driven by trader momentum rather than a fundamental development, hinting towards a sentimental shift among the traders. The outlook currently appears to be conditionally bullish, hinging on the market’s ability to absorb profit-taking at higher levels. Therefore, now it’s the time to look if the volume is sustained or fades quickly, which will be the signal of the strength of the buying conviction.
Hence, if the Virtuals Protocol (VIRTUAL) price holds above $0.7, it may break $0.8 to $0.85 range and head to $1.
The post Binance Coin BNB Price Cools Off After Volume Overheating: Is $400 the Real Target? appeared first on Coinpedia Fintech News
The Binance Coin BNB price is no longer riding the euphoria wave. It’s cooling fast. After what on-chain volume bubble maps clearly mark as overheating phases in both spot and futures markets, the heat has faded. And when volume cools after overheating, it usually doesn’t mean stability. It means pressure.
Right now, sell pressure is dominating the tape. Across both spot and futures volume maps, we’ve shifted from red “overheating” clusters into green cooling zones. That transition historically signals a reset phase. Every major expansion cycle begins with mild heating, accelerates into overcrowded enthusiasm, then exhausts. What follows? A neutral grind lower before quiet accumulation begins again. Similarly, we’re not in the accumulation phase yet.
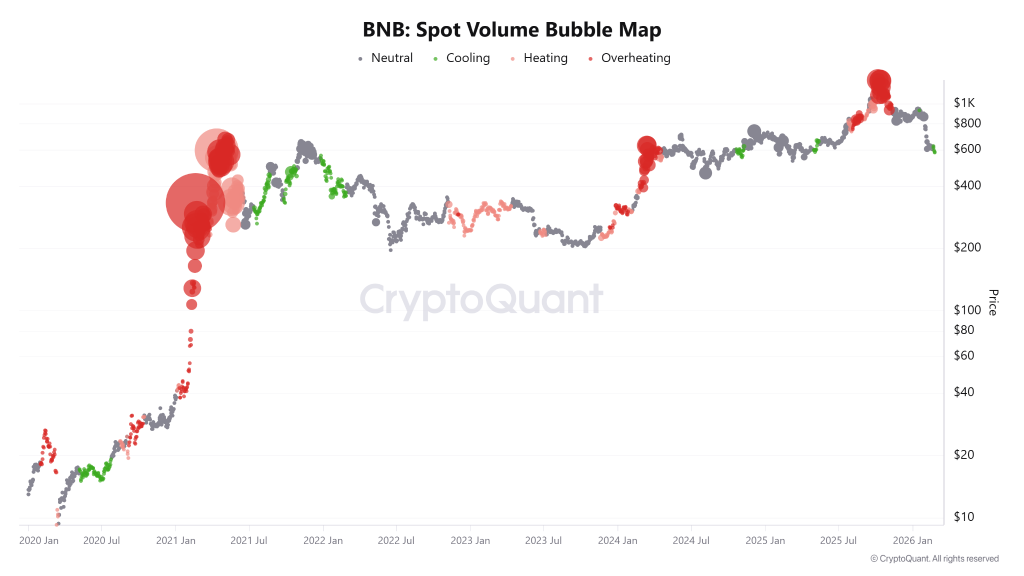
Pull up the BNB price chart and the structure confirms the message. BNB/USD has rolled over from its highs near the $1,000 region and is now trading around $609. Price sits below key moving averages, and momentum has been fading for weeks.
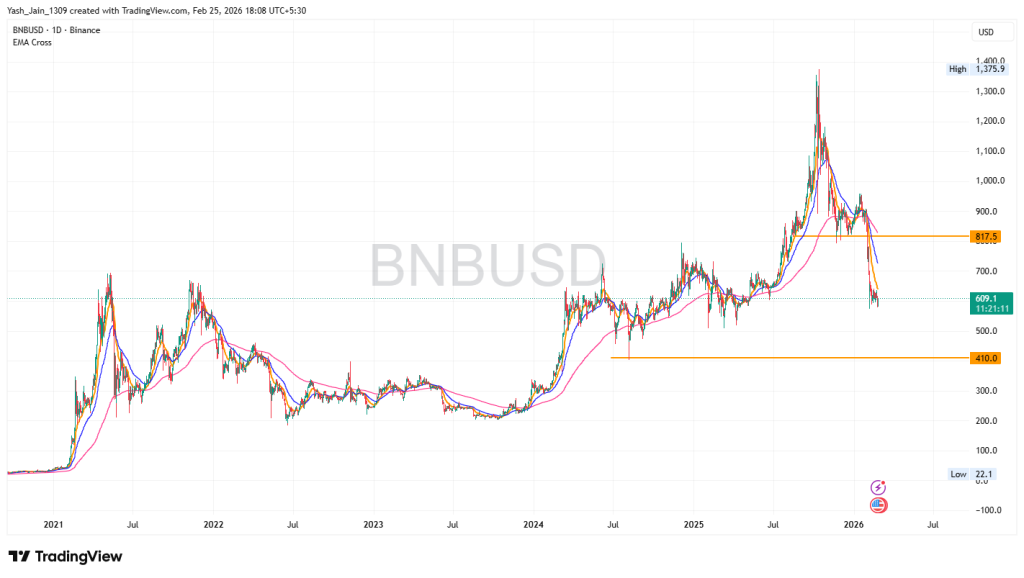
More telling? Volume behavior and derivatives positioning show that aggressive buyers have stepped aside. The futures average order size map reflects reduced large-scale whale aggression compared to prior peaks. Retail bursts showed up near local highs and that rarely ends well. Cooling isn’t bullish. It’s digestion at best, distribution at worst.
Now here’s the technical twist. The Chaikin Money Flow (CMF) has spiked toward the 0.20 region today a zone that historically sits between 0.20 and 0.30 where BNB has struggled to sustain upside. In previous cycles, whenever CMF pushed into that band, it marked short-term overbought conditions. What followed? Sharp downward repricing.
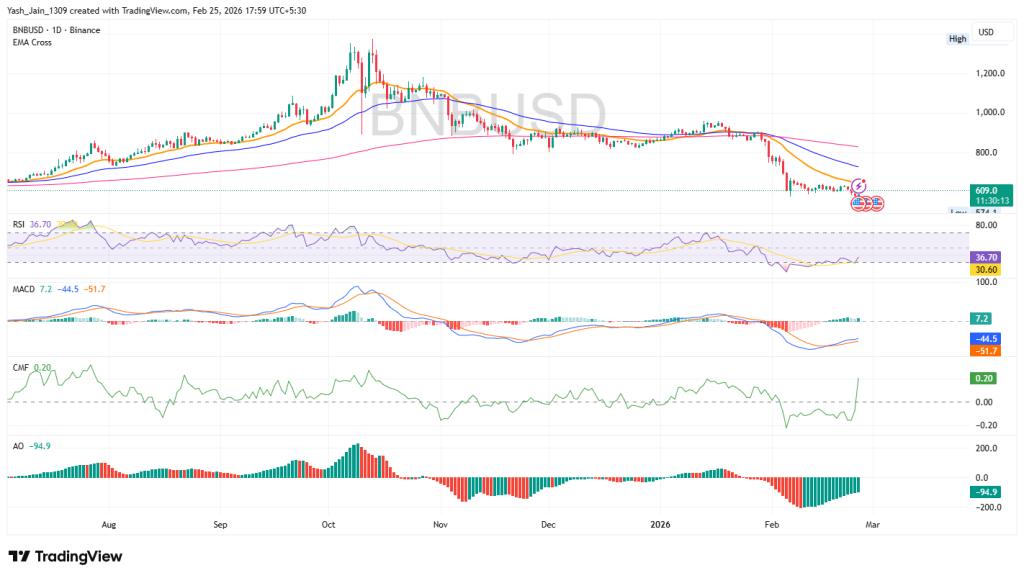
This doesn’t guarantee another drop. But it’s a familiar setup.
When CMF presses near its upper boundary during a cooling volume phase, it suggests temporary capital inflow against a broader weakening structure. That divergence between momentum spikes and volume exhaustion is worth paying attention to.
So, BNB price prediction for shortterm looks in red. If history rhymes, neutralization comes first. That implies more sideways-to-lower grind before a genuine base forms. The spot and futures bubble maps suggest we’re not done digesting the previous excess.
Technically, the next meaningful demand zone sits between $400 and $445. That region aligns with prior consolidation behavior and would represent a deeper reset phase if tested.
Could BNB/USD still hold above $600? Sure, the possibility is slim only if demand increases. However, the market has not yet shown convincing accumulation signals.
And until overheating cycles reset fully and volume flips back into constructive heating rather than cooling, the Binance Coin BNB price remains structurally vulnerable not broken, but certainly not ready to run.

The post Chainlink Price Prediction 2026, 2027 – 2030: Will LINK Price Reach $100? appeared first on Coinpedia Fintech News
Chainlink has emerged as a game-changing decentralized oracle network, enabling smart contracts to connect seamlessly with real-world data, APIs, and traditional financial systems. As the crypto market evolves, Chainlink’s role continues to expand, especially with its Cross-Chain Interoperability Protocol (CCIP) gaining traction. Its native token, LINK, not only powers the ecosystem but has also caught the attention of investors and analysts. As a result, institutional interest surged, leading to the launch of the LINK ETF by Grayscale in early December 2025.
With LINK price showing signs of a potential breakout and strong on-chain fundamentals backing its rise, the big question remains: Can LINK coin price hit $50 in December 2025? Let’s dive into this detailed Chainlink price prediction 2026–2030 to find out.
| Cryptocurrency | Chainlink |
| Token | LINK |
| Price | $9.4902
|
| Market Cap | $ 6,719,985,379.75 |
| 24h Volume | $ 523,599,917.8978 |
| Circulating Supply | 708,099,970.4526 |
| Total Supply | 1,000,000,000.00 |
| All-Time High | $ 52.8761 on 10 May 2021 |
| All-Time Low | $ 0.1263 on 23 September 2017 |
Chainlink (LINK) is currently trading at approximately $8.50. Market indicators suggest that a decline to critical support levels between $4.15 and $6.05 is quite probable should bearish sentiment increase. In the short term, there is potential for bulls to attempt a rally toward the $12 or $15 range. However, sustained bearish pressure could result in a return to the lower price range.
In early January, the LINK price struggled to hold $13, and by mid-January it had dropped to $7, only to rise again by early February. Since then, it has been consolidating around $8.50 as a pivot for the whole of February.
Now, what happens in March depends entirely on the strength of the bulls. If this consolidation is a sign of accumulation and demand, it can establish this level as support; a rise back to $12 or $15 may also be possible. Conversely, if it fails to hold above $8.50, the price could fall to the last line of defense, which is between $4.15 and $6.05.
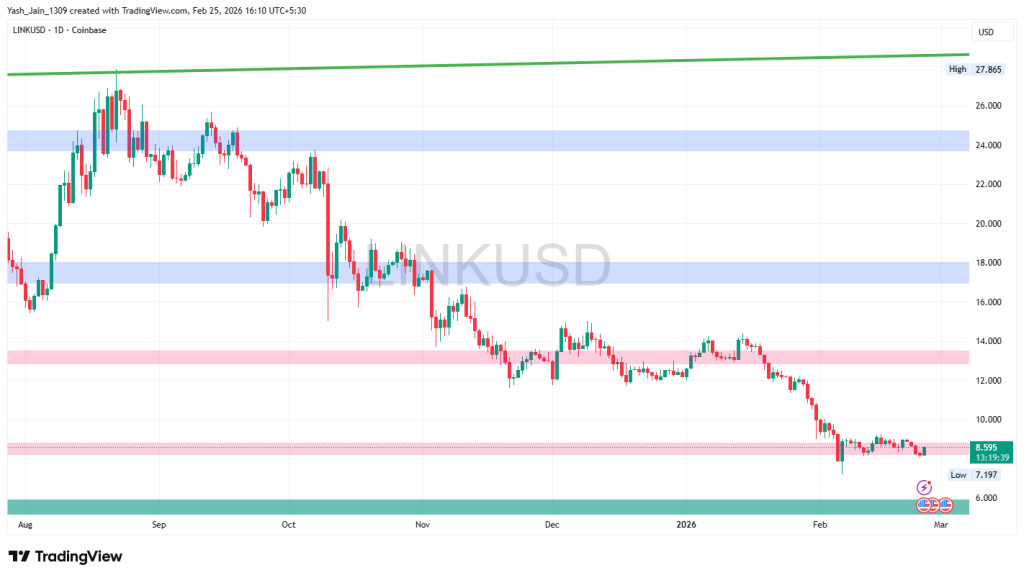
The weekly chart highlights an important price range for Chainlink (LINK) between $4.15 and $6.05. For many years, this range has provided crucial support, preventing the price from declining further.
In 2023, the price surged from this range, reaching a high of $31 by late 2024. However, bearish market conditions took over, leading to a consistent decline from 2025 onward. Early 2026 continued this downward trend, with the price now struggling around $8.50.
This support level is significant in the short term, as a reversal from this point could lead to a retest of the $12 or $15 levels. Historically, prices do not drop straight down without a challenge from bullish investors. However, if selling pressure remains strong and demand fails to meet expectations, the price may approach the $4.15 to $6.05 demand area again.
Looking ahead, the Chainlink price prediction for 2026 indicates the potential for a significant price surge similar to the explosive rally observed in 2020. Analysts suggest that if momentum and market sentiment align positively, the price could see a reversal, but it would take time to process that kind of price action.
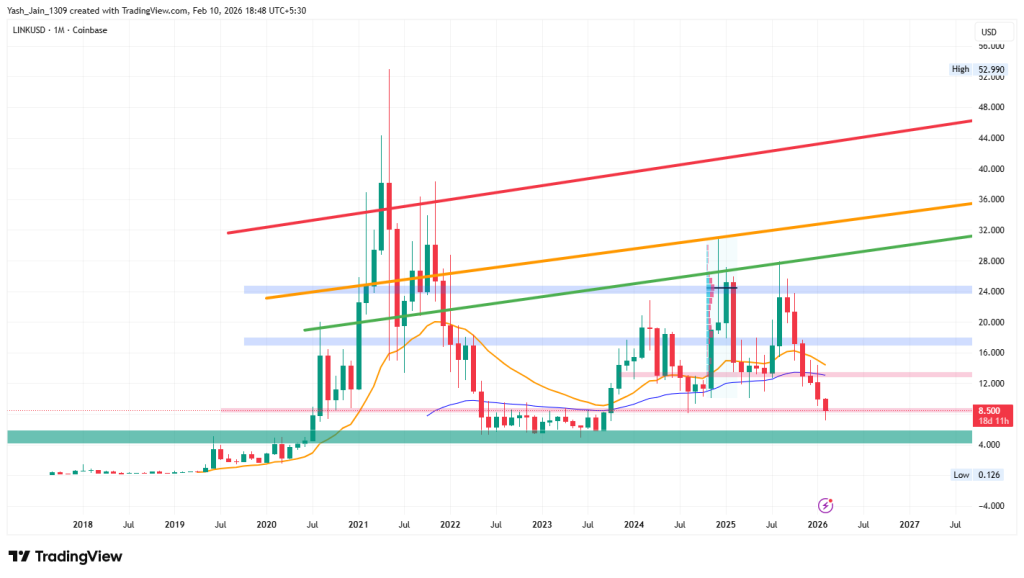
| Year | Potential Low ($) | Potential Average ($) | Potential High ($) |
| 2026 | 35 | 50 | 55 |
In the LINK on-chain metrics, both spot and futures markets are clearly exhibiting a Taker Buy-Dominant phase. It shows that buyers are actively executing at market prices without waiting for pullback opportunities. This is simply a strong sense of conviction rather than speculative strategies.
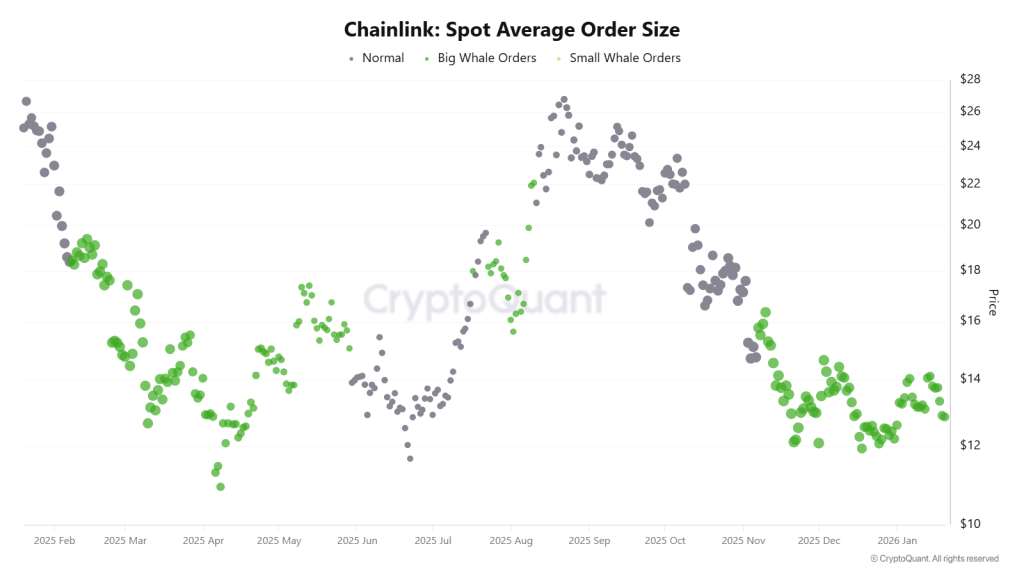
Additionally, the Average Order Size in both the spot and futures markets has escalated into the “Big Whale” category. This shift signals the involvement of institutional participants, who significantly influence LINK’s market structure, rather than retail trading flows.
| Year | Potential Low ($) | Potential Average ($) | Potential High ($) |
| 2026 | 35 | 50 | 55 |
| 2027 | 48 | 64 | 80 |
| 2028 | 58 | 85 | 104 |
| 2029 | 70 | 108 | 141 |
| 2030 | 85 | 147 | 195 |
This table, based on historical movements, shows Chainlink price to reach $195 by 2030 based on compounding market cap each year. This table provides a framework for understanding the potential LINK price movements. Yet, the actual price will depend on a combination of market dynamics, investor behavior, and external factors influencing the cryptocurrency landscape.
As per Chainlink’s Price forecast for 2026, the high price could be $55, the low may reach $35. This makes the average around $50.
Moving to 2027, the LINK Price projects that it might hit a high price of $80 potentially. With a $48 low and an average of $64.
Moving to 2028, the Chainlink Price Forecast predicts a high price of $104. On the flip side, the low may fall to $58, and the average is projected to be around $85.
As per Chainlink Price Forecast 2029, LINK’s high price is predicted to be $141, with a low of $70 and an average of $108.
Finally, as per the Chainlink Price Forecast 2030, LINK’s price can reach a high price of $195. With a low of $85 and an average of $147.
| Firm Name | 2026 | 2030 |
| Changelly | $25.83 | $140.70 |
| coincodex | $6.44 | $14.79 |
| Binance | $18.43 | $22.40 |
| Mitrade | $32.22 | $139.2 |
| Investing Haven | $54.10 | $80 |
| Flitpay | $62.6 | $110 |
*The aforementioned targets are the average targets set by the respective firms.
Stay ahead with breaking news, expert analysis, and real-time updates on the latest trends in Bitcoin, altcoins, DeFi, NFTs, and more.
At the time of writing, the value of one LINK crypto token was $ 9.49016475.
Chainlink price prediction for 2026 suggests LINK could trade between $35 and $55, with an average price near $50 under bullish conditions.
By 2030, 1 Chainlink could be worth between $85 and $195, depending on adoption, market cycles, and long-term crypto growth.
In five years, Chainlink is expected to be a core Web3 infrastructure, with broader adoption and a potential price range of $80–$140.
Chainlink is considered strong long term due to its real-world utility, oracle dominance, institutional adoption, and expanding cross-chain ecosystem.
LINK price is driven by oracle demand, CCIP adoption, staking growth, institutional interest, crypto market cycles, and global liquidity trends.
The post Why Is the Crypto Market Up Today? Bitcoin, Ethereum & XRP Lead Broad Rally appeared first on Coinpedia Fintech News
After days of panic selling and extreme fear, the crypto market has suddenly flipped green. Bitcoin price has reclaimed the $65,000 zone, Ethereum is pushing back toward $2,000, and XRP is stabilizing near $1.36. More than $323 million in leveraged positions were liquidated in just 24 hours, triggering a powerful short squeeze across major cryptocurrencies.
At the same time, strong Bitcoin ETF inflows and easing institutional concerns have helped stabilize sentiment. If you’re wondering why is the crypto market up today, the answer lies in a combination of forced liquidations, institutional ETF buying, macro shifts, and whale positioning beneath the surface.
Let’s break it down clearly.
The most immediate driver of today’s rally is forced liquidations. More than $323 million in leveraged positions were wiped out in the past 24 hours. Bitcoin alone saw roughly $140 million in liquidations, while Ethereum recorded over $100 million. The majority, estimated above 70%, were short positions. This matters because traders were heavily positioned for further downside as the Fear & Greed Index collapsed to 11 (Extreme Fear).
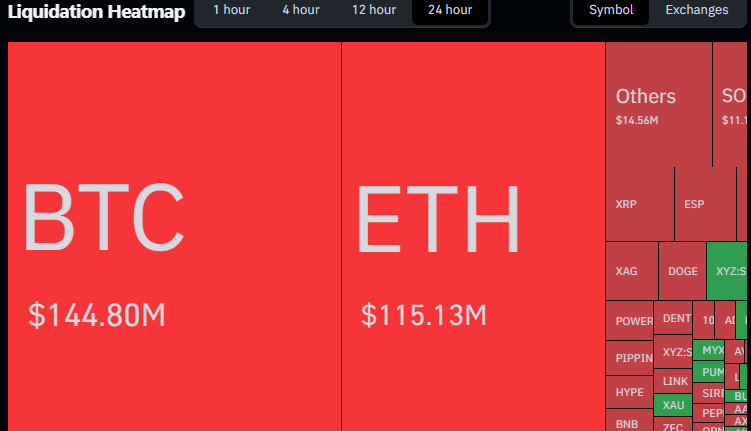
When prices began rising unexpectedly, short sellers were forced to close their trades. Once the cascade begins, prices can rise sharply in a short period. That squeeze effect forms the first backbone of why the crypto market is up today.
While liquidations explain the momentum of the rally, ETF inflows explain its strength. U.S. Bitcoin Spot ETFs recorded $257.7 million in daily net inflows, pushing cumulative inflows to approximately $54.07 billion. That represents real spot buying, not leveraged trading. Ethereum ETFs added about $9.23 million, and XRP-linked products recorded roughly $3.04 million in inflows.
ETF flows are important because they reflect institutional positioning. When institutional capital enters during extreme fear conditions, it provides structural demand beneath the market. Liquidations create momentum. ETF inflows create stability. Together, they form the backbone of today’s crypto market rebound.
Recent volatility surrounding Jane Street-related legal developments had weighed on sentiment. Concerns over potential institutional fallout increased risk-off behavior earlier in the week. Today’s stabilization suggests that systemic fears may have been overestimated. Markets often react strongly to uncertainty, and once clarity begins to emerge, prices reprice quickly. The easing of this narrative removed a layer of pressure from the market, allowing buyers to step back in.
The total crypto market cap has rebounded toward $2.26 trillion, reflecting broad participation rather than isolated strength.
Here’s how the majors are positioned today:
Bitcoin (BTC) Price Today
Bitcoin broke out of a short-term falling channel on lower timeframes, signaling a pause in downside momentum. Holding above $64,500 keeps the recovery structure intact.
Ethereum (ETH) Price Today
ETH has shifted from aggressive selling to consolidation after leverage reset. A push above $2,250 would strengthen short-term bullish structure.
XRP Price Today
XRP price is stabilizing after recent volatility. Holding above $1.30 maintains structure, while a break above $1.40 could invite renewed momentum.
Altcoins beyond the majors are also seeing relief bounces, indicating broader market participation rather than isolated Bitcoin strength.
The answer is layered but clear:
Bitcoin ignited the move, Ethereum confirmed it and XRP followed. The market shifted from panic to positioning, and that shift is driving today’s crypto market rally.
However, for sustained upside, Bitcoin must hold above the key resistance zone of $66k, ETF inflows need to remain consistent, liquidation pressure must continue favoring short positions and macro conditions must stay supportive. If these conditions align, this rebound could extend further.

The post PEPE Price Prediction 2026, 2027 – 2030: Can Pepe Memecoin Reach 1 Cent? appeared first on Coinpedia Fintech News
Pepe Coin (PEPE), the memecoin inspired by the iconic frog meme, has rapidly become a standout in the crypto world. Ranked just behind Dogecoin and Shiba Inu, PEPE’s explosive rise—boasting gains of over +130325085.96% from its all-time low—has captured investor attention globally.
As it maintains its position among top memecoins, many are now asking: Will PEPE price go parabolic by the end of 2025? In this article, explore CoinPedia’s in-depth PEPE coin price prediction for 2025, and discover long-term forecasts that look ahead to 2030.
| Cryptocurrency | Pepe |
| Token | PEPE |
| Price | $0.0000
|
| Market Cap | $ 1,721,309,802.03 |
| 24h Volume | $ 397,794,483.4418 |
| Circulating Supply | 413,772,501,517,365.7500 |
| Total Supply | 413,772,501,517,365.7500 |
| All-Time High | $ 0.0000 on 09 December 2024 |
| All-Time Low | $ 0.0000 on 14 April 2023 |
The price of PEPE has encountered difficulties due to insufficient liquidity and cautious investor sentiment, a trend that appears to have carried into the first quarter of 2026. A price increase may be feasible in the remaining period of Q1 2026, contingent on the introduction of new capital into the market, particularly in light of the recent narrowing of the PEPE/USD trading range. Conversely, should this capital influx fail to materialize, a decline towards $0.00000120 may be anticipated.
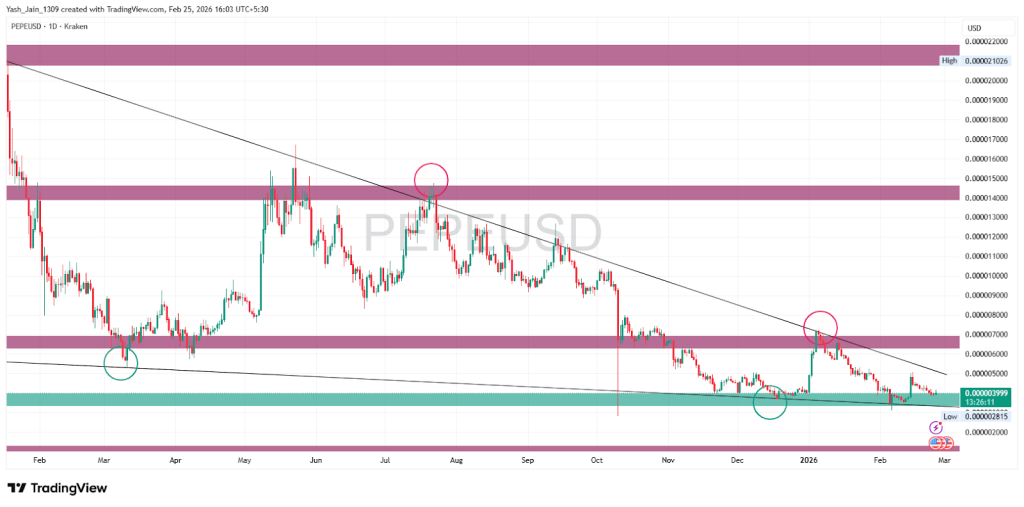
PEPE’s price has struggled in Q4 2025 due to low liquidity and cautious investor sentiment. This has continued in January 2026, and February is following that cautious investor, too.
The broader market is in an extreme fear phase, and prices are collapsing. However, if new capital flows in, a price rise is likely in the rest of Q1 2026, as this outlook is supported by a tightening trading range, which indicates a potential breakout more than ever. The PEPE price has faced challenges for several months, falling short of the expectations set by experts and investors alike, primarily due to an overarching risk-off sentiment within the memecoin space.
However, it’s essential to acknowledge that the current low market liquidity and cautious investor behavior have kept new capital on the sidelines amid a series of bearish trends.
Nevertheless, it is also a fact that entering the crypto market through memecoins remains one of the most accessible and easiest methods available. Therefore, should new liquidity begin to flow in, we can undoubtedly anticipate a bigger rise in PEPE’s price. Q1 2026 stands out as an ideal timeframe for this potential resurgence, and the compression of the falling wedge shows compression of the trading range that confirms the effectiveness and reliability of these trendlines that have been containing the price of PEPE since 2025, and the odds of a rally to pop out soon have greatly risen.
But, if it fails and collapses, then a decline toward $0.00000120 is expected, where we saw a rally sprouting back in early 2024.
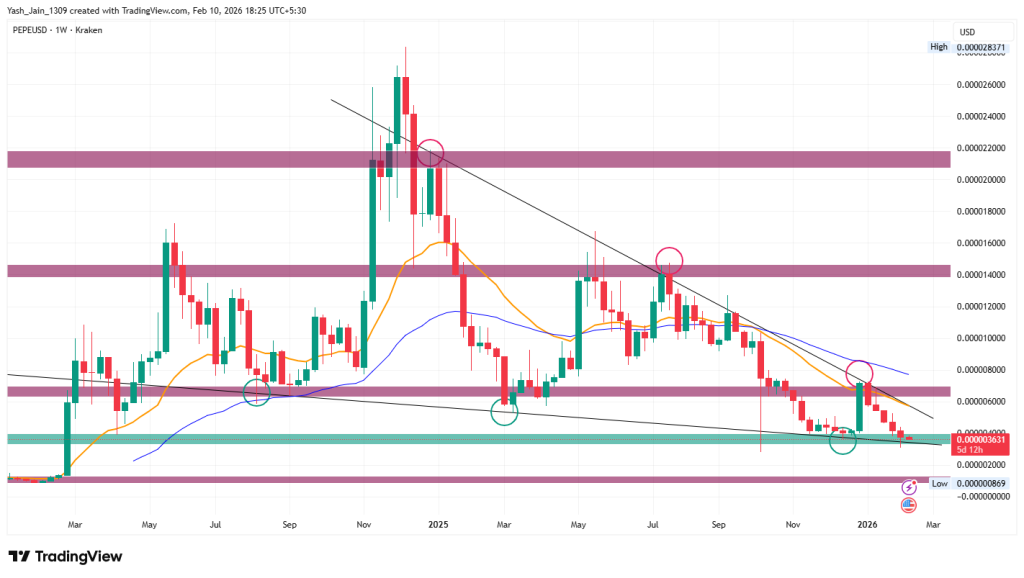
As per the metric “90-day Spot Taker CVD”, the cumulative difference between market buy and market sell volumes has turned positive and is increasing, indicating that high-conviction traders are aggressively market-buying PEPE rather than waiting for passive fills at lower prices.
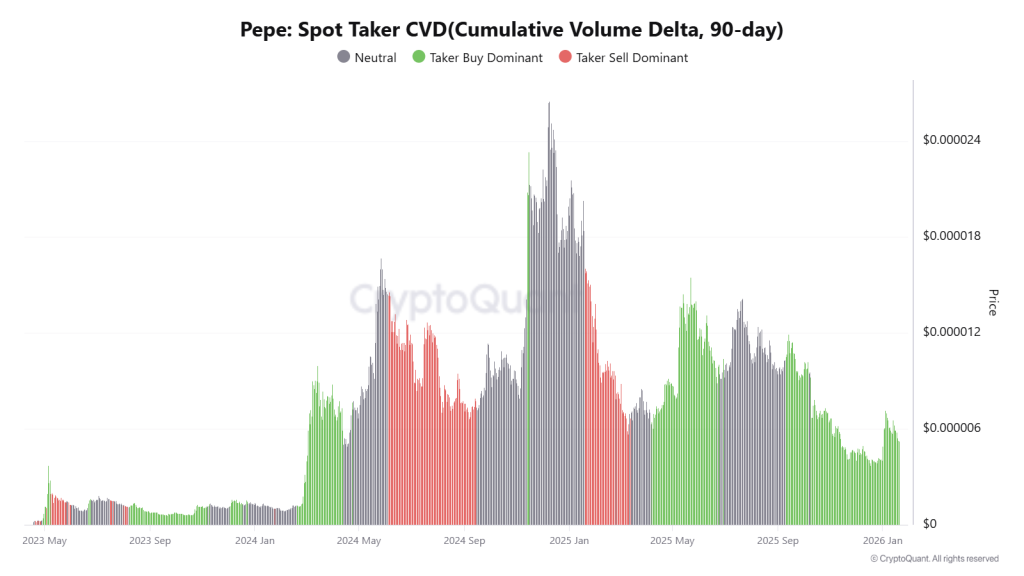
This aggressive participation is a hallmark of a robust accumulation phase, in which market demand begins to outpace available liquidity, often serving as a precursor to a volatile price expansion.
Given that similar green clusters on the historical chart preceded significant rallies in mid-2024 and mid-2025, the current uptick suggests that “smart money” is positioning for a major move as the asset stabilizes near its current support levels in January 2026.
| Year | Potential Low ($) | Potential Average ($) | Potential High ($) |
| 2026 | 0.0000179 | 0.0000359 | 0.0000539 |
| 2027 | 0.0000269 | 0.0000539 | 0.0000809 |
| 2028 | 0.0000404 | 0.0000809 | 0.0001214 |
| 2029 | 0.0000607 | 0.0001214 | 0.0001822 |
| 2030 | 0.0000910 | 0.0001822 | 0.0002733 |
This table, based on historical movements, shows PEPE price to reach $0.0002733 by 2030 based on compounding market cap each year. This table provides a framework for understanding the potential PEPE price movements. Yet, the actual price will depend on a combination of market dynamics, investor behavior, and external factors influencing the cryptocurrency landscape.
Our PEPE price prediction suggests that the price of PEPE in 2026 might range between $0.0000179 and $0.0000539, with the average price of the meme coin at $0.0000359.
For 2027, we predict that the price of PEPE could range between $0.0000269 and $0.0000809, and the average price of the meme coin is expected to be around $0.000539.
As per our Pepe Coin Price Prediction, in 2028, the price could range between $0.0000404 to $0.0001214, with the average price of the meme coin at $0.0000809.
For 2029, the price of PEPE could range between $0.0000607 and $0.0001822, with the average price of the meme coin expected to be around $0.0001214.
Based on our Pepecoin price forecast, the price of PEPE in 2030 might range between $0.0000910 to $0.0002733, with the average price of the meme coin predicted to be around $0.0001822.
| Firm Name | 2026 | 2030 |
| Changelly | $0.0020 | $0.015 |
| CoinCodex | $ 0.000026 | $ 0.000047 |
| Binance | $0.000014 | $0.000017 |
Stay ahead with breaking news, expert analysis, and real-time updates on the latest trends in Bitcoin, altcoins, DeFi, NFTs, and more.
The current price of Pepecoin is $ 0.00000416.
PEPE’s price depends on meme coin market sentiment, liquidity inflows, social media trends, and broader crypto cycles rather than fundamentals alone.
Yes. As a meme coin, PEPE is highly volatile and sentiment-driven, making it riskier than utility-based cryptocurrencies with real-world use cases.
PEPE competes mainly on community hype and trading momentum, while DOGE and SHIB benefit from longer histories and broader ecosystem support.
PEPE could trade between $0.0000179 and $0.0000539 in 2026, depending on meme coin demand, liquidity inflows, and overall crypto market momentum.
In 2027, PEPE may range from $0.0000269 to $0.0000809 if bullish sentiment and retail participation remain strong across meme coins.
PEPE’s price in 2028 could move between $0.0000404 and $0.0001214, driven by broader market cycles rather than project fundamentals.
By 2030, PEPE could reach up to $0.0002733 in optimistic scenarios, though prices will remain highly sensitive to market sentiment and risk appetite.
The post Dogecoin Price Prediction 2026, 2027 – 2030: Will DOGE Reach 1 Dollar? appeared first on Coinpedia Fintech News
Dogecoin, the original meme coin, has cemented its status as a crypto legend. Known for its viral appeal and a fiercely loyal community, it continues to capture headlines and investor interest. Following Donald Trump’s election win, speculation around a potential Dogecoin ETF fueled a surge in optimism.
Now, that speculation has become a reality. With the September 18 launch of the REX-Osprey DOGE ETF, trading under the ticker DOJE and carrying a 1.5% fee, the path has been cleared for institutional access. This groundbreaking debut makes it the first U.S.-listed spot ETF for Dogecoin and significantly raises the odds for similar approvals from major players like Bitwise and Grayscale before year-ends.As growing optimism and increasing adoption reshape the market, traders are asking: “Will Dogecoin go back up?” and “Can DOGE hit $1?” In this article, we dive into a detailed technical analysis and a long-term Dogecoin price prediction 2025 to 2030.
Keep reading to find out!
| Cryptocurrency | Dogecoin |
| Token | DOGE |
| Price | $0.1016
|
| Market Cap | $ 17,164,912,147.16 |
| 24h Volume | $ 1,118,993,004.6026 |
| Circulating Supply | 168,887,353,126.58 |
| Total Supply | 168,887,353,126.58 |
| All-Time High | $ 0.7376 on 08 May 2021 |
| All-Time Low | $ 0.0001 on 07 May 2015 |
The DOGE price continued its decline in January and In February, it retested the downward trendline after breaking below $0.10, but from mid-February onward, it experienced a brief bounce.
For a trend reversal to occur, it must surpass the key resistance level of $0.1380. If it falls below $0.0810, it could drop to the range of $0.055 to $0.060.
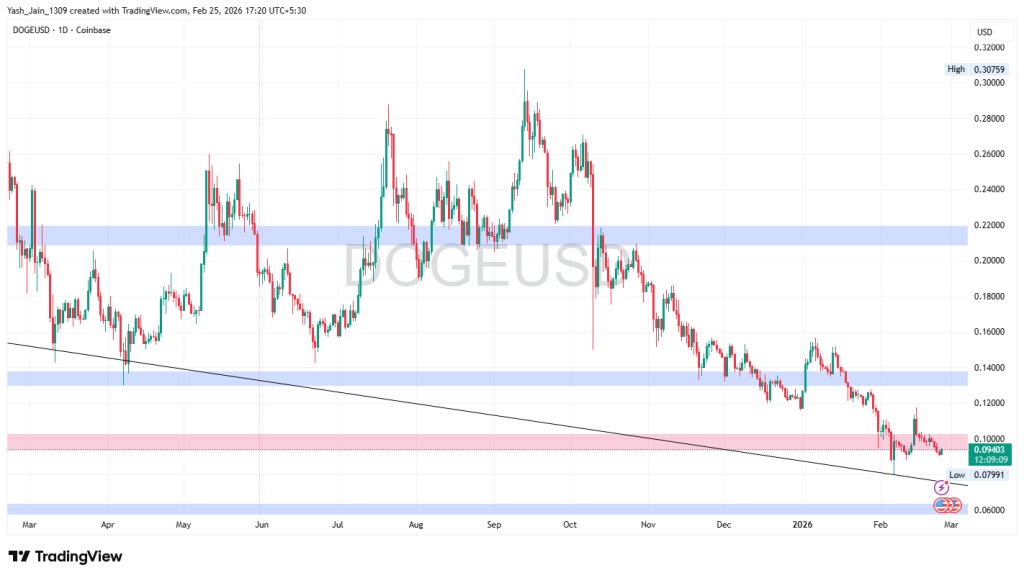
In January, the price consistently declined on the weekly chart, continuing where 2025 left off. Now, in February, it has retested the downward trendline after breaching the $0.10 support area. However, the dynamic support trendline has acted as a sturdy support that gave it a brief bounce to $0.1170 but still trades under $0.10 when short-term bullish momentum faded.
Since bullish demand is reacting at this level, the odds suggest that this long-term monthly decline could be flipped only if a certain level is knocked down to signal a change in trend, like $0.1380.
If it regains its footing above this area, then by the rest of Q1’s remaining days, a retest of $0.2000-0.2200 range could be possible.
But, at this point, if DOGE loses the 0.0810 point of contact of its support taken in February, which is knocked down, then it will end up retracing towards the support area of $0.055-$0.060, a range that previously contributed to a substantial rise in late 2023.
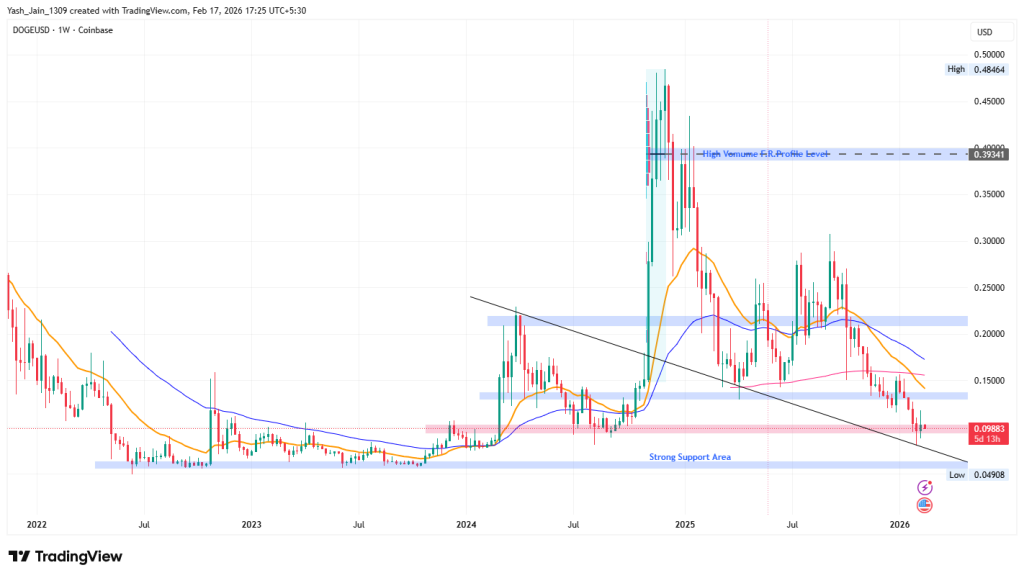
| Year | Potential Low ($) | Potential Average ($) | Potential High ($) |
| 2026 (conservative) | 0.10 | 0.39 | 1.00 |
Despite the price facing challenges after peaking at $0.46 in late 2024 and then falling, 2025 is a very tough year for its investors. But the total number of holders has surged to an impressive 8.17 million, indicating strong investor accumulation.
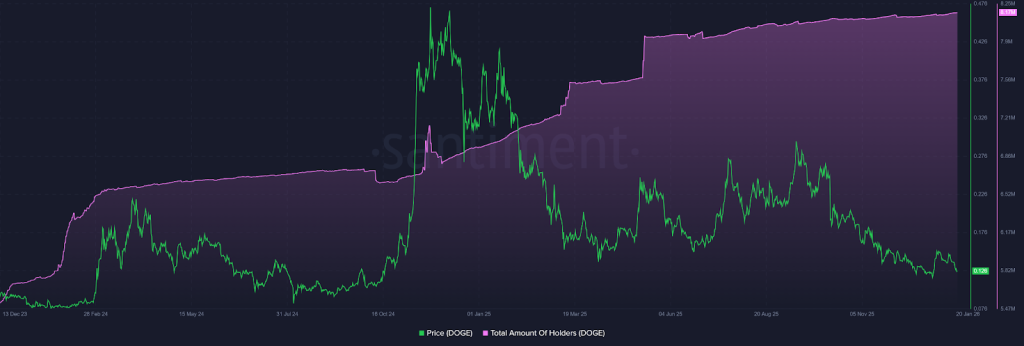
Similarly, large holders are showing strategic accumulation patterns that suggest bullish sentiment. While the number of retail holders holding between 10 and 10,000 coins has been declining, those holding between 100 million and 1 billion coins continue to increase, reinforcing a positive outlook for the asset.
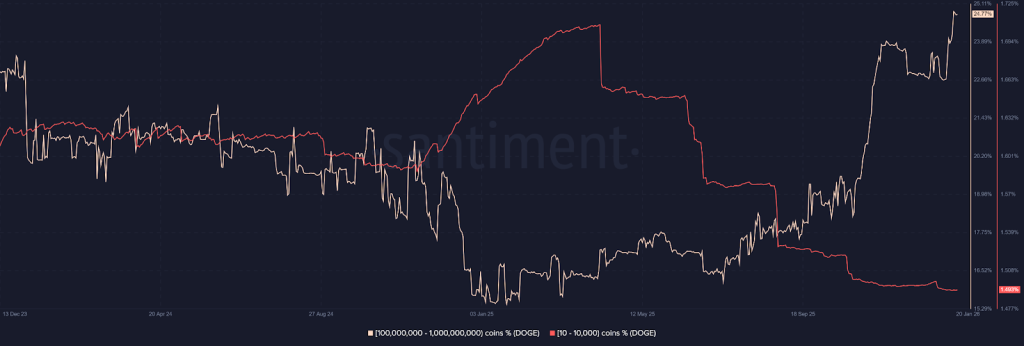
| Year | Potential Low ($) | Potential Average ($) | Potential High ($) |
| 2026 | 0.75 | 1.00 | 1.25 |
| 2027 | 1.15 | 1.35 | 1.50 |
| 2028 | 1.25 | 1.75 | 2.00 |
| 2029 | 1.50 | 2.15 | 2.65 |
| 2030 | 2.50 | 2.75 | 3.00 |
This table, based on historical movements, shows DOGE price to reach $3 by 2030 based on compounding market cap each year. This table provides a framework for understanding the potential DOGE price movements. Yet, the actual price will depend on a combination of market dynamics, investor behavior, and external factors influencing the cryptocurrency landscape.
Based on the historic market sentiments and trend analysis of the altcoin, here are the possible Dogecoin price targets for the longer time frames.
| Year | Potential Low ($) | Potential Average ($) | Potential High ($) |
| 2031 | 3.01 | 3.49 | 4.00 |
| 2032 | 3.79 | 4.47 | 5.25 |
| 2033 | 4.96 | 5.75 | 6.75 |
| 2040 | 14.22 | 19.50 | 25.00 |
| 2050 | 54.99 | 105.00 | 155.00 |
| Firm Name | 2026 | 2030 |
| Changelly | $0.233 | $1.07 |
| Coincodex | $0.115 | $0.259 |
| Binance | $0.235 | $0.285 |
Stay ahead with breaking news, expert analysis, and real-time updates on the latest trends in Bitcoin, altcoins, DeFi, NFTs, and more.
Analysts project Dogecoin could range between $0.39 and $1 in 2026, depending on institutional demand and market momentum.
Yes, if DOGE surpasses key resistance levels and gains institutional support, it could potentially hit $1 during 2026.
Long-term projections suggest Dogecoin may reach $3 by 2030, assuming steady adoption and growing market confidence.
Dogecoin’s strong community, mainstream adoption potential, and evolving use cases make it a viable long-term digital asset.
The post Crypto Market Recovers as Bitcoin Dominance Falls, Altcoin To Rally Next appeared first on Coinpedia Fintech News
The crypto market recovered strongly today, with total market value rising 3.5% to around $2.26 trillion. Major cryptocurrencies like Bitcoin, Ethereum, XRP, and Solana are now trading in green, showing gains between 3% and 8%.
This recovery comes at a critical time as Bitcoin dominance has broken below an important support level, raising early signs that altcoins could rally soon.
Bitcoin is now trading near $65,600 after recovering from recent lows near $62,000. The recovery shows that buyers are stepping in and preventing deeper losses.
Similarly, Ethereum has also jumped over 5.8%, while XRP has gained nearly 4%. Solana is among the top performers, rising more than 8.5% today.
The Relative Strength Index (RSI), a key indicator, has moved out of oversold levels. This means the heavy selling phase has ended, and the market is now stabilizing.
Experts say if Bitcoin stays above $64,000, it could try to move higher again and create a strong setup for altcoins to rise.
Bitcoin dominance is currently hovering around 58.42%, and the chart shows a clear break below a long-term rising support line. This trendline had been holding dominance up since 2024.
Now that dominance has broken below this key level, it signals that investors are starting to move capital into altcoins.
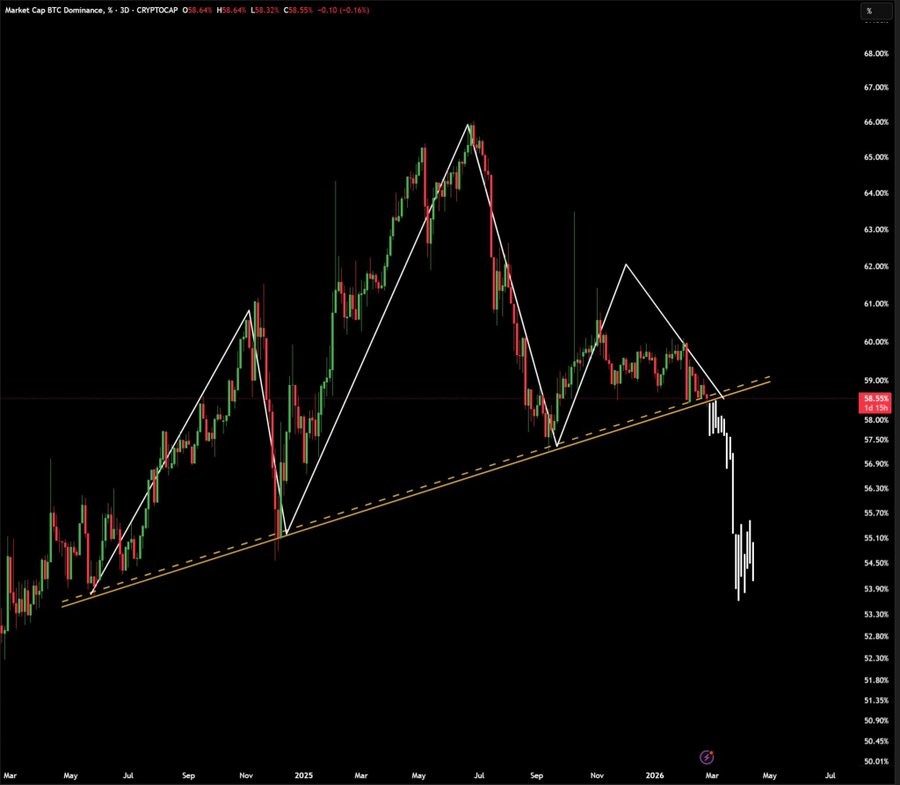
Once the breakdown happens, dominance will quickly move toward the 54% zone, confirming weakness. This is one of the strongest early signals of a potential altcoin season.
Altcoins are now rising faster than Bitcoin. Coins like Cardano, LINK, AVAX, and LTC are up around 5 to 9%. Smaller coins such as VIRTUAL, MORPHO, and ETHFI have jumped more than 10%.
The Altcoin Season Index has climbed to 45, its highest level since January. This shows that altcoins are slowly gaining strength, but the market is still in the early stage of a bigger move.
If Bitcoin dominance keeps falling, altcoins could see even stronger rallies ahead.
Therefore, the next few weeks will be important to confirm whether the market is entering a full altcoin rally phase.
Stay ahead with breaking news, expert analysis, and real-time updates on the latest trends in Bitcoin, altcoins, DeFi, NFTs, and more.
The crypto market is up 3.5% as buyers returned after oversold conditions. Bitcoin holding above $64K improved sentiment and triggered gains across major altcoins.
It’s early but promising. The Altcoin Season Index at 45 shows improving momentum, yet confirmation requires sustained Bitcoin stability and continued dominance decline.
Bitcoin holding above $64,000 is key. Staying above this level strengthens bullish momentum and increases the chances of further upside for the broader market.
The post Ethereum Price Teeters as Binance Deposits Spike: Capitulation or Bottom? appeared first on Coinpedia Fintech News
The Ethereum price is bleeding, and now the on-chain data is flashing something interesting, maybe ominous. Unique ETH deposit addresses on Binance have surged from around 360K to over 450K, the highest level since August 2025. That’s not subtle. And it’s happening while ETH/USD is clinging to the $1,900 zone after a brutal drop from October’s $4,900 peak.
Pull up the Ethereum price chart and it’s not exactly screaming recovery. Price is trading below the 50, 100, and 200-day dynamic EMA bands. Lower highs, lower lows. RSI hovering near oversold but without a convincing bullish divergence. MACD and AO still stuck in bearish territory.
Simply put, the trend is down. The recent breakdown below $2,000 was a psychological line in the sand and its break is what accelerated the slide. Structurally, this remains a confirmed downtrend. Conditions are stretched, sure. But oversold doesn’t mean reversal. It just means pressure has been relentless.
So when the Ethereum price is falling and exchange deposit addresses explode higher, that’s not background noise.
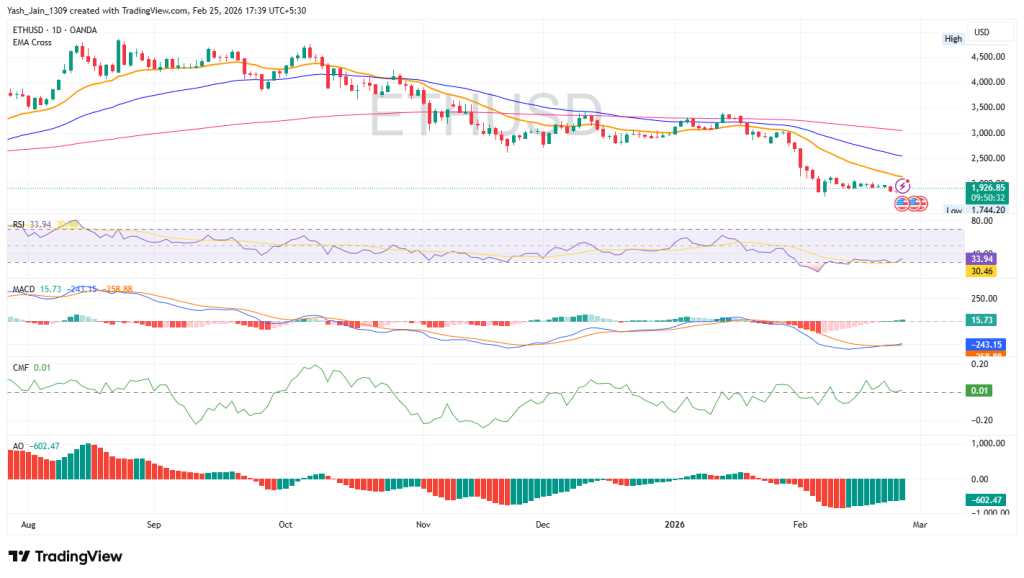
Here’s where it gets interesting. A surge in unique deposit addresses usually signals one thing: people are moving coins to an exchange to sell. Retail capitulation is the obvious narrative. Investors who held through the first leg down may finally be throwing in the towel, locking in losses, and exiting spot positions.
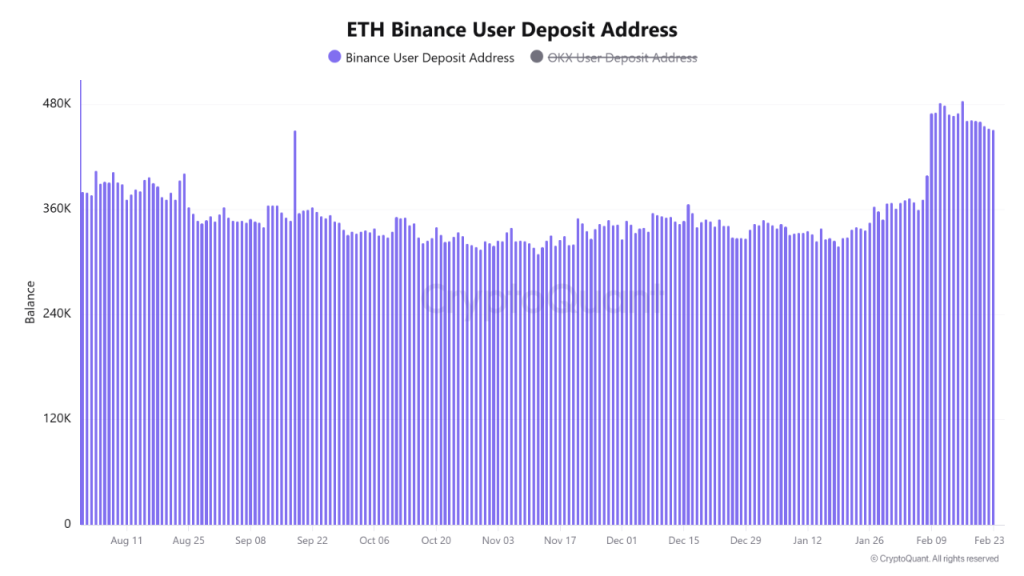
But let’s be real, it’s not always that simple. Given the steep drop below $2,000, a chunk of those deposits could be margin top-ups. Derivatives traders defending long positions, scrambling to avoid liquidation. When ETH/USD falls fast, collateral flows spike. It’s mechanical. Brutal. But most importantly Necessary to save positions. Either way, supply on Binance increases. And that tends to mean volatility.
So what does this mean for Ethereum price prediction?
In the short term, elevated deposits translate to potential selling pressure. That doesn’t disappear overnight. If deposit activity stays high and price continues making lower lows, we’re likely looking at another capitulation leg.
But, historically, extreme spikes in exchange deposit activity often cluster near exhaustion phases. When everyone who wants out has moved their coins, there’s simply less forced selling left.
Now, the best preservation of capital is to not enter any unsafe trades, so it’s best to look for changes in a few metrics which can hint for a reversal like declining deposit activity, exchange outflows rising, RSI divergence, and a reclaim of the 50-day EMA with real volume. Until then, the Ethereum price remains in a late-stage downtrend stretched, volatile, and sitting in what looks like an inflection zone.
Ethereum’s price is falling due to a confirmed downtrend, trading below key moving averages, and surging exchange deposits which typically signal increased selling pressure.
An oversold RSI suggests heavy pressure but doesn’t guarantee a reversal. Smart investors wait for confirmation like bullish divergence or a reclaim of key EMAs before buying.
A bounce is possible, but the current structure shows lower highs and lows. A sustained recovery requires decreasing exchange inflows and a breakout above the 200-day EMA.


A proposed law would require online investment influencers to reveal their holdings and paid promotions, with penalties potentially comparable to market manipulation violations.
FG Nexus sold another $14 million in Ether from its corporate treasury, bringing its losses to over $80 million as Ether-focused balance sheets come under mounting market pressure.

Competing reports outline contrasting views on protocol revenue, development and funding accountability.

Bitcoin’s failure to replicate gains in gold and stocks over the last six months may result in a delayed rally as BTC price returns to $65,000.

Binance rejected the allegations, saying it flags suspicious activity, enforces strict compliance procedures and does not permit Iranian users on the platform.
Bitcoin traders had mixed opinions over what caused a BTC price rebound past $66,000 as attention focused on Jane Street selling pressure.

The post FG Nexus Sells Additional Ethereum as Losses Hit $82M appeared first on Coinpedia Fintech News
Ethereum treasury firm FG Nexus sold another 7,550 ETH ($14.06M) today as it continues downsizing its holdings. The firm had bought 50,770 ETH for $196M in August–September 2025 at an average price of $3,860, but market conditions forced it to cut exposure, including a prior sale of 21,025 ETH at roughly $2,649 each. FG Nexus now holds 30,094 ETH ($57.5M), leaving it with an estimated loss of about $82.8M on its initial position.

The post Trakx Brings Crypto Tradable Indices On-Chain on Canton, Enabling B2B and B2B2C Partner Integrations appeared first on Coinpedia Fintech News
Paris, France – February 25, 2026
Trakx announced that its Crypto Tradable Indices (CTIs) are now live on-chain on the Canton Network, enabling B2B and B2B2C integrations for partners that want to embed tokenized strategy exposure directly into their own products and distribution channels.
The deployment supports a partner-first model: institutions operating within Canton’s permissioned, privacy-preserving environment can integrate CTIs as on-chain strategy components, while maintaining control over client relationships, compliance setups, and go-to-market execution.
Trakx can issue CTIs on-chain as programmable index strategy tokens, moving beyond a single exchange-based access point and allowing CTIs to be integrated as modular exposures within partner stacks.
This architecture is designed for institutional participants building on Canton, including:
Lionel Rebibo, CEO of Trakx, commented:
“This milestone is about crypto index products distribution at institutional scale. By bringing CTIs on-chain on Canton, we’re enabling partners to integrate regulated strategy exposure directly into their systems and reach end users through their existing channels.”
Trakx is inviting Canton Network ecosystem partners interested in integrating on-chain Crypto Tradable Indices – or exploring how tokenized strategy exposures can enhance their product stack – to start a discussion.
The B2B and B2B2C model is designed to keep partners in control: partners retain ownership of distribution, compliance configuration, and end-user relationships, while Trakx provides the on-chain issuance layer and strategy tokenization mechanics.
Institutional partners can begin the conversation by contacting canton@trakx.io.
In the near term, Trakx will onboard additional institutional partners within the Canton ecosystem and expand live integrations across issuance, transfer, and lifecycle workflows. Trakx also plans to progressively extend access to on-chain CTIs for retail users on the Trakx platform as integrations mature.
In parallel, the company is advancing compliant tokenization frameworks to expand issuance beyond crypto index strategies, enabling additional tokenized strategies and structures and, over time, other asset classes.
The post Hong Kong to Issue First Stablecoin Licenses in March appeared first on Coinpedia Fintech News
Hong Kong (HK) is preparing to issue its first stablecoin licenses in March, marking a major step in its plan to become a global leader in digital assets. The new licensing system will allow approved companies to issue fiat-backed stablecoins under clear regulatory oversight. This move will improve investor trust and attract global crypto firms to Hong Kong.
Financial Secretary Paul Chan announced the move in the 2026–27 budget speech, adding that Hong Kong has already introduced a licensing framework.
He said that the regulators will work closely with licensed companies to ensure compliance, risk control, and financial stability.
Crypto markets widely use stablecoins for trading, payments, and cross-border transfers. By introducing clear regulations, Hong Kong aims to create a safer environment for stablecoin adoption.
This makes Hong Kong one of the few major financial centers providing regulatory clarity for stablecoins.
Hong Kong regulators are also working to improve market liquidity and expand services for professional investors.
Alongside stablecoin licensing, Hong Kong is also developing its digital asset infrastructure. The Hong Kong Monetary Authority (HKMA) launched the pilot phase of “Project Ensemble,” which explores tokenized deposits and digital asset transactions.
CMU Omniclear, a subsidiary of HKMA, is also working on a digital asset platform to support the issuance and settlement of tokenized bonds.
The government is introducing guidelines and support programs to promote tokenization and enable blockchain-based asset issuance.
These efforts aim to modernize Hong Kong’s financial system and improve efficiency.
The global stablecoin market is valued at over $314.8 billion, with major stablecoins such as USDT and USDC dominating usage.
Hong Kong’s licensing framework could attract new stablecoin issuers and increase competition in the regulated stablecoin sector. Regulated stablecoin systems are essential for institutional adoption, as financial institutions require legal clarity and secure infrastructure.
Stay ahead with breaking news, expert analysis, and real-time updates on the latest trends in Bitcoin, altcoins, DeFi, NFTs, and more.
Hong Kong is scheduled to issue its first stablecoin licenses in March 2026, as announced in the Financial Secretary’s budget speech.
Hong Kong is regulating stablecoins to enhance investor protection, ensure financial stability, and attract global crypto firms by providing clear compliance rules.
The new licenses are expected to increase competition among regulated issuers, potentially challenging current leaders like USDT and USDC by offering a secure, compliant alternative.

The post Artificial Superintelligence Alliance (FET) Price Prediction 2026, 2027-2030 appeared first on Coinpedia Fintech News
As artificial intelligence continues to dominate global headlines, blockchain-based AI infrastructure projects are once again attracting investor attention.
Among them, the Artificial Superintelligence Alliance (ASI) stands out as a strategic merger of major AI-focused blockchain entities.
Founded through the collaboration of Fetch.ai, SingularityNET, and later CUDOS, the alliance aims to create the largest open-source, decentralized ecosystem focused on Artificial General Intelligence (AGI).
The FET token, originally native to Fetch.ai and now central to the ASI ecosystem, serves as the utility, governance, and settlement layer across AI services.
So let’s dive straight into CoinPedia’s Artificial Superintelligence Alliance (FET) price prediction for 2026, 2027, and 2030.
| Cryptocurrency | Artificial Superintelligence Alliance |
| Token | FET |
| Price | $0.1576
|
| Market Cap | $ 357,549,800.01 |
| 24h Volume | $ 81,907,103.4227 |
| Circulating Supply | 2,268,909,381.3463 |
| Total Supply | 2,714,384,546.6720 |
| All-Time High | $ 3.4743 on 28 March 2024 |
| All-Time Low | $ 0.0083 on 13 March 2020 |
Artificial Superintelligence Alliance is growing its AI agent marketplace, which allows users and apps to use AI services easily.
If ASI successfully brings everything together, it can host AI models on its network, allow AI agents to talk and work with each other, and enable users to pay for AI services directly on the blockchain. It is also working to form partnerships with businesses that want to use AI.
If more people start using AI on the network and demand for computing power rises, it could help increase activity and push the FET price towards $0.34 by March 2026.
Looking at the FET weekly chart, it shows a clear long-term downtrend, trading inside a descending channel since early 2024. However, the FET price continues to form lower highs and lower lows, confirming a strong bearish market structure.
Recently, FET has been consolidating near the lower channel boundary around $0.15, which is acting as a key support zone. A breakdown below this area could trigger further downside toward $0.10.
On the upside, immediate resistance is at $0.23, followed by stronger resistance near $0.34. The major trend reversal level remains near $0.60 at the top of the channel. Only a weekly close above $0.34 would signal early bullish strength.
The RSI is near 34, indicating weak momentum but also approaching oversold conditions, which may slow selling pressure.
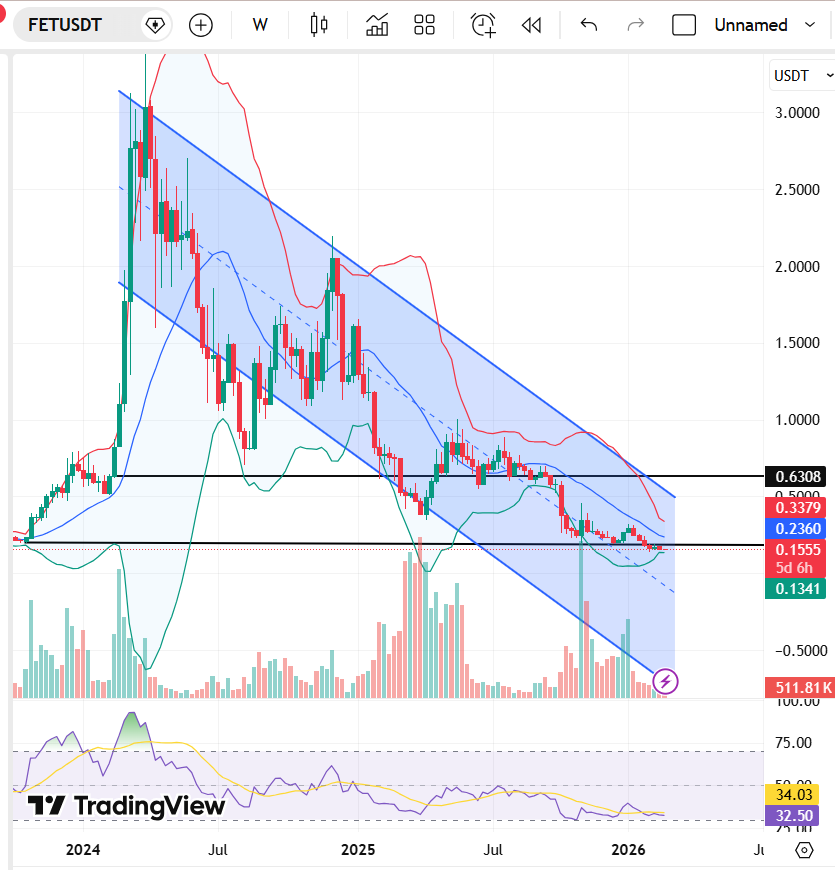
| Month | Potential Low ($) | Potential Average ($) | Potential High ($) |
| FET Price Prediction March 2026 | $0.0371 | $0.0582 | $$0.0913 |
As AI technologies continue to expand and perform more complex tasks, the bull run in FET might witness new peak formations this year.
Unlike many AI tokens that grow only on hype, ASI is focused on building real technology. It is creating a strong base that includes smart AI agents, decentralized AI marketplaces, and shared computing networks.
These tools allow AI systems to work, connect, and provide services without relying on one central company.
With the increased adoption of AI, companies and users will start using these services, and the demand for FET could increase. This real usage can help FET grow stronger and support its long-term value and future growth potential steadily.
| Year | Potential Low ($) | Potential Average ($) | Potential High ($) |
| FET Price Prediction 2026 | $0.0921 | $0.340 | $0.950 |
| Year | Potential Low ($) | Potential Average ($) | Potential High ($) |
| 2026 | $0.0921 | $0.340 | $0.950 |
| 2027 | $0.173 | $0.820 | $2.14 |
| 2028 | $0.468 | $1.938 | $5.53 |
| 2029 | $1.40 | $4.30 | $8.05 |
| 2030 | $2.126 | $6.78 | $12.45 |
Once AI agent usage and decentralized compute services scale steadily, the FET price could test $0.950.
Growing wider adoption of autonomous AI agents in supply chains, logistics, and digital services could push FET near $2.14
By 2028, if decentralized AGI frameworks mature and institutional AI infrastructure adopts ASI tooling, FET may approach $5.53.
In 2029, AGI research networks integrate token-based compute markets, and valuation expansion could drive FET toward $8.
In a strong AI-dominant economy where decentralized compute markets compete with centralized cloud providers, FET could test $12.45
| Year | 2026 | 2027 | 2030 |
| Coincodex | $0.6785 | $0.9095 | $1.26 |
| CoinDCX | $7.5 | $14 | $35 |
| Priceprediction.net | $1.98 | $2.88 | $13.75 |
As per CoinPedia’s FET Price Prediction, the exponential growth observable in the field of artificial technologies will boost the value of AI tokens in the crypto world
If the alliance successfully aligns AI compute markets, decentralized agents, and open-source model hosting under one economic framework, FET could gradually reclaim the $0.950 range in 2026.
| Year | Potential Low ($) | Potential Average ($) | Potential High ($) |
| 2026 | $0.0921 | $0.340 | $0.950 |
Stay ahead with breaking news, expert analysis, and real-time updates on the latest trends in Bitcoin, altcoins, DeFi, NFTs, and more.
Artificial Superintelligence Alliance (FET) is a merged AI-blockchain ecosystem uniting Fetch.ai, SingularityNET, and CUDOS to power decentralized AI services.
FET could trade between $0.09 and $0.95 in 2026, depending on AI adoption, network growth, and overall crypto market momentum.
If decentralized AI scales globally, FET may test $12 by 2030, though long-term growth depends on real-world usage and regulation.
By 2040, FET could trade between $25 and $40 if decentralized AI and AGI adoption expand globally with strong ecosystem growth.
By 2050, FET may exceed $60 in a mature AI economy, assuming sustained adoption, real utility, and stable crypto regulations.
FET offers exposure to decentralized AI infrastructure. Its long-term value relies on adoption, partnerships, and sustainable ecosystem growth.
The post Kava Price Prediction 2025, 2026 – 2030: Will KAVA Price Shoot To $1? appeared first on Coinpedia Fintech News
Kava Network positions itself as a hybrid Layer-1 blockchain combining the developer flexibility of Ethereum with the speed and interoperability of Cosmos.
Its unique co-chain architecture allows Ethereum Virtual Machine (EVM) compatibility alongside Cosmos SDK infrastructure, aiming to deliver high performance with low fees.
Now that the KAVA token is trading near $0.048, investors are questioning whether Kava can see a comeback in the next cycle. Here is CoinPedia’s Kava (KAVA) price prediction for 2026, 2027, and 2030.
Let’s find out.
| Cryptocurrency | Kava |
| Token | KAVA |
| Price | $0.0481
|
| Market Cap | $ 52,047,158.13 |
| 24h Volume | $ 2,585,347.1236 |
| Circulating Supply | 1,082,847,302.00 |
| Total Supply | 1,082,847,302.00 |
| All-Time High | $ 9.1926 on 09 September 2021 |
| All-Time Low | $ 0.0297 on 10 October 2025 |
Historically, Kava was known for lending and stablecoin minting products within DeFi, but competition from larger ecosystems slowed its growth.
Perhaps March 2026 could be a stabilizing period for Kava as the market begins to look at undervalued Layer-1 projects.
KAVA serves as the settlement asset for AI compute costs, adding a new real-world demand layer beyond DeFi. With KAVA staked across the top 100 validator nodes under Proof-of-Stake, network security remains strong
If staking participation increases and ecosystem liquidity improves, KAVA price could pump to $0.0913.
On the 4-hour price chart, KAVA shows clear bearish momentum after breaking below its key support at $0.050.
Earlier, the price was moving inside a range between $0.049 support and $0.058 resistance, but the recent breakdown confirms that sellers are now in control.
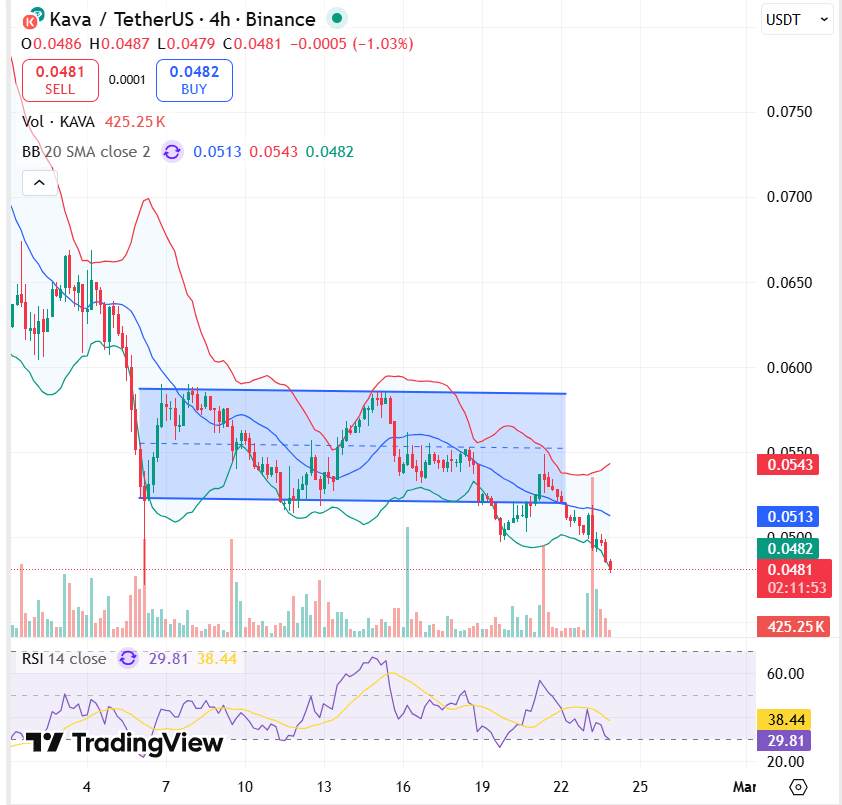
The price is trading below the Bollinger Bands midline (around $0.0513), which shows continued downward pressure. So, if the price continues falling, the next support is near $0.045.
On the upside, immediate resistance is at $0.0513, followed by the stronger resistance zone near $0.058. A move above this zone is needed to confirm trend reversal.
The RSI is near 30, which means the asset is close to the oversold zone.
| Month | Potential Low ($) | Potential Average ($) | Potential High ($) |
| KAVA Price Prediction March 2026 | $0.0371 | $0.0582 | $$0.0913 |
2026 could mark a structural shift for Kava, especially after the Kava 15 upgrade introduced a zero-inflation tokenomic model.
Unlike previous cycles, where new tokens were minted for rewards, the network now funds validator incentives entirely through transaction fees and the community pool. This significantly reduces long-term supply pressure.
Another major catalyst is Kava’s expansion into decentralized AI through its DeCloud infrastructure. The network now provides GPU resources for AI model training and on-chain inference.
If AI compute usage and DeFi TVL rise simultaneously, KAVA could approach the upper 2026 range
| Year | Potential Low ($) | Potential Average ($) | Potential High ($) |
| KAVA Price Prediction 2026 | $0.0054 | $0.1452 | $0.3401 |
| Year | Potential Low ($) | Potential Average ($) | Potential High ($) |
| 2026 | $0.0054 | $0.1452 | $0.3401 |
| 2027 | $0.0474 | $0.3756 | $0.7146 |
| 2028 | $0.138 | $0.752 | $1.55 |
| 2029 | $0.540 | $1.19 | $2.36 |
| 2030 | $0.826 | $2.228 | $5.17 |
If DeFi liquidity returns and Kava’s co-chain model proves efficient, KAVA could approach $0.34
By 2027, the impact of the $750 million Kava Rise incentive program could become more visible. KAVA could benefit from increased utility demand.
As interoperability deepens between Ethereum, Cosmos, and BNB Smart Chain, Kava may strengthen its cross-chain position, pushing KAVA’s price to $1.55.
If DeCloud becomes a recognized decentralized alternative for AI compute and the zero-inflation model continues reducing sell pressure, KAVA could test $2.4.
By 2030, Kava’s valuation will depend on whether it becomes a dual-purpose chain, then the token could target the $5.17.
| Year | 2026 | 2027 | 2030 |
| Digitalcoinprice | $0.0511 | $0.11 | $0.17 |
| Tradersunion | $0.0177 | $0.0312 | $0.0547 |
| Coincodex | $0.05726 | $0.0568 | $0.2660 |
From CoinPedia’s perspective, Kava represents a value-oriented Layer-1 project currently trading near long-term support. Its future depends heavily on whether DeFi adoption rebounds and whether its Ethereum–Cosmos co-chain model gains real traction.
If ecosystem liquidity increases and staking participation remains strong, KAVA could gradually reclaim the $0.34 level in 2026.
| Year | Potential Low ($) | Potential Average ($) | Potential High ($) |
| 2026 | $0.0054 | $0.1452 | $0.3401 |
Stay ahead with breaking news, expert analysis, and real-time updates on the latest trends in Bitcoin, altcoins, DeFi, NFTs, and more.
In simple words, KAVA allows users to borrow, lend, and trade assets, as well as offers a wide range of financial services, including stablecoin issuance and earning interest.
Kava’s future depends on its unique “co-chain” interoperability, zero-inflation model, and expanding decentralized AI infrastructure.
KAVA could trade between $0.0054 and $0.34 in 2026, depending on DeFi growth, AI compute demand, and staking participation.
If adoption expands across DeFi, AI compute, and cross-chain use cases, KAVA could target multi-dollar levels by 2030.
KAVA’s long-term outlook depends on ecosystem growth, zero-inflation tokenomics, and real adoption. Investors should assess risk carefully.

The post Bitcoin Down 50% From $126K Peter Schiff Warns of $40K Crash appeared first on Coinpedia Fintech News
The debate around Bitcoin’s long-term outlook is intensifying once again. While some investors view the recent pullback as a standard cycle correction, longtime critic Peter Schiff believes something far more structural is unfolding.
Bitcoin is currently trading roughly 50% below its October 2025 high of $126,000. After failing to regain sustained upside momentum, the asset has entered a period of consolidation under key resistance levels. Volatility tied to macroeconomic uncertainty and geopolitical stress has further pressured risk assets across the board.
But Schiff’s warning goes beyond charts and technical levels.
Schiff describes Bitcoin as sentiment-driven and bubble-like, arguing that the multi-year rally was fueled by speculation rather than sustainable fundamentals. In his view, the recent downturn signals that “the air is coming out” of an overextended market.
He has suggested that Bitcoin could fall toward $50,000, or even $40,000, if downside momentum accelerates. Schiff also made headlines by claiming that a single Truth Social post from Donald Trump could significantly impact Bitcoin’s price, underscoring what he sees as the asset’s fragility and dependence on political sentiment.
Schiff has additionally criticized Trump’s pro-crypto stance, calling efforts to position the United States as a global crypto hub misguided and a misallocation of capital.
While Bitcoin struggles, Schiff points to gold’s strong performance as evidence of a broader monetary shift. He argues that rising gold prices reflect de-dollarization trends and renewed central bank accumulation of hard assets.
Institutional flows appear to support a divergence. Hedge fund exposure to Bitcoin ETFs has declined in recent quarters, while gold-backed funds now manage significantly larger total assets. During periods of market stress, capital has increasingly rotated into traditional safe havens.
Bitcoin supporters maintain that volatility is a normal part of long-term adoption cycles. They argue that network fundamentals and institutional infrastructure remain intact despite the correction.
For now, Bitcoin stands between two sharply contrasting views. One sees a fragile bubble vulnerable to sentiment shocks, even political ones. The other sees a maturing asset navigating another cyclical downturn.
Stay ahead with breaking news, expert analysis, and real-time updates on the latest trends in Bitcoin, altcoins, DeFi, NFTs, and more.
Some critics call it a bubble due to speculation and volatility. Long-term investors argue it’s a cyclical correction, not a structural collapse.
Some capital has rotated into gold during market stress. Bitcoin ETF flows have cooled, but long-term institutional interest remains.
Yes. Bitcoin often reacts to political headlines and regulation shifts, but long-term price trends are driven more by adoption and liquidity.
The post Chainlink Price Targets $53: Could LINK Be the Next Blue Chip to Rally? appeared first on Coinpedia Fintech News
Chainlink price is up nearly 4% today, rebounding alongside a stabilizing broader crypto market, but this move may carry more weight than it appears. While most traders are focused on short-term volatility, LINK is quietly defending a critical monthly demand zone between $4.00 and $4.70. This region, identified as institutional accumulation territory on higher timeframes, has now become the structural line between breakdown and breakout.
At the same time, multi-year compression appears complete, liquidity below structure has likely been swept, and a massive buy-side pool remains untouched near $30–$31. So the real question is no longer whether LINK bounced 4% today. The question is whether Chainlink price is positioning for a macro expansion cycle, one that could eventually target $53 if the structure confirms.
Let’s break down what the chart is really signaling.
The LINK/USDT price chart clearly defines this zone as the key monthly order block.
LINK price chart analysis suggests that liquidity below structure has already been engineered. The deviation near $4.70 likely acted as a retail trap, clearing weak hands before stabilization.
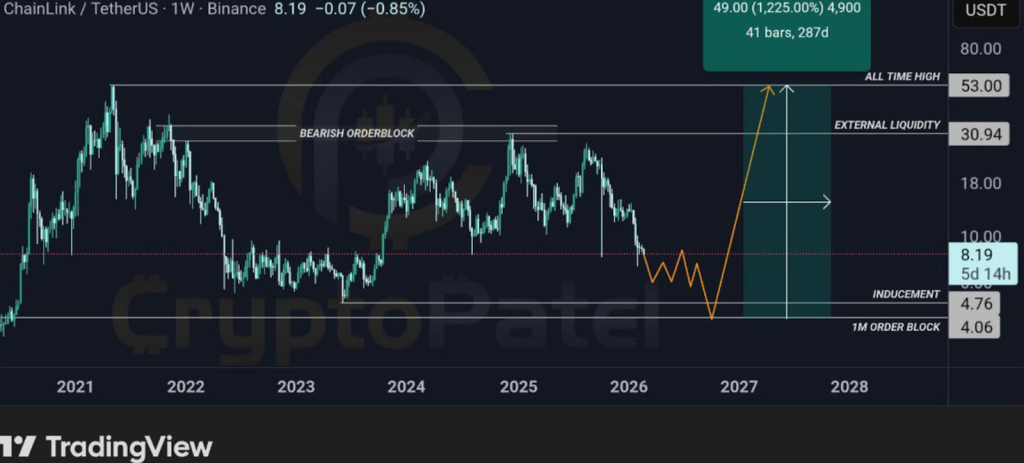
This aligns with classic Wyckoff accumulation principles and Smart Money liquidity engineering, where price sweeps below support before absorbing supply. For the bullish chainlink price prediction to remain valid, $4.00 must hold on monthly closes. A sustained monthly close below $2.00 would fully invalidate the macro bullish thesis.
Chainlink price has spent years compressing after its previous bull cycle peak. Multi-year range compression is rarely random. It often represents long-term supply absorption before expansion.
The structure now shows:
When compression resolves upward, the expansion is typically proportional to the length of consolidation. This is where the $53 target begins to make structural sense.
Above current price sits a massive resting buy-side liquidity pool at $30–$31 equal highs. Markets are liquidity-driven. If chainlink price confirms higher highs and escapes the compression structure, the pathway unfolds in stages:
The $53 target represents roughly a 1,200% expansion from the current demand zone, based on measured range breakout models.
The narrative in your image states: LINK may be the most undervalued blue chip currently.
Why?
Because:
Few large-cap assets sit at this combination of structural compression ,clear invalidation, and visible liquidity targets. That’s what creates asymmetry.
Yes. Holding this monthly demand zone signals strong buyer interest. As long as $4.00 holds on monthly closes, the macro bullish setup remains intact.
With defined risk near $4.00 and large upside potential, LINK offers favorable risk-reward if macro support holds.
A sustained breakout above $13 signals structural recovery. Reclaiming $30–$31 would confirm macro strength.


Strategy has become the most-shorted large-cap US stock as hedge funds ramp up bearish bets, according to data from Goldman Sachs.

The $61 million USDT seizure in North Carolina shows how US authorities can trace and freeze stablecoin flows tied to pig butchering scams, as AI‑driven impersonation schemes surge.

US spot Bitcoin ETF flows turned green on Tuesday, with Fidelity and BlackRock leading gains despite persistent weak market sentiment.

Hong Kong will build a digital asset platform for tokenized bond issuance and settlement, while moving ahead with stablecoin licensing and CARF.

River reports that Bitcoin adoption surged in 2025, cementing it as a mature asset class, even as its price has halved since hitting a peak in October.

South Korean prosecutors reportedly accused a man of poisoning a business partner with pesticide in a dispute over losses due to crypto trading.

The post Delhi High Court Refuses to Regulate Crypto Exchanges in India appeared first on Coinpedia Fintech News
India’s Delhi High Court has refused to regulate cryptocurrency exchanges in India, making it clear that creating crypto laws is the government’s responsibility. The decision came after a crypto investor filed a case against Indian exchange Bitbns, asking the court to introduce regulations and order an investigation into withdrawal issues.
This ruling shows that India still does not have clear crypto laws, leaving investors to depend on existing legal systems.
The case was filed by investor Rana Handa, who accused Bitbns of restricting withdrawals and manipulating asset values. Handa claimed he invested ₹14.22 lakh ($15,637) in 2021 and faced withdrawal limits, and later the platform showed the incorrect value of his Bitcoin holdings in 2025.
After filing a cybercrime complaint and receiving no response, he approached the Delhi High Court seeking regulatory action and a Central Bureau of Investigation (CBI) probe.
He accused Bitbns of financial mismanagement and asked the court to order a probe and introduce stricter crypto rules.
— Coinpedia (@CoinpediaNews) February 25, 2026
The case followed user complaints over blocked withdrawals.#CoinPedia #CryptoNews #Blockchain #CryptoCommunity
However, Justice Purushaindrakumar Kaurav dismissed the petition, stating that cryptocurrency exchanges are private entities and do not qualify as “State” under constitutional law.
Because of this, the court cannot create new regulations or order investigations without proper legal authority. Thus, the court advised the investor to use normal legal channels, such as police complaints or civil courts.
The Delhi High Court clarified that courts interpret and enforce laws but do not create new regulations. Crypto regulation falls under the authority of Parliament and government regulators, not the judiciary.
This means courts cannot regulate crypto exchanges unless the government first creates clear crypto laws.
The ruling shows the current legal gap in India’s crypto sector.
The decision highlights the risks faced by crypto investors in India’s largely unregulated market. Without dedicated crypto laws, investors cannot rely on courts to enforce special protections specific to digital assets.
Instead, users must depend on general financial, civil, and criminal laws when disputes arise with crypto platforms.
India remains one of the largest crypto markets globally, with 123.35 million active users investing in digital assets. Despite such a strong user base, the country still lacks clear regulatory guidelines governing crypto exchanges.
While the government has introduced crypto taxation, including a 30% tax on gains and 1% TDS, a comprehensive regulatory framework has not yet been implemented.
This regulatory gap creates uncertainty for both users and crypto companies operating in India.
Stay ahead with breaking news, expert analysis, and real-time updates on the latest trends in Bitcoin, altcoins, DeFi, NFTs, and more.
No. India taxes crypto at 30% with 1% TDS but has no comprehensive law governing exchanges, investor protection, or licensing.
Crypto regulation falls under the central government and Parliament. Agencies like RBI and SEBI may play roles once formal laws are enacted.
Investors must rely on existing civil, criminal, and financial laws. There are no crypto-specific consumer protection regulations yet.
It reinforces that only the government can introduce crypto laws, highlighting the urgent need for a clear regulatory framework for investors.
The post XRP Price Coils Around the Channel Support—Is a Breakout Beyond $1.5 Possible? appeared first on Coinpedia Fintech News
The XRP price is compressing around an important support range, which it defended during the recent sell-off. The token is stuck within a multi-month descending support, a level that has repeatedly acted as a strong and structural base. The XRP price is trading at $1.36 with over a 2.83% jump in the past 24 hours. The rise, followed by a broader market rebound, was led by Bitcoin’s 2.97% gain.
The sentiment also received a mild boost after SBI Ripple Asia announced a joint research initiative with DSRV Labs to explore XRP Ledger use for Japan-Korea cross-border payments. While the development may underpin long-term utility narratives, short-term price action remains technically driven.
With the technicals compressing and the XRP price displaying relative strength, will the crypto manage to rise above the upper threshold?
Ever since the XRP price topped above $3 in 2025, the trend has remained stuck within a descending channel. The rally has been forming constant lower highs and lows, with the bearish forces dominating since the rejection. Although the price has initiated a rebound from the support of the channel, it remains confined to the range.
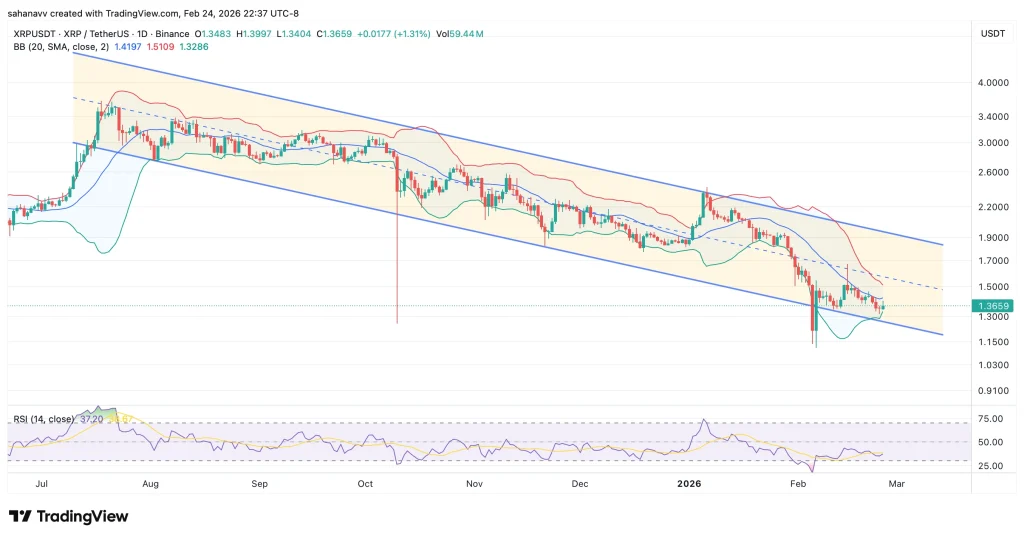
The Bollinger bands have begun to compress after the price tapped the lower band recently. Historically, such compression phases near structural support often precede expansion. Meanwhile, the direction of that expansion depends on whether buyers defend $1.30 or allow the price to slip towards the breakdown range.
On the other hand, the daily RSI sits near 37, briefly approaching the oversold levels. The momentum is soaring upwards, but a clear rise above 50 is required. The selling momentum has cooled, but bullish momentum has not taken over yet. Therefore, until the price clears the upper boundary of the channel near $1.90, the broader trend remains bearish.
Currently, the XRP price is sitting above the immediate structural support at $0.13, while a drop below $1.15 may confirm the breakdown. Further, a drop below $1 may strengthen the bears, but in case the price reaches $1.5, it may trigger a minor breakout. However, the price is required to secure the channel’s middle line at $1.65, which may push it further to the upper line of the descending channel at $1.9.
A breakout with a strong buying volume and positive market sentiment may push the XRP price beyond $2, probably to $2.2 or even $2.6. For now, a monthly close above $1.5 is extremely important to keep up the bullish momentum; otherwise, the price may maintain a descending consolidation within the channel.

The post Bitcoin ETFs See $258M Inflows, Fidelity Tops the List appeared first on Coinpedia Fintech News
On February 24, Bitcoin spot ETFs recorded strong inflows totaling $258 million. Fidelity’s FBTC led the day with $82.81 million in net inflows, ranking first among Bitcoin ETF products. Meanwhile, Ethereum spot ETFs posted a more modest $9.23 million in total inflows. Grayscale’s ETH fund stood out in the Ethereum category, attracting $11.08 million. The data reflects steady investor interest in crypto ETFs, with Bitcoin products continuing to dominate overall flows.


Bitcoin rallied above $66,000 following a positive close from US stock markets, putting Monday’s AI and tech-stock driven sell-off to rest. Will $60,000 remain the BTC bottom?

Coinbase, World Liberty Financial and Laser Digital are also in line for a banking charter in the US, after Crypto.com received conditional approval for a charter on Monday.

Bitcoin Depot is moving to require ID for all transactions as regulators have cracked down on crypto ATM operators over scams and money laundering concerns.

Bloomberg reports that Stripe is in early acquisition talks with PayPal as the payments giant has battled competition, leadership turmoil and an 85% stock drop from its peak.

The Blockchain Association urged Congress to exempt low-dollar crypto transactions and tax mining and staking rewards upon sale.

Anthropic alleges Chinese AI companies DeepSeek, Moonshot and MiniMax made 24,000 accounts and 16 million Claude exchanges to scrape its AI bot for training.
Bitwise’s acquisition of Chorus One expands the company’s staking capabilities to more than 30 blockchains, including Solana, Hyperliquid, Monad, Avalanche and Sui.

Ether faces a bearish trend as onchain fees and network deposits hit multiyear lows. Until derivatives metrics stabilize, ETH price remains at risk.

The EU authority tracking compliance under the MiCA framework issued a warning to those marketing crypto derivatives as “perpetual futures or perpetual contracts.”

The exchange now allows US customers to trade thousands of stocks and ETFs commission-free alongside crypto, with 24/5 access and instant funding.

Kraken’s new contracts, built on the xStocks framework, offer up to 20x leverage on tokenized benchmarks tied to US equities and gold.

MoonPay debuts infrastructure enabling AI agents to transact with stablecoins onchain as both crypto and non-crypto companies race to build the “agent economy.”

Bitcoin remains pinned below $65,000 as random bouts of intense selling pressure persist, but one onchain indicator has stabilized, providing insight into when spot market demand may return.

Users placed more than $7 million betting on the outcome of the crypto sleuth's investigation, expected to be announced on Thursday.

Ether whale order sizes are shrinking, while a $2 billion short cluster near $2,000 frame a tightening liquidity scenario for ETH after a sixth week of red price action.

A 9.8% shareholder has doubled down on calls for Empery Digital to sell its BTC holdings, return capital to investors and remove its CEO and board.

The approval allows WisdomTree’s tokenized Treasury money market fund to trade and settle around the clock within the US regulatory framework.


Two major news outlets published similar reports on Monday claiming that Binance had fired or suspended employees involved in an investigation into crypto going to Iranian entities.

Tokenized securities, 24/7 trading and onchain settlement could allow the NYSE’s blockchain plans to reshape post-trade processes in financial markets.

The deal channels crypto liquidity into US home loans, testing whether blockchain-based capital can fund traditional mortgage markets at scale.

Ether’s drop to $1,800 reflects weak technicals and onchain signals that point to continued downside risk as Ethereum ETF outflows persist.

BTC price targets stayed bearish with a zone of interest below $50,000 as macro assets saw increasing downside pressure at the Wall Street open.

The blockchain analytics company will incorporate locally and hire in the kingdom's Special Administrative Region as the region advances its digital asset strategy.

The Tether-backed crypto payments app is expanding beyond retail spending with wallet-based off-ramps into domestic banking rails.

Bitcoin price dropped 25% in 2022 and 50% in 2018 after similar on-chain loss signals, a warning sign for BTC’s next move.

The UK-listed Bitcoin treasury company says the facility will bridge equity settlements, enabling faster Bitcoin purchases during volatile markets.

Binance listed 10 of Ondo's tokenized stocks, ETFs and commodities on Binance Alpha with UAE regulatory approval, expanding crypto access to real-world assets.

Ethereum Foundation’s move to stake its own ETH, using minority clients and distributed infrastructure, throws fresh focus on how Ethereum’s staking landscape is evolving.

Derivatives don’t mint new Bitcoin, analysts say, pushing back on viral claims that state paper BTC has broken the 21-million cap.

A solo Bitcoin miner hit a rare jackpot of more than $200,000 after validating a block through $75 worth of rented hashrate.

Arkham data shows the Ethereum co-founder’s attributed wallets fell from about 241,000 ETH to 224,000 ETH this month.


Tariff shocks led to a capital rotation from crypto into precious metals and tokenized commodities, as analysts warn that the thin crypto market liquidity is limiting a wider recovery.

Russian authorities claim the Telegram messenger refused to remove 155,000 channels flagged for illegal content, according to multiple media reports.

Hashgraph Group has launched a blockchain-based supply-chain traceability solution ahead of the EU’s Digital Product Passport requirements, some of which take effect beginning in 2027.

Panic selling by short-term holders, combined with the RSI near record lows, suggests that BTC could be transitioning into a full capitulation regime.

Bitcoin ETF investors have recorded sustained outflows this year, but EMJ Capital’s Eric Jackson argues a longer-term institutional buyer base could emerge.

Bloomberg Intelligence said Coinbase’s USDC revenue may jump sevenfold, as Congress weighs a ban on stablecoin rewards that could reshape how that money is earned.


RedotPay secured $194 million in 2025 across three funding rounds, reaching a valuation above $1 billion and drawing backing from crypto- and venture-focused investors.
Canaan has acquired a stake in three operating Texas mining facilities with 120 MW of power and 4.4 EH/s of hashrate, expanding its footprint in infrastructure operations.

Framework reportedly struck a $45 million deal to acquire 10% of Better and will help it launch a token on the crypto protocol Sky.

Anthropic’s Claude Code Security sent shockwaves through cybersecurity markets, with CrowdStrike and Palo Alto Networks among the hardest hit.

The system provides real-time risk alerts for suspicious crypto transactions across multiple blockchains within the same workflow as fiat-payment monitoring.


Administrator Todd Snyder accused Jane Street of improperly communicating with Terraform insiders and trading on alleged non-public information, according to the lawsuit.

Computing and AI company IBM saw its largest single-day drop in 25 years on Monday, tumbling 13.1% to $223.35.
Binance stablecoin reserves have fallen 18.6% in three months as tightening Fed policy and weak inflows extended the crypto liquidity drought.

The US Federal Reserve is seeking feedback over the next 60 days on a proposal that could address concerns about crypto-related debanking.


Need to know what happened in crypto today? Here is the latest news on daily trends and events impacting Bitcoin price, blockchain, DeFi, NFTs, Web3 and crypto regulation.
