The post Best Cross-Chain Bridges to Watch in 2026 appeared first on Coinpedia Fintech News
Blockchain interoperability has moved from a niche engineering concern to a billion-dollar infrastructure priority. Here is what the landscape looks like today, and which platforms are earning trader trust.
For most of crypto’s first decade, the conversation about blockchain infrastructure revolved around a single question: which chain would win. Ethereum versus Solana. Solana versus Avalanche. Avalanche versus everything else. That framing has largely collapsed. The industry has settled, reluctantly at first and then decisively, on a different answer: all of them, simultaneously, connected.
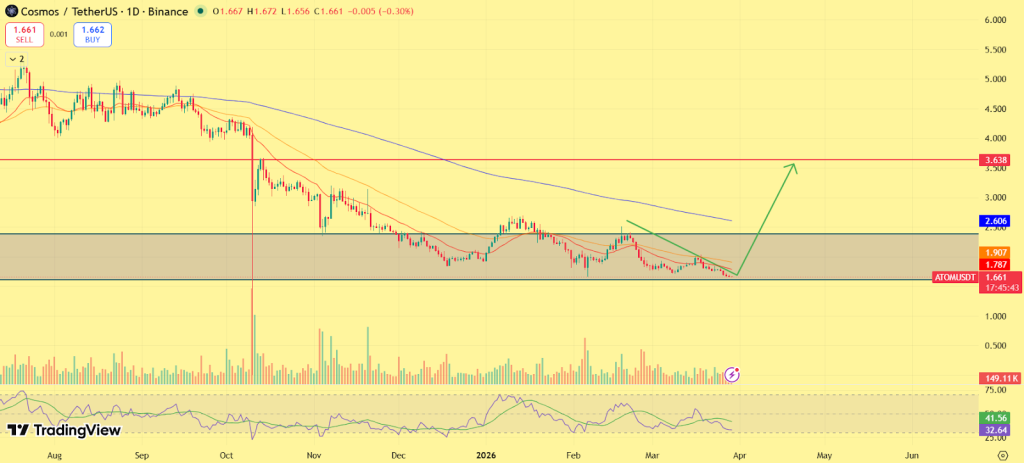
That shift has transformed cross-chain bridges from a technical curiosity into load-bearing infrastructure. According to DeFiLlama, Bridges TVL hit $21.94B as of March 2026, consistently exceeding $20B through market cycles. Bridges, it turns out, are one of the few crypto infrastructure categories that grow with market fragmentation rather than despite it.
But choosing the right bridge is not trivial. The sector carries a history of catastrophic failures. The Ronin Bridge exploit alone cost users over $600 million in 2022, and the recovery has been uneven. Some protocols have since been rebuilt with stronger architectures. Others have not. And an entirely different class of solution, exemplified by platforms like ChangeNOW, has sidestepped the most dangerous design patterns entirely.
What follows is a working guide for practitioners: the frameworks for evaluating bridge quality, an honest accounting of the risks, and a considered list of the cross-chain platforms worth watching as 2026 develops.
First, Understand What Bridging Actually Involves
The phrase “bridging crypto” gets used loosely, but the mechanics matter for anyone moving meaningful capital. At its core, a blockchain bridge solves a specific problem: native assets on one chain cannot, by design, exist or be verified on another chain. Ethereum has no visibility into the Solana ledger. BNB Chain cannot read an Avalanche block header. Bridging is the set of mechanisms that creates a credible representation of value across this divide.
The dominant architecture for most of bridge history has been “lock-and-mint”: a user deposits an asset into a smart contract on Chain A, and an equivalent “wrapped” token is issued on Chain B.
The wrapped token’s value is backed by the locked original. When the user wants out, they burn the wrapped token and unlock the original.
In theory, it is elegant. In practice, it creates a single, obvious problem: the locking contract becomes a high-value target. A single vulnerability can expose all funds held within it.
The Risk Question That Nobody Asks Carefully Enough
Is bridging crypto safe? The accurate answer is: it depends almost entirely on which bridge, and how you use it. That is not a hedge, it is the substantive answer.
The attack surface for bridges is distinctive. Unlike a DEX or lending protocol, where exploits typically drain one pool or one reserve, a compromised bridge contract can drain everything locked in it simultaneously.
The security environment has changed measurably. Audit standards have risen sharply, reputable bridges now carry multiple independent audits, often including formal verification. Bug bounty programs in the $1-10 million range have become standard for top-tier protocols. And the market has increasingly penalized protocols that cut corners: users have migrated capital toward bridges with stronger security track records.
That said, practical risks remain, and users should internalize them:
- Smart contract risk is never zero. Even audited code can contain exploitable edge cases, particularly in complex multi-chain messaging logic.
- Validator and multi-sig risk persists in bridges that rely on permissioned operator sets. The question is not whether these are trustworthy today, but whether they will remain so under adversarial conditions.
- Wrapped token risk is underappreciated. Users who bridge using lock-and-mint models hold tokens whose value is contingent on the security of a contract on another chain they may never interact with directly.
- Phishing risk is high and growing. Fraudulent bridge interfaces — visually identical to legitimate platforms are among the most common vectors for crypto losses that never appear in security research.
For most users, the most defensible posture is to prioritize non-custodial, swap-based bridges for routine cross-chain transfers and reserve lock-and-mint bridges for specific DeFi use cases where wrapped tokens are necessary. Users should also apply consistent hygiene by verifying URLs, starting with small test transactions, and avoiding keeping assets in bridge contracts between sessions.
Are Bridges Always Necessary?
This is the question most users skip.
For a growing segment of the market, the answer is increasingly no.
While bridges remain essential for certain DeFi-native use cases, particularly those involving wrapped assets or protocol-specific liquidity, alternative approaches to cross-chain execution have matured.
Instead of moving the same asset across chains, some platforms move value itself, using swaps rather than synthetic representations.
Platforms like ChangeNOW operate in this category. Rather than locking funds and issuing wrapped tokens, they facilitate cross-chain swaps, sourcing liquidity across networks. This removes the need for large locked pools, reducing exposure to one of the most critical bridge risks.
The trade-off is structural:
- Users receive a different asset on the destination chain
- Not a direct representation of the original
For payments, transfers, and portfolio rebalancing, this distinction is often irrelevant.
For DeFi strategies requiring specific wrapped assets, it still matters.
In practice, users are increasingly opting for either bridging or swapping based on risk tolerance, speed, and cost, rather than ideological considerations.
What Separates Good Bridges from the Rest
Across the best cross-chain bridges operating in 2026, several characteristics consistently separate the platforms worth trusting from those that require more caution.
Security architecture is the obvious starting point, but the relevant question is more specific than “has it been audited.” It is: what happens if a single component fails? The best blockchain bridges are designed with the assumption that individual nodes, validators, or contracts will be compromised, and they route around that failure gracefully.
Weak ones concentrate risk in:
- A single contract
- A small validator set
- A centralized multisig
Chain and asset coverage determine practical utility. A bridge that connects two chains handles a narrow use case. The most valuable crypto network bridges in 2026 span the major EVM chains, the principal Layer 2 rollups (Arbitrum, Optimism, Base, zkSync), non-EVM ecosystems like Solana and the Cosmos IBC universe, and the emerging Layer 1s gaining traction in the Sui and Aptos ecosystems. Asset coverage matters as much as chain coverage, a bridge that moves ETH but not ERC-20 tokens serves a fraction of user needs.
Fee transparency is a less glamorous but operationally important differentiator. Some bridges advertise low protocol fees while embedding margin in exchange rates. Total cost of transfer (including implicit spread) is the honest metric. Platforms that display both clearly earn a material advantage with sophisticated users.
Finally, non-custodial design and user experience increasingly travel together. The best bridges minimize or eliminate the window during which a third party holds user funds, and they deliver that security without requiring users to navigate complex wallet configurations or understand wrapped token mechanics.
Best Cross-Chain Bridges in 2026
Instead of a flat list, it is more useful to think in categories.
Infrastructure Layer (Messaging & Omnichain)
These protocols aim to abstract chains entirely:
- LayerZero
- Wormhole
- Axelar
They focus on passing data, not just tokens.
Liquidity-Based Bridges
Fast and widely used, but dependent on liquidity pools:
- Across Protocol
- Stargate Finance
- Synapse Protocol
Stablecoin Infrastructure
Focused on native asset transfer without wrapping:
Final Thought
Cross-chain bridges are no longer optional tooling. They are foundational infrastructure for a multi-chain financial system.
But they are not the only path.
For some users, avoiding bridge exposure entirely through swap-based execution is becoming a rational strategy, not a compromise. For others, especially within DeFi, bridges remain indispensable.
The market is no longer deciding between chains.
It is deciding how value moves between them.
And that question is still very much open.


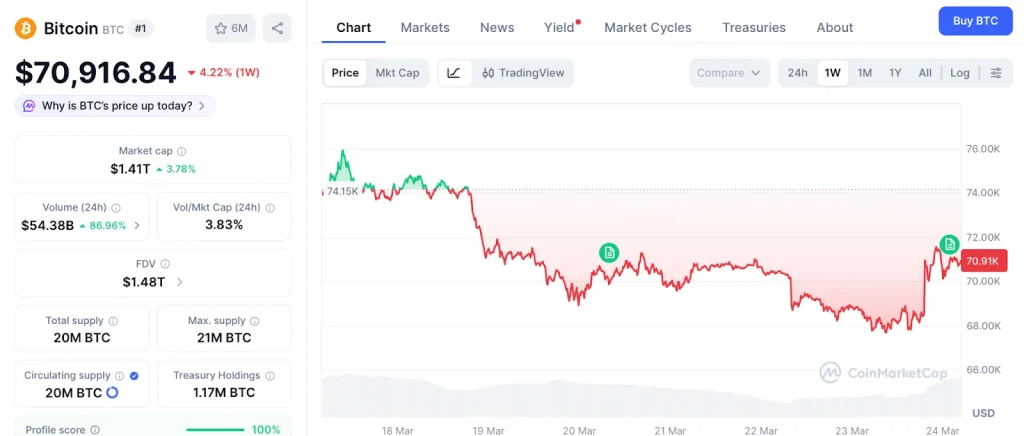
![Bitcoin Price Today [LIVE] Updates, Why is Crypto Going Up 16th March](https://image.coinpedia.org/wp-content/uploads/2026/03/16140330/Bitcoin-Price-Today-LIVE-Updates-Why-is-Crypto-Going-Up-16th-March-1024x536.webp)


 BNB (@cz_binance)


 (@justinsuntron)


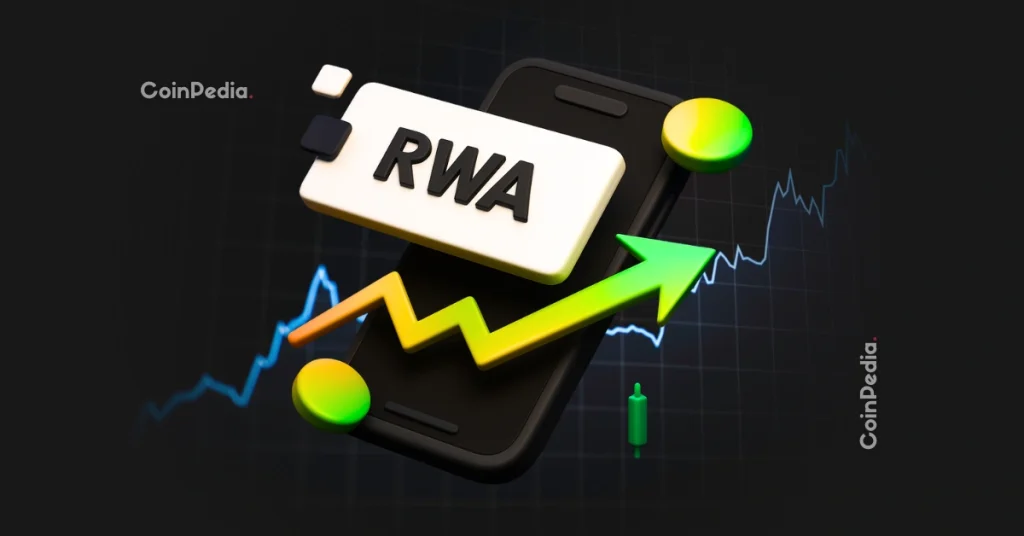
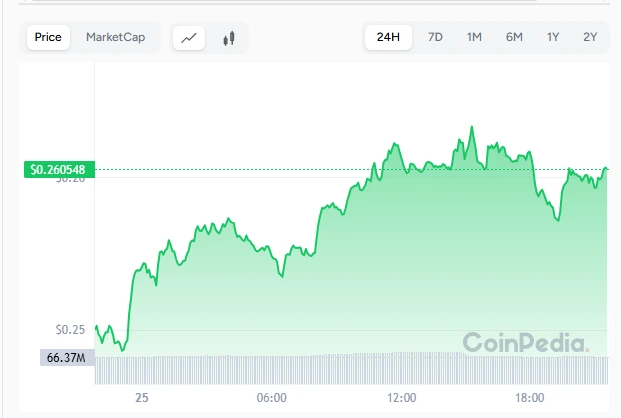
 BIG DATA: SOLANA DOMINATES IN RWA AND TOKENIZATION


 (@coinbase)


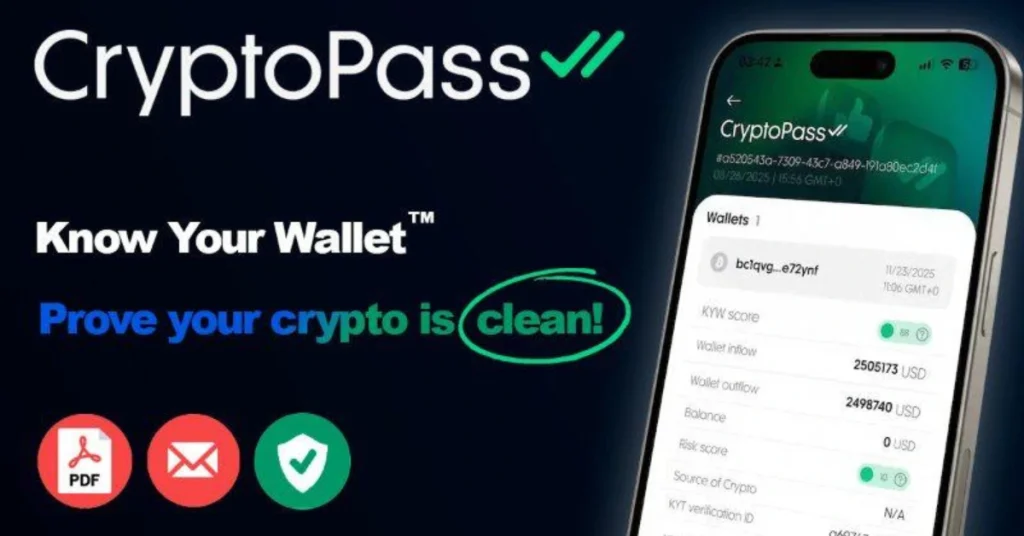
 Technology that performs a fast unhosted wallet AML check, proves crypto ownership on-chain, and instantly generates a professional self-hosted wallet compliance certificate that banks, exchanges, and tax authorities can use for Source of Funds verification.


 (@nansen_ai)