November Preview: Will Bitcoin Break The Cycle Or Repeat It?
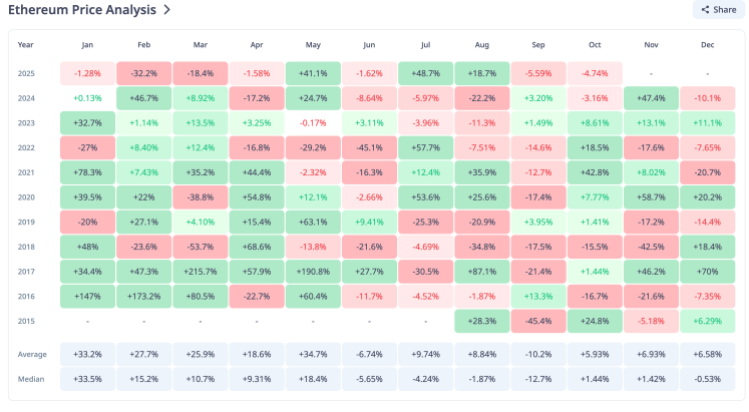
A widely shared seasonality snapshot is making the rounds ahead of month-end: a Coinglass heat map of Bitcoin’s monthly returns, reposted by trader Daan Crypto Trades. The table spans 2013–2025 and shows November as the statistical outlier in Bitcoin’s calendar—both for eye-popping gains and for sharp drawdowns in certain years.
Bitcoin November Preview
“November is Bitcoin’s best month based on historical performance. By far,” Daan wrote on X, pointing to an average November change of +46.02% across the dataset. That figure is visibly distorted by November 2013’s +449.35% surge, the single largest monthly move on the board. He added: “The average gain over all these months is +46.02%. But this is heavily skewed by a single monthly gain in November 2013. Bitcoin went up +449.35%!! that month.”
The raw counts back up the reputation without the hyperbole. Out of the 12 Novembers listed (2013–2024), 8 finished green—2013 (+449.35%), 2014 (+12.82%), 2015 (+19.27%), 2016 (+5.42%), 2017 (+53.48%), 2020 (+42.95%), 2023 (+8.81%), and 2024 (+37.29%)—while 4 were negative—2018 (-36.57%), 2019 (-17.27%), 2021 (-7.11%), and 2022 (-16.23%).
The median November change sits at +10.82%, a more conservative central tendency that dampens the 2013 effect. Excluding 2013 entirely, the simple average for November drops to roughly +9.35% across the remaining 11 years, underscoring how one month can skew mean-based seasonality.
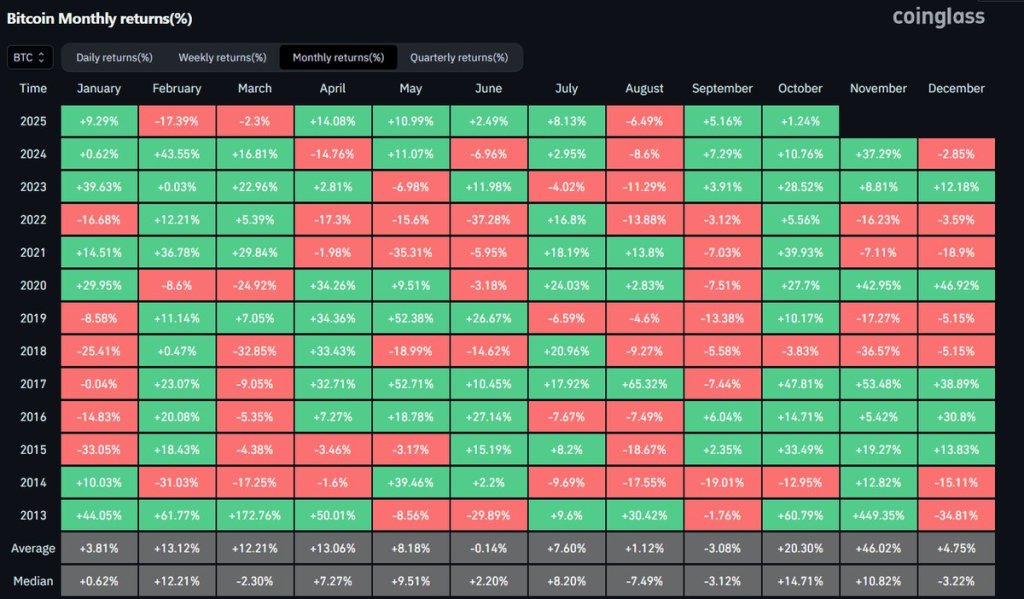
Context from the broader table matters. November’s average is the highest of any month on Coinglass’s grid, ahead of October’s +20.30% average, while December shows a far more mixed profile with a +4.75% average but a -3.22% median—an imbalance consistent with outlier-driven months.
September, long maligned by traders, retains a negative average (-3.08%) over the full period. The 2024 row itself captures the push-and-pull of this cycle’s narrative: double-digit gains in February, March, May, October, and November, offset by meaningful drawdowns in April, June, and August, and a negative December print to close the year (-2.85%).
Lessons From Prior Cycles
Daan’s framing extends beyond simple seasonality. “November & December is when the 2013, 2017 & 2021 cycles topped out. It’s also where the 2018 & 2022 cycles bottomed out,” he noted. That observation lines up with the historical inflection points most market participants remember: the late-2013 mania and subsequent crash, the December 2017 peak, the November 2021 all-time high, and the December 2018 and November 2022 washouts.
The Coinglass grid cannot timestamp intramonth highs or lows, but the clustering of major pivots into the final two months of the year is consistent with the market’s folklore and with the returns pattern that shows both exceptionally strong up months and some of the cycle’s most punishing down months in this window.
The practical takeaway—again in Daan’s words—is not categorical bullishness, but regime risk: “All in all, an eventful last 2 months of the year generally speaking. Whether it’s on the bullish or bearish side, volatility and big market pivots have been the theme into the end of the year.” The heat map supports that characterization.
November’s distribution spans the widest extremes on record—from +449.35% at the top to -36.57% on the downside—with a two-thirds hit rate for green months and a median gain in the low double digits. December, by contrast, has produced both cycle tops and cycle bottoms despite a modest average, a reminder that average and median statistics can obscure the path risk that defines Bitcoin’s fourth quarter.
Seasonality is not destiny, and the sample is limited. Still, the data-backed message is clear: as November approaches, Bitcoin’s historical pattern has been less about quiet trend continuation and more about variance—the kind that has marked both euphoric blow-offs and capitulation lows.
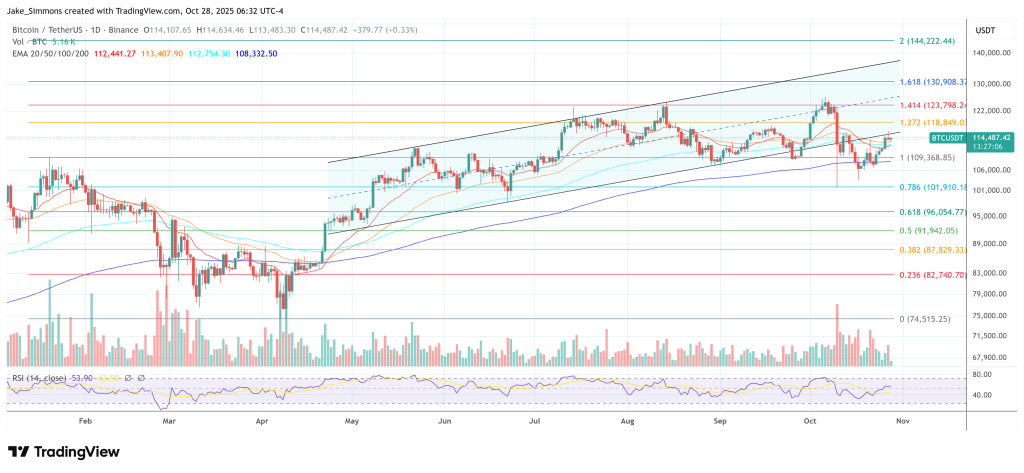
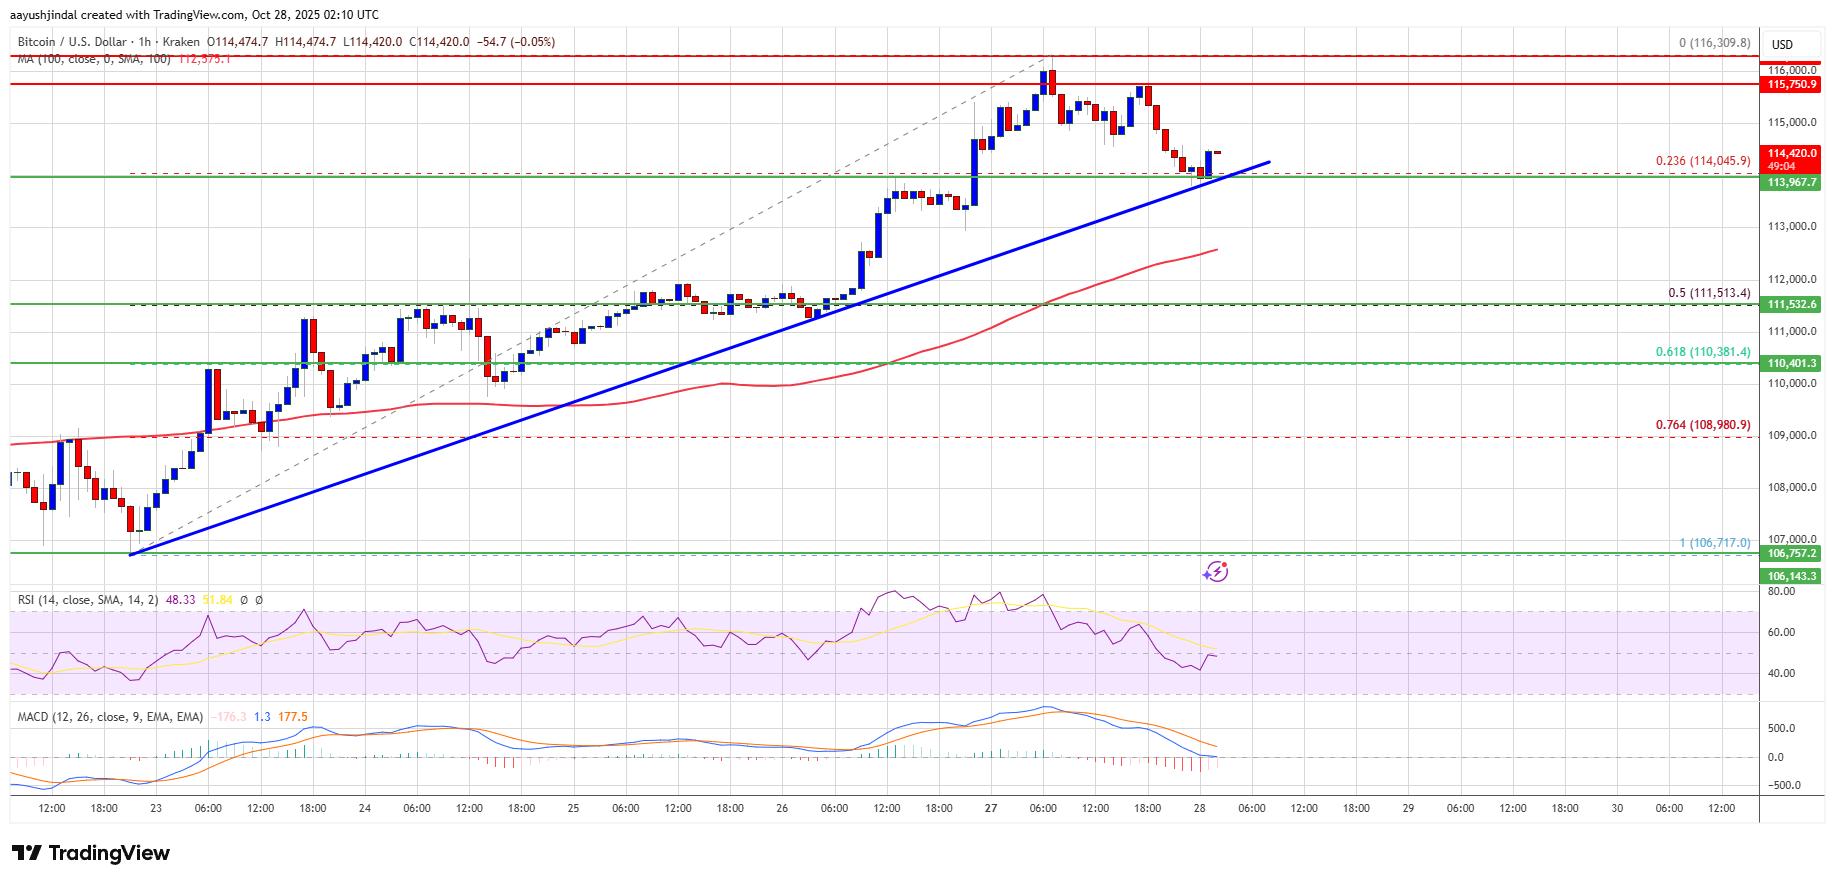
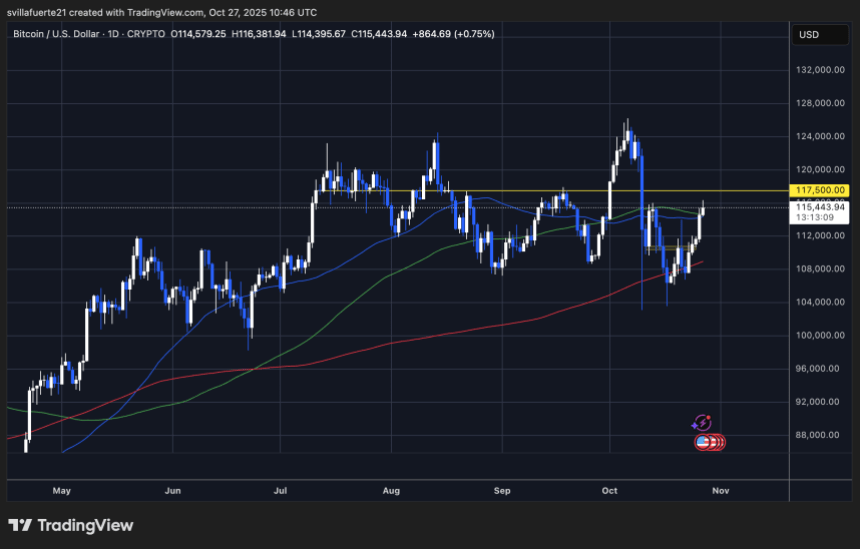
At press time, BTC traded at $114,487.


 Discover more about this exciting Layer-2 project in our detailed


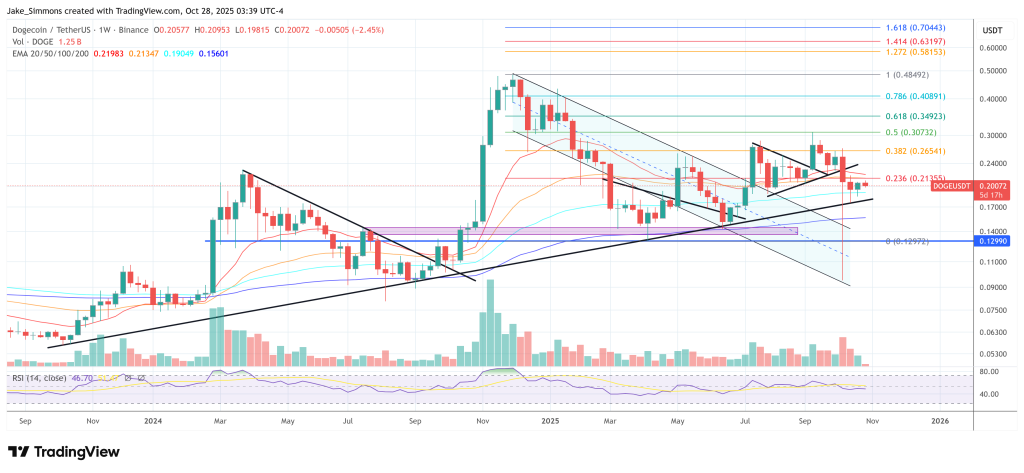


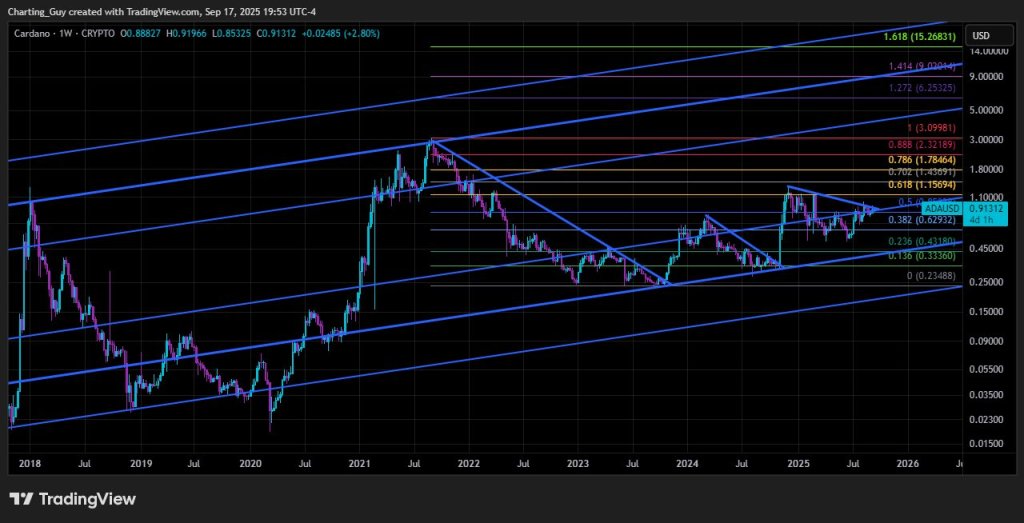
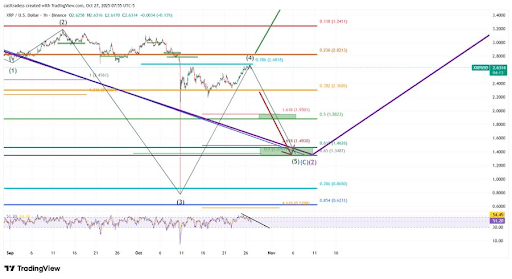
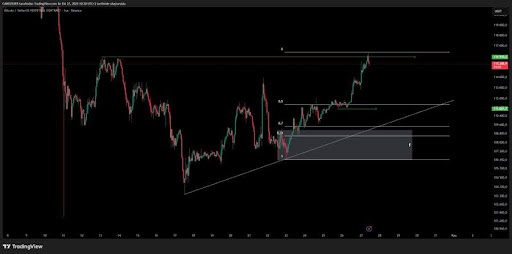
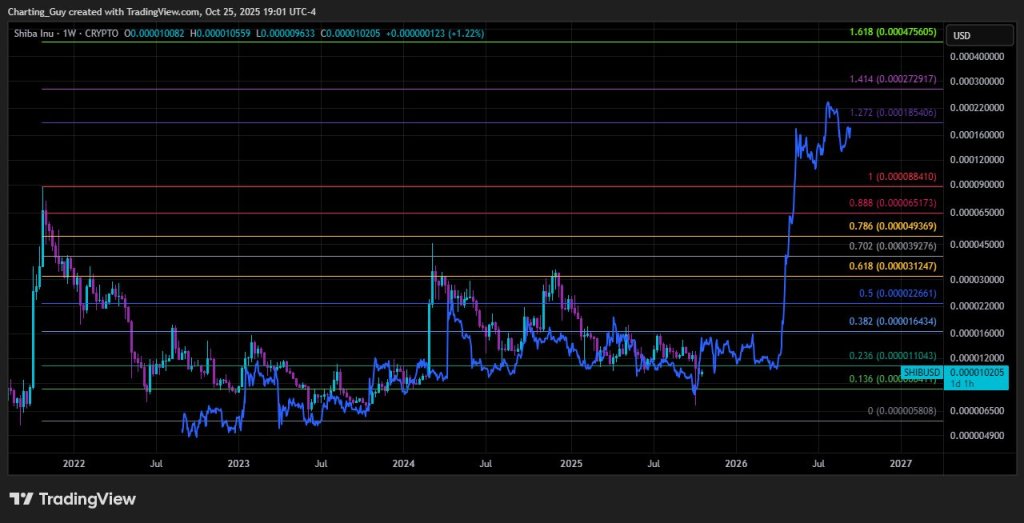
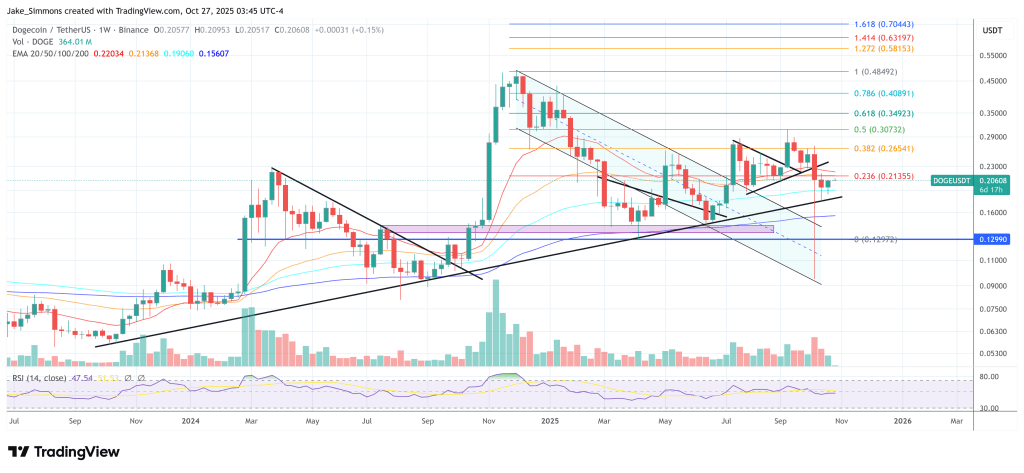
 … higher high pending… still targeting 1.272 fib this cycle,” tying the price structure back to the extension grid. The implication is not casual moon-math; it is geometric. If ADA continues to defend the uptrend defined by the channel’s lower rail and, crucially, converts the 0.618 retracement at $1.15694 into support on weekly closes, the path reopens into the upper retracement shelf—$1.43911 at 0.702 and $1.78464 at 0.786—before confronting the 0.888 marker at $2.32189.


 A Fully Regulated Digital Yen Bridging Japan’s Finance and Web3


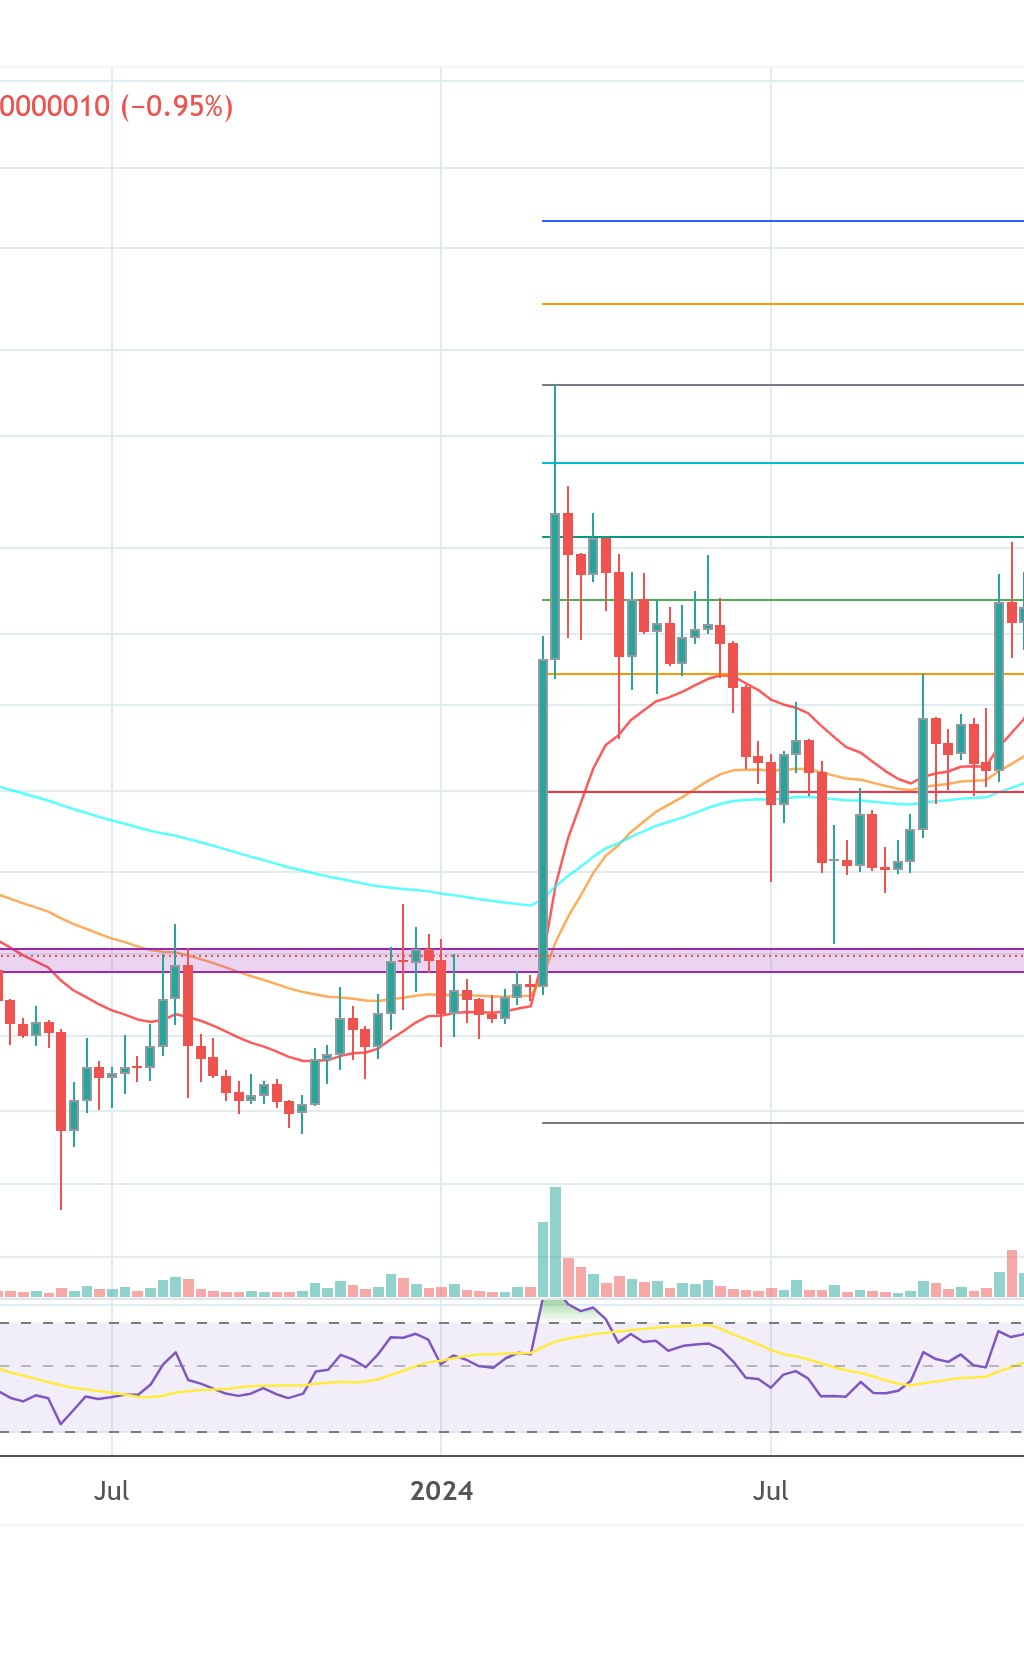


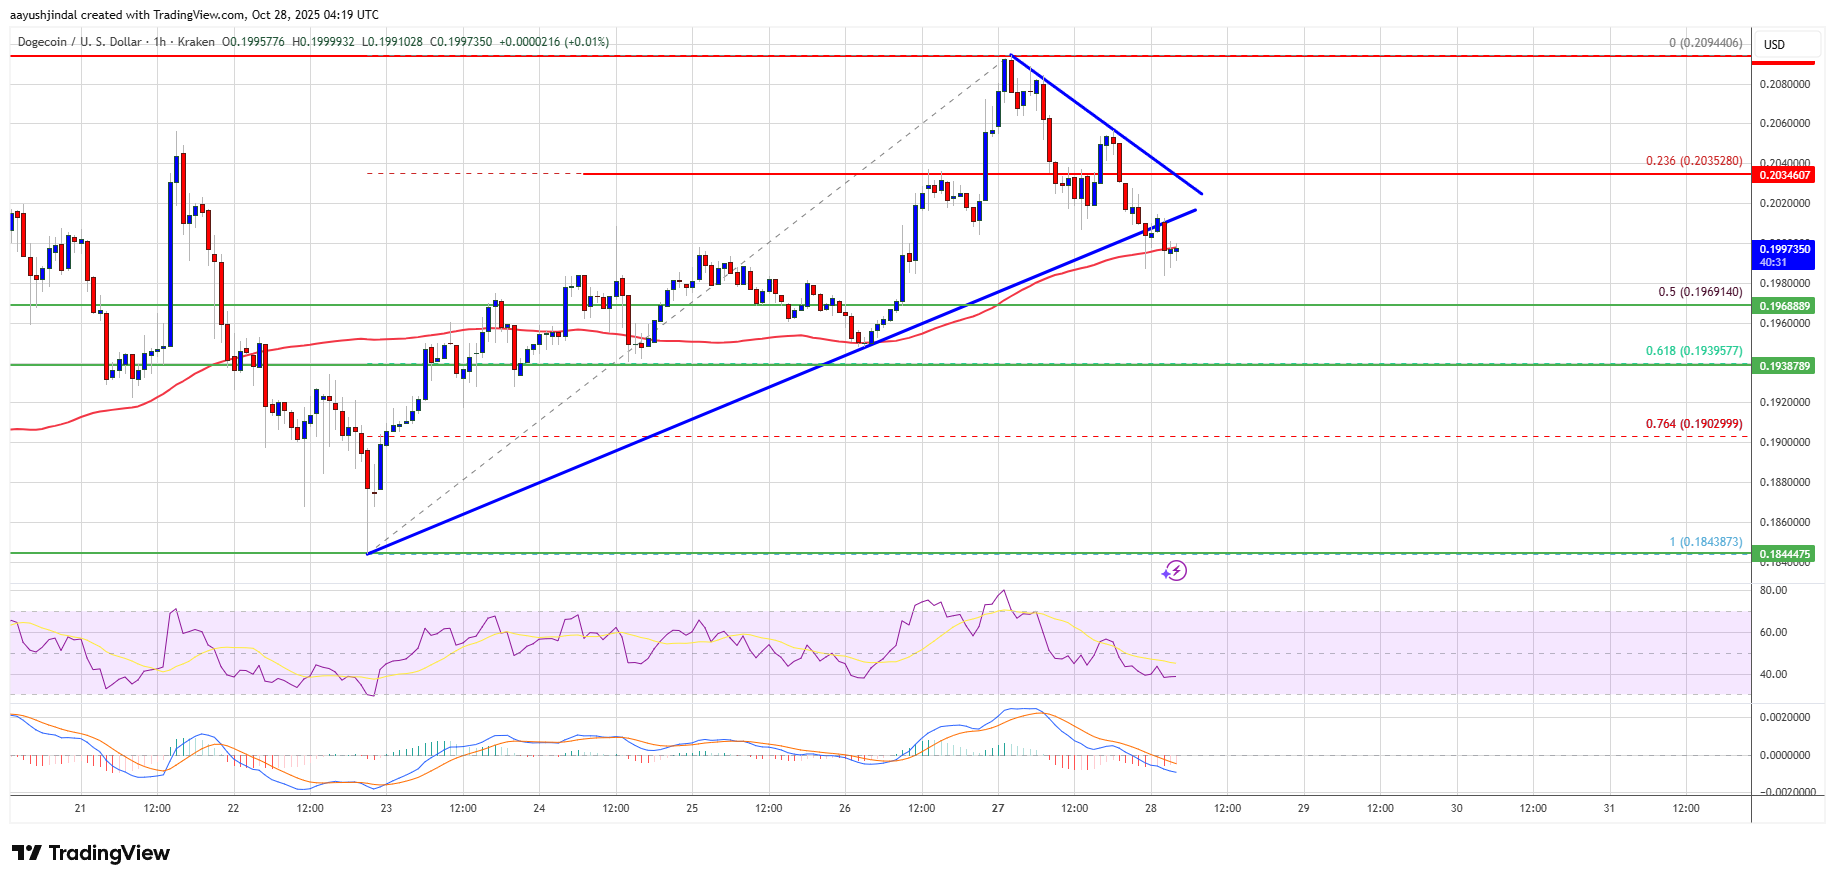
 Technical Indicators Show Choppy Momentum


 Take a look at our step-by-step guide on


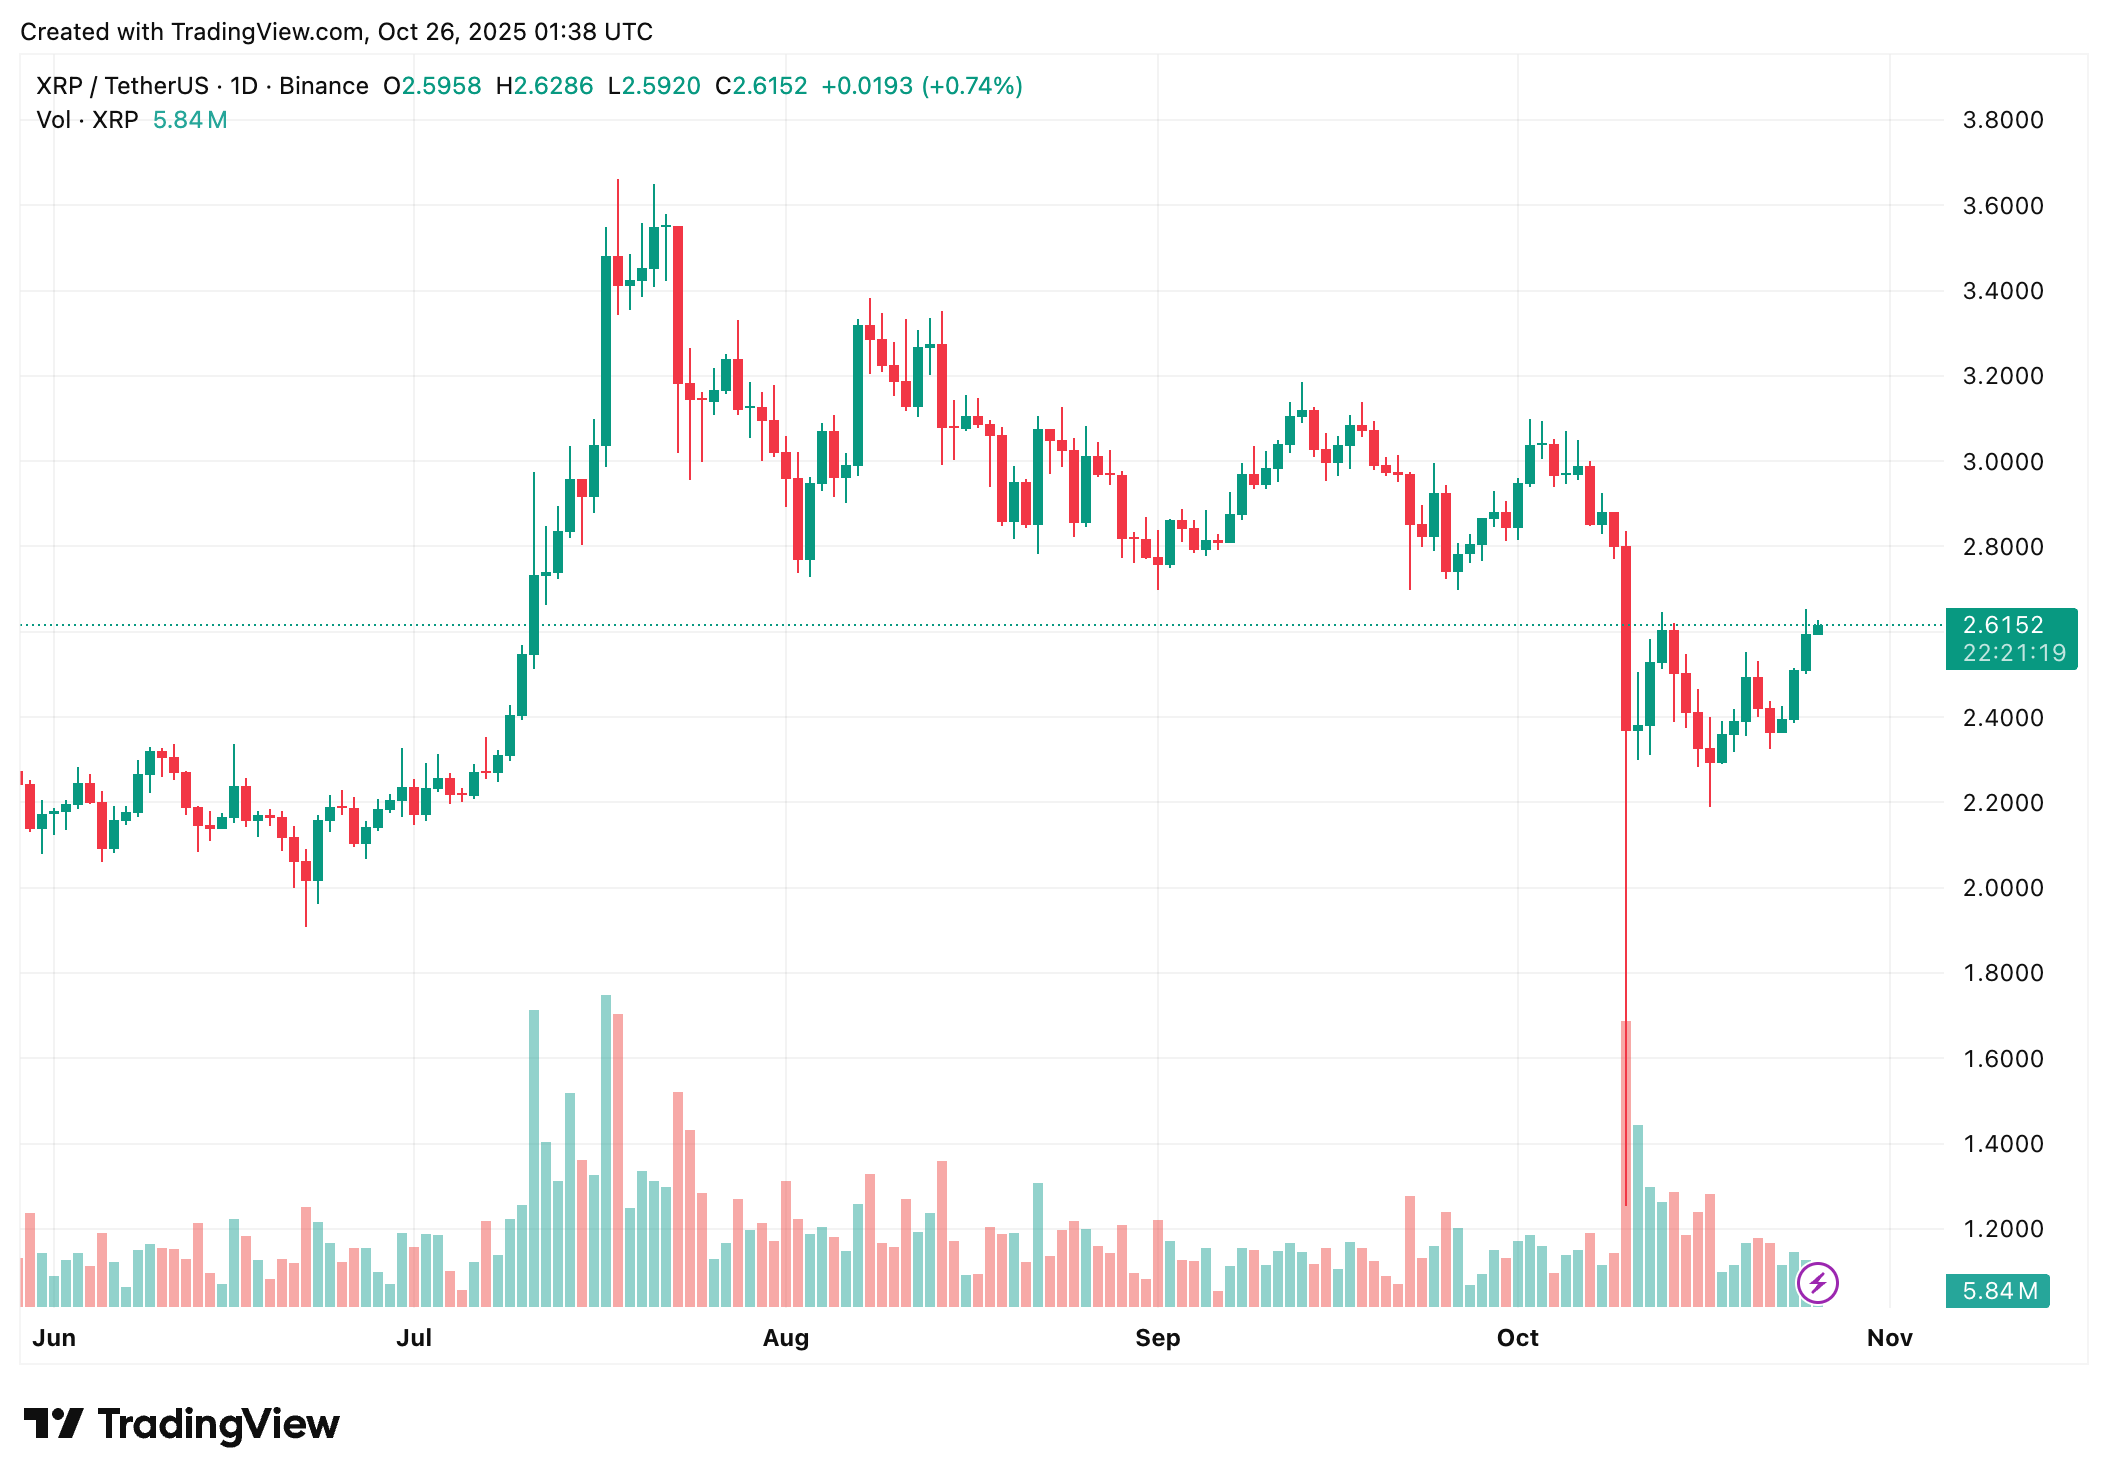


 JUST IN: A Hyperliquid whale has opened a MASSIVE $1M XRP long position with 10x leverage at $2.40


 |
| (@Xaif_Crypto)
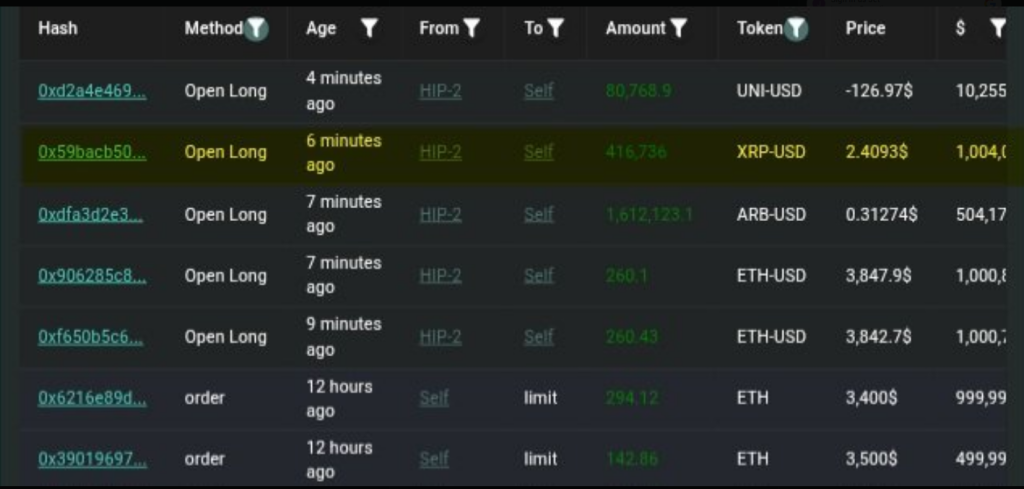


 (@tokenterminal)
 (@bitgu_ru)