Crypto analyst Steph has highlighted a high liquidity level that could spark a significant surge for the XRP price. This comes as the altcoin struggles to reclaim the psychological $3 level, which could lead to a further rally to new highs.
Liquidity Level That Could Spark An XRP Price Surge
In an X post, Steph revealed that the liquidity around $3.2 is expanding for the XRP price and that the market is charging toward the highest cluster. He explained that there are many buy and sell orders around this level, with market makers often looking to capture liquidity at price levels with significant liquidity clusters like this one.
As such, the XRP price could rally to $3.2 at some point, reclaiming the $3 level in the process. However, the crypto market is currently on a downtrend, which makes this rally less unlikely for now. XRP has struggled to break out of its current range since the $19 billion liquidation event on October 10.
Crypto analyst CasiTrades had recently predicted that the XRP price could still drop to as low as $1.4 before it records a bullish reversal. She claimed that this will set the stage for the next Wave 3 impulse that could send XRP toward $6.50 or $10. Meanwhile, for the projected XRP crash to be invalidated, the analyst stated that the altcoin needs to break and hold above $2.82.
However, Steph revealed that the XRP price has formed a double bottom, which he predicts would lead to a reversal above $3. The analyst is also confident that XRP will reach a new all-time high (ATH), predicting a rally to $4.50 as he highlighted a compression on the chart.
Why Current Price Action Is Still Bullish
Crypto analyst Egrag Crypto revealed that the XRP price is making higher highs and that the RSI is also making higher highs, which he noted means strong bullish momentum and that buyers are still in control while the trend is healthy. He added that there is no bearish divergence, so momentum is confirming the price move.
Egrag Crypto further remarked that when the XRP price and RSI rise together, the uptrend is real and supported by strength. He suggested that XRP holders should only be worried when the price makes higher highs but the RSI makes lower highs. He explained that this is when a bearish divergence could occur, indicating weakening momentum. Meanwhile, the analyst also mentioned that a close above between $2.65 and $2.70 with confirmation is key.
At the time of writing, the XRP price is trading at around $2.5, down over 3% in the last 24 hours, according to data from CoinMarketCap.
Bitcoin’s recent price action suggests a healthy pullback may be underway, setting the stage for renewed upside momentum. While short-term correction toward key support levels appears likely, the broader technical outlook still points to strength and potential continuation toward higher targets once consolidation completes.
Bitcoin Enters The Expected Pullback Phase
BeLaunch, in a recent BTC daily update shared on X, noted that Bitcoin’s price movement continues to unfold exactly as anticipated. The market appears to have transitioned into the expected pullback phase, signaling a temporary cooldown following its recent rally. This correction phase could be a natural part of the ongoing bullish structure rather than a sign of weakness.
According to the analyst, Bitcoin is likely to retrace toward the $108,000–$110,000 range, an area identified as a key short-term support zone. This range could serve as a healthy reset point for the market, allowing momentum indicators to cool down before the next potential upward leg begins.
Once this corrective phase concludes, BeLaunch expects Bitcoin to stage a rebound that could carry it toward the $125,000 target region. Such a move would represent the continuation of the macro uptrend that has been forming over the past several weeks. However, confirmation of this scenario would depend on the strength of the recovery following the anticipated dip.
The analyst concluded the update with a word of caution, reminding traders that this retracement phase may precede a significant breakout, describing it as the “calm before the storm.” This suggests that Bitcoin’s next decisive move could be substantial, making patience and strategic positioning key in the days ahead.
Market Cooldown Underway: BTC Slows After Recent Gains
In an X post, Crypto VIP Signal noted that Bitcoin’s price has started to ease gradually after recent gains. BTC’s market appears to be entering a short-term cooling phase, with selling pressure beginning to test lower levels.
According to the analyst, Bitcoin could revisit its key support area before making its next decisive move. Price action currently shows the formation of a clear trading range, suggesting that the market is consolidating and gathering momentum for its next breakout. Bitcoin behaviour around these crucial levels is vital, as a bounce from support could define the next upward push.
In the meantime, the update emphasized that some sideways movement is likely over the next few days. The existing support and resistance levels remain unchanged, serving as critical zones to gauge market sentiment. Once BTC breaks out from this consolidation range, it could set the tone for a directional move.
European Central Bank officials kept a clear target this week: launch the digital euro in 2029. That goal was described as realistic by senior ECB figures, even as the bank said it will carry on with preparation work beyond the formal end of its current phase in October 2025. According to Bloomberg and ECB statements, the timetable depends on new EU laws and technical readiness.
Preparation Phase Continues After October 2025
Based on reports, the ECB started the preparation phase in November 2023 and has been building rules and testing options since then. The formal stretch of that phase was due to finish in October 2025, but officials said work will not stop.
Tasks left on the list include finalizing the rulebook, deciding how privacy and anti-money-laundering checks will work, and lining up service providers and technical infrastructure. No final decision to issue will be taken until the legal framework is in place.
What The 2029 Target Means For Markets And Banks
Reports have disclosed that the bank aims for a mid-2029 launch if everything aligns — legislation, systems, and user tools. That leaves four years for lawmakers and market players to move.
Banks will be watching closely. So will fintech firms and payment platforms. Some regulators have said they want central bank money available electronically so citizens can keep using safe public money as cash use falls.
Political Pressure And International Context
According to media coverage, political signals from outside the EU have helped speed talks. US President Donald Trump’s moves on crypto and stablecoin regulation were cited by some EU ministers as a reason to solidify Europe’s own plan.
The ECB says the digital euro is partly about keeping public money relevant as private payment options multiply. Any decision to issue and distribute a retail CBDC will still need approval from EU lawmakers before the bank can start broad rollouts.
Open questions around design and limits remain. Will retail accounts hold interest? How much can a person keep in digital euros? Can citizens use the currency offline? These are basic questions that lawmakers and the ECB must answer together.
Reports say the ECB is aiming to protect privacy while meeting AML rules, but those goals sometimes conflict and will need trade-offs.
A narrow window, but not a guarantee. The 2029 timeline is a signal to markets and developers. It is a target, not a promise. Based on reports, the bank’s path will be shaped by how quickly EU legislation moves and how well technical trials go over the next months and years.
Featured image from Getty Images, chart from TradingView
Bitcoin is sitting on a technical ledge that could decide whether price makes a new all-time high or unwinds sharply into the $80,000s, according to veteran trader Josh Olszewicz (CarpeNoctom). “BTC complex iHS brewing in the megaphone,” he posted on October 30, 2025, adding in a follow-up: “Also this brewing, not great.”
The Bullish Case For Bitcoin
Olszewicz is tracking two structures. The first, on the 6-hour timeframe, shows BTC trading inside a broadening “megaphone” pattern that has contained price since July. The megaphone is defined by rising dotted resistance lines above and falling dotted support lines below. The upper boundary extends through roughly $126,000 to $128,000. The lower boundary widens down toward $105,400 and $103,800.
Within that range, Bitcoin put in a sharp spike above $126,000 in early October, then sold off violently, dropping below $106,000s with a wick toward roughly $102,000. That bounce failed to recover the prior range. Instead, price stalled under a horizontal resistance shelf around $116,000–$117,000. Olszewicz sketches a yellow projected path that implies a short-term bounce from just under $111,000 back towards $116,000. That path suggests attempted relief, not confirmed bullish continuation.
Only if Bitcoin can reclaim the $116,000–$117,000 zone does a move toward the upper resistance band come back into play. In that scenario, price could extend toward $128,000, print a new all-time high, and potentially restart a broader recovery phase.
The Bearish Case For Bitcoin
The second chart is where the downside risk accelerates. On the 1-day timeframe, Olszewicz maps a head-and-shoulders top with a rising neckline. The left shoulder topped in the $118,000 area, the head reached roughly $126,200, and the right shoulder again failed near $116,000. The neckline is drawn as an ascending dotted support line that now sits in the $105,000–$106,000 zone. He highlights $107,316.81 as the key breakdown level.
If that neckline breaks decisively, the chart applies a standard measured move. The distance from the head down to the neckline is projected lower. Olszewicz plots that extension into a teal target zone and marks intermediate and full objectives at $93,963.81 (the 1.618 extension) and $87,652.27 (the 2.0 extension). In other words, a clean daily breakdown through $107,316 opens a path first toward the mid-$90,000s and then toward roughly $87,600.
Above spot, resistance remains layered. The 0.5 retracement of the prior impulse is labeled at $115,486, and the 1.0 retracement — effectively the previous swing high — is marked at $124,477.
Structurally, Bitcoin is now boxed between supply in the $116,000 region and that neckline supports around $105,000–$106,000. Olszewicz’s message is that bulls may still be trying to form a “complex inverse head-and-shoulders in the megaphone,” but the active daily head-and-shoulders top is “not great.” A decisive loss of the neckline could confirm the bearish structure and put $93,963.81 and $87,652.27 on the table.
Grayscale Investments kicked off trading of a new Solana-focused ETF on Wednesday, adding a staking feature that passes network rewards to investors.
The fund, now listed on NYSE Arca as the Grayscale Solana Trust ETF (GSOL), was converted from a closed-end vehicle that first launched in 2021.
From Closed-End Trust To ETF
According to Grayscale, the move makes the firm one of the largest Solana exchange-traded product managers in the US by assets under management.
The converted ETF lets ordinary brokerage accounts hold SOL exposure while receiving staking rewards tied to the network.
Inkoo Kang, Grayscale’s Senior Vice President of ETFs, said the launch shows the firm’s belief that digital assets should sit alongside stocks and bonds in modern portfolios.
Introducing Grayscale Solana Trust ETF (Ticker: $GSOL), offering investors exposure to @Solana$SOL, one of the fastest-growing digital assets. $GSOL features:
Convenient Solana exposure paired with staking benefits.
Exposure to a high-speed, low-cost blockchain.… pic.twitter.com/TgVNlhqBPO
Based on reports, Grayscale is not alone. Bitwise rolled out its own Solana ETF on the New York Stock Exchange one day earlier. Canary also listed Litecoin and HBAR ETFs on Nasdaq on Tuesday.
Those moves came amid strong interest from asset managers to offer regulated crypto funds that give investors straightforward access to tokens without direct custody.
JUST IN: $GSOL, the first Grayscale Solana Trust ETF with staking, goes live on @NYSE Arca, offering U.S. investors spot @Solana exposure and staking rewards under newly approved SEC listing standards. pic.twitter.com/eTzVP9Kb1X
These ETF launches happened while the US government was partially shut down and some SEC staff were furloughed.
Kristin Smith, president of the Solana Policy Institute, said staking-enabled funds offer more than simple price exposure; participants can help secure the network, support developer work, and earn rewards.
The Securities and Exchange Commission issued guidance permitting firms to file S-1 registration statements without a delaying amendment, which lets certain funds take effect automatically within 20 days of filing.
The SEC had also approved updated listing standards for commodity-based trust shares shortly before the staffing disruption, a step that helped speed up approvals for dozens of pending crypto ETF applications.
What This Means For Solana Holders
Solana has consistently cemented its status among the powerhouse tokens in terms of market valuation, taking the sixth spot, according to CoinMarketCap.
Based on reports, the new listings did not include full details on fee levels, which validators will be used for staking, or how staking rewards will be split after expenses.
Those operational questions matter to investors weighing net returns and counterparty risk. Trading on NYSE Arca does mean easier access through brokerages, but the finer points of how staking is run will shape how attractive GSOL becomes versus other Solana products.
Featured image from Gemini, chart from TradingView
In a post on X on October 29, Quinn Thompson, CIO of Lekker Capital, argued that Jerome Powell’s post-FOMC messaging was less about macro uncertainty and more about pressure tactics aimed at the political apparatus — with direct consequences for crypto liquidity.
Powell’s FOMC Comments Decoded
Thompson wrote: “Powell appeared to be playing political games / posturing / CYA around the December verbiage, possibly to communicate to the admin to get the government reopened. It almost felt like a threat that if no data (due to continued government shutdown), then there won’t be a December cut and the market was briefly thrown off by that uncertainty.” He called out how abnormal it was to hear Powell comment this directly on market expectations: “The immediate reaction made sense given it is quite abnormal to hear Powell comment on market pricing so specifically as he always refrains from doing so and makes a point to say he will not comment on market pricing.”
That is the core of Thompson’s read. Powell just broke his own habit. Powell tends to reject any framing that implies the Fed is validating market forward pricing. This time, after the Federal Reserve cut its policy rate by 25 basis points to a target range of 3.75%–4.00%, Powell said explicitly that “a further reduction in the policy rate at the December meeting is not a foregone conclusion — far from it.”
He underlined that there are “strongly different views” inside the Committee about the speed and depth of further easing. Markets immediately repriced. Treasury yields moved higher and the probability of a December cut fell sharply from near certainty to something closer to a coin flip, and risk assets reacted accordingly. That includes crypto: bitcoin and large-cap crypto assets initially traded lower alongside equities as the market read the comment as a hawkish surprise rather than as positioning.
Thompson’s view is that this was not about signaling a hawkish turn. It was about signaling conditionality. He frames Powell’s remarks as a message to the White House and Congress: reopen the government, restore economic data flow, and the Fed has cover to cut again in December; keep the shutdown in place and deny the Fed official data, and Powell can say, on record, that he cannot justify further accommodation. Powell himself emphasized that the central bank has been operating “in the absence of key government data” because the shutdown that began on October 1 has blocked normal labor, inflation, and activity reporting. Thompson characterizes that stance as an implicit warning shot.
In his words, “What you infer from that is up to you, but additionally I believe the market may have been surprised by what I believe to be an incorrect Fed reaction function to the government shutdown. There is no scenario in which the economy is stronger because of the shutdown and if they are highlighting continued downside labor market risks, there isn’t a great case to be made to veer from their September dot plot path.”
For crypto, the subtext is important: Thompson is saying Powell’s comments were not a signal to tighten financial conditions into year-end. They were leverage in a political negotiation, not a policy ceiling on liquidity.
That point is operational, not rhetorical. Thompson is saying the Fed’s stated logic does not actually line up with what the Fed itself claims to be worried about. Powell’s justification for the October 29 cut leaned heavily on labor market softening and downside employment risk. The official FOMC statement pointed to a “shift in the balance of risks” toward weaker employment, noted that job gains have slowed, and acknowledged that unemployment has edged higher.
Powell also said inflation is still above target but no longer accelerating the way it was earlier in the year, which is why some members favored faster easing. That mix — weakening labor, cooling inflation, policy cuts — has historically been constructive for crypto because it points to easier dollar liquidity and a lower cost of capital without outright crisis.
On the balance sheet, Thompson highlights something that is already documented in Fed and press statements but has not yet fully repriced across risk: “Just a week or two ago the market was not expecting QT to end this soon and today Powell went so far as to discuss the next step in this process being a return to balance sheet growth. These developments are definitively liquidity positive, even though the MBS reinvestment and future purchases will be all or predominantly bills.”
What This Means For Crypto
In plain terms, the Fed didn’t just cut rates by 25 bps. It also said it will stop quantitative tightening on December 1. That means the Fed will no longer allow its Treasury and mortgage holdings to roll off passively. Instead, it will reinvest maturing Treasuries back into Treasuries and redirect principal paydowns from its mortgage-backed securities portfolio into Treasury bills.
For crypto, this is the line that matters. When the Fed stops shrinking its balance sheet and starts recycling back into bills, it’s effectively injecting incremental dollar liquidity into the system, even if it refuses to call it QE. That liquidity has historically leaked into the parts of the market most sensitive to excess cash and duration scarcity — tech, high beta credit, and crypto. Thompson is basically saying that under the surface of Powell’s cautious language, the Fed just signaled the start of the next crypto liquidity regime.
This is a critical liquidity inflection that is easy to miss if the only headline you absorb is “December cut not guaranteed.” Ending QT this early was not a consensus two weeks ago. This is also why Thompson rejects the idea that Powell’s tone was structurally bearish for risk.
He writes, “All in all I think the December cut is still quite likely.” He then lays out the macro sequence he expects to see once the shutdown ends: “Ultimately I think they will reopen the government in the next few weeks so there will be data and it is likely to show inflation falling for the next few months and labor market continue its weakening path, and Trump is making deals that likely bring tariffs down which also earns him brownie points with the FOMC.” The message for crypto investors is that once data resumes, it will justify continued easing, not block it.
The last part of Thompson’s post moves from mechanics to governance. He points directly at Powell’s expiring authority. “Powell’s term as Chair ends in 6 months and his successor will be known even sooner, creating a shadow Fed chair situation. It remains clear to everyone and the market that the new chair will be friendly towards and help effectuate the admin’s agenda. Given all of the above, it is difficult for me to paint a risk asset bear case based upon liquidity dynamics as all signs point to continued massaging to support markets.” That is the crypto punchline.
Thompson is arguing that the institutional bias of the Fed, going into the succession window, is toward maintaining and managing liquidity conditions so markets do not crack. If that bias holds, it is inherently crypto-bullish, because it implies a policy floor under dollar liquidity at the exact moment the Fed is already preparing to halt balance sheet runoff and re-expand via bills.
At press time, the total crypto market cap stood at $3.73 trillion.
The negative market sentiment has spread rapidly, and the Dogecoin price continues to range around $0.2 as a result. This puts the meme coin in a perilous position that could see its decline deepen from here. One thing that could make a difference would mean a rise in momentum, but volume is already down by a significant amount, so this route has remained a problem. Another major problem is the resistance mounting at $0.21 that could stop any recovery rally in its tracks.
What Happens If The Dogecoin Price Breaks $0.218
Crypto analyst Diana Sanchez has highlighted the bullish potential of Dogecoin, suggesting that the price has been showing strength. This comes with the recent market fluctuations ahead of the decision from the Federal Reserve following the FOMC meeting. At this point, though, there is an important level where there is still a lot of resistance.
The first thing the analyst points out is that despite the current struggle, the Dogecoin price has already increased by over 43%. This makes it one of the best performers among the top cryptocurrencies by market cap, and the momentum could turn bullish once again.
However, the major problem now lies at the $0.218 level, where the bears are now mounting their defense. As for now, it continues to maintain the support at $0.2, and this has become the major source of interest for the bulls who are looking to continue the rally.
The main point right now, the crypto analyst explains, is to break the resistance at $0.218. If this resistance is broken, then the Dogecoin price is expected to continue to rally. With this, the analyst says the Dogecoin price rising to the $0.5 target is no longer a dream.
Low Volume Could Be A Hindrance To Recovery
Despite the bullishness that is showing on the Dogecoin price chart, the fact that the meme coin’s daily trading remains low continues to put a damper on things. At the start of October, the daily trading volume had spiked above $20 billion before seeing a retracement.
Since then, though, the daily trading volume has continued to decline, reaching an average of $5 billion at the time of writing, as shown on the Coinglass website. So, unless there is a notable increase in the trading volume, any breakout could lack momentum, meaning the price could quickly correct and retrace its gains.
The Fed’s rate cut failed to lift crypto markets, as the move was likely fully priced in.
$XRP price prediction points to the $2.70 resistance. A strong breakout could pave the way to $4.50 in the short term and $15 in the long term.
Investors are backing Bitcoin Hyper ($HYPER) as the next 1000x crypto to ride the wave of utility-driven altcoins.
In hindsight, a sell-off after yesterday’s rate cut decision does make sense. After all, over 98% of market participants anticipated the cut – and when a move is that widely expected, there’s simply no fuel left behind it.
Not to mention, Federal Reserve Chairman Jerome Powell definitely spooked investors by saying that a December rate cut is ‘not a foregone conclusion.’
With the FOMC meeting behind us, the focus now shifts to pure price action, especially in the case of $XRP, which is trading in a crucial zone.
On the two-day timeframe, $XRP’s July run-up came after the breakout of a clean and long-standing descending triangle pattern – according to which the token’s next target should’ve been around $4.50.
However, $XRP topped out near $3.60 and has since fallen by over 30%, now trading around the $2.50 mark.
Sure, while this ‘drop’ has effectively completed a successful retest of the breakout trendline, the token now faces the $2.70 level on its way back up.
This particular level (blue box), mind you, has become an important resistance zone for $XRP.
However, some short-term volatility notwithstanding, $XRP’s long-term picture looks incredibly bullish.
In November last year, $XRP broke out of a descending triangle on the monthly chart – marking a major, potentially once-in-a-lifetime breakout.
After a sharp 230%+ rally in November alone, $XRP mostly moved sideways, suggesting we could be witnessing a long-drawn consolidation phase before the next leg up – potentially toward $15.
Sounds unrealistic? It’s actually far from it. Just look at $XRP’s history on the charts.
In 2017, $XRP soared 22,000% following the breakout of a similar consolidating triangle. If anything, the 2018–2024 consolidation was longer than the one that preceded 2017’s bull run.
So, there’s a high likelihood we’re in the early stages of yet another moonshot rally.
Here’s the kicker: if you plan to keep $XRP in your long-term portfolio but also want to capitalize on the growing momentum behind utility altcoins, consider adding a low-cap altcoin like Bitcoin Hyper ($HYPER).
What Is Bitcoin Hyper?
Bitcoin Hyper is a next-gen Layer-2 solution aiming to solve Bitcoin’s long-standing issues of sluggish speeds, high costs, and lack of support for Web3 and DeFi.
Unlike most Layer-2 networks, $HYPER will integrate the Solana Virtual Machine (SVM) instead of the Ethereum Virtual Machine (EVM).
This will give it the unique ability to execute thousands of transactions in parallel – as long as they’re unrelated to each other.
This breakthrough will finally bring Bitcoin up to modern blockchain standards – something that’s long overdue, given Bitcoin currently processes just seven transactions per second (TPS), while Solana handles an impressive 65K TPS.
Bitcoin Hyper will also allow developers to build smart contracts and decentralized applications (dApps) directly on Bitcoin, all while maintaining the network’s world-class security.
In simple terms, buying Bitcoin Hyper will mean unlocking access to high-speed DeFi trading apps, NFT marketplaces, lending, staking, borrowing, and gaming dApps, all on the Bitcoin network.
And $HYPER’s non-custodial canonical bridge will act as the gateway to this never-before-seen Web3 environment on Bitcoin. It will:
Securely lock in your Layer-1 Bitcoin, which you’ll send to a designated address monitored by the bridge.
Mint an equivalent amount of wrapped tokens on Bitcoin Hyper’s Layer-2 network.
Once you’ve completed your interaction on Web3 and initiated a withdrawal, it’ll release your original Bitcoin back to your Layer-1 wallet address.
Get the Most Out of $HYPER – Buy It Now While in Presale
After all, consider what $HYPER could mean for Bitcoin’s longevity. It could transform the biggest crypto in the world from merely an investment opportunity into a full-blown blockchain brimming with modern technology.
Interested? Right now is the best time to join the $HYPER tribe. That’s because it’s currently in presale, meaning it’s available at one of its lowest-ever prices – just $0.013195 per token.
Take a look at our detailed step-by-step guide on how to buy Bitcoin Hyper and stake it for 46% APY.
Despite recent interest rate cuts by the Federal Reserve on Wednesday, Bitcoin’s price reacted unexpectedly, declining when many anticipated a rise. However, market analyst Crypto Birb has identified ten indicators suggesting a potential surge may be on the horizon.
Bitcoin Price Holds Above Key Moving Averages
At the time of the expert’s post, BTC traded at $112,000. He pointed that with exchange-traded funds (ETFs) gaining traction and market fear subsiding, the Bitcoin price appears to be consolidating before a significant upward movement, indicating that a breakout is imminent.
Currently, the Bitcoin price trades comfortably above the 50-week simple moving average (SMA) of $102,934 and the 200-week SMA of $54,756. The correlation with the S&P 500 stands at -0.02, suggesting that Bitcoin’s movements are largely independent of broader equity market trends.
On the daily chart, Bitcoin is supported by the 200-day SMA at $109,267 and a key trend line at $113,100. The relative strength index (RSI) is neutral at 50, while the average true range (ATR) has decreased to 3,495, indicating a calmer market environment.
In terms of short-term bias, the market shows balance but is not bullish yet. The CTF Trailer indicates a bearish mode with a stop at $115,623, while the higher time frame trailer reflects a bullish mode with a stop at $114,601.
Currently, Bitcoin’s trading range is between $110,000 and $117,800, and this compression indicates that an equilibrium is forming. The next significant movement is expected to occur once this range is broken.
Calm Before The Storm?
Sentiment within the market appears balanced, with the Fear & Greed Index sitting at 51, which reflects a neutral stance. Crypto Birb asserts that emotions have reset following last week’s spike in fear, creating a stable environment for sustainable price movements.
Volatility is also cooling off, with a 50-day volatility of 3,080 and an ATR of 3,495. This contraction in trading range suggests that traders are reloading positions rather than capitulating, and history shows that periods of calm consolidation often precede volatility shocks.
On the mining front, the economic landscape is looking favorable, with mining costs at $106,400 and a ratio of 0.94, indicating that miners remain moderately profitable after last week’s compression. Stable costs suggest no immediate pressure for forced selling, and network fundamentals remain solid.
Looking at the October outlook, the month-to-date performance shows a minor decline of 0.53%, which is still an improvement over the typical historic October average of 19.78%. This suggests a healthy reset within an otherwise strong seasonal backdrop.
A Potential 51% Surge Ahead?
The expert further highlighted that historically, the fourth quarter has been bullish for the Bitcoin price, with an average gain of 51.04% over the past 15 years, resulting in nine winning years. If the current structure holds, Q4 is poised to remain a high-probability accumulation zone.
Lastly, data related to Ethereum ETFs indicates a quiet strength beneath the surface, with spot ETF volumes at $147 million and net inflows of $133.9 million. The total assets under management have reached $24.88 billion, and rising liquidity in altcoins complements the ongoing flows into Bitcoin, supporting a narrative of market rotation.
At the time of writing, however, the Bitcoin price has retraced back towards $110,439. Yet, still inside its current consolidation range that could result in a new uptrend for the leading crypto.
Featured image from DALL-E, chart from TradingView.com
Solana failed to stay above $198 and corrected gains. SOL price is now trading below $195 and might find bids near the $188 zone.
SOL price started a downside correction below $198 against the US Dollar.
The price is now trading below $195 and the 100-hourly simple moving average.
There is a declining channel forming with resistance at $200 on the hourly chart of the SOL/USD pair (data source from Kraken).
The pair could extend losses if it dips below the $188 zone.
Solana Price Approaches Support
Solana price failed to surpass $205 and started a downside correction, beating Bitcoin and Ethereum. SOL dipped below $200 and $198 to enter a short-term bearish zone.
There was a move below the 23.6% Fib retracement level of the upward wave from the $177 swing low to the $205 high. However, the bulls are active near the $192 support. Besides, there is a declining channel forming with resistance at $200 on the hourly chart of the SOL/USD pair.
Solana is now trading below $195 and the 100-hourly simple moving average. On the upside, the price is facing resistance near the $198 level. The next major resistance is near the $200 level. The main resistance could be $205. A successful close above the $205 resistance zone could set the pace for another steady increase. The next key resistance is $220. Any more gains might send the price toward the $225 level.
Downside Break In SOL?
If SOL fails to rise above the $198 resistance, it could start another decline. Initial support on the downside is near the $192 zone and the 50% Fib retracement level of the upward wave from the $177 swing low to the $205 high. The first major support is near the $188 level.
A break below the $188 level might send the price toward the $184 support zone. If there is a close below the $184 support, the price could decline toward the $177 support in the near term.
Technical Indicators
Hourly MACD – The MACD for SOL/USD is gaining pace in the bearish zone.
Hourly Hours RSI (Relative Strength Index) – The RSI for SOL/USD is below the 50 level.
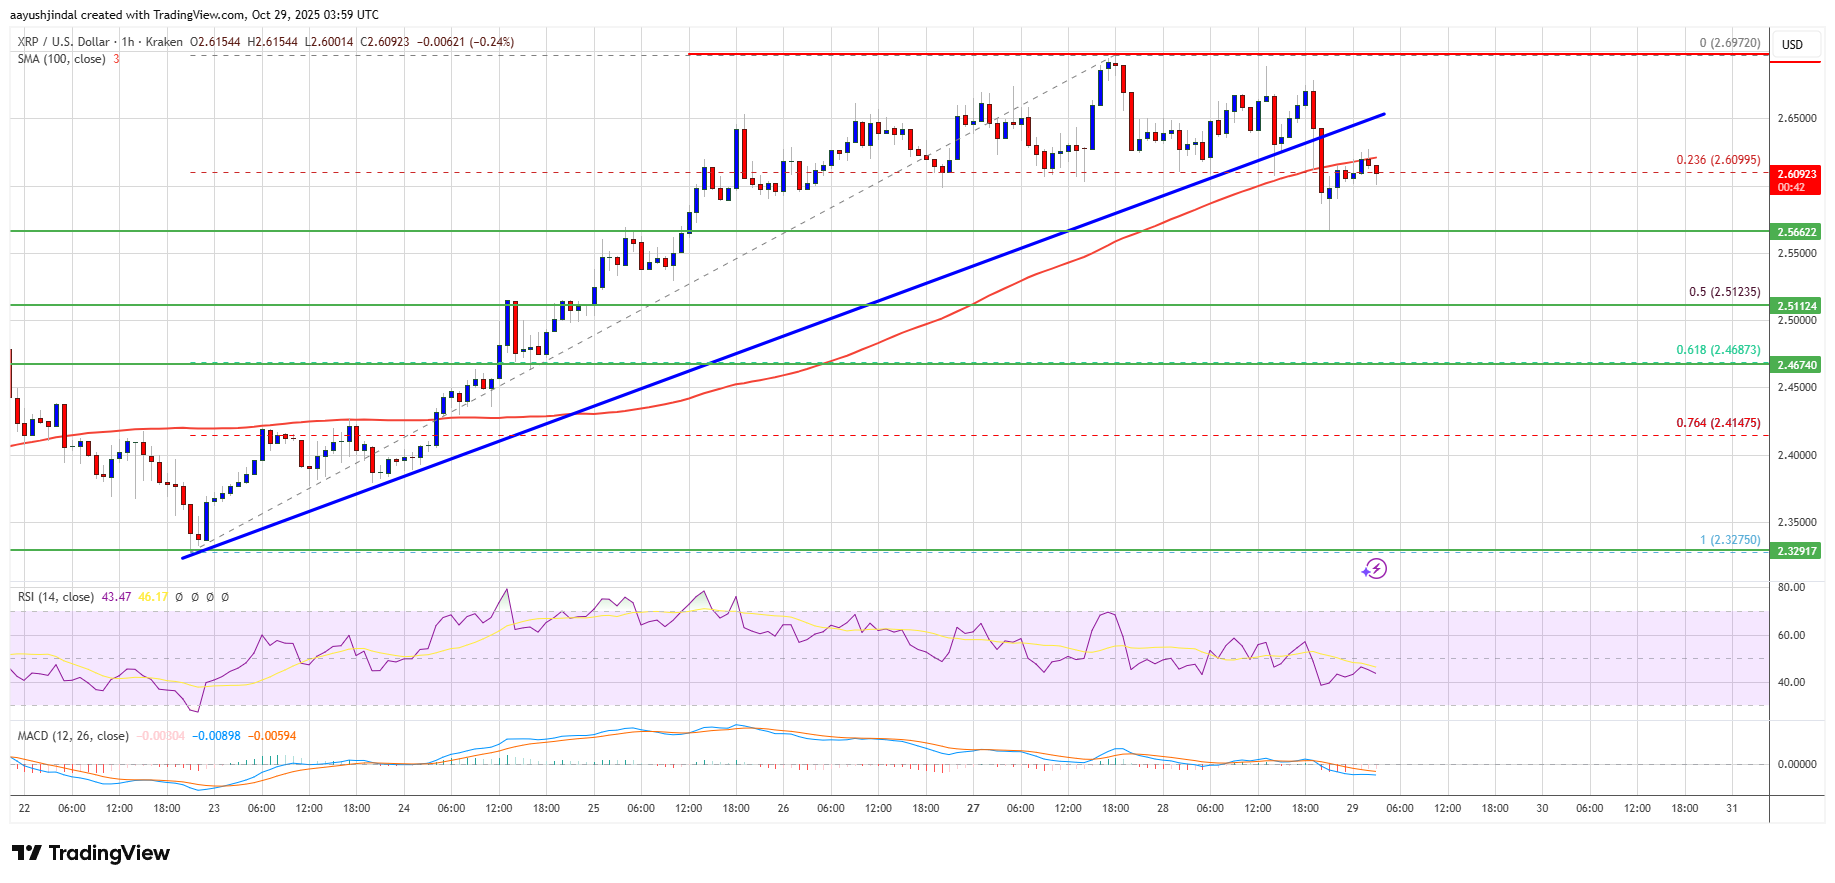
XRP price started a fresh increase above $2.550. The price is now facing hurdles above $2.650 and at risk of another decline in the near term.
XRP price failed to continue higher above $2.70 and corrected some gains.
The price is now trading below $2.60 and the 100-hourly Simple Moving Average.
There is a bearish trend line forming with resistance at $2.65 on the hourly chart of the XRP/USD pair (data source from Kraken).
The pair could start a fresh increase if it stays above $2.5120.
XRP Price Holds Support
XRP price formed a short-term top near $2.69 and started a downside correction, like Bitcoin and Ethereum. The price dipped below the $2.65 and $2.62 levels.
There was a move below the 23.6% Fib retracement level of the upward wave from the $2.327 swing low to the $2.697 high. The price even spiked below $2.55 but remained stable above $2.50. Besides, there is a bearish trend line forming with resistance at $2.65 on the hourly chart of the XRP/USD pair.
The price is now trading below $2.60 and the 100-hourly Simple Moving Average. If there is a fresh upward move, the price might face resistance near the $2.620 level. The first major resistance is near the $2.650 level and the trend line, above which the price could rise and test $2.680.
A clear move above the $2.680 resistance might send the price toward the $2.720 resistance. Any more gains might send the price toward the $2.750 resistance. The next major hurdle for the bulls might be near $2.80.
More Losses?
If XRP fails to clear the $2.650 resistance zone, it could start a fresh decline. Initial support on the downside is near the $2.550 level. The next major support is near the $2.5120 level and the 50% Fib retracement level of the upward wave from the $2.327 swing low to the $2.697 high.
If there is a downside break and a close below the $2.5120 level, the price might continue to decline toward $2.468. The next major support sits near the $2.420 zone, below which the price could continue lower toward $2.40.
Technical Indicators
Hourly MACD – The MACD for XRP/USD is now losing pace in the bearish zone.
Hourly RSI (Relative Strength Index) – The RSI for XRP/USD is now below the 50 level.
As the market awaits the Federal Open Market Committee (FOMC) meeting, Ethereum (ETH) is attempting to hold the $4,000 area as support. Despite the volatility, some analysts have predicted that the King of Altcoins may soon start its long-awaited price discovery rally, while whales pour millions into the cryptocurrency.
Ethereum Price Set For $8,000
On Wednesday, Ethereum fell below the $4,000 level once again, falling to a two-day low of $3,926. After a massive Q3 rally, the King of Altcoin has struggled to hold the crucial psychological barrier as support and has been unable to reclaim the $4,200 resistance for most of October.
Earlier this week, the cryptocurrency retested the key resistance level after surging 7% over the weekend, but retraced on Tuesday alongside the rest of the market. Amid this performance, some analysts suggested that ETH will likely experience more volatility, fueled by the Federal Reserve (Fed)’s interest rate cut announcement.
Daan Crypto Trades noted that ETH’s big test is around its previous cycle highs near the $4,100 level. To the trader, “this is the level to break and hold if the bulls want to get back to the highs in due time.” On the contrary, a new rejection from this area could send the price to retest $3,800 and turn the level into a major resistance in the larger timeframes.
Nonetheless, Crypto Yhodda stated that Ethereum is “getting ready for the last euphoric run,” as its performance resembles its 2021 price action, when the altcoin recorded a massive price discovery rally after breaking out of its four-year consolidation.
Similarly, analyst Crypto Jelle asserted that shakeouts at key support levels are expected, adding that the cryptocurrency’s rally “still looks very promising.” Jelle highlighted an 18-month bullish megaphone formation on Ethereum’s chart, which it broke out of during the Q3 rally.
The analyst emphasized that ETH is still holding the previous highs and the breakout level as support, suggesting that a “hated rally” to the $8,000 target could happen soon.
Whales Bet Big On ETH
Online reports highlighted that large-scale investors have been on a buying spree despite the altcoin’s pullback. As reported by NewsBTC, Santiment data showed that whales added 218,470 ETH in the past week, signaling that major investors are gradually re-entering the market.
Meanwhile, on-chain analytics platform Lookonchain revealed that whales continued to buy ETH over the past 24 hours. Notably, two newly created addresses received a total of 33,948 ETH, worth $135 million, from digital asset prime brokerage FalconX on Wednesday morning.
According to Lookonchain, the two addresses likely belong to BitMine, the largest Ethereum-based treasury company, which recently unveiled another 27,316 ETH purchase, worth $113 million.
In a Monday X post, BitMine provided its latest holdings update, which now surpasses the $14.2 billion mark. As of October 27, the company holds 3,313,069 ETH, 192 BTC, an $88 million stake in Eightco Holdings for its “Moonshot” initiative, and unencumbered cash of $305 million.
A month ago, BitMine revealed it had reached the 2% milestone of its goal to own 5% of Ethereum’s total supply. With the recent purchases, the company has achieved 55% of its goal, currently holding 2.75% of ETH’s supply.
As of this writing, ETH is trading at $3,990, a 3.5% drop in the daily timeframe.
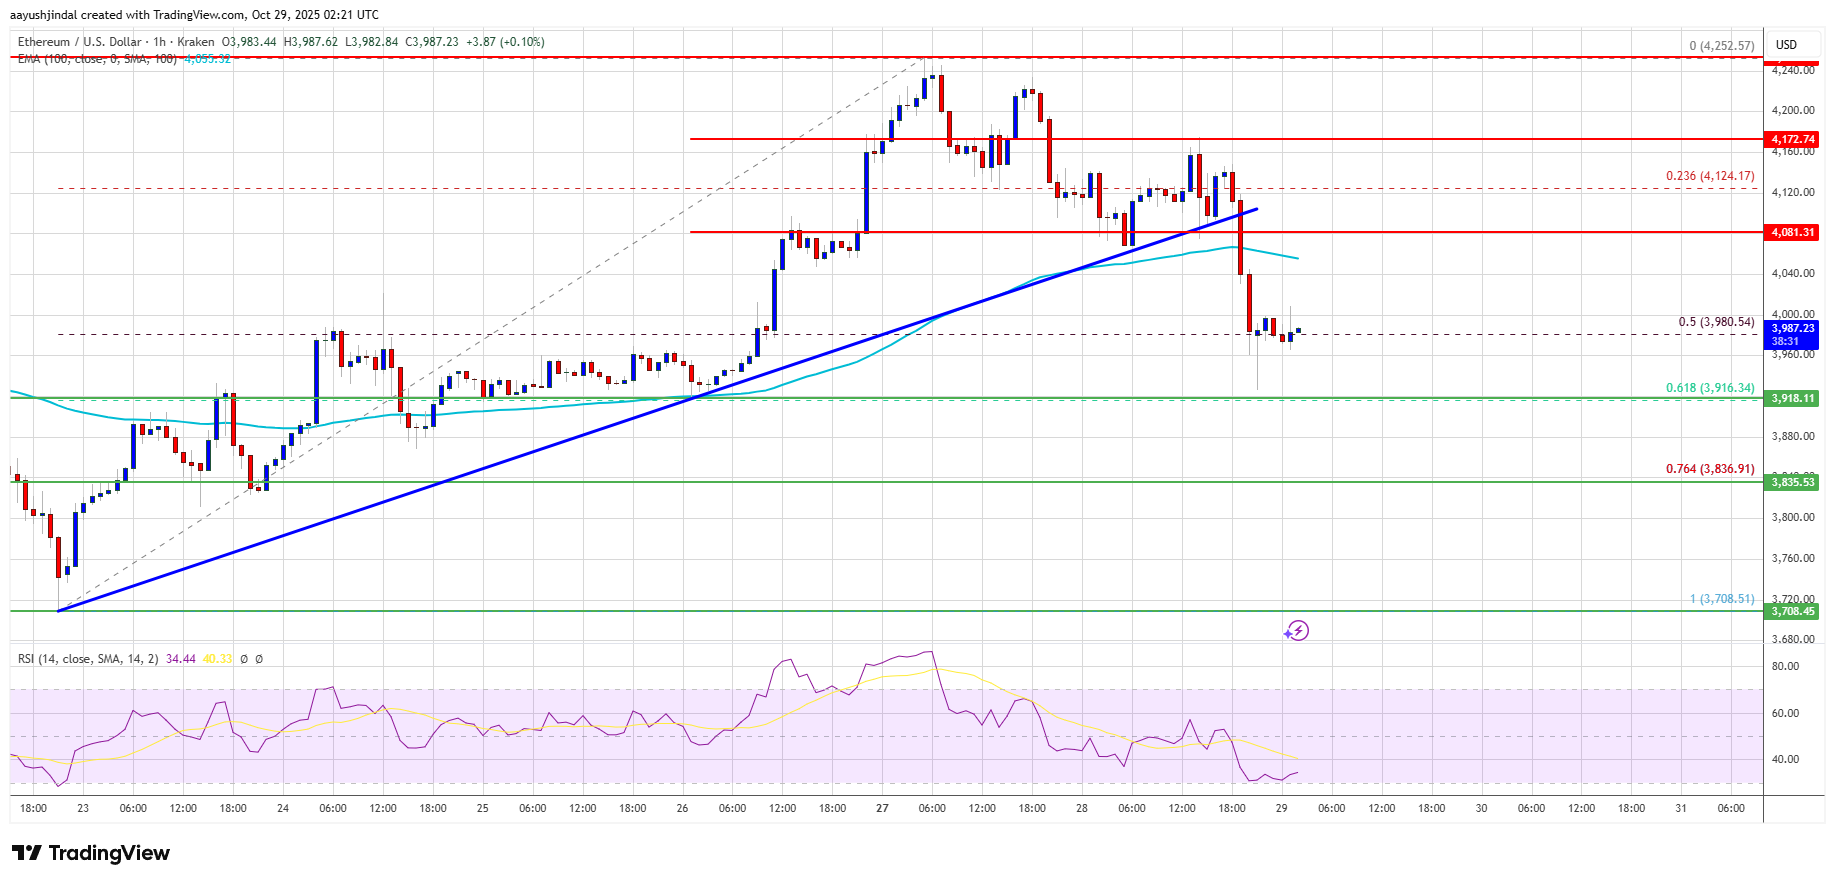
Ethereum price started a downside correction below $4,120. ETH is moving lower below $4,000 and might decline further if it trades below $3,880.
Ethereum started a downside correction below $4,050 and $4,000.
The price is trading below $4,000 and the 100-hourly Simple Moving Average.
There is a bearish trend line forming with resistance at $4,000 on the hourly chart of ETH/USD (data feed via Kraken).
The pair could continue to move down if it trades below $3,880.
Ethereum Price Dips Further
Ethereum price failed to stay in a positive zone and started a fresh decline, like Bitcoin. ETH price declined below $4,120 and $4,050 to enter a bearish zone.
There was a clear move below the 61.8% Fib retracement level of the upward move from the $3,708 swing low to the $4,252 high. Besides, there is a bearish trend line forming with resistance at $4,000 on the hourly chart of ETH/USD.
Ethereum price is now trading below $4,000 and the 100-hourly Simple Moving Average. If there is another increase, the price could face resistance near the $4,000 level and the trend line. The next key resistance is near the $4,030 level and the 100-hourly Simple Moving Average.
The first major resistance is near the $4,080 level. A clear move above the $4,080 resistance might send the price toward the $4,120 resistance. An upside break above the $4,120 region might call for more gains in the coming sessions. In the stated case, Ether could rise toward the $4,200 resistance zone or even $4,220 in the near term.
More Losses In ETH?
If Ethereum fails to clear the $4,000 resistance, it could start a fresh decline. Initial support on the downside is near the $3,880 level. The first major support sits near the $3,840 zone and the 76.4% Fib retracement level of the upward move from the $3,708 swing low to the $4,252 high.
A clear move below the $3,840 support might push the price toward the $3,750 support. Any more losses might send the price toward the $3,700 region in the near term. The next key support sits at $3,650 and $3,620.
Technical Indicators
Hourly MACD – The MACD for ETH/USD is gaining momentum in the bearish zone.
Hourly RSI – The RSI for ETH/USD is now below the 50 zone.
A cryptocurrency analyst has explained how the TD Sequential has accurately spotted XRP trend reversals over the last three months, and It has just flashed again.
TD Sequential Has Given Another Signal For XRP
In a new post on X, analyst Ali Martinez has discussed about the Tom Demark (TD) Sequential signal that has just formed for XRP. The TD Sequential is a technical analysis (TA) indicator that’s used for spotting points of trend reversal in a given asset’s price.
The indicator involves two phases. In the first of these, called the setup, it counts up nine candles of the same color on the asset’s chart. Once the nine candles are in, it signals that the price trend has reached a state of exhaustion. In other words, the asset has reached a point of turnaround.
Naturally, this signal is a bullish one if nine red candles led to the setup’s completion. Similarly, the signal is bearish if green candles were involved instead. When the setup is done, the second phase begins. This phase, known as the countdown, works much like the setup, with the only difference being that it lasts for thirteen candles. The countdown’s finish coincides with another top or bottom for the asset.
XRP has recently completed the former of the two TD Sequential setups on its daily price. Below is the chart shared by Martinez that shows this signal forming for the cryptocurrency.
As displayed in the graph, the 1-day price of XRP has formed a TD Sequential setup with nine green candles. This means that the coin could be due a reversal to the downside, at least from the perspective of the indicator.
During the last few months, the TD Sequential has given several signals for the asset, and interestingly, they have coincided quite well with local tops and bottoms. Considering this trend, it’s possible that the latest sell signal may also lead to a drawdown for the coin.
XRP isn’t the only asset that the TD Sequential has lately been reliable for. As the analyst has explained in another X post, the indicator has also called the recent swings in the Bitcoin price.
From the above chart, it’s apparent that the TD Sequential gave a sell signal for Bitcoin earlier in the day. Since then, the asset has witnessed a retrace, implying that the metric may have once again caught a trend reversal.
XRP Price
XRP has been trading sideways recently as its price is still floating around $2.62.
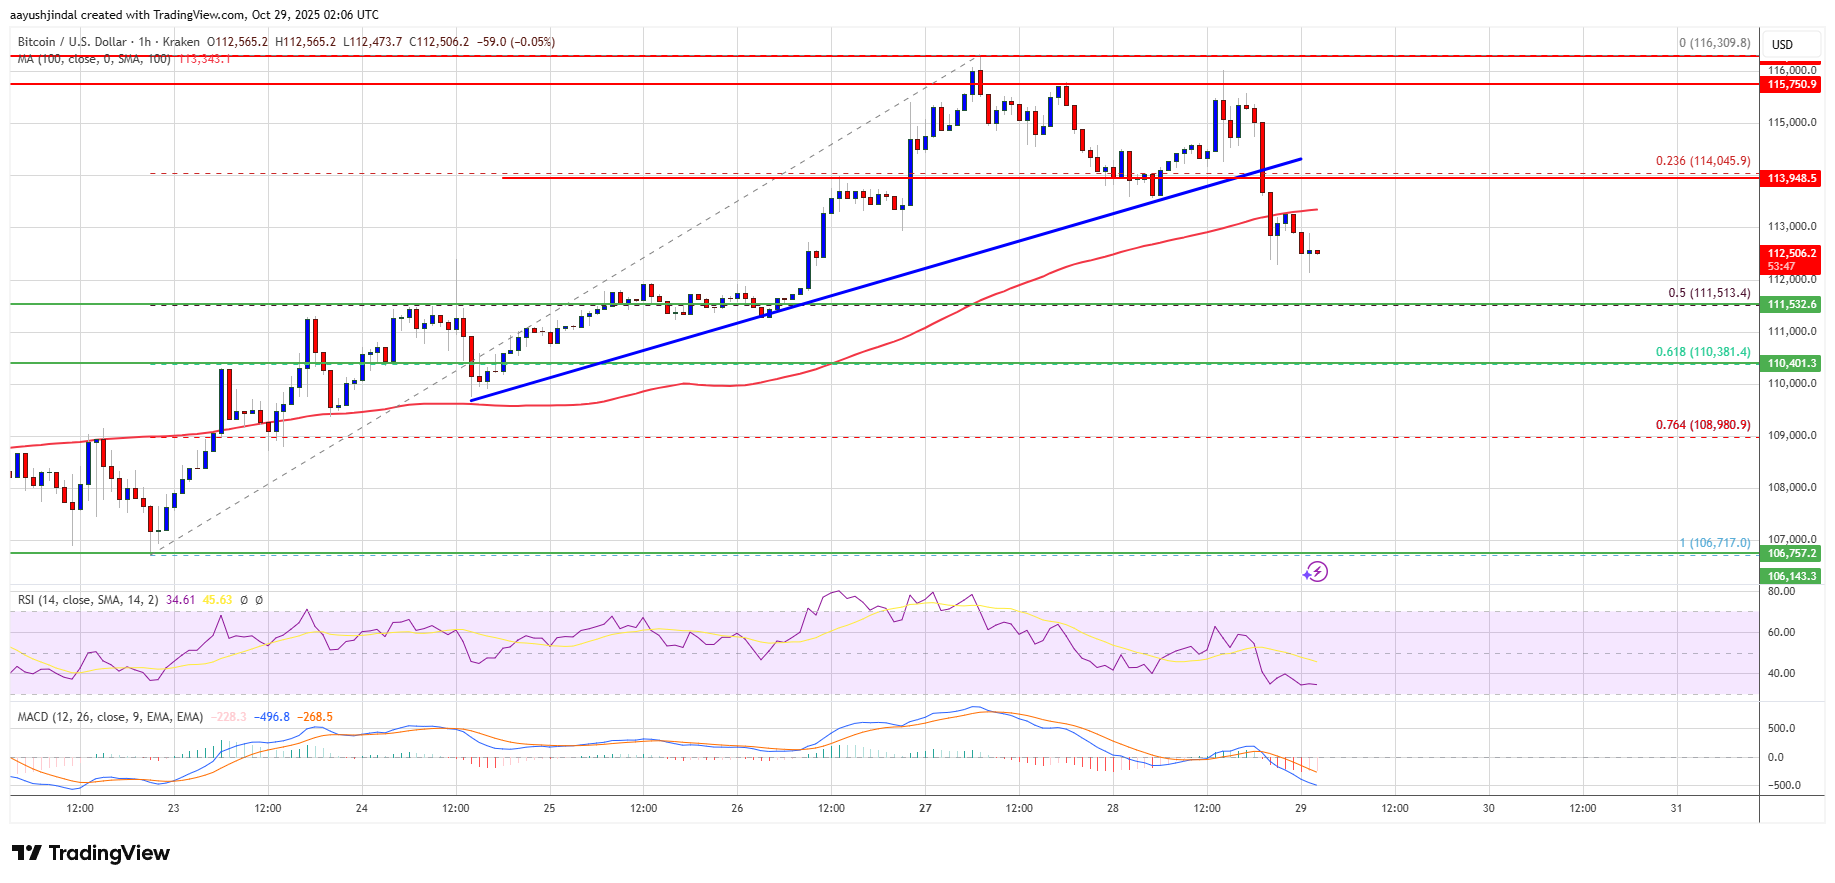
Bitcoin price is correcting gains below $112,500. BTC could continue to move down if it stays below the $112,000 resistance.
Bitcoin started a downside correction below the $112,000 support.
The price is trading below $112,000 and the 100 hourly Simple moving average.
There is a bearish trend line forming with resistance at $111,500 on the hourly chart of the BTC/USD pair (data feed from Kraken).
The pair might continue to move down if it trades below the $108,800 zone.
Bitcoin Price Dips Further
Bitcoin price failed to stay above the $113,500 pivot level and extended losses. BTC dipped below $112,500 and $112,000 to enter a bearish zone.
The decline was such that the price traded below the 61.8% Fib retracement level of the upward move from the $106,718 swing low to the $116,310 high. Besides, there is a bearish trend line forming with resistance at $111,500 on the hourly chart of the BTC/USD pair.
Bitcoin is now trading below $112,000 and the 100 hourly Simple moving average. If the bulls attempt a fresh increase, the price could face resistance near the $111,500 level and the trend line. The first key resistance is near the $112,000 level.
The next resistance could be $112,500. A close above the $112,500 resistance might send the price further higher. In the stated case, the price could rise and test the $113,200 resistance. Any more gains might send the price toward the $113,500 level. The next barrier for the bulls could be $115,000 and $115,500.
More Losses In BTC?
If Bitcoin fails to rise above the $112,500 resistance zone, it could continue to move down. Immediate support is near the $110,000 level. The first major support is near the $108,800 level or the 76.4% Fib retracement level of the upward move from the $106,718 swing low to the $116,310 high.
The next support is now near the $108,000 zone. Any more losses might send the price toward the $106,500 support in the near term. The main support sits at $103,500, below which BTC might struggle to recover in the short term.
Technical indicators:
Hourly MACD – The MACD is now gaining pace in the bearish zone.
Hourly RSI (Relative Strength Index) – The RSI for BTC/USD is now below the 50 level.
Major Support Levels – $108,800, followed by $108,000.
Crypto analyst VisionPulsed argues that Dogecoin is entering a seasonal window of strength in November—conditional on a broader “risk-on” handoff from US equities to crypto and, critically, Bitcoin maintaining support at a key moving average. In an Oct. 28 video update focused on Dogecoin, he linked the coin’s near-term upside to a now-familiar sequence: S&P strength → Russell 2000 catch-up → Ethereum breakout → DOGE momentum.
“November could be repeating itself where we get a big push in November,” he said, citing what he frames as a recurring pattern of late-October bottoms followed by November reversals in recent years. He pointed to 2022 and 2023 as examples and opened the session by noting ongoing equity optimism, quipping that “the S&P is continuing to gap up,” and that a risk-bid in stocks historically creates favorable conditions for crypto beta.
November Preview For Dogecoin
The pathway he sketches is explicit and hierarchical. “If the S&P can push higher, then the Russell 2000 may actually follow… And as we’ve said 100 times, when the Russell breaks out, that increases the chance that Ethereum breaks out. Happened in 2017, happened in 2020. And if the Russell can break out and Ethereum can break out, slap Dogecoin on there.” His Dogecoin view is framed inside a rising channel, with price “grinding upwards on the trend line” into early November before a potential acceleration toward the channel top in mid-month.
The analyst is emphatic that the setup is constructive but not a done deal. “There’s probably no big bull run just yet, but it looks bullish from here to at least December.” From there, the branching outcomes hinge on whether an altseason materializes and whether DOGE can break beyond the upper boundary of its channel.
If momentum stalls at resistance without evidence of declining Bitcoin dominance—his shorthand for capital rotating into altcoins—he warns of a familiar whipsaw: “If we come up to the top of the channel and we get stuck again… we’re going to see a crash to the bottom of the channel or at least the middle.”
In that downside branch, he cites a drawdown scenario toward the low-teens, saying DOGE could “go back to 13 cents.” In the upside branch, if an altseason ignites, he floats a run toward “80 cents, 90 cents, whatever,” with the caveat that such a surge into December could also mark a local cycle top requiring reassessment in real time.
As a gating condition across all scenarios, Bitcoin’s trend integrity remains the fulcrum. “If for whatever reason, Bitcoin breaks this moving average, then there’s no bull run at all. It doesn’t exist—we’re in a bear market. But as long as we hold a moving average… the bull run will continue.”
He analogizes the dynamic to a “blue circle” bounce on the S&P and expects a comparable moving-average response from BTC to keep the crypto risk cycle intact. The Ethereum leg is treated as both a beneficiary of small-cap equity strength and a validator for alt rotation: “If the S&P and the Russell can both push higher, that gives us a green light for Ethereum. And if Ethereum can push higher, then Doge could push higher.”
Timing is central to his thesis. He anticipates a steady “grind” into early November, a push toward DOGE’s channel top “probably in the middle of November,” and then a decisive inflection as the market either confirms altseason into December—or fails and resets with one more flush before any sustained rotation. He also leaves room for a less popular possibility: “We always have to keep our open mind to the possibility that there is no altseason… I’m the last person that wants to say that… but we’ve got to be open to the possibilities.”
VisionPulsed characterizes the current moment as tactically bullish with binary edges defined by the channel and BTC’s moving average. “I would say the top of the channel is in play as long as we hold the bottom of the channel.” The message to Dogecoin traders is ultimately conditional and sequence-driven: November offers the opening, but equities, Bitcoin trend support, and an Ethereum confirmation are the levers that must all click into place to turn an encouraging drift into a decisive breakout. As he signed off: “As always, none of this is financial advice.”
Bitget Wallet’s integration with HyperEVM, the Ethereum-compatible smart contract layer powering the Hyperliquid Layer-1 blockchain, has ignited strong momentum across the DeFi sector.
The update expands Bitget’s reach to over 80 million users, granting seamless access to Hyperliquid’s deep onchain liquidity, programmable finance features, and cross-chain transfers.
The move effectively transforms Bitget Wallet into a major gateway for $HYPE token utilities, staking, and governance.
With Hyperliquid’s Total Value Locked (TVL) now surpassing $5 billion, the Layer-1 network continues to attract institutional capital and DeFi builders, strengthening its status among top-performing decentralized platforms.
Hyperliquid (HYPE) Price Action: Bulls Eye a $50 Breakout
After a stunning 110% rebound since mid-October, Hyperliquid (HYPE) is trading around $47–$49, nearing its all-time high of $59. The bullish structure follows a breakout from a descending wedge pattern, supported by surging on-chain volume and staking rewards totaling over $90 million this month.
Technical indicators reveal a classic bull flag formation, with analysts projecting a breakout toward the $52–$55 zone if momentum holds above $48.
The Money Flow Index (MFI) remains elevated at 63, indicating continued inflows and sustained investor confidence. However, failure to clear resistance could trigger short-term retracement toward $44 support before the next leg up.
Buybacks and On-Chain Revenue Fuel Long-Term Strength
Beyond price action, Hyperliquid’s fundamentals remain strong. The project generated over $111 million in fees over the past 30 days, ranking third among all DeFi protocols by revenue.
Its new $644 million Assistance Fund Buyback program is reducing circulating supply, now 336 million HYPE, providing strong tokenomic support for long-term holders. Meanwhile, the HIP-3 upgrade, which allows new perpetual markets through staked HYPE, is drawing institutional builders and tokenized futures products.
With $1.5 trillion in cumulative trading volume and dominance in decentralized derivatives, Hyperliquid’s ecosystem continues to expand even amid growing competition from Binance-backed Aster.
If bullish momentum persists and HyperEVM adoption accelerates, analysts suggest HYPE could reclaim $55 and test new highs above $60 in the coming weeks, cementing Hyperliquid’s reputation as one of DeFi’s most profitable and innovative ecosystems.
Cover image from ChatGPT, HYPEUSD chart from Tradingview
Ethereum (ETH) is struggling to reclaim higher levels as the broader crypto market consolidates following the recent crash. Despite short-term weakness, several analysts suggest that ETH may be entering a bullish accumulation phase, with price action stabilizing around the key $4,000 level—a zone that has historically served as both strong resistance and support. The asset’s resilience amid market uncertainty reflects growing confidence in Ethereum’s long-term fundamentals and network activity.
Adding to the intrigue, on-chain data from Lookonchain revealed that an Ethereum ICO participant has re-emerged after nearly eight years of dormancy, transferring 1,500 ETH—worth approximately $6 million—to Kraken for the first time. This wallet originally received 20,000 ETH during Ethereum’s 2015 genesis sale, purchased for roughly $6,200, which would now be valued at more than $80 million.
Such rare movements from early holders often capture the market’s attention, as they can signal renewed engagement or strategic repositioning. While Ethereum’s price remains in a consolidation phase, the network’s long-term value narrative—driven by layer-2 scaling, staking growth, and DeFi activity—continues to strengthen. If the current range holds, ETH could be positioning for a recovery as market confidence rebuilds.
Dormant Ethereum Whale Awakens After 8 Years
According to a recent report by Lookonchain, an early Ethereum participant—identified as wallet 0x3690—has resurfaced after nearly eight years of inactivity, sparking renewed discussions across the crypto community. This address was one of the original Ethereum ICO wallets, receiving 20,000 ETH at genesis in 2015 for a total investment of just $6,200. At current prices, that stash would be worth roughly $80.42 million, representing an extraordinary 12,971x return.
On October 27, 2025, the wallet sent 1,500 ETH (around $6 million) to Kraken, marking its first-ever on-chain movement since Ethereum’s launch. Such activity from early holders often raises questions about investor sentiment and potential market shifts—especially as the broader crypto market remains in a fragile consolidation phase.
While the transfer does not necessarily signal an immediate sell-off, it underscores how long-term participants are beginning to reposition as Ethereum hovers near the $4,000 level. Analysts suggest that the coming weeks will be decisive for the market, as both Bitcoin and Ethereum approach critical technical and psychological thresholds ahead of the US Federal Reserve’s next policy decisions.
If Ethereum manages to hold its current range and sustain network engagement, it could confirm the start of a new bullish accumulation phase. Conversely, a breakdown below support might extend the correction before a stronger rebound forms later in the quarter. In either case, this event serves as a reminder of Ethereum’s resilience—and how early conviction in the network’s vision has yielded historic returns for those who held through multiple cycles. The market now watches closely to see whether this renewed on-chain activity signals a turning point or a moment of reflection before the next major move.
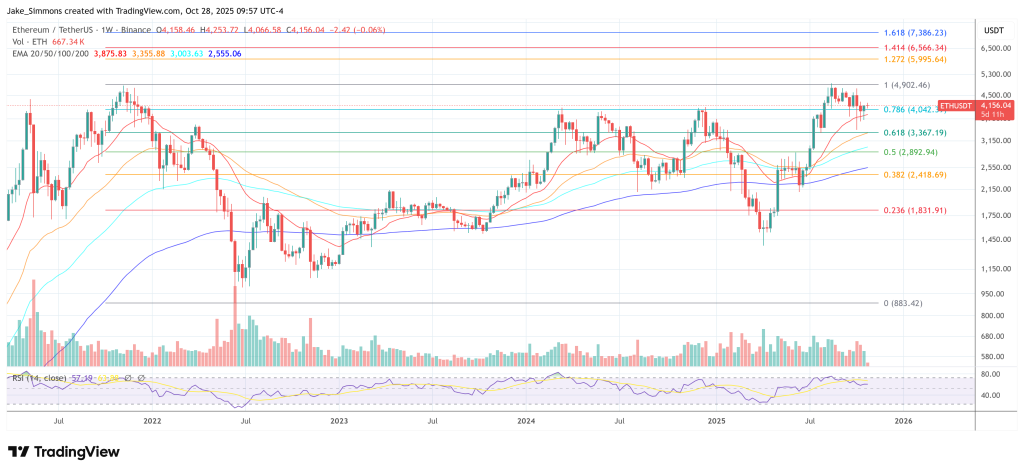
Ethereum Struggles To Break $4,200 As Consolidation Tightens Around Key Support
Ethereum (ETH) is trading near $3,993, attempting to regain strength after weeks of sideways action. The chart shows ETH struggling to break above the $4,200 resistance, a level that has repeatedly rejected price advances since early October. The 50-day moving average (blue) currently aligns with this resistance, reinforcing it as a critical barrier that bulls must clear to confirm a short-term reversal.
Below, the 100-day (green) and 200-day (red) moving averages provide solid structural support near $3,800 and $3,300, respectively. The convergence of these levels suggests that Ethereum remains in a broad consolidation range, with limited momentum on either side as the market digests recent volatility.
A decisive close above $4,200 could open the path toward $4,500–$4,700, where liquidity from previous highs remains. Conversely, a breakdown below $3,800 would expose ETH to deeper retracements toward the $3,500 zone, where buyers previously stepped in during September’s correction.
Market sentiment appears cautious but not bearish. Ethereum’s ability to hold near the $4,000 psychological level despite the broader market slowdown indicates resilience. As macro uncertainty persists, ETH’s next move will likely depend on whether buying pressure strengthens ahead of the Federal Reserve’s policy update this week.
Featured image from ChatGPT, chart from TradingView.com
On Wednesday, the Federal Reserve (Fed) announced a 25-basis-point rate cut from the previous rate of 4.25%, aligning with market expectations. Despite this bullish development being highly anticipated by top experts as the best catalyst for the remainder of the year, Bitcoin (BTC), XRP, and Ethereum (ETH) led the market downturn following the announcement.
Fed Chair Signals Uncertainty Over Further Rate Cuts
The selloff intensified after Fed Chairman Jerome Powell indicated during his press conference that another interest-rate cut in December “is not a foregone conclusion.” This uncertainty has contributed to market volatility, as both cryptocurrencies and stocks have rallied this year in anticipation of lower interest rates.
If the Fed does not implement further rate cuts in December, it could lead to a rebound in the dollar, which would be detrimental for Bitcoin bulls.
Analyst Manuel Villegas from Julius Baer noted that options-derived implied movements for US equity indices suggest significant shifts around upcoming macroeconomic reports. He advised crypto investors to prepare for potential volatility.
However, market expert Timothy Peterson provided further insights on social media site X (formerly Twitter), predicting that the Bitcoin price could rise up to 12% over the next week, meaning that the leading crypto could surge toward $123,000.
Analyst Foresees Positive Momentum For Bitcoin
In his analysis, Peterson highlighted Bitcoin’s performance surrounding Federal Reserve Federal Open Market Committee (FOMC) meetings and noted that since 2023, Bitcoin’s average movement after such meetings has been about 1.5 times its prior week’s performance.
With Bitcoin having gained 4% in the week leading up to the Fed’s decision, Peterson anticipates a subsequent increase of around 7%, with a potential range of 0-15%.
The FOMC, which sets US interest rates and guides monetary policy, often sees markets trade cautiously before meetings, followed by reactions once the uncertainty is resolved, with the expert concluding that despite the growing uncertainty, Bitcoin and the broader market could see a new leg up near record highs.
Featured image from DALL-E, chart from TradingView.com
Hedera’s much-anticipated debut on the New York Stock Exchange through the Canary Capital Hedera ETF (Ticker: HBR) marked a major milestone for the network, positioning it alongside Bitcoin and Ethereum as one of the few cryptocurrencies with a regulated U.S. spot ETF.
The listing initially sparked optimism, sending HBAR soaring over 25% to $0.2191 as trading volume jumped 328% to $1.12 billion. However, the momentum proved short-lived. Within 24 hours, HBAR has slid nearly 6%, retreating below $0.20.
Analysts attribute the decline to profit-taking and broader market caution, as technical indicators flashed mixed signals. Despite this dip, market observers say institutional participation remains strong, fueled by the ETF’s potential to unlock new liquidity streams through regulated exposure.
Hedera (HBAR) Analysts Split as “Death Cross” Looms
Data from TradingView shows that while HBAR broke above key resistance at $0.206 earlier this week, it struggled to sustain momentum.
Traders now eye support at $0.194–$0.200 and resistance between $0.210–$0.219. A decisive break above $0.21 could reignite bullish sentiment, but failure to hold current levels may lead to a correction toward $0.183.
Some analysts warn that a potential “death cross”, where the 50-day moving average crosses below the 200-day, could confirm ongoing weakness.
Historically, such formations have preceded deeper pullbacks. But others argue that the bearish pattern might already be priced in, as MACD and Aroon indicators suggest renewed upward momentum.
Technical analyst ZAYK Charts highlighted that HBAR’s current formation mirrors a bullish breakout setup seen earlier in 2025, projecting a possible 50–60% upside if buying pressure returns.
Institutional Adoption Narrative Remains Intact
Even as prices correct, institutional confidence in Hedera appears to be building. The NYSE’s multi-asset ETF launch, which also included Solana (SOL) and Litecoin (LTC) products, reflects growing regulatory clarity for alternative blockchains.
ETF strategist Eric Balchunas noted that the HBR ETF’s first-day volume hit $8 million, a promising start for a non-Bitcoin, non-Ethereum asset. Furthermore, 12 additional ETF filings from issuers like Grayscale, ProShares, and T. Rowe Price are pending, showing broader market interest.
While short-term volatility persists, analysts maintain that the HBAR ETF listing marks a pivotal moment for Hedera’s long-term narrative, expanding institutional access and setting the stage for potential recovery once macro conditions stabilize.
Cover image from ChatGPT, HBARUSD chart from Tradingview
Tron (TRX) is consolidating this week as the broader crypto market braces for the upcoming US Federal Reserve decision on interest rates and quantitative tightening (QT). Investors are treading carefully, with uncertainty surrounding whether the Fed will maintain its restrictive stance or pivot toward easing—an outcome that could shift liquidity flows across digital assets. Despite the cautious market mood, on-chain data from CryptoQuant highlights a powerful surge in Tron’s network activity that stands out from the rest of the market.
On October 27, 2025, Tron flagged one of its most significant on-chain events to date. The number of daily active addresses skyrocketed from a steady baseline of roughly 3.5 million to an astonishing 6.23 million, marking the second-highest activity ever recorded in the network’s history. This massive uptick underscores a sharp increase in network demand and utility, suggesting that users are actively engaging with decentralized applications and stablecoin transfers within the Tron ecosystem.
While price action remains in a consolidation phase, this sudden burst in on-chain participation paints a different picture—a growing fundamental strength that could position Tron as one of the few networks expanding its real-world activity amid macroeconomic uncertainty.
Fundamentals Show Strength As Tron Price Corrects
According to a recent CryptoOnchain report published on CryptoQuant, Tron’s latest on-chain surge reveals an intriguing dynamic between network activity and market price. What makes this event particularly compelling is the clear bullish divergence it forms. While Tron’s fundamentals are strengthening, its price has been steadily declining—a pattern that often precedes a reversal.
Specifically, the number of daily active addresses jumped from 3.5 million to 6.23 million on October 27, 2025, marking one of the network’s most active days ever. Meanwhile, TRX has been in a soft downtrend since August, slipping from a high near $0.36 to roughly $0.29. This divergence—rising on-chain engagement amid falling prices—suggests that market participants are underpricing Tron’s growing real-world utility.
Historically, such divergences between on-chain strength and price weakness have often acted as leading indicators for trend shifts. In Tron’s case, the data implies that network demand and user adoption are increasing faster than market sentiment reflects.
Analysts point to several possible catalysts behind this activity, including new decentralized application (dApp) launches, higher stablecoin transaction volumes, and effective user acquisition campaigns across the ecosystem.
The key factor now is sustainability. If this elevated level of activity holds through the coming weeks, it would confirm that Tron’s network growth is structural rather than temporary. Such validation could lay the groundwork for a significant bullish reversal, especially if macro conditions—like the Federal Reserve’s rate and QT decisions—shift toward easing, boosting liquidity across risk assets.
TRX Tests Key Moving Average As Bulls Defend Support
Tron’s (TRX) price is showing signs of consolidation around the $0.29–$0.30 range after an extended pullback from the August high of $0.36. The daily chart reveals that TRX has now reached the 200-day moving average (red line) — a key technical support that has historically served as a major inflection point for trend reversals. The asset briefly dipped below this level earlier in the week but has since recovered slightly, suggesting that buyers are attempting to stabilize momentum.
The 50-day (blue) and 100-day (green) moving averages are trending lower, reflecting short-term weakness after months of bullish structure. However, holding above the 200-day MA could mark the beginning of a base formation before a potential rebound. A confirmed close below this level, by contrast, would open the door for a deeper retracement toward $0.27 or even $0.25, where previous accumulation zones exist.
Trading volume remains moderate, hinting that the market is in a wait-and-see mode ahead of the US Federal Reserve’s interest rate and QT decision. If broader market sentiment turns risk-on and on-chain activity remains elevated, TRX could soon attempt a recovery toward $0.32–$0.33, reclaiming its medium-term trend.
Featured image from ChatGPT, chart from TradingView.com
TIS Inc., Japan’s largest payments processor, has moved into tokenized finance by launching a Multi-Token Platform on Avalanche’s AvaCloud, according to company announcements and industry reports.
The platform is built to support stablecoins, tokenized deposits and digital securities for banks and large firms. This is a step that could change how some institutional payments settle inside Japan.
TIS Brings Existing Scale To Tokens
According to filings and company material, TIS’s PayCierge system now handles more than ¥300 trillion in annual B2C payments. That figure could top ¥1,000 trillion if more B2B and payroll flows move on-chain, based on the firm’s internal forecasts.
TIS is not small: it handles nearly half of domestic credit card processing and supports more than 80% of branded debit accounts.
Reports show 11 of Japan’s leading 25 credit card issuers use TIS systems, which together serve nearly 200 million customers. Those ties give the new token platform a ready set of potential partners.
This is a big deal.
The company that powers ~50% of Japan’s credit card payments, TIS, just deployed on Avalanche: pic.twitter.com/kyTFSKoYdo
Avalanche’s fast finality and cross-chain tools were cited as reasons TIS can aim for real-time, programmable settlement between institutions.
The move means responsibility for the underlying cloud and node operations will be shared with the Avalanche service.
Links To Yen Stablecoins And Reserve Models
JPYC has put forward what it calls the first fully redeemable yen-backed stablecoin, claiming backing from domestic deposits and Japanese government bonds (JGBs).
JPYC has said it charges no transaction fees and that it earns revenue from JGB interest. That kind of model is one of the examples of how tokenized yen instruments might be structured on platforms such as TIS’s.
What This Could Mean For Banks And Corporates
Banks and corporations may be able to run tokenized deposits or securities on the Multi-Token Platform if they join pilots or production programs.
That said, adoption will require clear rules about backing, custody and how tokens are redeemed into yen. Some of these details are being discussed now between issuers, service providers and market observers.
Deployment has already begun in production, according to the announcements, but broad use will take time.
Featured image from Yellow, chart from TradingView
Evernorth has emerged as the latest powerhouse in institutional crypto accumulation, closing in on its ambitious XRP treasury goal. In just a few days, the firm has reached 95% of its accumulation target, marking a major milestone in XRP’s journey toward broader institutional adoption. The rapid growth of Evernorth’s reserves and its strategic partnerships has sparked renewed excitement across the XRP community, signaling what could be a pivotal shift in how institutions engage with the cryptocurrency.
Evernorth Nears $1 Billion In XRP Holdings
A new report from CryptoQuant has revealed that Evernorth’s XRP holdings is now nearing the $1 billion funding milestone, positioning it among the top institutional holders of the cryptocurrency. According to JA Maartunn, a community analyst at CryptoQuant, Evernorth currently holds 388,710,606.03 XRP, reaching 95% of its $1 billion target.
The company’s total XRP treasury is now valued at approximately $947,183,571, with unrealized profits of roughly $46 million generated in four days. This figure reflects an average purchase price of $2.44 per XRP, which Maartunn believes could become a defining price level for the cryptocurrency’s market trajectory.
Notably, Evernorth’s XRP treasury comes amid a broader trend of institutional diversification toward digital assets. Earlier this year, several major crypto treasury institutions—most notably Strategy, with its aggressive Bitcoin accumulation strategy, and The Ether Machine, with its dedicated focus on Ethereum—set the tone for large-scale crypto accumulation.
Evernorth’s expanding holdings signal a decisive shift beyond BTC and ETH, underscoring a maturing institutional demand for alternative layer-1 assets. It also suggests that XRP may become the next frontier for institutional treasuries seeking exposure to high-liquidity, regulated crypto assets.
Evernorth’s XRP Growth Strategy
Asheesh Birla, the CEO of Evernorth, introduced the treasury company last week, on October 20, through an X post. He described it as an institutional vehicle built to propel XRP’s global adoption. The announcement detailed the company’s plans to go public through a SPAC merger with Armada Acquisition Corp II (NASDAQ:AACI), targeting gross proceeds of more than $1 billion.
Evernorth’s growth strategy includes acquiring XRP through innovative financial structures designed to maximize XRP per share and expanding internationally into key markets like Japan and South Korea. The company also plans to diversify its yield generation through risk-mitigated treasury deployment. These initiatives reflect a deliberate, structured approach toward building a long-term institutional presence around XRP.
Ripple CEO Brad Garlinghouse has also praised Birla’s initiative, noting Ripple’s partnership and investment alongside prominent firms such as SBI Holdings, Pantera Capital, Kraken, GSR, and Rippleworks. Garlinghouse said that Evernorth’s participation in institutional lending, liquidity provision, and DeFi yield opportunities will be instrumental in expanding XRP’s utility. Ripple’s CTO, David Schwartz, who joins Evernorth as a strategic advisor, echoed this sentiment, expressing enthusiasm for building scalable opportunities for XRP across DeFi and capital markets.
The Bitcoin market landscape continues to evolve rapidly, with new developments emerging overnight that are reshaping short-term sentiment and long-term investor positioning across spot and derivatives markets. Price action remains steady, while on-chain and institutional signals are shifting.
What Happened With Bitcoin Over The Last 24 Hours?
In an X post, a crypto analyst, Luca, has offered insights on Bitcoin’s recent market movement. Over the past 24 hours, several notable developments in the BTC space have occurred. While BTC price action has been moving lower, funding rates have also declined, a combination that suggests long positions are being flushed out of the market.
However, Luca explains that the Open Interest (OI) has actually increased, pointing to something entirely different and signaling that bears are actively doubling down, not bulls getting liquidated. He believes that the recent drop isn’t driven by longs getting flushed, but by aggressive short positioning, as traders are trying to front-run a potential breakdown.
Historically, this kind of setup often fuels the next major move up, as excessive short exposure creates the perfect conditions for a short squeeze. A full-time crypto trader and investor, Daan Crypto Trades, has also mentioned that the Bitcoin price action, funding rate, and open interest have barely changed this month. Meanwhile, BTC has remained flat in October, despite reaching its first new all-time highs, and then BTC pulled back up to 20% lower.
Daan further highlighted that the neutrality of the funding rate has largely traded at its levels from the past two to three months, particularly dropping back to the level last seen in July, which is the only major change in the movement. This shows that leverage has been reduced, especially compared to when BTC was trading at similar prices in August and September.
Bitcoin Derivatives Market Hit The Reset Button
The Bitcoin funding flip is officially in, and it might be the signal the market has been waiting for. A popular crypto news source, CryptosRus, has revealed that a negative funding rate has just wiped the market clean. While leverage was flushed out, shorts got paid, and open interest cooled off. This is exactly the kind of deep reset the market needed, and now the sign of recovery is back in the green.
However, every time these funding rates flip from negative to positive after a deep reset, BTC starts building momentum again. BTC saw this same move in June and September, which is currently happening again. CryptosRus further noted that since October 22, the funding has been steadily climbing back above zero, but the BTC price has been consolidating. Such a combination feels like the calm before the next big move.
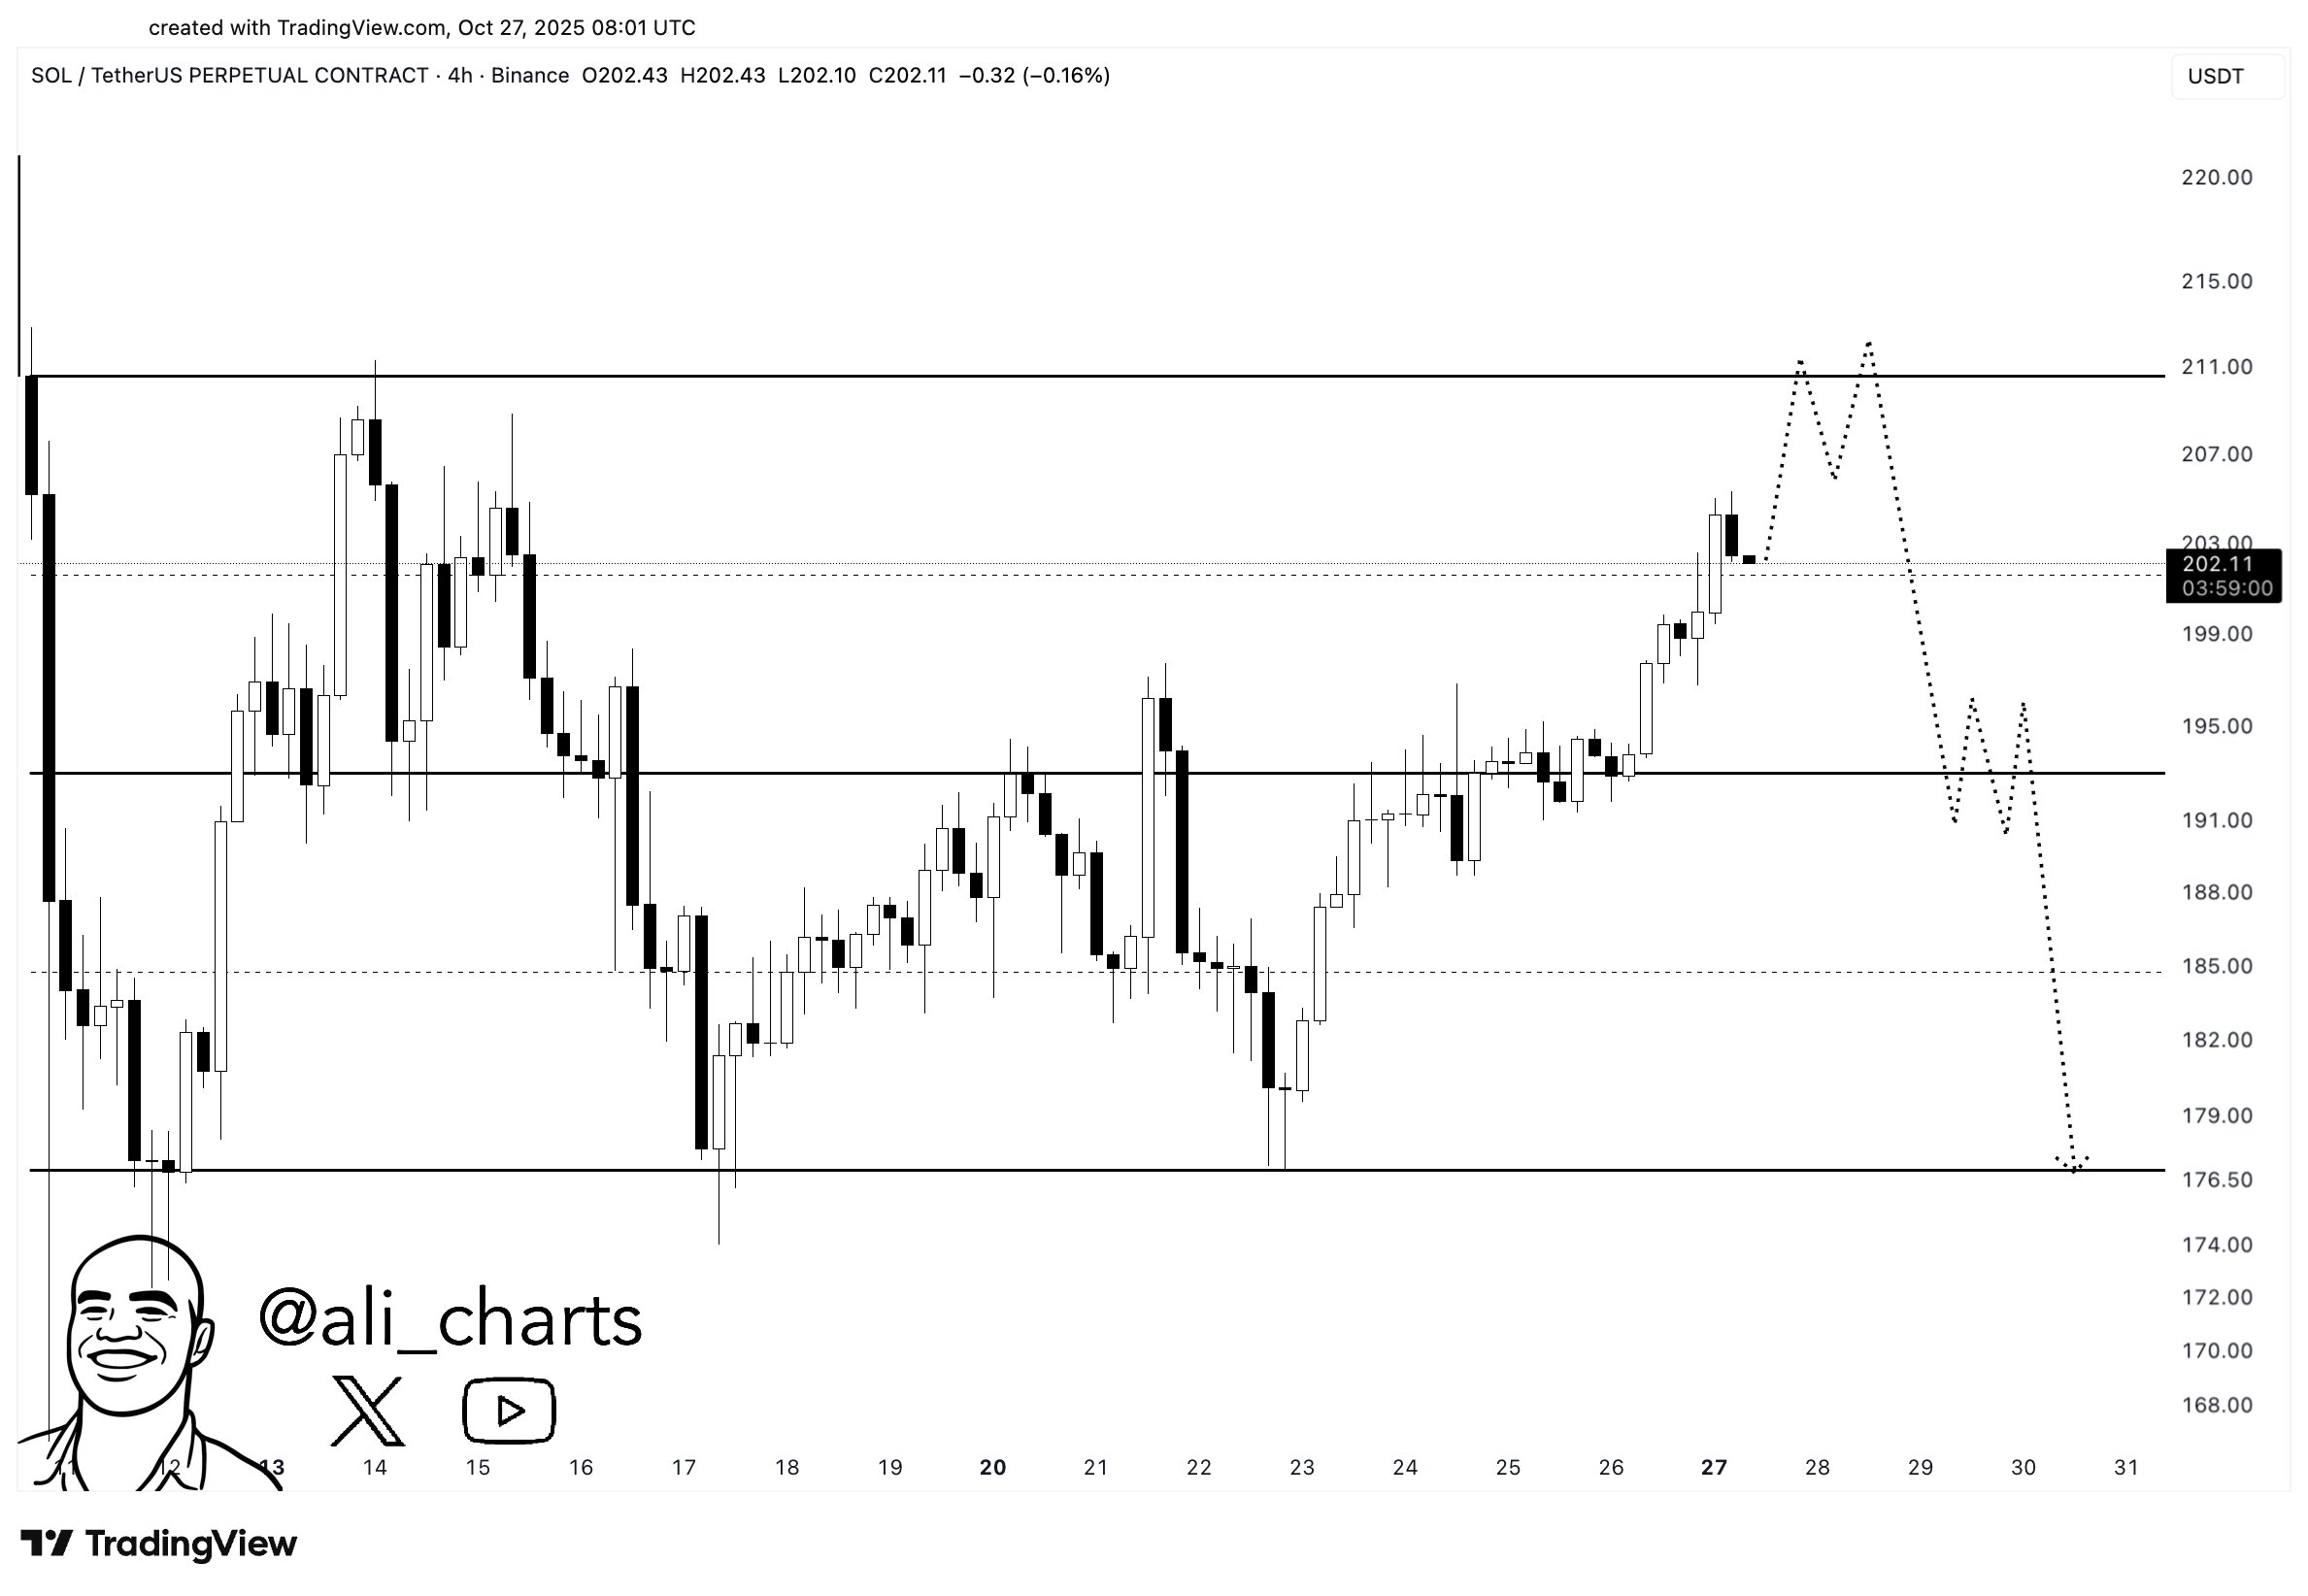
Crypto analyst Ali Martinez has cautioned that XRP may be approaching another downswing after the Tom DeMark (TD) Sequential flashed a fresh sell signal on the daily timeframe. In a new video and transcript shared alongside a TradingView chart of the Binance XRP/USDT perpetual contract, Martinez said, “XRP could be bound for a correction. The TD Sequential Indicator on the daily chart has been remarkably accurate in calling XRP’s trend reversals over the past three months, and it has just flashed another sell signal.”
Is XRP Poised For A 16%+ Drawdown?
Martinez anchored the call in a sequence of recent TD prints that he argues lined up with notable reversals. “On July 22nd, a sell signal resulted in a 24% correction. On August 8th, a sell signal led to a 17% pullback. On August 23rd, a sell signal resulted in a 13% drop. On September 15th, another sell signal preceded a 13% dip. On September 27th, a buy signal resulted in a 12% rebound. On October 22nd, a buy signal led to a 14% surge. Now, the TD Sequential Indicator just flashed a sell signal, suggesting that a pullback may be underway.”
The above chart depicts the daily candles for the XRP/USDT perpetual on Binance with TD markers annotated at the cited swing points. It shows drawdowns and rebounds close to the magnitudes Martinez lists, with boxes highlighting approximate moves of about −23.9%, −17.75%, −12.34% and −12.89% following earlier sell counts, and rebounds of roughly +12.26% and +14.25% after the late-September and late-October buy signals.
The latest candle is labeled with a new “9” sell tag near the $2.64 area shown on the chart, underscoring the analyst’s warning that the next impulse could skew lower if the pattern persists.
TD Sequential signals are timing tools, not directional guarantees, and their effectiveness is typically judged ex-post by how consistently they appear near exhaustion points. Martinez’s argument is empirical and narrowly scoped to the recent three-month sample visible on his chart, where the recorded signals coincided with local peaks and troughs to a notable degree.
The present setup therefore pivots on whether XRP respects the latest sell print as it did in July, August, and mid-September, or whether the market breaks that cadence as it occasionally does in trending environments.
Martinez is not projecting targets or durations beyond the historical analogues he enumerates, and the only explicit inference he draws is that another corrective phase is statistically plausible given the recent behavior of the TD signals on the daily chart. Based on the four most recent TD sell signals (−24%, −17%, −13%, −13%), the average drawdown is ~16.75%, which—applied to the chart’s current price around $2.64—would imply potential downside toward roughly $2.20 if the pattern repeats.
Crypto analyst Adez has revealed what most traders are missing following the Bitcoin price rally to $116,000 earlier this week. The analyst suggested there is no reason to be bullish right now, as BTC is likely to decline further before breaking out to the upside.
What Traders Are Missing From The Bitcoin Price Action
In an X post, Adez noted that the Bitcoin price pumped from around $111,000 to $115,500 and that everyone thinks a breakout is happening. However, the analyst opined that the rally was just a trap. He explained that BTC actually swept the Value Area High at $114,600, but the Cumulative Volume Delta (CVD) barely moved.
Adez further revealed that the open interest was completely flat, indicating that zero money came in for the move on Binance. The funding rate was also still at 0.01%, which is “dead neutral,” and nobody was excited about the Bitcoin price rally. In other words, he explained that the breakout happened with no institutional support, no new capital, and no retail FOMO, which is why the analyst believes the move was just a liquidity grab.
As to what happens next, Adez stated that this is a classic pattern after sweeping resistance with weak conviction, which leads to a sharp reversal. He urged investors and traders to watch the next few H4 candles to see if the Bitcoin price rejects back below $114,600, forms a lower low, and the CVD starts dropping.
For a break of structure to be confirmed, the Bitcoin price needs to break below the H1 at 114,839 and then the H4 at 113,560. Once that happens, Adez predicts that there is an 85% probability that BTC will head to the real support between $104,000 and $106,000 within seven to ten days. Notably, BTC has broken these two levels and may now be at risk of dropping to these support levels as the analyst has predicted.
Why This Price Action Is Plausible
Adez explained that this Bitcoin price action makes sense because November is historically 60% bullish and that Q4 has averaged 65% wins. However, he noted that these rallies didn’t start from thin air at $115,000. Instead, they start from value zones where institutions can accumulate before BTC rallies.
The analyst highlighted $109,000 as the point of control, while between $104,000 and $106,000 is the Value Area Low, where there are also billions in buy orders. He added that the current Bitcoin price action is floating above real support, which is exactly where smart money dumps before the real move begins.
As such, Adez expects retail to buy the breakout at $115,000 and get stopped out on the reversal. Then, they miss the real entry between $104,000 and $106,000. On the other hand, Smart Money sells into this pump, waits for the sweep down, then loads up at between $104,000 and $106,000 and rides the Bitcoin price rally to above $130,000.
At the time of writing, the Bitcoin price is trading at around $113,000, down in the last 24 hours, according to data from CoinMarketCap.
Based on reports, several asset managers have updated filings for spot XRP exchange-traded funds, naming tickers such as GXRP and XRPZ.
That regulatory activity is one of the items market watchers say is drawing attention back to XRP. At the same time, Ripple’s move to acquire GTreasury for $1 billion has been highlighted by some analysts as a step closer to the $120 trillion corporate treasury market.
Those developments, taken together, are keeping optimism alive among traders and community figures.
Analyst Claims Accelerated Timeline
According to social posts and comment threads, the analyst known as 24hrscrypto1 told followers “something big is going on” and reiterated a previously stated $100 target for XRP, while suggesting the date might come sooner than the earlier claim of by 2030.
At current trading near $2.60, reaching $100 would represent roughly a 4,000% increase from today’s level. Other commentators have offered similar high-end ranges.
Something big is going on..
All I can say is, we will see a $100 XRP way before 2030
For example, CryptoCharged COO Matthew Brienen has described a $100–$1,000 band as “highly possible” inside a five to 10 year span, citing use cases in cross-border payments.
Wealth mentor Linda Jones has used a personal example to make a point: a $100 investment once bought about 400 XRP at $0.25 each, but that same $100 today would buy fewer than 35 XRP, a detail some see as evidence of growing scarcity.
Institutional Accumulation And Supply Concerns
Some observers argue that steady buying by banks and funds has been taking place behind the scenes during volatile stretches. If large holders continue to add positions and trading liquidity thins, the market could face a supply-demand imbalance that would push prices higher quickly.
That is the basic line supporting ultra-ambitious forecasts. Yet whether institutions will hold XRP long term or use it actively in payments remains a crucial unknown that would determine how the story actually plays out.
Market Moves And Community Momentum
Social voices continue to matter. A prominent community commentator using the name UnknowDLT has described XRP as one of the major opportunities for this generation and the next, language that keeps retail interest high.
XRP will end up being one of the greatest opportunities of not only our life time, but many to come.
At the same time, volatility is real: earlier this month XRP dropped to roughly $1.20 during a broader market pullback, showing how fast gains can be wiped out when conditions change.
Reports note that approval of spot XRP ETFs may depend on regulatory timing and procedural steps at the US securities regulator.
Community watchers point to the resumption of SEC actions as a likely trigger for formal approvals, but that is not guaranteed.
The filings from Grayscale, Bitwise, and Franklin Templeton have been updated, yet market access will only expand once regulators sign off.
Featured image from Gemini, chart from TradingView
Dogecoin shows potential for $0.22 as whales move millions in $DOGE ahead of the coming FOMC meeting.
Some analysts point to a $0.248 price point if $DOGE breaks out of the symmetrical triangle pattern.
House of Doge becomes majority stakeholder in the Italian soccer team US Triestina Calcio 1918, which expands on $DOGE’s real-world utility.
Maxi Doge ($MAXI) reaches $3.8M in presale, promoting no-stop-loss trading and YOLO entries at 1000x leverage.
Dogecoin remains bullish, according to analysts, despite a 4% drop over the last 24 hours, which suggests a potential breakout to $0.22 if momentum recovers in Q4.
Since then, the coin has struggled to regain momentum, but failed to consolidate in the green, partly because Bitcoin has also failed to do so. $BTC also failed to retain momentum above $115K on three different occasions and is now trading at $112.6K on a 2.46% 24-hour loss.
Despite this bearish performance, the market is confident in $DOGE’s Q4 performance, and Maxi Doge’s ($MAXI) $3.8M presale could contribute to that.
Can $DOGE Reclaim $0.22?
$DOGE shows signs of a bullish tendency, which could support a push to $0.22 if momentum begins to build.
Analysts like Trader Tardigrade go even farther than that, suggesting a price point of $0.248 in case of a breakout from the Symmetrical Triangle pattern.
But how is a breakout possible considering $DOGE’s somewhat bearish recent performance, which largely stems from massive sells? As analyst Ali points out, whales sold over 500M $DOGE over the past week.
The answer is that this is a problem of perspective. While some whales sold in bulk, others started their accumulation phase. As Onchain Lens noted, one whale wallet withdrew over 15M $DOGE from Binance, worth $2.95M. Only sold $1,450-worth of tokens.
This type of whale activity is usually a sign of consolidation in preparation for a coming bull phase, and $DOGE’s chart performance shows exactly that.
With the coin now at $0.1936 and whales making massive moves ahead of the coming FOMC meeting, we expect a momentum buildup into November. A breakout above $0.20 could fuel a more consistent push to $0.22 and above.
The hints are there, especially with $DOGE’s 24h trading volume, which is now 33.75% in the green. It was over 60% earlier today, suggesting increased investor movements. The price remained stable throughout, which suggests that something significant may be on the horizon this week.
And let’s not forget House of Doge’s decision to acquire a majority stake in the Italian soccer team, US Triestina Calcio 1918, which expands on $DOGE’s real-world utility, adding even more legitimacy to the mix.
Long-term, $DOGE will likely break above $ 0.25, especially with projects like Maxi Doge ($MAXI) adding more flavor to the market.
How Maxi Doge Makes Trading Fun
Maxi Doge ($MAXI) turns trading into a big boy’s game, where only the toughest can survive.
The Maxi Doge philosophy is simple, and it fuels the entire ecosystem: retire at 22. There are no shortcuts, excuses, or barriers to overcome. Everything proceeds in a straight line with no Plan B or safety nets.
This explains why Maxi Doge trades at 1000x leverage, buys green candles, and chases pumps while on a diet of Red Bull and Maxitren 9000.
Maxi Doge presents itself as the solution to moderate, lukewarm trading and offers unhinged investing as the alternative.
The solution is in your face:
Maxi Doge embodies sheer willpower: lift, trade, repeat. The $MAXI community channels that energy, sharing leveraged strategies, competitions, and meme-driven camaraderie to unlock maximal gains together.
The presale has been performing very well recently, raising over $3.8M as investors took notice and succumbed to the FOMO fever. $MAXI now trades at $0.0002655, making this an ideal time to invest, considering the project’s potential and meme impact.
If $MAXI can replicate even a fraction of $DOGE’s 34,441% all-time ROI, we’re looking at a slam dunk.
Don’t take this as financial advice. Do your own research (DYOR) before making an investment.
A crypto commentator is once again discussing how the United States may use XRP in a key plan. According to his post, XRP could one day reach very high prices and still be small compared to the US national debt. He suggests crypto could one day help solve the country’s money problems and tells people to hold four digital assets that he believes are important for the future. He says he has known about these ideas for a long time and is reminding the public again.
Crypto Pundit Says XRP At $1,000 Is “Peanuts” For US National Debt
The crypto commentator, known as The Real Remi Relief on X, is sharing a NewsMax video about using XRP to help clear the US national debt. In the X post, he simply says that $1,000 per XRP is “peanuts,” suggesting he thinks XRP’s value could be much higher if this idea becomes reality. The US national debt is enormous, totalling $37.8 trillion, and even at high XRP prices, it would still be small compared to the money the country needs.
The Real Remi Relief also says he has talked about this idea before, as he tells his followers to remember what he said back in December 2024. At that time, he said leaders were considering using crypto in a new way and shared all the information he could, though some he couldn’t discuss openly. The pundit hints that big decisions may involve XRP in a significant role tied to the US national debt.
The crypto commentator believes the public should pay attention because this idea could change how the United States handles its money. He believes that XRP at $1,000 is still cheap if it helps solve the trillion-dollar national debt, and crypto holders should be watching closely to see what happens next.
“Just Stack The Fantastic 4,” Pundit Advises Holders
The Real Remi Relief also tells crypto users to prepare for the future. The crypto pundit strongly suggests that something important is happening behind the scenes, possibly involving XRP and other valuable assets.
He calls these assets the “Fantastic 4.” These include XRP, XLM, XDC, and HBAR. The post suggests that these four assets will be critical in the future if the United States begins using digital money systems more widely. The pundit repeats that crypto holders should consider these assets now, not later.
He also gives safety advice in the X post. He asks holders to store their XRP, XLM, and HBAR in a cold wallet to keep their crypto safe offline. He says people should stack and protect these assets because they may appreciate if the US turns to crypto to address its financial problems.
Technical analyst Charting Guy has shared a new perspective on the relationship between XRP and Ethereum, identifying a setup that he believes could lead to short-term XRP outperformance.
His analysis, which was posted on the social media platform X, focuses on the XRP/ETH weekly chart, where he highlighted the formation of a bullish divergence that has not appeared since mid-2024. The development, he says, signals a constructive shift in momentum that will favor XRP’s price action over Ethereum for the next three months.
A Rare Weekly Bullish Divergence Favors XRP Over Ethereum
In his update, Charting Guy explained that the XRP/ETH weekly Relative Strength Index (RSI) was previously rejected but has now reversed into a bullish divergence. The RSI has turned upward from a low region, while the price closed at a lower low last week, which is a tell-tale sign of waning selling pressure and XRP building strength against Ethereum.
This green-marked divergence on the analyst’s XRP/ETH chart, which is shown below, mimics a setup that preceded another major swing in XRP’s favor. The yellow RSI moving average has also started to flatten, and this is another signal that momentum could be stabilizing before a breakout.
The last time this same configuration occurred was in June 2024, just before XRP began a multi-month surge against Ethereum. Back then, the XRP/ETH pair rose from 0.00015 to as high as 0.0003 in August 2024, before retracing and then finally picking up again in November 2024.
The pattern outlined by the analyst shows XRP/ETH currently consolidating near the 0.00063 ratio level. This time, the setup looks equally compelling. The RSI’s upward curve points to market participation on the XRP side, while Ethereum’s relative momentum continues to slow. If the pattern repeats, it could mark the start of another short-term cycle of the token strength against ETH.
Short-Term Projection Favors XRP
As shown by the projection drawn in blue on the chart above, Charting Guy visualized a scenario where XRP climbs sharply relative to Ethereum. The projection uses the performance of the pair between July 2024 and March 2025 to predict the next move. From here, the projection places the XRP/ETH pair trading above 0.00015 by March 2026.
He concluded his analysis by stating, “I am VERY bullish on $XRP > $ETH the next 3 months.” His three-month forecast implies that XRP could regain a leadership position among major altcoins during the next quarter. If the token manages to outperform Ethereum as predicted, it will close the gap in their market cap.
At the time of writing, XRP is trading at $2.64 with a $158 billion market cap. Ethereum, on the other hand, is trading at $4,025 with a $486 billion market cap.
Dogecoin moved past the $0.20 mark as crypto markets showed a mild rebound. According to market feeds, DOGE traded around $0.20261 at one check, and later reached $0.21 after a small uptick. Bitcoin was holding above $114,000 and Ethereum hovered above $4,200, giving the rally some broader support.
Dogecoin Whale Purchases Spark Buying
According to reports, large holders bought more than 327 million DOGE in the last 24 hours. That wave of big trades coincided with trading volume that rose about 10% above weekly averages.
The latest move signals stronger than usual activity. The purchases were picked up by on-chain trackers and have been pointed to as a likely reason for the recent price movement.
Technical Setup Points To A Tight Range
Based on reports from chart watchers, Dogecoin is trading inside a symmetrical triangle — a pattern that usually means price is being squeezed and could break out in either direction.
The Relative Strength Index stood at 58, which suggests the coin is neither overbought nor oversold. The MACD line is above its signal line, and the histogram shows modest upward momentum, though analysts caution it is not yet a strong surge.
Key Levels To Watch
Traders say a clear move above $0.22 would be the first sign that the bulls are in charge. On the upside, some market watchers list $0.25 as the next meaningful barrier, and a run toward $0.26+ has been floated as a possible target if momentum builds.
On the flip side, a drop below $0.18 could open the door to further losses and bring the consolidation phase back into focus.
Market Sentiment Remains Mixed
Reports have disclosed that DOGE advanced 1.35% to $0.21 during the session, marking its first close above the $0.2026 resistance level since August.
Still, a number of indicators suggest the move is tentative. Volume gains and whale interest are positive signs, but analysts are waiting for confirmation from price action and higher volume on a breakout.
What Could Go Wrong
There are risks. The triangle pattern can break to the downside as easily as it can break up, and the current momentum readings are moderate rather than strong.
If selling pressure mounts or if large wallets begin to shift coins back to exchanges, gains could be reversed quickly. Also, wider market swings in Bitcoin or Ethereum would likely pull DOGE along.
Watch The $0.22 Line
In short, DOGE is showing early signs of life, but a decisive outcome is not yet clear. Traders should watch $0.22 closely; a clean break with above-average volume would increase the odds of a move toward $0.25 and beyond.
If that level does not hold, the market may settle back into the $0.18–$0.22 range for a while longer.
Featured image from Unsplash, chart from TradingView
Wintermute, one of crypto’s largest market makers, struck an overtly risk-on tone in a Monday market update on X, arguing that a dovish macro turn and thawing US–China tensions have reset positioning and liquidity into a friendlier Q4 regime. In a post dated October 28, the firm wrote that “risk appetite is returning as softer CPI data and improving Trump-Xi relations lifted markets, with yields easing and volatility declining,” adding that “Bitcoin reclaimed $115k on ETF inflows and short squeezes, while DeFi and AI sectors led the recovery.”
Wintermute’s Bullish Crypto Outlook For Q4
The desk framed the impulse as both macro- and microstructure-driven. On the macro side, Wintermute pointed to “a softer US CPI print (3.0% YoY vs 3.1% expected)” and “the announcement of a Trump-Xi summit in Seoul,” which it said catalyzed “a broad rebound across assets” as the S&P 500 gained 1.9%, the VIX hovered “around 16,” and Treasury yields eased with rate-cut odds firming into this week’s Federal Reserve meeting.
On the crypto side, the update said “Bitcoin performed well with a 5.3% gain, climbing above $115k… amplified by $160m in short liquidations,” while “Ethereum tracked higher toward $4,200,” and “gold unwound nearly 7% from its highs, signaling a rotation from defensive assets into risk assets.”
Wintermute characterized the advance as broadening beneath the surface. “DeFi and AI names led gains on strong protocol revenue prints and improving on-chain activity,” while “Utilities and Tooling benefited from infrastructure-related rotation as new L2 deployments and restaking primitives drew liquidity.”
Derivatives posture turned supportive, too: “On the perp side, funding rates turned positive again across most majors… though positioning remains far from crowded.” The firm also flagged a turn in base money for crypto beta: “Stablecoin supply is ticking higher for the first time since September, reinforcing that macro tailwinds are beginning to translate into fresh inflows.
Spot demand from US spot ETFs, according to Wintermute, continues to anchor the structure even as activity cooled. “US spot BTC ETFs absorbed moderate inflows through the week even as volumes thinned, underscoring sticky structural demand.” Meanwhile, derivatives leverage “is rebuilding at a measured pace after the early-month flush,” which the firm framed as healthier—“cleaner leverage and more balanced funding.”
The house view into November is unambiguously constructive and leans on seasonality and positioning. One passage distilled the stance: “While Uptober had a bit of a false start, macro tailwinds, cooling inflation, ‘stabilizing’ geopolitical tension and a dovish FED are setting the stage for a supportive rest of the year, which historically (Q4) has been the strongest for Bitcoin.”
In its closing summary, Wintermute reiterated that “positioning is cleaner, volatility subdued, and capital rotation is gradually steering toward crypto. With liquidity conditions improving and sentiment stabilising, the setup into Q4 remains constructive, favouring further risk-on continuation.”
A Decisive Week For Crypto
The note drew immediate amplification from market commentators. DeFi analyst Ignas compressed the message into a trading takeaway: “Wintermute is telling you to max bid,” citing “yields… easing, volatility… down, and BTC reclaimed 115k helped by ETF inflows and short squeezes.” He highlighted Wintermute’s own line that “macro tailwinds, cooling inflation, ‘stabilizing’ geopolitical tension and a dovish FED are setting the stage for a supportive rest of the year.”
Whether this marks an outright regime shift or a tactically favorable window will hinge on this week’s event risk—namely the Fed decision and any concrete outcomes from the Trump–Xi engagement.
Wintermute, however, is explicit about the current state of play: markets are “rotating back into risk” with “cleaner positioning” and “calmer volatility,” Bitcoin “has reclaimed early-October losses with steady ETF inflows,” and sector leadership in DeFi and AI is consistent with an early-risk rotation. “With cleaner positioning, calmer volatility, and better macro visibility, the setup into November looks healthy for further recovery and rotation across crypto,” the firm concluded.
At press time, the total crypto market cap stood at $3.78 trillion.
Smart money is flowing into utility-focused presales ahead of altcoin season.
$XRP is once again ignoring the broader market while Bitcoin and Ethereum decline red.
Currently hovering above $2.65 with a cheeky 1.5% gain, $XRP didn’t get the memo that everyone else is having a bad time.
According to crypto expert CRYPTOWZRD, $XRP needs to stay above the $2.62 support level, as breaking through the $2.75 resistance could lead to a surge toward $3.
$XRP whales are accumulating at levels we haven’t seen before. While retail investors are doom-scrolling through red candles, smart money is quietly loading its position.
If you’re not positioning yourself in the best altcoins to buy now, you might be late to the party. Again.
While everyone’s watching $XRP test support levels with the focus of a hawk, let’s discuss three presale altcoins that could surge during this altcoin season.
1. Best Wallet Token ($BEST) – The Infrastructure Play Whales Are Quietly Loading
Prioritize hardware support, swaps/bridges, EVM + non-EVM, and strong security (audits, phishing alerts, biometrics, social recovery/MPC). Skip custodial risk and outdated add-ons, choose speed, safety, and full control.
Best Wallet is more than a wallet; it’s a comprehensive DeFi and NFT hub with a presale launchpad on the horizon. It speaks multi-chain fluently, which matters when altcoin season arrives and every chain comes to life.
Remember juggling seven wallets last cycle? Yeah—Best Wallet turns that chaos into one clean, connected stack.
Best Wallet token ($BEST) holders get exclusive access to early presale opportunities, reduced trading fees, and governance rights over which projects get featured on the platform. It’s a VIP pass to the hottest club filled with degens, and the bouncer is a smart contract.
Currently in presale at $0.025865, the token has already raised over $16.7M from investors who clearly understand that infrastructure plays win in bull markets, including a $33K buy in just 10 hours ago.
When $XRP finally rips past $2.75 and sparks the altcoin feeding frenzy, you’ll want a wallet built for chaos. Best Wallet is that stack, multi-chain, fast, and battle-ready. Get in early, and you’re positioned if volumes explode at launch.
2. Bitcoin Hyper ($HYPER) – The Layer 2 That Finally Makes Bitcoin Usable
Bitcoin is painfully slow with just 3-7 transactions per second. We’ve all been there, waiting 30 minutes for a transaction to confirm while watching the crypto market move without you, like you’re stuck in traffic while everyone else is already at the party.
Bitcoin Hyper ($HYPER) decided that wasn’t good enough and built a Layer 2 rollup for Bitcoin.
Bitcoin Hyper fuses Solana’s SVM with Bitcoin’s battle-tested security. Think Bitcoin’s trust with Solana-level speed: near-instant finality, tiny fees, and the same hard security that made BTC the OG.
The $HYPER token is currently in presale at $0.013185, and the project has already raised over $25.1M. Whale buys of $379.9K and $274K show that smart money is recognizing that Bitcoin needs scaling solutions and Bitcoin Hyper is actually delivering.
The tokenomics are refreshing, with 30% allocated to development, as it appears they genuinely want to build something. Novel concept in crypto, I know.
The presale is structured in stages with price increases as it progresses, so early birds genuinely do get better entry points. Learn how to buy Bitcoin Hyper before the next price increase.
Staking is available from day one, and with Bitcoin’s dominance likely to remain strong, regardless of what happens in the altcoin market, $HYPER offers a solid hedge that still provides sweet presale upside potential.
3. DeepSnitch AI ($DSNT) – The Intelligence Edge That Separates Winners from Exit Liquidity
Wouldn’t it be nice to know what the whales are doing before everyone else does? That’s exactly what DeepSnitch AI is building, and it’s about time someone did this properly.
DeepSnitch combines artificial intelligence with blockchain surveillance tools to provide regular traders with the same insights that whales and institutions have been using for years.
Five AI-powered tools analyze wallet movements, identify accumulation patterns, detect suspicious activity, and provide a heads-up when smart money is making moves.
The DeepSnitch AI token ($DSNT) is currently in Stage 2 presale at just $0.02032, having raised over $476K. That’s dirt cheap for a project with actual utility that solves a real problem.
When $XRP finally breaks through $2.75 and altcoin season goes nuclear, having DeepSnitch AI in your toolkit means you’ll see the next wave coming before most people realize there’s a wave at all.
$XRP is testing support while whales stack sats and experts call for a potential run to $3. Whether you’re betting on $XRP to break through or hedging your bets with high-potential presales, position now or cry later.
Best Wallet token gives you the infrastructure, Bitcoin Hyper gives you the Bitcoin upside with actual functionality, and DeepSnitch gives you the intelligence edge.
If there was ever a time to position yourself for the next leg up, it’s probably now.
After a turbulent month, the Dogecoin price looks to stabilizing just around the $0.2 level, and it continues to show strength at this level. However, there are some developments on the meme coin’s chart that suggest that there could be some bearish headwinds that could lead to another crash. Crypto analyst MyCryptoParadise outlines this in a recent analysis, showing the possible directions that the Dogecoin price could be headed in as the market unfolds.
Dogecoin Price Is Facing Strong Resistance
The first thing that stands out is that the crypto analyst explains that the Dogecoin price is already seeing a lot of resistance, especially on the 4-Hour chart. Since the price was rejected below $0.21, it suggests that bears are already putting a lot of pressure on the price at this level.
Another interesting chart is the Dogecoin 1-Hour chart that shows a breakdown in the Rising Wedge. The fact that this breakdown occurred with bearish divergence increases the possibilities of a price decrease, pushing it back down toward the next major support.
The crypto analyst also shows that this downward move is still supported by the confluence that has shown up. On the Dogecoin 1-Hour chart, the 200EMA has also been acting as a dynamic resistance, adding more pressure to an already bearish chart.
From here, the crypto analyst advises investors to be cautious before entering into the meme coin. For the best time to enter, it is best to wait for the price breakdown toward lower levels before taking a position. If the current trend plays out, then it could see another 10% breakdown.
In the event of this breakdown, then the next major level lies just above $0.18, which is where support is piling up. A cleaner bearish candlestick pattern would ensure an entry with lower risk, before the Dogecoin price begins another bounce.
However, just like with any setup, there is still the possibility for invalidation and this time, the bulls could do it. The Dogecoin price would have to break out and make a candle above the resistance zone on the 4-Hour chart. Such a sustained break would invalidate the bearish setup and create room for a bullish continuation.
The second part of the year has seen a notable surge in the US stock market, while Bitcoin (BTC) and the broader cryptocurrency market has faced its share of uncertainty and significant corrections.
With the Nasdaq recently surpassing the 26,000 mark, leading analysts are now suggesting that this milestone could be a clear indicator for Bitcoin to finish the year at new highs.
What Historical Patterns Indicate
According to experts at The Bull Theory, the pattern observed with the Nasdaq reaching all-time highs typically suggests a flow of liquidity, an increased risk appetite, and a shift of capital into growth assets. As this phase develops, it often sets the stage for Bitcoin’s next significant movement.
Data compiled by the analysts supports this assertion. Historically, in the first 30 days following a Nasdaq all-time high, Bitcoin has averaged a gain of approximately 7%. This return tends to grow, reaching about 14% within 60 days and climbing to an average of 25% by the 90-day mark.
This pattern is not merely coincidental; it reflects a capital rotation where liquidity does not disappear but instead shifts from traditional markets into higher-risk assets like Bitcoin.
The current situation appears to follow a similar trajectory. The Nasdaq’s rise to 26,000 indicates a wave of liquidity building beneath the surface. With rate cuts beginning and quantitative tightening coming to an end, global capital is once again seeking yield.
This scenario mirrors the conditions that contributed to Bitcoin’s significant breakouts in previous years, particularly in 2017, 2020, and 2023.
As such, the analysts note that the next four to five months may represent an acceleration phase for Bitcoin, coinciding with a potential pause in equities, which could lead to crypto becoming the primary outlet for liquidity.
Bitcoin Poised For Breakout Similar To 2020-2021 Cycle
Analysts like Ash Crypto also noted on social media that the BTC/NASDAQ weekly chart is revealing a repeating pattern reminiscent of the 2020-2021 cycle, during which Bitcoin significantly outperformed traditional tech stocks. In both cycles, the October to March timeframe has historically prompted major upward movements.
After a period of consolidation within a rising wedge, the BTC/NASDAQ pair appears poised for another breakout. Should this pattern repeat, Bitcoin may see substantial gains compared to the Nasdaq in the fourth quarter and into early 2026, Ash Crypto noted.
Notably, this sets the stage for a major rally that could see Bitcoin prices surpassing current records of over $126,000. However, the market is still characterized by increased volatility, and there is no clear path ahead for BTC.
The leading cryptocurrency is trading at $113,350 after a 2% correction in Tuesday’s trading session, following an initial surge above $115,000. This puts BTC 6.5% below record highs.
Featured image from DALL-E, chart from TradingView.com
Following the recent launch of multiple crypto ETFs, Bitwise Asset Manager’s CIO has forecasted a bright future for the firm’s Solana Staking Exchange-Traded Fund (ETF), as investors show strong initial interest in the investment product.
Bitwise Solana Staking ETF Sees Strong Start
On Tuesday, Bitwise CIO Matt Hougan predicted that the Bitwise Solana Staking ETF (BSOL) could attract significant institutional interest and become one of the leading investment products based on digital assets.
Hougan argued that Solana is “one of the most exciting crypto investment opportunities that exists today,” as it records “the most revenue of any blockchain.” He explained that institutional investors “love” both ETFs and revenue, which suggests that these investors will “love Solana ETFs.”
Bitwise’s CIO previously pointed out that there must be fundamental reasons for investors’ interest in investment vehicles such as ETFs and Digital Asset Treasuries (DATs), signaling that Solana has them. Therefore, he has “a feeling the Bitwise Solana Staking ETF, BSOL, is gonna be huge.”
Ahead of the launch, ETF Expert Eric Balchunas predicted that the first day volume for Bitwise’s Solana ETF could surpass the $50 million mark. Notably, the firm’s spot Bitcoin ETF (BITB) and spot Ethereum ETH (ETHW) recorded $237.9 million and $204 million on their first day, respectively.
Hougan has highlighted that Solana’s market capitalization is 1/20th the size of BTC and less than 1/4th the size of ETH. Based on this, the volume for an SOL ETF is expected to be smaller than that of ETFs based on the two leading crypto assets.
According to data shared by Balchunas, BSOL recorded an impressive volume of $10 million in the first 30 minutes of trading, hinting at initial demand. This amount surged to approximately $33 million by the half-day mark and hit $56 million by the end of its first trading day.
According to the analyst, BSOL had a strong start, noting that its “$56m is the MOST of any launch this year.. More than XRPR, SSK, Ives and BMNU.”
Crypto ETFs Launch Amid Government Shutdown
BSOL was among the crypto ETFs launched on October 28 despite the US government shutdown. As reported by NewsBTC, Bitwise, for its Solana Staking ETF, and Canary Capital, for its spot Litecoin (LTC) and Hedera (HBAR) ETFs, filed 8-A forms on Monday to launch the investment products this week despite the government shutdown.
Notably, the Securities and Exchange Commission (SEC) was set to approve over a dozen altcoin ETFs between October and November after delaying the decision deadline and releasing new generic listing standards for the products.
However, investors expected that the long-awaited green light would be delayed until the end of the government shutdown. Journalist Eleanor Terret explained that the launch was possible because an open government isn’t required and the 8-A filings are “just as important” as the S-1 forms, as they formally register ETF shares under the Securities Exchange Act of 1934.
As a result, after the NYSE certified all the filings for the ETFs, they could start trading on Tuesday. Meanwhile, Grayscale’s Solana Trust (GSOL) will convert into an ETF on Wednesday.
Global financial services company Western Union is making a strategic move into the world of stablecoins, responding to the evolving landscape created by the recent passage of the GENIUS Act in the US.
On Tuesday, the company announced its intention to launch the US Dollar Payment Token (USDPT), a new stablecoin, alongside its Digital Asset Network designed to integrate digital and fiat currencies.
Western Union New USDPT Stablecoin
Built on the Solana (SOL) blockchain and issued by Anchorage Digital Bank, USDPT aims to broaden the options for transferring money for customers, agents, and partners, while also bolstering Western Union’s treasury capabilities.
Through this initiative, the company plans to provide users with access to digital assets, allowing them to send, receive, spend, and hold USDPT with ease, supported by Western Union’s global compliance and risk management framework.
Devin McGranahan, President and CEO of Western Union, expressed the company’s commitment to harnessing emerging technologies to empower customers and communities.
“As we transition into the digital asset space, USDPT will enable us to take ownership of the economics associated with stablecoins,” McGranahan stated.
He also highlighted the significance of the Digital Asset Network, which aims to simplify cash off-ramps for digital assets by partnering with wallets and wallet providers, thereby allowing seamless access for customers via Western Union’s extensive global network.
Western Union anticipates that USDPT will launch in the first half of 2026, with plans for users to access the stablecoin through partner exchanges, ensuring broad availability and user-friendliness.
Stablecoins To Reduce Reliance On Traditional Banking
During Western Union’s third quarter of the year earnings call last Thursday, McGranahan revealed that the company has initiated a pilot program utilizing stablecoins for value transfer.
He noted that this pilot aims to leverage blockchain technology and stablecoins to decrease reliance on traditional correspondent banking systems, which will help shorten settlement times and enhance capital efficiency.
Historically, Western Union has maintained a cautious approach towards crypto, primarily due to concerns regarding volatility, regulatory challenges, and customer protection.
However, with the enactment of the GENIUS Act, McGranahan indicated that new opportunities are emerging for integrating digital assets into the company’s operations, enhancing efficiency, reducing friction, and ultimately improving the customer experience.
Western Union facilitates the transfer of billions of dollars annually, boasting a market capitalization of over $2.9 billion as of October 28, and generating more than $1 billion in adjusted revenue in the third quarter of the year alone.
Despite the announcement, SOL’s price has failed to react positively, currently attempting to hold the $200 line as the cryptocurrency’s next short-term support.
Featured image from DALL-E, chart from TradingView.com
On-chain analytics firm Glassnode has revealed a Bitcoin price range that defines the current battleground between recent buyers and profit-takers.
Bitcoin Cost Basis Distribution Shows Where Resistance & Support Are Strongest
In a new post on X, Glassnode has talked about where support and resistance levels lie for Bitcoin based on the Cost Basis Distribution (CBD). This indicator basically tells us about the total amount of supply that last changed hands at the various price levels that the cryptocurrency has visited in its history.
Below is the chart shared by the analytics firm that shows the trend in this metric over the last few months.
As is visible in the graph, the CBD highlights two levels for holding a dense amount of the cryptocurrency’s supply (shaded in red). The lower of these levels is situated near $111,000. A large chunk of buying at this mark occurred during the recent bearish phase in the asset.
The other level is located around $117,000, made up of investors who bought during the price rally to the all-time high (ATH). Naturally, these buyers would be underwater right now, while those who purchased at $111,000 would be in profit.
Generally, holders are sensitive to retests of their cost basis and can show some kind of reaction during one. Since these two levels host the cost basis of a significant amount of investors, it’s possible that when BTC will revisit them, some panic selling or buying will crop up.
Which behavior would be dominant usually comes down to the market mood and the direction of the retest. When the retest occurs from above, investors may choose to buy more, believing the same cost basis level would result in profits again in the future. Similarly, holders who were in loss prior to the retest can react by selling, fearing that the asset will drop again in the future.
Considering these effects, the $111,000 may be considered a key support cushion for Bitcoin, while $117,000 a resistance barrier. “This range defines the current battleground between recent buyers and profit-takers,” noted Glassnode.
It now remains to be seen which level BTC will visit next and how its retest will go. “A break in either direction could set the tone for the next major move,” explained the analytics firm.
In some other news, the Stablecoin Supply Ratio (SSR) Oscillator has been sitting at cycle lows recently, as Glassnode has pointed out in another X post. This oscillator is based on the SSR, which compares the Bitcoin circulating supply against the supply of the stablecoins.
The SSR Oscillator is sitting at a low level at the moment, which indicates that the BTC supply is low compared to stablecoin liquidity. “Historically, such periods precede stronger bid-side support when market confidence returns,” said the analytics firm.
BTC Price
Bitcoin saw a retrace toward $113,500 earlier, but the coin has been quick to bounce back as its price has returned to $115,400.
Market expert VirtualBacon recently suggested that the most significant event for the crypto industry this year is not the Bitcoin (BTC) Halving or the approval of exchange-traded funds (ETFs), but rather a potential shift in Federal Reserve (Fed) liquidity policy.
After 18 months of tightening measures, the Fed is reportedly preparing to pause its quantitative tightening (QT) and may even initiate stealth quantitative easing (QE) once again.
What’s Next For The Crypto Market
In a recent post on social media platform X, VirtualBacon laid out a compelling argument linking liquidity pivots to altcoin cycles. In 2019, the Fed halted QT, which resulted in a rally for altcoins. Conversely, in 2022, when the Fed began QT, altcoins peaked.
Now, as the Fed is expected to end QT in 2025, VirtualBacon anticipates a similar surge for altcoins. The correlation is clear: when the Fed increases liquidity, altcoins tend to rise. The pressing question now is when exactly QT will come to a close.
While the Fed may not explicitly label a shift as QE, the expert notes that the pivotal moment will arrive when they remove the language regarding “reducing the size of the balance sheet.”
The last notable instance of this was during the 2019 repo crisis, when banks faced immediate cash shortages, prompting the Fed to inject $75 billion into the financial system. Although Powell claimed it was “not QE,” it effectively was, and following that intervention, Bitcoin tripled in value within months.
CME FedWatch Tool Shows High Probability Of Rate Cuts
Major financial institutions are already making predictions, with Goldman Sachs stating that the October meeting is the base case for QT to end, Bank of America expecting QT to cease by month-end, and Evercore indicating that the Fed is likely to signal an end to QT this week.
The same indicators that caused market disruptions back in 2019 are signaling distress now. Regardless of official statements, it appears QT is nearing its conclusion, with stealth QE on the horizon.
This shift would facilitate a return of liquidity to the markets, which historically has driven crypto prices. Liquidity acts as the fuel for market movements, and the Fed is poised to refill this tank.
The CME FedWatch tool currently indicates a 96.7% probability of a rate cut this month and an 87.9% chance of another cut in December. Powell recently hinted that QT would conclude “in the coming months,” signaling an imminent pivot.
M2 Money Supply Signals Upcoming Bitcoin Surge
Despite the current market uncertainty, VirtualBacon asserts that Bitcoin has not reached its peak. Out of 30 historical indicators that typically signal a bull market peak, none have activated yet, with data indicating there is still room for growth.
The global M2 money supply continues to rise, which historically leads Bitcoin prices by 10 to 12 weeks. The expert added that since the beginning of the month, this money supply has been increasing.
This development indicates that Bitcoin’s next upward movement is already in the pipeline, albeit lagging behind the liquidity curve. Additionally, VirtualBacon forecasts that once the Fed pivots, a new altcoin season may commence.
Featured image from DALL-E, chart from TradingView.com
Solana failed to stay above $200 and corrected gains. SOL price is now trading below $200 and might decline further if it dips below $192.
SOL price started a downside correction below $200 against the US Dollar.
The price is now trading below $198 and the 100-hourly simple moving average.
There was a break below a bullish trend line with support at $198 on the hourly chart of the SOL/USD pair (data source from Kraken).
The pair could extend losses if it dips below the $192 zone.
Solana Price Corrects Some Gains
Solana price started a decent increase after it settled above the $192 zone, beating Bitcoin and Ethereum. SOL climbed above the $198 level to enter a short-term positive zone.
The price even smashed the $200 resistance. A high was formed near $205 and the price recently corrected some gains. There was a move below the 23.6% Fib retracement level of the upward wave from the $177 swing low to the $205 high.
Besides, there was a break below a bullish trend line with support at $198 on the hourly chart of the SOL/USD pair. Solana is now trading below $198 and the 100-hourly simple moving average.
On the upside, the price is facing resistance near the $198 level. The next major resistance is near the $200 level. The main resistance could be $205. A successful close above the $205 resistance zone could set the pace for another steady increase. The next key resistance is $212. Any more gains might send the price toward the $220 level.
More Losses In SOL?
If SOL fails to rise above the $200 resistance, it could start another decline. Initial support on the downside is near the $192 zone and the 50% Fib retracement level of the upward wave from the $177 swing low to the $205 high. The first major support is near the $188 level.
A break below the $188 level might send the price toward the $180 support zone. If there is a close below the $180 support, the price could decline toward the $166 support in the near term.
Technical Indicators
Hourly MACD – The MACD for SOL/USD is gaining pace in the bearish zone.
Hourly Hours RSI (Relative Strength Index) – The RSI for SOL/USD is below the 50 level.
Dogecoin saw a sharp jump in trading activity on Tuesday, but prices did not follow immediately. Volume over the last 24 hours rose by 60%, pushing total traded value above $2 billion, according to CoinMarketCap.
Yet the token traded near $0.21 at the time of the report, down about 0.18% in the day and down 12% so far this month.
Trading Volume Surges
According to CoinMarketCap data, the sudden spike in volume shows many more hands moving DOGE than usual. Reports have disclosed that this wave of trades coincides with renewed interest among retail buyers and larger holders.
Data shows that October has historically been a strong month for Dogecoin, with modest gains of 30% to a more impressive 101% from 2021 up to 2024. Those past returns help explain why some traders expect a positive close this month.
Whales Move, Exchanges See Flow
Reports have disclosed several large transfers tied to the surge. One report described a dormant whale with a 36 DOGE seed reactivating and making a transfer valued at $26.8 million to Binance.
Another dormant wallet reportedly moved 15.115 million DOGE, valued at about $2.95 million, out of the same exchange. These movements drew attention because big transfers can change where liquidity sits and how quickly prices move when buying or selling picks up.
Another dormant wallet reportedly moved 15 million DOGE, valued at about nearly $3 million, out of Binance. These movements drew attention because big transfers can change where liquidity sits and how quickly prices move when buying or selling picks up.
Macro Drivers And Market Sentiment
The volume surge came as major cryptocurrencies showed strength. Reports have disclosed Bitcoin moving higher toward $115,000 while Ethereum traded near $4,200.
That broader rally can lift smaller tokens as traders rotate capital across markets. Still, metrics are mixed: one recent forecast predicted DOGE could rise by 13% to $0.22 by November 27, 2025, while technical indicators flagged the current sentiment as Bearish and the Fear & Greed Index sat at 50.
Outlook And Risks Ahead
The picture is straightforward and messy at the same time. Higher volume suggests interest; price action says caution. Whale transfers can both fuel rallies and add selling pressure, depending on intent.
Traders watching the symmetrical triangle will likely wait for a clear break up or down before making bigger bets. Those looking at seasonal trends may find hope in October’s past strength, but historical gains do not guarantee future returns.
Featured image from Unsplash, chart from TradingView
XRP price started a fresh increase above $2.550. The price is now facing hurdles above $2.650 and at risk of another decline in the near term.
XRP price gained pace for a move above $2.60 and $2.620 before the bears appeared.
The price is now trading below $2.60 and the 100-hourly Simple Moving Average.
There was a break below a bullish trend line with support at $2.6350 on the hourly chart of the XRP/USD pair (data source from Kraken).
The pair could start a fresh increase if it stays above $2.50.
XRP Price Retreats Lower
XRP price started a fresh increase after it settled above $2.50, like Bitcoin and Ethereum. The price surpassed the $2.550 and $2.60 resistance levels.
The bulls were able to push the price above $2.650. A high was formed at $2.6972 and the price recently started a downside correction. There was a move below the 23.6% Fib retracement level of the recent move from the $2.327 swing low to the $2.6972 high.
Besides, there was a break below a bullish trend line with support at $2.6350 on the hourly chart of the XRP/USD pair. The price is now trading below $2.60 and the 100-hourly Simple Moving Average.
If there is a fresh upward move, the price might face resistance near the $2.620 level. The first major resistance is near the $2.650 level, above which the price could rise and test $2.6880. A clear move above the $2.6880 resistance might send the price toward the $2.720 resistance. Any more gains might send the price toward the $2.7650 resistance. The next major hurdle for the bulls might be near $2.80.
More Losses?
If XRP fails to clear the $2.650 resistance zone, it could start a fresh decline. Initial support on the downside is near the $2.5650 level. The next major support is near the $2.550 level.
If there is a downside break and a close below the $2.550 level, the price might continue to decline toward $2.5120 or the 50% Fib retracement level of the recent move from the $2.327 swing low to the $2.6972 high. The next major support sits near the $2.450 zone, below which the price could continue lower toward $2.40.
Technical Indicators
Hourly MACD – The MACD for XRP/USD is now gaining pace in the bearish zone.
Hourly RSI (Relative Strength Index) – The RSI for XRP/USD is now below the 50 level.
Ethereum-focused treasury company ETHZilla said it has sold roughly $40 million worth of ether to fund ongoing share repurchases, a maneuver aimed at closing what it calls a “significant discount to NAV.” In a press statement on Monday, the company disclosed that since Friday, October 24, it has bought back about 600,000 common shares for approximately $12 million under a broader authorization of up to $250 million, and that it intends to continue buying while the discount persists.
ETHZilla Dumps ETH For BuyBacks
The company framed the buybacks as balance-sheet arbitrage rather than a strategic retreat from its core Ethereum exposure. “We are leveraging the strength of our balance sheet, including reducing our ETH holdings, to execute share repurchases,” chairman and CEO McAndrew Rudisill said, adding that ETH sales are being used as “cash” while common shares trade below net asset value. He argued the transactions would be immediately accretive to remaining shareholders.
ETHZilla amplified the message on X, saying it would “use its strong balance sheet to support shareholders through buybacks, reduce shares available for short borrow, [and] drive up NAV per share” and reiterating that it still holds “~$400 million of ETH” on the balance sheet and carries “no net debt.” The company also cited “recent, concentrated short selling” as a factor keeping the stock under pressure.
The market-structure logic is straightforward: when a digital-asset treasury trades below the value of its coin holdings and cash, buying back stock with “coin-cash” can, in theory, collapse the discount and lift NAV per share. But the optics are contentious inside crypto because the mechanism requires selling the underlying asset—here, ETH—to purchase equity, potentially weakening the very treasury backing that investors originally sought.
Death Spiral Incoming?
Popular crypto trader SalsaTekila (@SalsaTekila) commented on X: “This is extremely bearish, especially if it invites similar behavior. ETH treasuries are not Saylor; they haven’t shown diamond-hand will. If treasury companies start dumping the coin to buy shares, it’s a death spiral setup.”
Skeptics also zeroed in on funding choices. “I am mostly curious why the company chose to sell ETH and not use the $569m in cash they had on the balance sheet last month,” another analyst Dan Smith wrote, noting ETHZilla had just said it still holds about $400 million of ETH and thus didn’t deploy it on fresh ETH accumulation. “Why not just use cash?” The question cuts to the core of treasury signaling: using ETH as a liquidity reservoir to defend a discounted equity can be read as rational capital allocation, or as capitulation that undermines the ETH-as-reserve narrative.
Beyond the buyback, a retail-driven storyline has rapidly formed around the stock. Business Insider reported that Dimitri Semenikhin—who recently became the face of the Beyond Meat surge—has targeted ETHZilla, saying he purchased roughly 2% of the company at what he views as a 50% discount to modified NAV. He has argued that the market is misreading ETHZilla’s balance sheet because it still reflects legacy biotech results rather than the current digital-asset treasury model.
The same report cites liquid holdings on the order of 102,300 ETH and roughly $560 million in cash, translating to about $62 per share in liquid assets, and calls out a 1-for-10 reverse split on October 15 that, in his view, muddied the optics for retail. Semenikhin flagged November 13 as a potential catalyst if results show the pivot to ETH generating profits.
The company’s own messaging emphasizes the discount-to-NAV lens rather than a change in strategy. ETHZilla told investors it would keep buying while the stock trades below asset value and highlighted a goal of shrinking lendable supply to blunt short-selling pressure.
For Ethereum markets, the immediate flow effect is limited—$40 million is marginal in ETH’s daily liquidity—but the second-order risk flagged by traders is behavioral contagion. If other ETH-heavy treasuries follow the playbook, selling the underlying to buy their own stock, the flow could become pro-cyclical: coins are sold to close equity discounts, the selling pressures spot, and wider discounts reappear as equity screens rerate to the weaker mark—repeat.
That is the “death spiral” scenario skeptics warn about when the treasury asset doubles as the company’s signal of conviction.
Ethereum price started a downside correction from $4,250. ETH is moving lower below $4,000 and might decline further if it trades below $3,920.
Ethereum started a downside correction below $4,150 and $4,050.
The price is trading below $4,050 and the 100-hourly Simple Moving Average.
There was a break below a bullish trend line with support at $4,100 on the hourly chart of ETH/USD (data feed via Kraken).
The pair could continue to move down if it trades below $3,920.
Ethereum Price Starts Downside Correction
Ethereum price extended gains above the $4,050 level, like Bitcoin. ETH price even surpassed $4,200 before the bears appeared. A high was formed at $4,252 and the price recently started a downside correction.
There was a move below the $4,120 and $4,050 levels. The price dipped below the 50% Fib retracement level of the recent wave from the $3,708 swing low to the $4,252 high. Moreover, there was a break below a bullish trend line with support at $4,100 on the hourly chart of ETH/USD.
Ethereum price is now trading below $4,080 and the 100-hourly Simple Moving Average. If there is another increase, the price could face resistance near the $4,040 level. The next key resistance is near the $4,080 level.
The first major resistance is near the $4,120 level. A clear move above the $4,120 resistance might send the price toward the $4,200 resistance. An upside break above the $4,200 region might call for more gains in the coming sessions. In the stated case, Ether could rise toward the $4,240 resistance zone or even $4,250 in the near term.
More Losses In ETH?
If Ethereum fails to clear the $4,080 resistance, it could start a fresh decline. Initial support on the downside is near the $3,950 level. The first major support sits near the $3,920 zone and the 61.8% Fib retracement level of the recent wave from the $3,708 swing low to the $4,252 high.
A clear move below the $3,920 support might push the price toward the $3,880 support. Any more losses might send the price toward the $3,840 region in the near term. The next key support sits at $3,780.
Technical Indicators
Hourly MACD – The MACD for ETH/USD is gaining momentum in the bearish zone.
Hourly RSI – The RSI for ETH/USD is now below the 50 zone.
XRP hovers at a key resistance, signaling a crucial decision point. With momentum building, traders now wonder, will one final dip come before the next major breakout?
XRP Faces A Crucial Decision Zone Amid Ongoing Range
CasiTrades, in a recent market update, highlighted that XRP continues to range within a critical zone, keeping its setup for a potential final wave down valid. The analyst noted that the price remains at a key decision point, with ongoing tests of the Wave 4 highs acting as a firm ceiling against further upside movement.
According to CasiTrades, the pivotal level to watch is $2.82 on Binance. A confirmed breakout and sustained hold above this resistance would invalidate the bearish setup and signal renewed bullish momentum. However, XRP has so far failed to push through, maintaining a range-bound structure between support and resistance, a sign that the market has yet to commit to a clear directional trend.
The analyst emphasized that a V-shaped recovery typically breaks through resistance with strong conviction, but such a move has not been seen here. Instead, XRP’s hesitancy indicates that selling pressure may still be present, preventing a clean continuation to the upside.
Exchange Variations Add Complexity To Market Analysis
CasiTrades went on to explain that most major exchanges are now aligning around their key Fibonacci retracement levels, particularly the 0.618 zone. On Binance, this range sits between $1.35 and $1.46, which the analyst identified as the area where the next corrective wave could complete. According to the expert, this move would finalize the macro Wave 2 correction, paving the way for a powerful Wave 3 impulse that might propel XRP toward $6.50 or even $10.
The analyst emphasized that these lower price levels shouldn’t be viewed as a cause for concern but rather as valuable accumulation opportunities for long-term investors. Historically, zones like these have marked points of strong institutional buying and major trend reversals, presenting some of the best risk-to-reward setups before a large bullish expansion.
CasiTrades also noted that exchange discrepancies add a layer of complexity to the analysis. For instance, during a recent liquidation event, Binance briefly fell to $0.77, while Coinbase never reached its .618 retracement. This variation means traders should always chart on the specific exchange they plan to execute trades on, as price reactions can differ slightly between platforms. In conclusion, the analyst noted that until XRP breaks and holds above $2.82, the market structure still supports the idea of one final downward wave before a major upward cycle begins.
Bitcoin price is correcting gains below $113,500. BTC could continue to move down if it stays below the $114,200 resistance.
Bitcoin started a downside correction below the $114,200 support.
The price is trading below $114,000 and the 100 hourly Simple moving average.
There was a break below a bullish trend line with support at $114,050 on the hourly chart of the BTC/USD pair (data feed from Kraken).
The pair might continue to move down if it trades below the $112,000 zone.
Bitcoin Price Starts Pullback
Bitcoin price extended gains above the $113,500 zone. BTC gained pace for a move above the $115,000 pivot level. The price even spiked above $116,200 before the bears appeared.
A high was formed at $116,309 and the price is now correcting some gains. There was a move below the $114,200 support zone. The price dipped below the 23.6% Fib retracement level of the recent wave from the $106,718 swing low to the $116,309 high.
Moreover, there was a break below a bullish trend line with support at $114,050 on the hourly chart of the BTC/USD pair. Bitcoin is now trading below $114,000 and the 100 hourly Simple moving average.
Immediate resistance on the upside is near the $113,650 level. The first key resistance is near the $114,200 level. The next resistance could be $115,000. A close above the $115,000 resistance might send the price further higher. In the stated case, the price could rise and test the $116,200 resistance. Any more gains might send the price toward the $117,500 level. The next barrier for the bulls could be $118,000.
More Losses In BTC?
If Bitcoin fails to rise above the $114,200 resistance zone, it could continue to move down. Immediate support is near the $112,000 level. The first major support is near the $111,500 level or the 50% Fib retracement level of the recent wave from the $106,718 swing low to the $116,309 high.
The next support is now near the $110,500 zone. Any more losses might send the price toward the $110,000 support in the near term. The main support sits at $108,500, below which BTC might struggle to recover in the short term.
Technical indicators:
Hourly MACD – The MACD is now gaining pace in the bearish zone.
Hourly RSI (Relative Strength Index) – The RSI for BTC/USD is now below the 50 level.
Major Support Levels – $112,000, followed by $111,500.
The Dogecoin price is fighting to hold the psychological $0.20 support as large investors continue offloading holdings and leveraged traders exit the market. The Dogecoin price briefly traded above $0.21 earlier this week, but has since slipped by more than 2%, highlighting the mounting selling pressure in the market.
According to on-chain data, whales have sold over 500 million DOGE tokens in the past week, fueling fears of further downside. The selloff coincides with a sharp 61% drop in futures open interest, plunging from $5.03 billion to $1.95 billion, signaling widespread position liquidations and trader fatigue.
Futures Liquidations and Weak Technicals Weigh on Momentum
Derivatives data show declining participation across major exchanges, with traders closing out long positions rather than adding new exposure. Meanwhile, Dogecoin’s 24-hour trading volume surged 17.5% to nearly $2 billion, a sign that sellers remain in control even as overall market recovery stalls.
Technical indicators paint a similarly cautious picture. On the daily chart, the Dogecoin price is forming a potential “death cross” between the 50-day and 200-day exponential moving averages, a bearish pattern that often precedes a further drop.
If sustained selling continues, analysts warn the Dogecoin price could fall toward the $0.166 support, which aligns with the lower boundary of its long-term ascending trendline.
However, this same trendline has historically triggered strong rebounds. Previous retests have led to price recoveries of nearly 100%, leaving some traders optimistic that a similar setup could emerge if support holds firm.
Consolidation or Collapse? Key Dogecoin Price Levels to Watch
Currently, Dogecoin price hovers near $0.20 with a market cap of $30.3 billion, holding above the critical psychological zone but struggling to regain upward momentum. The immediate resistance lies between $0.204 and $0.210, while a decisive close below $0.19 could accelerate losses toward $0.18–$0.166.
For now, the balance between whale distribution and new buyer demand will determine DOGE’s next move. If fresh inflows return and futures activity stabilizes, a recovery toward $0.23–$0.25 remains possible.
But without renewed conviction from large holders, the Dogecoin price risks extended consolidation, or a deeper retracement before the next bullish wave begins.
Cover image from ChatGPT, DOGEUSD chart from Tradingview
An analyst has explained how Solana could decide its next big move after rising to $210, the resistance level of a Parallel Channel.
Solana Has Been Trading Inside A Parallel Channel Recently
In a new post on X, analyst Ali Martinez has talked about how the trajectory of Solana is looking from the perspective of a technical analysis (TA) pattern. The pattern in question is a Parallel Channel, which forms whenever an asset’s price trades between two parallel trendlines.
The upper line of the channel is considered a source of resistance, meaning that tops can be probable to appear on retests of it. Similarly, the lower level is assumed to provide support to the price, helping it to arrive at bottoms. A breakout of either of these bounds can signal a continuation of the trend in that direction. That is, a surge above the Parallel Channel can be a bullish signal, while a drop under it may lead to bearish action.
There are a few different types of Parallel Channels, depending on how the channel is oriented with respect to the graph axes. Channels that have a positive slope are known as Ascending Channels, while those that slope downward are called Descending Channels.
In the context of the current topic, the third and simplest type is the one of interest: a Parallel Channel that’s also parallel to the time-axis. This case corresponds to a phase of true sideways consolidation in the asset.
Now, here is the chart shared by Martinez that shows the Parallel Channel that the 4-hour price of Solana has been stuck inside for the last couple of weeks:
As displayed in the above graph, Solana retested the lower level of the Parallel Channel last week and successfully found support. The cryptocurrency has since been rising and nearing the resistance level, located at $210. Considering the coin’s current trajectory, the analyst has noted that its price may be heading for a retest at $210 before making its next big move. However, the direction of such a move, if one happens, remains uncertain.
Given that the $210 level corresponds to the resistance line of the Parallel Channel, it’s possible that a retest could reject Solana all the way back down to the support level around $176. It’s also possible, though, that this retest could instead lead to a breakout. In this case, SOL could naturally see a sustained bullish push. It now remains to be seen which of the two scenarios will play out for the asset if the Parallel Channel holds and a retest takes place.
SOL Price
At the time of writing, Solana is floating around $200, up over 7.5% in the last seven days.
The Solana decentralized finance (DeFi) ecosystem just gained another powerful addition with the launch of SolsticeFi. This innovative new platform is poised to introduce a much-needed layer of risk-controlled yield generation, directly addressing one of the primary concerns for users venturing into the safety of their deposited capital.
SolsticeFi is reimagining how investors earn on Solana by introducing a defensively engineered approach to yield, one that directly protects the value of user deposits. According to crypto commentator Madissa’s post on X, one of SolsticeFi’s most compelling features is its ability to allow users to continue earning staking rewards while keeping their assets liquid and usable across the broader DeFi ecosystem.
How SolsticeFi Balances Risk While Generating Yield
This innovation created continuous opportunities for user to deploy their capital in other protocols without interrupting their base yield, instead of locking up funds. SolsticeFi platform is designed to prioritize full transparency and validator diversification, minimizing exposure to single-validator risks and opaque yield platforms. Furthermore, depositing capital into SolsticeFi provides support for SOL’s network security while generating sustainable returns for users.
Crypto analyst Hokage has also mentioned how Solana is improving and completely revolutionizing financial transaction speeds in traditional finance (TraFi), where transfers take days, settlements drag, and middlemen slow everything down.
SOL has changed the game by creating a new block every 400 milliseconds, and currently, the central to this acceleration is Bam, the new block assembly marketplace. This Bam will speed up how quickly user transaction gets picked up and integrated into a block, and slash inclusion times to an astonishing 50-100 milliseconds. Building on this is Alpenglow, which takes finality down to an incredible 100-150 milliseconds faster than a blink, and the point where the network confirms the user transaction is 100% done and irreversible.
One project that stands out in these ultra-fast ecosystem steps is SolsticeFi’s USX, a stablecoin specifically built to move at that speed, which enables users to send dollars, deploy capital, and settle instantly. Hokage concluded that “while these advancements might sound like pure sci-fi, if you’ve been around the SOL ecosystem, you would know it’s not.”
Market Confidence Returns To Solana
While SolsticeFi provides speed and reduces risk to Solana yield platforms, KOLS Manager at Binance, investor, and trader BitGuru, has noted that SOL’s price is currently showing a strong bullish setup, after following a steady downtrend and now stabilizing near key support.
As a result of that action, the SOL market is now pulling back with considerable strength, aiming to break above the critical $210 resistance level, a zone that has capped multiple attempts at recovery. A decisive breakout above $210 would likely trigger SOL’s next leg higher toward $230 and beyond.
The Cardano (ADA) price is flying under the radar amid growing accumulation by large-holders (“whales”) and a technical formation that traders seldom ignore, a symmetrical triangle.
With ADA currently trading around $0.66, after briefly reaching $0.69 earlier in the week, the stage appears set for a breakout, or a breakdown. Analysts suggest that if the bullish scenario prevails, ADA could target $1 and beyond, potentially even reaching $5 or more in a longer-term move.
Whale Accumulation Signals Long-Term Confidence
Despite short-term price softness, on-chain data reveal that wallets holding large quantities of ADA are steadily increasing their positions.
According to recent reports, wallets with 100,000 ADA tokens have been accumulating over the past six weeks, even while retail demand remains lukewarm. This accumulation is taking place as ADA forms a low-volatility consolidation, such behaviour often precedes major market moves.
The divergence is noteworthy. While Open Interest and spot cumulative volume delta (CVD) remain weak, signaling limited retail/speculator engagement, whales are quietly buying the dips.
Enthusiasm among large-holders suggests confidence in ADA’s fundamentals and plays into the bullish thesis that this accumulation could underpin a powerful move once the technical breakout triggers.
Symmetrical Triangle Breakout Offers Route to Major Upside
Technical analysts highlight that ADA has been trading within a symmetrical triangle pattern, a convergence of support and resistance trendlines, typically signalling a buildup of tension before a decisive move.
The crucial support near $0.61 and resistance roughly at $0.70–$0.75 mark the boundaries of this formation. A decisive breakout above the upper trendline could unlock a rally toward $0.80–$0.85, and potentially beyond $1.70 per some projections.
Conversely, a breakdown below the support would invalidate the bullish setup and could see ADA revisit $0.55 or lower. Given the whale accumulation underway, the bullish scenario currently seems favoured, but traders must still watch for confirmation.
Bottom Line
The question now gaining traction is: could ADA eventually hit $5? While the immediate target may be around $1 to $2, some longer-term models based on Fibonacci extensions and structural breakout maths place significantly higher levels on the table.
If ADA converts supply zones into support and elevates its on-chain narrative, the powerful combination of whale positioning + breakout could carry it much higher.
Cover image from ChatGPT, ADAUSD chart from Tradingview
Bitcoin is showing early signs of strength as it attempts to reclaim the $115,000 level. After weeks of mixed sentiment and heavy selling pressure, momentum appears to be turning slightly bullish. The recent weekly close above $114,500 has confirmed a reclaim of the Short-Term Holder (STH) Realized Price, a key on-chain threshold currently sitting near $113,000. This metric represents the average cost basis of recent market participants and often serves as a pivotal line separating bullish from bearish sentiment.
Top analyst Darkfost shared that this reclaim is an encouraging signal, reflecting renewed buyer confidence after a volatile October. However, he also cautioned that Bitcoin’s position must still be monitored closely. A rejection at current levels could lead to a renewed correction phase, mirroring the pattern seen in 2024, when BTC faced multiple failed attempts before regaining upward momentum.
For now, the market sits at a delicate crossroads — consolidating below resistance while holding critical on-chain support. If Bitcoin can sustain this structure and push convincingly above $115K, analysts believe it could open the door for a broader bullish continuation and potentially a retest of the $120K region in the weeks ahead.
Bitcoin Holds Above Key On-Chain Level
According to top analyst Darkfost, Bitcoin’s reclaim of the Short-Term Holder (STH) Realized Price around $113,000 could mark a crucial turning point for market structure. He notes that during the 2024 correction, BTC faced four failed attempts to break above this same metric. Each rejection was driven by short-term holders selling at their break-even points — a typical psychological reaction that delays trend reversals. Once Bitcoin finally sustained above the STH Realized Price, however, the market quickly regained momentum and entered a new expansion phase.
This time, the dynamic appears similar. If Bitcoin successfully consolidates above this zone, it could pave the way for a strong bullish impulse and potentially a new all-time high (ATH) in the short term. The STH Realized Price acts as a measure of conviction among recent investors; holding above it suggests growing confidence and a shift from capitulation to accumulation.
Darkfost also highlights another critical observation: throughout the current bull cycle, Bitcoin has never fallen below the yearly STH Realized Price. Each time the price neared that level, a rebound followed — reaffirming it as a structural support for the broader trend.
Still, caution remains essential. A breakdown below the $94,000 mark — the current yearly STH Realized Price — would likely signal a deeper market shift. Such a move could mark the transition from a mid-cycle correction into a more prolonged bearish phase.
For now, the data suggests resilience, not weakness. As long as BTC remains above its short-term realized threshold, the broader uptrend remains intact — with potential for the next major rally if buying pressure continues to build above $115K.
BTC Bulls Defend Key Support While Momentum Cools
Bitcoin is currently trading around $114,360, consolidating after a brief rally that tested resistance near $115,800–$117,500. The chart shows that BTC successfully reclaimed the 200-period moving average (red line) on the 4-hour timeframe, a level that had acted as resistance throughout mid-October. This reclaim is an encouraging short-term signal, but momentum appears to be slowing as traders await the next catalyst.
The $113,000–$114,000 range now serves as immediate support — aligning with the Short-Term Holder (STH) Realized Price, a key on-chain level that reflects the cost basis of recent buyers. Holding this zone could allow bulls to consolidate strength before another attempt at breaking above $117,500, the main horizontal resistance that capped previous rallies.
On the downside, failure to maintain above the 200-MA could trigger a retest of $111,000, where the 100-MA (green line) provides secondary support. Trading volume remains subdued, reflecting investor caution ahead of the Federal Reserve’s interest rate decision later this week.
Bitcoin remains in a constructive phase as long as it holds above $113K. Sustained consolidation above this level would reinforce bullish structure — while a decisive break above $117,500 could open the path toward $120,000+ in the short term.
Featured image from ChatGPT, chart from TradingView.com
Dogecoin (DOGE) is facing a steep market cooldown after weeks of heightened trading activity in early October. Data from CoinGlass shows that both Open Interest (OI) and trading volume for DOGE futures have crashed, indicating a sharp decline in the meme coin’s momentum. The latest figures reveal a significant pullback in derivatives activity and spot market participation, suggesting that traders may be retreating from speculative positions as volatility eases.
Dogecoin Open Interest Crashes Over 60%
Dogecoin’s Open Interest has plunged dramatically from its October highs, reflecting a rapid exodus of leveraged traders from the market. According to CoinGlass, total exchange DOGE futures Open Interest has fallen over 62% from a peak of $5.03 billion on October 7 to $1.88 billion on October 28. This represents a drop to approximately 9.41 billion DOGE, valued at $ 0.20 per token.
Despite the decline in Open Interest, Binance, BitMEX, and Bybit continue to lead as the top exchanges with the highest Dogecoin futures activity. Still, the downturn has been widespread across exchanges. Kucoin recorded the largest drop in recent hours at 3.1%, followed closely by Bitget, which saw a 2.27% decline. Over the last 24 hours, Bitunix recorded the steepest drop in Open Interest, down 15.86%, while Crypto.com saw a 7.36% reduction.
Even Binance, which consistently leads Dogecoin futures trading, has seen a notable pullback. CoinGlass reports that the exchange’s Open Interest peaked at $964.7 million on October 7, marking a monthly high. Since then, it has fallen to $380.29 million (1.9 billion DOGE), representing a staggering 60.6% crash in just over three weeks.
Dogecoin Sees Even Worse Decline In Volume
Trading volume for Dogecoin has mirrored the collapse in Open Interest. CoinGlass data shows that Dogecoin’s futures volume heatmap across major crypto exchanges is in the red zone. Total trading volume had spiked to $20.45 billion on October 11, following the devastating crypto flash crash on October 10, but has since plummeted to $5.31 billion as of October 28. This represents a whopping 74% decline.
On individual exchanges, Binance’s DOGE trading volume dropped by 9.35% in the past 24 hours, while OKX saw a 13.69% decline. CoinEx recorded the largest volume decrease at 26.1%, followed by Gate.io at 23.94%. Popular exchanges like Bitget, Kucoin, and Bitunix also reported varying declines of 4.96%, 20.37% and 13.16%, respectively, as overall market liquidity thinned.
However, a few exchanges bucked the downward trend, recording slight gains. dYdX saw its DOGE volume surge by 167.61%, HTX increased by 49.93%, and Hyperliquid rose by 23.88%. Bybit and MEXC also recorded modest gains of 24.98% and 1.88%, respectively.
Alongside its decline in trading volume, CoinGlass notes that Dogecoin’s price performance has slipped. The meme coin is currently trading at $0.20, down 13.19% over the past 30 days and 2.86% in the last 24 hours.
The XRP price recently saw a sharp drop that was very scary for many traders, and some in the crypto market think the chart looks weak now. However, an analyst on X, Cryptoinsightuk, disagrees. The analyst explains that XRP is not bearish right now, even after the 50% flash crash, and the price can still move higher when liquidity returns.
Low Downside Liquidity And Weekly Chart Still Looks Fine For The XRP Price
Cryptoinsightuk says that XRP has “no downside liquidity.” The analyst explains that sellers are not strong, so there is very little liquidity sitting below the current price level. It does not mean the XRP price will stay still, although it may move up and down for now. At some point, exchanges and market makers may push the price higher into deeper liquidity, where they can make money.
The analyst says that the flash crash does not damage the weekly chart. The weekly picture still shows a normal trend even after the sharp fall. He notes that online discussions are focusing on the monthly chart and using it to claim that XRP is weak, but the monthly chart alone is only one timeframe and not enough to call the price truly bearish. The slight drop shows weakness only on lower timeframes, not in the broader market structure, and Cryptoinsightuk believes the bigger structure is still pointing up, which is a key reason he does not see a bearish trend forming even after the 50% flash crash.
The analyst’s comment about market makers also gives hope to traders who worry that the XRP price will keep falling. When market makers see better opportunities at higher price levels, the price often moves up to where they want to make profits. It gives XRP a path to recovery later, rather than staying low. He keeps pointing to the weekly chart because it shows that XRP still holds its larger bullish setup even after the fear caused by the flash crash.
Higher Timeframes Look Strong, And RSI Fractal Points To A Move Up
Cryptoinsightuk further adds that higher timeframes are always more reliable for reading price trends and recommends looking at the XRP price chart over the past three months. In his view, the three-month chart looks good and supports a strong long-term trend.
He also looks at the daily RSI, and it recently hit an oversold area. When this happened the last time, the XRP price later saw a strong move up. The analyst shared a fractal a few weeks ago that shows what a new “measured move” could look like if this same pattern repeats.
The fractal suggests the XRP price could rise again from here. The oversold RSI signal suggests that buyers could return and push the price higher in the future.
Uniswap (UNI) has been consolidating since the October 10 market crash, with price action stabilizing but volatility still lingering. The decentralized exchange (DEX) token has struggled to regain its previous momentum, reflecting the broader uncertainty across the altcoin market. Analysts remain divided on its short-term outlook — some view Uniswap as a key driver of Ethereum’s DeFi ecosystem and a potential leader in the next recovery phase, while others caution that lingering liquidity stress and waning trader activity could spark more turbulence ahead.
Despite this cautious backdrop, new on-chain data suggests a shift may be underway. According to CryptoQuant insights, Binance whales have become increasingly active on UNI, with large transactions and outflows spiking to multi-month highs. Historically, this type of whale behavior — especially when coupled with heavy exchange outflows — has been associated with accumulation phases and strategic repositioning by major players.
As Uniswap’s fundamentals remain solid, with trading volumes and user engagement steadily recovering, the renewed whale activity could indicate that smart money is quietly preparing for the next market leg. Whether this accumulation marks the early stages of a trend reversal or just a temporary pause before further volatility remains to be seen.
Uniswap Exchange Outflows Hit Multi-Month Highs
In recent days, Uniswap’s native token, UNI, has seen a notable uptick in large-scale activity, signaling renewed interest from major market participants. According to on-chain data from CryptoQuant, whale wallets — typically identified by the top 10 largest transactions — have begun moving significant amounts of UNI out of Binance. These outflows represent transfers from exchange wallets to external addresses, a behavior that often indicates accumulation or long-term repositioning by large holders rather than short-term trading.
The data highlights a daily peak of 17,400 UNI withdrawn from Binance, alongside a monthly peak of 5,250 UNI, marking a three-month high in whale activity. Historically, such outflow spikes tend to occur during accumulation phases, as whales seek to reduce exposure to centralized exchanges and secure tokens for longer-term holding or staking opportunities.
This renewed movement comes at a time when UNI is still digesting the market correction that began in July, with prices stabilizing but failing to regain strong upward momentum. Analysts interpret this surge in whale activity as a potential early indicator of confidence returning to the asset. If sustained, it could mark the beginning of a structural reversal — a shift from post-crash consolidation to the early stages of renewed accumulation and recovery.
UNI Price Analysis: Consolidation Persists as Whales Reenter the Market
Uniswap (UNI) continues to consolidate near the $6.50 level after a sharp correction that began in July 2025. The weekly chart shows a prolonged period of sideways movement following a breakdown from the $12 resistance zone, where bullish momentum previously failed to sustain. Despite multiple attempts to rebound, UNI remains below the 50-week and 200-week moving averages, both of which now act as dynamic resistance levels.
The recent price action reflects investor hesitation, with the broader market still digesting the effects of the October 10 crash. However, volume analysis indicates that selling pressure has started to decline, suggesting that sellers may be exhausting and that accumulation could be forming at current levels.
From a technical perspective, the $6.00–$6.20 zone serves as immediate support, while a decisive reclaim above $8.00 would be required to shift market structure toward a potential mid-term recovery. Interestingly, the recent whale accumulation reported by on-chain data aligns with this stabilization phase — a pattern often seen near cyclical bottoms.
If Uniswap maintains support and market sentiment improves, UNI could attempt to retest the $10–$12 zone in the coming months. Conversely, a failure to hold above $6 could open the door for a retest of the 2024 range lows around $4.
Featured image from ChatGPT, chart from TradingView.com
A recent debate on the social media platform X has drawn attention to XRP’s long-term price outlook after an XRP enthusiast, Crypto Bitlord, proposed a rather wild scenario where the cryptocurrency teleports to $500 instantly. His post, which imagined XRP being used by the US government to pay off its $35 trillion debt, caused some reactions across the XRP community.
In response, well-known crypto analyst ChartNerd stepped in to temper expectations, explaining that while XRP’s future is bright, such a leap to $500 is far from realistic this market cycle.
ChartNerd’s Take On Realistic XRP Targets
ChartNerd’s comments immediately stood out for their grounded tone, especially amongst reactions filled with predictions of explosive, instant gains. Responding directly to Bitlord’s vision of XRP rocketing to $500, ChartNerd clarified that XRP’s price will not trade at that price target this cycle. “$XRP will not teleport to $500,” he said.
Instead of a three-digit price, the analyst noted that the XRP price can only realistically reach the double-digit threshold in this cycle. “Realistically, it could definitely teleport to $13-$27 this cycle,” he continued.
This double-digit price target, although very bullish compared to XRP’s current price action, pales in comparison to other bullish projections from other crypto analysts, with many anticipating triple-digit price targets and others even predicting a run to $1,000 and beyond.
As conversations around potential XRP ETFs continue to gain momentum, one commenter asked ChartNerd whether his projections accounted for the billions in possible ETF inflows and the tokens expected to be locked in treasury funds and liquidity pools over the next few months.
His response showed that his analysis was not detached from these developments. ChartNerd explained that even if XRP captured half of Bitcoin’s ETF trading volume from the past two years, the result would still translate to a market capitalization of roughly $1.2 trillion, bringing the price closer to his $27 upper target rather than $500.
Most ultra-bullish XRP price predictions are contingent on the cryptocurrency gaining adoption among banks and players in traditional finance. However, adoption models grow over years, not weeks, with ChartNerd adding that “these developments take time, and triple digits are not possible until many a year down the line.”
Staying Grounded Amid Bold Predictions
Another user remarked that Bitcoin once faced similar disbelief before breaching $100,000, meaning that XRP could surprise skeptics in the same way. ChartNerd, however, maintained his cautious stance with the response, “Highly unlikely imo, we shall see. I’ll stick to double digits.”
Such comparisons overlook the fundamental differences between Bitcoin’s and XRP’s market dynamics, especially when it comes to their circulating supplies.
At the time of writing, XRP is trading at $2.66, a 1% increase in the past 24 hours and a 9.2% rise over the last seven days. To reach the hypothetical $500 level, XRP would need to surge by roughly 18,690% from its current price. By contrast, hitting $13 or $27 would represent gains of approximately 388% and 915%, respectively.
The recent Dogecoin market action has seen its price now hovering below $0.20 after surging to $0.208 in the past 24 hours. Despite the consolidation, analysts and traders are watching the meme coin closely, believing that the next major move could redefine its long-term trajectory.
Among those voices is crypto analyst EtherNasyonaL, who predicted that Dogecoin’s third and most powerful bullish phase is still ahead. His technical analysis on the monthly chart presents a structure that reveals the groundwork for another massive uptrend to above $0.8 is already in motion.
Dogecoin’s First Two Bull Waves Set The Stage
The monthly candlestick price chart shared by EtherNasyonaL calls attention to Dogecoin’s cyclical nature since 2014, showing two completed bull waves and a third one forming. Each of these bullish waves was formed after Dogecoin broke above and then retested the upper trendline of a descending channel of lower highs that had confined its price action in the preceding years. This retest was also highlighted by a confluence of the 25 Moving Average (MA) indicator.
The first wave, which began in 2017, caused Dogecoin’s earliest exponential rise from near-zero levels, right when the meme coin entered into popular crypto discussions. The second, and far more explosive, bull wave occurred between 2020 and 2021, when Dogecoin surged from under $0.003 to an all-time high of $0.7316, which has stood until now.
Each bull run started once Dogecoin reclaimed its 25-month moving average as support, following extended consolidation periods that spanned multiple months. The current setup reflects the same condition, as the 25MA line has once again turned upward, and Dogecoin has successfully retested the upper trendline of its previous descending channel, as shown in the chart below.
The analysis reveals that Dogecoin has recently broken free from a long-term downtrend that spanned between mid-2021 and early 2025. Notably, recent crypto market liquidation events in October have seen the Dogecoin price complete a successful retest of the resistance level, now turned support, around the $0.17 to $0.20 price range.
This successful retest also coincides with a simultaneous bounce off the bottom trendline of an ascending channel. EtherNasyonaL describes the current price action as Dogecoin “accumulating strength in the lower band of a years-long ascending channel.”
The projected trajectory on the chart above shows Dogecoin following its established pattern by moving from the lower region of the ascending channel to its upper boundary. If the third bull wave plays out as the previous two did, Dogecoin’s price could challenge its $0.73 all-time high and break into new price territories. The first price target in this case is the $0.8 mark, and then as high as $4 in the long term.


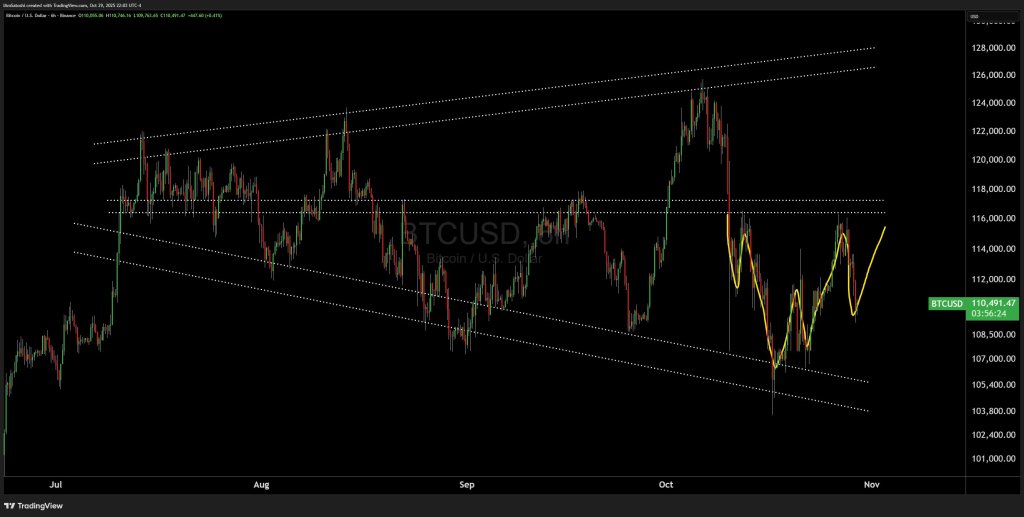
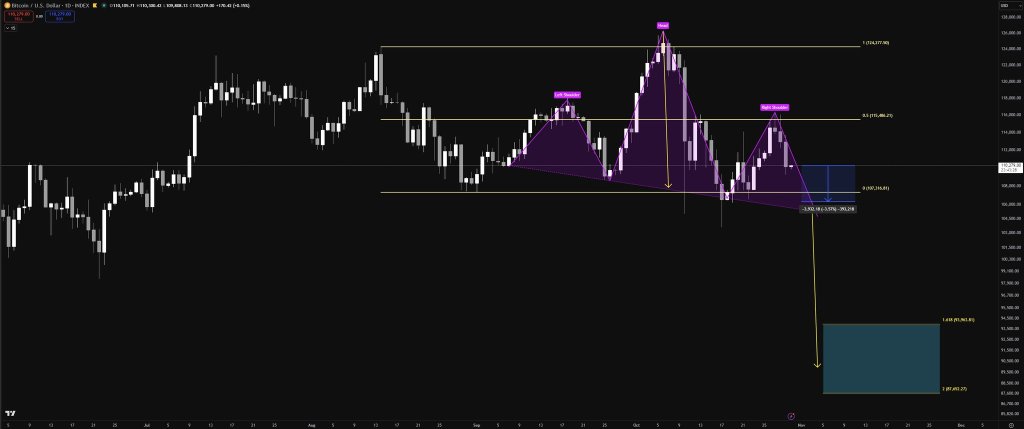
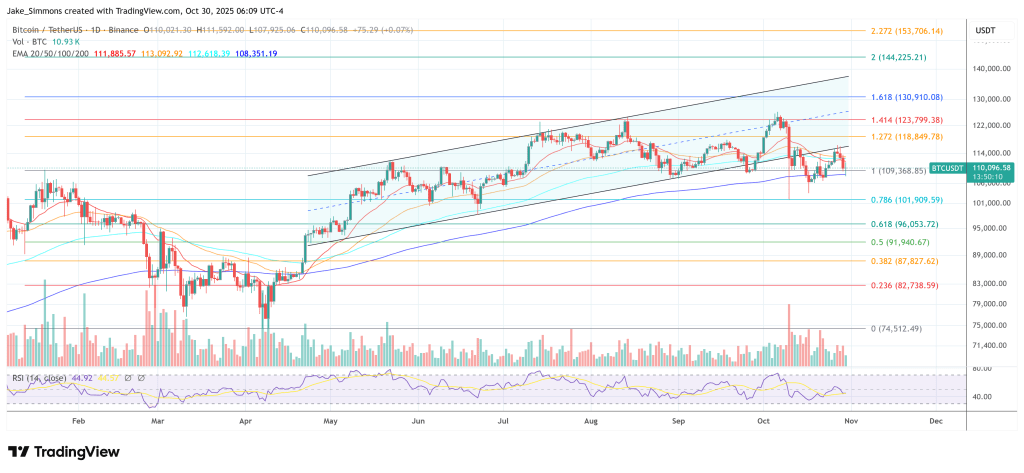

 Convenient Solana exposure paired with staking benefits.
 Exposure to a high-speed, low-cost blockchain.…
  JUST IN:
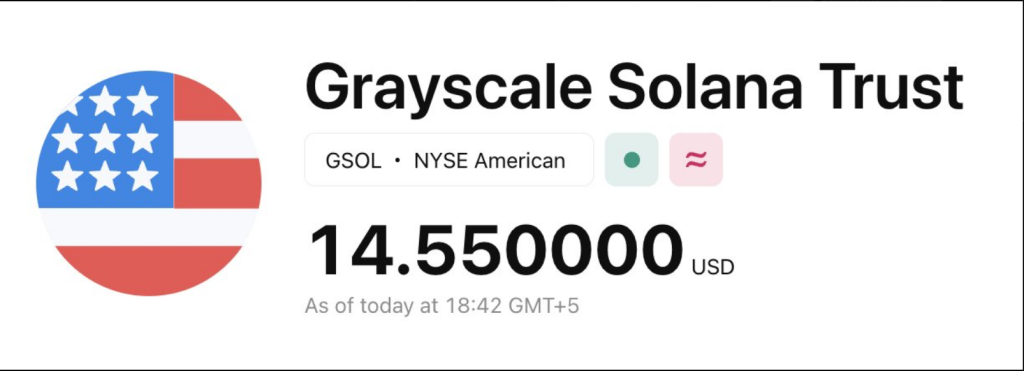

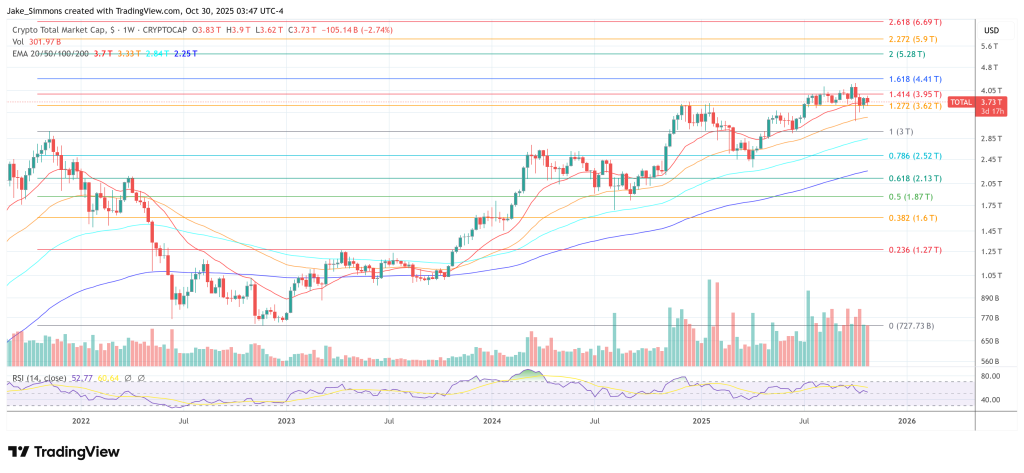


 The Fed’s rate cut failed to lift crypto markets, as the move was likely fully priced in.

 Check out our


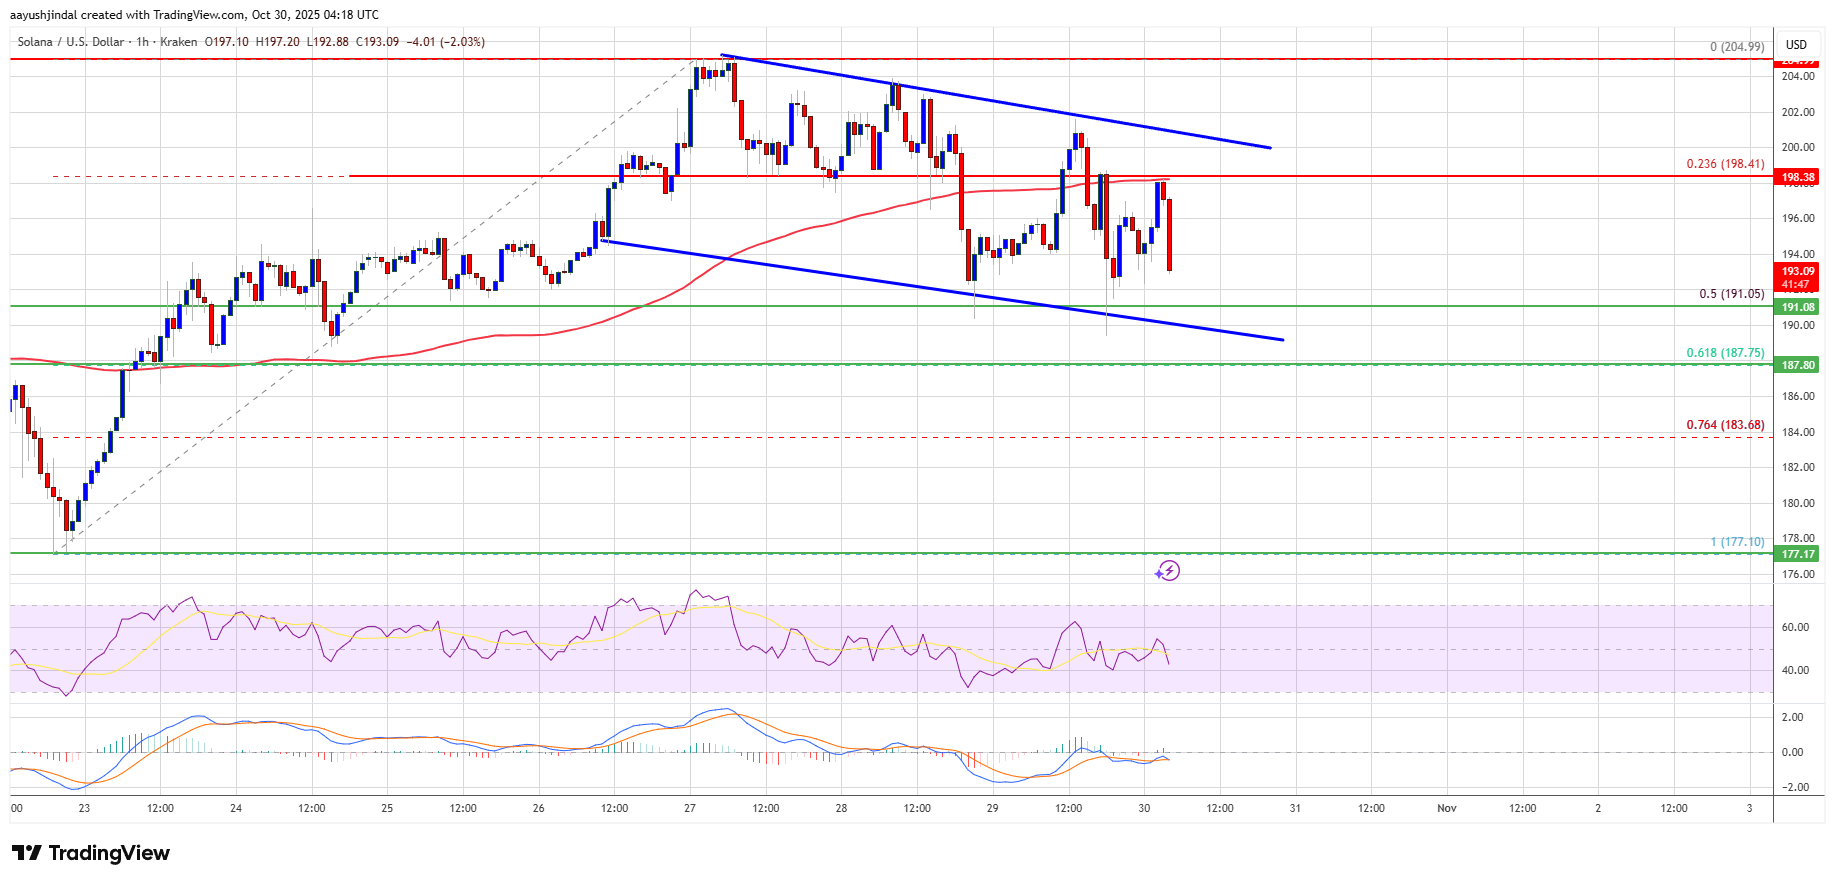


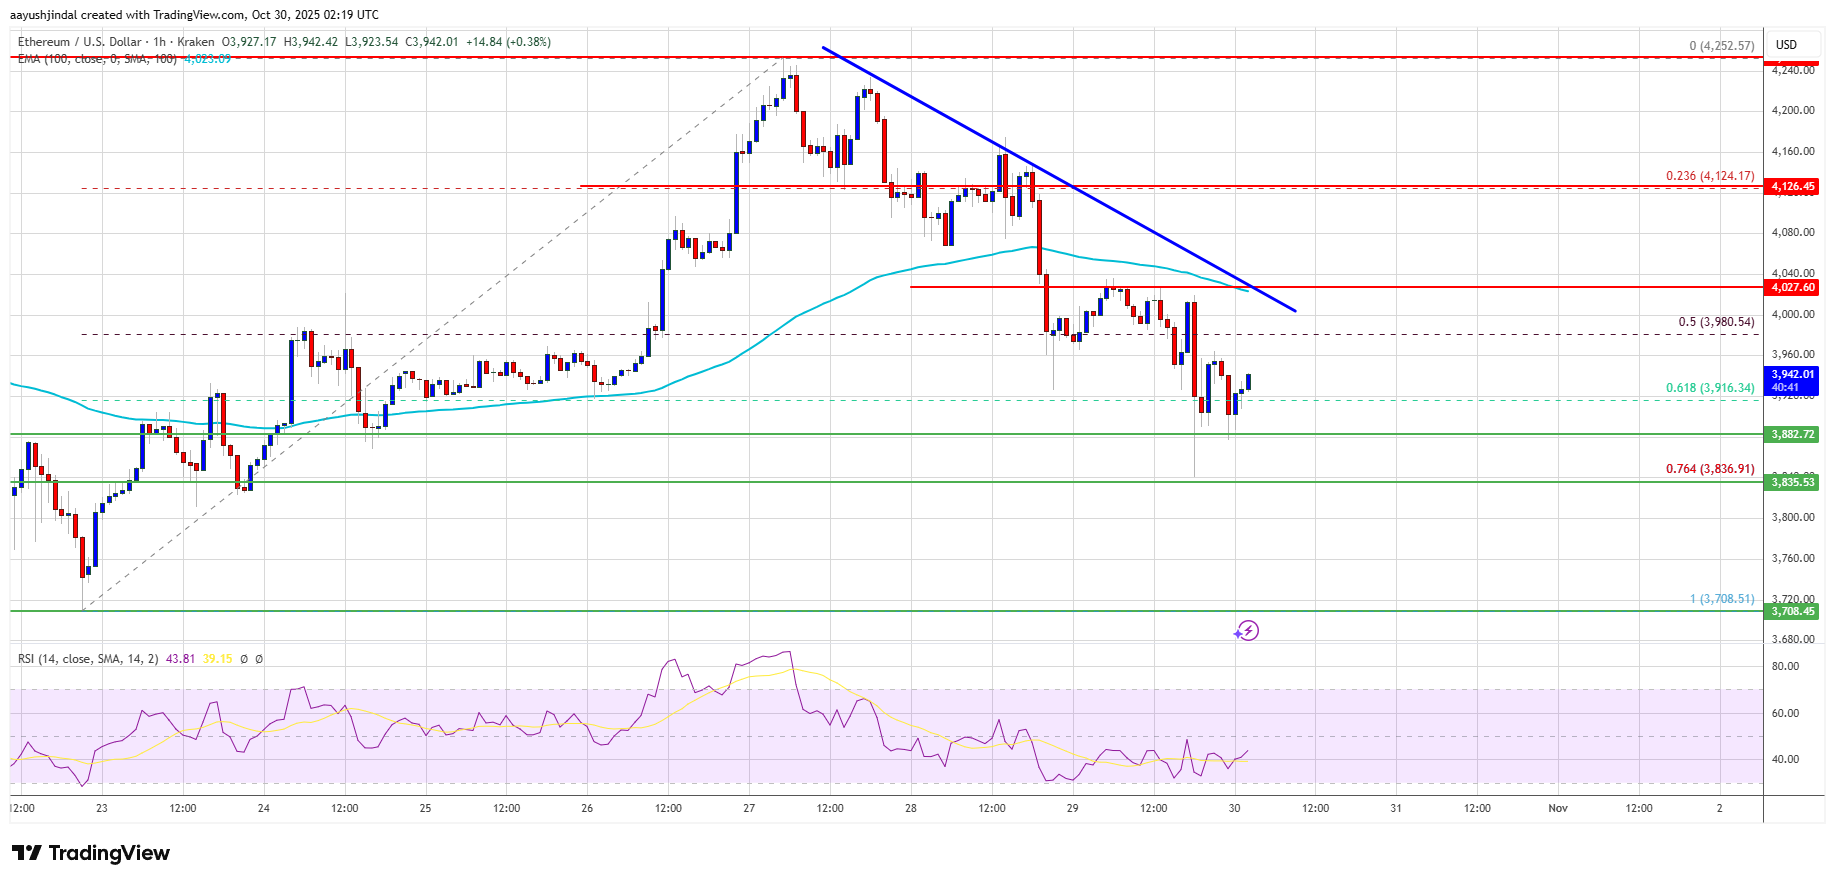

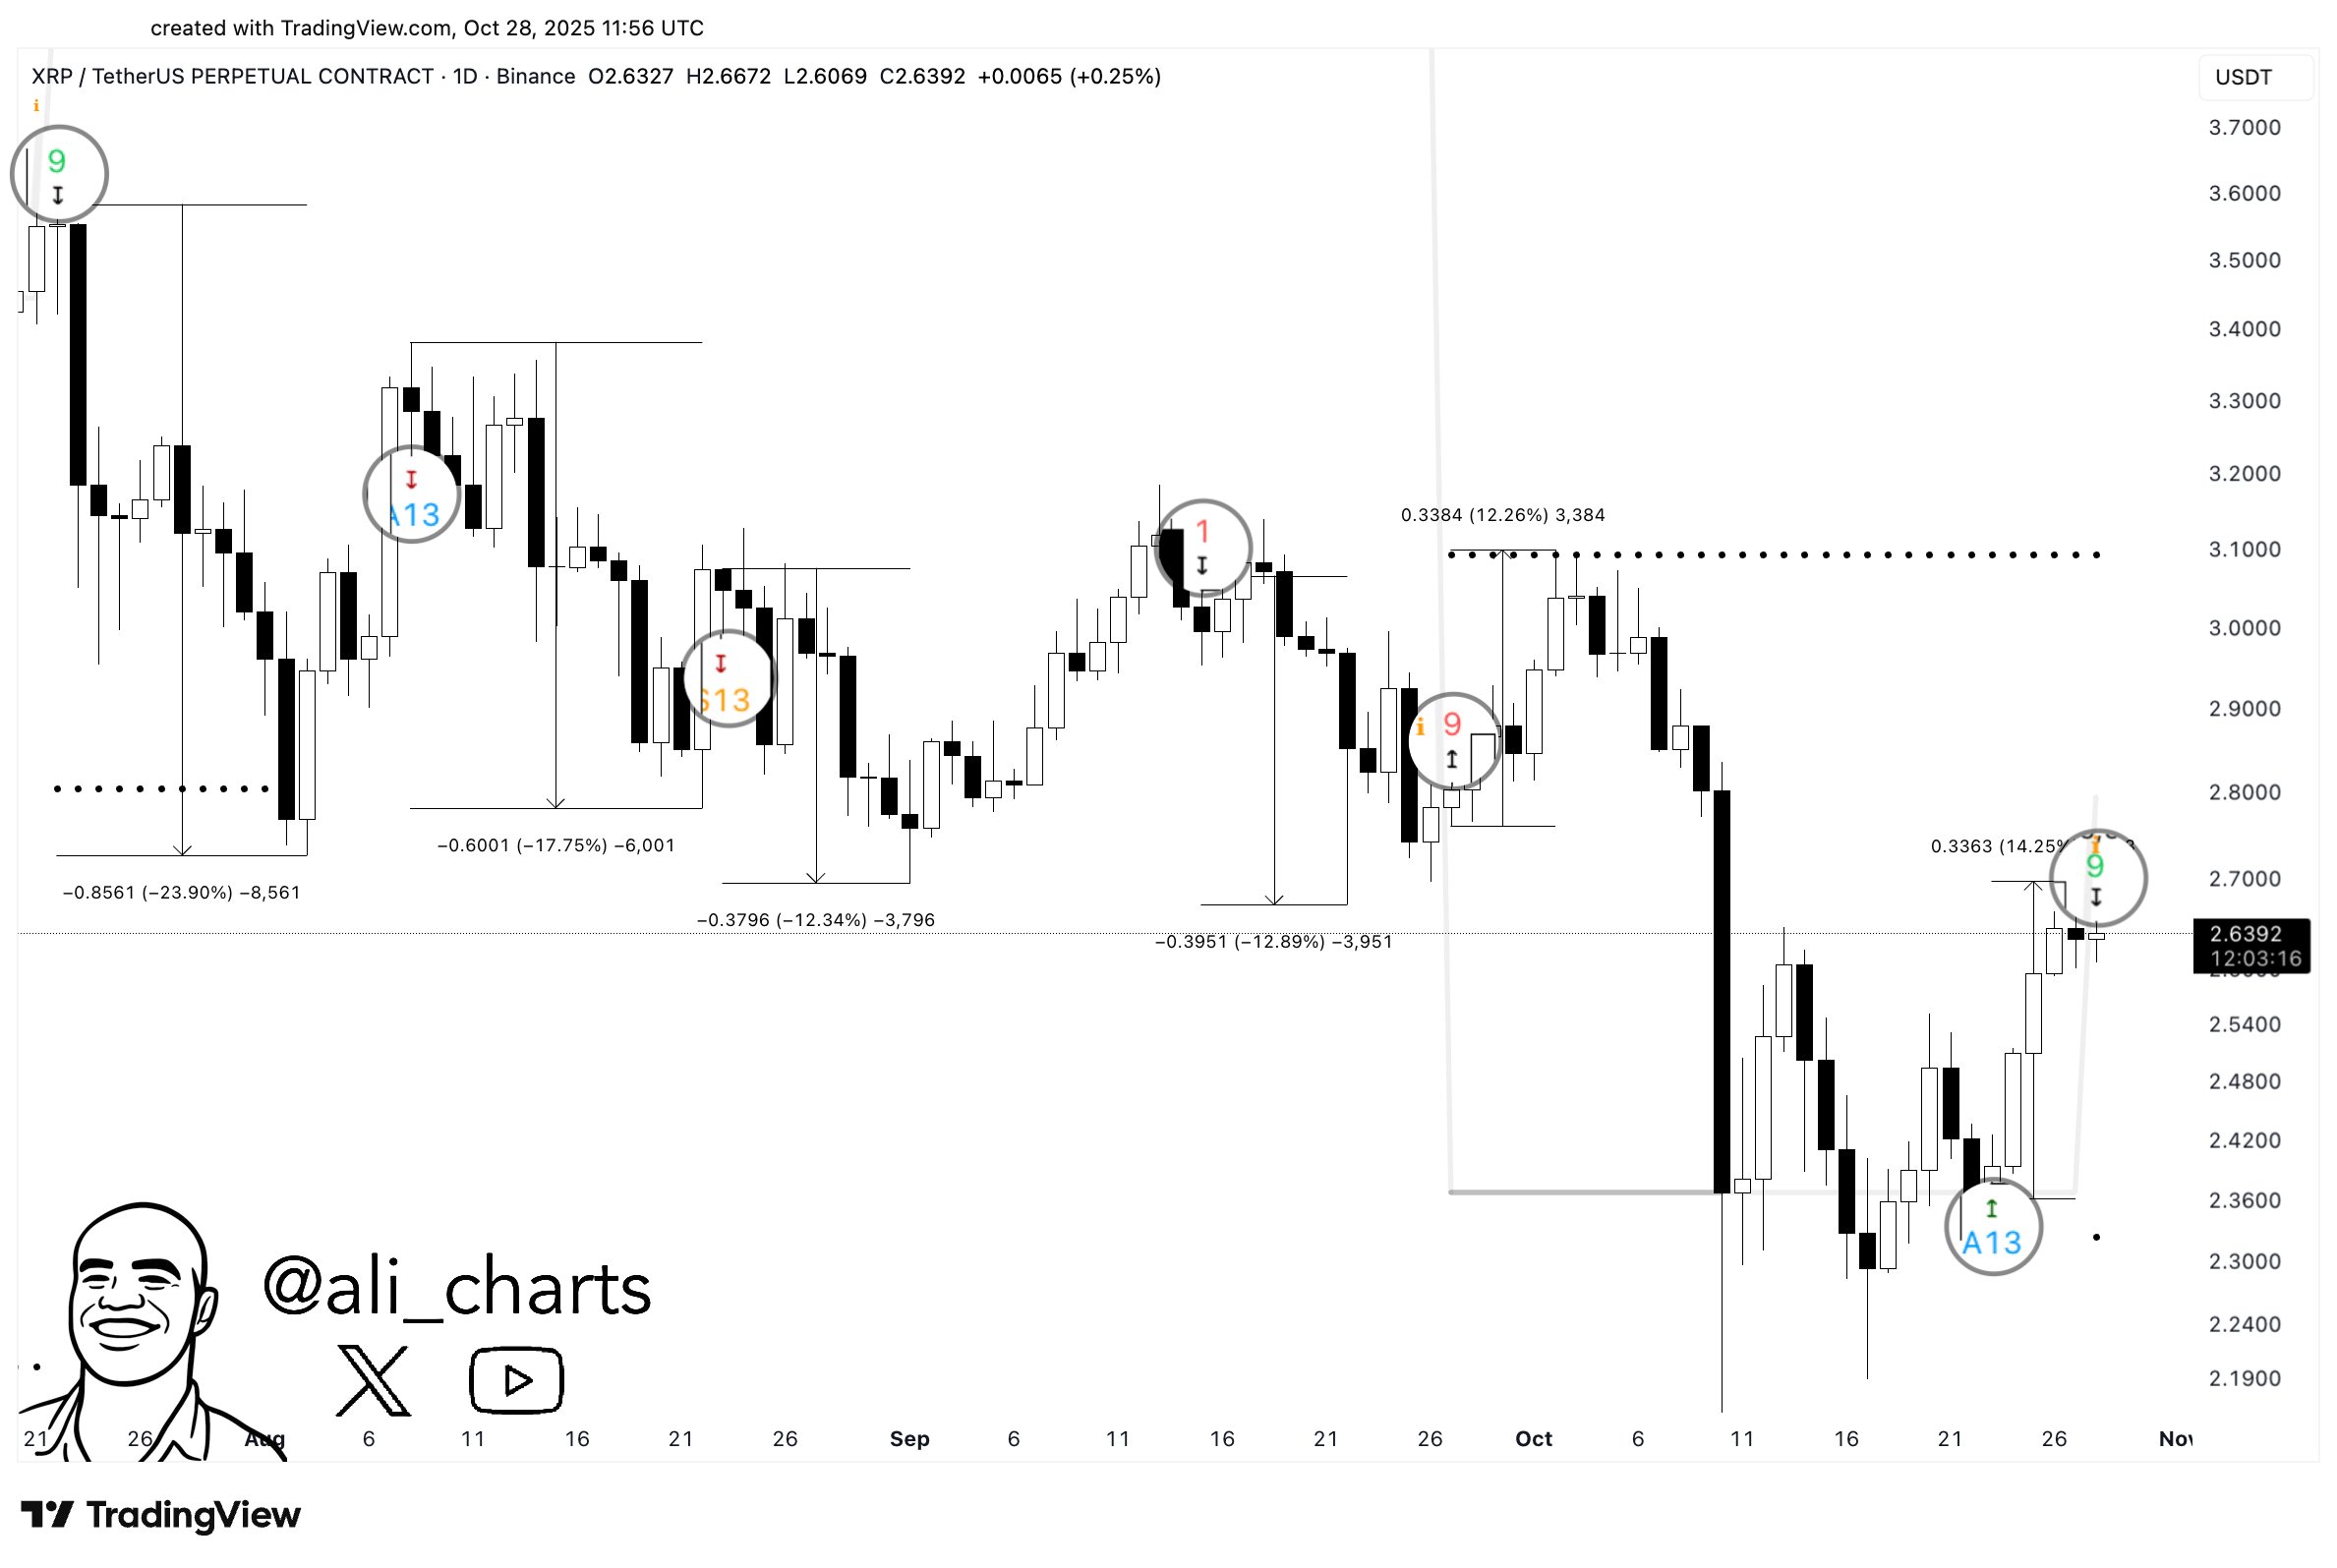
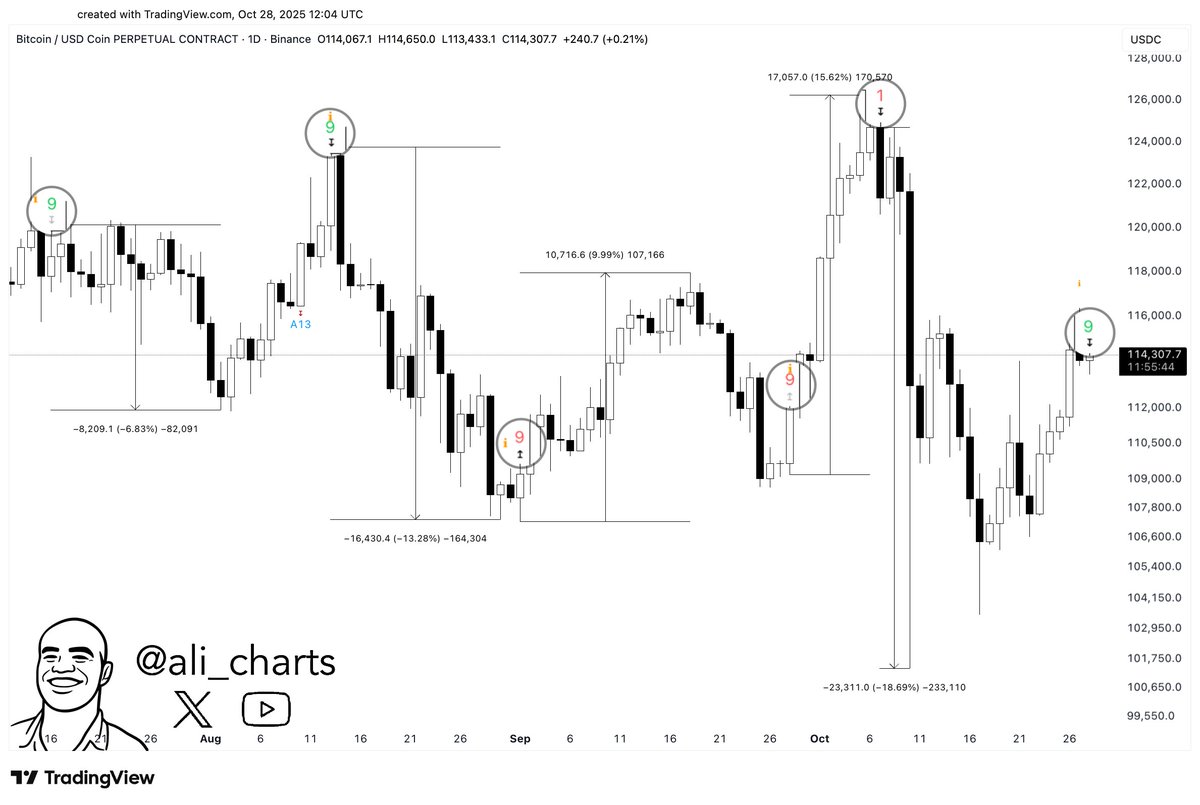

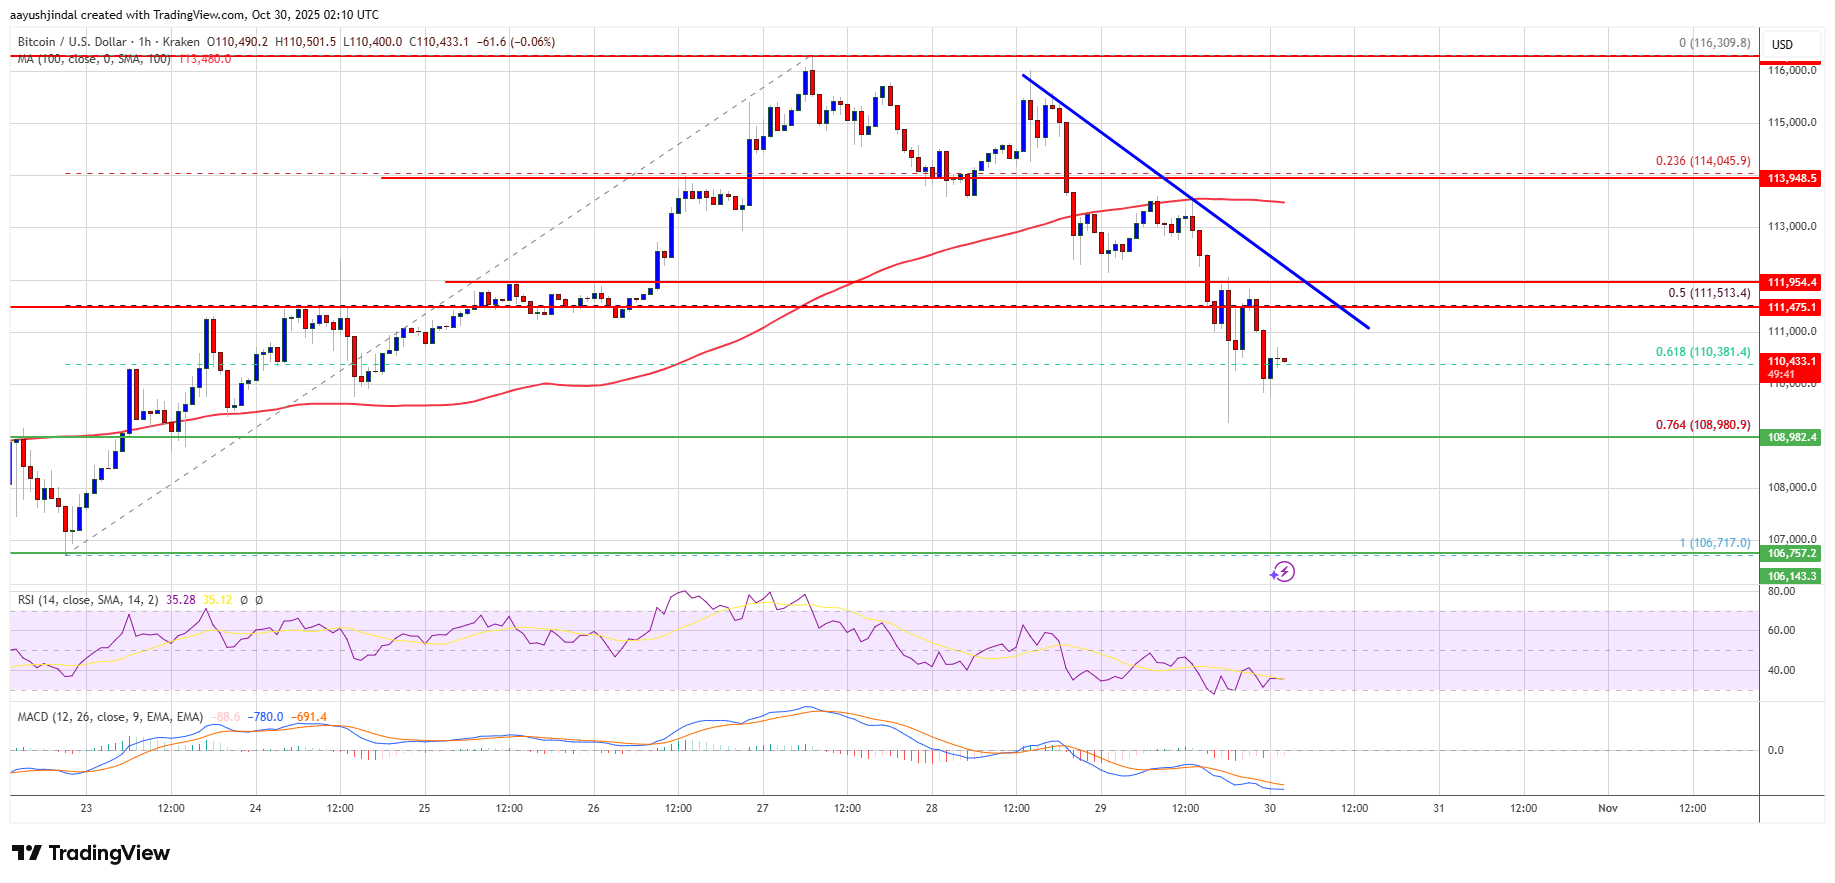

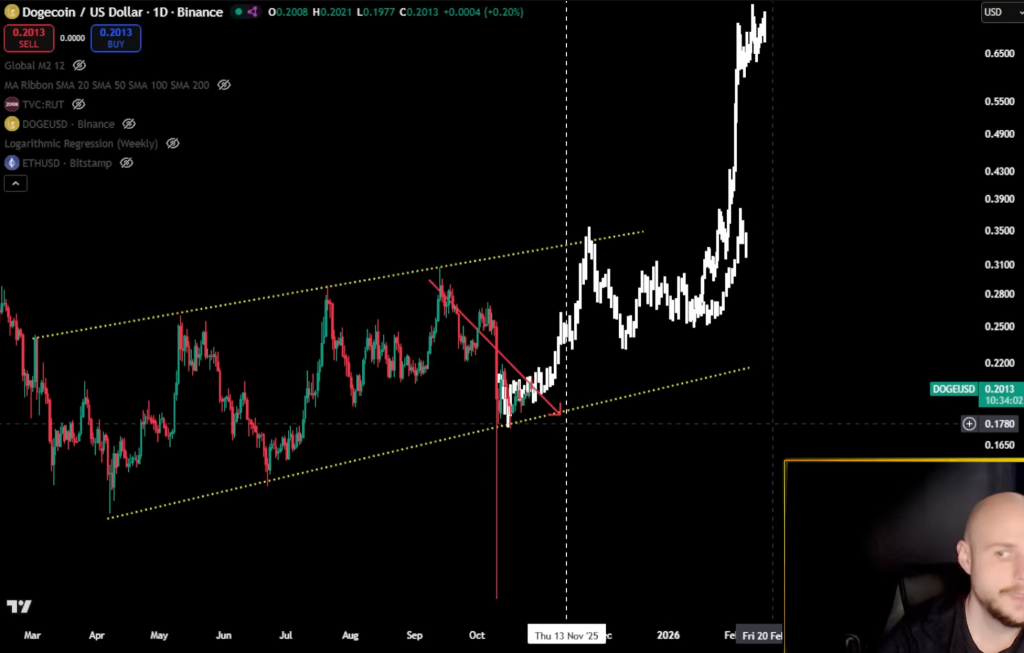
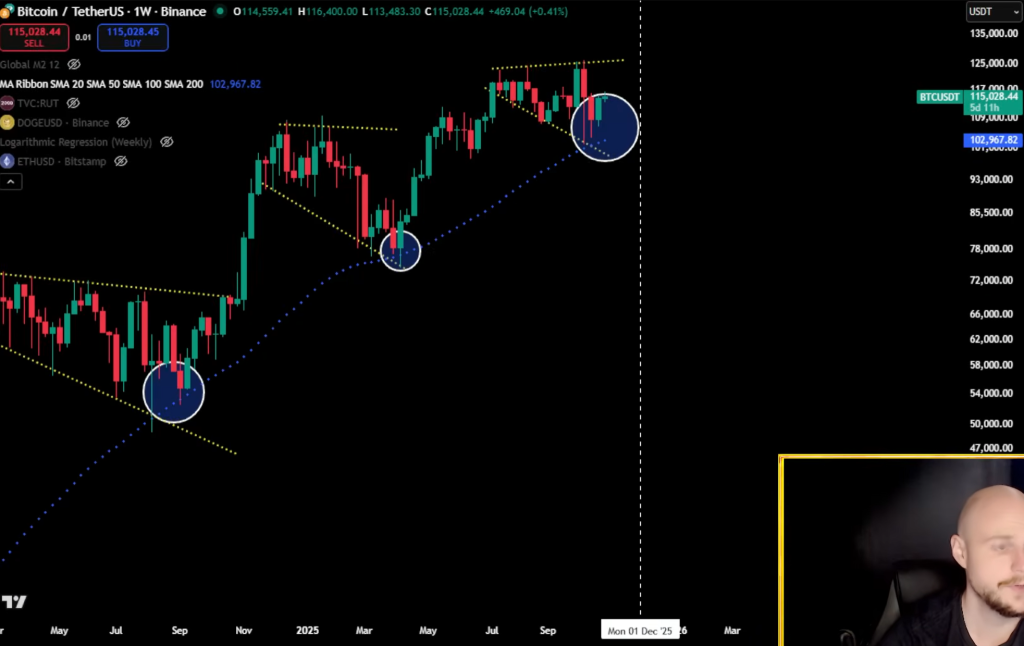
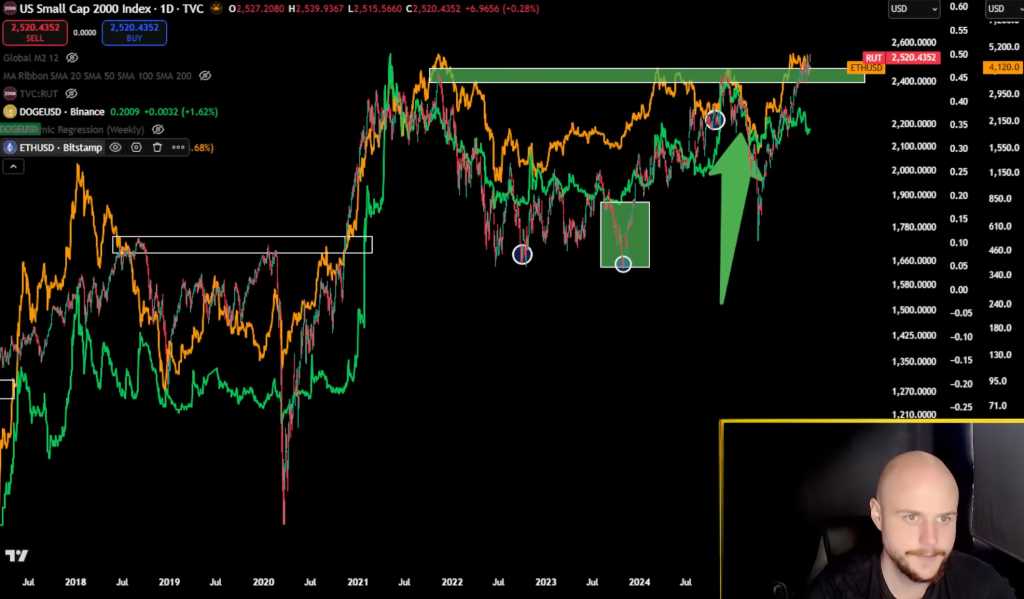
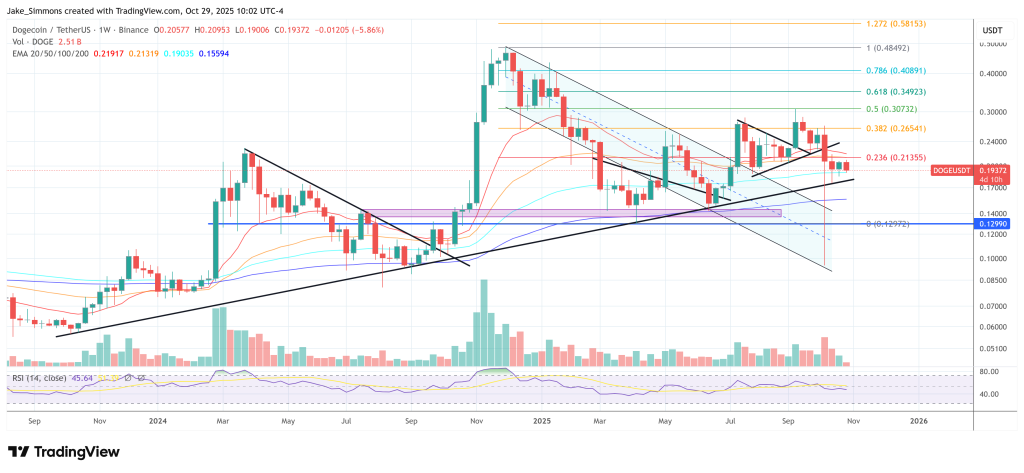


 :
:  (@avax)


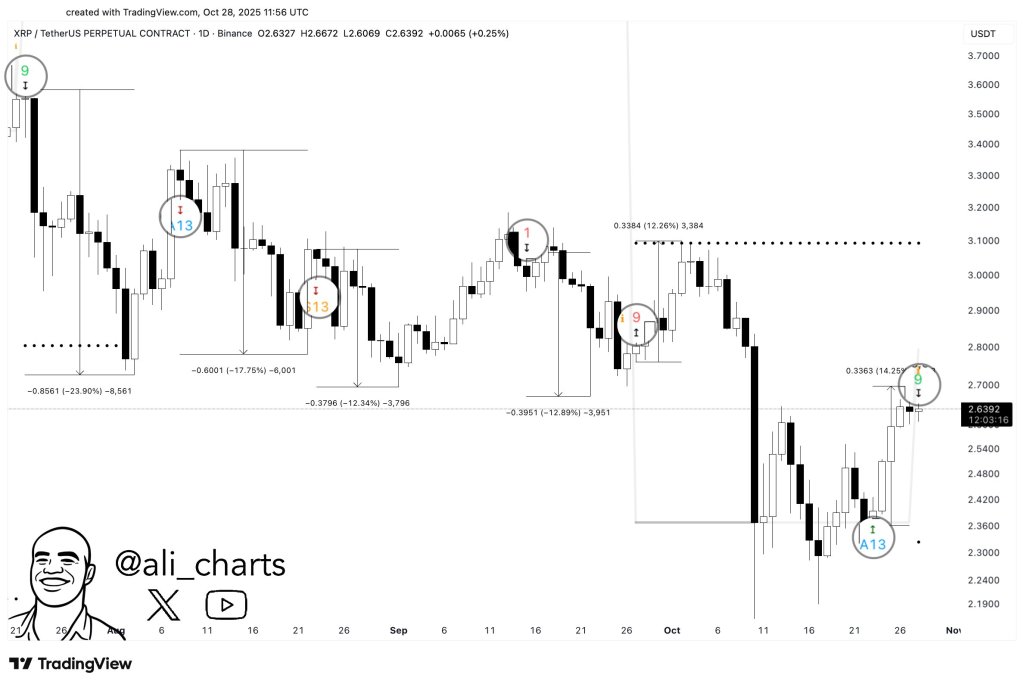
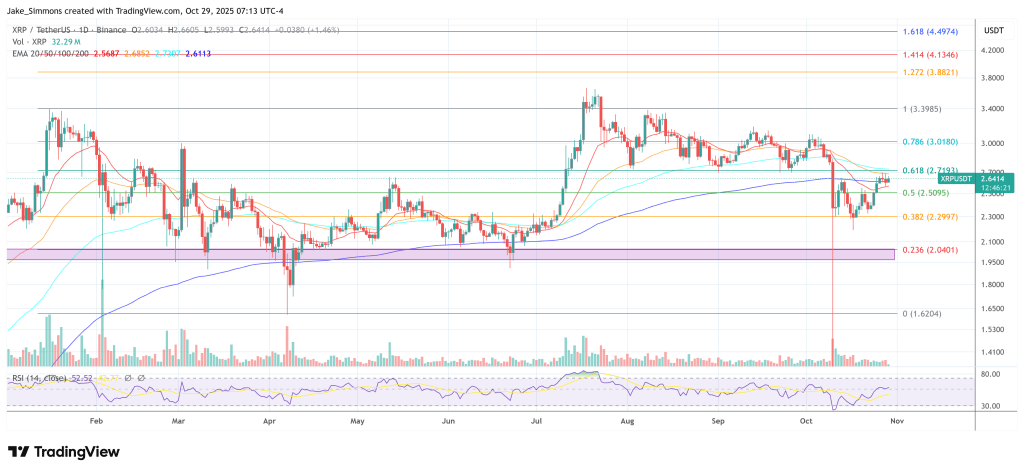


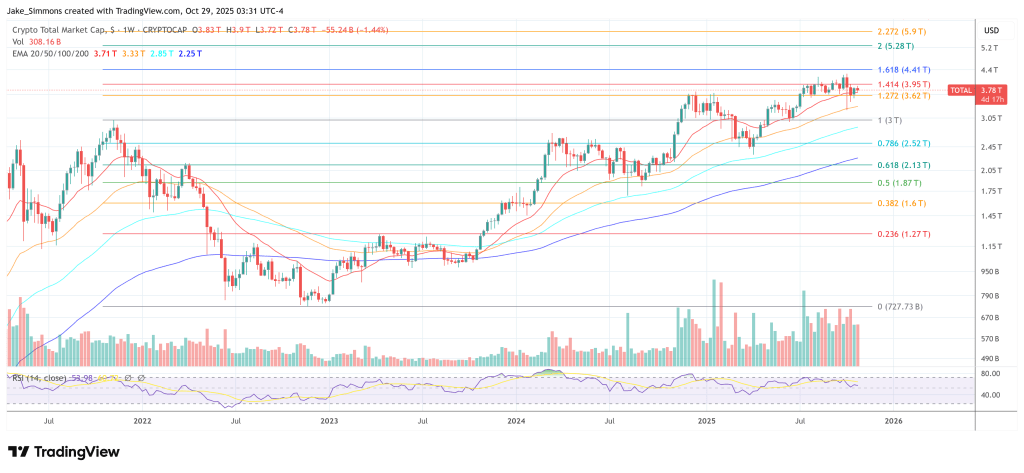


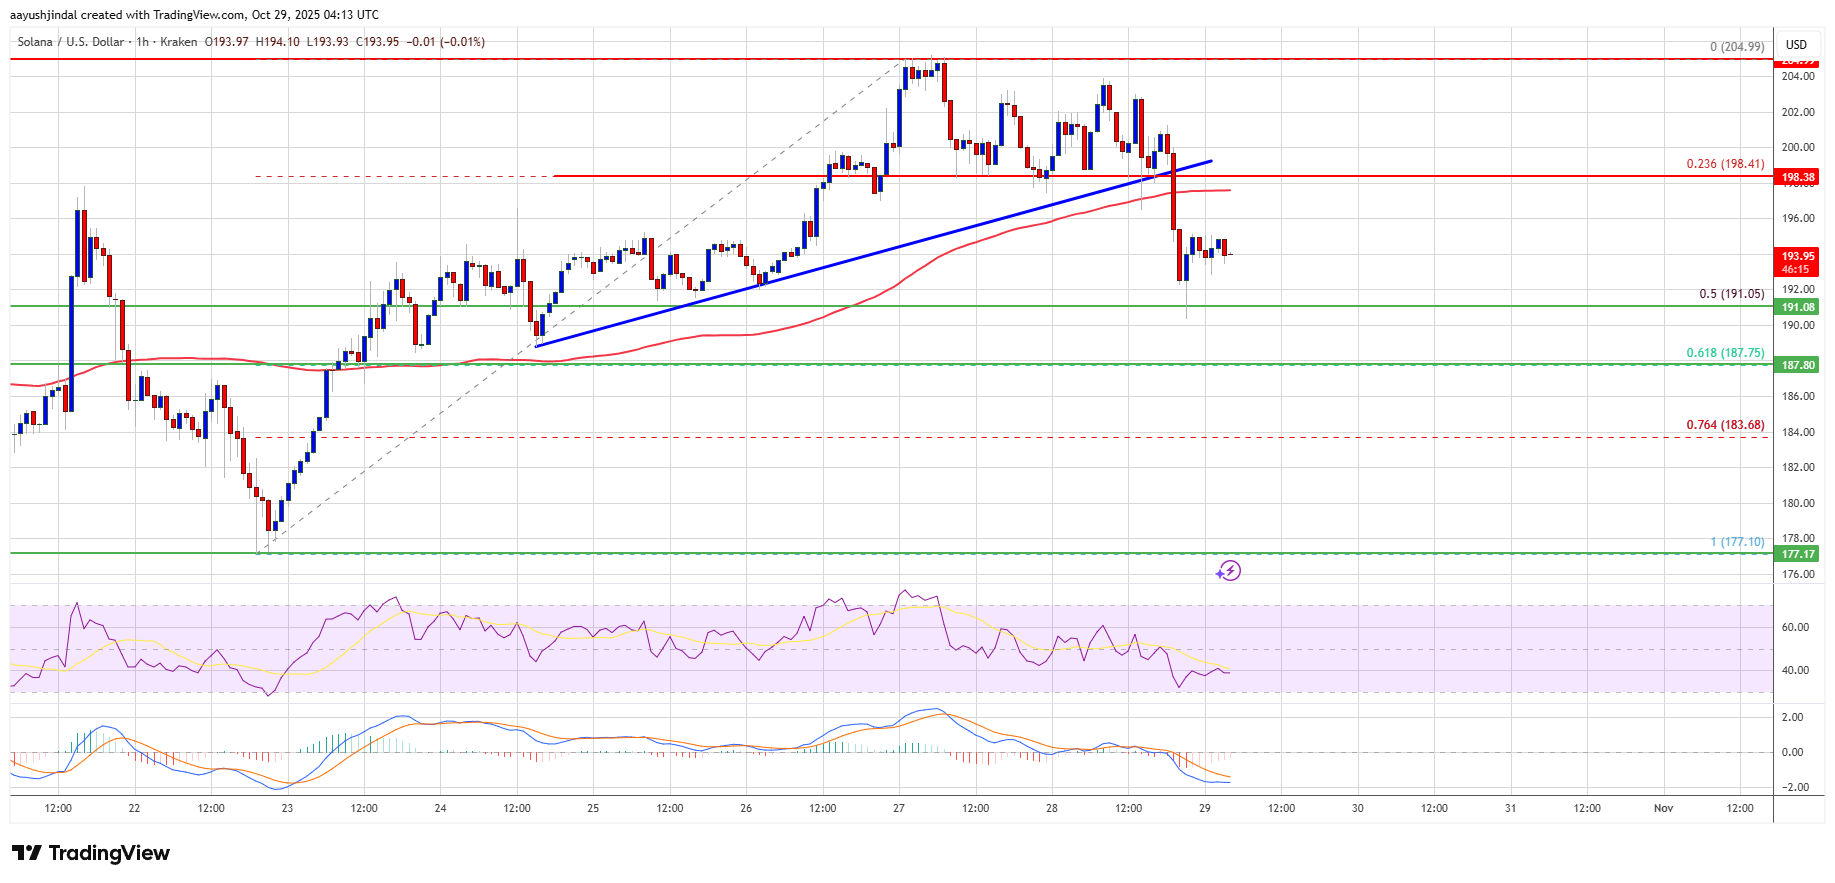

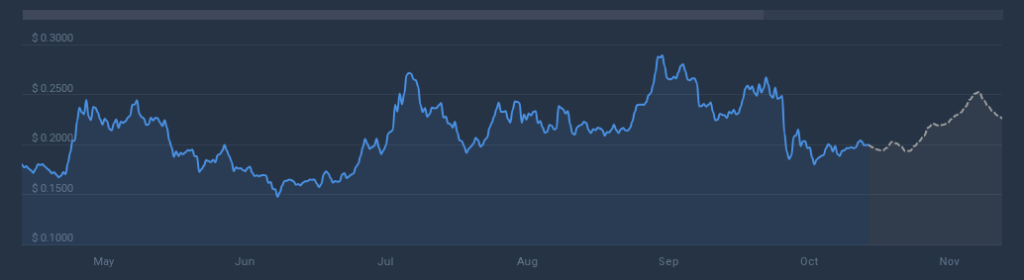 Outlook And Risks Ahead