Curiosity of a child destroyed 50 of his father’s Samsung SSDs worth $4000, which were holding around 25TB of storage. It’s said that the boy bent all the solid-state drives, rendering them completely unusable.
The father, who appears to run a computer repair or sales business, shared photos of the damaged drives on a Vietnamese Facebook group called “Build a PC is Easy,” via Tom’s Hardware.
Child destroys 50 Samsung SSDs
In his post, he described himself as “the most miserable dad in the world.” He explained that prices for RAM, graphics cards, SSDs, and CPUs have increased sharply, yet his son decided to test the durability of the drives by bending them.
The photos show the drives bent into curved shapes, some more severely than others. Many have cracks along the PCBs. M.2 SSDs are thin and fragile, designed for secure installation in a slot, not for handling that involves force.
There remains a small chance that some drives could still work. If the bends avoided damaging key areas or breaking internal connections, a portion might function.
Source: Build a PC (Facebook Group)
The incident occurred amid rising prices for computer components. Each drive was valued at about 2 million Vietnamese dong, or roughly $76 based on current exchange rates. For 50 units, the total comes to approximately $3,800.
The story spread quickly across tech sites and forums after the Facebook post. Many expressed sympathy for the father while noting the importance of keeping valuable parts out of reach from young children.
Galaxy S23 FE has now joined the growing list of Samsung devices testing One UI 8.5 internally. The public beta is available for Galaxy S25 users, but internal testing is simultaneously underway for many more devices.
Samsung’s first One UI 8.5 build for the Galaxy S23 FE carries version GYLF (via Alfaturk). Users shouldn’t hope for a Beta Program, as Stable will come directly.
Recently, One UI 8.5 builds surfaced for the Galaxy S22 Ultra and Tab S9 series. Galaxy S23 FE has also joined the other models, including the main Galaxy S23 lineup, in testing the upcoming software based on One UI 8.
Back in October 2023, Samsung launched the Galaxy S23 FE. It arrived with the Android 13-based One UI 5 operating system. It’s eligible for four years of major OS and security patches, with Android 17-based One UI 9 confirmed.
One UI 8.5 Update
Samsung is developing One UI 8.5 for the Galaxy S26 series. The new flagships will launch preinstalled with the new software. The company will then provide select new features and design changes to older devices with updates.
The software rollout may begin in the second quarter of next year. The new flagship phones are reportedly coming out in February. The update won’t be accessible to older devices instantly, but they have to wait a few months.
Samsung has already completed the Android 16 deployment. All Galaxy devices eligible for the upgrade have received the new OS. The upcoming One UI 8.5 will take over One UI 8, but the OS level will remain Android 16.
Samsung will continue its efforts to make foldables mainstream, with the Galaxy Z Fold 8 camera setup leak coming as the latest justification.
Folks over at GalaxyClub revealed the camera specifications of the Galaxy Z Fold 8 phone, which Samsung will launch in the second half of next year. It’s more important than ever as it will compete with Apple’s first foldable device.
Galaxy Z Fold 8 camera upgrades over Fold 7
Telephoto
Samsung could bring the Galaxy Z Fold 8 with an upgraded Telephoto camera. The company is said to be using a new 12-megapixel telephoto sensor. The resolution could improve from 10-megapixel, but the optical zoom may remain 3x.
Ultrawide
Galaxy Z Fold 8 might use an upgraded Ultrawide camera with 50-megapixel resolution. It could replace the existing 12-megapixel sensor that Samsung has been using for years, matching the Galaxy S25/S26 Ultra.
With the new Ultrawide sensor, the Galaxy Z Fold 8 will become equivalent to the Galaxy S26 Ultra in terms of camera. It will just lack a 50-megapixel periscope sensor, and others will match the upcoming Ultra flagship.
Other camera sensors
Samsung may keep using the 200MP main and 10MP selfie cameras. The three sensors are unlikely to see any significant upgrade. Still, it’s a better upgrade on the upcoming foldable as compared to the Galaxy S26.
The Galaxy Z Fold 8 will have two front cameras, each on the cover and inner screens. With the Galaxy Z Fold 7, the company has dropped the under-display camera tech from the main display to improve picture quality.
Samsung could launch the Galaxy Z Fold 8 along with a Wide Fold model and Z Flip 8 around July 2026.
Samsung is readying the Galaxy S26 Plus for India launch. The smartphone’s battery has just appeared in the database of the country’s certification authority. The development signals that the behind-the-scenes work is moving fast.
According to the info, the BIS authority of India has listed EB-BS946 (battery unit) for the Galaxy S26 Plus. The solution’s model number confirms it’s crafted for the middle child of Samsung’s upcoming Galaxy S26 flagship lineup.
It’s a lithium-ion battery manufactured by an India-based company. While the listing doesn’t disclose the battery’s capacity, it’s almost confirmed to be the same as the Galaxy S25 Plus, which has a 4,900mAh battery inside.
Earlier, the Galaxy S26 and S26 Ultra have surfaced on the BIS database.
Source – BIS (India)
Samsung’s Galaxy S26 could come with a 4,300mAh battery, bigger than the S25. Meanwhile, the Ultra variant is unlikely to get a bigger battery. However, there were rumors that the device could end up packing a 5,200mAh cell.
The Galaxy S26 and S26 Plus may feature 25W and 45W peak charging speeds. There will be a minimal upgrade in terms of wireless charging due to Qi2. The Galaxy S26 Ultra could come with 60W wired and 25W wireless charging.
The South Korean tech giant has just unveiled the Exynos 2600 chipset. It’s a deca-core processor that is crafted using Samsung’s cutting-edge 2nm process. The AP comes with a faster CPU, a reliable GPU, and a blazing-fast NPU for AI.
The lineup’s unveiling is expected in February 2026, and it could push the first sale to early March.
Samsung has quietly started One UI 8.5 testing on the Galaxy S22 Ultra and Tab S9 series. The company’s premium smartphone and tablet lineup has finally joined the internal optimization, marking the first major step.
Galaxy S22 is the last flagship smartphone lineup that will receive the One UI 8.5 update next year. The company may also deliver One UI 8.5 to the Galaxy S21 FE, which also received the Android 16-based One UI 8.0 earlier.
Samsung has opened a public Beta Program for the Galaxy S25 series. Meanwhile, internal testing is also running for various phones and tablets. It remains to be seen whether more Galaxy devices join the open Beta Program.
As spotted, the first One UI 8.5 builds carry PDA version numbers ending with HYLF and EYL1 for the Galaxy S22 Ultra and Tab S9 series, respectively. Pay attention, the S22 and S22 Plus will also receive the upcoming software.
Note that the builds will keep changing throughout the internal testing phase. The concerned phones and tablets are unlikely for the Beta Program. That said, you have to wait until the official rollout begins in Q2 2026.
Samsung’s One UI 8.5 brings a redesigned user interface with vibrant aesthetics. Various apps and services have adopted dynamic UI changes. The application or blur is also worth praising, as it significantly improves the UX.
One UI 8.5 will be released with the Galaxy S26 series early next year. The company has also confirmed the update will be provided to various Galaxies. However, the rollout will be sequential for qualifying devices.
BSV has traded under the 200-day EMA band since early 2025, indicating a bearish trend.
Analysts predict a gradual price increase, with potential highs reaching $175 by 2030.
Bitcoin SV price (BSV) has been on muted growth trajectory compared to other altcoins. Since the beginning of the year, signaling prolonged bearish sentiment, Bitcoin SV (BSV) has consistently traded below its 200-day EMA band.
Despite attempts to gain traction, the asset has failed to show any long-term bullish reversal, raising doubts among investors and traders about its recovery potential.
Even it’s a non-profit organization, BSV association, optimistic activities like successful collaboration and hackathon events are not manifesting on the BSV price chart
Many ask: “Can BSV Price break bearish trend above 200-day EMA?, “Is BSV a hidden gem waiting for its breakout, or just another risky bet?”. In this Bitcoin SV price prediction 2025 article, we’ll explore the future for BSV Price from 2025 through 2030.
Bitcoin SV Price Today
Cryptocurrency
Bitcoin SV
Token
BSV
Price
$17.8601 1.73%
Market Cap
$ 356,537,255.38
24h Volume
$ 26,517,640.8690
Circulating Supply
19,962,831.25
Total Supply
19,962,831.25
All-Time High
$ 491.6354 on 16 April 2021
All-Time Low
$ 17.0884 on 19 December 2025
Bitcoin SV (BSV) Price Analysis
The price of Bitcoin SV (BSV) has experienced significant volatility. Whereas, in the latter half of 2024, BSV formed an ascending broadening wedge pattern, which fueled a strong buying movement throughout Q4 2024, aligning with Trump’s election win. This successfully pushed the price from the lower to the upper boundary of the wedge and culminated in a high of $86 after early 2024 high of $126..
BSV Price Analysis 2025: Outlook Of Remainder Days
The current status of Bitcoin SV’s price (BSV) presents an exceptional opportunity for savvy investors. Despite experiencing a downturn in 2025, marked by a significant sell-off, BSV’s price is currently forming a falling wedge pattern that suggests potential for a turnaround.
Currently, the BSV price is on a downward trajectory, potentially approaching the $14 mark on the weekly chart. This level aligns with the lower boundary of the falling wedge, but we anticipate that bullish demand will emerge.
This temporary decline is likely a precursor to a possible turning point. While the current price action may seem subdued, it seems BSV is approaching a turning point where renewed demand could trigger an impressive parabolic breakout around the $14 level.
Additionally, the tightening price action each month indicates a strong contraction in prices, which may lead to greater expectations for a significant rally in 2026. If market conditions stabilize, we could unlock substantial upward movement ahead.
Conversely, if demand falters, we may witness further declines. Nonetheless, the future holds promising potential for BSV/USD, and investors are eager to see how this unfolds on the chart.
Bitcoin SV Price Target December 2025
At present, all weekly candlesticks in the BSV/USD chart are clearly indicating a strong bearish trend. While we do see a few bullish candles attempting to show buyer resistance, these efforts are overwhelmingly overshadowed by selling pressures.
We anticipate that this decline will continue into December as it has already lost $20 support, but there’s a potential recovery opportunity if demand meets expectations around when BSV hits $14 level.
Given the lack of momentum in November and now in December, too, it’s highly unlikely that December will ignite a rally. Thus, a bearish outlook is far more probable, with minimal chances for upward movement unless a significant catalyst emerges in the market.
Moreover, any positive bullish trends that may emerge should be viewed with caution, as meaningful developments are more likely to materialize in 2026, contingent upon observable demand.
Month
Potential Low ($)
Average Price ($)
Potential High ($)
BSV Coin Price Prediction December 2025
20
27.5
45
Bitcoin SV Onchain Analysis
In the second half, the price may be deteriorating badly, but the onchain data signifies that it is strengthening gradually. In the second half of the year 2025, it has made 58 million transactions by delivering 102 peak TPS. This means that market participants using BSV have increased in the second half, despite the price fall.
Bitcoin SV Price Forecast 2026-2030
Year
Potential Low ($)
Average Price ($)
Potential High ($)
2026
60
90
130
2027
75
95
145
2028
85
115
155
2029
95
125
165
2030
105
135
175
This table, based on historical movements, shows BSV price to reach $175 by 2030 based on compounding market cap each year. This table provides a framework for understanding the potential BSV price movements. Yet, the actual price will depend on a combination of market dynamics, investor behavior, and external factors influencing the cryptocurrency landscape.
Market Analysis
Firm Name
2025
2026
2030
Digital Coin price
$78
$94
$199
Coindataflow
$75
$36
$70
Coincodex
$26
$21
$35
Swapspace
$23
$46
$360
Never Miss a Beat in the Crypto World!
Stay ahead with breaking news, expert analysis, and real-time updates on the latest trends in Bitcoin, altcoins, DeFi, NFTs, and more.
FAQs
How much will 1 Bitcoin (BTC) be worth in 2025?
BSV may hit a high of $117 in 2025, with an average price of $86 and potential lows around $55, based on market trends.
What is the long-term price forecast for Bitcoin SV by 2030?
BSV could reach up to $175 by 2030 if adoption increases and it regains investor confidence.
What is the price prediction for Bitcoin SV in 2040?
If growth compounds, BSV could potentially exceed $300–$500 by 2040, but risks remain.
What is the future of Bitcoin SV?
BSV’s future depends on adoption, developer activity, and breaking key resistance levels.
Is Bitcoin SV the real Bitcoin?
Bitcoin SV claims to follow Bitcoin’s original vision, but it isn’t considered BTC by the broader market.
The live price of The Graph crypto is $ 0.03654897.
Price predictions for 2026 range from $0.05 to $1.75.
In 2030, GRT may hit a high of $3.55, reflecting long-term growth.
AI may be taking center stage in today’s tech revolution, but behind every smart application lies the challenge of accessing and organizing reliable data. That’s where The Graph (GRT) steps in—an innovative indexing protocol transforming how blockchain data is queried.
As interest in The Graph surges, especially after its major 2025 upgrades and the launch of substreams-powered subgraphs, the question on everyone’s mind is: Can GRT price reach $1? In this article, we break down its technical potential, rising developer adoption, and market sentiment in our detailed The Graph Price Prediction 2026–2030.
The Graph (GRT) Analysis 2025 Displays Muted Price Action
The Graph Network has recently improved its fundamental growth, yet this strength is sharply diverging from its prolonged bearish GRT price action.
The network, is majorly used by developers and data consumers who pay to query data, is flourishing, per onchain. yet, the GRT remains significantly suppressed, presenting a notable contrast that is at the heart of its current analysis.
Why On-Chain Hints Flourishing Network and Ecosystem Growth In “The Graph”?
As per the data onchain, the performance of The Graph Network can be directly assessed by the growing “volume of queries” and the “accrual of query fees”.
In this context, the data reveals that over the last six months, its query volume has impressively reached 11.6 billion, which displays a clear sign of robust developer adoption that has been particularly fast since the network’s migration to Arbitrum.
Similarly, the query fees generated by data consumers on Arbitrum have also reached an all-time high of $8.11 million in August.
This success is supported by a large community of over 167,000 delegators and 7,204 active curators, all contributing to the network’s health.
In addition, the growing ecosystem is also in the spotlight by recent integrations with major brands like Tron, pointing to a strengthening on a fundamental level.
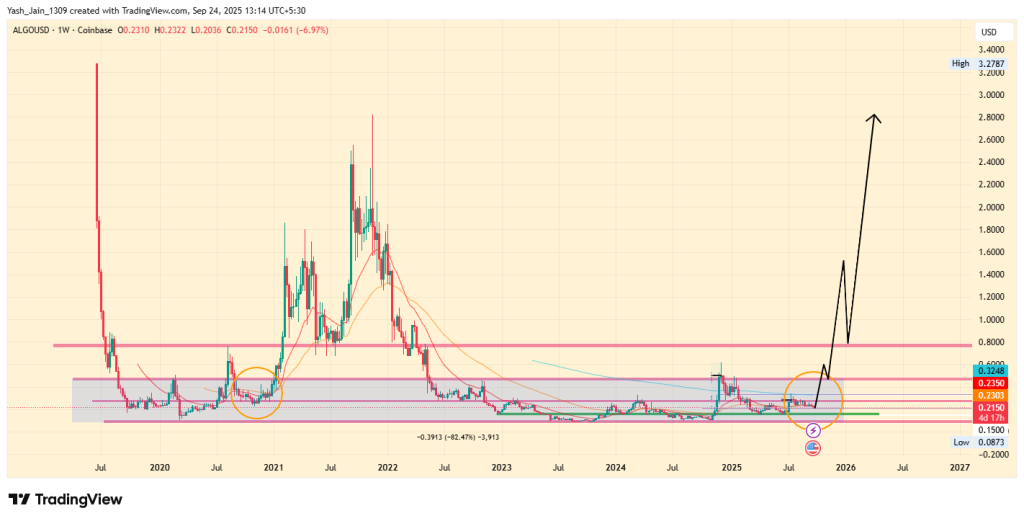
GRT Price Chart History (2021-2025)
Despite having strong fundamentals holding its ground, the Graph (GRT) token has seen a muted price journey. It’s currently down more than 80% from its 2024 peak and over 95% from its all-time high in 2021. This disconnect between its price and its core strength is a key point of technical analysis.
Since the 2021 crash, GRT has been declining on its monthly chart and reached $0.055 by 2022 end. Then in the beginning of 2023 started rising and reached $0.49 in March 2024. Since then, the price of GRT has continued a multi-month correction.
Currently, GRT is in a prolonged downtrend that has lasted several months on the weekly chart from the last seen high of $0.49 in early 2024. But, the expectations were strong when it hit the late 2022 support area. It was expected that with a weekly consolidation, the price could rise, as prices often respond to previous demand areas, but it has lost this level in December, making things worse for GRT price action
GRT Price Prediction 2025 December
In 2025, GRT/USD has been bleeding but has reached a key dynamic support trendline on the GRT weekly chart. However, the demand is lacking and could continue to trade on this support.
This is because the macroeconomic factors aren’t supportive, and there is excessive caution in the market, keeping GRT prices subdued.
The GRT price prediction 2025 suggests that it will conclude the year below $0.040.
GRT Price Prediction 2026
Moreover, the challenges faced in 2025 were significant, yet the trajectory for the future is becoming clearer as we move into 2026.
A detailed analysis of market patterns reveals that it is strategically sidestepping major demand areas. This suggests a deliberate approach to liquidate a larger number of long positions, paving the way for an upcoming future rally.
This presents an exciting opportunity for a substantial upward movement in prices, likely to materialize in Q1 of 2026. The potential for a strong reversal is high, with expectations of retesting critical levels around $0.20 or even reaching $0.34 early in Q1 2026.
Year
Potential Low ($)
Potential Average ($)
Potential High ($)
2026(weak demand case)
0.05
0.20
0.34
2026(strong demand case)
1.05
1.20
1.75
GRT Coin Price Prediction 2026-2030
Year
Potential Low ($)
Potential Average ($)
Potential High ($)
2026
1.05
1.20
1.75
2027
1.55
1.70
2.15
2028
2.15
2.20
2.65
2029
2.25
2.70
3.25
2030
3.15
3.20
3.55
What Does The Market Say?
Firm Name
2026
2030
Changelly
$0.320
$1.89
priceprediction.net
$0.493
$2.26
DigitalCoinPrice
$0.27
$0.58
Never Miss a Beat in the Crypto World!
Stay ahead with breaking news, expert analysis, and real-time updates on the latest trends in Bitcoin, altcoins, DeFi, NFTs, and more.
FAQs
What is the price of 1 GRT Token?
At the time of writing, the price of 1 The Graph Token was $ 0.03654897
What is the price prediction for GRT in 2026?
GRT price in 2026 may range from $0.05 in weak demand to $1.75 in strong demand, with an average target near $1.20.
What could The Graph (GRT) be worth in 2030?
By 2030, GRT could trade between $3.15 and $3.55 if adoption continues and the protocol becomes a core data layer for Web3.
Is The Graph (GRT) a good long-term investment?
GRT has strong fundamentals, growing developer adoption, and real utility, making it a promising long-term project, though price volatility remains high.
Can GRT reach $1?
Yes, based on network growth and adoption, some projections suggest GRT could reach between $1.05 and $1.75 by 2026, though market conditions will ultimately determine its price path.
The live price of the LINK token is $ 12.22377735.
Price prediction for 2026 suggests a potential high of $55.
Long-term forecasts indicate LINK could reach $195 by 2030.
Chainlink has emerged as a game-changing decentralized oracle network, enabling smart contracts to connect seamlessly with real-world data, APIs, and traditional financial systems. As the crypto market evolves, Chainlink’s role continues to expand, especially with its Cross-Chain Interoperability Protocol (CCIP) gaining traction. Its native token, LINK, not only powers the ecosystem but has also caught the attention of investors and analysts. As a result, institutional interest surged, leading to the launch of the LINK ETF by Grayscale in early December 2025.
With LINK price showing signs of a potential breakout and strong on-chain fundamentals backing its rise, the big question remains: Can LINK coin price hit $50 in December 2025? Let’s dive into this detailed Chainlink price prediction 2026–2030 to find out.
The wedge formed by the cup and handle pattern is approaching its final completion phase. However, it is unlikely that this will lead to a rally in December. In fact, the evidence suggests that the price will continue to bleed and consolidate, remaining below $18 until the end of the month.
Month
Potential Low ($)
Potential Average ($)
Potential High ($)
LINK Crypto Price Forecast December 2025
10
18
30
Chainlink Price Analysis 2025
In 2025, Chainlink price (LINK) started the year on a downward path, but by April, the tide began to turn. Early in April, LINK began its recovery from a low of $10.067.
By May, it had formed a bullish rounded bottom pattern, with a crucial neckline set at $18. However, since mid-May, LINK faced challenges in maintaining its position near this neckline.
By the third week of June, it pulled back toward the support level of the rounded bottom, which coincides with a multi-year support zone around $11.
In the final week of June onwards, the LINK price began to rise and main rally came from $11 to $28 between July and August. This surge was primarily triggered by the successful launch of the Chainlink Reserve.
However, after reaching its peak, profit-taking in late August led to a decline in the LINK/USD price, which dropped to $11.75 by November 21st. This price point coincided with the lower border support of a declining wedge, which is part of a cup-and-handle pattern where the handle is represented by the declining wedge.
By late November, the price began to rise again, facing some challenges around the $13.30 mark. On December 3rd, momentum shifted positively when Grayscale launched its LINK ETF, GLNK, resulting in a 25% increase and enabling the price to clear the 20-day EMA band on the daily chart. It now appears that LINK price is headed to retest the upper boundary of the handle as well as the falling wedge.
The optimistic forecast for LINK/USD in 2025 has been low because the FOMC failed to generate positive momentum. Additionally, the BOJ is another significant concern, increasing bearish odds. However, 2026 seems more opportune than 2025.
Chainlink Price Prediction 2026
On the weekly chart, a long-term ascending trendline has been consistently in effect over multiple years. This trendline has proven its reliability by producing upward price movements on numerous occasions, reinforcing its credibility as a key technical indicator.
Looking ahead, the Chainlink price prediction 2026 suggests that the potential for a significant price surge reminiscent of the explosive rally observed in 2020, remains high. Analysts suggest that such a rally could see prices target the range of $48 to $55, driven by strong market momentum and bullish sentiment.
For those taking a more conservative outlook, even the lower end of the targets suggests a promising rally, with predictions pinpointing a price range of approximately $32 to $36 by 2026. This presents a favorable risk-reward scenario for investors monitoring this trendline and assessing their market strategies.
Year
Potential Low ($)
Potential Average ($)
Potential High ($)
2026
35
50
55
Chainlink Price Targets 2026 – 2030
Year
Potential Low ($)
Potential Average ($)
Potential High ($)
2026
35
50
55
2027
48
64
80
2028
58
85
104
2029
70
108
141
2030
85
147
195
This table, based on historical movements, shows Chainlink price to reach $195 by 2030 based on compounding market cap each year. This table provides a framework for understanding the potential LINK price movements. Yet, the actual price will depend on a combination of market dynamics, investor behavior, and external factors influencing the cryptocurrency landscape.
Market Analysis
Firm Name
2025
2026
2030
Changelly
$15.32
$25.83
$140.70
coincodex
$10.66
$6.44
$14.79
Binance
$17.55
$18.43
$22.40
Mitrade
$22.64
$32.22
$139.2
Investing Haven
$39.20
$54.10
$80
Flitpay
$40.6
$62.6
$110
*The aforementioned targets are the average targets set by the respective firms.
Never Miss a Beat in the Crypto World!
Stay ahead with breaking news, expert analysis, and real-time updates on the latest trends in Bitcoin, altcoins, DeFi, NFTs, and more.
FAQs
How much is Chainlink worth?
At the time of writing, the value of one LINK crypto token was $ 12.22377735.
What is the price prediction for Chainlink in 2026?
Chainlink price prediction for 2026 suggests LINK could trade between $35 and $55, with an average price near $50 under bullish conditions.
How much will 1 Chainlink be worth in 2030?
By 2030, 1 Chainlink could be worth between $85 and $195, depending on adoption, market cycles, and long-term crypto growth.
Where will Chainlink be in 5 years?
In five years, Chainlink is expected to be a core Web3 infrastructure, with broader adoption and a potential price range of $80–$140.
Is Chainlink a good long-term investment?
Chainlink is considered strong long term due to its real-world utility, oracle dominance, institutional adoption, and expanding cross-chain ecosystem.
What factors influence Chainlink price predictions?
LINK price is driven by oracle demand, CCIP adoption, staking growth, institutional interest, crypto market cycles, and global liquidity trends.
The live price of the Cardano token is $ 0.36027610.
Price prediction suggests potential to reach $2.75 to $3.25 by year-end 2026.
Long-term forecasts indicate ADA could hit $10.25 by 2030.
The Cardano price prediction 2026 is generating significant buzz in the crypto market, as the last quarter is soon to close in few days, boosting interest for the next altcoin. The 2025 for ADA/USD began with numerous fundamental updates strengthening its future, including the transformative Plomin Hard Fork, but 2026 seems even more constructive.
From January to December 2025, the price of Cardano (ADA) has undergone a significant decline, particularly notable after reaching an impressive peak of $1.32 in December 2024.
Upon examining the Cardano price chart, a falling wedge formation has emerged during this downward trend. This pattern often indicates a potential reversal, which could be the next possible move for ADA/USD price action.
However, the macro conditions and cautious interest are the major barriers that prevent ADA from meeting all necessary conditions to shift the trend with a strong catalyst involved. The pattern itself suggests that a bullish trend could follow the current bear market, but 2025 does not appear to be the chosen year for it.
The recent downturn followed a brief attempt to regain a foothold above the vital $1 threshold in August 2025, proving that the pattern is only followed but not broken yet, and neither is there solid demand, further strengthening the possibility that December could conclude below $0.40.
However, Q1 2026 seems more promising than Q1 2025, and Q1 could see an expansion towards $1 and potentially reach higher levels based on demand and liquidity.
Cardano AI Price Prediction For December 2025
Source
Low Price
Average Price
High Price
Gemini
$0.85 – $0.95
$1.00 – $1.20
$1.30 – $1.50+
BlackBox
$0.65
$1.00
$1.50
ChatGPT
$0.75
$0.95
$1.25
ADA Price Prediction 2026
The Cardano price prediction 2026 highlights a crucial support level on its weekly chart, a zone that has historically functioned as a solid pivot point for price trends, and gives another rally vibes now.
This support level is known for displaying remarkable resilience over time, suggests that if Cardano price USD can maintain its position above this threshold once again, it could pave the way for significant price movements in 2026.
Looking back at Cardano’s historical performance on weekly chart, it reveals an extraordinary rally that occurred in 2020, when the asset experienced staggering gains of nearly 4000%.
During that bullish phase, Cardano price USD spent an extended period consolidating around the dynamic support trendline, which seems like a strategical accumulation at discounts from wsmart money, that contributed significantly to its eventual surge.
Let’s say, if the current market sentiment shifts positively, then a resurgence in investor confidence could lead to a recovery. Not ambitiously, even modestly to that past performance could give tremndous surge, last was 4000%, if we assume 1/4th of that momentum it will be an increase of approximately 1000%, which could definitely elevate Cardano’s price to an estimated $4.50 by 2026.
On the other hand, a more cautious approach allows for a realistic price target of around $1.40, reflecting a gain of about 300%. This projection remains possible, particularly as it is grounded in fundamental analyses and market trends independent of speculative catalysts such as the potential approval of exchange-traded funds (ETFs).
More to that, Many analysts suggest that these ETFs could serve as game-changers by increased institutional investment and market stability.
In a scenario where ETF approvals come to fruition and retail investor enthusiasm surges then Cardano’s price could realistically fall within the range of $2.05 to $2.80.
Scenario
Potential Low
Average Price
Potential High
Without ETF Approval
$0.85
$1.10
$1.25
With ETF Approval + Retail Surge
$1.20
$1.65
$2.05
Bullish Breakout (with ETF & macro support)
$1.50
$2.05
$2.80
Cardano (ADA) Price Prediction 2026 – 2030
Price Prediction
Potential Low ($)
Average Price ($)
Potential High ($)
2026
2.75
3.00
3.25
2027
4.50
4.75
5.00
2028
5.25
5.50
5.75
2029
6.75
7.25
7.75
2030
9.00
9.75
10.25
This table, based on historical movements, shows ADA prices to reach $10.25 by 2030 based on compounding market cap each year. This table provides a framework for understanding the potential Cardano price movements. Yet, the actual price will depend on a combination of market dynamics, investor behavior, and external factors influencing the cryptocurrency landscape.
Based on the historic market sentiments and trend analysis of the altcoin, here are the possible Cardano price targets for the longer time frames.
Market Analysis
Firm Name
2025
2026
2030
Changelly
$0.752
$1.18
$6.05
Coincodex
$0.79
$0.53
$0.89
Binance
$0.79
$0.83
$1.01
*The aforementioned targets are the average targets set by the respective firms.
Coinpedia’s Price Analysis provides you with the latest content on the recent market trend that enables you to get closer to the price movements & actions of the various cryptocurrencies.
Never Miss a Beat in the Crypto World!
Stay ahead with breaking news, expert analysis, and real-time updates on the latest trends in Bitcoin, altcoins, DeFi, NFTs, and more.
FAQs
What is Cardano’s (ADA) price prediction for 2026?
Cardano could trade between $2.75 and $3.25 in 2026 if market sentiment improves, adoption grows, and key support levels hold.
Is Cardano a good long-term investment?
Cardano is considered a long-term project due to its research-driven development, scalability upgrades, and focus on decentralization.
What factors could drive ADA’s price higher in the future?
ETF approval, institutional adoption, network upgrades, and improved macro conditions could all positively impact ADA’s price.
Where will ADA be in 5 years?
In five years, ADA could trade between $7 and $10 if Cardano adoption grows, scalability improves, and the crypto market enters a strong cycle.
What will Cardano be worth in 2030?
By 2030, Cardano could be valued around $9 to $10 based on long-term growth, network usage, and sustained investor confidence.
Samsung SmartThings upgrades with the integration of the Matter 1.5 camera. It’s a pretty big deal for smart home users, as SmartThings has become the first to support Matter cameras ahead of its rivals in the segment.
On December 18, Samsung announced SmartThings now supports Matter 1.5, expanding the platform to support Matter-compatible camera.
The South Korean tech giant also disclosed its collaboration with global IoT device makers, including Aqara, Eve and Ulticam, to develop Matter cameras, and these products are expected to roll out starting in March 2026.
SmartThings update coming
Samsung says it will update the SmartThings app to support Matter cameras. The company will launch an updated version of SmartThings later this month, and the app update will roll out sequentially around the world.
The next SmartThings update will expand its existing list of Matter devices by adding cameras. The list currently has lights, door locks, switches, and various sensors.
Matter 1.5
The main role of Matter 1.5 is the adoption of a camera standard. That said, Matter 1.5 supports a wide range of camera use cases, including indoor and outdoor security cameras, video doorbells, and more.
Beyond camera support, the new Matter standard comes with useful features, including live video streaming, two-way communication, motion detection, event history, and pan-tilt-zoom controls.
“Samsung aims to ensure that products and services built on different brands and protocols deliver a unified experience through SmartThings,” said Jaeyeon Jung, Executive Vice President and Head of SmartThings Team at Samsung Electronics. “We will continue to expand our support for industry standards, including Matter, and further strengthen collaboration to drive new customer experiences.”
Samsung has introduced the Exynos 2600, its latest flagship mobile chip. What sets it apart is its advanced approach to heat management, featuring a technology that no other mobile system-on-chip (SoC) has used in this way before.
Built on a 2nm process, this processor marks a significant step forward in performance and efficiency. However, the key innovation of the Samsung Exynos 2600 chip is HPB (Heat Path Block) packaging technology.
Samsung explained HPB and its benefits on the Exynos 2600 landing page. HPB is a copper-based component that sits directly on top of the processor die.
In earlier designs, DRAM was stacked on the chip, blocking direct access for cooling. Samsung moved the DRAM to the side, allowing the HPB to make full contact with the hot areas.
Heat moves out faster through conduction, reducing temperatures by up to 30 percent compared to previous Exynos chips, extending the 2nm enhancements way beyond.
Samsung also uses High-k EMC (epoxy molding compound) material, which has better thermal properties. Together, these changes lower thermal resistance and keep the chip stable under load.
Source – Samsung
Past Exynos models faced criticism for throttling during extended use, such as gaming. The HPB addresses this directly at the package level. It draws from techniques used in PCs and servers but adapted for thin smartphones.
Samsung’s decision to integrate this cooling method shows confidence in the design. Reports indicate the company may offer HPB technology to other chip makers, highlighting its potential impact on the industry.
Samsung has made it an Exynos Day by unveiling the Exynos 2600 processor. Meanwhile, a new report from Korean media suggests that Samsung has almost finalized the February launch of the Galaxy S26 series in the US.
It was revealed that the product planning has led to the Unpacked event being delayed by 4 weeks. The company may hold its first Unpacked 2026 event in February, rather than the usual late January timeframe.
Now, a trusted Korean outlet reports that Samsung still plans to hold the Galaxy S26 launch event in February in the US. The latest input denies a recent report that claimed there’s no delay in the unveiling of new flagships.
Recently, it was reported that the Galaxy S26 Ultra’s production starts this month. However, the other two models have been pushed to early next year. This is due to the delay in spec and model finalization of the non-Ultra versions.
With Samsung pushing Unpacked to February, the first sale will also be impacted. Hopefully, the event doesn’t stretch to late February, or else, the release will most likely happen in the first or second week of March 2026.
Exynos 2600 will power the Galaxy S26 series in select regions outside the US. The flagships will bring Snapdragon 8 Elite Gen 5 stateside. Meanwhile, the Ultra version will exclusively use Qualcomm-made chip globally.
One UI 8.5 comes with a significant design refresh and UX improvements. The software has just entered Beta testing on the Galaxy S25 series, while the official version is slated to introduce even more AI features and tools.
Samsung unveiled more details about Galaxy S26‘s Exynos 2600 processor. The company uncovered crucial information about the process tech, CPU, and NPU improvements and potential benefits to consumers.
2nm process – GAA
Samsung says Exynos 2600 is under mass production. It’s the world’s first chipset fabricated using Samsung Foundry’s cutting-edge 2nm process. It leverages GAA Gate All Around technology to reduce size and improve efficiency.
CPU and NPU
Exynos 2600 is a “compact chip” that boasts a powerful CPU, GPU, and NPU. The modern components aim to offer enhanced AI and gaming experiences to Samsung fans purchasing the Galaxy S26 series next year.
“The Exynos 2600 delivers enhanced AI and gaming experiences by integrating powerful CPU, NPU and GPU into a single compact chip,” the company said on the website.
Exynos 2600 is said to deliver up to a 39 percent boost in CPU performance and a huge 113 percent faster NPU performance than Exynos 2600.
It has a deca-core CPU with tri-cluster architecture, featuring C1-Ultra 3.8 GHz, C1-Prox3 3.25 GHz, and C1-Prox6 2.75 GHz. It has an AMD-powered Xclipse 960 GPU and an AI engine with 32K MAC NPU.
On-device AI improvements
The processor’s upgraded NPU will ensure users have a better experience when it comes to on-device AI tasks. The chip makes on-device AI tasks quicker and more efficient, thanks to the new AI engine with 32K MAC NPU.
“Thanks to these improvements, you can perform more on-device AI tasks, such as intelligent image editing and AI assistant functions, quicker and more efficiently,” the company added.
Samsung is currently mass-producing the Exynos 2600 chipset. It will be used in the Galaxy S26 and S26 Plus, while a larger portion still goes to Snapdragon. The company’s in-house chip would see limited utilization in select countries.
The US financial landscape witnessed good numbers on December 18 from an key 3-star news. The latest Consumer Price Index (CPI) report has just revealed a much sharper decline in price pressures than analysts were anticipating before.
This cooling US inflation is currently sitting at a headline rate of 2.7% year-over-year, which has caught the markets all by surprise, and is now about to send a wave of optimism throughout the financial space, including crypto’s.
With even the core inflation down to 2.6% is like a icing on cake to investors, because the narrative of “sticky” inflation is now being replaced by expectations of a more lenient monetary environment in coming time, this will be much helpful in providing a much-needed boost to risk-on assets like Bitcoin, Ethereum, XRP, and many more in crypto space.
The Fed’s Path to Early 2026 Rate Cuts & BTC Odds to Rise Increases
The immediate reaction to the data was bullish in Bitcoin quickly jumping 2.5% from $87,179 to $89,401. This suggests that the Federal Reserve may no longer need to maintain its restrictive stance for as long as previously feared.
Investors are quickly repricing the Federal Reserve rate cuts for early 2026.
While the broader market is green, Bitcoin price still remains the focal point for institutional investors, who are still looking to capitalize on this improving macroeconomic shift.
Since, Bitcoin price surged immediately following the announcement, testing shortterm psychological resistance levels as traders exited defensive positions. Because BTC acts as a “liquidity sponge,” it is often the first to benefit from a weakening dollar.
This macro tailwind is expected to persist as long as the data supports a softening economy without a full-blown recession.
The Impact of Cooling US Inflation on Liquidity
The most significant long-term benefit for digital assets is the projected increase in crypto market liquidity. When the cost of borrowing decreases and the dollar stabilizes, more capital flows into decentralized finance and major cryptocuries. This specific trend of cooling US inflation suggests that the “liquidity winter” may finally be thawing, allowing for a sustained “Santa Rally” into the new year.
As we head into the final weeks of 2025, the focus remains on how the Federal Reserve will acknowledge this data in their upcoming communications. If the central bank confirms a dovish tilt, the momentum generated by this cooling US inflation could propel Bitcoin and the wider crypto market to new yearly highs, reshaping the investment landscape for the start of 2026.
Samsung continues to expand its December 2025 security update to Galaxy devices, with the A35, A54, A53, A13, and Tab A9 becoming the latest.
Over the past couple of hours, Samsung pushed the December 2025 security update to the Galaxy A35, A54, A53, and A13 phones, along with the Tab A9 tablet. Notably, the initial rollout is happening in South Korea and India.
Most of the devices are running Android 16-based One UI 8 firmware. Galaxy A13 is the only device operating on an older OS version. Meanwhile, the latest December SMR carries 68 fixes for Android CVE and One UI SVE items.
Previously, Samsung updated its Galaxy A15, A05, A24, M44, Tab S8 series, and Tab S10 FE series with new firmware updates. Additionally, plenty of Samsung devices on the Verizon network have also grabbed the latest patches.
Earlier this month, Samsung revealed a device chart eligible for monthly, quarterly, and biannual updates. The quarterly schedule brings the majority of mid-range and budget devices, making it a significant portion.
It has been noticed that the company isn’t pushing quarterly devices to the biannual chart. As of December, the biannual category has a handful of phones and tablets. Samsung is retiring devices directly from the quarterly chart.
How to update
Samsung phones bring built in tool to update software. You can access the menu through Settings > Software update. At this stage, tap the Download and install button to force the device connect to the server and fetch an update.
One UI 8.5 is equipping the Samsung Camera app with White Balance feature in Photo mode. The new adjustment tool is currently under development and expected to be applied in a future One UI 8.5 Beta build.
A new leak by PhoneArt suggests that One UI 8.5 could bring a new way to manually adjust white balance in the standard Photo mode.
Tests show that changes made with the slider do not apply correctly to the captured images. This is expected in early test builds, where features are added but still require polishing.
Until now, manual white balance on Samsung phones has been limited to Pro mode or Expert RAW app, requiring more steps. Bringing it to the Photo mode would make it accessible for everyday shooting without switching modes.
Photo White Balance
Users can access it by opening the Camera app, switching to Photo mode, tapping the settings icon with four dots, and selecting the WB option. This opens a slider that allows adjustments from around 3,000 Kelvin up to 10,000 Kelvin.
Under indoor lighting, the camera often produces cooler tones when warmer ones would be more accurate. Manual adjustment lets users correct these errors on the spot or apply a specific color temperature for creative effect.
The latest version of One UI 8.5 adds a function to the default camera. This kind of detail may only be easily found by me. The default camera adds the white balance adjustment function.Please take a look at my demonstration. You can adjust the white balance of the photos taken… pic.twitter.com/idRvFoqPxZ
Samsung has not confirmed when this white balance option will become active. The company is preparing the second One UI 8.5 Beta, which is likely to include other camera improvements, such as expanded options in Pro mode.
One UI 8.5 is also being prepared to bring back missing features like Single Take and Dual Recording through the Camera Assistant app. Given the current state, the WB tool may appear in a later Beta build once it works reliably.
Samsung has reportedly identified issues involving improper rebates at its subsidiary in Taiwan. The problems came to light during a standard internal audit of the unit, which handles sales and customer support in the local market.
A source from the semiconductor sector (via TheElec) said the audit revealed that some Samsung employees had accepted bribes from outside in exchange for favorable treatment on DRAM and NAND flash chip supplies.
The exact amount involved has not been made public.
DigiTimes report suggested multiple employees and distributors took part, leading to quick staff changes in marketing and sales teams.
DigiTimes reported that “multiple employees and distributors of Samsung Electronics Taiwan are known to be involved in the rebate misconduct,” and that “after auditors interviewed staff from various semiconductor-related departments, Samsung took immediate personnel action.”
The reports also mentioned possible involvement of senior officials and raised questions about similar issues in Samsung’s operations in Singapore and China.
The report further claimed, “The first round of personnel shifts occurred in the marketing and sales divisions, and the rebate controversy also affected high-ranking officials in the sales and marketing sectors,” adding that “there is a high possibility that the Singapore and China subsidiaries are also involved.”
However, the industry source noted that the audit found no prior rumors or complaints that triggered the review. It appears limited to individual actions in Taiwan, with the investigation still in progress.
No confirmation exists yet on problems in other regions.
Samsung begins internal One UI 8.5 testing on the Galaxy Z Fold 5 and Z Flip 5. The company’s software server has just listed early builds. The two foldables were released in 2023 and are gearing up to receive a major upgrade.
Galaxy Z Fold 5 and Z Flip 5 are now confirmed to receive One UI 8.5. Samsung initiated internal testing on the two devices months before potential release.
The first One UI 8.5 builds carry PDA version F946BXXU5GYLB and F731BXXU5GYLB for the Z Fold 5 and Z Flip 5, respectively, via TarunVats.
Meanwhile, a Beta Program is unlikely for the concerned phones.
Samsung has already begun internal tests on the Galaxy Z Fold 7, Z Flip 7, Z Fold 6, and Z Flip 6. 2023’s foldables are the latest to join early testing, while the Galaxy Z Fold 4 and Z Flip 4 are also eligible for the update.
At present, Samsung is Beta testing One UI 8.5 on the S25 series. The company released the first Beta build earlier this month, and the second Beta is probably coming later this month, along with an expansion to India and Poland.
One UI 8.5 is based on the One UI 8 (Android 16) operating system. While the main upgrade lacks UI tweaks and AI upgrades, the mid-cycle version aims to renovate the entire user interface with dynamic tweaks and refinements.
The South Korean tech giant will release the official One UI 8.5 update early next year. The upcoming Galaxy S26 series will come preloaded with the new software, and it will be provided to existing devices sequentially.
Samsung is finally bringing the December 2025 security update to the Galaxy S23, S23 Plus, and S23 Ultra. Though a bit late, the company’s 2023 flagships have received the latest security patches released this month.
The initial rollout has started in South Korea, and users of the Galaxy S23 phones can identify the December 2025 update via PDA build version ending with EYL1. Global expansion should follow over the next couple of days.
December update patches 68 improvements, covering Android and One UI. You may have been waiting for the One UI 8.5 Beta, but Samsung currently has no plan to expand the early access to older flagship phones.
The firmware aims to improve system stability and reliability. It also enhances the overall user experience by cleaning up cache and unnecessary app data. An alert will arrive soon, but you can also check for updates manually.
Updating the latest software update is no brainer on Samsung phones. Open the system Settings and enter the Software update section. Hit Download and install on that page to initiate firmware fetching on the server.
Source – Samsung Community Korea
One UI 8.5 Update
Samsung launched One UI 8.5 Beta for the Galaxy S25 series in 4 countries. It will expand to 2 more countries when Beta 2 arrives. In the official announcement, Samsung didn’t reveal a plan to bring the Beta Program to more users.
The official version will land early next year, but the rollout to older devices may take some time. We expect it to happen in the second quarter, but the expansion of the software update will take place sequentially.
One UI 8.5 Beta 2 could make Galaxy’s Pro Camera mode literally awesome. Samsung is reportedly bringing a pretty useful feature to the stock camera app’s Pro mode, and it’s highly likely to come stapled with the second Beta update.
Samsung is testing One UI 8.5 Beta on the Galaxy S25 series. The second Beta update is expected to arrive around December 22. The current availability to four countries would also expand to six, joining India and Poland.
Earlier, Samsung confirmed that Single Take and Dual Recording are returning to Galaxy flagships with the second Beta. Well, the One UI 8.5 Beta 2 may also bring a new feature to Pro Camera mode, something like presets.
Samsung may let users save Pro camera settings. Parameters can be clubbed and saved to become a preset. You may also be able to share presets using Quick Share to use the same settings on other compatible Galaxy devices.
Once created, the preset can be restored in Pro mode view. It will streamline your photography experience and make the entire capturing time-saving.
Samsung hasn’t clearly said such a feature is coming. However, the mention of “custom options for professional shooting” suggests so. It aligns with a previous input that emerged in October this year.
Camera Assistant will upgrade with the second One UI 8.5 Beta. This Good Lock app is expected to add a dedicated section for Single Take and Dual Recording. Like other features, the two modes can be activated and disabled.
Google released the QPR3 Beta 1 update for Pixel phones. The latest Android 16 update introduces a new expandable location tracking indicator, which would end up landing on Samsung and other Android phones in the future.
Android displays an indicator when the phone’s microphone, camera, or location is used. Google has upgraded the location indicator in Android 16 QPR3 Beta 1. The icon is no longer static, but has become expandable with new stuff.
The new location indicator shows up with a solid Blue background. When a location is being used by an app, it will show up in the status bar. Tapping the icon will open an expanded menu in pop-up view with detailed information.
This section will list the app or apps tracking your phone’s location. It all will happen in real time, and you will be able to revoke GPS access. You will have two options for the app using location: Close the app and Manage access.
Source – Android Authority
The Blue indicator will turn Green when the Location is being used along with the mic and/or camera. The color unification will ensure the access indicator won’t grab much space on your phone’s screen or the status bar.
Pixel phones running QPR Beta have received it with the latest release. Since it’s a core Android improvement, it would expand to Samsung phones too. It may show up in One UI 8.5 Stable, otherwise One UI 9 will bring it.
Pay attention, Google first added such an indicator in Android 12. After years, it has made a comeback in Android 16, but the testing is underway. Google may either improve its functionality or dump the indicator again.
Samsung will participate with its AI-powered smart gadgets at CES 2026 this January. The company today revealed its agenda and upcoming products.
CES 2026 will be the base for Samsung to unveil the next-gen Bespoke AI appliances. The improved products merge AI-powered customized care and powerful hardware-supported performance.
Featured innovations include the upgraded Bespoke AI AirDresser, Bespoke AI Laundry Combo, Bespoke AI WindFree Pro Air Conditioner, and the flagship Bespoke AI Jet Bot Steam Ultra robot vacuum.
2026 Bespoke AI Laundry Combo is coming with improvements, which shorten wash-to-dry cycles and enhance drying performance.
Samsung’s upgraded Bespoke AI AirDresser is returning with enhanced performance and greater convenience.
2026 WindFree Air Conditioner introduces AI technology and Motion Wind to address the key attribute, influencing purchasing decisions like wind modes.
Samsung’s new Bespoke AI Jet Bot Steam Ultra comes with advanced recognition technologies designed to reduce human intervention and simplify cleaning.
Source – Samsung NewsroomSamsung will put these Bespoke AI products on showcase at CES 2026. Visitors can explore more and have a firsthand experience by visiting Samsung’s showroom located inside Wynn Las Vegas.
Jeong Seung Moon, EVP and Head of the R&D Team for the Digital Appliances (DA) Business at Samsung Electronics, said:
“This year, to enhance the living experience, we are unveiling our upgraded Air Dresser, Laundry Combo and WindFree Air Conditioner, developed by integrating valuable customer feedback and leveraging the R&D expertise we have accumulated over the years.”
New leak paints out the clearest picture yet of the Samsung Exynos 2600 chip for the Galaxy S26 series. An insider has revealed the final specifications of the processor’s CPU, GPU, and other parameters.
Samsung insider PhoneArt (@UniverseIce) revealed the technical specs of the Exynos 2600 chip to be used in the Galaxy S26 series. The silicon seems to be incredibly powerful with a fast CPU and AMD-powered GPU inside.
CPU
Exynos 2600 is a deca-core processor, featuring 10 CPU cores. The AP incorporates a tri-cluster architecture, bringing a prime core clocked at 3.9Ghz, six performance cores clocked at 3.25Ghz and three efficiency cores clocked at 2.75Ghz.
It’s manufactured using Samsung Foundry’s cutting-edge 2nm process. As compared to the latest chips from Apple, Qualcomm, and MediaTek, Exynos 2600 has a generational edge given its fabrication process.
GPU
The leak says Exynos 2600 features an AMD JUNO-powered GPU @ 985MHz. Samsung could market the graphics processing unit as Xclipse 960 with Vulkan 1.3. Other technical parameters includes Open Gles 3.2 and OpenCL 3.0.
Meanwhile, tipster ErencanYılmaz claims that there are some minor errors in the Exynos 2600 specs leaked by PhoneArt.
As per the screenshots, Exynos 2600’s prime core is clocked at 3.8GHz, peak GPU frequency is 980MHz, and Vulkan version is 1.4. The performance cores and efficiency cores are clocked at 3.26GHz and 2.76GHz, respectively.
Samsung has officially confirmed the Exynos 2600 chipset. The company will soon reveal its new Exynos chipset. It will arrive right before the Galaxy S26 launch; till then, you can take the emerging leaks as a pinch of salt.
Galaxy S26 series could be unveiled in February, and sales begin in March. The Ultra model is being prioritized in mass production, while others are being pushed to early next year. Samsung will also unveil One UI 8.5 with the new phones.
Bitcoin ETFs, corporate treasuries and macro tailwinds are challenging BTC’s traditional four-year cycle, which could result in new all-time highs in 2026.
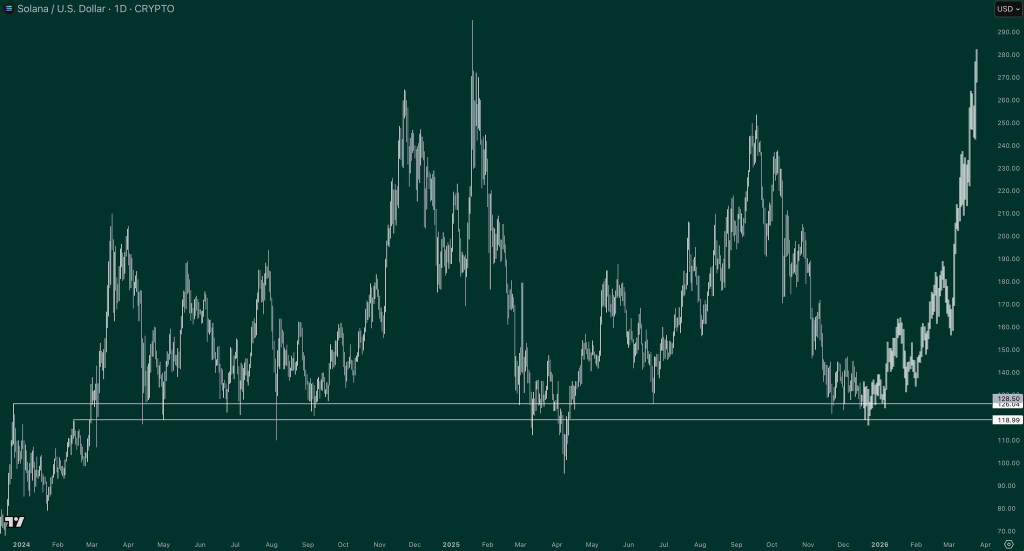
The SOL price is once again under pressure, but not without context. After slipping from $134 earlier this week, Solana now hovers near a long-term support range that has historically defined its most of the broader trend since 2024. As macro risks rise with BOJ in picture, traders are weighing whether this SOL/USD zone marks accumulation or vulnerability.
SOL Price Today Sits on a Crucial Support Range
The Solana price chart spanning from 2024 to the present highlights a a demand zone between $119 and $126, which has proved resilient all this time.
Now, when writing, the SOL price today is once again hovering near $127, which is only marginally above this key support area.
While short-term volatility has shaken confidence at least for now, the broader structure suggests differently. Solana has sustained for many months above a long-term base. It has repeatedly acted as a stabilizing zone, and as long as the price sustains above it, a deeper breakdown is not yet confirmed.
Also, if this week’s turbulence is absorbed without major damage, short-term conditions could improve, while the long-term SOL price forecast remains structurally intact.
Macro Pressure Puts Solana at a Crossroads
That said, macro conditions are now driving the narrative more than charts alone. The upcoming Bank of Japan rate decision on December 19 has become a pivotal risk event for all risk assets, including Solana crypto.
Since, Japan has long been a source of ultra-cheap liquidity through the process of yen carry trade. Now, at this vulnerable financial state globally, a rate hike would likely force all those carry traders to immediately unwind their positions, and if they do unwind, it will trigger an immense selling pressure across global markets. If we take crypto market specifically, then its evident that in previous BoJ hikes during 2024 and 2025, Bitcoin USD experienced sharp drawdowns of 20–30%, and Solana followed closely.
If such a scenario unfolds again, the SOL price USD may struggle to defend current levels. Conversely, a pause or dovish stance is what market needs that could relieve pressure and allow price to stabilize.
Similarly, despite near-term uncertainty, Solana crypto’s fundamentals remain intact. Whatever the short-term result may be, the Network usage, developer activity, and ecosystem growth are undeniably strong, which continues to support its long-term narrative. If macro conditions stabilize even modestly, the current setup could favor recovery rather than continuation lower.
Regulation and 2026 Outlook Shape SOL Price Prediction
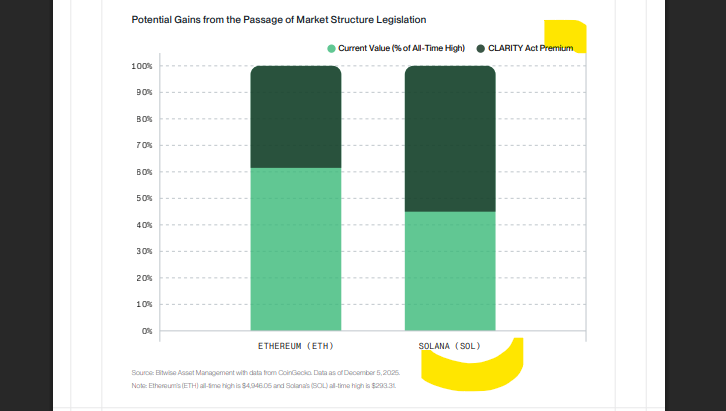
Looking further ahead, forward predictions for 2026 highlight that regulatory progress could be a decisive catalyst, per the latest Bitwise report. The CLARITY Act in U.S. is seen as essential for unlocking the next growth phase in crypto.
Report also added that Stablecoins and tokenization are widely viewed as megatrends, and Solana is positioned as one of the major beneficiary if adoption accelerates.
If regulatory momentum continues and broader conditions remain constructive, the SOL price prediction 2026 becomes increasingly optimistic.
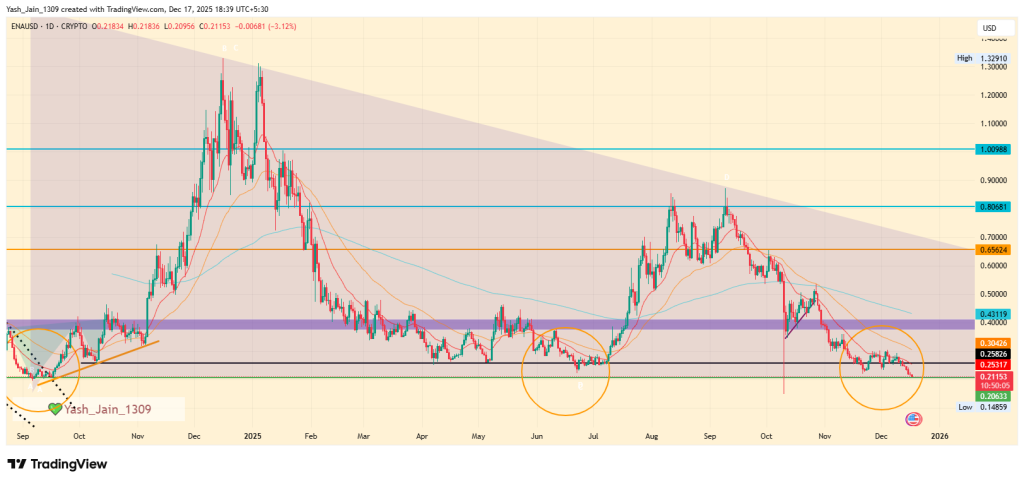
The Ethena price has returned to a critical zone this mid-december that previously marked the start of a powerful rally in 2024. While the current short-term price action can’t be ignored as it remains strongly subdued by macro sentiment. But, a combination of technical positioning and improving on-chain metrics is drawing renewed attention to Ethena crypto amid an uncertain macro backdrop.
Ethena Price Revisits a Historically Reactive Level
In September 2024, ENA/USD traded near the $0.20 level before launching into a strong upside move that carried the token to roughly $1.20 by December, representing a 525% advance. This week, the Ethena price USD is once again hovering near that same demand area.
On the Ethena price chart, the structure appears similar to the setup seen before the previous rally. Although past performance does not guarantee another repetition of rally, but bullish odds can’t be overruled. As markets often respond to levels where liquidity and historical demand are previously aligned. As a result, watching closely for signs of stabilization before any directional move emerges is a wise action here on.
Short-Term Consolidation May Shape Ethena Price Prediction
In the near term, price behavior suggests that a brief consolidation phase could be necessary. As sideways movement around the current support zone would allow sellers to exhaust and buyers to gradually absorb supply. If this process plays out, the Ethena price prediction could shift toward a recovery move targeting the $1.20 region.
Dostlar $ENA söylediğimiz bölgeden %50 yaptı tekrar akümüle seviyesine düştü buralarda yatay bu süreci geçirip yukarı çok sert gideceğine eminim fakat yıldırıyolar, bıktırıyolar elinizdekileri satın market maker malı kendisi götürsün çabaları görüyorum. pic.twitter.com/8iXmhLUp5V
However, this scenario depends heavily on broader market stability. Without supportive conditions across major assets, even technically favorable setups can fail to gain traction. As such, ENA crypto’s short-term outlook remains conditional rather than guaranteed.
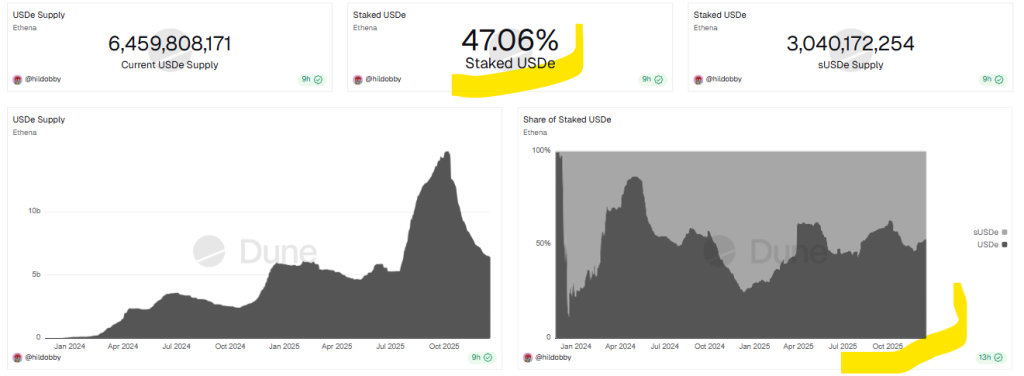
Rising sUSDe Staking Signals Improving Protocol Health
Beyond price action, on-chain metrics present a more constructive picture. The growing share of staked USDe (sUSDe) suggests that a larger portion of the circulating supply is being locked into the Ethena protocol in pursuit of yield. This reflects increasing user trust and confidence in the system’s design.
This generally viewed as a positive indicator for the ecosystem’s fundamentals. While it does not ensure an immediate rebound in Ethena price, it can provide underlying support if market sentiment improves. From a fundamentals perspective, Ethena crypto does not currently show signs of any major weakness.
Macro Conditions Could Override the Ethena Price Forecast
Despite these supportive signals, macroeconomic risk remains elevated. As Bank of Japan’s plays a critical role in global liquidity through the yen carry trade. A potential rate hike on December 19 could force leveraged positions to unwind, leading to broad-based selling across risk assets.
Historically, Bank of Japan rate hikes in 2024 and 2025 were followed by rapid Bitcoin drawdowns of 20–30%. In such a scenario, ENA/USD would likely struggle to maintain support, regardless of improving fundamentals. Therefore, the Ethena price forecast remains highly sensitive to upcoming shortterm macro developments.
For now, the Ethena price sits at the intersection of constructive on-chain signals and elevated macro risk. If liquidity conditions stabilize and consolidation holds, upside scenarios remain viable. However, a deterioration in global risk sentiment could quickly invalidate bullish setups.
Analysts project Dogecoin could reach $0.39 by the end of 2025.
Long term projection highlights that by 2030 it could even reach the $3 mark.
Dogecoin, the original meme coin, has cemented its status as a crypto legend. Known for its viral appeal and a fiercely loyal community, it continues to capture headlines and investor interest. Following Donald Trump’s election win, speculation around a potential Dogecoin ETF fueled a surge in optimism.
Now, that speculation has become a reality. With the September 18 launch of the REX-Osprey DOGE ETF, trading under the ticker DOJE and carrying a 1.5% fee, the path has been cleared for institutional access. This groundbreaking debut makes it the first U.S.-listed spot ETF for Dogecoin and significantly raises the odds for similar approvals from major players like Bitwise and Grayscale before year-ends.As growing optimism and increasing adoption reshape the market, traders are asking: “Will Dogecoin go back up?” and “Can DOGE hit $1?” In this article, we dive into a detailed technical analysis and a long-term Dogecoin price prediction 2025 to 2030.
According to CoinPedia’s formulated Dogecoin price projections for 2025, if the trading volume of Dogecoin rises, then we can expect the DOGE price to surge to $1.07 as the year ends.
On the other hand, if the market is hit again by external forces like regulations or negative statements by influencers. Hence, the meme coin might trade at a potential low of $0.62.
We expect the DOGE price to reach a new swing high of $1.07 by the end of 2025.
Year
Potential Low
Potential Average
Potential High
2025
$0.62
$0.84
$1.07
DOGE Price Analysis 2025
The Dogecoin price (DOGE) has continued to capture investor attention, primarily due to its history of delivering remarkable returns.
One notable surge occurred in November 2024, following Donald Trump’s presidential election victory, which propelled the price to a peak of $0.4846 by year-end. However, profit-taking around this peak created a supply zone, triggering a downward trend.
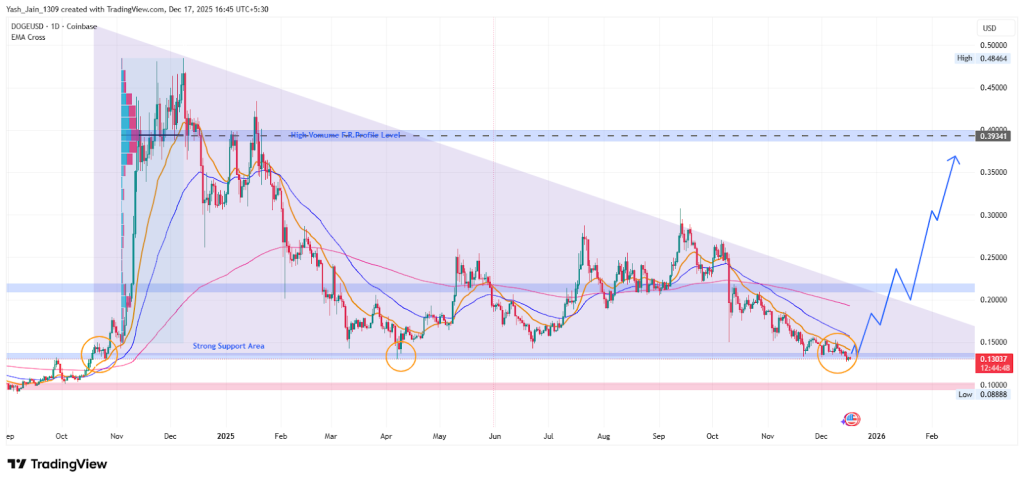
In January 2025, the DOGE bulls made an effort to sustain the gains from Q4 2024. Yet, the high volume profile resistance at $0.39 proved formidable, pushing the price down to a low of $0.130 by early April.
Interestingly, April’s low is near the demand zone at $0.130 – $0.150 that has previously supported a parabolic rally, and bulls are seen active in this area. Over the past couple of months, this level has been tested several times and has proven strong for bears to break that easily.
Also, the DOGE in H1’s final week retested this support again after a market-wide rebound, following a ceasefire that was announced in the battle between the US, Israel, and Iran.
Dogecoin Price Targets December 2025
The analysis of the Dogecoin price movements in 2025 shows that it has primarily been contained within a descending triangle pattern entire this year. Although there were brief bullish tries, but they were weak.
For instance, a short-lived rally was observed from July to early September, coinciding with the announcement of the first memecoin ETF, the Rex Osprey DOGE ETF, which temporarily pushed prices above $0.30. This move briefly teased the descending triangle’s upper border resistance, but that proved to be a false breakout as bearish sentiment took over.
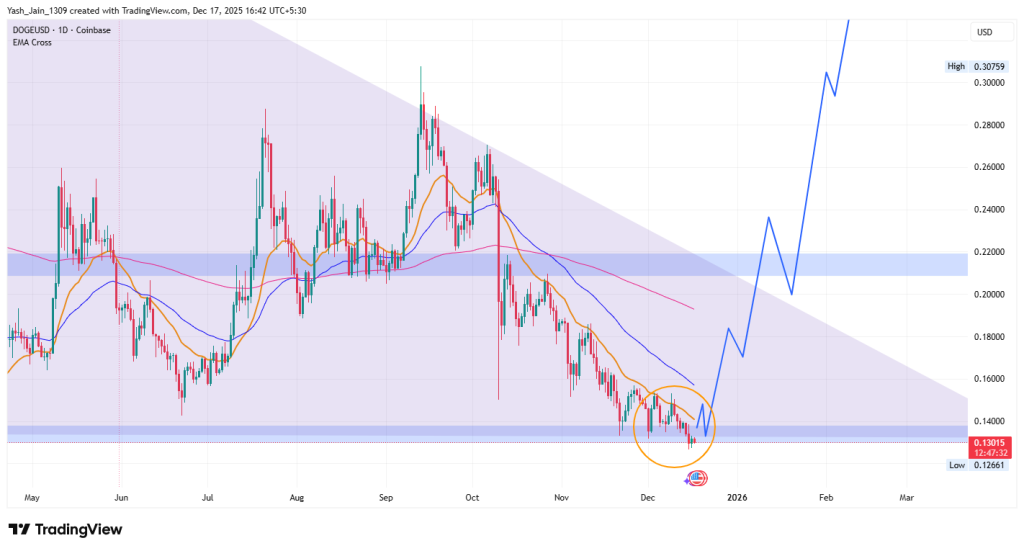
By October to mid-December 2025, the DOGE price dropped to $0.13, creating a buying opportunity reminiscent of November 2024. Numerous analysts predicted that a rally could commence, especially as DOGE/USD was testing the support level of $0.13 from late November to mid December.
Historically, such tests have frequently led to rallies that reach the upper resistance of the descending trendline. If this trend continues, a target of $0.21 in December 2025 indicates a possible increase of about 40%.
At present, the DOGE price seems to be in a phase of accumulation, with bullish demand responding favorably at this support level. For a notable long-term breakout to occur, the DOGE price needs to successfully retake the $0.21 level before the end of the year. Surpassing this level could lead to a breakout rally targeting $0.39 in the initial months of 2026.
On the other hand, if the price dips below $0.13, it could jeopardize the recovery and prompt a further decline towards $0.10 and BOJ move on December 19th can greatly affect DOGE.
Month
Potential Low ($)
Potential Average ($)
Potential High ($)
DOGE Price Target November 2025
0.10
0.25
0.39
Dogecoin Price Prediction 2025
Moreover, optimism is now growing for the approval of more Dogecoin ETF products, which could spark significant adoption before the end of the year.
If this institutional demand propels DOGE past the $0.39 resistance, it could target its previous high of $0.484. A sustained rally beyond this point makes a move to the iconic $1.00 mark a real possibility.
However, if the price is rejected at the $0.39 resistance level by the end of 2025, it may retrace back to the $0.13 demand zone. The remainder of 2025 will be crucial for Dogecoin as it navigates these key resistance and support levels, with its trajectory heavily dependent on further institutional interest.
Year
Potential Low ($)
Potential Average ($)
Potential High ($)
2025
0.13
0.39
1.00
Dogecoin Price Prediction 2026 – 2030
Year
Potential Low ($)
Potential Average ($)
Potential High ($)
2026
0.75
1.00
1.25
2027
1.15
1.35
1.50
2028
1.25
1.75
2.00
2029
1.50
2.15
2.65
2030
2.50
2.75
3.00
This table, based on historical movements, shows DOGE price to reach $3 by 2030 based on compounding market cap each year. This table provides a framework for understanding the potential DOGE price movements. Yet, the actual price will depend on a combination of market dynamics, investor behavior, and external factors influencing the cryptocurrency landscape.
Based on the historic market sentiments and trend analysis of the altcoin, here are the possible Dogecoin price targets for the longer time frames.
Year
Potential Low ($)
Potential Average ($)
Potential High ($)
2031
3.01
3.49
4.00
2032
3.79
4.47
5.25
2033
4.96
5.75
6.75
2040
14.22
19.50
25.00
2050
54.99
105.00
155.00
Market Analysis
Firm Name
2025
2026
2030
Changelly
$0.205
$0.233
$1.07
Coincodex
$0.155
$0.115
$0.259
Binance
$0.223
$0.235
$0.285
Can DOGE Break the $1 Barrier?
Given DOGE’s success, largely driven by hype with some technical progress, crossing $1 by 2025 remains a realistic possibility. A sustained media frenzy and growing endorsement deals could maintain bullish momentum. Expanded merchant adoption would also strengthen confidence in its long-term viability.
Dogecoin’s Tokenomics and Long-Term Outlook
The future of Dogecoin hinges on its utility. Meme popularity alone may not sustain it indefinitely, but advancements in transaction fees, speed, and business collaborations could help it thrive as a mainstream digital currency. Its large and passionate community will likely continue to drive positive evolution.
Conclusion
Given Dogecoin’s past price behavior, driven largely by online hype and media coverage, it has the potential to reach over $1 in 2025. DOGE has shown remarkable resilience, and key factors like expanded merchant adoption, community growth, and protocol upgrades could enhance its viability.
Never Miss a Beat in the Crypto World!
Stay ahead with breaking news, expert analysis, and real-time updates on the latest trends in Bitcoin, altcoins, DeFi, NFTs, and more.
FAQs
Will Dogecoin hit $5?
Dogecoin will likely reach $5 in the next decade.
What is Dogecoin’s price prediction for 2025?
DOGE may hit $1.07 by 2025, with a low of $0.62 and an average of $0.84, driven by market trends and adoption.
What is the highest Dogecoin can go by the end of 2030?
DOGE is projected to reach $2.50–$3.00 by 2030, averaging $2.75, fueled by utility and market optimism.
Is Dogecoin a good investment?
Yes, Dogecoin might definitely be a good investment if you are looking to invest for the long term.
Is Dogecoin dead?
No, Dogecoin is not dead right now, the peaks and troughs are normal in the cryptocurrency industry. Major announcements and happenings will eventually drive the price.
What is Dogecoin used for?
Dogecoin was developed as a digital form of payment system, similar to Bitcoin or Litecoin.
How much would the price of Dogecoin be in 2040?
DOGE could range from $14.22 to $25.02 in 2040, averaging $19.62, depending on adoption and market trends.
How much will the DOGE coin price be in 2050?
DOGE may soar to $54.99–$154.91 by 2050, averaging $104.95, driven by long-term utility and hype.
Can Dogecoin reach $1 by 2025?
Yes, DOGE could break $1 by 2025 if trading volume rises and merchant adoption grows, per CoinPedia’s forecast.
Analysts predict PEPE could reach $0.000028 by 2025.
Long-term forecasts suggest potential highs of $0.0002733 by 2030.
Pepe Coin (PEPE), the memecoin inspired by the iconic frog meme, has rapidly become a standout in the crypto world. Ranked just behind Dogecoin and Shiba Inu, PEPE’s explosive rise—boasting gains of over +130325085.96% from its all-time low—has captured investor attention globally.
As it maintains its position among top memecoins, many are now asking: Will PEPE price go parabolic by the end of 2025? In this article, explore CoinPedia’s in-depth PEPE coin price prediction for 2025, and discover long-term forecasts that look ahead to 2030.
Pepe Coin is showing potential for growth in 2025. Initially seen as a joke, meme coins like PEPE, Dogecoin, and SHIB have found their place in the market, driven by social media excitement.
In the first half of 2025, the PEPE price dropped nearly 80% from $0.00002837 in Q1 2025. However, Q2 showed demand but failed to flip the Fibonacci 0.5 level near $0.000016 from $0.00000525, and ended up forming a symmetrical triangle pattern. Its current price action is part of its consolidation phase.
PEPE Price Prediction December 2025
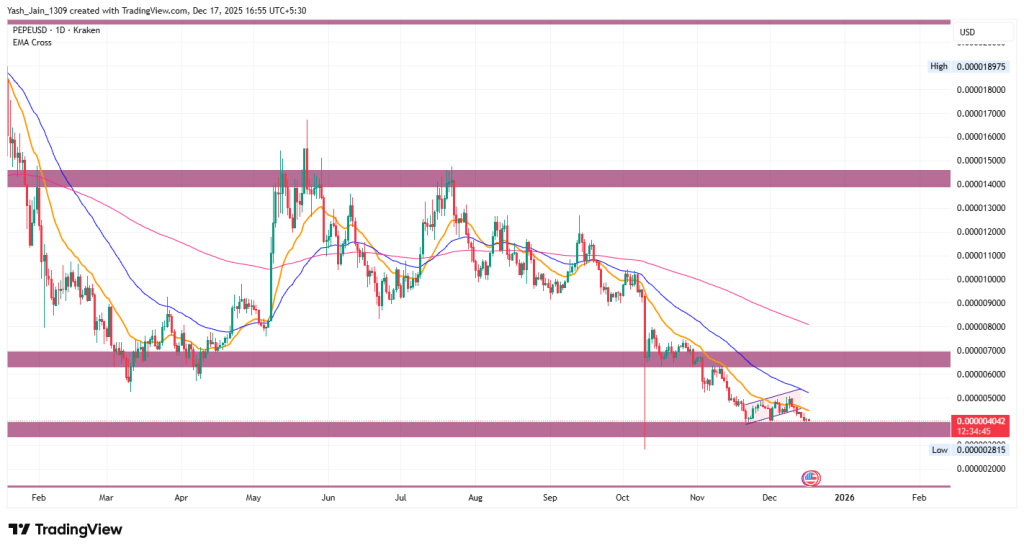
Since reaching its all-time high of $0.00002837, PEPE/USD has faced significant challenges, primarily due to a year marked by numerous rug pulls, hacks, and various macroeconomic issues. This has led to a cautious stance among both old and new liquidity providers. The memecoin sector has emerged as the riskiest asset category in the crypto finance space, and as a result, it currently lacks momentum.
The PEPE chart unmistakably reflects this decline. Despite a brief surge in bullish momentum back in May, the trend has been downward since then. By September, the price fell below the 20-day EMA band and has remained under it through December. If this pattern continues, we are likely to see consolidation persist into the year’s end.
However, there is potential for revival. If macro liquidity improves, PEPE could break above the 20-day and 50-day EMA bands, regaining its upward momentum.
Month
Potential Low ($)
Potential Average ($)
Potential High ($)
Pepecoin Price Forecast December 2025
0.00000410
0.00001050
0.00001688
PEPE Price Projection 2025
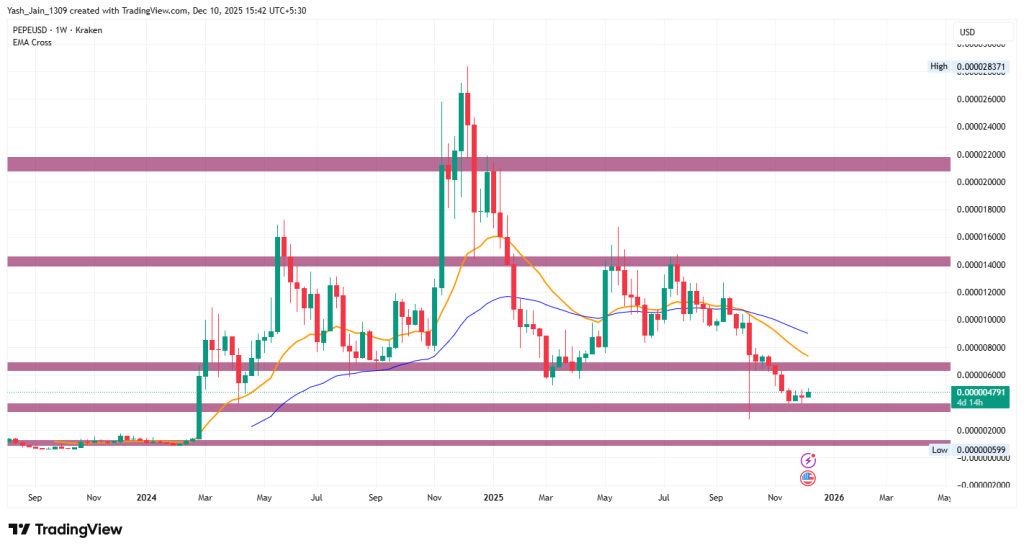
PEPE crypto’s performance in Q3 and Q4 was marked by notable price fluctuations, ultimately resulting in the loss of its crucial two-year key support area in November, positioned between $0.00000640 and $0.00000710.
The entire meme category’s low interest led to a significant decline for PEPE. However, it found support in late November around the April 2024 swing low area, which is between $0.00000350 and $0.00000400.
Around early to mid-December, it continued to consolidate on same levels. Should the April 2024 swing low demand area be compromised, the focus will shift to the critical demand zone around $0.000001250.
Year
Potential Low ($)
Potential Average ($)
Potential High ($)
2025
$0.00000850
$0.00002263
$0.00002837
PEPE Price Prediction 2026 – 2030
Year
Potential Low ($)
Potential Average ($)
Potential High ($)
2026
0.0000179
0.0000359
0.0000539
2027
0.0000269
0.0000539
0.0000809
2028
0.0000404
0.0000809
0.0001214
2029
0.0000607
0.0001214
0.0001822
2030
0.0000910
0.0001822
0.0002733
This table, based on historical movements, shows PEPE price to reach $0.0002733 by 2030 based on compounding market cap each year. This table provides a framework for understanding the potential PEPE price movements. Yet, the actual price will depend on a combination of market dynamics, investor behavior, and external factors influencing the cryptocurrency landscape.
PEPE Coin Market Analysis
Firm Name
2025
2026
2030
Changelly
$0.000032
$0.0020
$0.015
CoinCodex
$ 0.000037
$ 0.000026
$ 0.000047
Binance
$0.000013
$0.000014
$0.000017
CoinPedia’s PEPE Price Prediction
Coinpedia’s PEPE coin price prediction expects the community to explore new avenues and reach a new high by the end of this year. So, based on our analysis, the price of PEPE in 2025 should range between $0.0000120 to $0.0000360. Additionally, the average price of PEPE should be around $0.0000240.
Year
Potential Low ($)
Potential Average ($)
Potential High ($)
2025
$0.0000120
$0.0000240
$0.0000360
Never Miss a Beat in the Crypto World!
Stay ahead with breaking news, expert analysis, and real-time updates on the latest trends in Bitcoin, altcoins, DeFi, NFTs, and more.
FAQs
How high will the PEPE price go in 2025?
According to our Pepecoin price forecast, the altcoin’s price could surge to a maximum of 0.00001688 this year.
How much is Pepe coin worth?
The current price of Pepecoin is $ 0.00000414.
How much is 1 Pepe coin in rupees?
At the time of writing, Pepe coin price in INR is ₹0.0008666.
Is PEPE an ERC-20 token?
Yes, Pepecoin is an ERC-20 token working on the Ethereum blockchain.
Is it possible to mine Pepecoin?
No, PEPE cannot be mined as it is a non-mineable token.
Where to buy Pepe coins?
If you want to buy this coin, then you can do so on various exchanges like Binance, OKX, and more. The coin is listed on popular exchanges such as Trust Wallet and Metamask.
Who is behind Pepecoin?
Interestingly, the project’s website reveals that there is no established team behind the token, and the creators prefer to remain anonymous.
When was Pepecoin launched?
Furie introduced Pepecoin in 2021 to reestablish the character’s positive image. The digital currency has since gained popularity among internet users and cryptocurrency enthusiasts.
Price predictions for 2025 range from $300 to $710, with strong support at $300.
By 2030, BCH could reach highs of $2,675, driven by increased adoption and transaction activity.
With Bitcoin smashing through the $100K barrier, all eyes are now on Bitcoin Cash (BCH) as traders wonder—will BCH price follow with a banana move of its own? Beyond hype, Bitcoin Cash is proving its value in the real world. Ranked 4th on Crypwerk’s global adoption list, BCH is gaining traction for its speed, low fees, and merchant-friendly design.
If you’re searching for answers to “Will Bitcoin Cash go up further?” — you’re not alone. In this Bitcoin Cash price prediction 2025–2030, we dive into the technicals and adoption trends shaping the next big BCH Price Prediction.
Coinpedia’s analysis suggests that Bitcoin Cash could potentially emerge as a more affordable version of Bitcoin.
If Bitcoin Cash gains some hype in the coming months, then the BCH price can reach $701 in 2025. On the flip side, the BCH price can drop to $507 during that year.
We expect the BCH price to create a new 2025 high of $701 during the upcoming altcoin season.
Year
Potential Low
Potential Average
Potential High
2025
$507
$605
$701
BCH Price Action History Driven by Smart Money Transaction Volume (2017-2025)
The history of BCH price USD movements shows a strong correlation with daily transaction volume, highlighting the presence of “smart money” participation.
In the run-up of late 2017, the Bitcoin cash price increased over 1100% (from $350 to $4,300) despite daily transactions remaining under 110,000. but, the subsequent 2018 crash from the $4,300 ATH to $400 saw daily transactions skyrocket to 2 million, confirming a massive, swift sell-off by large holders.
Similarly the smart money activity was seen in 2021 also when transactions increased from daily average but unlike 2017’s rise, the opposite behavior characterized the 2021 recovery. As the price climbed from $450 to $1,597 between February and April, transaction volume held consistently high, fluctuating between 300,000 and 400,000 per day.
However, this time this buying enthusiasm was followed by a prolonged, 24-month slow bear market from May 2021 to May 2023. During this severe sell-off, transactions plunged from 300,000 to below 15,000 daily, capping BCH recovery attempts and driving the price below $150.
Therefater, since June 2023, the market has seen a notable shift. Daily transactions began increasing abruptly, oscillating between 100,000 and 400,000 through October 2024, mirroring the price recovery attempt toward 689. This fluctuation confirms that large market players are responsible for high-volume swings in transactions, and their absence results in flat activity.
Near-Term Outlook
Currently (November 2024 onwards), daily transactions have consistently remained under 100,000, suggesting that smart money is neither actively buying nor selling. The price recovery to above 600 in Q3 2025 is built primarily on retail-based transactions.
However, given this historical pattern, there are high odds that significant buying could be seen soon. When large players return, high-magnitude fluctuations in the transaction chart will signal their entry, confirming genuine demand.
If this smart money buying materializes, BCH could initiate a strong recovery starting with $689, followed by targets at $1,200 and $1,597 by year-end. This momentum could extend into the first half of 2026, potentially hitting $2,532 and even retesting the prior all-time high of $4,300. Should the major buying activity fail to appear, BCH is expected to consolidate around the $450 level for the remainder of 2025.
BCH Price Prediction 2025 (Q1 to Q4)
Bitcoin Cash price (BCH) saw a downturn in the first quarter of 2025, following profit-taking activities at the close of December 2024, where it reached the upper boundary of a descending triangle at approximately $640.
However, the second quarter brought a renewed wave of enthusiasm as bullish investors rallied, driving prices up from a critical support level of $300 after some stop-loss orders were shaken out. By the third quarter, BCH impressively rebounded to $645, marking a significant breakout from a multi-year descending triangle.
Entering the fourth quarter of 2025, the price did experience a retracement, falling from $645 to $445. This level aligns with the support provided by the 50-week exponential moving average, suggesting that this pullback may be a set-up for another rally. Encouragingly, the likelihood of a market uptick in December 2025 appears to be increasing.
To enhance the bullish outlook, it is essential for BCH price USD to maintain a weekly closing price above the $620–$640 range. Achieving this threshold would facilitate a near-term retest of $689. If BCH successfully sustains above this mark, it would signify a “Change of Character (ChoCh)” on the monthly chart, indicating a pivotal long-term trend shift and opening the door to higher targets ahead.
Conversely, if the breakout fails and BCH dips below critical support at $422, we may witness a rapid downturn. The $300 level is expected to act as a robust defense against further declines; however, a breach here would undermine the current bullish sentiment entirely.
Year
Potential Low
Potential Average
Potential High
2025
$300
$605
$1200
Bitcoin Cash Price Target December 2025
Since September 18th, Bitcoin Cash (BCH) has significantly declined, reaching the 50-week exponential moving average (WEMA) and consolidating for several weeks. By mid-December, it confidently trades above the 20-day EMA band.
The BCH price is poised for a decisive move that can transform the $620 resistance into a stepping stone, propelling it to $689 in the short term.
However, should it drop below $540, we could see a continuation of the sell-off down to the key support level at $422. If that level fails, $300 will serve as a strong defense.
Month
Potential Low ($)
Potential Average ($)
Potential High ($)
Bitcoin Cash Price November 2025
422
522
689
Bitcoin Cash Price Targets 2026 – 2030
Year
Potential Low ($)
Potential Average ($)
Potential High ($)
2026
595
790
985
2027
680
925
1,160
2028
795
1,135
1,475
2029
1,025
1,480
1,955
2030
1,350
2,010
2,675
This table, based on historical movements, shows BCH price to reach $2675 by 2030 based on compounding market cap each year. This table provides a framework for understanding the potential BCH price movements. Yet, the actual price will depend on a combination of market dynamics, investor behavior, and external factors influencing the cryptocurrency landscape.
Market Analysis
Firm Name
2025
02026
2030
Changelly
$361
$664
$3731
priceprediction.net
$572
$865
$3830
DigitalCoinPrice
$821
$932
$2912
*The targets mentioned above are the average targets set by the respective firms.
Never Miss a Beat in the Crypto World!
Stay ahead with breaking news, expert analysis, and real-time updates on the latest trends in Bitcoin, altcoins, DeFi, NFTs, and more.
FAQs
What could be the maximum price of BCH in the next 3 years?
According to our Bitcoin Cash price prediction, BCH’s price could hit the maximum trade value of $1,160 by 2027.
What Is Bitcoin Cash?
Bitcoin Cash is a hard fork of Bitcoin, that aims at a decentralized peer-to-peer electronic cash system. Without relying on any central governing authority.
Is Bitcoin Cash a good investment in 2025 amidst newer higher-performing entrants?
Bitcoin Cash is an underrated investment with a high chance of performing in 2025.
What are the advantages of Bitcoin Cash over Bitcoin?
Bitcoin Cash focuses on resolving two of the major limitations of Bitcoin, which are scalability and transaction fees.
Samsung Galaxy Z TriFold sparks frenzy as it runs out of stock instantly in the second sale. The company started the phone’s second sale today, and the story remained the same as the initial sale in South Korea.
Moments after opening the second sale, the Galaxy Z TriFold ran out of stock on the Samsung website. The company has put a notice on the website, thanking buyers for their response and signing up for the restock alert.
Notably, Samsung put TriFold on sale on December 17 at 10 AM in South Korea. The entire stock was sold out within just two minutes. Shoppers were fully prepared to place their order as soon as the window opened.
Galaxy Z TriFold turns out to be a massive success in South Korea. First, the Galaxy Z Fold Special Edition impressed with its sales, followed by the Z Fold 7. Now, the company’s new form factor is continuing the legacy.
A notice was posted on the website stating, “Thank you for your support. Our prepared inventory has sold out. If you sign up for a restock notification, we will alert you when more units become available.”
Samsung has also sent out limited units at key retail stores. However, buyers who returned empty-handed on the day of the first sale will be prioritized. You can visit your nearest Samsung store to check if they have TriFold stock left.
The company will now restock the TriFold early next month. A specific date or timeline hasn’t been revealed, but January seems a sweet spot. It will keep the device in headlines and encourage buyers to make a new year purchase.
The XRP price is presenting a rare series of events. On the one hand, institutional accumulation has remained uninterrupted for weeks, including XRP ETF net flows. But, on the flip side, the price action continues to bleed lower, testing investors’ and traders’ patience heavily. This growing divergence between fundamentals and market behavior is shaping one of the most complex XRP setups in recent years, that is keeping new investors at bay.
XRP Price Sees Unbroken Institutional Inflows
As evident on XRP ETF netflows, from November 14 to December 15, the XRP price chart recorded not a single day of ETF outflows. This clearly suggests that institutions are not only interested in XRP but are also steadily increasing their exposure, regardless of short-term volatility.
Institutional holdings have now reached approximately 0.98% of XRP crypto’s total market capitalization, translating to nearly $1.12 billion in net assets, per SOSOValue’s data. This level of confidence makes it hard to believe that the price would settle lower, given good fundamentals and a project with utility.
However, these positive net flows indicate a long-term role rather than short-term speculative positioning. The accumulation trend reinforces the idea that XRP’s fundamentals remain intact even as the price weakens, and it seems more likely that the market will show a big surprise soon or next year.
Why Strong Fundamentals Aren’t Lifting XRP Price
Now, many are intrigued as to why XRP ETF positive inflows aren’t supporting the price. Then, looking at the data, the picture becomes clearer, which underlines the real problem. The XRP price USD has failed to respond positively to ETF data, and the primary reason lies in insufficient buying power relative to broader selling pressure.
While XRP ETF inflows are constructive, they are not yet large enough to offset aggressive derivatives activity.
The Taker Buy Sell Ratio has stayed negative for most of this period, indicating that sell orders continue to dominate XRP’s futures market. This imbalance suggests that short-term traders remain positioned bearishly, limiting any sustained upside attempts.
Historically, such extended compression phases often end with sharp volatility expansions. However, current conditions show that bears momentum is still strong against bulls.
Another critical factor weighing on the XRP price forecast is the evaporation of buying pressure in derivatives markets. Insights from CryptoQuant suggest that the Buy-side futures volume has fallen to multi-month lows, signaling hesitation from leveraged traders.
Beyond XRP-specific metrics, the broader market context also remains unfavorable. Altcoins as a whole have experienced a significant dip over recent months. While Bitcoin continues to absorb the majority of available liquidity, holding onto its own support levels, it leaves limited room for recovery across alternative coins.
Additionally, at a time like this, new liquidity from new investors would have helped facilitate recovery; however, new investors are currently on the sidelines due to the tremendous liquidations across the altcoin sector in October, which have further eroded confidence. As risk appetite remains fragile, even fundamentally strong assets like XRP crypto struggle to attract aggressive bids.
Key Levels Define the XRP Price Outlook
From a technical perspective, $1.92 has emerged as a crucial turning point on the XRP price chart, at least in the short term. Now, a Failure to hold this zone could open the door to a deeper correction toward the $1.00 psychological level.
At the same time, prolonged weakness may continue to benefit institutional buyers. As weaker retail gets absorbed slowly, conditions could eventually shift toward a more durable accumulation base. In that context, many expect the XRP price to stabilize before any meaningful recovery phase potentially develops later.
FAQs
How high could XRP go by the end of 2025?
Analysts predict XRP could reach $5.05 by December 2025 if bullish momentum continues and key resistance levels are broken.
What factors influence XRP’s price movement?
XRP price is influenced by ETF approvals, on-chain activity, investor sentiment, legal developments, and broader crypto market trends.
Is XRP a good investment in 2025?
XRP shows bullish signs with strong on-chain activity and ETF interest, but investors should watch key support and resistance levels carefully.
Price predictions for 2025 suggest highs of $50 and potential ETF approval.
Long-term forecasts indicate AVAX could reach $518.50 by 2030.
Avalanche (AVAX) has become a go-to platform for developers, especially after its Avalanche 9000 mainnet upgrade and the launch of the AVAX card in early 2025. With lower fees and growing real-world use cases, plus backing from giants like Mastercard and SMBC, AVAX is gaining serious traction.
As a result, many are intrigued to know Avalanche prediction and are wondering: “How high can AVAX price go?” or “Will AVAX reach $50?” or “Does Avalanche have a good long-term future?” So, if you’re planning an investment in Avalanche (AVAX). Explore our in-depth Avalanche Price Prediction 2025 to 2030.
According to Coinpedia’s AVAX price prediction, the altcoin may surpass the $49.46 mark in 2025. Moreover, the upcoming years are expected to be bullish, with a conservative momentum.
With an optimistic outlook, we expect the AVAX coin price to reach $50 in 2025.
Year
Potential Low
Potential Average
Potential High
2025
$12.36
$30.91
$49.46
Avalanche Price Prediction 2025
Since its rally from late 2023 to early 2024, from $ 8.62 to $ 65.23, was the last bullish jump witnessed in the AVAX price in USD. Since that high, AVAX has not managed to reach a new high; instead, it has continued to decline for multiple months, and even 2025 was contained in a bearish mode.
However, on the daily chart, it is observed that the current price decline is headed to retest the key support of late 2023 around once again in the $8.62-$10 area, which could bring a reversal in the rally, as it is the exact point where we last saw bullish momentum.
This will lead to another 20% to 30% decline in the AVAX price in the coming sessions, but after this decline, renewed demand at key levels is expected to strengthen the AVAX price.
In that scope, the short-term view may remain on the short side due to current geopolitical conditions, along with risk-off investor sentiment, but the long-term view for 2026 is majorly bullish, and as early as the first half, it will display good price action only if bullish demand reappears from the same key support.
Year
Potential Low
Potential Average
Potential High
2025
$25
$33
$50
Avalanche Price Target December 2025
In 2025, a definitive bearish trend has established a falling wedge on the weekly chart, consistently converging each time it intersects with the borders. This pattern strongly indicates that movement is coiling, and further consolidation will inevitably lead to a significant surge.
As of December, the price is trading around the lower border of this pattern. If a rally occurs, the target by the end of December will be approximately $30. Should it break through this level, we can anticipate a continuation of the rally into Q1 2026, potentially reaching the $52 region.
Conversely, if the price fails to rally, we will likely see it consolidate below $20 for the remainder of December, shifting all focus and anticipation to the opportunities that 2026 will bring.
The Ethereum price is currently demonstrating clear structural strength in its price action, despite surface-level volatility. Although short-term price movements are still confined to a range, but the hard facts that came from deeper on-chain metrics and the 2025 ETF net flows trend indicate a strong accumulation phase is in progress. This bodes well for a significant upward move brewing for future months.
Ethereum Price and Whale Realized Levels Signal Strong Support
One of the most notable developments on the Ethereum price chart comes from realized price data tied to accumulation addresses. According to on-chain metric chart from CryptoQuant, large holders have steadily increased their cost basis over recent months. In June, the realized price for these accumulation wallet addresses stood near $1,560. Since then, it has climbed toward the $3,000 zone.
This rise in realized price alone reflects consistent buying rather than short-term trading. Importantly, realized price often acts as a psychological and structural support level, where smart money will do everything in power to minimize losses. As long as whales continue accumulating above this zone, it becomes increasingly difficult for the Ethereum price USD to sustain deep breakdowns below it.
Why Whale Accumulation Matters for Ethereum Crypto
Whales typically accumulate with a longer time horizon, especially when preparing for broader market expansions. Their continued buying suggests confidence that current prices represent value rather than excess. This behavior reinforces the idea that downside risks may be absorbed gradually instead of triggering sharp capitulation.
From a structural perspective, this accumulation trend places the Ethereum price in a different position compared to speculative-driven rallies. Instead of rapid spikes, price stabilization near rising realized levels often precedes more sustained trend expansions.
Beyond on-chain data, ETF activity adds another layer of confirmation. Throughout the year, the Ethereum ETF landscape has recorded more weeks of inflows than outflows. This consistency suggests institutional participation is supporting the market, even during periods of broader uncertainty.
Notably, since September, the pace of weekly outflows has been declining. This shift points toward improving sentiment rather than distribution. While ETF flows have not triggered immediate upside, they appear to be playing a stabilizing role in maintaining the Ethereum price USD above critical zones.
Aligning On-Chain Data With Ethereum Price Forecast
When whale accumulation trends and ETF flows are viewed together, a clearer picture emerges. Rather than signaling exhaustion, current conditions suggest preparation. December may function as a consolidation phase rather than a breakout month.
As a result, Ethereum price prediction models increasingly focus on early 2026. If accumulation continues and institutional demand remains steady, projections extend toward higher psychological levels during Q1. This alignment between on-chain conviction and capital flows strengthens longer-term Ethereum price forecast assumptions.
Price predictions suggest ALGO could reach $0.90 by the end of 2025.
Long-term forecasts indicate potential highs of $5.65 by 2030.
Algorand’s strong push for scalability, security, and decentralization is paying off. With the launch of AlgoKit 3.0 in Q1 2025 and growing developer interest, ALGO adoption has improved and is now on the rise. The rising adoption is beneficial for an asset, as it is directly proportional to a token’s price.
But the big question for intrigued market participants still remains: Can ALGO Price hit $1 this cycle? Read our in-depth Algorand Price Prediction 2025 and long-term outlook through 2030 to find out.
As per Coinpedia’s Algorand Price Prediction, the forecast for the Algorand network is optimistic for the coming years. With a potential altcoin market in Q1 2025, the ALGO coin price might skyrocket toward a new high.
If the network maintains the staggering growth, the ALGO coin price may reach $0.89 in 2025. Conversely, if the network fails to expand, then the price can flip into a bearish trap and dip to $0.45.
Year
Potential Low
Potential Average
Potential High
2025
$0.45
$0.67
$0.89
Algorand Price Analysis 2025
In Q4 2024, Algorand (ALGO) experienced a significant drive, reaching a high of $0.613, marking a remarkable 470% gain from the $0.1079 level.
However, the excitement was short-lived as a sell-off intensified in the final month of 2024, extending that into Q1 2025. By the first week of April, ALGO’s price plummeted to a low of $0.1491, which established a strong multi-year support area.
From the second week of April, the price action began to shift, forming a higher-high structure that indicated a recovery from the multi-year support level. By mid-May, Algorand’s price had climbed nearly 70% to $0.24 from the Q2 low of $0.150.
Unfortunately, this upward momentum was halted in mid-May as strong supply levels rejected further advances, pushing the price below the 200-day EMA band.
In the third week of June, ALGO returned to April’s low, finding support at the $0.15 level. At this point, the price was down 71% from Q4 2024’s high and 32% from mid-May’s peak. The risks were high, with indications that any short-term bearish pressure could lead to a drop to the 2024 low of $0.0943, breaching the $0.15 support.
However, everything changed last week in June, which was also the finishing week for H1. The momentum in H2 began with the blast.
Algo Price Target December 2025
The price of Algorand (ALGO) surged to $0.34 in July, hitting the upper resistance of a declining triangle pattern that has developed over the past several months.
Since then, the price has closely tracked along the upper boundary of this long-term formation, indicative of a bleeding phase. This continued from August until now, which means it lasted into most of December. While the decline has persisted, it’s reassuring that no new lows for this year have been established, offering a solid sense of stability for investors with only a few days left in December.
The current demand zone around $0.10-$0.13 is pivotal, as it holds the potential to prevent another dip in price action. The price range is now highly congested. This also briefly shifts perception from the bearish side to the bullish side, despite the price crashing significantly in 2025.
As the price remains longer and tighter within this pattern, the higher the likelihood of a significant breakout. A substantial movement is on the horizon, expected either in December or to kick off in Q1 2026.
If ALGO successfully regains the $0.15 level, it’s likely to test the $0.21 mark. Should it surpass that, a target of $0.28 could very well be achievable this December or Q1 2026. It’s just like a matter of a good macro catalyst this time around.
On the other hand, if selling pressure ramps up and the price falls below the critical support area, it could invalidate the bullish outlook. In that case, ALGO is likely to maintain a sideways price action, but the overall bullish potential remains strong.
Month
Potential Low ($)
Potential Average ($)
Potential High ($)
Algorand (ALGO) Price Forecast December 2025
0.18
0.30
0.34
ALGO Price Analysis 2026
Over the last three years, Algorand (ALGO) has been in a sustained sideways trading range, which has slowly built an ascending broadening wedge pattern. This slow price action is in stark contrast to the parabolic growth it experienced in 2021.
This extended period of consolidation is clearly visible on the monthly chart, suggesting that the longer the price coils, the more powerful the eventual breakout could be.
Looking toward the second half of 2025, if demand for ALGO increases in direct proportion to its adoption, it could clear key resistance levels. With a surge in momentum, ALGO could aim for price targets of $0.60, $0.80, and potentially even $0.90 by year-end.
While these targets may appear ambitious given the current price, the macro-level chart analysis indicates that such a move is plausible if strong momentum returns to the market, especially given the increased institutional collaborations and retail adoption.
Year
Potential Low
Potential Average
Potential High
2025
$0.20
$0.50
$0.90
Algorand Price Targets 2026 – 2030
Year
Potential Low ($)
Potential Average ($)
Potential High ($)
2026
0.65
1.0
1.35
2027
0.90
1.50
2.00
2028
1.40
2.10
2.90
2029
1.75
2.95
4.15
2030
2.50
4.05
5.65
Algorand (ALGO) Price Forecast 2026
Moving forward to 2026, the ALGO price may record a maximum price of $1.35. With a potential low of $0.65, the average price could settle at around $1.0.
ALGO Coin Price Projection 2027
Looking ahead to 2027, the Algorand crypto token may range between $0.90 and $2.0. With this, the average trading price could settle at around $1.50 for the year.
Algorand Crypto Price Action 2028
In 2028, the ALGO coin with a potential surge could reach a high of $2.90, a low of $1.40, and an average of $2.10.
ALGO Token Price Analysis 2029
Moving into 2029, the Algorand coin could range between $1.75 and $4.15. Considering the buying and selling pressure, the average price could settle at around $2.95.
ALGO Price Prediction 2030
By 2030, the value of a single Algorand token could reach a high of $5.65, a low of $2.50, and an average of $4.05.
Market Analysis
Firm Name
2025
2026
2030
Currencyanalytics
$0.67
$0.97
$4.06
Priceprediction.net
$0.18
$0.258
$1.10
DigitalCoinPrice
$0.82
$1.28
$2.60
Never Miss a Beat in the Crypto World!
Stay ahead with breaking news, expert analysis, and real-time updates on the latest trends in Bitcoin, altcoins, DeFi, NFTs, and more.
FAQs
What is the Algorand price prediction 2025?
Algorand may trade between $0.45 and $0.90 in 2025, depending on adoption, market demand, and overall crypto sentiment.
Is Algorand a good long-term investment?
Algorand’s focus on scalability and developer tools makes it a strong long-term contender, but investors should consider overall market risks.
What drives Algorand’s price growth?
ALGO’s price is mainly driven by adoption, developer activity, network upgrades, and overall crypto market sentiment.
How high can Algorand go by 2030?
Forecasts suggest ALGO may reach up to $5.65 by 2030 if adoption expands and market conditions remain favorable.
Why is Algorand gaining developer interest?
Tools like AlgoKit 3.0 and faster transaction speeds are attracting more developers, boosting ecosystem activity and utility.
Price predictions for 2026 range from $4.6 – $7.20.By 2030, the MYX price could surge toward $46.80 due to growing trader activity.
MYX Finance is positioning itself as a next-generation decentralized perpetual futures exchange, targeting traders who want on-chain transparency without sacrificing leverage and execution speed.
As centralized exchanges face increasing regulatory pressure, perpetual DEXs like MYX are attracting users looking for non-custodial alternatives.
While the overall cryptocurrency market is under pressure, MYX Finance’s native token (MYX) is moving in the opposite direction. The token jumped around 15% in the last 24 hours, trading near $3.5, even as Bitcoin, Ethereum, and most altcoins slipped lower.
At a time when overall market sentiment remains weak, MYX’s strong price action has turned heads. Making investors curious about the token growth, wondering what the future will be for these tokens.
With that in mind, let’s take a closer look at our MYX Finance (MYX) price outlook for 2026 to 2030.
Unlike traditional platforms, MYX offers a chain-abstracted wallet that lets users trade across blockchains without manual bridging. Its two-layer account model keeps funds in user custody while enabling gasless trades.
With up to 50x leverage and zero slippage, MYX gained attention, leading to major listings like WLFI in September.
This volume more than doubled during the year, climbing from $51 billion in January 2025 to $123.18 billion by early December. Also, Earnings have more than doubled in the same period, jumping from $18 million to $54.83 million.
The recent uptick suggests improving confidence, but sustained momentum will depend on whether volume growth follows price.
Technical Analysis
Looking at the MYX/USD 4-hour chart, the price is trading around the middle Bollinger Band near $3.27, which is acting as a short-term support zone.
The lower Bollinger Band, at around $2.87, marks the key downside support and has held well during recent pullbacks. On the upside, the upper Bollinger Band near $3.65–$3.68 is acting as immediate resistance. A clear break above this level could open the door towards $4.3, then further to near $5.
Technical indicators, such as the RSI, are currently around 60, indicating mild bullish momentum. This suggests buyers are active, but the price is not yet overbought.
Month
Potential Low ($)
Potential Average ($)
Potential High ($)
MYX Crypto Price Prediction January 2026
$1.74
$3.60
$5
MYX Finance (MYX) Price Prediction 2026
The year 2026 may act as a stress test for MYX Finance. By this stage, traders will judge the platform based on execution reliability during volatile markets, liquidation efficiency, and fee competitiveness.
If MYX succeeds in maintaining tight spreads and predictable funding rates while onboarding new traders from centralized exchanges, its valuation could expand steadily.
Looking ahead, 2026 could decide whether PUMP.fun grows beyond a viral trend into a platform users return to regularly.
However, aggressive competition from other perpetual DEXs could limit upside if differentiation remains weak.
Year
Potential Low ($)
Potential Average ($)
Potential High ($)
MYX Finance Price Prediction 2026
$2.80
$5.2
$10.44
MYX Finance Price Prediction 2026 – 2030
Year
Potential Low ($)
Potential Average ($)
Potential High ($)
2026
$2.80
$5.2
$10.44
2027
$3.90
$11.5
$18.9
2028
$9.56
$17.2
$27.3
2029
$16.7
$25.4
$38.9
2030
$21.5
$36.32
$48.7
MYX Finance Price Prediction 2026
In 2026, MYX’s price will be influenced primarily by trader retention. Metrics such as daily active traders, average leverage usage, and liquidation fairness will determine whether users remain loyal during volatile cycles.
MYX Finance Price Prediction 2027
By 2027, MYX’s growth may depend on product sophistication. Features such as cross-margining, advanced risk controls, or institutional-grade APIs could attract professional traders seeking decentralized alternatives.
MYX Finance Price Prediction 2028
The 2028 outlook relies on market structure evolution. If decentralized derivatives capture a larger share of global futures volume, MYX could benefit significantly, particularly if centralized exchange restrictions tighten further, pushing its price to around $27.3.
MYX Finance Price Prediction 2029
In 2029, MYX may transition from an emerging DEX to an established infrastructure. At this stage, valuation would be supported by consistent protocol revenue, governance participation, and integration with broader DeFi ecosystems.
MYX Finance Price Prediction 2030
By 2030, MYX’s relevance will depend on its ability to remain competitive amid rapid innovation. If it becomes a core liquidity venue for on-chain derivatives, long-term valuation could jump to nearly $47, assuming sustained demand.
What Does The Market Say?
Year
2026
2027
2030
CoinCodex
$9.50
$14.99
$40.87
Pricepredictions
$6.3
$11.8
$28.09
DigitalCoinPrice
$7.41
$18.71
$37.75
CoinPedia’s MYX Finance Price Prediction
After thorough analysis, Coinpedia believes MYX Finance’s long-term outlook depends less on hype and more on execution quality and trader trust.
If the protocol consistently delivers reliable performance during high-volatility events, MYX could outperform many speculative DeFi assets
Year
Potential Low ($)
Potential Average ($)
Potential High ($)
2026
$21.5
$36.32
$48.7
Never Miss a Beat in the Crypto World!
Stay ahead with breaking news, expert analysis, and real-time updates on the latest trends in Bitcoin, altcoins, DeFi, NFTs, and more.
FAQs
What is MYX Finance and how does it work?
MYX Finance is a decentralized perpetual futures exchange offering up to 50x leverage, gasless trades, and non-custodial accounts across blockchains.
Is MYX Finance a good long-term investment?
MYX’s long-term potential depends on trader adoption, platform reliability, and growth of decentralized derivatives markets through 2026–2030.
What is the MYX price prediction for 2026?
For 2026, MYX is projected to trade between $2.8 and $10.44, depending on user growth, market conditions, and protocol performance.
Can MYX reach $40 or higher by 2030?
If MYX becomes a major on-chain derivatives platform with strong liquidity and revenue, long-term forecasts suggest prices near $40–$48 by 2030.
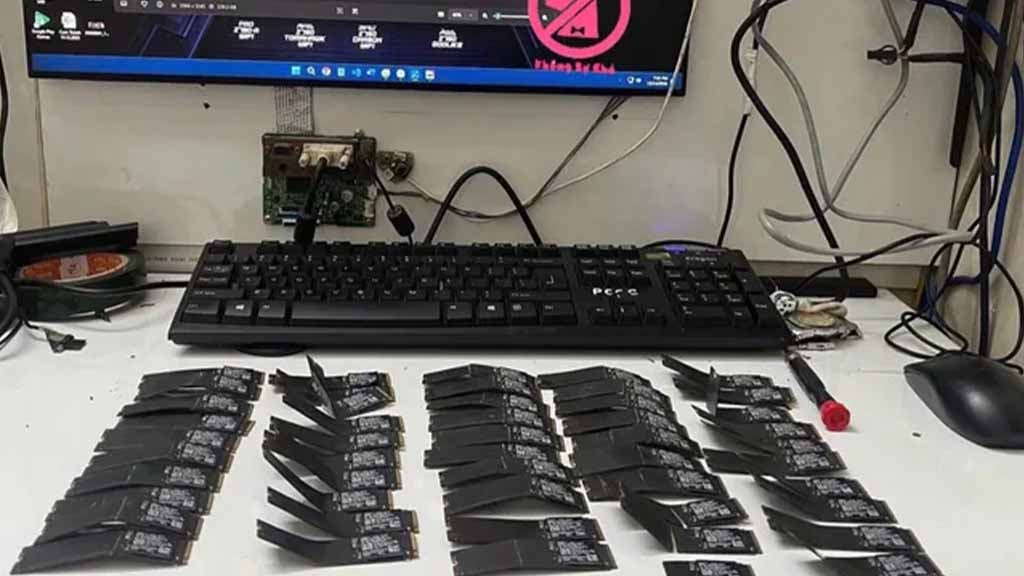


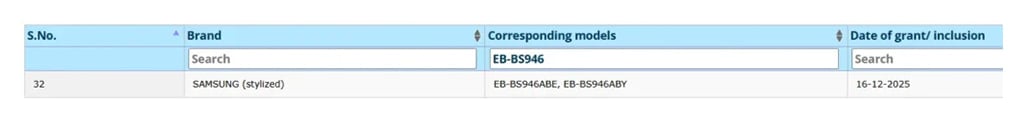
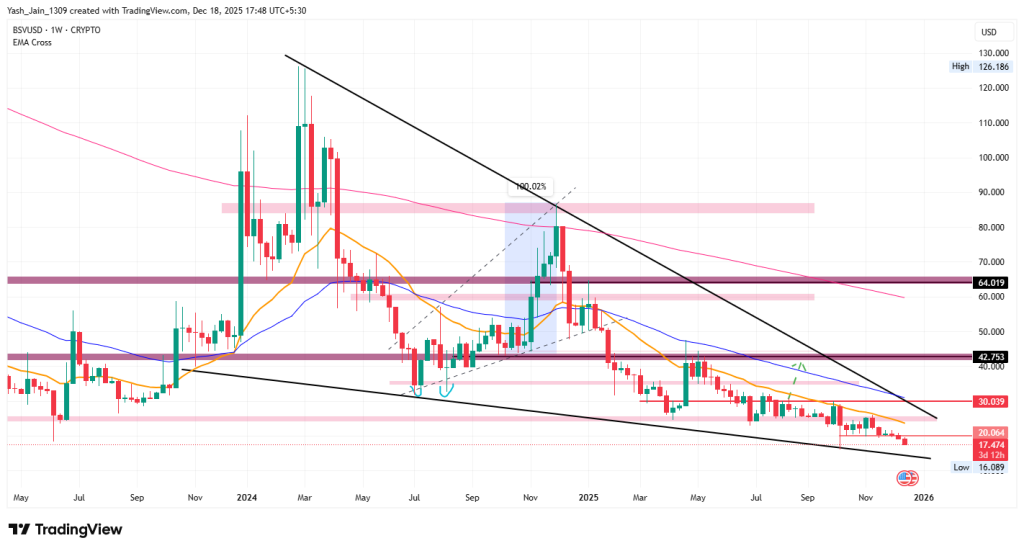
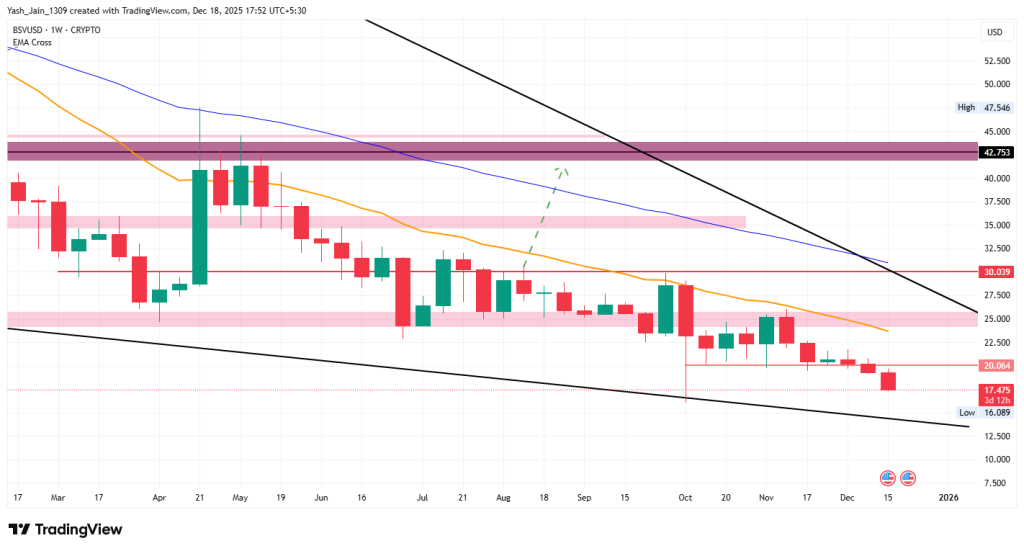
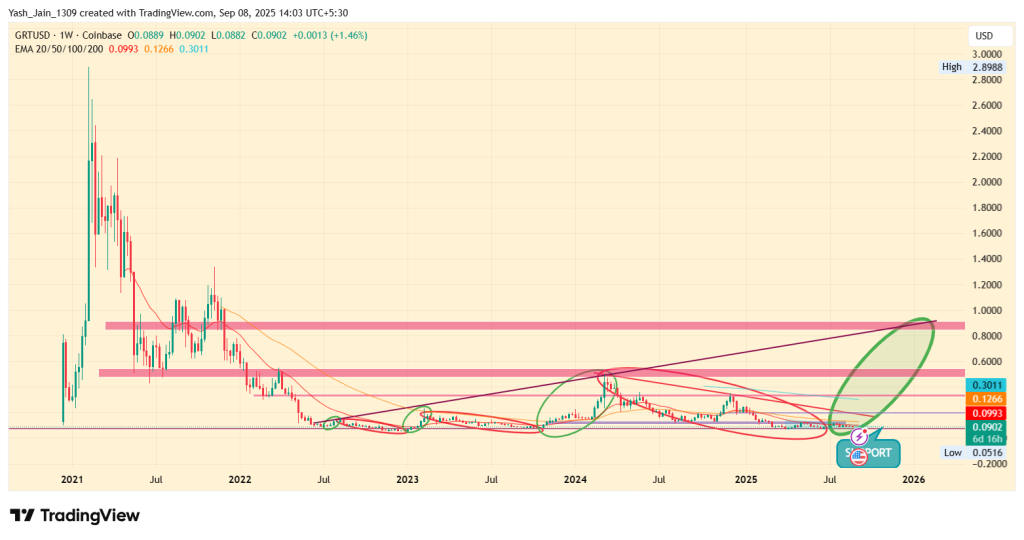
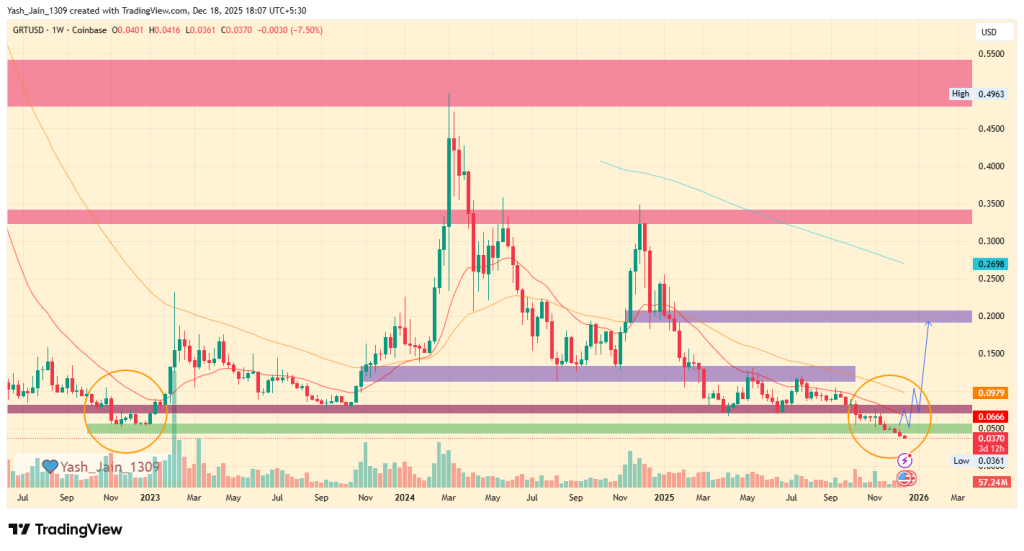
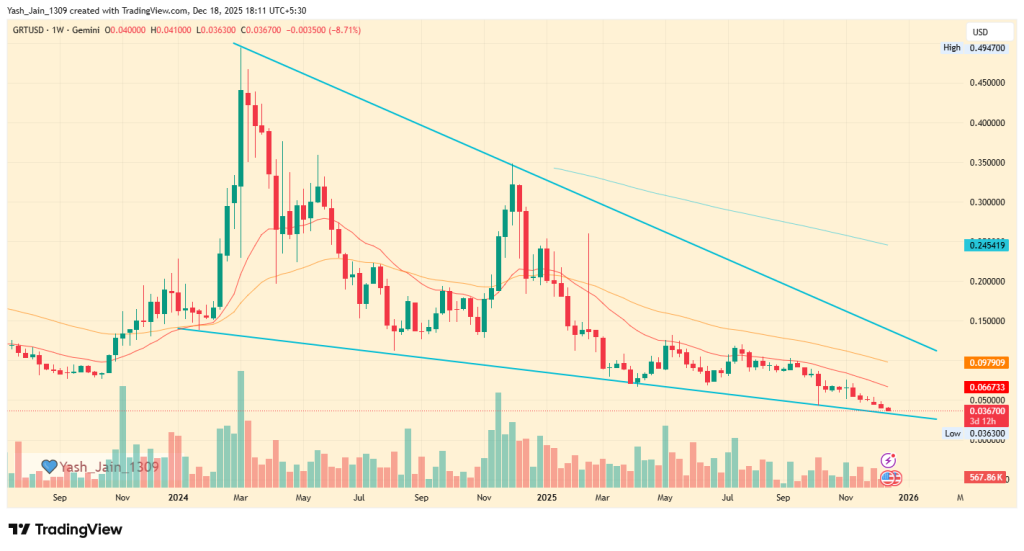
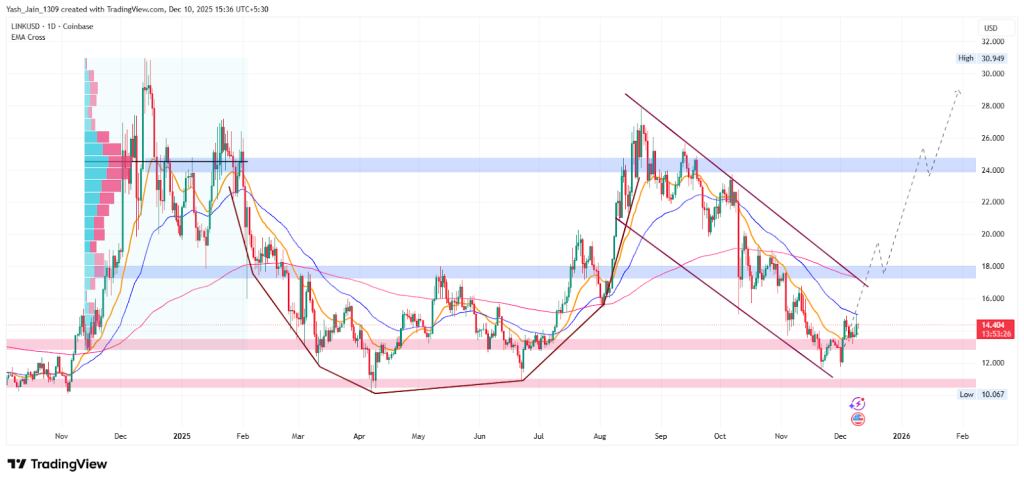
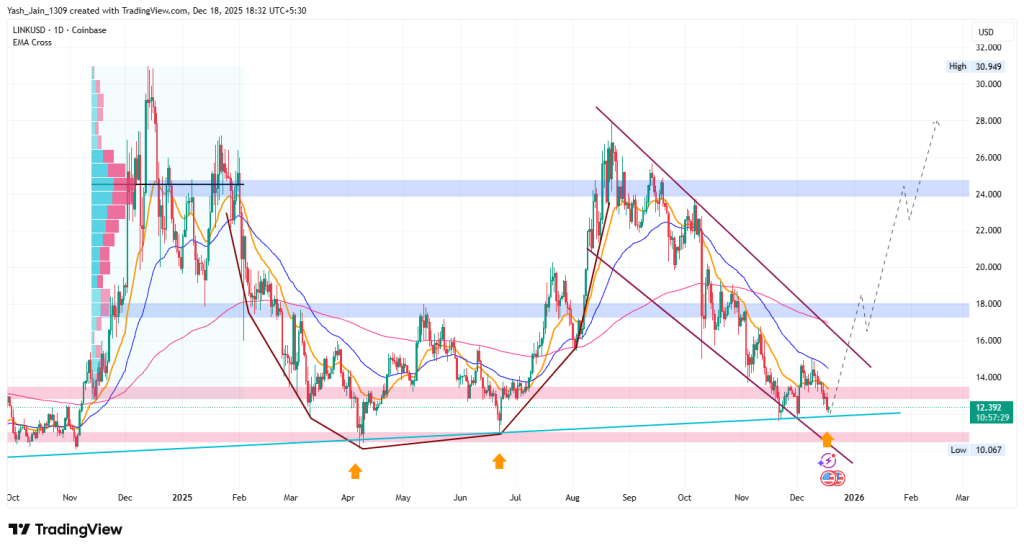


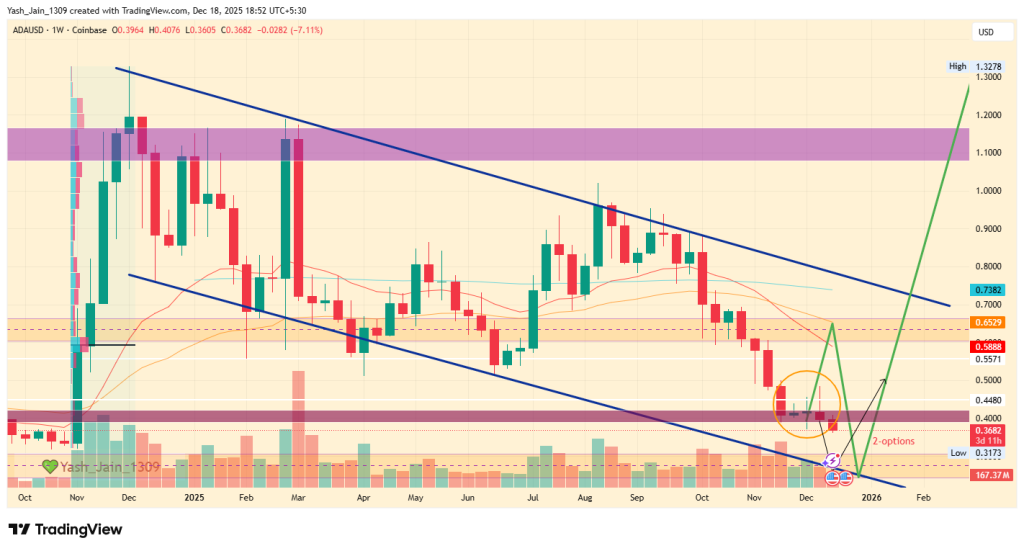
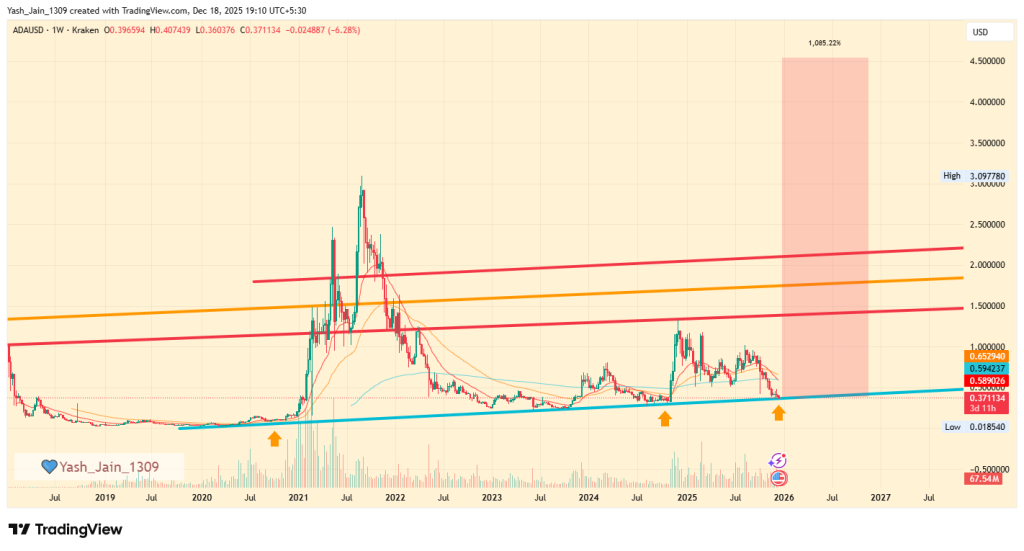


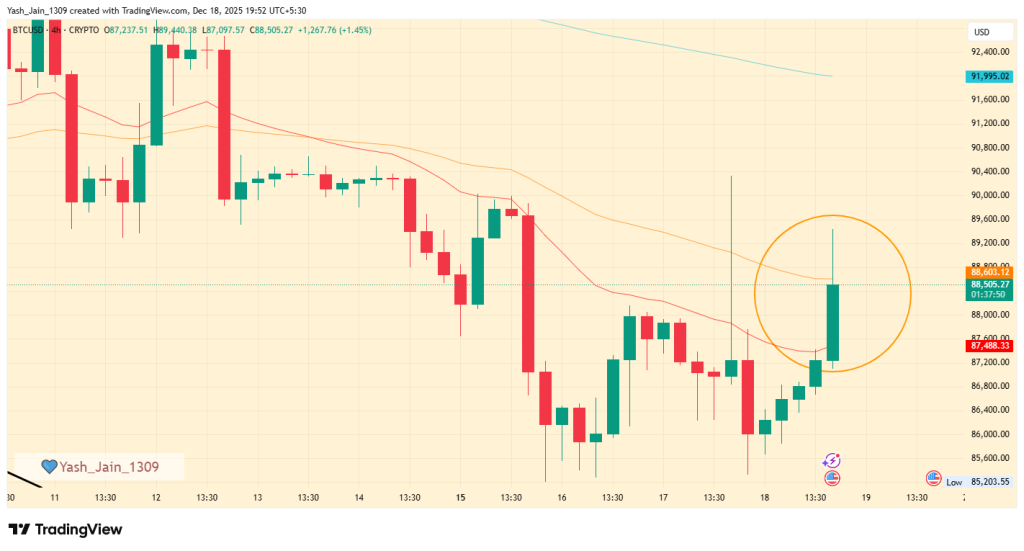
 BREAKING