Based on reports, several asset managers have updated filings for spot XRP exchange-traded funds, naming tickers such as GXRP and XRPZ.
That regulatory activity is one of the items market watchers say is drawing attention back to XRP. At the same time, Ripple’s move to acquire GTreasury for $1 billion has been highlighted by some analysts as a step closer to the $120 trillion corporate treasury market.
Those developments, taken together, are keeping optimism alive among traders and community figures.
Analyst Claims Accelerated Timeline
According to social posts and comment threads, the analyst known as 24hrscrypto1 told followers “something big is going on” and reiterated a previously stated $100 target for XRP, while suggesting the date might come sooner than the earlier claim of by 2030.
At current trading near $2.60, reaching $100 would represent roughly a 4,000% increase from today’s level. Other commentators have offered similar high-end ranges.
Something big is going on..
All I can say is, we will see a $100 XRP way before 2030
For example, CryptoCharged COO Matthew Brienen has described a $100–$1,000 band as “highly possible” inside a five to 10 year span, citing use cases in cross-border payments.
Wealth mentor Linda Jones has used a personal example to make a point: a $100 investment once bought about 400 XRP at $0.25 each, but that same $100 today would buy fewer than 35 XRP, a detail some see as evidence of growing scarcity.
Institutional Accumulation And Supply Concerns
Some observers argue that steady buying by banks and funds has been taking place behind the scenes during volatile stretches. If large holders continue to add positions and trading liquidity thins, the market could face a supply-demand imbalance that would push prices higher quickly.
That is the basic line supporting ultra-ambitious forecasts. Yet whether institutions will hold XRP long term or use it actively in payments remains a crucial unknown that would determine how the story actually plays out.
Market Moves And Community Momentum
Social voices continue to matter. A prominent community commentator using the name UnknowDLT has described XRP as one of the major opportunities for this generation and the next, language that keeps retail interest high.
XRP will end up being one of the greatest opportunities of not only our life time, but many to come.
At the same time, volatility is real: earlier this month XRP dropped to roughly $1.20 during a broader market pullback, showing how fast gains can be wiped out when conditions change.
Reports note that approval of spot XRP ETFs may depend on regulatory timing and procedural steps at the US securities regulator.
Community watchers point to the resumption of SEC actions as a likely trigger for formal approvals, but that is not guaranteed.
The filings from Grayscale, Bitwise, and Franklin Templeton have been updated, yet market access will only expand once regulators sign off.
Featured image from Gemini, chart from TradingView
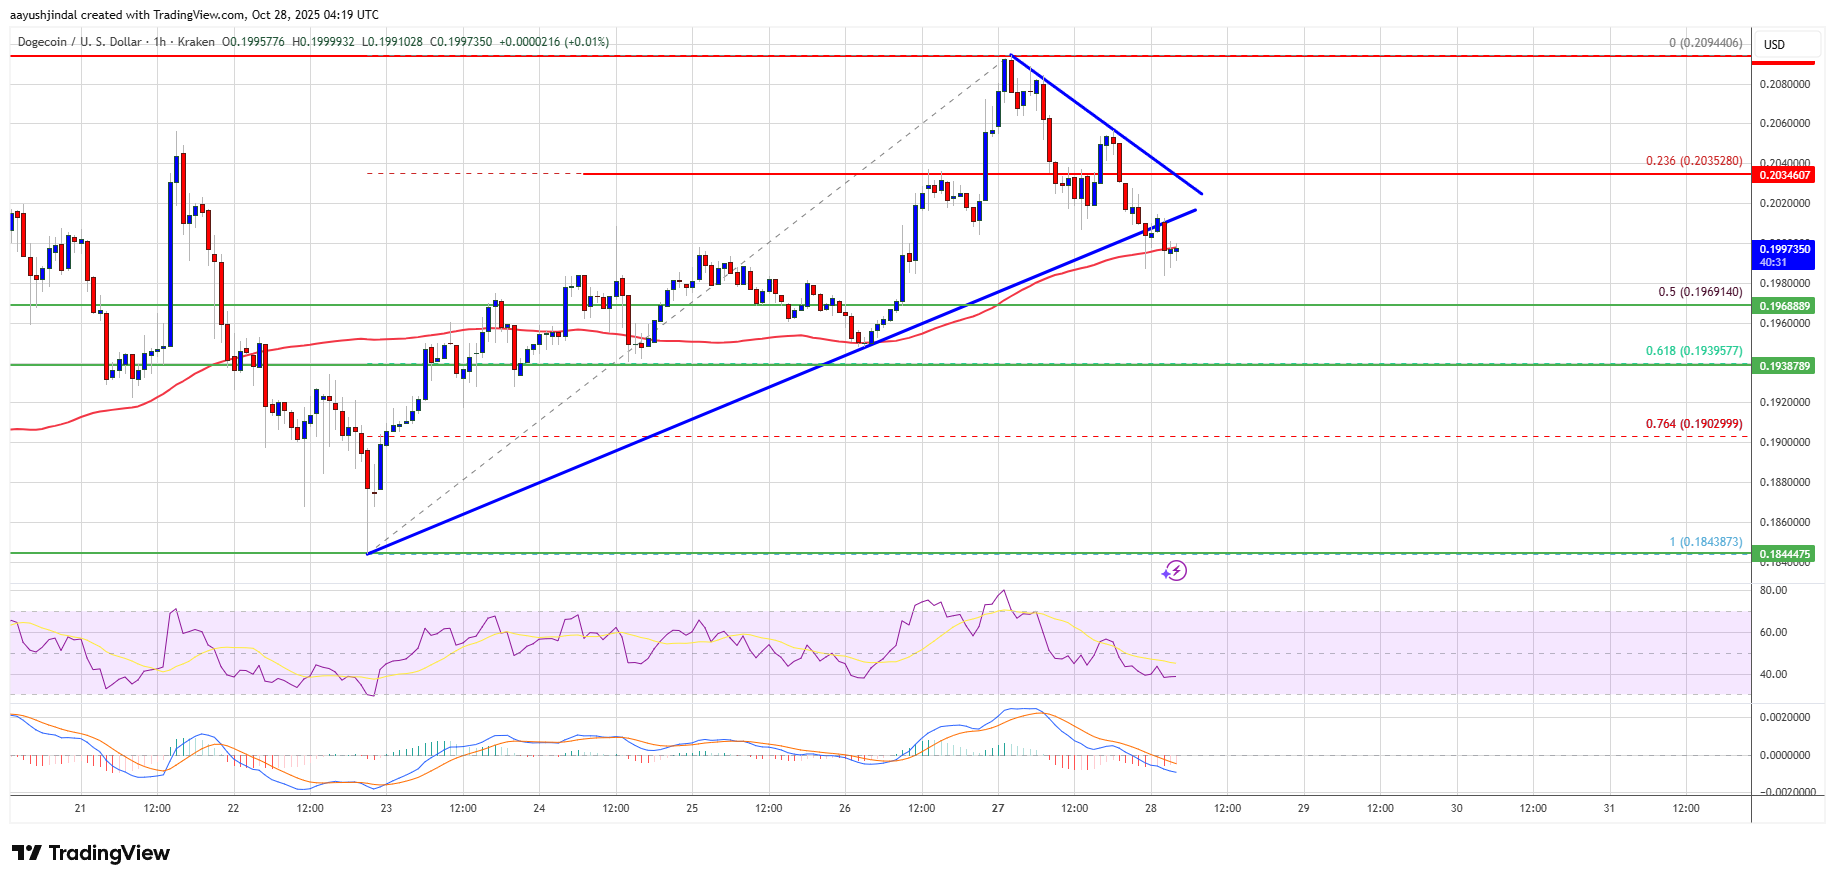
Dogecoin shows potential for $0.22 as whales move millions in $DOGE ahead of the coming FOMC meeting.
Some analysts point to a $0.248 price point if $DOGE breaks out of the symmetrical triangle pattern.
House of Doge becomes majority stakeholder in the Italian soccer team US Triestina Calcio 1918, which expands on $DOGE’s real-world utility.
Maxi Doge ($MAXI) reaches $3.8M in presale, promoting no-stop-loss trading and YOLO entries at 1000x leverage.
Dogecoin remains bullish, according to analysts, despite a 4% drop over the last 24 hours, which suggests a potential breakout to $0.22 if momentum recovers in Q4.
Since then, the coin has struggled to regain momentum, but failed to consolidate in the green, partly because Bitcoin has also failed to do so. $BTC also failed to retain momentum above $115K on three different occasions and is now trading at $112.6K on a 2.46% 24-hour loss.
Despite this bearish performance, the market is confident in $DOGE’s Q4 performance, and Maxi Doge’s ($MAXI) $3.8M presale could contribute to that.
Can $DOGE Reclaim $0.22?
$DOGE shows signs of a bullish tendency, which could support a push to $0.22 if momentum begins to build.
Analysts like Trader Tardigrade go even farther than that, suggesting a price point of $0.248 in case of a breakout from the Symmetrical Triangle pattern.
But how is a breakout possible considering $DOGE’s somewhat bearish recent performance, which largely stems from massive sells? As analyst Ali points out, whales sold over 500M $DOGE over the past week.
The answer is that this is a problem of perspective. While some whales sold in bulk, others started their accumulation phase. As Onchain Lens noted, one whale wallet withdrew over 15M $DOGE from Binance, worth $2.95M. Only sold $1,450-worth of tokens.
This type of whale activity is usually a sign of consolidation in preparation for a coming bull phase, and $DOGE’s chart performance shows exactly that.
With the coin now at $0.1936 and whales making massive moves ahead of the coming FOMC meeting, we expect a momentum buildup into November. A breakout above $0.20 could fuel a more consistent push to $0.22 and above.
The hints are there, especially with $DOGE’s 24h trading volume, which is now 33.75% in the green. It was over 60% earlier today, suggesting increased investor movements. The price remained stable throughout, which suggests that something significant may be on the horizon this week.
And let’s not forget House of Doge’s decision to acquire a majority stake in the Italian soccer team, US Triestina Calcio 1918, which expands on $DOGE’s real-world utility, adding even more legitimacy to the mix.
Long-term, $DOGE will likely break above $ 0.25, especially with projects like Maxi Doge ($MAXI) adding more flavor to the market.
How Maxi Doge Makes Trading Fun
Maxi Doge ($MAXI) turns trading into a big boy’s game, where only the toughest can survive.
The Maxi Doge philosophy is simple, and it fuels the entire ecosystem: retire at 22. There are no shortcuts, excuses, or barriers to overcome. Everything proceeds in a straight line with no Plan B or safety nets.
This explains why Maxi Doge trades at 1000x leverage, buys green candles, and chases pumps while on a diet of Red Bull and Maxitren 9000.
Maxi Doge presents itself as the solution to moderate, lukewarm trading and offers unhinged investing as the alternative.
The solution is in your face:
Maxi Doge embodies sheer willpower: lift, trade, repeat. The $MAXI community channels that energy, sharing leveraged strategies, competitions, and meme-driven camaraderie to unlock maximal gains together.
The presale has been performing very well recently, raising over $3.8M as investors took notice and succumbed to the FOMO fever. $MAXI now trades at $0.0002655, making this an ideal time to invest, considering the project’s potential and meme impact.
If $MAXI can replicate even a fraction of $DOGE’s 34,441% all-time ROI, we’re looking at a slam dunk.
Don’t take this as financial advice. Do your own research (DYOR) before making an investment.
A crypto commentator is once again discussing how the United States may use XRP in a key plan. According to his post, XRP could one day reach very high prices and still be small compared to the US national debt. He suggests crypto could one day help solve the country’s money problems and tells people to hold four digital assets that he believes are important for the future. He says he has known about these ideas for a long time and is reminding the public again.
Crypto Pundit Says XRP At $1,000 Is “Peanuts” For US National Debt
The crypto commentator, known as The Real Remi Relief on X, is sharing a NewsMax video about using XRP to help clear the US national debt. In the X post, he simply says that $1,000 per XRP is “peanuts,” suggesting he thinks XRP’s value could be much higher if this idea becomes reality. The US national debt is enormous, totalling $37.8 trillion, and even at high XRP prices, it would still be small compared to the money the country needs.
The Real Remi Relief also says he has talked about this idea before, as he tells his followers to remember what he said back in December 2024. At that time, he said leaders were considering using crypto in a new way and shared all the information he could, though some he couldn’t discuss openly. The pundit hints that big decisions may involve XRP in a significant role tied to the US national debt.
The crypto commentator believes the public should pay attention because this idea could change how the United States handles its money. He believes that XRP at $1,000 is still cheap if it helps solve the trillion-dollar national debt, and crypto holders should be watching closely to see what happens next.
“Just Stack The Fantastic 4,” Pundit Advises Holders
The Real Remi Relief also tells crypto users to prepare for the future. The crypto pundit strongly suggests that something important is happening behind the scenes, possibly involving XRP and other valuable assets.
He calls these assets the “Fantastic 4.” These include XRP, XLM, XDC, and HBAR. The post suggests that these four assets will be critical in the future if the United States begins using digital money systems more widely. The pundit repeats that crypto holders should consider these assets now, not later.
He also gives safety advice in the X post. He asks holders to store their XRP, XLM, and HBAR in a cold wallet to keep their crypto safe offline. He says people should stack and protect these assets because they may appreciate if the US turns to crypto to address its financial problems.
Technical analyst Charting Guy has shared a new perspective on the relationship between XRP and Ethereum, identifying a setup that he believes could lead to short-term XRP outperformance.
His analysis, which was posted on the social media platform X, focuses on the XRP/ETH weekly chart, where he highlighted the formation of a bullish divergence that has not appeared since mid-2024. The development, he says, signals a constructive shift in momentum that will favor XRP’s price action over Ethereum for the next three months.
A Rare Weekly Bullish Divergence Favors XRP Over Ethereum
In his update, Charting Guy explained that the XRP/ETH weekly Relative Strength Index (RSI) was previously rejected but has now reversed into a bullish divergence. The RSI has turned upward from a low region, while the price closed at a lower low last week, which is a tell-tale sign of waning selling pressure and XRP building strength against Ethereum.
This green-marked divergence on the analyst’s XRP/ETH chart, which is shown below, mimics a setup that preceded another major swing in XRP’s favor. The yellow RSI moving average has also started to flatten, and this is another signal that momentum could be stabilizing before a breakout.
The last time this same configuration occurred was in June 2024, just before XRP began a multi-month surge against Ethereum. Back then, the XRP/ETH pair rose from 0.00015 to as high as 0.0003 in August 2024, before retracing and then finally picking up again in November 2024.
The pattern outlined by the analyst shows XRP/ETH currently consolidating near the 0.00063 ratio level. This time, the setup looks equally compelling. The RSI’s upward curve points to market participation on the XRP side, while Ethereum’s relative momentum continues to slow. If the pattern repeats, it could mark the start of another short-term cycle of the token strength against ETH.
Short-Term Projection Favors XRP
As shown by the projection drawn in blue on the chart above, Charting Guy visualized a scenario where XRP climbs sharply relative to Ethereum. The projection uses the performance of the pair between July 2024 and March 2025 to predict the next move. From here, the projection places the XRP/ETH pair trading above 0.00015 by March 2026.
He concluded his analysis by stating, “I am VERY bullish on $XRP > $ETH the next 3 months.” His three-month forecast implies that XRP could regain a leadership position among major altcoins during the next quarter. If the token manages to outperform Ethereum as predicted, it will close the gap in their market cap.
At the time of writing, XRP is trading at $2.64 with a $158 billion market cap. Ethereum, on the other hand, is trading at $4,025 with a $486 billion market cap.
Dogecoin moved past the $0.20 mark as crypto markets showed a mild rebound. According to market feeds, DOGE traded around $0.20261 at one check, and later reached $0.21 after a small uptick. Bitcoin was holding above $114,000 and Ethereum hovered above $4,200, giving the rally some broader support.
Dogecoin Whale Purchases Spark Buying
According to reports, large holders bought more than 327 million DOGE in the last 24 hours. That wave of big trades coincided with trading volume that rose about 10% above weekly averages.
The latest move signals stronger than usual activity. The purchases were picked up by on-chain trackers and have been pointed to as a likely reason for the recent price movement.
Technical Setup Points To A Tight Range
Based on reports from chart watchers, Dogecoin is trading inside a symmetrical triangle — a pattern that usually means price is being squeezed and could break out in either direction.
The Relative Strength Index stood at 58, which suggests the coin is neither overbought nor oversold. The MACD line is above its signal line, and the histogram shows modest upward momentum, though analysts caution it is not yet a strong surge.
Key Levels To Watch
Traders say a clear move above $0.22 would be the first sign that the bulls are in charge. On the upside, some market watchers list $0.25 as the next meaningful barrier, and a run toward $0.26+ has been floated as a possible target if momentum builds.
On the flip side, a drop below $0.18 could open the door to further losses and bring the consolidation phase back into focus.
Market Sentiment Remains Mixed
Reports have disclosed that DOGE advanced 1.35% to $0.21 during the session, marking its first close above the $0.2026 resistance level since August.
Still, a number of indicators suggest the move is tentative. Volume gains and whale interest are positive signs, but analysts are waiting for confirmation from price action and higher volume on a breakout.
What Could Go Wrong
There are risks. The triangle pattern can break to the downside as easily as it can break up, and the current momentum readings are moderate rather than strong.
If selling pressure mounts or if large wallets begin to shift coins back to exchanges, gains could be reversed quickly. Also, wider market swings in Bitcoin or Ethereum would likely pull DOGE along.
Watch The $0.22 Line
In short, DOGE is showing early signs of life, but a decisive outcome is not yet clear. Traders should watch $0.22 closely; a clean break with above-average volume would increase the odds of a move toward $0.25 and beyond.
If that level does not hold, the market may settle back into the $0.18–$0.22 range for a while longer.
Featured image from Unsplash, chart from TradingView
Wintermute, one of crypto’s largest market makers, struck an overtly risk-on tone in a Monday market update on X, arguing that a dovish macro turn and thawing US–China tensions have reset positioning and liquidity into a friendlier Q4 regime. In a post dated October 28, the firm wrote that “risk appetite is returning as softer CPI data and improving Trump-Xi relations lifted markets, with yields easing and volatility declining,” adding that “Bitcoin reclaimed $115k on ETF inflows and short squeezes, while DeFi and AI sectors led the recovery.”
Wintermute’s Bullish Crypto Outlook For Q4
The desk framed the impulse as both macro- and microstructure-driven. On the macro side, Wintermute pointed to “a softer US CPI print (3.0% YoY vs 3.1% expected)” and “the announcement of a Trump-Xi summit in Seoul,” which it said catalyzed “a broad rebound across assets” as the S&P 500 gained 1.9%, the VIX hovered “around 16,” and Treasury yields eased with rate-cut odds firming into this week’s Federal Reserve meeting.
On the crypto side, the update said “Bitcoin performed well with a 5.3% gain, climbing above $115k… amplified by $160m in short liquidations,” while “Ethereum tracked higher toward $4,200,” and “gold unwound nearly 7% from its highs, signaling a rotation from defensive assets into risk assets.”
Wintermute characterized the advance as broadening beneath the surface. “DeFi and AI names led gains on strong protocol revenue prints and improving on-chain activity,” while “Utilities and Tooling benefited from infrastructure-related rotation as new L2 deployments and restaking primitives drew liquidity.”
Derivatives posture turned supportive, too: “On the perp side, funding rates turned positive again across most majors… though positioning remains far from crowded.” The firm also flagged a turn in base money for crypto beta: “Stablecoin supply is ticking higher for the first time since September, reinforcing that macro tailwinds are beginning to translate into fresh inflows.
Spot demand from US spot ETFs, according to Wintermute, continues to anchor the structure even as activity cooled. “US spot BTC ETFs absorbed moderate inflows through the week even as volumes thinned, underscoring sticky structural demand.” Meanwhile, derivatives leverage “is rebuilding at a measured pace after the early-month flush,” which the firm framed as healthier—“cleaner leverage and more balanced funding.”
The house view into November is unambiguously constructive and leans on seasonality and positioning. One passage distilled the stance: “While Uptober had a bit of a false start, macro tailwinds, cooling inflation, ‘stabilizing’ geopolitical tension and a dovish FED are setting the stage for a supportive rest of the year, which historically (Q4) has been the strongest for Bitcoin.”
In its closing summary, Wintermute reiterated that “positioning is cleaner, volatility subdued, and capital rotation is gradually steering toward crypto. With liquidity conditions improving and sentiment stabilising, the setup into Q4 remains constructive, favouring further risk-on continuation.”
A Decisive Week For Crypto
The note drew immediate amplification from market commentators. DeFi analyst Ignas compressed the message into a trading takeaway: “Wintermute is telling you to max bid,” citing “yields… easing, volatility… down, and BTC reclaimed 115k helped by ETF inflows and short squeezes.” He highlighted Wintermute’s own line that “macro tailwinds, cooling inflation, ‘stabilizing’ geopolitical tension and a dovish FED are setting the stage for a supportive rest of the year.”
Whether this marks an outright regime shift or a tactically favorable window will hinge on this week’s event risk—namely the Fed decision and any concrete outcomes from the Trump–Xi engagement.
Wintermute, however, is explicit about the current state of play: markets are “rotating back into risk” with “cleaner positioning” and “calmer volatility,” Bitcoin “has reclaimed early-October losses with steady ETF inflows,” and sector leadership in DeFi and AI is consistent with an early-risk rotation. “With cleaner positioning, calmer volatility, and better macro visibility, the setup into November looks healthy for further recovery and rotation across crypto,” the firm concluded.
At press time, the total crypto market cap stood at $3.78 trillion.
Smart money is flowing into utility-focused presales ahead of altcoin season.
$XRP is once again ignoring the broader market while Bitcoin and Ethereum decline red.
Currently hovering above $2.65 with a cheeky 1.5% gain, $XRP didn’t get the memo that everyone else is having a bad time.
According to crypto expert CRYPTOWZRD, $XRP needs to stay above the $2.62 support level, as breaking through the $2.75 resistance could lead to a surge toward $3.
$XRP whales are accumulating at levels we haven’t seen before. While retail investors are doom-scrolling through red candles, smart money is quietly loading its position.
If you’re not positioning yourself in the best altcoins to buy now, you might be late to the party. Again.
While everyone’s watching $XRP test support levels with the focus of a hawk, let’s discuss three presale altcoins that could surge during this altcoin season.
1. Best Wallet Token ($BEST) – The Infrastructure Play Whales Are Quietly Loading
Prioritize hardware support, swaps/bridges, EVM + non-EVM, and strong security (audits, phishing alerts, biometrics, social recovery/MPC). Skip custodial risk and outdated add-ons, choose speed, safety, and full control.
Best Wallet is more than a wallet; it’s a comprehensive DeFi and NFT hub with a presale launchpad on the horizon. It speaks multi-chain fluently, which matters when altcoin season arrives and every chain comes to life.
Remember juggling seven wallets last cycle? Yeah—Best Wallet turns that chaos into one clean, connected stack.
Best Wallet token ($BEST) holders get exclusive access to early presale opportunities, reduced trading fees, and governance rights over which projects get featured on the platform. It’s a VIP pass to the hottest club filled with degens, and the bouncer is a smart contract.
Currently in presale at $0.025865, the token has already raised over $16.7M from investors who clearly understand that infrastructure plays win in bull markets, including a $33K buy in just 10 hours ago.
When $XRP finally rips past $2.75 and sparks the altcoin feeding frenzy, you’ll want a wallet built for chaos. Best Wallet is that stack, multi-chain, fast, and battle-ready. Get in early, and you’re positioned if volumes explode at launch.
2. Bitcoin Hyper ($HYPER) – The Layer 2 That Finally Makes Bitcoin Usable
Bitcoin is painfully slow with just 3-7 transactions per second. We’ve all been there, waiting 30 minutes for a transaction to confirm while watching the crypto market move without you, like you’re stuck in traffic while everyone else is already at the party.
Bitcoin Hyper ($HYPER) decided that wasn’t good enough and built a Layer 2 rollup for Bitcoin.
Bitcoin Hyper fuses Solana’s SVM with Bitcoin’s battle-tested security. Think Bitcoin’s trust with Solana-level speed: near-instant finality, tiny fees, and the same hard security that made BTC the OG.
The $HYPER token is currently in presale at $0.013185, and the project has already raised over $25.1M. Whale buys of $379.9K and $274K show that smart money is recognizing that Bitcoin needs scaling solutions and Bitcoin Hyper is actually delivering.
The tokenomics are refreshing, with 30% allocated to development, as it appears they genuinely want to build something. Novel concept in crypto, I know.
The presale is structured in stages with price increases as it progresses, so early birds genuinely do get better entry points. Learn how to buy Bitcoin Hyper before the next price increase.
Staking is available from day one, and with Bitcoin’s dominance likely to remain strong, regardless of what happens in the altcoin market, $HYPER offers a solid hedge that still provides sweet presale upside potential.
3. DeepSnitch AI ($DSNT) – The Intelligence Edge That Separates Winners from Exit Liquidity
Wouldn’t it be nice to know what the whales are doing before everyone else does? That’s exactly what DeepSnitch AI is building, and it’s about time someone did this properly.
DeepSnitch combines artificial intelligence with blockchain surveillance tools to provide regular traders with the same insights that whales and institutions have been using for years.
Five AI-powered tools analyze wallet movements, identify accumulation patterns, detect suspicious activity, and provide a heads-up when smart money is making moves.
The DeepSnitch AI token ($DSNT) is currently in Stage 2 presale at just $0.02032, having raised over $476K. That’s dirt cheap for a project with actual utility that solves a real problem.
When $XRP finally breaks through $2.75 and altcoin season goes nuclear, having DeepSnitch AI in your toolkit means you’ll see the next wave coming before most people realize there’s a wave at all.
$XRP is testing support while whales stack sats and experts call for a potential run to $3. Whether you’re betting on $XRP to break through or hedging your bets with high-potential presales, position now or cry later.
Best Wallet token gives you the infrastructure, Bitcoin Hyper gives you the Bitcoin upside with actual functionality, and DeepSnitch gives you the intelligence edge.
If there was ever a time to position yourself for the next leg up, it’s probably now.
After a turbulent month, the Dogecoin price looks to stabilizing just around the $0.2 level, and it continues to show strength at this level. However, there are some developments on the meme coin’s chart that suggest that there could be some bearish headwinds that could lead to another crash. Crypto analyst MyCryptoParadise outlines this in a recent analysis, showing the possible directions that the Dogecoin price could be headed in as the market unfolds.
Dogecoin Price Is Facing Strong Resistance
The first thing that stands out is that the crypto analyst explains that the Dogecoin price is already seeing a lot of resistance, especially on the 4-Hour chart. Since the price was rejected below $0.21, it suggests that bears are already putting a lot of pressure on the price at this level.
Another interesting chart is the Dogecoin 1-Hour chart that shows a breakdown in the Rising Wedge. The fact that this breakdown occurred with bearish divergence increases the possibilities of a price decrease, pushing it back down toward the next major support.
The crypto analyst also shows that this downward move is still supported by the confluence that has shown up. On the Dogecoin 1-Hour chart, the 200EMA has also been acting as a dynamic resistance, adding more pressure to an already bearish chart.
From here, the crypto analyst advises investors to be cautious before entering into the meme coin. For the best time to enter, it is best to wait for the price breakdown toward lower levels before taking a position. If the current trend plays out, then it could see another 10% breakdown.
In the event of this breakdown, then the next major level lies just above $0.18, which is where support is piling up. A cleaner bearish candlestick pattern would ensure an entry with lower risk, before the Dogecoin price begins another bounce.
However, just like with any setup, there is still the possibility for invalidation and this time, the bulls could do it. The Dogecoin price would have to break out and make a candle above the resistance zone on the 4-Hour chart. Such a sustained break would invalidate the bearish setup and create room for a bullish continuation.
The second part of the year has seen a notable surge in the US stock market, while Bitcoin (BTC) and the broader cryptocurrency market has faced its share of uncertainty and significant corrections.
With the Nasdaq recently surpassing the 26,000 mark, leading analysts are now suggesting that this milestone could be a clear indicator for Bitcoin to finish the year at new highs.
What Historical Patterns Indicate
According to experts at The Bull Theory, the pattern observed with the Nasdaq reaching all-time highs typically suggests a flow of liquidity, an increased risk appetite, and a shift of capital into growth assets. As this phase develops, it often sets the stage for Bitcoin’s next significant movement.
Data compiled by the analysts supports this assertion. Historically, in the first 30 days following a Nasdaq all-time high, Bitcoin has averaged a gain of approximately 7%. This return tends to grow, reaching about 14% within 60 days and climbing to an average of 25% by the 90-day mark.
This pattern is not merely coincidental; it reflects a capital rotation where liquidity does not disappear but instead shifts from traditional markets into higher-risk assets like Bitcoin.
The current situation appears to follow a similar trajectory. The Nasdaq’s rise to 26,000 indicates a wave of liquidity building beneath the surface. With rate cuts beginning and quantitative tightening coming to an end, global capital is once again seeking yield.
This scenario mirrors the conditions that contributed to Bitcoin’s significant breakouts in previous years, particularly in 2017, 2020, and 2023.
As such, the analysts note that the next four to five months may represent an acceleration phase for Bitcoin, coinciding with a potential pause in equities, which could lead to crypto becoming the primary outlet for liquidity.
Bitcoin Poised For Breakout Similar To 2020-2021 Cycle
Analysts like Ash Crypto also noted on social media that the BTC/NASDAQ weekly chart is revealing a repeating pattern reminiscent of the 2020-2021 cycle, during which Bitcoin significantly outperformed traditional tech stocks. In both cycles, the October to March timeframe has historically prompted major upward movements.
After a period of consolidation within a rising wedge, the BTC/NASDAQ pair appears poised for another breakout. Should this pattern repeat, Bitcoin may see substantial gains compared to the Nasdaq in the fourth quarter and into early 2026, Ash Crypto noted.
Notably, this sets the stage for a major rally that could see Bitcoin prices surpassing current records of over $126,000. However, the market is still characterized by increased volatility, and there is no clear path ahead for BTC.
The leading cryptocurrency is trading at $113,350 after a 2% correction in Tuesday’s trading session, following an initial surge above $115,000. This puts BTC 6.5% below record highs.
Featured image from DALL-E, chart from TradingView.com
Following the recent launch of multiple crypto ETFs, Bitwise Asset Manager’s CIO has forecasted a bright future for the firm’s Solana Staking Exchange-Traded Fund (ETF), as investors show strong initial interest in the investment product.
Bitwise Solana Staking ETF Sees Strong Start
On Tuesday, Bitwise CIO Matt Hougan predicted that the Bitwise Solana Staking ETF (BSOL) could attract significant institutional interest and become one of the leading investment products based on digital assets.
Hougan argued that Solana is “one of the most exciting crypto investment opportunities that exists today,” as it records “the most revenue of any blockchain.” He explained that institutional investors “love” both ETFs and revenue, which suggests that these investors will “love Solana ETFs.”
Bitwise’s CIO previously pointed out that there must be fundamental reasons for investors’ interest in investment vehicles such as ETFs and Digital Asset Treasuries (DATs), signaling that Solana has them. Therefore, he has “a feeling the Bitwise Solana Staking ETF, BSOL, is gonna be huge.”
Ahead of the launch, ETF Expert Eric Balchunas predicted that the first day volume for Bitwise’s Solana ETF could surpass the $50 million mark. Notably, the firm’s spot Bitcoin ETF (BITB) and spot Ethereum ETH (ETHW) recorded $237.9 million and $204 million on their first day, respectively.
Hougan has highlighted that Solana’s market capitalization is 1/20th the size of BTC and less than 1/4th the size of ETH. Based on this, the volume for an SOL ETF is expected to be smaller than that of ETFs based on the two leading crypto assets.
According to data shared by Balchunas, BSOL recorded an impressive volume of $10 million in the first 30 minutes of trading, hinting at initial demand. This amount surged to approximately $33 million by the half-day mark and hit $56 million by the end of its first trading day.
According to the analyst, BSOL had a strong start, noting that its “$56m is the MOST of any launch this year.. More than XRPR, SSK, Ives and BMNU.”
Crypto ETFs Launch Amid Government Shutdown
BSOL was among the crypto ETFs launched on October 28 despite the US government shutdown. As reported by NewsBTC, Bitwise, for its Solana Staking ETF, and Canary Capital, for its spot Litecoin (LTC) and Hedera (HBAR) ETFs, filed 8-A forms on Monday to launch the investment products this week despite the government shutdown.
Notably, the Securities and Exchange Commission (SEC) was set to approve over a dozen altcoin ETFs between October and November after delaying the decision deadline and releasing new generic listing standards for the products.
However, investors expected that the long-awaited green light would be delayed until the end of the government shutdown. Journalist Eleanor Terret explained that the launch was possible because an open government isn’t required and the 8-A filings are “just as important” as the S-1 forms, as they formally register ETF shares under the Securities Exchange Act of 1934.
As a result, after the NYSE certified all the filings for the ETFs, they could start trading on Tuesday. Meanwhile, Grayscale’s Solana Trust (GSOL) will convert into an ETF on Wednesday.
Global financial services company Western Union is making a strategic move into the world of stablecoins, responding to the evolving landscape created by the recent passage of the GENIUS Act in the US.
On Tuesday, the company announced its intention to launch the US Dollar Payment Token (USDPT), a new stablecoin, alongside its Digital Asset Network designed to integrate digital and fiat currencies.
Western Union New USDPT Stablecoin
Built on the Solana (SOL) blockchain and issued by Anchorage Digital Bank, USDPT aims to broaden the options for transferring money for customers, agents, and partners, while also bolstering Western Union’s treasury capabilities.
Through this initiative, the company plans to provide users with access to digital assets, allowing them to send, receive, spend, and hold USDPT with ease, supported by Western Union’s global compliance and risk management framework.
Devin McGranahan, President and CEO of Western Union, expressed the company’s commitment to harnessing emerging technologies to empower customers and communities.
“As we transition into the digital asset space, USDPT will enable us to take ownership of the economics associated with stablecoins,” McGranahan stated.
He also highlighted the significance of the Digital Asset Network, which aims to simplify cash off-ramps for digital assets by partnering with wallets and wallet providers, thereby allowing seamless access for customers via Western Union’s extensive global network.
Western Union anticipates that USDPT will launch in the first half of 2026, with plans for users to access the stablecoin through partner exchanges, ensuring broad availability and user-friendliness.
Stablecoins To Reduce Reliance On Traditional Banking
During Western Union’s third quarter of the year earnings call last Thursday, McGranahan revealed that the company has initiated a pilot program utilizing stablecoins for value transfer.
He noted that this pilot aims to leverage blockchain technology and stablecoins to decrease reliance on traditional correspondent banking systems, which will help shorten settlement times and enhance capital efficiency.
Historically, Western Union has maintained a cautious approach towards crypto, primarily due to concerns regarding volatility, regulatory challenges, and customer protection.
However, with the enactment of the GENIUS Act, McGranahan indicated that new opportunities are emerging for integrating digital assets into the company’s operations, enhancing efficiency, reducing friction, and ultimately improving the customer experience.
Western Union facilitates the transfer of billions of dollars annually, boasting a market capitalization of over $2.9 billion as of October 28, and generating more than $1 billion in adjusted revenue in the third quarter of the year alone.
Despite the announcement, SOL’s price has failed to react positively, currently attempting to hold the $200 line as the cryptocurrency’s next short-term support.
Featured image from DALL-E, chart from TradingView.com
On-chain analytics firm Glassnode has revealed a Bitcoin price range that defines the current battleground between recent buyers and profit-takers.
Bitcoin Cost Basis Distribution Shows Where Resistance & Support Are Strongest
In a new post on X, Glassnode has talked about where support and resistance levels lie for Bitcoin based on the Cost Basis Distribution (CBD). This indicator basically tells us about the total amount of supply that last changed hands at the various price levels that the cryptocurrency has visited in its history.
Below is the chart shared by the analytics firm that shows the trend in this metric over the last few months.
As is visible in the graph, the CBD highlights two levels for holding a dense amount of the cryptocurrency’s supply (shaded in red). The lower of these levels is situated near $111,000. A large chunk of buying at this mark occurred during the recent bearish phase in the asset.
The other level is located around $117,000, made up of investors who bought during the price rally to the all-time high (ATH). Naturally, these buyers would be underwater right now, while those who purchased at $111,000 would be in profit.
Generally, holders are sensitive to retests of their cost basis and can show some kind of reaction during one. Since these two levels host the cost basis of a significant amount of investors, it’s possible that when BTC will revisit them, some panic selling or buying will crop up.
Which behavior would be dominant usually comes down to the market mood and the direction of the retest. When the retest occurs from above, investors may choose to buy more, believing the same cost basis level would result in profits again in the future. Similarly, holders who were in loss prior to the retest can react by selling, fearing that the asset will drop again in the future.
Considering these effects, the $111,000 may be considered a key support cushion for Bitcoin, while $117,000 a resistance barrier. “This range defines the current battleground between recent buyers and profit-takers,” noted Glassnode.
It now remains to be seen which level BTC will visit next and how its retest will go. “A break in either direction could set the tone for the next major move,” explained the analytics firm.
In some other news, the Stablecoin Supply Ratio (SSR) Oscillator has been sitting at cycle lows recently, as Glassnode has pointed out in another X post. This oscillator is based on the SSR, which compares the Bitcoin circulating supply against the supply of the stablecoins.
The SSR Oscillator is sitting at a low level at the moment, which indicates that the BTC supply is low compared to stablecoin liquidity. “Historically, such periods precede stronger bid-side support when market confidence returns,” said the analytics firm.
BTC Price
Bitcoin saw a retrace toward $113,500 earlier, but the coin has been quick to bounce back as its price has returned to $115,400.
Market expert VirtualBacon recently suggested that the most significant event for the crypto industry this year is not the Bitcoin (BTC) Halving or the approval of exchange-traded funds (ETFs), but rather a potential shift in Federal Reserve (Fed) liquidity policy.
After 18 months of tightening measures, the Fed is reportedly preparing to pause its quantitative tightening (QT) and may even initiate stealth quantitative easing (QE) once again.
What’s Next For The Crypto Market
In a recent post on social media platform X, VirtualBacon laid out a compelling argument linking liquidity pivots to altcoin cycles. In 2019, the Fed halted QT, which resulted in a rally for altcoins. Conversely, in 2022, when the Fed began QT, altcoins peaked.
Now, as the Fed is expected to end QT in 2025, VirtualBacon anticipates a similar surge for altcoins. The correlation is clear: when the Fed increases liquidity, altcoins tend to rise. The pressing question now is when exactly QT will come to a close.
While the Fed may not explicitly label a shift as QE, the expert notes that the pivotal moment will arrive when they remove the language regarding “reducing the size of the balance sheet.”
The last notable instance of this was during the 2019 repo crisis, when banks faced immediate cash shortages, prompting the Fed to inject $75 billion into the financial system. Although Powell claimed it was “not QE,” it effectively was, and following that intervention, Bitcoin tripled in value within months.
CME FedWatch Tool Shows High Probability Of Rate Cuts
Major financial institutions are already making predictions, with Goldman Sachs stating that the October meeting is the base case for QT to end, Bank of America expecting QT to cease by month-end, and Evercore indicating that the Fed is likely to signal an end to QT this week.
The same indicators that caused market disruptions back in 2019 are signaling distress now. Regardless of official statements, it appears QT is nearing its conclusion, with stealth QE on the horizon.
This shift would facilitate a return of liquidity to the markets, which historically has driven crypto prices. Liquidity acts as the fuel for market movements, and the Fed is poised to refill this tank.
The CME FedWatch tool currently indicates a 96.7% probability of a rate cut this month and an 87.9% chance of another cut in December. Powell recently hinted that QT would conclude “in the coming months,” signaling an imminent pivot.
M2 Money Supply Signals Upcoming Bitcoin Surge
Despite the current market uncertainty, VirtualBacon asserts that Bitcoin has not reached its peak. Out of 30 historical indicators that typically signal a bull market peak, none have activated yet, with data indicating there is still room for growth.
The global M2 money supply continues to rise, which historically leads Bitcoin prices by 10 to 12 weeks. The expert added that since the beginning of the month, this money supply has been increasing.
This development indicates that Bitcoin’s next upward movement is already in the pipeline, albeit lagging behind the liquidity curve. Additionally, VirtualBacon forecasts that once the Fed pivots, a new altcoin season may commence.
Featured image from DALL-E, chart from TradingView.com
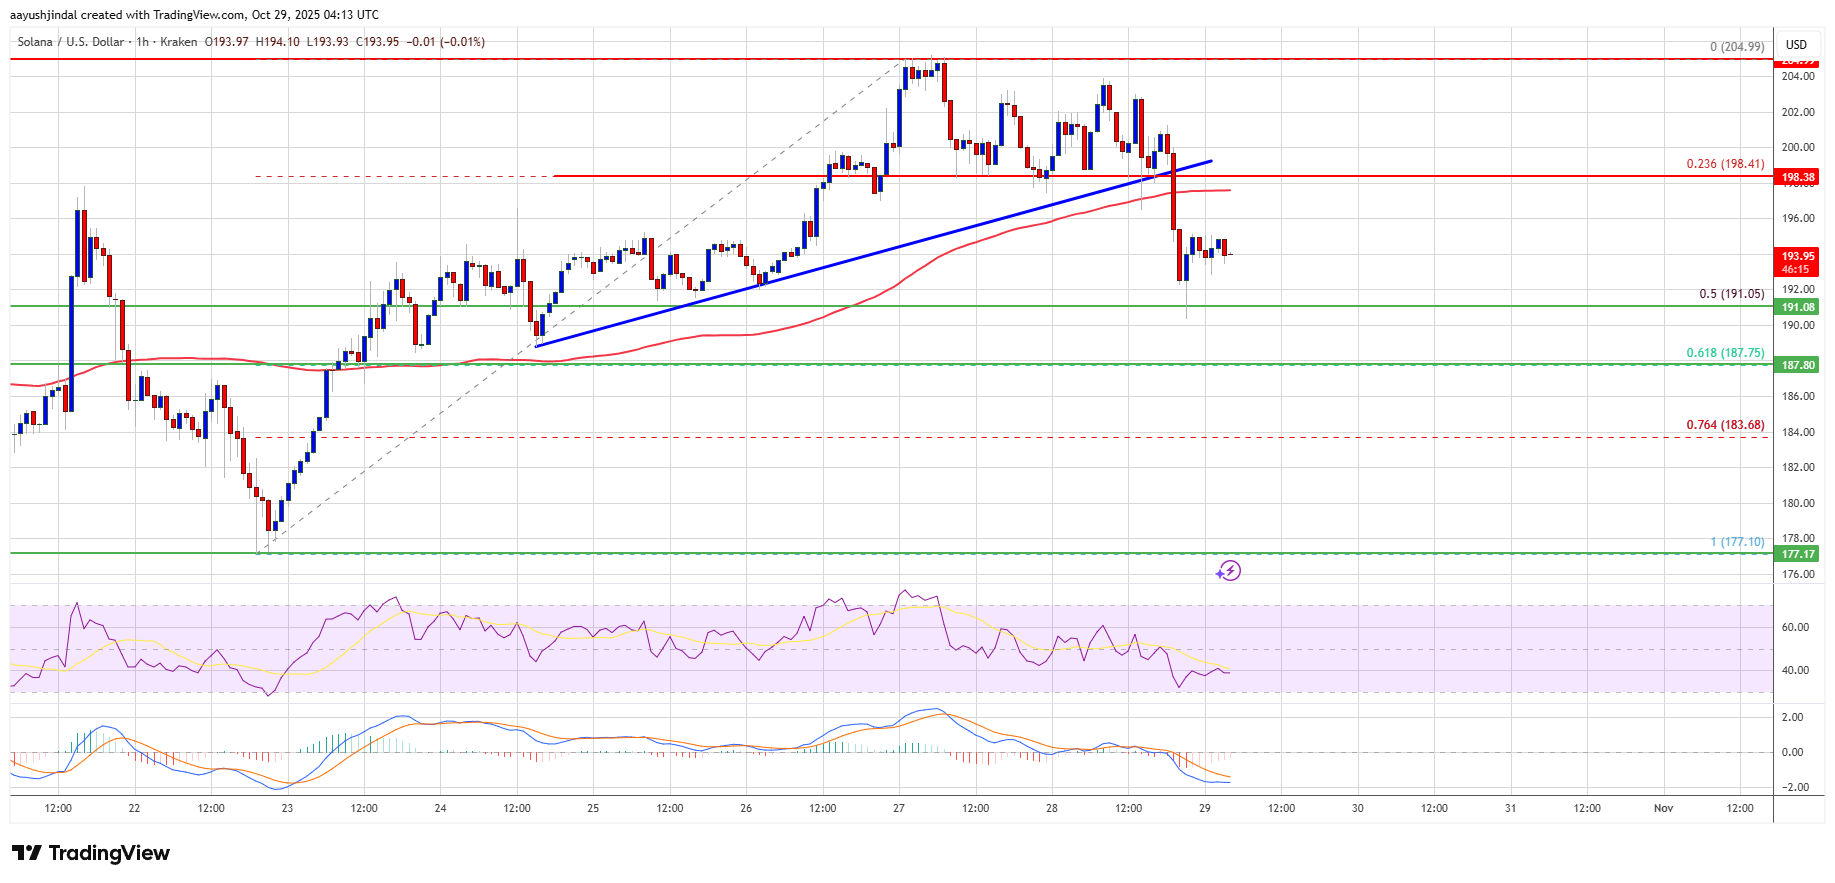
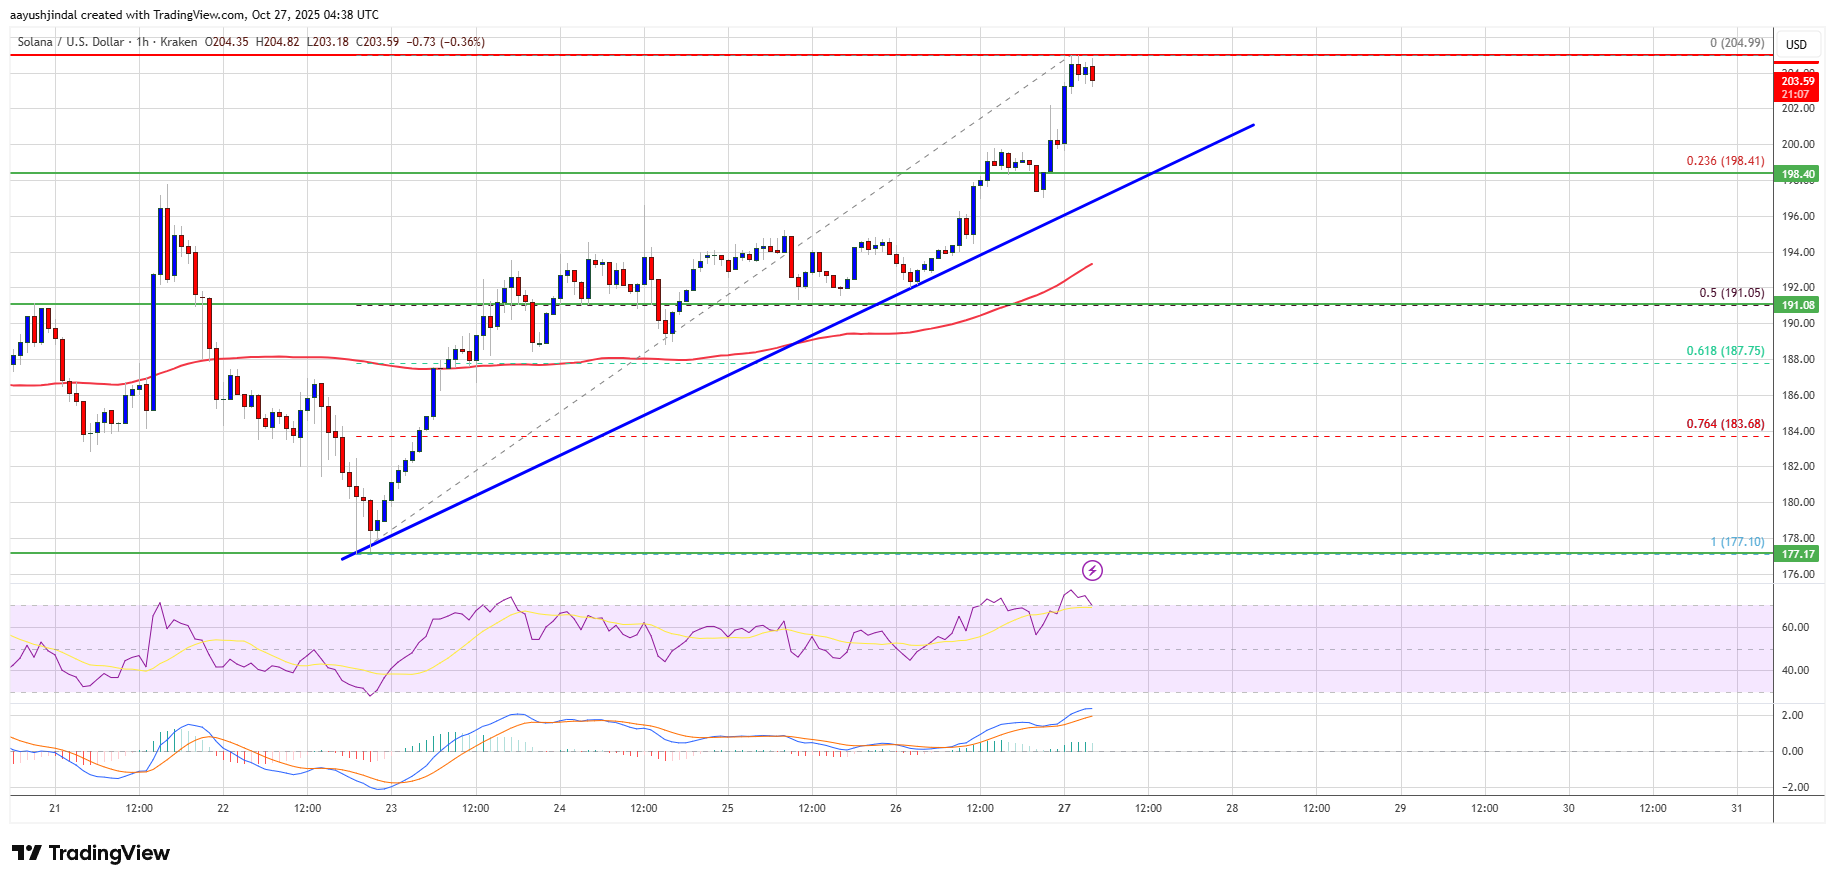
Solana failed to stay above $200 and corrected gains. SOL price is now trading below $200 and might decline further if it dips below $192.
SOL price started a downside correction below $200 against the US Dollar.
The price is now trading below $198 and the 100-hourly simple moving average.
There was a break below a bullish trend line with support at $198 on the hourly chart of the SOL/USD pair (data source from Kraken).
The pair could extend losses if it dips below the $192 zone.
Solana Price Corrects Some Gains
Solana price started a decent increase after it settled above the $192 zone, beating Bitcoin and Ethereum. SOL climbed above the $198 level to enter a short-term positive zone.
The price even smashed the $200 resistance. A high was formed near $205 and the price recently corrected some gains. There was a move below the 23.6% Fib retracement level of the upward wave from the $177 swing low to the $205 high.
Besides, there was a break below a bullish trend line with support at $198 on the hourly chart of the SOL/USD pair. Solana is now trading below $198 and the 100-hourly simple moving average.
On the upside, the price is facing resistance near the $198 level. The next major resistance is near the $200 level. The main resistance could be $205. A successful close above the $205 resistance zone could set the pace for another steady increase. The next key resistance is $212. Any more gains might send the price toward the $220 level.
More Losses In SOL?
If SOL fails to rise above the $200 resistance, it could start another decline. Initial support on the downside is near the $192 zone and the 50% Fib retracement level of the upward wave from the $177 swing low to the $205 high. The first major support is near the $188 level.
A break below the $188 level might send the price toward the $180 support zone. If there is a close below the $180 support, the price could decline toward the $166 support in the near term.
Technical Indicators
Hourly MACD – The MACD for SOL/USD is gaining pace in the bearish zone.
Hourly Hours RSI (Relative Strength Index) – The RSI for SOL/USD is below the 50 level.
Dogecoin saw a sharp jump in trading activity on Tuesday, but prices did not follow immediately. Volume over the last 24 hours rose by 60%, pushing total traded value above $2 billion, according to CoinMarketCap.
Yet the token traded near $0.21 at the time of the report, down about 0.18% in the day and down 12% so far this month.
Trading Volume Surges
According to CoinMarketCap data, the sudden spike in volume shows many more hands moving DOGE than usual. Reports have disclosed that this wave of trades coincides with renewed interest among retail buyers and larger holders.
Data shows that October has historically been a strong month for Dogecoin, with modest gains of 30% to a more impressive 101% from 2021 up to 2024. Those past returns help explain why some traders expect a positive close this month.
Whales Move, Exchanges See Flow
Reports have disclosed several large transfers tied to the surge. One report described a dormant whale with a 36 DOGE seed reactivating and making a transfer valued at $26.8 million to Binance.
Another dormant wallet reportedly moved 15.115 million DOGE, valued at about $2.95 million, out of the same exchange. These movements drew attention because big transfers can change where liquidity sits and how quickly prices move when buying or selling picks up.
Another dormant wallet reportedly moved 15 million DOGE, valued at about nearly $3 million, out of Binance. These movements drew attention because big transfers can change where liquidity sits and how quickly prices move when buying or selling picks up.
Macro Drivers And Market Sentiment
The volume surge came as major cryptocurrencies showed strength. Reports have disclosed Bitcoin moving higher toward $115,000 while Ethereum traded near $4,200.
That broader rally can lift smaller tokens as traders rotate capital across markets. Still, metrics are mixed: one recent forecast predicted DOGE could rise by 13% to $0.22 by November 27, 2025, while technical indicators flagged the current sentiment as Bearish and the Fear & Greed Index sat at 50.
Outlook And Risks Ahead
The picture is straightforward and messy at the same time. Higher volume suggests interest; price action says caution. Whale transfers can both fuel rallies and add selling pressure, depending on intent.
Traders watching the symmetrical triangle will likely wait for a clear break up or down before making bigger bets. Those looking at seasonal trends may find hope in October’s past strength, but historical gains do not guarantee future returns.
Featured image from Unsplash, chart from TradingView
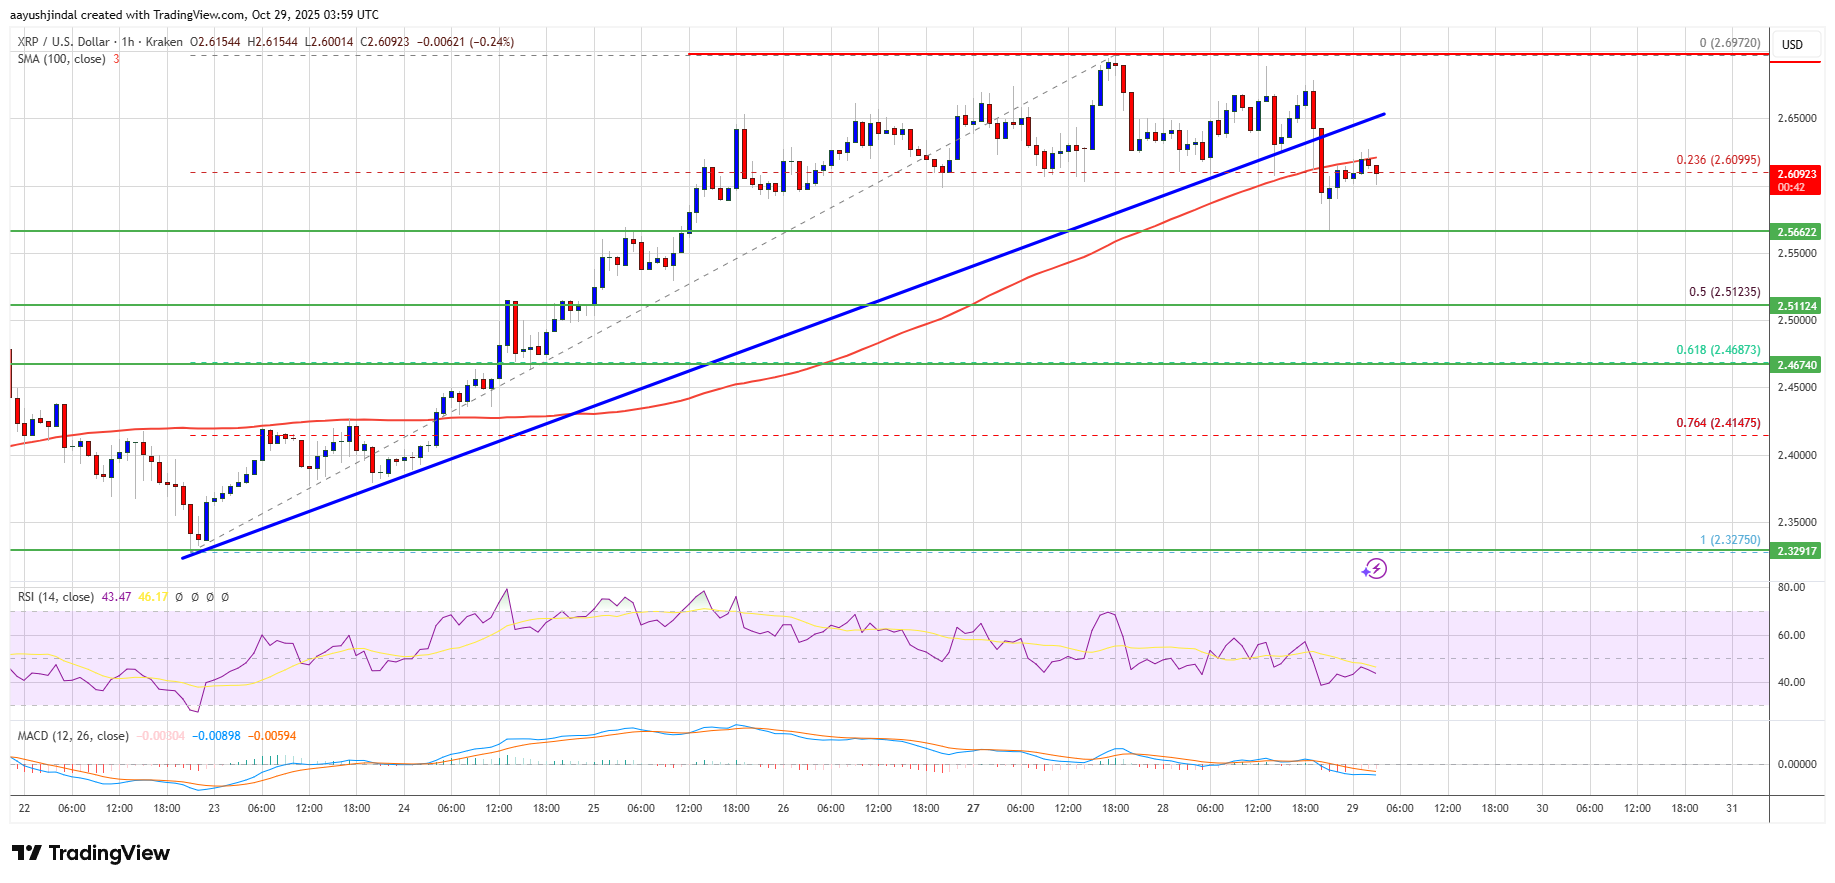
XRP price started a fresh increase above $2.550. The price is now facing hurdles above $2.650 and at risk of another decline in the near term.
XRP price gained pace for a move above $2.60 and $2.620 before the bears appeared.
The price is now trading below $2.60 and the 100-hourly Simple Moving Average.
There was a break below a bullish trend line with support at $2.6350 on the hourly chart of the XRP/USD pair (data source from Kraken).
The pair could start a fresh increase if it stays above $2.50.
XRP Price Retreats Lower
XRP price started a fresh increase after it settled above $2.50, like Bitcoin and Ethereum. The price surpassed the $2.550 and $2.60 resistance levels.
The bulls were able to push the price above $2.650. A high was formed at $2.6972 and the price recently started a downside correction. There was a move below the 23.6% Fib retracement level of the recent move from the $2.327 swing low to the $2.6972 high.
Besides, there was a break below a bullish trend line with support at $2.6350 on the hourly chart of the XRP/USD pair. The price is now trading below $2.60 and the 100-hourly Simple Moving Average.
If there is a fresh upward move, the price might face resistance near the $2.620 level. The first major resistance is near the $2.650 level, above which the price could rise and test $2.6880. A clear move above the $2.6880 resistance might send the price toward the $2.720 resistance. Any more gains might send the price toward the $2.7650 resistance. The next major hurdle for the bulls might be near $2.80.
More Losses?
If XRP fails to clear the $2.650 resistance zone, it could start a fresh decline. Initial support on the downside is near the $2.5650 level. The next major support is near the $2.550 level.
If there is a downside break and a close below the $2.550 level, the price might continue to decline toward $2.5120 or the 50% Fib retracement level of the recent move from the $2.327 swing low to the $2.6972 high. The next major support sits near the $2.450 zone, below which the price could continue lower toward $2.40.
Technical Indicators
Hourly MACD – The MACD for XRP/USD is now gaining pace in the bearish zone.
Hourly RSI (Relative Strength Index) – The RSI for XRP/USD is now below the 50 level.
Ethereum-focused treasury company ETHZilla said it has sold roughly $40 million worth of ether to fund ongoing share repurchases, a maneuver aimed at closing what it calls a “significant discount to NAV.” In a press statement on Monday, the company disclosed that since Friday, October 24, it has bought back about 600,000 common shares for approximately $12 million under a broader authorization of up to $250 million, and that it intends to continue buying while the discount persists.
ETHZilla Dumps ETH For BuyBacks
The company framed the buybacks as balance-sheet arbitrage rather than a strategic retreat from its core Ethereum exposure. “We are leveraging the strength of our balance sheet, including reducing our ETH holdings, to execute share repurchases,” chairman and CEO McAndrew Rudisill said, adding that ETH sales are being used as “cash” while common shares trade below net asset value. He argued the transactions would be immediately accretive to remaining shareholders.
ETHZilla amplified the message on X, saying it would “use its strong balance sheet to support shareholders through buybacks, reduce shares available for short borrow, [and] drive up NAV per share” and reiterating that it still holds “~$400 million of ETH” on the balance sheet and carries “no net debt.” The company also cited “recent, concentrated short selling” as a factor keeping the stock under pressure.
The market-structure logic is straightforward: when a digital-asset treasury trades below the value of its coin holdings and cash, buying back stock with “coin-cash” can, in theory, collapse the discount and lift NAV per share. But the optics are contentious inside crypto because the mechanism requires selling the underlying asset—here, ETH—to purchase equity, potentially weakening the very treasury backing that investors originally sought.
Death Spiral Incoming?
Popular crypto trader SalsaTekila (@SalsaTekila) commented on X: “This is extremely bearish, especially if it invites similar behavior. ETH treasuries are not Saylor; they haven’t shown diamond-hand will. If treasury companies start dumping the coin to buy shares, it’s a death spiral setup.”
Skeptics also zeroed in on funding choices. “I am mostly curious why the company chose to sell ETH and not use the $569m in cash they had on the balance sheet last month,” another analyst Dan Smith wrote, noting ETHZilla had just said it still holds about $400 million of ETH and thus didn’t deploy it on fresh ETH accumulation. “Why not just use cash?” The question cuts to the core of treasury signaling: using ETH as a liquidity reservoir to defend a discounted equity can be read as rational capital allocation, or as capitulation that undermines the ETH-as-reserve narrative.
Beyond the buyback, a retail-driven storyline has rapidly formed around the stock. Business Insider reported that Dimitri Semenikhin—who recently became the face of the Beyond Meat surge—has targeted ETHZilla, saying he purchased roughly 2% of the company at what he views as a 50% discount to modified NAV. He has argued that the market is misreading ETHZilla’s balance sheet because it still reflects legacy biotech results rather than the current digital-asset treasury model.
The same report cites liquid holdings on the order of 102,300 ETH and roughly $560 million in cash, translating to about $62 per share in liquid assets, and calls out a 1-for-10 reverse split on October 15 that, in his view, muddied the optics for retail. Semenikhin flagged November 13 as a potential catalyst if results show the pivot to ETH generating profits.
The company’s own messaging emphasizes the discount-to-NAV lens rather than a change in strategy. ETHZilla told investors it would keep buying while the stock trades below asset value and highlighted a goal of shrinking lendable supply to blunt short-selling pressure.
For Ethereum markets, the immediate flow effect is limited—$40 million is marginal in ETH’s daily liquidity—but the second-order risk flagged by traders is behavioral contagion. If other ETH-heavy treasuries follow the playbook, selling the underlying to buy their own stock, the flow could become pro-cyclical: coins are sold to close equity discounts, the selling pressures spot, and wider discounts reappear as equity screens rerate to the weaker mark—repeat.
That is the “death spiral” scenario skeptics warn about when the treasury asset doubles as the company’s signal of conviction.
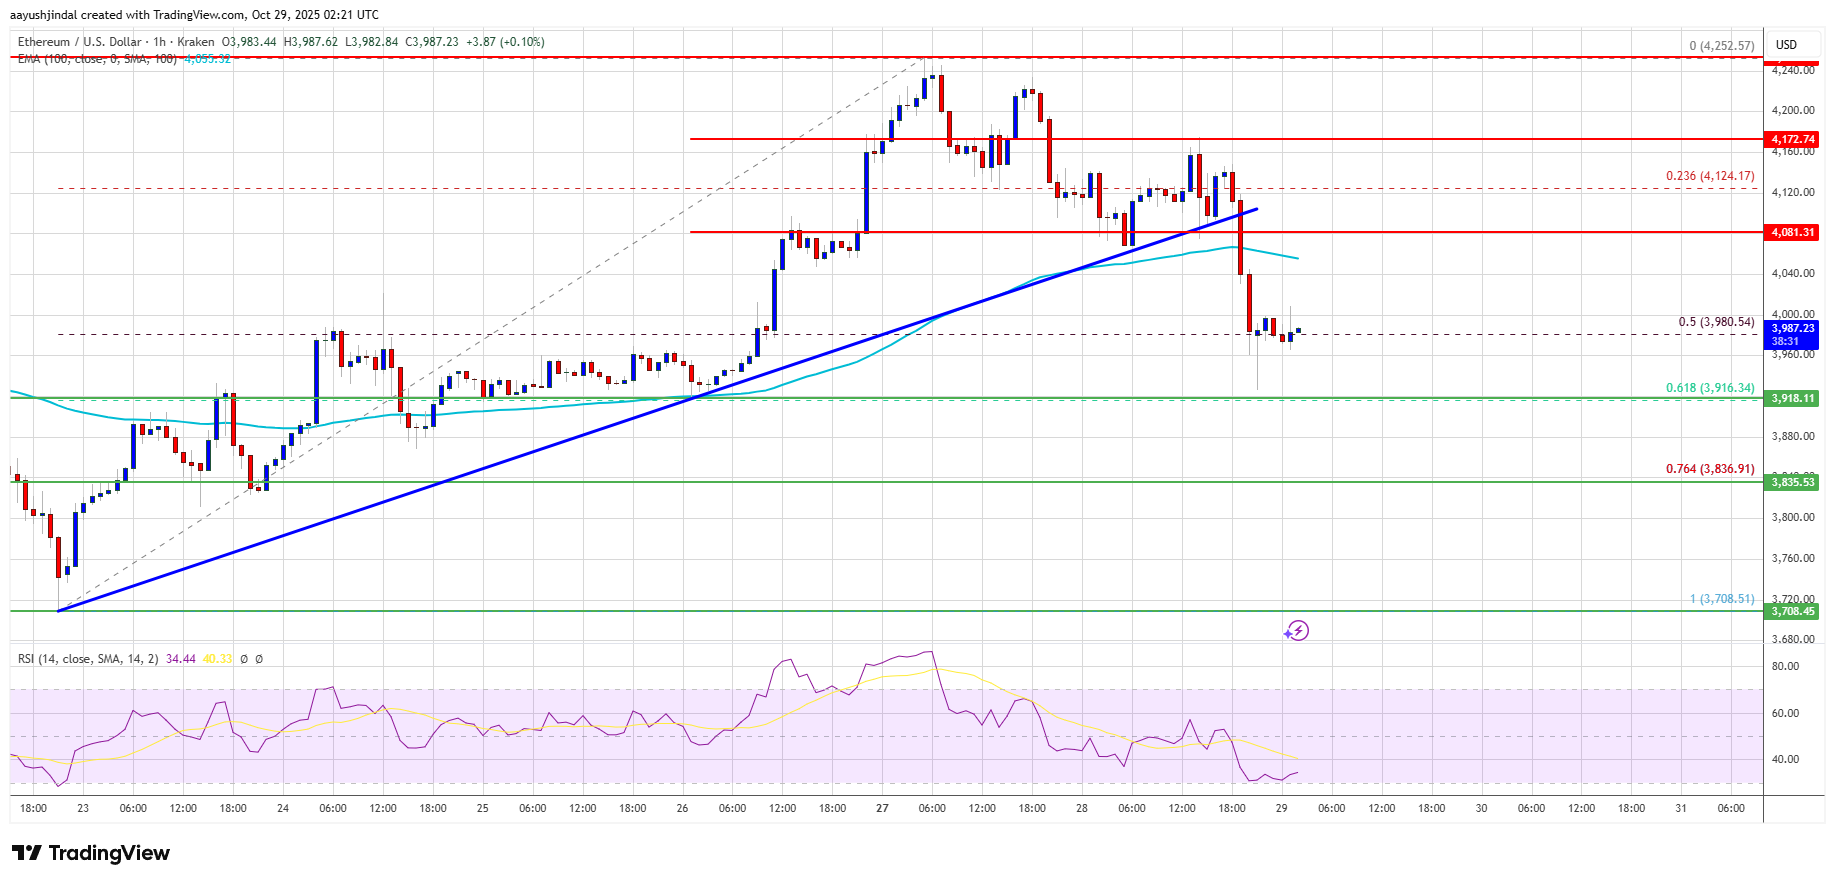
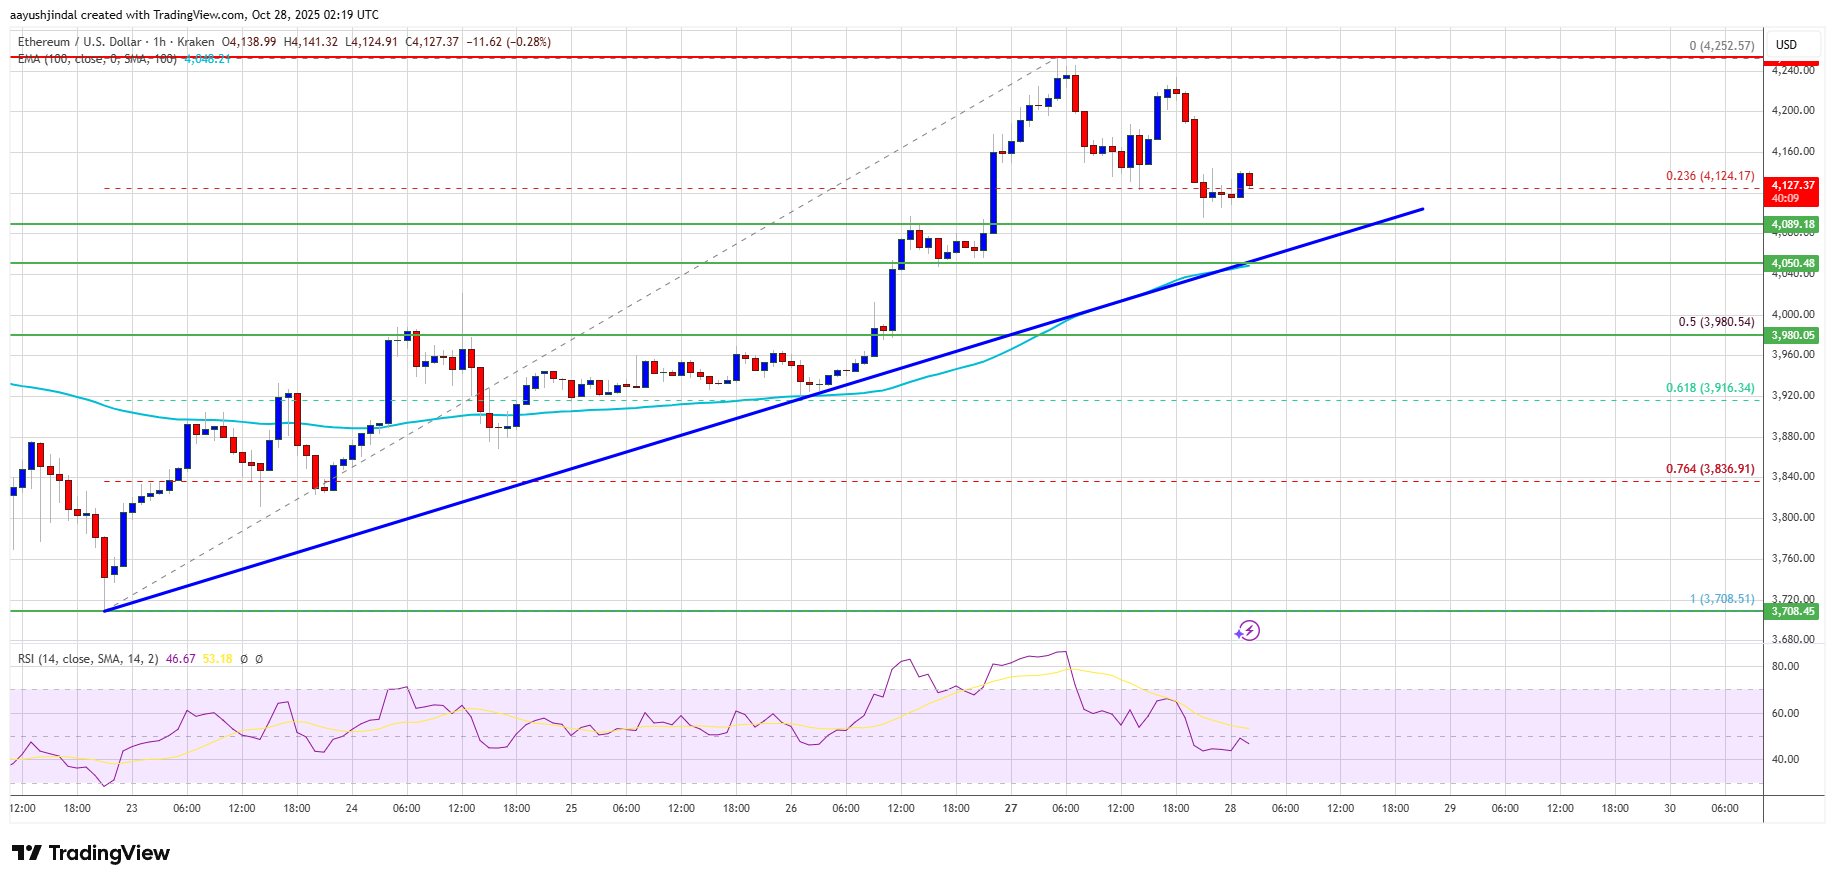
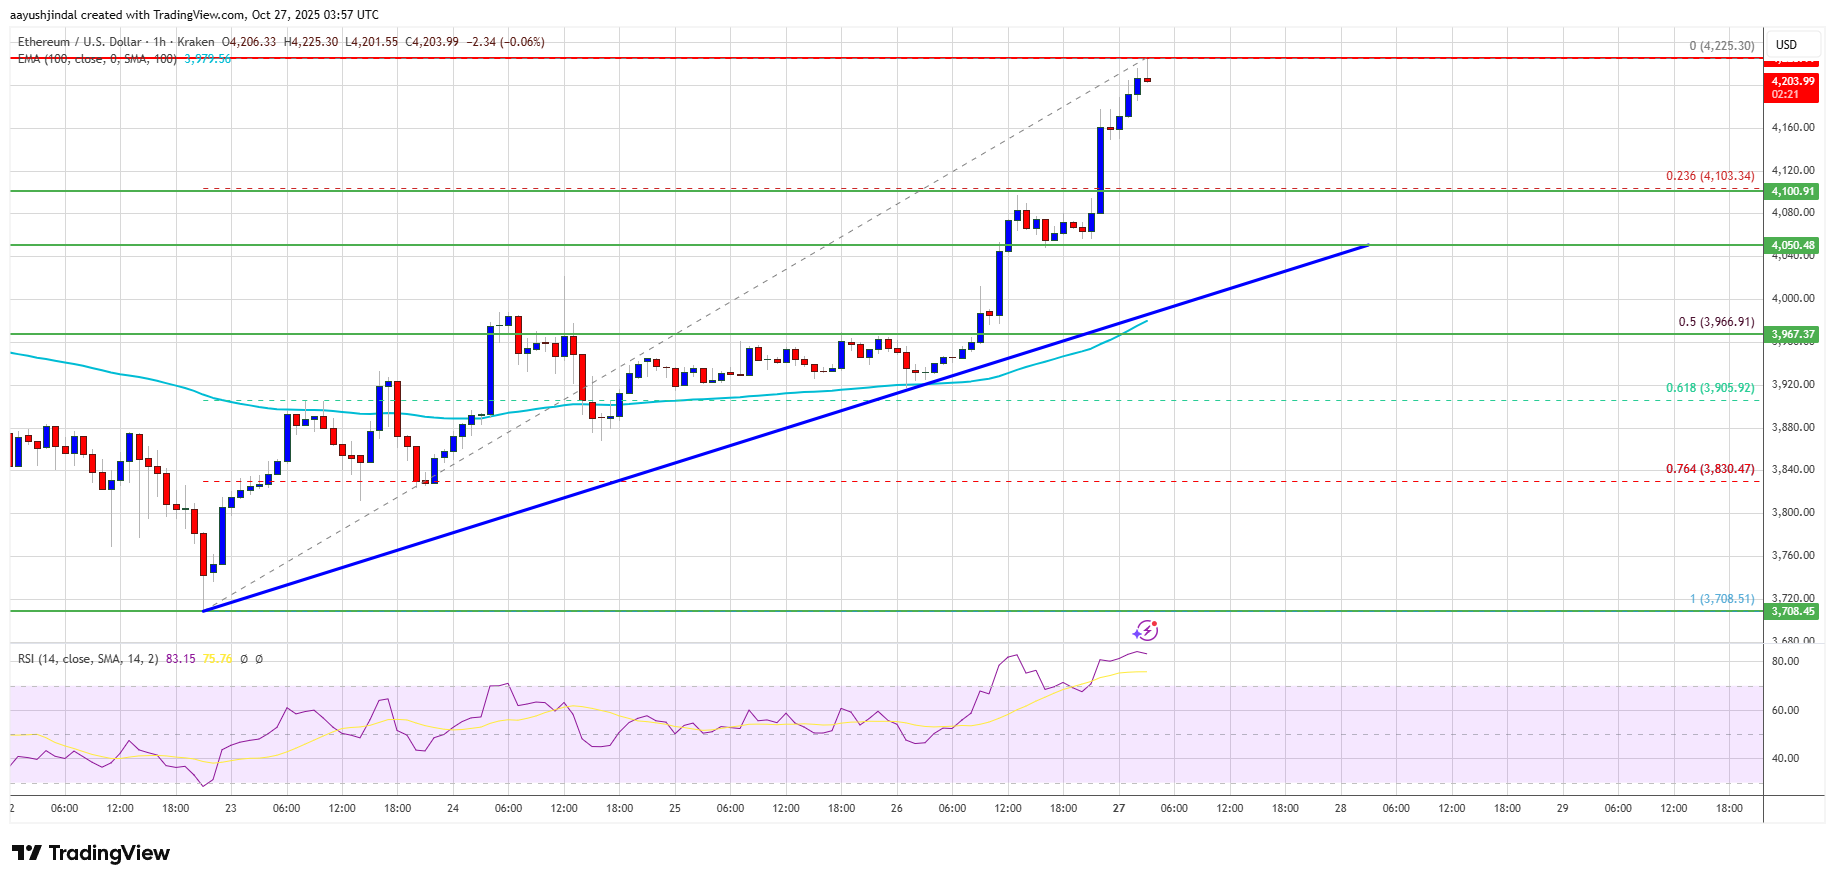
Ethereum price started a downside correction from $4,250. ETH is moving lower below $4,000 and might decline further if it trades below $3,920.
Ethereum started a downside correction below $4,150 and $4,050.
The price is trading below $4,050 and the 100-hourly Simple Moving Average.
There was a break below a bullish trend line with support at $4,100 on the hourly chart of ETH/USD (data feed via Kraken).
The pair could continue to move down if it trades below $3,920.
Ethereum Price Starts Downside Correction
Ethereum price extended gains above the $4,050 level, like Bitcoin. ETH price even surpassed $4,200 before the bears appeared. A high was formed at $4,252 and the price recently started a downside correction.
There was a move below the $4,120 and $4,050 levels. The price dipped below the 50% Fib retracement level of the recent wave from the $3,708 swing low to the $4,252 high. Moreover, there was a break below a bullish trend line with support at $4,100 on the hourly chart of ETH/USD.
Ethereum price is now trading below $4,080 and the 100-hourly Simple Moving Average. If there is another increase, the price could face resistance near the $4,040 level. The next key resistance is near the $4,080 level.
The first major resistance is near the $4,120 level. A clear move above the $4,120 resistance might send the price toward the $4,200 resistance. An upside break above the $4,200 region might call for more gains in the coming sessions. In the stated case, Ether could rise toward the $4,240 resistance zone or even $4,250 in the near term.
More Losses In ETH?
If Ethereum fails to clear the $4,080 resistance, it could start a fresh decline. Initial support on the downside is near the $3,950 level. The first major support sits near the $3,920 zone and the 61.8% Fib retracement level of the recent wave from the $3,708 swing low to the $4,252 high.
A clear move below the $3,920 support might push the price toward the $3,880 support. Any more losses might send the price toward the $3,840 region in the near term. The next key support sits at $3,780.
Technical Indicators
Hourly MACD – The MACD for ETH/USD is gaining momentum in the bearish zone.
Hourly RSI – The RSI for ETH/USD is now below the 50 zone.
XRP hovers at a key resistance, signaling a crucial decision point. With momentum building, traders now wonder, will one final dip come before the next major breakout?
XRP Faces A Crucial Decision Zone Amid Ongoing Range
CasiTrades, in a recent market update, highlighted that XRP continues to range within a critical zone, keeping its setup for a potential final wave down valid. The analyst noted that the price remains at a key decision point, with ongoing tests of the Wave 4 highs acting as a firm ceiling against further upside movement.
According to CasiTrades, the pivotal level to watch is $2.82 on Binance. A confirmed breakout and sustained hold above this resistance would invalidate the bearish setup and signal renewed bullish momentum. However, XRP has so far failed to push through, maintaining a range-bound structure between support and resistance, a sign that the market has yet to commit to a clear directional trend.
The analyst emphasized that a V-shaped recovery typically breaks through resistance with strong conviction, but such a move has not been seen here. Instead, XRP’s hesitancy indicates that selling pressure may still be present, preventing a clean continuation to the upside.
Exchange Variations Add Complexity To Market Analysis
CasiTrades went on to explain that most major exchanges are now aligning around their key Fibonacci retracement levels, particularly the 0.618 zone. On Binance, this range sits between $1.35 and $1.46, which the analyst identified as the area where the next corrective wave could complete. According to the expert, this move would finalize the macro Wave 2 correction, paving the way for a powerful Wave 3 impulse that might propel XRP toward $6.50 or even $10.
The analyst emphasized that these lower price levels shouldn’t be viewed as a cause for concern but rather as valuable accumulation opportunities for long-term investors. Historically, zones like these have marked points of strong institutional buying and major trend reversals, presenting some of the best risk-to-reward setups before a large bullish expansion.
CasiTrades also noted that exchange discrepancies add a layer of complexity to the analysis. For instance, during a recent liquidation event, Binance briefly fell to $0.77, while Coinbase never reached its .618 retracement. This variation means traders should always chart on the specific exchange they plan to execute trades on, as price reactions can differ slightly between platforms. In conclusion, the analyst noted that until XRP breaks and holds above $2.82, the market structure still supports the idea of one final downward wave before a major upward cycle begins.
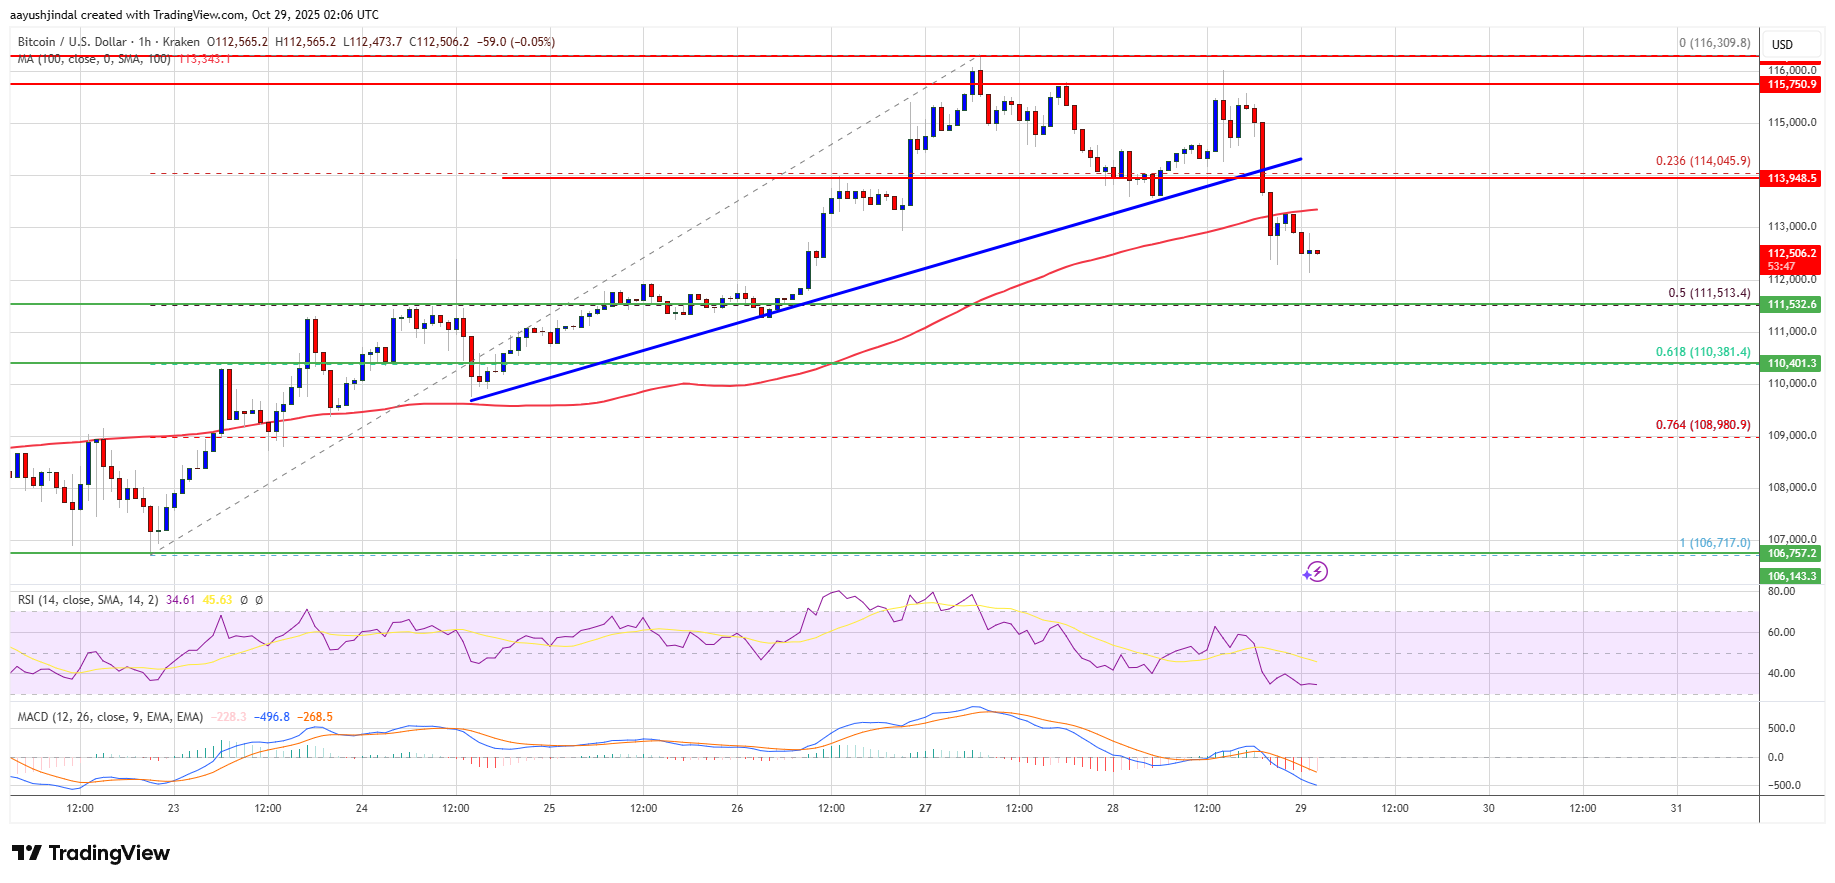
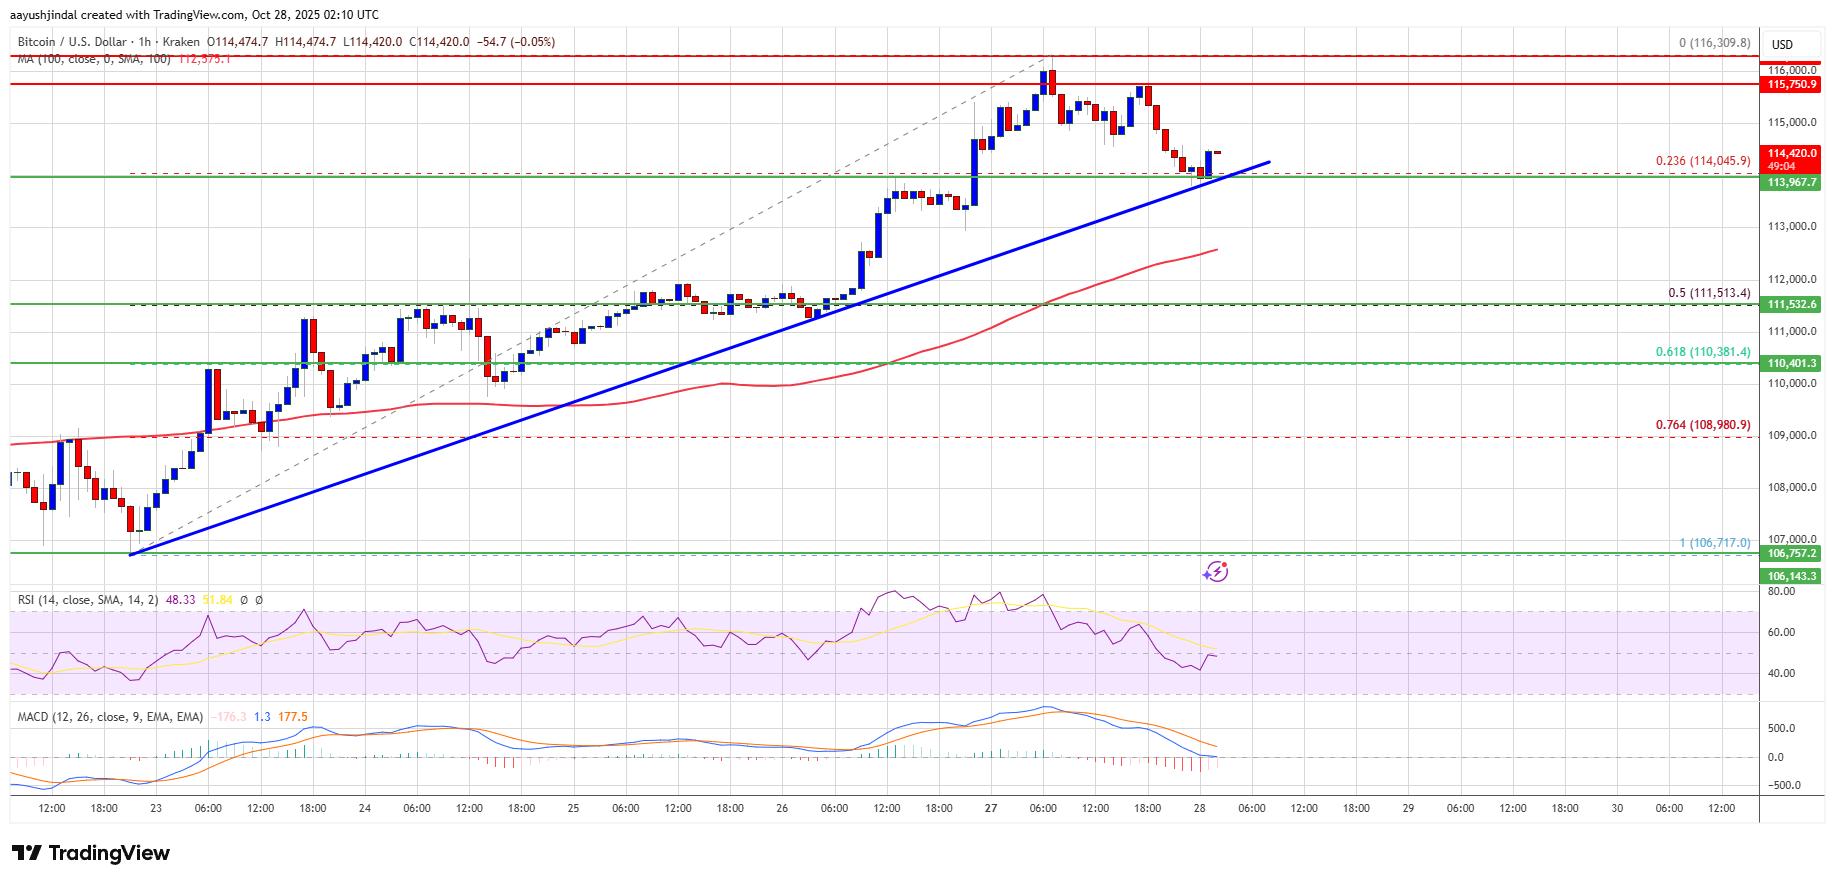
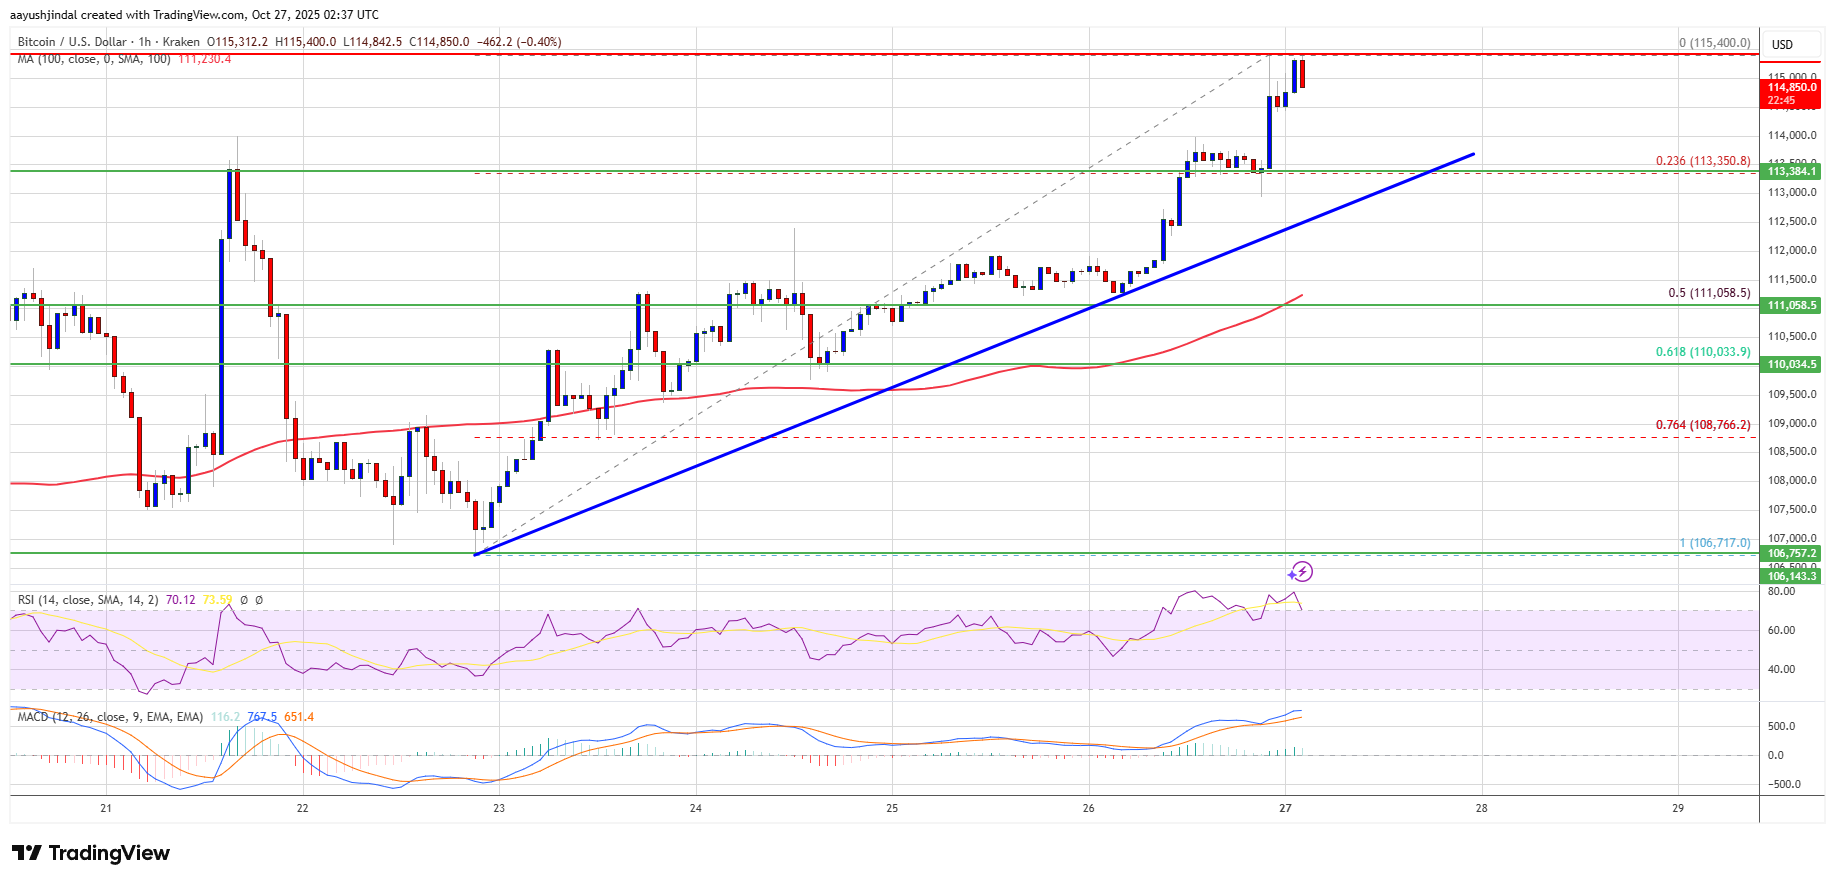
Bitcoin price is correcting gains below $113,500. BTC could continue to move down if it stays below the $114,200 resistance.
Bitcoin started a downside correction below the $114,200 support.
The price is trading below $114,000 and the 100 hourly Simple moving average.
There was a break below a bullish trend line with support at $114,050 on the hourly chart of the BTC/USD pair (data feed from Kraken).
The pair might continue to move down if it trades below the $112,000 zone.
Bitcoin Price Starts Pullback
Bitcoin price extended gains above the $113,500 zone. BTC gained pace for a move above the $115,000 pivot level. The price even spiked above $116,200 before the bears appeared.
A high was formed at $116,309 and the price is now correcting some gains. There was a move below the $114,200 support zone. The price dipped below the 23.6% Fib retracement level of the recent wave from the $106,718 swing low to the $116,309 high.
Moreover, there was a break below a bullish trend line with support at $114,050 on the hourly chart of the BTC/USD pair. Bitcoin is now trading below $114,000 and the 100 hourly Simple moving average.
Immediate resistance on the upside is near the $113,650 level. The first key resistance is near the $114,200 level. The next resistance could be $115,000. A close above the $115,000 resistance might send the price further higher. In the stated case, the price could rise and test the $116,200 resistance. Any more gains might send the price toward the $117,500 level. The next barrier for the bulls could be $118,000.
More Losses In BTC?
If Bitcoin fails to rise above the $114,200 resistance zone, it could continue to move down. Immediate support is near the $112,000 level. The first major support is near the $111,500 level or the 50% Fib retracement level of the recent wave from the $106,718 swing low to the $116,309 high.
The next support is now near the $110,500 zone. Any more losses might send the price toward the $110,000 support in the near term. The main support sits at $108,500, below which BTC might struggle to recover in the short term.
Technical indicators:
Hourly MACD – The MACD is now gaining pace in the bearish zone.
Hourly RSI (Relative Strength Index) – The RSI for BTC/USD is now below the 50 level.
Major Support Levels – $112,000, followed by $111,500.
The Dogecoin price is fighting to hold the psychological $0.20 support as large investors continue offloading holdings and leveraged traders exit the market. The Dogecoin price briefly traded above $0.21 earlier this week, but has since slipped by more than 2%, highlighting the mounting selling pressure in the market.
According to on-chain data, whales have sold over 500 million DOGE tokens in the past week, fueling fears of further downside. The selloff coincides with a sharp 61% drop in futures open interest, plunging from $5.03 billion to $1.95 billion, signaling widespread position liquidations and trader fatigue.
Futures Liquidations and Weak Technicals Weigh on Momentum
Derivatives data show declining participation across major exchanges, with traders closing out long positions rather than adding new exposure. Meanwhile, Dogecoin’s 24-hour trading volume surged 17.5% to nearly $2 billion, a sign that sellers remain in control even as overall market recovery stalls.
Technical indicators paint a similarly cautious picture. On the daily chart, the Dogecoin price is forming a potential “death cross” between the 50-day and 200-day exponential moving averages, a bearish pattern that often precedes a further drop.
If sustained selling continues, analysts warn the Dogecoin price could fall toward the $0.166 support, which aligns with the lower boundary of its long-term ascending trendline.
However, this same trendline has historically triggered strong rebounds. Previous retests have led to price recoveries of nearly 100%, leaving some traders optimistic that a similar setup could emerge if support holds firm.
Consolidation or Collapse? Key Dogecoin Price Levels to Watch
Currently, Dogecoin price hovers near $0.20 with a market cap of $30.3 billion, holding above the critical psychological zone but struggling to regain upward momentum. The immediate resistance lies between $0.204 and $0.210, while a decisive close below $0.19 could accelerate losses toward $0.18–$0.166.
For now, the balance between whale distribution and new buyer demand will determine DOGE’s next move. If fresh inflows return and futures activity stabilizes, a recovery toward $0.23–$0.25 remains possible.
But without renewed conviction from large holders, the Dogecoin price risks extended consolidation, or a deeper retracement before the next bullish wave begins.
Cover image from ChatGPT, DOGEUSD chart from Tradingview
An analyst has explained how Solana could decide its next big move after rising to $210, the resistance level of a Parallel Channel.
Solana Has Been Trading Inside A Parallel Channel Recently
In a new post on X, analyst Ali Martinez has talked about how the trajectory of Solana is looking from the perspective of a technical analysis (TA) pattern. The pattern in question is a Parallel Channel, which forms whenever an asset’s price trades between two parallel trendlines.
The upper line of the channel is considered a source of resistance, meaning that tops can be probable to appear on retests of it. Similarly, the lower level is assumed to provide support to the price, helping it to arrive at bottoms. A breakout of either of these bounds can signal a continuation of the trend in that direction. That is, a surge above the Parallel Channel can be a bullish signal, while a drop under it may lead to bearish action.
There are a few different types of Parallel Channels, depending on how the channel is oriented with respect to the graph axes. Channels that have a positive slope are known as Ascending Channels, while those that slope downward are called Descending Channels.
In the context of the current topic, the third and simplest type is the one of interest: a Parallel Channel that’s also parallel to the time-axis. This case corresponds to a phase of true sideways consolidation in the asset.
Now, here is the chart shared by Martinez that shows the Parallel Channel that the 4-hour price of Solana has been stuck inside for the last couple of weeks:
As displayed in the above graph, Solana retested the lower level of the Parallel Channel last week and successfully found support. The cryptocurrency has since been rising and nearing the resistance level, located at $210. Considering the coin’s current trajectory, the analyst has noted that its price may be heading for a retest at $210 before making its next big move. However, the direction of such a move, if one happens, remains uncertain.
Given that the $210 level corresponds to the resistance line of the Parallel Channel, it’s possible that a retest could reject Solana all the way back down to the support level around $176. It’s also possible, though, that this retest could instead lead to a breakout. In this case, SOL could naturally see a sustained bullish push. It now remains to be seen which of the two scenarios will play out for the asset if the Parallel Channel holds and a retest takes place.
SOL Price
At the time of writing, Solana is floating around $200, up over 7.5% in the last seven days.
The Solana decentralized finance (DeFi) ecosystem just gained another powerful addition with the launch of SolsticeFi. This innovative new platform is poised to introduce a much-needed layer of risk-controlled yield generation, directly addressing one of the primary concerns for users venturing into the safety of their deposited capital.
SolsticeFi is reimagining how investors earn on Solana by introducing a defensively engineered approach to yield, one that directly protects the value of user deposits. According to crypto commentator Madissa’s post on X, one of SolsticeFi’s most compelling features is its ability to allow users to continue earning staking rewards while keeping their assets liquid and usable across the broader DeFi ecosystem.
How SolsticeFi Balances Risk While Generating Yield
This innovation created continuous opportunities for user to deploy their capital in other protocols without interrupting their base yield, instead of locking up funds. SolsticeFi platform is designed to prioritize full transparency and validator diversification, minimizing exposure to single-validator risks and opaque yield platforms. Furthermore, depositing capital into SolsticeFi provides support for SOL’s network security while generating sustainable returns for users.
Crypto analyst Hokage has also mentioned how Solana is improving and completely revolutionizing financial transaction speeds in traditional finance (TraFi), where transfers take days, settlements drag, and middlemen slow everything down.
SOL has changed the game by creating a new block every 400 milliseconds, and currently, the central to this acceleration is Bam, the new block assembly marketplace. This Bam will speed up how quickly user transaction gets picked up and integrated into a block, and slash inclusion times to an astonishing 50-100 milliseconds. Building on this is Alpenglow, which takes finality down to an incredible 100-150 milliseconds faster than a blink, and the point where the network confirms the user transaction is 100% done and irreversible.
One project that stands out in these ultra-fast ecosystem steps is SolsticeFi’s USX, a stablecoin specifically built to move at that speed, which enables users to send dollars, deploy capital, and settle instantly. Hokage concluded that “while these advancements might sound like pure sci-fi, if you’ve been around the SOL ecosystem, you would know it’s not.”
Market Confidence Returns To Solana
While SolsticeFi provides speed and reduces risk to Solana yield platforms, KOLS Manager at Binance, investor, and trader BitGuru, has noted that SOL’s price is currently showing a strong bullish setup, after following a steady downtrend and now stabilizing near key support.
As a result of that action, the SOL market is now pulling back with considerable strength, aiming to break above the critical $210 resistance level, a zone that has capped multiple attempts at recovery. A decisive breakout above $210 would likely trigger SOL’s next leg higher toward $230 and beyond.
The Cardano (ADA) price is flying under the radar amid growing accumulation by large-holders (“whales”) and a technical formation that traders seldom ignore, a symmetrical triangle.
With ADA currently trading around $0.66, after briefly reaching $0.69 earlier in the week, the stage appears set for a breakout, or a breakdown. Analysts suggest that if the bullish scenario prevails, ADA could target $1 and beyond, potentially even reaching $5 or more in a longer-term move.
Whale Accumulation Signals Long-Term Confidence
Despite short-term price softness, on-chain data reveal that wallets holding large quantities of ADA are steadily increasing their positions.
According to recent reports, wallets with 100,000 ADA tokens have been accumulating over the past six weeks, even while retail demand remains lukewarm. This accumulation is taking place as ADA forms a low-volatility consolidation, such behaviour often precedes major market moves.
The divergence is noteworthy. While Open Interest and spot cumulative volume delta (CVD) remain weak, signaling limited retail/speculator engagement, whales are quietly buying the dips.
Enthusiasm among large-holders suggests confidence in ADA’s fundamentals and plays into the bullish thesis that this accumulation could underpin a powerful move once the technical breakout triggers.
Symmetrical Triangle Breakout Offers Route to Major Upside
Technical analysts highlight that ADA has been trading within a symmetrical triangle pattern, a convergence of support and resistance trendlines, typically signalling a buildup of tension before a decisive move.
The crucial support near $0.61 and resistance roughly at $0.70–$0.75 mark the boundaries of this formation. A decisive breakout above the upper trendline could unlock a rally toward $0.80–$0.85, and potentially beyond $1.70 per some projections.
Conversely, a breakdown below the support would invalidate the bullish setup and could see ADA revisit $0.55 or lower. Given the whale accumulation underway, the bullish scenario currently seems favoured, but traders must still watch for confirmation.
Bottom Line
The question now gaining traction is: could ADA eventually hit $5? While the immediate target may be around $1 to $2, some longer-term models based on Fibonacci extensions and structural breakout maths place significantly higher levels on the table.
If ADA converts supply zones into support and elevates its on-chain narrative, the powerful combination of whale positioning + breakout could carry it much higher.
Cover image from ChatGPT, ADAUSD chart from Tradingview
Bitcoin is showing early signs of strength as it attempts to reclaim the $115,000 level. After weeks of mixed sentiment and heavy selling pressure, momentum appears to be turning slightly bullish. The recent weekly close above $114,500 has confirmed a reclaim of the Short-Term Holder (STH) Realized Price, a key on-chain threshold currently sitting near $113,000. This metric represents the average cost basis of recent market participants and often serves as a pivotal line separating bullish from bearish sentiment.
Top analyst Darkfost shared that this reclaim is an encouraging signal, reflecting renewed buyer confidence after a volatile October. However, he also cautioned that Bitcoin’s position must still be monitored closely. A rejection at current levels could lead to a renewed correction phase, mirroring the pattern seen in 2024, when BTC faced multiple failed attempts before regaining upward momentum.
For now, the market sits at a delicate crossroads — consolidating below resistance while holding critical on-chain support. If Bitcoin can sustain this structure and push convincingly above $115K, analysts believe it could open the door for a broader bullish continuation and potentially a retest of the $120K region in the weeks ahead.
Bitcoin Holds Above Key On-Chain Level
According to top analyst Darkfost, Bitcoin’s reclaim of the Short-Term Holder (STH) Realized Price around $113,000 could mark a crucial turning point for market structure. He notes that during the 2024 correction, BTC faced four failed attempts to break above this same metric. Each rejection was driven by short-term holders selling at their break-even points — a typical psychological reaction that delays trend reversals. Once Bitcoin finally sustained above the STH Realized Price, however, the market quickly regained momentum and entered a new expansion phase.
This time, the dynamic appears similar. If Bitcoin successfully consolidates above this zone, it could pave the way for a strong bullish impulse and potentially a new all-time high (ATH) in the short term. The STH Realized Price acts as a measure of conviction among recent investors; holding above it suggests growing confidence and a shift from capitulation to accumulation.
Darkfost also highlights another critical observation: throughout the current bull cycle, Bitcoin has never fallen below the yearly STH Realized Price. Each time the price neared that level, a rebound followed — reaffirming it as a structural support for the broader trend.
Still, caution remains essential. A breakdown below the $94,000 mark — the current yearly STH Realized Price — would likely signal a deeper market shift. Such a move could mark the transition from a mid-cycle correction into a more prolonged bearish phase.
For now, the data suggests resilience, not weakness. As long as BTC remains above its short-term realized threshold, the broader uptrend remains intact — with potential for the next major rally if buying pressure continues to build above $115K.
BTC Bulls Defend Key Support While Momentum Cools
Bitcoin is currently trading around $114,360, consolidating after a brief rally that tested resistance near $115,800–$117,500. The chart shows that BTC successfully reclaimed the 200-period moving average (red line) on the 4-hour timeframe, a level that had acted as resistance throughout mid-October. This reclaim is an encouraging short-term signal, but momentum appears to be slowing as traders await the next catalyst.
The $113,000–$114,000 range now serves as immediate support — aligning with the Short-Term Holder (STH) Realized Price, a key on-chain level that reflects the cost basis of recent buyers. Holding this zone could allow bulls to consolidate strength before another attempt at breaking above $117,500, the main horizontal resistance that capped previous rallies.
On the downside, failure to maintain above the 200-MA could trigger a retest of $111,000, where the 100-MA (green line) provides secondary support. Trading volume remains subdued, reflecting investor caution ahead of the Federal Reserve’s interest rate decision later this week.
Bitcoin remains in a constructive phase as long as it holds above $113K. Sustained consolidation above this level would reinforce bullish structure — while a decisive break above $117,500 could open the path toward $120,000+ in the short term.
Featured image from ChatGPT, chart from TradingView.com
Dogecoin (DOGE) is facing a steep market cooldown after weeks of heightened trading activity in early October. Data from CoinGlass shows that both Open Interest (OI) and trading volume for DOGE futures have crashed, indicating a sharp decline in the meme coin’s momentum. The latest figures reveal a significant pullback in derivatives activity and spot market participation, suggesting that traders may be retreating from speculative positions as volatility eases.
Dogecoin Open Interest Crashes Over 60%
Dogecoin’s Open Interest has plunged dramatically from its October highs, reflecting a rapid exodus of leveraged traders from the market. According to CoinGlass, total exchange DOGE futures Open Interest has fallen over 62% from a peak of $5.03 billion on October 7 to $1.88 billion on October 28. This represents a drop to approximately 9.41 billion DOGE, valued at $ 0.20 per token.
Despite the decline in Open Interest, Binance, BitMEX, and Bybit continue to lead as the top exchanges with the highest Dogecoin futures activity. Still, the downturn has been widespread across exchanges. Kucoin recorded the largest drop in recent hours at 3.1%, followed closely by Bitget, which saw a 2.27% decline. Over the last 24 hours, Bitunix recorded the steepest drop in Open Interest, down 15.86%, while Crypto.com saw a 7.36% reduction.
Even Binance, which consistently leads Dogecoin futures trading, has seen a notable pullback. CoinGlass reports that the exchange’s Open Interest peaked at $964.7 million on October 7, marking a monthly high. Since then, it has fallen to $380.29 million (1.9 billion DOGE), representing a staggering 60.6% crash in just over three weeks.
Dogecoin Sees Even Worse Decline In Volume
Trading volume for Dogecoin has mirrored the collapse in Open Interest. CoinGlass data shows that Dogecoin’s futures volume heatmap across major crypto exchanges is in the red zone. Total trading volume had spiked to $20.45 billion on October 11, following the devastating crypto flash crash on October 10, but has since plummeted to $5.31 billion as of October 28. This represents a whopping 74% decline.
On individual exchanges, Binance’s DOGE trading volume dropped by 9.35% in the past 24 hours, while OKX saw a 13.69% decline. CoinEx recorded the largest volume decrease at 26.1%, followed by Gate.io at 23.94%. Popular exchanges like Bitget, Kucoin, and Bitunix also reported varying declines of 4.96%, 20.37% and 13.16%, respectively, as overall market liquidity thinned.
However, a few exchanges bucked the downward trend, recording slight gains. dYdX saw its DOGE volume surge by 167.61%, HTX increased by 49.93%, and Hyperliquid rose by 23.88%. Bybit and MEXC also recorded modest gains of 24.98% and 1.88%, respectively.
Alongside its decline in trading volume, CoinGlass notes that Dogecoin’s price performance has slipped. The meme coin is currently trading at $0.20, down 13.19% over the past 30 days and 2.86% in the last 24 hours.
The XRP price recently saw a sharp drop that was very scary for many traders, and some in the crypto market think the chart looks weak now. However, an analyst on X, Cryptoinsightuk, disagrees. The analyst explains that XRP is not bearish right now, even after the 50% flash crash, and the price can still move higher when liquidity returns.
Low Downside Liquidity And Weekly Chart Still Looks Fine For The XRP Price
Cryptoinsightuk says that XRP has “no downside liquidity.” The analyst explains that sellers are not strong, so there is very little liquidity sitting below the current price level. It does not mean the XRP price will stay still, although it may move up and down for now. At some point, exchanges and market makers may push the price higher into deeper liquidity, where they can make money.
The analyst says that the flash crash does not damage the weekly chart. The weekly picture still shows a normal trend even after the sharp fall. He notes that online discussions are focusing on the monthly chart and using it to claim that XRP is weak, but the monthly chart alone is only one timeframe and not enough to call the price truly bearish. The slight drop shows weakness only on lower timeframes, not in the broader market structure, and Cryptoinsightuk believes the bigger structure is still pointing up, which is a key reason he does not see a bearish trend forming even after the 50% flash crash.
The analyst’s comment about market makers also gives hope to traders who worry that the XRP price will keep falling. When market makers see better opportunities at higher price levels, the price often moves up to where they want to make profits. It gives XRP a path to recovery later, rather than staying low. He keeps pointing to the weekly chart because it shows that XRP still holds its larger bullish setup even after the fear caused by the flash crash.
Higher Timeframes Look Strong, And RSI Fractal Points To A Move Up
Cryptoinsightuk further adds that higher timeframes are always more reliable for reading price trends and recommends looking at the XRP price chart over the past three months. In his view, the three-month chart looks good and supports a strong long-term trend.
He also looks at the daily RSI, and it recently hit an oversold area. When this happened the last time, the XRP price later saw a strong move up. The analyst shared a fractal a few weeks ago that shows what a new “measured move” could look like if this same pattern repeats.
The fractal suggests the XRP price could rise again from here. The oversold RSI signal suggests that buyers could return and push the price higher in the future.
Uniswap (UNI) has been consolidating since the October 10 market crash, with price action stabilizing but volatility still lingering. The decentralized exchange (DEX) token has struggled to regain its previous momentum, reflecting the broader uncertainty across the altcoin market. Analysts remain divided on its short-term outlook — some view Uniswap as a key driver of Ethereum’s DeFi ecosystem and a potential leader in the next recovery phase, while others caution that lingering liquidity stress and waning trader activity could spark more turbulence ahead.
Despite this cautious backdrop, new on-chain data suggests a shift may be underway. According to CryptoQuant insights, Binance whales have become increasingly active on UNI, with large transactions and outflows spiking to multi-month highs. Historically, this type of whale behavior — especially when coupled with heavy exchange outflows — has been associated with accumulation phases and strategic repositioning by major players.
As Uniswap’s fundamentals remain solid, with trading volumes and user engagement steadily recovering, the renewed whale activity could indicate that smart money is quietly preparing for the next market leg. Whether this accumulation marks the early stages of a trend reversal or just a temporary pause before further volatility remains to be seen.
Uniswap Exchange Outflows Hit Multi-Month Highs
In recent days, Uniswap’s native token, UNI, has seen a notable uptick in large-scale activity, signaling renewed interest from major market participants. According to on-chain data from CryptoQuant, whale wallets — typically identified by the top 10 largest transactions — have begun moving significant amounts of UNI out of Binance. These outflows represent transfers from exchange wallets to external addresses, a behavior that often indicates accumulation or long-term repositioning by large holders rather than short-term trading.
The data highlights a daily peak of 17,400 UNI withdrawn from Binance, alongside a monthly peak of 5,250 UNI, marking a three-month high in whale activity. Historically, such outflow spikes tend to occur during accumulation phases, as whales seek to reduce exposure to centralized exchanges and secure tokens for longer-term holding or staking opportunities.
This renewed movement comes at a time when UNI is still digesting the market correction that began in July, with prices stabilizing but failing to regain strong upward momentum. Analysts interpret this surge in whale activity as a potential early indicator of confidence returning to the asset. If sustained, it could mark the beginning of a structural reversal — a shift from post-crash consolidation to the early stages of renewed accumulation and recovery.
UNI Price Analysis: Consolidation Persists as Whales Reenter the Market
Uniswap (UNI) continues to consolidate near the $6.50 level after a sharp correction that began in July 2025. The weekly chart shows a prolonged period of sideways movement following a breakdown from the $12 resistance zone, where bullish momentum previously failed to sustain. Despite multiple attempts to rebound, UNI remains below the 50-week and 200-week moving averages, both of which now act as dynamic resistance levels.
The recent price action reflects investor hesitation, with the broader market still digesting the effects of the October 10 crash. However, volume analysis indicates that selling pressure has started to decline, suggesting that sellers may be exhausting and that accumulation could be forming at current levels.
From a technical perspective, the $6.00–$6.20 zone serves as immediate support, while a decisive reclaim above $8.00 would be required to shift market structure toward a potential mid-term recovery. Interestingly, the recent whale accumulation reported by on-chain data aligns with this stabilization phase — a pattern often seen near cyclical bottoms.
If Uniswap maintains support and market sentiment improves, UNI could attempt to retest the $10–$12 zone in the coming months. Conversely, a failure to hold above $6 could open the door for a retest of the 2024 range lows around $4.
Featured image from ChatGPT, chart from TradingView.com
A recent debate on the social media platform X has drawn attention to XRP’s long-term price outlook after an XRP enthusiast, Crypto Bitlord, proposed a rather wild scenario where the cryptocurrency teleports to $500 instantly. His post, which imagined XRP being used by the US government to pay off its $35 trillion debt, caused some reactions across the XRP community.
In response, well-known crypto analyst ChartNerd stepped in to temper expectations, explaining that while XRP’s future is bright, such a leap to $500 is far from realistic this market cycle.
ChartNerd’s Take On Realistic XRP Targets
ChartNerd’s comments immediately stood out for their grounded tone, especially amongst reactions filled with predictions of explosive, instant gains. Responding directly to Bitlord’s vision of XRP rocketing to $500, ChartNerd clarified that XRP’s price will not trade at that price target this cycle. “$XRP will not teleport to $500,” he said.
Instead of a three-digit price, the analyst noted that the XRP price can only realistically reach the double-digit threshold in this cycle. “Realistically, it could definitely teleport to $13-$27 this cycle,” he continued.
This double-digit price target, although very bullish compared to XRP’s current price action, pales in comparison to other bullish projections from other crypto analysts, with many anticipating triple-digit price targets and others even predicting a run to $1,000 and beyond.
As conversations around potential XRP ETFs continue to gain momentum, one commenter asked ChartNerd whether his projections accounted for the billions in possible ETF inflows and the tokens expected to be locked in treasury funds and liquidity pools over the next few months.
His response showed that his analysis was not detached from these developments. ChartNerd explained that even if XRP captured half of Bitcoin’s ETF trading volume from the past two years, the result would still translate to a market capitalization of roughly $1.2 trillion, bringing the price closer to his $27 upper target rather than $500.
Most ultra-bullish XRP price predictions are contingent on the cryptocurrency gaining adoption among banks and players in traditional finance. However, adoption models grow over years, not weeks, with ChartNerd adding that “these developments take time, and triple digits are not possible until many a year down the line.”
Staying Grounded Amid Bold Predictions
Another user remarked that Bitcoin once faced similar disbelief before breaching $100,000, meaning that XRP could surprise skeptics in the same way. ChartNerd, however, maintained his cautious stance with the response, “Highly unlikely imo, we shall see. I’ll stick to double digits.”
Such comparisons overlook the fundamental differences between Bitcoin’s and XRP’s market dynamics, especially when it comes to their circulating supplies.
At the time of writing, XRP is trading at $2.66, a 1% increase in the past 24 hours and a 9.2% rise over the last seven days. To reach the hypothetical $500 level, XRP would need to surge by roughly 18,690% from its current price. By contrast, hitting $13 or $27 would represent gains of approximately 388% and 915%, respectively.
The recent Dogecoin market action has seen its price now hovering below $0.20 after surging to $0.208 in the past 24 hours. Despite the consolidation, analysts and traders are watching the meme coin closely, believing that the next major move could redefine its long-term trajectory.
Among those voices is crypto analyst EtherNasyonaL, who predicted that Dogecoin’s third and most powerful bullish phase is still ahead. His technical analysis on the monthly chart presents a structure that reveals the groundwork for another massive uptrend to above $0.8 is already in motion.
Dogecoin’s First Two Bull Waves Set The Stage
The monthly candlestick price chart shared by EtherNasyonaL calls attention to Dogecoin’s cyclical nature since 2014, showing two completed bull waves and a third one forming. Each of these bullish waves was formed after Dogecoin broke above and then retested the upper trendline of a descending channel of lower highs that had confined its price action in the preceding years. This retest was also highlighted by a confluence of the 25 Moving Average (MA) indicator.
The first wave, which began in 2017, caused Dogecoin’s earliest exponential rise from near-zero levels, right when the meme coin entered into popular crypto discussions. The second, and far more explosive, bull wave occurred between 2020 and 2021, when Dogecoin surged from under $0.003 to an all-time high of $0.7316, which has stood until now.
Each bull run started once Dogecoin reclaimed its 25-month moving average as support, following extended consolidation periods that spanned multiple months. The current setup reflects the same condition, as the 25MA line has once again turned upward, and Dogecoin has successfully retested the upper trendline of its previous descending channel, as shown in the chart below.
The analysis reveals that Dogecoin has recently broken free from a long-term downtrend that spanned between mid-2021 and early 2025. Notably, recent crypto market liquidation events in October have seen the Dogecoin price complete a successful retest of the resistance level, now turned support, around the $0.17 to $0.20 price range.
This successful retest also coincides with a simultaneous bounce off the bottom trendline of an ascending channel. EtherNasyonaL describes the current price action as Dogecoin “accumulating strength in the lower band of a years-long ascending channel.”
The projected trajectory on the chart above shows Dogecoin following its established pattern by moving from the lower region of the ascending channel to its upper boundary. If the third bull wave plays out as the previous two did, Dogecoin’s price could challenge its $0.73 all-time high and break into new price territories. The first price target in this case is the $0.8 mark, and then as high as $4 in the long term.
A widely shared seasonality snapshot is making the rounds ahead of month-end: a Coinglass heat map of Bitcoin’s monthly returns, reposted by trader Daan Crypto Trades. The table spans 2013–2025 and shows November as the statistical outlier in Bitcoin’s calendar—both for eye-popping gains and for sharp drawdowns in certain years.
Bitcoin November Preview
“November is Bitcoin’s best month based on historical performance. By far,” Daan wrote on X, pointing to an average November change of +46.02% across the dataset. That figure is visibly distorted by November 2013’s +449.35% surge, the single largest monthly move on the board. He added: “The average gain over all these months is +46.02%. But this is heavily skewed by a single monthly gain in November 2013. Bitcoin went up +449.35%!! that month.”
The raw counts back up the reputation without the hyperbole. Out of the 12 Novembers listed (2013–2024), 8 finished green—2013 (+449.35%), 2014 (+12.82%), 2015 (+19.27%), 2016 (+5.42%), 2017 (+53.48%), 2020 (+42.95%), 2023 (+8.81%), and 2024 (+37.29%)—while 4 were negative—2018 (-36.57%), 2019 (-17.27%), 2021 (-7.11%), and 2022 (-16.23%).
The median November change sits at +10.82%, a more conservative central tendency that dampens the 2013 effect. Excluding 2013 entirely, the simple average for November drops to roughly +9.35% across the remaining 11 years, underscoring how one month can skew mean-based seasonality.
Context from the broader table matters. November’s average is the highest of any month on Coinglass’s grid, ahead of October’s +20.30% average, while December shows a far more mixed profile with a +4.75% average but a -3.22% median—an imbalance consistent with outlier-driven months.
September, long maligned by traders, retains a negative average (-3.08%) over the full period. The 2024 row itself captures the push-and-pull of this cycle’s narrative: double-digit gains in February, March, May, October, and November, offset by meaningful drawdowns in April, June, and August, and a negative December print to close the year (-2.85%).
Lessons From Prior Cycles
Daan’s framing extends beyond simple seasonality. “November & December is when the 2013, 2017 & 2021 cycles topped out. It’s also where the 2018 & 2022 cycles bottomed out,” he noted. That observation lines up with the historical inflection points most market participants remember: the late-2013 mania and subsequent crash, the December 2017 peak, the November 2021 all-time high, and the December 2018 and November 2022 washouts.
The Coinglass grid cannot timestamp intramonth highs or lows, but the clustering of major pivots into the final two months of the year is consistent with the market’s folklore and with the returns pattern that shows both exceptionally strong up months and some of the cycle’s most punishing down months in this window.
The practical takeaway—again in Daan’s words—is not categorical bullishness, but regime risk: “All in all, an eventful last 2 months of the year generally speaking. Whether it’s on the bullish or bearish side, volatility and big market pivots have been the theme into the end of the year.” The heat map supports that characterization.
November’s distribution spans the widest extremes on record—from +449.35% at the top to -36.57% on the downside—with a two-thirds hit rate for green months and a median gain in the low double digits. December, by contrast, has produced both cycle tops and cycle bottoms despite a modest average, a reminder that average and median statistics can obscure the path risk that defines Bitcoin’s fourth quarter.
Seasonality is not destiny, and the sample is limited. Still, the data-backed message is clear: as November approaches, Bitcoin’s historical pattern has been less about quiet trend continuation and more about variance—the kind that has marked both euphoric blow-offs and capitulation lows.
Crypto analyst CasiTrades has predicted that the XRP price could still crash to $1.4 in the final wave of this downtrend. This comes despite bullish catalysts such as the Fed rate cut, which could lift the altcoin to new highs.
Analyst Predicts XRP Price Crash To $1.4
In an X post, CasiTrades stated that exchanges are aligning toward their .618 retracements, with Binance showing a crash to between $1.35 and $1.46 for the XRP price. She noted that this next wave down would complete the macro Wave 2 correction, setting the stage for the next Wave 3 impulse that could send XRP toward $6.50 or $10.
This came as the analyst remarked that the XRP price was at a major decision point, with the price continuing to test the Wave 4 highs. She noted that this resistance is making another wave down a possibility. To invalidate the move down, CasiTrades stated that XRP needs to break and hold above $2.82 on Binance.
However, so far, the XRP price hasn’t done so, with CasiTrades noting that the price is still ranging between support and resistance. She explained that this leans toward this being a Wave 4, with the altcoin one final move lower before the next macro impulse. The analyst ruled out a V-shaped recovery, noting that price typically breaks through resistance immediately and decisively, which is not happening with the current price action.
She further remarked that the hesitation suggests that selling pressure isn’t fully exhausted for the XRP price. However, CasiTrades assured that the deeper support levels aren’t a reason to panic, as they are high conviction accumulation zones. Meanwhile, the analyst highlighted a discrepancy in the price action on different exchanges.
She noted that the XRP price on Binance wicked to $0.77 during the $19 billion liquidation event, while on Coinbase, XRP never reached its .618 retracement level. CasiTrades then reiterated that until $2.82 breaks, the price action favors one final wave down before the next major move up.
XRP’s Bull Run Isn’t Over
Crypto analyst Egrag Crypto has assured that the bull run isn’t over for the XRP price, despite predictions that the top may be in. He stated that as long as XRP holds above $2.20 and $1.97 as monthly closes, then there is no structural break. He also believes that the altcoin and other risk assets are about to “roar.”
Egrag Crypto noted that quantitative tightening is still active and that Fed rate cuts are just beginning. In line with this, he declared that the last leg up is still waiting to play out. He claimed that cycles don’t end when 50% of traders are cautious, but do when everyone is “drunk on euphoria.”
At the time of writing, the XRP price is trading at around $2.6, down in the last 24 hours, according to data from CoinMarketCap.
Trump-backed American Bitcoin ($ABTC) surged 11% after adding 1,414 $BTC ($163M) to its treasury, bringing total holdings to roughly 3,865 $BTC worth $446M.
The company, backed by Donald Trump Jr. and Eric Trump, uses a novel Satoshis per Share (SPS) metric to show investors exactly how much $BTC backs each share.
Among the best altcoins to watch in this rotation are Bitcoin Hyper ($HYPER), a Bitcoin Layer-2; PepeNode ($PEPENODE), a mine-to-earn meme project; and World Liberty Financial ($WLFI), the Trump-themed DeFi ecosystem.
The Trump family has made another bold move in the corporate crypto world as the publicly listed treasury and mining firm American Bitcoin (ABTC) announced a 1,414 Bitcoin addition to its holdings.
That’s roughly $163M at current prices and brings $ABTC’s total stash to about 3,865 BTC – approximately $446M.
Backed by Donald Trump Jr and Eric Trump, American Bitcoin is the public-facing vehicle formed after a merger between Canadian miner Hut 8 Corp and Gryphon Digital Mining.
In a media release, American Bitcoin emphasized that its business model goes beyond simply buying $BTC; it also mines the cryptocurrency directly, which the company says gives it a cost advantage over peers that purely purchase from the market.
To drive the point home, ABTC relies on a metric called ‘Satoshis per share,’ or SPS. With 100M Satoshis per Bitcoin, ‘sats’ are the smallest unit of value in $BTC. By dividing the number of shares by the total number of sats in the Bitcoin it holds, ABTC can tell shareholders exactly how much $BTC their holdings represent.
Following the announcement, ABTC’s stock rose by more than 11% in a single session, as the news resonated with investors hungry for exposure to public company-level crypto strategies.
Bitcoin is up by around 4.7% in the past week, and sits just under $115K, near a two-week high.
ABTC forms part of the growing push for crypto treasuries, and signals confidence in Bitcoin’s near-term trajectory. That trajectory bodes well for key altcoins as well. Even as ABTC amasses Bitcoin, tokens like $HYPER, $PEPENODE, and $WLFI are emerging as the best altcoins to buy right now.
Bitcoin Hyper ($HYPER) plans to introduce a next-gen Layer-2 ecosystem that will address Bitcoin’s biggest pain points – slow speeds, high costs, and smart-contract compatibility.
And the project will do this by merging Bitcoin’s monetary dominance with Solana’s high-performance virtual machine (SVM) environment.
The Hyper Layer-2 will use a Canonical Bridge architecture on the SVM that allows native $BTC to be minted, wrapped, and deployed across a fast, low-fee ecosystem. And with zero-knowledge proofs and final settlement on the original Bitcoin Layer-1, it will all be executed without compromising Bitcoin’s top-tier security model.
Bitcoin Hyper enables real-time payments, DeFi participation, and on-chain micro-transactions that unlock Bitcoin’s liquidity for practical utility.
The project’s hybrid framework positions it as a natural upgrade to Bitcoin, capable of scaling transaction speeds from Bitcoin’s current seven transactions per second to multiple thousands, courtesy of the SVM. Meanwhile, its native token, $HYPER, will power validator staking, bridge operations, and ecosystem governance.
Discover more about this exciting Layer-2 project in our detailed Bitcoin Hyper review.
The combination of new utility and proven reliability bode well for $HYPER’s performance, which is why it’s no surprise that the Bitcoin Hyper surpassed the $25M milestone yesterday.
It’s also part of the reason our $HYPER price prediction shows that the token could potentially increase from its current price of $0.013185 to $0.08625 by the end of 2026 – for 554% gains. To get in now, check out our step-by-step guide to buying $HYPER.
Being a presale, though, its price rises in stages, while the staking APY decreases as more holders stake their tokens. With little over one day left before the next price increase – and staking APY currently at 47% – there’s no time like the present to join the presale at its early-bird price.
2. PepeNode ($PEPENODE) – ‘Mine-to-Earn’ for Bigger Gains and Meme Coin Rewards
PepeNode ($PEPENODE) deploys an innovative ‘mine-to-earn’ infrastructure play that transforms how meme coin culture and the blockchain intersect.
With a virtual server-room model, you’ll be able to use your $PEPENODE tokens to buy mining rigs and nodes to outfit your server rooms. And the more nodes you have, the more $PEPENODE you’ll mine.
Rewards are also up for grabs courtesy of this gamified project – and they’re not limited to $PEPENODE. Rewards include other popular meme coins like $PEPE and $FARTCOIN.
This novel platform brings together the fun of blockchain gaming and the raw potential of meme coins. For PepeNode investors, mine-to-earn opens the door for several ways to earn from the project:
$PEPENODE token price increases:Our PepeNode price prediction shows the token could potentially go from $0.0011227 to $0.0077 by the end of 2026, a 585% increase.
Staking and $PEPENODE rewards: The dynamic staking APY currently stands at 653%, while mine-to-earn rewards will be available after the project launches post-TGE.
Other meme coin rewards: Earning $FARTCOIN and $PEPE adds another way to benefit from the project.
The PepeNode presale has already raised $1.9M+, despite the presale only recently being launched. We expect that figure to ramp up considerably, placing $PEPENODE among the next altcoins to potentially explode.
3. World Liberty Financial ($WLFI) – Centerpiece of Donald Trump’s Crypto Empire
World Liberty Financial ($WLFI) – like all Trump projects – is as politically charged as it is business-motivated. Launched in parallel with Donald Trump’s pro-crypto policies, World Liberty Financial includes the $WLFI token as well as stablecoins like $USD1.
$WLFI blends meme-coin energy with a treasury-backed investment protocol tied to the Trump movement’s populist narrative. Its mission is to empower holders through decentralized finance, tokenized assets, and a particular brand identity.
$WLFI recently gained viral traction after a White House-themed tweet referenced GameStop and crypto freedom and sent trading volume surging past $220M in a single day.
Currently trading at $0.1465, $WLFI is up by more than 14% in the past week, reflecting an appeal that lies partly in its growing ecosystem and partly in political mood affiliation.
To recap: American Bitcoin’s $163M bet on Bitcoin highlights just how much institutional corporate interest there is in the crypto space. Projects like $WLFI show how that interest bridges from corporate projects to leading altcoins, and $HYPER and $PEPENODE stand to benefit.
Always do your own research; this isn’t financial advice.
Strategy Inc., the company led by Michael Saylor that rebranded from MicroStrategy, was hit with a junk credit grade on Monday as S&P Global Ratings flagged its heavy concentration in Bitcoin and weak dollar liquidity.
According to S&P, the firm’s balance sheet is tied closely to the price of Bitcoin and carries risks that traditional ratings models find hard to treat as stable collateral.
Bitcoin Holdings Drive The Score
Based on reports, Strategy’s Bitcoin stack is enormous — about 640,808 BTC on its books — worth roughly $73 billion to $74 billion at recent prices.
S&P said that while the company owns a large digital-asset hoard, the volatility of that asset and the company’s limited cash flow make it risky under S&P’s credit rules.
S&P assigned a B- issuer credit rating and kept the outlook stable. That B- places the company squarely in non-investment-grade territory, signaling a higher chance of stress if markets turn against it.
S&P Global Ratings has assigned Strategy Inc a ‘B-‘ Issuer Credit Rating (Outlook Stable) — the first-ever rating of a Bitcoin Treasury Company by a major credit rating agency. https://t.co/WLMkFqkkCb
Reports have disclosed that S&P was particularly concerned about a mismatch: most obligations are owed in US dollars, but most of the company’s value sits in Bitcoin. This gap can force the sale of Bitcoin to meet dollar payments if prices slide.
Analysts and commentators pointed to sizable convertible securities and preferred-stock commitments that add cash demands on the company. According to filings and market write-ups, the firm faces billions of dollars in convertible and preferred obligations spread over coming years.
Saylor and Strategy have made repeat purchases of Bitcoin as part of their stated plan. Those buys have created big unrealized gains on paper, but S&P’s methodology largely treats the token differently from traditional equity when measuring risk-adjusted capital.
Liquidity, Access To Markets
S&P noted that, for now, Strategy still has access to capital markets, which is why its outlook is stable rather than immediately negative.
But the rating agency warned that a sharp drop in Bitcoin’s price or any sudden tightening of funding channels could trigger a further downgrade.
Market participants will watch funding costs, preferred dividend payments and convertible notes for signs of stress.
Investors reacted with mixed signals in early trading. Some buyers treated the downgrade as a formal recognition of a known risk, while others judged the move as a calibration that won’t stop Saylor’s accumulation strategy if markets stay calm.
Trading volume and price swings in both Strategy shares and Bitcoin may rise as traders reassess odds.
Featured image from Gemini, chart from TradingView
Cantonese Cat used his October 28 video to zero in on the Dogecoin market structure, arguing that the meme-coin is nearing the end of a multi-year accumulation phase—and that the recent washout was a feature, not a bug, of that process. While he declined to publish numeric price targets in the video, he made the case that DOGE’s setup is maturing in lockstep with broader “risk-on” signals, with a familiar lag to Ethereum that historically precedes Dogecoin’s larger moves.
When Will Dogecoin Rally Again?
On structure, he was explicit. “Just looking at Doge here, you can see how […] Doge has been forming a cup over here for close to four and a half, five years now […] it’s just been building a big giant base.” In his read, the rounded bottom is the defining pattern of this cycle for DOGE, and it remains intact despite recent volatility.
He framed the sharp drawdown two weeks ago as necessary positioning rather than a break in trend: “You just had a great deleveraging event […] I’m not going to look at a lower low and think the trend is broken […] These are very healthy deleveraging before the next move up as far as I’m concerned.” He highlighted “a big giant wick” and “a lot of demand down below,” pointing to what he sees as resilient spot support through the base.
Timing, not targets, was the centerpiece. He reiterated that Dogecoin typically follows Ethereum with a delay once ETH clears its own major resistance bands. “Whenever we get closer to the end of the rounded bottom […] that’s when Ethereum breaks out above the resistance zone and goes up a lot higher. Thus, Doge runs together with Ethereum,” he said, adding: “There is a lag. I would say the lag is probably maybe a couple months between Ethereum breaking up and Doge finally breaking above this rounded bottom here and going up.”
He made a similar observation using risk proxies, noting that DOGE moves have historically trailed small-cap-led risk cycles by several months, though he cautioned that the exact interval can vary. Via X, he added “DOGE lags behind IWM [iShares Russell 2000 ETF] all-time-high breakout by about 2 to 4 months before it takes off.”
Cantonese Cat also pushed back on the view that a sequence of lower lows automatically invalidates the DOGE setup, arguing that this occurred in prior cycles just before outsized rallies. “A lot of people look at this, ‘that’s a lower low […] the cycle is over.’ Well, it doesn’t work that way. That’s a lower low right there. Next thing you know, it just went a lot higher,” he said, tying the observation to the current “healthy deleveraging” and the persistence of the rounded-bottom structure.
If the video offered the structural blueprint, his same-day post on X clarified his stance on headline targets. “I realize that it’s stupid to call for DOGE to $2 or $4 when price is at 20 cents. If I was smart like others, I should just call for DOGE to $2 or $4 when it’s $2 or $4.” The comment is consistent with his prior price predictions.
Inside the video update, the analyst instead emphasized the sequence he expects to matter—ETH strength first, DOGE follow-through second, with the magnitude determined by how far the broader risk cycle runs once momentum rotates.
The next Federal Open Market Committee (FOMC) meeting is fast approaching, and the bets are already pouring in as to what it would mean for the Bitcoin and crypto industry. The last FOMC meeting took place in September, when the Federal Reserve ended up cutting rates down to 4-4.25% after months of no rate cuts. With this setting the tone, the expectations that another rate cut could be on the way are getting louder, with the FedWatch Tool showing a high percentage.
Market Expects Another Rate Cut To 3.75-4%
The next FOMC meeting is scheduled for Wednesday, October 29, 2025, and there is already a major clamor around what the Fed is planning on doing. The current market headwinds point to a favorable outcome for risk assets such as Bitcoin and other cryptocurrencies, with expected rate cuts.
Currently, the CME FedWatch Tool is showing that the probability of a rate cut has risen to 98.3% as of the time of this writing. This leaves only a 1.7% chance that the Federal Reserve will actually leave rates at their current levels, and there is zero chance that there will be a rate hike.
A reduction in the rate cuts is good for businesses all around, as lower interest rates mean better loan terms and increased spending and borrowing. Thus, it will increase the participation in the markets, from consumer goods to the stock market, and then make its way into newer markets such as Bitcoin and crypto.
Expectations For Bitcoin And Crypto Are Getting Higher
A rate cut by the Federal Reserve aligns with the more pro-crypto stance that the United States has been moving in since President Donald Trump was elected. Last week, the president pardoned the Founder and former CEO of the Binance crypto exchange, Changpeng Zhao, after he previously pled guilty to money laundering violations back in 2024. Zhao has since served a 4-month stint before the pardon from Trump came.
With the US embracing Bitcoin and crypto again, a rate cut will only further the ascent, allowing more investors to get into the market as liquidity frees up. The initial announcement has been known to trigger a rapid increase in the market. But as the news settles, the crypto market is expected to continue to rise in response.
However, nothing is certain until the FOMC meeting is complete and the announcement is made. For the Bitcoin and crypto market to remain bullish, inflation will also have to be reduced, as an increase could trigger more conservative stances from investors.
$135 Litecoin price prediction hits the market ahead of the Litecoin ETF (LTCC) reaching Nasdaq today.
Litecoin is already bullish, after briefly breaking above $105 and consolidating around the $102 mark in preparation of the SEC’s decision.
PEPENODE ($PEPENODE) reaches $1.96M in presale thanks to its mine-to-earn mechanics and community support.
$PEPENODE could deliver an ROI of 585% in 2026, without counting the staking APY of 653%.
A $135 price prediction for Litecoin appears more than feasible ahead of its spot ETF, which is ready to launch on Nasdaq today with the ticker LTCC.
Litecoin has been experiencing a notable increase over the last week, following a 10.44% surge that took it from $ 90.50 on October 23 to a high of $105.25 today.
The main catalyst is the SEC’s imminent favorable decision, which would greenlight Canary Litecoin, Canary HBAR, and Bitwise Solana ETFs today.
Bloomberg analyst, Eric Balchunas, confirmed the news on X, saying: ‘Assuming there’s not some last min SEC intervention, looks like this is happening’.
The news is understandably bullish for Litecoin, as the Nasdaq listing would open the asset to investors who don’t necessarily want to buy it. Long-term, this will boost liquidity, improve Litecoin’s legitimacy, and increase adoption at retail and, hopefully, institutional level.
Projects like PEPENODE ($PEPENODE) also stand to gain thanks to its on-chain utility and meme value. PEPENODE allows early adopters to buy mining nodes and build their own virtual coin mining facility, minus the electricity costs and expensive mining equipment.
Can Litecoin Push to $135?
The momentum is there for a $135 push, especially considering the network activity, as shown by Santiment. Litecoin’s price spiked on October 9 and crashed soon after; the window was too short for investors to capitalize on it.
There was an attempt, but it fizzled out as Litecoin was already in free fall.
If investors had capitalized on it, the momentum might have held, increasing the opportunity window and potentially triggering a consolidation phase above $130.
But we’re not in that timeline.
Fortunately, we may be looking at a strong reset, as $LTC is already showing signs of consolidation above $101 after briefly popping its head above $105.
And this time, investors are not willing to miss the opportunity window again. The 24-hour transaction volume is up 69.41%, a clear indication that momentum is building ahead of the SEC’s decision later today.
We then have the Relative Strength Index, which currently stands at 64.77 points. For reference, the bull zone begins at a price above 50.
The community is clearly hyped up, $LTC shows growing potential, and investors are ready. In this context, a breakout above $135 is more than achievable if LTCC performs well following its Nasdaq listing.
If $LTC meets the bullish expectations, another project that stands to gain significant attention is PEPENODE ($PEPENODE), with its presale already at $1.96M.
How PEPENODE Rewards Early Adoption
PEPENODE ($PEPENODE) encourages participation in its presale with the help of its innovative mine-to-earn mechanics.
The project addresses the main problems associated with crypto presales today: the lack of participation incentives. In short, presales don’t incentivize investors to buy in early, which leads to poor presale performances, which inadvertently lowers the coin’s visibility post launch.
PEPENODE’s mine-to-earn mechanics offer an exciting alternative in the form of virtual mining facilities. The concept is straightforward: purchase mining nodes, upgrade them, build your own virtual mining facility, activate it, and watch your rewards accumulate.
The earlier you buy, the stronger your nodes, the faster you mine, and the more you can earn. This translates to higher post-TGE rewards, which include actual meme coins, such as $FARTCOIN and $PEPE.
The 653% staking APY is an additional incentive for early adoption.
$PEPENODE now sits at $0.0011227 and managed to raise $1,965,327 so far, while the presale is still going. Based on the project’s utility and meme value, the token still has plenty of growth potential.
A realistic price prediction for $PEPENODE puts the coin at $0.0077 by the end of 2026; possibly even higher if the mine-to-earn mechanics catch on. This translates to an ROI of 585%, excluding the staking benefits or the meme coin rewards resulting from your coin-farming.
The crypto market, despite experiencing throughout the year major price fluctuations, security incidents, and legal hurdles, has experienced remarkable growth.
This can be attributed to the expansion of digital asset treasuries (DATs), increased institutional adoption, and new initiatives aimed at integrating digital assets, particularly stablecoins, into traditional financial sectors.
Andreessen Horowitz (a16z) recently shared their projections for the crypto landscape for the remainder of the year and years to come, highlighting nine key trends expected to be major catalysts for the industry.
Key Legislative Changes And Institutional Adoption
Firstly, market structure legislation in the US is expected to emerge as a critical priority for policymakers and Congress, establishing a clear regulatory framework that supports crypto developers.
The passage of the GENIUS Act in July of this year also marked a pivotal moment, garnering bipartisan support and providing builders with much-needed certainty in their endeavors.
Secondly, the adoption of stablecoins is set to accelerate as network effects take hold among financial institutions, merchants, and consumers, thereby enhancing the global standing of the US dollar.
Furthermore, major players like JPMorgan, Citi, BlackRock, and Fidelity are amplifying their crypto offerings through new product launches, partnerships, and acquisitions.
The infrastructure supporting blockchain technology is also advancing rapidly. Current networks can process over 3,400 transactions per second, marking a 100-fold increase over the past five years.
Moreover, a new wave of real-world assets (RWAs) is transitioning onto the blockchain as the worlds of crypto and traditional finance converge. The market for tokenized real-world assets has expanded to nearly $30 billion, with significant contributions from Treasuries, money market funds, and private credit.
The Future Of Crypto
In parallel, the crypto sector is attracting a growing pool of talent, driven by a more favorable regulatory environment and the emergence of new opportunities for developers.
The focus on revenue generation is also shifting within the token ecosystem. More tokens are implementing fee mechanisms, redirecting attention toward fundamental value. In the past year, users have paid $33 billion in fees, resulting in $18 billion for projects and $4 billion for token holders.
Innovative consumer products are also expected to drive the next wave of crypto adoption. Although approximately 716 million people now own cryptocurrency, only 40 to 70 million are considered active users.
Ultimately, 2025 is poised to lay the groundwork and establish the foundations for the years to come. It is expected to be a transformative year for the crypto industry, characterized by widespread institutional adoption, regulatory clarity, and tangible utility.
Featured image from DALL-E, chart from TradingView.com
Multiple crypto exchange-traded funds (ETFs) are set to launch this week despite the government shutdown, with investment products based on Solana (SOL), Litecoin (LTC), and Hedera (HBAR) seemingly ready to start trading as soon as Tuesday.
Big Week For Crypto ETFs
On Sunday night, Nate Geraci affirmed that the next two weeks will be key for the long-awaited spot crypto-based ETFs as Solana, XRP, LTC, and other ETF filings are “all lined up & ready for launch.”
Similarly, Bitwise CEO, Hunter Horsley, hinted that this week would be a “Big week,” suggesting progress related to its Solana Staking ETF. It’s worth noting that the crypto community has been awaiting the US Securities and Exchange Commission (SEC)’s approval of the investment products following the numerous ETF applications filed over the past few months.
Between August and September, the regulatory agency postponed the decision deadline of most applications by two months, pushing back the key dates to mid-October and mid-November. However, the government’s shutdown, which started on October 1, reduced the odds of the products receiving a green line during the expected timeline.
On Monday morning, ETF expert Erich Balchunas reported that multiple issuers were looking to launch their crypto-based ETFs this week, despite the government shutdown. According to the Bloomberg analyst, Canary Capital had filed 8-A forms for its spot Litecoin and Hedera ETFs, while Bitwise had filed one for its Solana Staking ETF.
“These are the ones rumored to be poss looking to launch (along w Grayscale solana) this week despite shutdown. Not a done deal but clearly preparations being made. Stay tuned,” Balchunas stated.
Solana, Litecoin, Hedera Products Take The Lead
Later, Balchunas confirmed the reports that the exchange had posted listing notices for Bitwise’s Solana Staking ETF, and Canary’s LTC and HBAR ETFs to launch on October 28, while Grayscale’s Solana trust is set to convert on Wednesday. “Assuming there’s not some last min SEC intervention, looks like this is happening,” the analyst added.
Crypto Journalist Eleanor Terret also shared the news, citing Canary’s CEO, Steven McClurg, who confirmed that the Canary spot HBAR and LTC ETFs will begin trading on Nasdaq on Tuesday.
“Litecoin and Hedera are the next two token ETFs to go effective after Ethereum,” McClurg told the journalist in a statement. “We look forward to launching tomorrow.”
Terret explained that despite the government shutdown, the launch is possible because “the operation of law does not always actually require an open government.”
According to the post, the 8-A forms are “just as important” as the S-1s filings: the former formally registers ETF shares under the Securities Exchange Act of 1934, while the latter registers the investment products under the Securities Exchange Act of 1933.
After NYSE certified all the 8-A filings for the ETFs above on Monday, shares can start trading, Terret affirmed, adding:
“Here’s the key: The issuers included language in their amended S-1s that lets them automatically go effective 20 days after filing. Typically, issuers delay S-1s until the SEC takes them effective, but the legal default is that the S-1 goes automatically effective without SEC intervention. That means the agency doesn’t need to approve them manually and the filings can go live on their own, even during the shutdown. So, long story short, all the legal boxes are checked and these ETFs are on track for launch.”
Despite facing criticism for lagging behind the United States in creating a more accommodating environment for cryptocurrency growth and adoption, China reaffirmed its stringent stance on crypto once again this week.
Authorities issued warnings about the alleged risks posed by stablecoins, particularly amid concerns that the US may have solidified its dollar dominance through these digital assets.
US GENIUS Act Vs. China’s Crypto Caution
According to local media reports, Pan Gongsheng, governor of the People’s Bank of China, announced plans to expand the use of the country’s central bank digital currency (CBDC), known as the “e-CNY.”
He remarked, “[Stablecoins] are still in their early stages of development,” emphasizing that financial regulators globally remain cautious about these assets, which are typically pegged to other currencies.
In the United States, however, Trump’s policies toward digital assets have resulted in the passage of the GENIUS Act, as the first crypto bill aimed at laying the framework for the adoption of these dollar-pegged cryptocurrencies.
Yet, Pan highlighted that stablecoins currently fail to meet essential requirements such as customer identification and anti-money laundering (AML) measures, which could allegedly exacerbate gaps in global financial regulation.
He expressed concern that these issues foster a “speculative market atmosphere,” increasing vulnerabilities in the global financial system and affecting the monetary sovereignty of less developed economies.
The central bank plans to collaborate with law enforcement to continue cracking down on domestic operations and speculation related to crypto. “The policies and measures implemented since 2017 to address risks associated with virtual currencies remain in effect,” he stated.
Regulatory Revisions Ahead
Despite China’s continuous crypto crackdown, research on stablecoins is progressing within China. The country’s largest government-backed research fund recently opened applications for studies focused on stablecoins and their cross-border monitoring systems, offering grants ranging from 200,000 yuan (approximately $28,083) to 300,000 yuan ($42,126).
The central bank also plans to optimize the positioning of the digital yuan, allowing more commercial banks to participate in the pilot program that has been running in over two dozen cities since 2019, accumulating a transaction value exceeding 14 trillion yuan.
Zhu Hexin, director of the State Administration of Foreign Exchange, indicated that nine new policy measures would soon be introduced to promote trade innovation and development, with the potential to bring positive developments for the growth of the crypto ecosystem in the Asian country.
Wu Qing, chairman of the China Securities Regulatory Commission, also hinted at the possibility of such measures, stating that the regulator would review listing standards on the Shenzhen Stock Exchange’s ChiNext board to better align with the characteristics of emerging fields and future industries.
Featured image from DALL-E, chart from TradingView.com
Data shows the Bitcoin Fear & Greed Index has surged back into the neutral zone after the recovery rally in the cryptocurrency’s price.
Bitcoin Fear & Greed Index Now Has A Value Of 51
The “Fear & Greed Index” refers to an indicator created by Alternative that measures the average sentiment present among traders in the Bitcoin and wider cryptocurrency markets. The metric uses the data of the following five factors to determine the investor mentality: trading volume, market cap dominance, volatility, social media sentiment, and Google Trends.
The index uses a numerical scale running from zero to hundred for representing this sentiment. All values above 53 correspond to greed among the investors, while those below 47 to fear. The region between the two cutoffs naturally corresponds to a net neutral mentality.
Now, here is how the current Bitcoin market sentiment is like, according to the Fear & Greed Index:
As is visible above, the indicator has a value of 51, which suggests the trader sentiment is almost exactly in the balance right now. This is a notable change in market mood compared to just a few days ago.
As displayed in the chart, the Fear & Greed Index was inside the fear zone during the past few days. The despair among the traders was a result of the bearish price action that BTC had recently faced.
At one point, the indicator even fell to a low of 22, reflecting a state of “extreme fear.” This zone, which occurs below 25, corresponds to investors being the most bearish toward the market. There is a similar region for the greed side as well, called the “extreme greed,” situated above 75.
Historically, the extreme sentiments have been quite significant for Bitcoin and other cryptocurrencies, as they are where major tops and bottoms have tended to form. The relationship has been an inverse one, however, meaning extreme fear is where bottoms form, while extreme greed facilitates tops.
Since the extreme fear low earlier in the month, BTC has been on the way up, a potential indication that the contrarian signal of the sentiment may once again be in action.
The cryptocurrency has extended its recovery in a sharp manner during the last couple of days, which may be a potential reason why the Fear & Greed Index has surged back to the neutral territory now.
Though, for now, Bitcoin traders are still undecided on whether bullish action will follow next. It now remains to be seen whether they will embrace greed, or continue to be hesitant about the recovery.
BTC Price
At the time of writing, Bitcoin is floating around $114,900, up 3.6% over the last seven days.
Dogecoin struggled to rise above $0.210 and corrected some gains against the US Dollar. DOGE is now consolidating and might decline below $0.1980.
DOGE price started a fresh downside correction below $0.2035.
The price is trading below the $0.20 level and the 100-hourly simple moving average.
There was a break below a contracting triangle with support at $0.20 on the hourly chart of the DOGE/USD pair (data source from Kraken).
The price could aim for a fresh increase if it remains stable above $0.1940.
Dogecoin Price Starts Another Pullback
Dogecoin price started a fresh increase after it settled above $0.1920, like Bitcoin and Ethereum. DOGE climbed above the $0.20 resistance to enter a positive zone.
The bulls were able to push the price above $0.2020 and $0.2050. A high was formed at $0.2094 and the price is now correcting gains. There was a move below the 23.6% Fib retracement level of the upward move from the $0.1843 swing low to the $0.2094 high.
Besides, there was a break below a contracting triangle with support at $0.20 on the hourly chart of the DOGE/USD pair. Dogecoin price is now trading below the $0.20 level and the 100-hourly simple moving average.
If there is another increase, immediate resistance on the upside is near the $0.2020 level. The first major resistance for the bulls could be near the $0.2050 level. The next major resistance is near the $0.210 level. A close above the $0.210 resistance might send the price toward $0.2150. Any more gains might send the price toward $0.2250. The next major stop for the bulls might be $0.2320.
More Losses In DOGE?
If DOGE’s price fails to climb above the $0.2020 level, it could start a downside correction. Initial support on the downside is near the $0.1970 level and the 50% Fib retracement level of the upward move from the $0.1843 swing low to the $0.2094 high. The next major support is near the $0.1935 level.
The main support sits at $0.190. If there is a downside break below the $0.190 support, the price could decline further. In the stated case, the price might slide toward the $0.1840 level or even $0.1780 in the near term.
Technical Indicators
Hourly MACD – The MACD for DOGE/USD is now gaining momentum in the bearish zone.
Hourly RSI (Relative Strength Index) – The RSI for DOGE/USD is now below the 50 level.
The Cardano weekly chart is still looking strongly bullish according to independent technician Charting Guy (@ChartingGuy on X) who resurfaced his long-running Fibonacci roadmap and channel study.
Can Cardano Top $6 This Cycle?
His latest post on X on October 26 noted that “ADA is fine as long as uptrend holds,” a view that is anchored in a multi-year rising channel that has contained price action since the 2018–2019 base. The channel features a lower rail now passing through roughly the $0.33–$0.35 area, a midline that has behaved as a recurring pivot since 2020, and overhead parallels that intersect with Fibonacci extension targets later in the cycle.
The chart history mapped on his visuals is orderly. The 2021–2022 bear trend, drawn as a steep descending line from the prior peak, ended into the channel’s lower support and resolved through a series of falling trendline breakouts during 2023 and early 2024. Since Q4 2023, the chart has shown a series of higher highs and higher lows. Currently, the ADA price is again guided by a falling trendline.
Everything in the layout revolves around the Fibonacci ladder. The retracement set on the right margin—derived from the 2021 peak to the cycle low—marks 0% at $0.23488, then $0.33360 (0.136), $0.43180 (0.236), $0.62932 (0.382), a mid-range 0.5 at $0.85, $1.15694 (0.618), $1.43911 (0.702), $1.78464 (0.786), $2.32189 (0.888), and $3.09981 (1.000). Above that stack, the cycle extensions are plotted at $6.25325 (1.272), $9.00941 (1.414) and $15.26831 (1.618).
Those numbers are consistent with how the analyst framed the market earlier in the year. On April 27 he wrote that “ADA fibs are very important here. The 0.618 is a STRONG resistance… the 0.382 MUST hold… neutral until one of these breaks on a weekly close.” That roadmap has aged intact.
Rallies through spring and summer repeatedly stalled in the 0.500–0.618 zone, with the 0.618 level at $1.15694 capping advances. Pullbacks, in turn, have found bids near the 0.382 pivot at $0.62932.
On September 18, after that rejection, he updated that “ADA higher low … higher high pending… still targeting 1.272 fib this cycle,” tying the price structure back to the extension grid. The implication is not casual moon-math; it is geometric. If ADA continues to defend the uptrend defined by the channel’s lower rail and, crucially, converts the 0.618 retracement at $1.15694 into support on weekly closes, the path reopens into the upper retracement shelf—$1.43911 at 0.702 and $1.78464 at 0.786—before confronting the 0.888 marker at $2.32189.
A yellow waypoint for a higher high (on the main chart) sits near ~$2.30, deliberately aligning with that 0.888 level to flag a logical checkpoint for the next impulsive leg beneath the full retrace at $3.09981.
Only beyond that zone does the headline question come into play. The analyst’s cycle objective is the 1.272 extension at $6.25325. On his canvas, that target is not an orphaned price label; it intersects with the upper parallels of the multi-year rising channel further out in time, which means the extension is technically consistent with the same structure that has governed ADA since the last cycle’s base.
The risk management side of the ledger remains equally explicit: lose the 0.382 at $0.62932 on a weekly closing basis and the neutral-to-constructive stance is impaired, pushing focus back to $0.43180 and $0.33360, with the 0% anchor at $0.23488 defining the absolute boundary of the cycle floor inside the channel’s lower third.
As the latest candles on the charts show, ADA sits mid-channel with the higher low confirmed and the range unresolved beneath descending trendline supply. The triggers are unchanged and numerically clear. A sustained weekly close above $1.15694 would validate an attempt toward $1.44, $1.78, and $2.32, with $3.10 the final retrace before extension math takes over.
A failure through $0.62932 would flatten the uptrend call. Between those guardrails, the analyst’s October 26 message reads less like bravado and more like a conditional statement embedded in the chart itself: Cardano can still reach $6.25 this cycle—but only if the uptrend continues to hold and the 0.618 ceiling finally gives way.
XRP price started a fresh increase above $2.50. The price is now showing positive signs and might rise further if it clears the $2.6880 resistance.
XRP price gained pace for a move above $2.50 and $2.550.
The price is now trading above $2.50 and the 100-hourly Simple Moving Average.
There is a bullish trend line forming with support at $2.60 on the hourly chart of the XRP/USD pair (data source from Kraken).
The pair could start a fresh increase if it clears the $2.6880 resistance.
XRP Price Holds Support
XRP price started a fresh increase after it settled above $2.40, like Bitcoin and Ethereum. The price surpassed the $2.420 and $2.50 resistance levels.
The bulls were able to push the price above $2.550 and $2.65. A high was formed at $2.6972 and the price is now consolidating gains above the 23.6% Fib retracement level of the recent move from the $2.327 swing low to the $2.6972 high.
The price is now trading below $2.60 and the 100-hourly Simple Moving Average. There is a bullish trend line forming with support at $2.60 on the hourly chart of the XRP/USD pair.
If there is a fresh upward move, the price might face resistance near the $2.650 level. The first major resistance is near the $2.6880 level, above which the price could rise and test $2.70. A clear move above the $2.70 resistance might send the price toward the $2.7650 resistance. Any more gains might send the price toward the $2.80 resistance. The next major hurdle for the bulls might be near $2.880.
Downside Correction?
If XRP fails to clear the $2.6880 resistance zone, it could start a fresh decline. Initial support on the downside is near the $2.60 level. The next major support is near the $2.5650 level.
If there is a downside break and a close below the $2.5650 level, the price might continue to decline toward $2.5120 or the 50% Fib retracement level of the recent move from the $2.327 swing low to the $2.6972 high. The next major support sits near the $2.4680 zone, below which the price could continue lower toward $2.420.
Technical Indicators
Hourly MACD – The MACD for XRP/USD is now losing pace in the bullish zone.
Hourly RSI (Relative Strength Index) – The RSI for XRP/USD is now above the 50 level.
The XRP market is bracing for a new phase of intense volatility, with anticipation growing around key legal, regulatory, and institutional developments. Ripple CEO Brad Garlinghouse has recently addressed the XRP community, offering guidance and setting expectations for what is to come.
XRP Unusual Stability May Be Setting Up A Major Move
The cryptocurrency world is buzzing with increased anticipation for XRP, following a series of strategic announcements from Ripple and compelling technical analysis. Popular crypto news source CryptosRus has highlighted on X that the altcoin is poised for a sharp move, as Ripple CEO Brad Garlinghouse has mentioned that investors should be prepared for a substantial shift.
At the core of this move, Ripple has just launched Ripple Prime, a new global prime brokerage service tailored for institutional clients. According to the company, Ripple Prime will be powered by Ripple’s foundational digital asset infrastructure, encompassing its robust solutions for payments, crypto custody, and stablecoin capabilities, alongside XRP.
However, CEO Brad Garlinghouse called this move another step toward building the internet of value, emphasizing that the XRP sits at the center of everything Ripple does. CryptosRus noted that the altcoin has recently bounced off a key support level at $2.33. This technical indicator is signaling a potential 30% rally, with an initial target of $3.45 or even higher, as market momentum continues to build.
An analyst known as TylerHillYT, who is also the president of FluenceGlobal and Co-Founder of the CSS, has also stated that the XRP price comeback is showing structural strength. In just a day, the token burn rate spiked 29%, mirroring its 29% price surge, signaling a synchronized increase in both on-chain demand and heightened investor activity.
This Ripple’s deeper expansion into traditional finance and the recent launch of Ripple Prime have caused the network usage to ramp up again. TylerHillYT emphasized that at the accelerated pace, XRP is not just riding a wave of market momentum, but it’s rebuilding its long-term narrative. However, the burn acceleration with renewed institutional traction could be the early signs of a sustained upward trajectory, pushing the token structurally toward the $3.00 mark.
Connecting Market Surge To Foundational Growth
While the digital asset market is vibrating with renewed excitement surrounding XRP, a prominent crypto influencer and creator on Binance and CMC, Jack, has revealed that the bulls have firmly smashed through the critical $2.55 resistance level with conviction. This decisive breakout has now set the immediate sights of traders on $2.80 and beyond.
Jack mentioned that whale activity is back, and the Open Interest (OI) is climbing steadily, while sentiment is flipping fast. If this powerful momentum holds, the next significant pit stop for XRP could be the $3.00 mark and beyond.
Ethereum price started a decent increase above $4,000. ETH is consolidating gains and could aim for more gains above the $4,220 resistance.
Ethereum started a fresh upward move above $4,000 and $4,120.
The price is trading above $4,080 and the 100-hourly Simple Moving Average.
There is a bullish trend line forming with support at $4,055 on the hourly chart of ETH/USD (data feed via Kraken).
The pair could continue to move up if it trades above $4,200.
Ethereum Price Holds Gains
Ethereum price started a steady upward move above the $3,880 zone, like Bitcoin. ETH price surpassed the $4,000 and $4,120 levels to enter a short-term positive zone.
The price even spiked above $4,200. A high was formed at $4,252 and the price is now consolidating gains. There was a minor decline below the 23.6% Fib retracement level of the recent wave from the $3,708 swing low to the $4,252 high.
Ethereum price is now trading above $4,080 and the 100-hourly Simple Moving Average. Besides, there is a bullish trend line forming with support at $4,055 on the hourly chart of ETH/USD.
On the upside, the price could face resistance near the $4,180 level. The next key resistance is near the $4,200 level. The first major resistance is near the $4,250 level. A clear move above the $4,250 resistance might send the price toward the $4,320 resistance. An upside break above the $4,320 region might call for more gains in the coming sessions. In the stated case, Ether could rise toward the $4,480 resistance zone or even $4,500 in the near term.
Another Pullback In ETH?
If Ethereum fails to clear the $4,200 resistance, it could start a fresh decline. Initial support on the downside is near the $4,080 level. The first major support sits near the $4,050 zone and the trend line.
A clear move below the $4,050 support might push the price toward the $3,980 support or the 50% Fib retracement level of the recent wave from the $3,708 swing low to the $4,252 high. Any more losses might send the price toward the $3,840 region in the near term. The next key support sits at $3,780.
Technical Indicators
Hourly MACD – The MACD for ETH/USD is losing momentum in the bullish zone.
Hourly RSI – The RSI for ETH/USD is now below the 50 zone.
Bitcoin edged higher on Sunday as signs of easing US-China trade tensions lifted risk assets, while Strategy’s founder hinted the company kept adding to its Bitcoin holdings.
Strategy Keeps Buying
Michael Saylor posted a chart on October 26 that uses orange dots to mark recent purchases. The visual cue has become his shorthand for new buys.
Based on reports, Strategy added 387 BTC between October 13 and October 20, bringing its total to 640,418 BTC. That number is striking on its own. It shows a steady, deliberate approach to buying even when prices are volatile.
Strategy’s disclosed average cost for its Bitcoin stands at $74,010. The company’s moves lately have been small compared with September, when it took in more than 7,000 BTC across several large transactions. The size of any fresh purchases this week has not been publicly revealed.
At the same time, Bitcoin’s market moves were influenced by broader news. The price of Bitcoin rose about 1.6% on Sunday, while Ethereum gained roughly 2.8%. Short-term swings appear driven more by headlines than by a single company’s actions.
Based on reports, at prices a little over $115,000 per BTC, Strategy’s Bitcoin stash is valued at around $72 billion. That valuation implies a paper gain of more than $25 billion over a total cost basis of about $47.4 billion since the program began in 2020.
Reports have logged 83 separate purchase events in that time, a pattern that has left investors with a clear view of the firm’s playbook: buy repeatedly and report afterward.
Some of the buying was concentrated in September, when the firm added thousands of coins in a few large moves. Recently, however, allocations have looked smaller and more frequent. That shift suggests a preference for steady accumulation rather than single big bets.
Buying Behavior And Market Response
Strategy shares have been trading above the company’s net asset value. That fact suggests investors are comfortable owning MSTR as a way to gain Bitcoin exposure without buying the token directly. The company’s method — announce purchases after the fact and let the market reflect the holdings — has been consistent and predictable.
Geopolitical Headlines Drive Volatility
Meanwhile, officials from the US and China signaled progress in trade talks, and that helped calm some investors. According to reports, Scott Bessent told CBS News he expected the threat of 100% tariffs and an immediate export control regime to have receded.
Earlier in October, China announced tighter limits on rare earth exports used in chip manufacturing. On October 11, US President Donald Trump said he would impose an additional 100% tariff on Chinese goods and planned export controls on certain software to take effect on November 1.
Those days of sharp rhetoric caused heavy losses across markets and triggered one of the largest liquidation events in crypto this year.
Featured image from Gemini, chart from TradingView
Bitcoin price is consolidating gains above $113,500. BTC could rise further if there is a clear move above the $115,750 resistance.
Bitcoin started a fresh upward move above the $114,000 resistance level.
The price is trading above $114,200 and the 100 hourly Simple moving average.
There is a bullish trend line forming with support at $113,900 on the hourly chart of the BTC/USD pair (data feed from Kraken).
The pair might continue to move up if it trades above the $115,750 zone.
Bitcoin Price Starts Consolidation
Bitcoin price formed a base and started a fresh increase above the $112,500 zone. BTC gained pace for a move above the main hurdle at $113,500.
It opened the doors for a move above $115,000 and the 100 hourly Simple moving average. Finally, the price spiked above $116,000 and is currently consolidating gains above the 23.6% Fib retracement level of the recent wave from the $106,718 swing low to the $116,309 high.
Besides, there is a bullish trend line forming with support at $113,900 on the hourly chart of the BTC/USD pair. Bitcoin is now trading above $114,000 and the 100 hourly Simple moving average.
Immediate resistance on the upside is near the $115,000 level. The first key resistance is near the $115,500 level. The next resistance could be $115,750. A close above the $115,750 resistance might send the price further higher. In the stated case, the price could rise and test the $116,300 resistance. Any more gains might send the price toward the $117,500 level. The next barrier for the bulls could be $118,000.
Another Pullback In BTC?
If Bitcoin fails to rise above the $115,500 resistance zone, it could start a fresh decline. Immediate support is near the $114,000 level. The first major support is near the $113,500 level or the trend line.
The next support is now near the $111,000 zone. Any more losses might send the price toward the $110,500 support in the near term. The main support sits at $108,500, below which BTC might struggle to recover in the short term.
Technical indicators:
Hourly MACD – The MACD is now gaining pace in the bullish zone.
Hourly RSI (Relative Strength Index) – The RSI for BTC/USD is now above the 50 level.
Major Support Levels – $114,000, followed by $113,500.
Data shows cryptocurrency short investors have suffered large liquidations during the past day as Bitcoin and altcoins have made a recovery.
Bitcoin, Ethereum Have Surged In The Last 24 Hours
Bitcoin and other cryptocurrencies have witnessed a rally during the past day, breaking away from the slump the market had earlier fallen into. At the height of this surge, Bitcoin broke past $116,000, while Ethereum touched $4,250.
The assets have since seen a small retracement. The chart below shows how BTC’s latest trajectory has looked.
At its current price of $115,400, Bitcoin is up about 4% on the weekly timeframe. Similarly, Ethereum at $4,160 is in a profit of 3.4%. Most other digital assets have seen similarly positive returns, although there are some outliers like Tron, which is down more than 7%. The market-wide recovery during the past day has meant that a large amount of short liquidations have piled up on the derivatives exchanges.
Crypto Market Liquidations Have Totaled At $467 Million
According to data from CoinGlass, about $467 million in cryptocurrency-related derivatives contracts have been liquidated over the last 24 hours. A contract is said to be “liquidated” when its platform forcibly shuts it down after it accumulates losses of a certain degree (as defined by the exchange).
Given that coins across the board have rebounded, the contracts crossing this threshold would mostly be the short ones. And indeed, the data would confirm so.
As is visible above, liquidations related to bearish cryptocurrency bets have reached $358 million in this window, representing 76.6% of the total flush in the sector. Bitcoin led the liquidations with $177 million in contracts involved, while Ethereum contributed the second most with $130 million in contracts. Out of the rest, Solana witnessed the largest flush at $34 million.
In some other news, Bitcoin spot exchange-traded funds (ETFs) have observed a notable amount of inflows over the past month, as CryptoQuant community analyst Maartunn has pointed out in an X post.
Spot ETFs refer to investment vehicles that allow investors to gain exposure to an asset without having to directly own it. The US SEC approved BTC spot ETFs in January of 2024. Here is the chart shared by the analyst that shows how the 30-day netflow for these vehicles has fluctuated since:
As displayed in the above graph, Bitcoin spot ETFs have seen inflows of $4.7 billion during the past month. Ethereum spot ETFs, which gained approval in mid-2024, have also enjoyed inflows in this period, although their value of $983 million is significantly less than BTC’s.
Bitcoin’s recent liquidity flush has stirred volatility across the market, leaving traders cautious as Ethereum shows signs of a potential recovery. While BTC struggles to stabilize after clearing key liquidity levels, ETH is attempting to reclaim crucial resistance, setting the stage for what could be the next major directional move in the crypto market.
Market Weakness Persists After $116,000 Liquidity Sweep
Can Özsüer, in his latest BTC 1H Current Chart update shared on X, highlighted that the hourly chart of Bitcoin shows little to no bullish reflection at the moment. He pointed out that market sentiment has weakened, particularly after the $116,000 liquidity zone was cleared, which further dampened the outlook across the broader crypto market.
According to Özsüer, the overall setup remains fragile, and taking scalp long positions in such conditions could be risky until a clearer reversal structure begins to form. Özsüer identified the $111,000 level as a potential zone for an initial reaction buy, suggesting that some short-term support could emerge around this point. However, he cautioned that if this level fails to hold, Bitcoin could experience a sharper decline toward the trendline support near $109,000.
He further advised that traders should construct their strategies carefully, focusing on the zones within what he referred to as “box number 1.” This area could provide a technical framework for identifying potential entry points and managing risk effectively.
To conclude, Özsüer noted that the cleanest and safest approach would be to align trading plans around optimal price levels while ensuring that positions remain protected above the defined support structure.
Bullish Momentum Builds If $4,200 Is Reclaimed
While Bitcoin faces a potential drawdown, crypto analyst Ted Pillows revealed that ETH is currently engaged in a critical fight to reclaim the $4,200 resistance zone. The success of this immediate technical battle is crucial, as it will determine the asset’s trajectory in the days to come.
Ted pillows outlined the condition for a continuation of the rally; if Ethereum is able to decisively reclaim and hold the $4,200 level, traders should “expect more bullish continuation.” Conquering this resistance would likely signal a clear path to the next higher price targets.
Conversely, should ETH fail to secure the $4,200 zone, the price will likely retreat. The analyst predicts that this failure would trigger a necessary retest of the $4,000 level before the market can attempt any further upward moves, indicating that $4,000 acts as the crucial defense line against a deeper correction.
Zcash (ZEC) has exploded in value past $350, clearing its 2021 high and igniting a wave of renewed optimism across the digital assets ecosystem. A surge in demand tied to privacy, cross-chain integration and bold market calls are pushing ZEC into the spotlight.
Rally Driven by Privacy Narrative and Major Price Call
Zcash’s recent rally is nothing short of dramatic. In the past month, ZEC’s price surged roughly 380 % and smashed through its May 2021 closing level of around US$319.
This breakout has drawn fresh attention to the coin’s core value proposition, transaction anonymity, at a time when regulatory scrutiny and surveillance concerns are rising globally.
Adding fuel to the fire, Arthur Hayes, co-founder and former CEO of BitMEX, publicly predicted that ZEC could ultimately reach US$10,000. Markets responded swiftly; within 24 hours of Hayes’s “vibe check” post on X, ZEC jumped over 30 %. The privacy-coin resurgence appears well underway.
Meanwhile, technical analysts argue the rise is more than hype. ZEC’s chart now showcases breakout patterns, rising volumes, and a shift in smart-money positioning. However, caution remains. Many analysts note that although the price is reflecting a strong narrative, actual usage of shielded transactions remains limited.
Zcash (ZEC) Ecosystem Integrations Add Strength
Behind the price action lies concrete ecosystem development. Zcash integration into other chains, such as its wrapped version on Solana, is reviving interest, while new solutions seek to restore ZEC’s full privacy features across cross-chain networks.
For example, the project Encifher is enabling encrypted versions of ZEC (eZEC) using fully homomorphic encryption on Solana so that users can transact privately while still engaging with DeFi.
Other catalysts include the anticipated halving event, which is due to cut miner rewards in mid-November, tightening supply. Added to that, institutional frameworks such as the debut of a trust vehicle for ZEC are reportedly expanding exposure. All told, these structural shifts support the narrative.
Nevertheless, even with infrastructure rising, the risk remains that price is racing ahead of real adoption. Analysts warn of a “sell the news” scenario if new integrations or usage metrics fail to materialize.
Cover image from ChatGPT, ZECUSD chart from Tradingview
Bitcoin (BTC) is showing renewed strength, reclaiming the $115,000 level after weeks of volatility and uncertainty. Bulls are attempting to build momentum for a potential impulse move higher, aiming to confirm a sustained bullish structure after the recent consolidation phase.
On-chain data continues to reveal a clear and repeating pattern tied to investor behavior and market cycles. Historically, when the percentage of Bitcoin supply in profit climbs above 95%, the market tends to enter an overheated phase, often leading to sharp corrections. These pullbacks serve as natural cooling periods, resetting sentiment and liquidity before the next major leg up.
Interestingly, each correction cycle has shown consistent bottoming zones around the 75% threshold, where long-term holders reaccumulate and market confidence begins to rebuild. More specifically, data highlights profit supply lows of 73% in September 2024, 76% in April 2024, and a recent rebound from 81%, signaling a potential mid-cycle recovery phase.
Bitcoin Supply in Profit Rises to 83.6% — Momentum Rebuilds Ahead of Key Threshold
According to top analyst Darkfost, the percentage of Bitcoin supply in profit has started to climb again, currently standing at 83.6%. This steady rise indicates that a growing share of Bitcoin holders are once again sitting on unrealized gains — a trend that often reflects improving sentiment and renewed market confidence.
Darkfost notes that this level can be interpreted as encouraging, suggesting that investors are willing to hold their BTC instead of realizing profits, anticipating further upside in the near term. Historically, such behavior has been characteristic of mid-cycle recovery phases, when fear starts to fade and accumulation resumes across both retail and institutional segments.
This stage of the cycle is considered healthy for rebuilding momentum, as it allows the market to stabilize after large corrections. Holders who previously capitulated often reenter at this stage, while long-term participants strengthen their positions, creating a more resilient market structure.
However, Darkfost cautions that once the supply in profit surpasses 95%, it typically signals overheated market conditions — a point where euphoria tends to replace rational conviction. In such phases, Bitcoin historically faces increased volatility and sharp corrections as overleveraged traders and short-term speculators take profits.
Bitcoin (BTC) is showing renewed bullish momentum, trading around $115,443 and successfully reclaiming key short-term support levels after weeks of consolidation. The daily chart highlights a strong recovery structure, with BTC breaking above both the 50-day and 100-day moving averages, signaling a shift in short-term market sentiment.
The next critical test lies at $117,500, a historical resistance zone that previously rejected multiple attempts in September and early October. A clear breakout and daily close above this level would likely confirm an impulse continuation toward $120K–$125K, opening the door for a more sustained uptrend.
Momentum indicators suggest strengthening buying pressure, while the recent bounce from the 200-day moving average near $107K underscores the market’s resilience. This level acted as a springboard for the current rally, aligning with the broader pattern of accumulation seen on-chain, where investor profitability is rising steadily.
However, BTC remains within a range-bound structure, and rejection at $117.5K could trigger short-term consolidation back toward $111K–$112K. Overall, Bitcoin’s technical outlook appears constructive — if the bulls can sustain above $115K and confirm strength above $117.5K, the market could transition into a new bullish leg, supported by improving investor sentiment and on-chain health.
Featured image from ChatGPT, chart from TradingView.com
The Bitcoin price is positioning for a potentially explosive move that could take it well beyond its previous all-time highs. Analysts are closely watching a critical resistance level near $116,000, which may serve as the final hurdle before BTC catapults into uncharted territory above $126,000.
Analyst Predicts New Bitcoin Price All-Time High
Crypto analyst Donny Dicey revealed in an X social media post this week that the $116,000 price level is the decisive zone Bitcoin must breach to confirm a breakout toward a new all-time high. His technical analysis suggests that once BTC achieves a clean break above this resistance area, momentum could swiftly carry it above $126,000.
Notably, Bitcoin set a new ATH on October 6, 2025, after breaking through its previous record above $124,000 and climbing past $126,000. Since achieving this level, the price of BTC has fallen dramatically to $115,000. Dicey’s accompanying chart shows the market steadily recovering after testing support near $108,000, marked as a “market structure break” region, with bullish price action consolidating above $109,000.
The analyst has emphasized that each day Bitcoin maintains a close above $109,000 strengthens the probability of a strong upward swing as the market heads into November. This period coincides with the Federal Open Market Committee’s (FOMC) next meeting, where investors are anticipating dovish signals such as rate cuts or the formal end of Quantitative Tightening (QT).
Dicey also notes that bullish S&P 500 earnings, easing global trade tensions from a potential agreement between US President Donald Trump and China’s President Xi Jinping, and improving ISM manufacturing data point to a macro environment supportive of risk assets. A community member commented that whales may have underestimated how much BTC’s demand tends to persist during these conditions. Dicey responded that the same whales might become “exit liquidity” as Bitcoin accelerates higher, possibly missing out on the strongest phase of this cycle.
Consolidation Above January Highs Signal Unbreakable Strength
In a follow-up analysis, Dicey highlighted Bitcoin’s remarkable stability above its January highs, describing its price structure as “unbreakable” amid global macroeconomic uncertainty. He pointed to several converging factors that reinforce BTC’s resilience, including ongoing fiscal and monetary expansion, a weakening US dollar, and renewed confidence in the global business cycle.
The analyst also emphasized that geopolitical tensions tied to US-China relations appear to be subsiding. At the same time, ETF inflows and exponential growth in the Artificial Intelligence (AI) sector contribute to acting as tailwinds for digital assets. He disclosed that despite strong underlying fundamentals, skepticism remains widespread in the market.
According to him, many still believe in the traditional four-year cycle narrative, while retail enthusiasm has not fully returned. Furthermore, the Russell 2000 index has yet to breakout, and rotation from traditional assets, such as the S&P 500 and gold, into Bitcoin remains limited. With these developments subduing broader market participation, Dicey suggests it creates the perfect setup for a powerful rally in BTC once sentiment shifts decisively.
After months of growing uncertainty and anticipation, the debut of exchange-traded funds (ETFs) for Hedera (HBAR) and Litecoin (LTC) is set to commence tomorrow, as confirmed by Canary Capital’s CEO Steven McClurg on Monday.
Hedera And Litecoin ETF Launches Imminent
Crypto reporter Eleanor Terret shared the news on X (formerly Twitter), revealing that the ETF launches for Litecoin and Hedera are imminent, with a statement from McClurg underscoring the excitement for the upcoming launch.
Notably, the New York Stock Exchange (NYSE) has also made significant moves in the ETF sector by certifying 8-A filings and issuing listing notices for Bitwise Invest’s spot Solana (SOL) ETF launch tomorrow and Grayscale’s GSOL conversion slated for Wednesday.
Despite the ongoing government shutdown, these ETF debuts are proceeding smoothly, Terret confirmed. The legal processes behind ETF launches, including the crucial 8-A filings, have been completed successfully, paving the way for the launch of these investment vehicles.
ETF Listings Confirmed
Addressing concerns about Securities and Exchange Commission (SEC) approval during the shutdown, a key detail emerged: the issuers strategically included provisions in their amended S-1 filings, enabling automatic effectiveness 20 days post-filing. This ensures a seamless transition to trading without manual SEC approval.
Bloomberg’s ETF expert, Eric Balchunas, further corroborated this development on social media, confirming the listing notices for Bitwise, Canary, to launch imminently, with grayscale Solana’s conversion scheduled shortly after. Balchunas stated, “Assuming there’s not some last min SEC intervention, looks like this is happening.”
The news has sparked a recovery in HBAR and LTC prices. Litecoin has regained the key $100 mark with a 2% surge in the 24-hour time frame, while Hedera has seen similar gains of 2.1% during the same period.
Featured image from DALL-E, chart from TradingView.com
XRP is staging a remarkable rebound, rising from early October lows of $1.77 to over $2.60, even as the U.S. Securities and Exchange Commission (SEC) prolongs its review of pending XRP ETF filings.
The delays have sparked mixed market sentiment, yet XRP’s trading volume and technical setup indicate growing bullish momentum. Over the weekend, XRP surged to $2.68, breaking critical resistance at $2.63 on a 147% volume spike, one of the largest in recent months.
This explosive move coincided with renewed optimism following Ripple’s strategic acquisitions, including the integration of Ripple Prime and GTreasury, which CEO Brad Garlinghouse said place XRP “at the center of everything Ripple does.”
Technical Indicators Strengthen the Bullish Outlook
From a technical perspective, XRP’s chart paints a clear bullish picture. The token has moved firmly above both its 50-day and 200-day exponential moving averages (EMAs), key indicators of trend continuation.
It has also formed an inverse head-and-shoulders pattern, historically signaling potential for higher highs. The Relative Strength Index (RSI) remains near 70, showing strong demand despite slightly overbought conditions.
Analysts expect a confirmed breakout above $2.70 to set the stage for XRP to reach the $2.90–$3.00 range in the near term. Momentum indicators such as the True Strength Index (TSI) and rising open interest in CME XRP futures, which recently crossed $27 billion in notional volume, reinforce this bullish outlook.
However, traders are watching the $2.54–$2.58 support zone closely. A drop below this range could weaken momentum and invite short-term corrections.
Institutional Flows Signal Confidence in XRP’s Future
While ETF delays have briefly dented sentiment, institutional accumulation around XRP remains strong. The token’s rapid integration into U.S.-listed ETFs, expanding derivatives markets, and corporate adoption, including Evernorth’s treasury allocation, underscore growing confidence in Ripple’s long-term fundamentals.
Institutional demand continues to accelerate through vehicles like the REX-Osprey XRP ETF, which recently surpassed $100 million in assets under management, placing XRP as a mainstream financial instrument rather than a speculative token.
With global crypto market capitalization hovering near $3.8 trillion and the Federal Reserve’s upcoming rate decision expected to ease liquidity constraints, analysts believe XRP could outperform peers in the next leg of the bull cycle.
If buying pressure holds above $2.70, the $2.90 breakout target may only mark the beginning of a broader rally, one that cements XRP’s role at the heart of institutional digital finance.
Japan has officially stepped into the regulated stablecoin era with the launch of JPYC EX, the country’s first fully licensed digital yen under the revised Payment Services Act. This milestone marks a pivotal moment for Japan’s financial sector, bridging traditional banking infrastructure with the Web3 ecosystem.
Building on earlier versions of JPYC, the new JPYC EX is designed to serve as a compliant, yen-backed stablecoin connecting the nation’s banking system to blockchain-based commerce, DeFi applications, and cross-border payments. With full legal authorization and asset backing, it positions the yen as a future cornerstone in global digital finance.
According to CryptoQuant, the total stablecoin market capitalization has now surpassed $150 billion, forming the backbone of liquidity for crypto markets, DeFi protocols, and global payments. Analysts from Citi and Bloomberg project that this figure could expand to between $1.6 and $4 trillion by 2030. Within that rapid growth, JPYC is forecasted to capture roughly 2% of the market, reaching a valuation of around $70 billion.
A Fully Regulated Digital Yen Bridging Japan’s Finance and Web3
What distinguishes JPYC EX from other stablecoins is its combination of regulatory clarity, asset backing, and technical versatility. Domestic bank deposits and Japanese government bonds fully collateralize each token, ensuring complete transparency and stability. This structure makes JPYC EX one of the world’s most legally robust stablecoins. A benchmark for compliance-driven innovation in digital finance.
Built on Ethereum, Polygon, and Avalanche, JPYC EX provides instant yen transfers with near-zero fees. Making it a practical tool for businesses and individuals alike. It supports commerce, payroll, peer-to-peer payments, and DeFi applications, offering the efficiency of blockchain without sacrificing legal or operational safeguards.
JPYC EX also aligns closely with Japan’s digital transformation strategy, which aims to merge traditional finance with emerging Web3 systems. By serving as a settlement layer for e-commerce platforms, NFT marketplaces, and cross-border transactions, the stablecoin enables instant yen transfers across Asia, lowering costs and increasing accessibility for international trade.
Looking ahead, analysts forecast JPYC’s market capitalization could reach $70 billion by 2030. It represents roughly 2% of the global stablecoin market. This growth potential underscores Japan’s ambition to establish the digital yen as a key pillar of the decentralized global economy. With its blend of regulatory trust, technological precision, and global reach, JPYC EX may redefine how national currencies operate in the Web3 era.
Stablecoin Dominance Shows a Cooling Phase After Recent Surge
The chart shows that stablecoin market dominance currently sits around 8.31%, following a sharp rise earlier in October that pushed the ratio above 9%. This level often signals heightened demand for liquidity and safety, as traders move capital into stable assets amid market uncertainty.
Over the past few months, dominance has steadily climbed from the 7.3%–7.5% range, reflecting a cautious sentiment as Bitcoin and major altcoins face selling pressure. However, the recent pullback suggests that some funds are beginning to rotate back into risk assets, a potential early sign of market stabilization.
Technically, the dominance remains above both the 50-day and 200-day moving averages, indicating a broader uptrend in liquidity positioning. If this level holds, it may serve as a buffer during continued volatility. Conversely, a sustained drop below 8% could signal that traders are redeploying capital into crypto assets, possibly fueling short-term rallies.
Stablecoin dominance remains elevated — a sign that market participants still prefer holding dry powder. Until dominance begins a more decisive decline, this cautious stance will likely persist, underscoring the market’s fragile balance between risk-off sentiment and the readiness for re-entry into volatile assets.
Featured image from ChatGPT, chart from TradingView.com
Investor sentiment, as shown by trading volume and flows on exchanges, has turned optimistic amidst the recovery. Now that Ethereum’s price action is starting to turn bullish again, a new technical analysis shared by crypto analyst Freedomby40 on the social media platform X suggests that the current rally could be far from over, projecting a possible long-term climb to $16,000.
Wave Count Structure Points To A Continuation Phase
Freedomby40’s analysis, which is based on the Elliott Wave structure, presents Ethereum as currently positioned in an extended bullish sequence that began forming in late 2022. Posting the technical analysis on X, the analyst noted that Ethereum’s price action looks great for a continuation.
His chart shows that the asset has just completed a corrective phase and is entering a renewed impulse wave, with support established between $3,225 and $3,563 at the 0.5 and 0.382 Fibonacci retracement zones, respectively. The analyst labels this zone as the ideal accumulation area for the next leg up, consistent with previous cycle structures seen in 2017 and 2021.
The Elliott Wave projection in his analysis presents a multi-layered confluence of impulse waves extending to the third degree. It illustrates that Ethereum is currently unfolding its fifth major impulse wave in a structure that traces back to mid-2022.
The internal structure of this wave sequence also reveals a C wave in motion, which itself contains smaller sub-impulse waves. Within that C wave, Ethereum appears to be entering its own fifth sub-wave, which is known to be a decisively bullish wave.
Based on this setup, the analyst outlined two potential target zones on the chart: a green box representing the realistic price range for this wave cycle and a red box depicting the higher, more extended scenario that could push Ethereum’s market cap into the trillion-dollar level.
Fibonacci Extensions Predict Targets Of $9,000, $11,000, And $16,000
Freedomby40’s analysis identifies multiple price levels based on Fibonacci extensions from the current price action. The first price target is at $6,303, which is based on the 1.0 Fibonacci extension. This initial price target will see the Ethereum price break above its current all-time high, but this is the first of many.
The next target, the 1.236 extension, is positioned around $9,013. These two price targets ($6,303 and $9,013) were described by the analyst as very realistic. Possible extensions are at the 1.382 and 1.618 Fibonacci extension levels, corresponding to $11,210 and $16,077, respectively.
At the time of writing, Ethereum is trading at $4,160, up by 5.2% in the past 24 hours. Freedomby40’s outlook joins a growing list of ultra-bullish Ethereum price forecasts from institutional research desks and top analysts. Standard Chartered Bank recently raised its 2025 price target for Ethereum to $7,500, while projecting a potential long-term path to $25,000 by 2028.
Crypto analyst Bobby A is warning that the XRP price may face trouble soon. He says the large monthly chart is showing weak signs, and this could mean the market is turning bearish again. The analyst thinks the price might need to drop further before it can move higher.
Bearish Signals Showing On The XRP Price Monthly Chart
Bobby A says the big XRP chart does not look healthy right now. He explains that many important monthly indicators are crossing bearishly. He says XRP is trading below the 1.618 level, and the price action there looks like a rejection rather than a breakout. He thinks this rejection is happening at a terrible time for XRP, noting that the monthly candle is closing near the BMSB line, another dangerous sign for the price.
Bobby A reminds traders that when the Bressert indicator crosses bearish on the monthly chart, history shows it has never been good for XRP. He believes that history could repeat itself, and these bearish signals are evident on the chart right now, suggesting the mid-term trend may not be strong. His analysis says that in six days, XRP will be facing the monthly candle close again, and facing it while price action is weak is usually not a good sign. He is worried because the chart’s overall structure shows more weakness than strength at this time.
He explains that when a chart shows this kind of technical damage, the smart move is to stay alert. He says traders must focus on risk control during times when the big charts start to flash warning signs. He shares this because he has trusted his chart study before when XRP was under $0.30, and now he needs to trust what he sees again with XRP above $2. He says the market can change very fast, and traders must be ready for those changes.
XRP May Drop To Lower Support Before Moving Up Again
Right now, XRP is already making a small move downward. Bobby A says this retracement is happening in real time. He warns that XRP could roll over again and retest lower price support levels. If this happens, the token price could fall under $1 to find more substantial support before it tries to recover. He believes there is a real and present risk that the price will crash below $1 if sellers keep pushing it down.
He advises traders to protect their money and manage their trades carefully. He says capital safety must come first in times like these. Even though he still believes in XRP’s long-term future and remains a strong supporter of the project, he feels the odds right now point to lower prices in the mid-term. He says this is because the latest market signs are not strong enough to support a big bullish move yet.
Popular technician Charting Guy (@ChartingGuy) calls Shiba Inu “weak and choppy” and suggests the token may not break out until late in the current crypto cycle. Sharing a weekly Shiba Inu chart, he wrote on Oct. 26, 2025: “SHIB has been weak and choppy all cycle. Won’t do anything until the end imo.”
How High Can Shiba Inu Price Go?
The below TradingView chart is a weekly SHIB/USD study anchored to a Fibonacci ladder. The price marker on the right rail reads $0.000010205, placing SHIB fractionally below the 0.236 retracement band annotated at $0.000011043.
Above that, the chart maps successive overhead levels at 0.382 near $0.000016434, 0.5 around $0.000022661, 0.618 near $0.000031247 and 0.786 at about $0.000049369. The red 1 line flags $0.000088410, with higher extension markers plotted at 1.272 ≈ $0.000185406, 1.414 ≈ $0.000272917 and a terminal 1.618 ≈ $0.000475605.
A stylized projection trace on the chart depicts a late-cycle, near-vertical advance that only materializes after a prolonged base and then stalls inside the 1.0–1.272 cluster before breaking above the 1.272 Fib extension and topping below the 1.414 Fib extension roughly at $0.000022; the path visually reinforces the author’s contention that SHIB underperforms until the “end.”
In a separate post on Oct. 24, Charting Guy ranked market structures across majors and large-cap altcoins, explicitly placing SHIB in his “Bad Looking Charts” bucket while labeling Bitcoin, Ether, XRP, Solana, BNB and Stellar as “Good Looking Charts.” His list read, in part: “Good Looking Charts: BTC, ETH, XRP, SOL, BNB, XLM … Decent Looking Charts: XDC, DOGE, PENGU, ADA, ONDO, SUI, AAVE, LTC … Eh Looking Charts: PEPE, FLOKI, FLR, LINK, BCH … Bad Looking Charts: SHIB, WIF, ETC, AVAX, FET, RENDER, INJ, CRV, ALGO, SOLO, COREUM, NEAR, VET, COMP, DOT, IOTA, FIL, ATOM, And many more.”
What To Expect
The technical message is unambiguous: on a weekly timeframe, SHIB remains capped beneath early Fibonacci thresholds that many chartists treat as momentum gates. Remaining below 0.236 typically signals that price has yet to reclaim even the shallowest retracement of the prior cycle; clearing it often opens room to test the 0.382–0.5 midpoint zone where trends either accelerate or fail.
In Charting Guy’s map, structurally meaningful inflection areas stack tightly from roughly $0.000016 to $0.000031, with the 0.618 level near $0.000031 attributed the role of a trend-confirmation threshold. The cycle-top roadmap he drew concentrates risk and reward into the higher cluster around $0.000088 to $0.000185, a range often watched by Fibonacci practitioners for exhaustion and distribution in late-stage moves. However, a rise to $0.00022 could still mean an incredible upside for SHIB of around 2,055.81%—a roughly 20.56-fold increase.
Contextually, his relative-strength table is just as important as the levels. By grouping SHIB with other “bad looking” structures while upgrading Bitcoin, Ether, XRP, Solana and BNB, he is signaling an expectation that market breadth will remain narrow and quality-led before any speculative rotation into meme-beta like SHIB. That framework aligns with his succinct call that SHIB “won’t do anything until the end,” implying a sequencing view rather than a categorical dismissal.
What to Know: Kraken’s Q3 report shows a massive 114% year-over-year revenue jump, signaling explosive growth and renewed investor confidence.
The exchange’s strategic acquisitions and xStocks innovation have positioned it as a serious contender to Coinbase and Binance.
If you’re hunting for the best altcoins to buy, consider watching low-cap gems like $PEPENODE, $BEST, and $AURA.
In a year that has been a bit topsy-turvy for the cryptocurrency markets, firms like Kraken are proof that the industry’s bottom line is getting stronger and stronger.
Kraken recorded a 50% surge in revenue quarter-over-quarter and a 114% jump year-over-year.
Trading volumes on Kraken reached a mind-boggling $561.9B, marking a 23% increase from the previous quarter.
It now holds a total of $59.3B worth of assets, putting it in contention with Coinbase and Binance as one of the best crypto exchanges on the market.
It’s essential to recognize that Kraken’s phenomenal growth hasn’t occurred simply because the broader industry is expanding – other firms haven’t experienced a similar increase in growth.
Kraken has clearly done something extraordinary to attract such large numbers.
First, this year, Kraken announced several major acquisitions, including NinjaTrader and Small Exchange, which have made it a go-to name in the derivatives trading space, giving it direct market access in the U.S.
One of its most notable innovations has been the xStocks platform, which allows investors in more than 160 countries to trade tokenized versions of U.S. equities – and that too without middlemen or market-hour restrictions.
Given that it blends Wall Street and Web3 in a never-before-seen manner, it’s no surprise that xStocks has racked up over $5B in trading volume in just a few months.
So, what’s next for Kraken? Well, an IPO seems like the most obvious answer. Earlier this year, the company raised $500M at a $15B valuation.
And if reports are to be believed, it could be eyeing another funding round – this time at around $20B.
As for the potential IPO timeline, 2026 appears to be the most likely candidate. If it does go through, Kraken would join the likes of Coinbase, Gemini, and Bullish as crypto exchanges that have gone public.
All in all, the growth of a major firm like Kraken is a telltale sign of increased footfall in crypto – and of its growing acknowledgment as a legitimate trading and investing avenue.
If you want to ride the gravy train that is crypto and make some chunky gains along the way, consider investing in low-cap, high-upside tokens.
1. PEPENODE ($PEPENODE) – Virtual Crypto Mining with Real Rewards
PEPENODE ($PEPENODE) is a unique mine-to-earn cryptocurrency project offering everyday investors an inexpensive and straightforward way to scratch their crypto mining itch – and earn real rewards, too.
While real-world crypto mining requires a massive upfront investment, maintenance costs, and technical expertise to build and maintain the setup, virtual crypto mining with PEPENODE is not only affordable but also accessible to beginners, making it inclusive, fun, and engaging.
You start with an empty virtual server room, which you get as soon as you buy your first $PEPENODE tokens. From there, it’s up to you to fill this room with any combination of meme nodes you like.
Of course, these nodes differ in efficiency and mining capability, so you’ll have to put your smarts to work to create the perfect mining setup.
Oh, and remember that you’ll be competing with other $PEPENODE holders and miners, as rewards will be distributed based on the final leaderboard. So, the better your mining rig, the more rewards you’ll earn.
Speaking of rewards, these will include free $PEPENODE, $PEPE, and $FARTCOIN tokens, and they’ll be distributed after PEPENODE’s Token Generation Event (TGE) completes and its virtual mining simulator goes live.
Currently in presale, PEPENODE has already raised over $1.95M from early investors, with each token available for just $0.0011183.
According to our PEPENODE price prediction, the token could reach $0.0077 by the end of 2026, so a $100 investment today could turn into $700 in just a few months.
2. Best Wallet Token ($BEST) – Powering a Secure & Easy-to-Use Free Crypto Wallet
Best Wallet Token ($BEST) is the native cryptocurrency of Best Wallet, a free-to-use cryptocurrency wallet that offers a robust blend of security and ease of use.
First things first, since it’s a non-custodial crypto wallet, Best Wallet never hands over your private keys to anyone but you, ensuring airtight privacy for your funds.
It also comes equipped with class-leading encryption technology, two-factor authentication (2FA) including biometric login, and robust safeguards against hackers, scams, and phishing websites.
In terms of convenience, Best Wallet stands out as the only crypto wallet on the market that allows you to buy the best crypto presales directly within the app.
Its ‘Upcoming Tokens’ section lists all of the best new cryptocurrency projects in one place, meaning you no longer have to scour the internet for the next moonshot opportunity.
Compare this to traditional crypto wallets that force you to visit external presale sites, connect your wallet, and authorize transactions – all while wondering whether those sites are legitimate.
In contrast, every token listed in Best Wallet’s Upcoming Tokens section is vetted first-hand by the internal Best Wallet team.
Best Wallet is well-positioned to capture over 40% of the non-custodial wallet market by 2027, and you can ride this growth by buying $BEST.
Based on our $BEST price prediction, the token could soar up to 170% by the end of 2030, potentially reaching $0.07.
Currently, one $BEST is available for just $0.025855, and the project has already raised over $16.6M in its ongoing presale.
Buy $BEST today – and unlock voting rights, reduced fees, a 79% staking APY.
3. Aura ($AURA) – Viral Meme Coin Poised for More Returns
If you want to maximize your returns from an altcoin run, it could be worth including a top-trending crypto like Aura ($AURA) in your portfolio.
As the name suggests, the $AURA token is based on the wildly popular internet phenomenon of ‘Aura points,’ which, simply put, represent how much charisma you gain or lose through a particular action.
For instance, if you’re playing football with your friends and happen to score a free kick from near the halfway line, you’d gain infinite Aura points.
Sounds absurd, right? Well, it is, and that’s precisely why $AURA has gained so much traction among meme coin investors.
In June 2025, $AURA skyrocketed over 28,000%, and while the token has traded sideways since then, it has now found strong support around the $0.05 level.
On the charts, it’s currently on the cusp of breaking out of a neat descending triangle pattern, which could send the token back to its all-time high of around $0.24 – meaning a potential 160% gain could be on the cards if you get in now.
Recap: With Kraken’s explosive growth signaling a stronger crypto market, now’s the perfect time to load up on PEPENODE ($PEPENODE), Best Wallet Token ($BEST), and Aura ($AURA) – high-upside tokens with the potential to become the next 1000x crypto.
Disclaimer: The cryptocurrency market is highly unpredictable; therefore, please invest only after conducting your own thorough research. This article is not financial advice.
Crypto analyst CryptosRus has drawn attention to the open interest reset for XRP. The analyst also explained why this development could spark a major price surge for the altcoin.
XRP’s Open Interest Drops To New Lows
In an X post, CryptosRus revealed that XRP’s open interest on Binance has dropped back to the same lows that were seen in May 2025. The analyst noted that back then, the liquidation flush sparked a massive rally for the altcoin, which pushed it to $3.50. He added that this time around, the open interest is at the floor again, but the price is holding around $2.6.
CryptosRus stated that this means that leverage is gone while the strong hands are still holding XRP. The analyst predicted that if new liquidity enters, this setup could signal the next leg up for the altcoin. He added that rallies usually start when leverage is low, spot demand is strong, and shorts are trapped.
Notably, XRP has witnessed new demand with the launch of the largest XRP treasury company, Evernorth. The company has already accumulated up to $1 billion in XRP with Ripple’s backing and has revealed plans to continue accumulating more, using gains from its DeFi activities. Notably, the company stated that it will purchase XRP on the open market, which is expected to impact the altcoin’s price.
Meanwhile, the SEC is expected to approve the spot XRP ETFs once the U.S. government shutdown ends. This could drive new liquidity into the altcoin, boosting its price. Moreover, experts such as Canary Capital’s CEO Steven McClurg have predicted that the XRP ETFs could see more inflows in their first month than the Ethereum ETFs did.
XRP Is Gearing Up For A ‘Face Melting’ Rally
Crypto analyst Ether stated that XRP is quietly gearing up to melt faces and that most aren’t even aware or ready for what is coming. This came as the analyst alluded to an earlier analysis, in which he revealed that a similar scenario from a previous cycle was playing out for the altcoin.
Ethere stated that XRP’s cyclical structure is showing a striking similarity again. After the altcoin’s rally in 2017, its price was rejected from the 2013 all-time high (ATH) level and then retested the 2014 ATH level, which had previously acted as resistance. XRP then began its parabolic run after it accumulated strength in that range.
Now, this same XRP price action is playing out again, according to Ether. He noted that after the strong surge in 2024, the altcoin’s price was rejected at the 2017 ATH level and retested the 2021 ATH level, which had previously acted as resistance. The analyst added that the power accumulation phase is now underway in this region and that once it is complete, the next parabolic run will be inevitable.
At the time of writing, the XRP price is trading at around $2.63, up in the last 24 hours, according to data from CoinMarketCap.
According to market snapshots, Zcash rose about 30% in a 24-hour span, moving from roughly $272 to a peak near $355. The coin has been up more than 40% in the last week.
The token’s gain outpaced all other top 50 coins by market cap during the same window. Volume spiked at the same time, showing traders piled in quickly after a single social post touched off the move.
Influencer Posts Spark Buying
Based on reports on social media, the rally was partly driven by traders reacting to a bullish post from Arthur Hayes on X.
Contributors on platforms like Binance Square flagged the post, and one user known as AB Kuai Dong said an endorsement by what he called a “legendary Silicon Valley investor” pushed people into the market.
Another poster, Clemente, who is listed as a board member at treasury firm K9Strategy, said they joined the trade because they felt “so much FOMO I couldn’t keep myself sidelined.” These bursts of hype pushed more orders onto the books and helped lift the price in a short time.
Past Calls Have Moved Markets
Hayes has prompted market moves before. At a Tokyo conference in August 2025, he predicted Hyperliquid’s HYPE token could climb 126 times over three years.
That call produced a modest market response then — roughly a 5% uptick for HYPE — but it showed how a single forecast from a well-known figure can sway trader behavior.
Market participants say such calls sometimes lead to brief spikes and sometimes to longer trends. Follow-through, depth of liquidity, and general demand all matter.
Privacy Tokens See Renewed Interest
Reports have disclosed that Zcash rallied close to 500% over the last 30 days and crossed a $5 billion market cap on Sunday, according to CoinMarketCap data.
At the same time, Monero, the largest privacy coin by market cap, ticked up about 3.2% to trade near $345 and remains restricted on many big exchanges, highlighting differences in access and regulatory pressure.
Technical Indicators Show Choppy Momentum
According to a recent Zcash price outlook, ZEC is forecast to rise about 52% and reach $558 by November 26, 2025. Current technical indicators are flagged Bullish, while the Fear & Greed Index sat at 51, a neutral reading.
Over the past 30 days Zcash posted 19/30 green days, which is 63%, and showed 37% price volatility. Those numbers point to strong recent momentum but also to a bumpy ride. Some gains may hold if new buyers arrive and liquidity tightens; other gains could fade quickly if selling pressure appears.
Based on reports and the data above, the Zcash move highlights how social signals can trigger rapid trading flows. The numbers are eye-catching. Still, traders and observers will be watching whether demand deepens or the rally is a short-lived reaction to hype.
Featured image from Gemini, chart from TradingView
The Dogecoin weekly chart is flashing a cluster of technically constructive signals, according to crypto analyst Cantonese Cat (@cantonmeow), who published a four-panel weekly read on DOGE on Oct. 27. Price is currently hovering near $0.208 on Binance spot, and the setup he highlights pivots on four independent checks: the cycle-high anchored VWAP, Ichimoku “Katana” support, a 0.5 log-scale Fibonacci hold, and conspicuously light sell-side volume during the recent drawdown.
4 Reason To Be Bullish On Dogecoin
In his post, Cantonese Cat wrote: “Attempting to reclaim cycle high AVWAP as support. Claiming Ichimoku Tenkan + Kijun fusion (blue and red lines fused together), AKA Katana, as support so far. Holding 0.5 log fib from cycle high–cycle low as support so far. There’s been no volume so far during this downturn on multiple exchanges including Coinbase and Binance, and all it takes is just some volume to come in and we could reverse any downtrend in a hurry.”
On the anchored VWAP chart, the teal line measured from Dogecoin’s cycle peak tracks the market’s volume-weighted cost basis since the 2021 top. DOGE is pressing that band from above/at parity, attempting to convert it into support after a failed breakdown earlier this month.
On a weekly basis, closing and subsequently holding above the cycle-high AVWAP tilts risk-reward positively because it implies the marginal participant who bought since the peak is no longer underwater. Notably, the most recent weekly wick that probed below the band—printing a sharp stab toward the low-$0.09s—was retraced swiftly, with subsequent candles clustering back around ~$0.21. That rejection of lower prices right at the anchored VWAP argues against sustained distribution at current levels.
The Ichimoku frame reinforces the same idea. Tenkan-sen and Kijun-sen are fused around ~$0.2009 on the weekly (a configuration the analyst labels “Katana”), and price is currently riding that confluence as support. The cloud (Senkou span) remains red and overhead, spanning roughly the $0.24s into the ~$0.29 region, which defines the near-term supply zone that would need to be cleared on a weekly close to confirm trend resumption.
Until then, the Katana acting as a shelf at ~$0.20 is the near line in the sand; lose it decisively and the bias flips back to testing deeper supports, but sustain it and the path of least resistance shifts to re-engaging the cloud’s lower boundary.
Fibonacci context adds precision to those levels. Measured log-scale from the cycle high to the cycle low, DOGE has so far defended the 0.5 retracement at $0.19070 on multiple weekly closes.
That 50% line is the pivot of the current structure: a confirmed weekly close and acceptance below would hand momentum to bears toward the 0.382 at $0.13847, while continued defense keeps the market pointed at successive retracement ceilings overhead—the 0.618 at $0.26261, the 0.707 at $0.33430, the 0.786 at $0.41416, and the 0.886 at $0.54318—before the full retrace to the cycle high marker around $0.73995.
Price has been oscillating in a broad $0.16–$0.27 corridor for months; sitting above the 0.5 while probing the AVWAP strengthens the case that the mid-$0.20s could be revisited if buyers can reclaim momentum.
Volume is the wild card—and the fourth reason the analyst cites for optimism. The weekly histogram across multiple years shows that persistent selloffs have been accompanied by contracting volume, with downward arrows on the chart denoting successive periods of declining activity into lows.
By contrast, the last major impulsive advance in late 2024 printed the cycle’s heaviest weekly turnover. The current downturn lacks that distribution signature; bins on Coinbase and Binance have thinned rather than expanded. In market-structure terms, falling volume on pullbacks is textbook corrective behavior, and it leaves the door open for a sharp reversal if/when demand returns.
Put together, the four lenses describe a market sitting on top of a stacked support cluster: the cycle-high AVWAP roughly at the current price, the Ichimoku Katana fused near ~$0.2009, and the 0.5 log Fibonacci at $0.19070 just below. The invalidation path is clear enough—a decisive weekly loss of the $0.19 handle would expose the $0.13847 (0.382) shelf—while the upside path is equally mapped: first reclaim the lower edge of the cloud in the low-$0.20s, then test $0.26261 (0.618), with any weekly close through that level shifting focus to $0.33430 and beyond.
According to NYDIG research, Bitcoin’s price moves are driven more by the strength of the US dollar and broad liquidity conditions than by direct ties to inflation.
Greg Cipolaro, NYDIG’s global head of research, said the data show weak and inconsistent links between inflation measures and Bitcoin. That view shifts attention away from the old narrative that Bitcoin is mainly an inflation hedge.
Inflation Link Weak
Cipolaro argued that expectations for inflation are a slightly better signal than headline inflation readings, but still not a tight predictor of Bitcoin’s price.
Instead, Bitcoin and gold both tend to gain when the US dollar weakens. While gold’s inverse relation with the dollar is long established, Bitcoin’s opposite movement to the dollar is newer but visible.
Gold And Bitcoin React To Dollar Moves
Based on reports, gold has historically climbed as the dollar falls. Bitcoin is following that pattern, though its correlation is less steady than gold’s.
As Bitcoin becomes more connected with mainstream finance, NYDIG expects that its inverse relationship with the dollar will likely strengthen.
This makes sense to traders who price everything in dollars and seek alternatives when the greenback loses purchasing power.
Interest Rates And Money Supply
Cipolaro highlighted interest rates and money supply as the two major macro levers that move both gold and Bitcoin.
Lower interest rates and looser monetary policy have tended to support higher prices for these assets.
In simple terms: when borrowing costs drop and liquidity rises, Bitcoin often benefits. The note framed gold as more of a real-rate hedge, while Bitcoin is described as acting like a gauge of market liquidity — a subtle but important distinction for investors.
Illiquid Supply Drops, Selling Pressure Returns
On-chain data show signs of renewed selling. Reports say illiquid Bitcoin — coins held in long-dormant wallets — fell from 14.38 million earlier in October to 14.300 million on the 23rd of October.
That change means roughly 62,000 BTC, worth about $6.8 billion at recent prices, moved back into circulation. In the past, large inflows did exert price pressure. In January 2024, a substantial sum of coins came available that caused the price momentum to soften.
According to Glassnode data, there has been a consistent selloff from wallets holding from 0.1 to 100 BTC, and first-time buyer supply has contracted down to ~213,000 BTC.
The overall assessment from a macro perspective and on-chain metrics is not favorable. Demand from new buyers appears to be lighter, momentum traders appear to have stepped aside, and more coins are now available to trade. This combination can blunt rallies or deepen pullbacks until liquidity conditions improve or the dollar weakens.
Featured image from Gemini, chart from TradingView
Over the years, a number of indicators have emerged that have often helped to pinpoint the Bitcoin bull market peak. These indicators have been triggered in previous cycles, and their triggers have often been a signal that it was time to get out of the market, as a new bear market is underway. However, this time around, even with the Bitcoin price hitting multiple new all-time highs, none of these cycle peak indicators have been triggered, suggesting that the market top has yet to be reached.
0 Out Of 30 Bull Market Peak Indicators Triggered
The Bull Market Peak Indicator tracker on the Coinglass website follows a total of 30 indicators that follow 30 indicators that show the progress of the Bitcoin bull market toward reaching a top. Some major ones include the Bitcoin Bubble Index, the Puell Multiple, the Bitcoin Rainbow Chart, and the Altcoin Season Index, among others.
Usually, these indicators are tracked on a scale of 0-100%, with 0% meaning that it is far from being triggered and 100% showing that an indicator has been triggered. If only a few of these get to the 100% mark and are triggered, it usually doesn’t mean that the Bitcoin peak has been reached.
However, even now, not one of these indicators has been triggered. Most continue to remain quite low, while the likes of the Bitcoin dominance are high, but still have not been triggered. For there to be a definite progress toward the Bitcoin market peak, at least half of these would have to be triggered.
What This Means For Investors
Since none of the bull market peak indicators have been triggered, it means that the Bitcoin price might actually be far away from its all-time high. With the score still being 0 out of 30, it points to this being a time to hold, despite the declines that the market has suffered recently.
According to a previous report from Bitcoinist, this was the case a few months ago, and now two months later, the tracker remains the same. Thus, it could be that $126,000 is not the all-time high for Bitcoin, and that the market could end up getting an altcoin season after all.
In the case that more than half of the bull market peak indicators do get triggered, then it means that the top of the market is getting close. Once it gets to 30/30, then it signals the start of the next bear market, and this is when selling is at its highest in the market, leading to rapid price declines across the board.
Snorter Token combines meme coin appeal with real utility through its advanced Telegram-based trading bot that levels the playing field for retail traders.
Early price forecasts suggest up to 1,285% ROI by 2030, backed by strong features and exclusive holder benefits.
The presale ends in less than 7 hours, so this could be your last chance to grab $SNORT at its lowest price before it hits major exchanges.
Ever since its launch earlier this year, Snorter Token ($SNORT) has become one of the most sought-after crypto presales of 2025 – and for good reason.
Sure, its cute yet gun-trained aardvark mascot plays a big role in attracting meme coin investors, but under the hood, Snorter Token offers a potentially game-changing trading bot designed to level the playing field between everyday traders and the whales.
As a result, $SNORT continues to attract tens of thousands of dollars in investment every single day, even as it nears the end of its presale – less than 7 hours to go, so you won’t find it at the low price of $0.1083 ever again!
Challenges with Current On-Chain Meme Coin Trading
If you’re a retail participant aiming to join the meme coin mania and hopefully make some chunky profits for yourself, unfortunately, the task ahead of you is a tall one.
Also, that has nothing to do with your own experience level and everything to do with the unfair and unjust techniques used by advanced players.
Right now, big-money traders use automated sniping scripts and insider tactics to scoop up all the liquidity in newly listed meme coins, leaving little to nothing for smaller players.
And of course, we all know those initial meme coin frenzies are often the most profitable crypto rallies ever.
If that wasn’t enough, retail traders also have to watch out for rug pulls and sandwich attacks, as malicious on-chain actors are at all times after whatever little profit you do manage to make amidst all this chaos.
What’s more, you also have to constantly hop between charts, DEX dashboards, and Telegram rooms – and this when modern trading technology should be able to offer you a single, trustworthy interface.
Fortunately, there’s a solution to all that.
How Snorter Is Opening Up the Meme Coin Market to Everyone
Snorter Bot uses a purpose-built Solana routing engine to offer retail traders sub-second execution.
In simple English, this means that if you’re a Snorter Bot user, you can place buy/sell limit or stop orders well before liquidity arrives in a new meme coin.
And when it finally does, Snorter Bot takes matters into its own hands and executes your trades at lightning speed – allowing you to participate in the meme coin action in the truest sense of the word.
In addition to reducing the dominance of crypto whales, Snorter Bot also ensures you’re protected from all kinds of on-chain dangers.
It comes packed with robust safeguards against front-running, rug pulls, honeypots, and even complex sandwich attacks.
One of Snorter’s standout features, though, is its ease of use.
Since Snorter Bot operates entirely on Telegram, every single action – from placing trades to managing your crypto portfolio, and even using the copy-trading function – can be done through simple chat commands.
Speaking of the copy-trading function, it can help you earn decent profits by connecting your wallet to that of proven meme coin traders and copying their trades.
That said, you’ll admittedly be much better off using this feature as a learning tool – to see how the pros trade and then use that insight to ultimately craft a strategy of your own.
Don’t Miss the $SNORT Presale – Get in Early for Massive Gains
Snorter Bot is all set to first launch on Solana and then expand its coverage to multiple blockchains, including Ethereum, BNB, Polygon, and Base, ultimately reaching every corner of the retail meme coin trading community, no matter where they operate.
This naturally puts the spotlight on its native cryptocurrency, $SNORT (it exists as an SPL token on Solana and an ERC-20 on Ethereum), which could be the next 1000x crypto.
According to our $SNORT price prediction, the token could soar 840% by the end of 2025, potentially reaching a high of $1.02.
But if you exercise a bit of patience and hold on, you could see a whopping 1,285% ROI by the end of 2030, as $SNORT could climb to around $1.50 by then.
But it’s worth remembering that these gains are potentially only on offer for the next 7 hours, i.e., as long as the Snorter Token presale is live. Once $SNORT lists on exchanges, you might never find it at this low a price again.
Solana started a fresh increase above the $200 zone. SOL price is now consolidating above $200 and might aim for more gains above the $208 zone.
SOL price started a fresh upward move above the $188 and $195 levels against the US Dollar.
The price is now trading above $200 and the 100-hourly simple moving average.
There is a bullish trend line forming with support at $198 on the hourly chart of the SOL/USD pair (data source from Kraken).
The pair could extend gains if it clears the $208 resistance zone.
Solana Price Jumps Again Above $200
Solana price started a decent increase after it settled above the $180 zone, like Bitcoin and Ethereum. SOL climbed above the $188 level to enter a short-term positive zone.
The price even smashed the $198 resistance. The bulls were able to push the price above $200. The price is now consolidating gains above the 23.6% Fib retracement level of the recent upward move from the $177 swing low to the $204 high.
Solana is now trading above $200 and the 100-hourly simple moving average. Besides, there is a bullish trend line forming with support at $198 on the hourly chart of the SOL/USD pair.
On the upside, the price is facing resistance near the $205. The next major resistance is near the $208 level. The main resistance could be $212. A successful close above the $212 resistance zone could set the pace for another steady increase. The next key resistance is $225. Any more gains might send the price toward the $232 level.
Another Pullback In SOL?
If SOL fails to rise above the $205 resistance, it could start another decline. Initial support on the downside is near the $198 zone and the trend line. The first major support is near the $192 level and the 50% Fib retracement level of the recent upward move from the $177 swing low to the $204 high.
A break below the $192 level might send the price toward the $184 support zone. If there is a close below the $184 support, the price could decline toward the $180 support in the near term.
Technical Indicators
Hourly MACD – The MACD for SOL/USD is gaining pace in the bullish zone.
Hourly Hours RSI (Relative Strength Index) – The RSI for SOL/USD is above the 50 level.
XRP price started a fresh increase above $2.45. The price is now showing positive signs and might rise further if it clears the $2.680 resistance.
XRP price is attempting a fresh increase above the $2.50 zone.
The price is now trading above $2.50 and the 100-hourly Simple Moving Average.
There is a bullish trend line forming with support at $2.580 on the hourly chart of the XRP/USD pair (data source from Kraken).
The pair could start a fresh increase if it clears the $2.680 resistance.
XRP Price Eyes Steady Increase
XRP price formed a base above $2.320 and started a fresh increase, like Bitcoin and Ethereum. The price surpassed the $2.380 and $2.450 resistance levels.
The bulls were able to push the price above $2.50 and $2.55. A high was formed at $2.668 and the price is now consolidating gains above the 23.6% Fib retracement level of the recent wave from the $2.327 swing low to the $2.668 high.
The price is now trading below $2.50 and the 100-hourly Simple Moving Average. There is a bullish trend line forming with support at $2.580 on the hourly chart of the XRP/USD pair.
If there is a fresh upward move, the price might face resistance near the $2.660 level. The first major resistance is near the $2.680 level, above which the price could rise and test $2.750. A clear move above the $2.750 resistance might send the price toward the $2.80 resistance. Any more gains might send the price toward the $2.920 resistance. The next major hurdle for the bulls might be near $2.950.
Are Dips Supported?
If XRP fails to clear the $2.680 resistance zone, it could start a fresh decline. Initial support on the downside is near the $2.60 level. The next major support is near the $2.580 level.
If there is a downside break and a close below the $2.580 level, the price might continue to decline toward $2.50 or the 50% Fib retracement level of the recent wave from the $2.327 swing low to the $2.668 high. The next major support sits near the $2.450 zone, below which the price could continue lower toward $2.40.
Technical Indicators
Hourly MACD – The MACD for XRP/USD is now gaining pace in the bullish zone.
Hourly RSI (Relative Strength Index) – The RSI for XRP/USD is now above the 50 level.
Ethereum price started a recovery wave above $4,000. ETH is moving higher but faces a couple of key hurdles near $4,220 and $4,250.
Ethereum started a fresh recovery above $4,000 and $4,120.
The price is trading above $4,120 and the 100-hourly Simple Moving Average.
There is a bullish trend line forming with support at $4,050 on the hourly chart of ETH/USD (data feed via Kraken).
The pair could continue to move up if it trades above $4,220.
Ethereum Price Eyes Steady Gains
Ethereum price started a minor recovery wave above the $3,880 zone, like Bitcoin. ETH price surpassed the $4,000 and $4,050 levels to enter a short-term positive zone.
The price even spiked above $4,220. A high was formed at $4,225 and the price is now consolidating gains. The price is stable above the 23.6% Fib retracement level of the recent increase from the $3,708 swing low to the $4,225 high.
Ethereum price is now trading above $4,150 and the 100-hourly Simple Moving Average. Besides, there is a bullish trend line forming with support at $4,050 on the hourly chart of ETH/USD.
On the upside, the price could face resistance near the $4,220 level. The next key resistance is near the $4,250 level. The first major resistance is near the $4,320 level. A clear move above the $4,320 resistance might send the price toward the $4,450 resistance. An upside break above the $4,450 region might call for more gains in the coming sessions. In the stated case, Ether could rise toward the $4,500 resistance zone or even $4,550 in the near term.
Another Decline In ETH?
If Ethereum fails to clear the $4,220 resistance, it could start a fresh decline. Initial support on the downside is near the $4,150 level. The first major support sits near the $4,120 zone.
A clear move below the $4,120 support might push the price toward the $4,050 support. Any more losses might send the price toward the $4,000 region in the near term. The next key support sits at $3,880.
Technical Indicators
Hourly MACD – The MACD for ETH/USD is gaining momentum in the bullish zone.
Hourly RSI – The RSI for ETH/USD is now above the 50 zone.
Bitcoin price is attempting to recover above $113,500. BTC could rise further if there is a clear move above the $115,500 resistance.
Bitcoin started a fresh recovery wave above the $113,500 resistance level.
The price is trading above $114,000 and the 100 hourly Simple moving average.
There is a bullish trend line forming with support at $113,350 on the hourly chart of the BTC/USD pair (data feed from Kraken).
The pair might continue to move up if it trades above the $115,500 zone.
Bitcoin Price Starts Fresh Increase
Bitcoin price declined again below the $108,000 level. BTC tested the $106,720 zone and recently started a fresh increase. There was a move above the $112,000 resistance level.
The bulls were able to pump the price above $113,500 and the 100 hourly Simple moving average. Finally, the price spiked above $115,000 and is currently consolidating gains above the 23.6% Fib retracement level of the recent wave from the $106,718 swing low to the $115,400 high.
Besides, there is a bullish trend line forming with support at $113,350 on the hourly chart of the BTC/USD pair. Bitcoin is now trading above $114,000 and the 100 hourly Simple moving average.
Immediate resistance on the upside is near the $115,250 level. The first key resistance is near the $115,500 level. The next resistance could be $116,200. A close above the $116,200 resistance might send the price further higher. In the stated case, the price could rise and test the $117,000 resistance. Any more gains might send the price toward the $118,000 level. The next barrier for the bulls could be $118,800.
Another Pullback In BTC?
If Bitcoin fails to rise above the $115,500 resistance zone, it could start a fresh decline. Immediate support is near the $114,000 level. The first major support is near the $113,500 level or the trend line.
The next support is now near the $111,000 zone. Any more losses might send the price toward the $110,500 support in the near term. The main support sits at $108,500, below which BTC might struggle to recover in the short term.
Technical indicators:
Hourly MACD – The MACD is now gaining pace in the bullish zone.
Hourly RSI (Relative Strength Index) – The RSI for BTC/USD is now above the 50 level.
Major Support Levels – $114,000, followed by $113,500.
The XRP/BTC monthly chart has finally snapped the long diagonal that’s capped XRP since 2018, and one analyst on X thinks that shift could rewrite the pecking order. Posting under the handle X Finance Bull (XFB), the analyst argued that XRP will soon start to outperform Bitcoin.
This is because the XRP/BTC pair has not only broken out but also retested the trendline as support, and this has certified the start of a new buildup of momentum.
Retest Of A Six-Year Breakout Trendline
The mid-October flash crash that rippled through the crypto market left a visible mark on the XRP/BTC chart, creating a deep downward wick that momentarily dipped below the long-standing resistance trendline. However, as Bitcoin started to recover to above $110,000, XRP struggled to keep up and lost ground relative to Bitcoin.
Interestingly, price action shows that this move was short-lived, and XRP has started to recover against Bitcoin in recent trading sessions. As shown on the monthly candlestick timeframe chart below, the wick fell to the exact level of the breakout retest, a point where former resistance turned into new support.
This breakout occurred in late 2024/early 2025, when XRP outperformed Bitcoin for three consecutive months. From there, the XRP/Bitcoin pair was able to break out of a downward-sloping resistance trendline of lower highs spanning over six years.
Since then, however, 2025 has been characterized by more months of Bitcoin outperforming XRP than months of XRP outperforming Bitcoin, with October falling into the former group of months. Particularly, during the flash crash, the XRP/BTC pair plunged to around 0.000007 before rebounding almost immediately, a move that, according to XFB, represents the long-awaited retest of the broken trendline.
Since that retest, XRP has recovered impressively, with the pair maintaining a monthly close above the diagonal that once acted as a ceiling. This technical confirmation signals the completion of the breakout from the 2018 to 2024 downtrend that had defined XRP’s multi-year underperformance against Bitcoin. The monthly structure is now displaying the early signs of an upward shift, with the pair trading around 0.00002258 BTC.
XRP To Decouple And Outperform Bitcoin?
According to the analyst, XRP is about to undergo a rally that massively outperforms Bitcoin and melts the face of many Bitcoin maximalists. XFB’s chart outlines two target zones ahead for XRP: 0.00014688 BTC and 0.00023009 BTC. The first target corresponds to the consolidation area seen between 2018 and 2019, while the second represents a major resistance cluster from the earlier phase of XRP’s creation. If XRP/BTC rallies to those levels, it would amount to approximately a 6x and 10x gain relative to Bitcoin, respectively.
The analyst also connects the technical setup to Ripple’s growing institutional ecosystem. He pointed to Ripple Prime, GTreasury, Metaco, Standard Custody, and Rail as part of the infrastructure that’s setting up XRP as a bridge asset for global finance. These partnerships give XRP an edge heading into the coming months, as it moves into real institutional utility and starts outperforming Bitcoin.
If these developments continue, the incoming decoupling of the XRP/BTC pair could become one of the most significant events for XRP. At the time of writing, XRP is trading at $3.63, up by 3.5% in the past 24 hours.
Featured image from Unsplash, chart from TradingView
Ethereum’s largest non-exchange holders are tiptoeing back into accumulation. On-chain analytics platform Santiment reported that wallets holding between 100 and 10,000 ETH, also known as whales and sharks, have begun to rebuild positions after unloading roughly 1.36 million ETH between October 5 and 16.
Notably, the Ethereum collective holdings chart shows that nearly one-sixth of those coins have already been clawed back, as some confidence starts to return to the second-largest crypto asset.
Whales Reverse Course After Early-October Capitulation
The first half of October was highlighted by one of Ethereum’s most pronounced periods of capitulation this year. Macroeconomic fears due to US tariffs saw the Bitcoin price undergo a flash crash that dragged many altcoins to the downside. During this move, Ethereum’s price also fell very quickly, dropping from highs around $4,740 on October 7 to as low as $3,680 on October 11.
Interestingly, on-chain data shows that the selling pressure from large holders amplified this move, as the chart from Santiment shows a steep decline in their cumulative holdings from about 24.5 million ETH to roughly 22.6 million ETH. This 1.9 million ETH drop reflected clear risk-off behavior among whales and sharks, who had been net buyers since August.
However, once selling momentum began to fade, accumulation started to return. Institutional inflows started to return into Spot Ethereum ETFs, and whale/shark trades started accumulating Ethereum. Since October 16, the same cohort that contributed to the liquidation has begun adding back to their positions. Santiment noted that these holders are finally showing some signs of confidence, demonstrating an incoming extended recovery phase following the shakeout.
218,470 ETH Added In Last 7 Days
According to Santiment’s data, the collective holdings of addresses with 100 to 10,000 ETH have rebounded to approximately 23.05 million ETH after bottoming out in mid-October. A highlighted annotation on the chart shows that 218,470 ETH were accumulated in just the past week, signaling a tangible shift in on-chain behavior.
This increase represents roughly one-sixth of the coins previously dumped, a sign that major investors are gradually re-entering the market after what appeared to be an exhaustion phase. Similar accumulation trends have often preceded a broader recovery in Ethereum’s price, especially when accompanied by stabilization in the ETH/BTC trading pair.
As it stands, the Ethereum price appears to be building a firmer base for the next phase of its recovery heading into November. When whale wallets accumulate, it reduces the circulating supply available on exchanges and reduces selling pressure.
At the time of writing, Ethereum is trading at $3,940 and is on track to break and close above $4,000 again. Both Ethereum and Bitcoin have risen a bit in recent days after inflation report showed US inflation cooling to 3% in September, below the 3.1% forecasted by economists.
Featured image from Unsplash, chart from TradingView
The Chainlink (LINK) market has experienced a significant uplift in the last week as prices grew by 7.64%. In line with the general crypto market, the altcoin produced a modest rebound from the deep correction levels seen in mid-October. Amid this price action, renowned market analyst Ali Martinez has shared a developing bullish pattern that suggests more profits ahead.
Buy The Dip At $15 – Here’s Why
In a recent X post on October 25, Martinez postulated that LINK could be gearing up for a major rally, with technical indicators hinting at an incoming bullish opportunity. In analyzing the LINKUSDT daily chart, investors may have a chance to notch a 300% gain in the coming months.
Based on the chart analysis presented by Martinez, LINK is trading within a broad ascending parallel channel that has defined its market behavior since mid-2023. Notably, the altcoin last bounced off the lower boundary of this channel in June 2025 to trade as high as $28.00, before descending to current market prices around $18.00.
Martinez anticipates that LINK will complete its ongoing decline by revisiting the channel’s lower boundary, with the $15.00 zone, which aligns with the 0.618 Fibonacci retracement level, serving as the key area of interest. The analyst identifies $15.00 as a strong accumulation zone, advising investors to consider buying at that level. From there, LINK is expected to stage a recovery toward the upper boundary of the channel.
However, Martinez cautions that the token could face interim resistance around $20.04, corresponding to the 0.786 Fibonacci level, which may trigger a brief pullback to $18.00 before a potential breakout rally. If this setup unfolds as projected, LINK could surge toward the $46.31 mark, matching the 1.272 Fibonacci extension, representing an upside of roughly 300% gain from the expected accumulation point.
LINK Market Overview
At the time of writing, LINK trades at $18.21, reflecting a slight 2.41% gain in the past day. Meanwhile, the token’s daily trading volume has declined by 43.38% and is valuedat around $366 million.
Looking at its monthly chart, LINK remains down by 11.05% despite the modest recovery seen in the last week, signaling that the token still needs further upside to fully reverse its recent losses and bring most new investors back into profit. With a market cap of $12.35 billion, LINK continues to hold its position as the twelfth largest cryptocurrency in the market.