Uniswap (UNI) has been consolidating since the October 10 market crash, with price action stabilizing but volatility still lingering. The decentralized exchange (DEX) token has struggled to regain its previous momentum, reflecting the broader uncertainty across the altcoin market. Analysts remain divided on its short-term outlook — some view Uniswap as a key driver of Ethereum’s DeFi ecosystem and a potential leader in the next recovery phase, while others caution that lingering liquidity stress and waning trader activity could spark more turbulence ahead.
Despite this cautious backdrop, new on-chain data suggests a shift may be underway. According to CryptoQuant insights, Binance whales have become increasingly active on UNI, with large transactions and outflows spiking to multi-month highs. Historically, this type of whale behavior — especially when coupled with heavy exchange outflows — has been associated with accumulation phases and strategic repositioning by major players.
As Uniswap’s fundamentals remain solid, with trading volumes and user engagement steadily recovering, the renewed whale activity could indicate that smart money is quietly preparing for the next market leg. Whether this accumulation marks the early stages of a trend reversal or just a temporary pause before further volatility remains to be seen.
Uniswap Exchange Outflows Hit Multi-Month Highs
In recent days, Uniswap’s native token, UNI, has seen a notable uptick in large-scale activity, signaling renewed interest from major market participants. According to on-chain data from CryptoQuant, whale wallets — typically identified by the top 10 largest transactions — have begun moving significant amounts of UNI out of Binance. These outflows represent transfers from exchange wallets to external addresses, a behavior that often indicates accumulation or long-term repositioning by large holders rather than short-term trading.
The data highlights a daily peak of 17,400 UNI withdrawn from Binance, alongside a monthly peak of 5,250 UNI, marking a three-month high in whale activity. Historically, such outflow spikes tend to occur during accumulation phases, as whales seek to reduce exposure to centralized exchanges and secure tokens for longer-term holding or staking opportunities.
This renewed movement comes at a time when UNI is still digesting the market correction that began in July, with prices stabilizing but failing to regain strong upward momentum. Analysts interpret this surge in whale activity as a potential early indicator of confidence returning to the asset. If sustained, it could mark the beginning of a structural reversal — a shift from post-crash consolidation to the early stages of renewed accumulation and recovery.
UNI Price Analysis: Consolidation Persists as Whales Reenter the Market
Uniswap (UNI) continues to consolidate near the $6.50 level after a sharp correction that began in July 2025. The weekly chart shows a prolonged period of sideways movement following a breakdown from the $12 resistance zone, where bullish momentum previously failed to sustain. Despite multiple attempts to rebound, UNI remains below the 50-week and 200-week moving averages, both of which now act as dynamic resistance levels.
The recent price action reflects investor hesitation, with the broader market still digesting the effects of the October 10 crash. However, volume analysis indicates that selling pressure has started to decline, suggesting that sellers may be exhausting and that accumulation could be forming at current levels.
From a technical perspective, the $6.00–$6.20 zone serves as immediate support, while a decisive reclaim above $8.00 would be required to shift market structure toward a potential mid-term recovery. Interestingly, the recent whale accumulation reported by on-chain data aligns with this stabilization phase — a pattern often seen near cyclical bottoms.
If Uniswap maintains support and market sentiment improves, UNI could attempt to retest the $10–$12 zone in the coming months. Conversely, a failure to hold above $6 could open the door for a retest of the 2024 range lows around $4.
Featured image from ChatGPT, chart from TradingView.com
DJT stock price remains in a tight range near its all-time low, but this could change soon as it formed a highly bullish chart pattern. Trump Media was trading at $16.30, down by 62% from its highest point this year.…
Liquidity-driven DeFi continues to become more sophisticated, and finding the best yield farming platforms for 2025 is more crucial now than ever. With the total value locked (TVL) in yield-farming protocols already reaching hundreds of billions of dollars; identifying platforms that strike a good balance between reward and safety is a top priority.
How Yield Farming Works – The Basics
Yield farming; also known as liquidity mining, is the process of locking or staking cryptocurrency on a protocol in return for rewards; usually in the form of interest; governance tokens; or a share of transaction fees.
This process involves supplying liquidity to pools on decentralized exchanges (DEXs); or lending assets on money-markets. To stand out from the crowd; the best yield farming platforms need to offer high yields; audited smart contracts, and transparent tokenomics.
Yield farming is increasingly becoming an integral component of decentralized finance (DeFi); and a growing demand for structured exposure through high-quality yield farming platforms is being seen.
Top 5 Platforms to Consider
Here are five leading yield farming platforms worth evaluating in 2025:
Platform
Network(s)
Why It Stands Out
Aave
Ethereum; Polygon; Arbitrum
Robust lending/borrowing framework with large TVL.
Curve Finance
Ethereum; Arbitrum; Base
Stable-coin pools offer lower risk; and steady returns.
Yearn Finance
Ethereum
Automated vaults optimize returns across strategies.
PancakeSwap
BNB Chain
High-yield farming and simple user interface for retail users.
Uniswap
Multi-chain
Leading AMM enabling LP rewards and farming on varied tokens.
Choosing the Right Yield Farming Platforms
When it comes to selecting a standout platform; one can’t just look for the highest APY. It is important to focus on security and yield optimization. Top analysts at DeFiLlama and industry insiders; agree that protocols with audited contracts; transparent team governance, and high TVL are the ones worth keeping an eye on.
For instance; Hacken’s smart-contract risk report drives home the point that even a high APY isn’t enough to outweigh weak audits or opaque token emissions.
As the yield farming landscape continues to evolve; the best yield farming platforms are starting to develop into “yield aggregators” that automatically optimize strategies.
When choosing the best yield farming platforms; consider the following criteria:
Security and audit track record – Protocols that have been audited by reputable firms and have a clear governance and transparent operations; are generally more trustworthy.
Total Value Locked (TVL) and liquidity depth – A higher TVL is a good indicator of user confidence and protocol stability; and indicates lower risk.
Yield sustainability and tokenomics – A platform that offers elevated yields without a clear reward mechanism or token model is likely to present some hidden risks.
Chain compatibility and fee efficiency – Lower transaction costs and cross-chain support can help reduce the barriers to entry for a larger user base.
Transparency of mechanics – The best platforms clearly publish how yield is generated; reward distribution mechanics, and any potential risks involved.
In a nutshell; when it comes to picking the best yield farming platforms; it is important to focus on the ones that offer large; diverse liquidity, a trustworthy audit history; manageable tokenomics, and open transparency.
Risks and Mitigation in Yield Farming
Despite the upside; yield-farming comes with real risks that need to be managed:
Impermanent loss: This occurs when an LP token’s fundamental assets diverge in price; more relevant in volatile token pairs than stablecoin pools.
Smart contract vulnerabilities: Even mature protocols can have bugs, exploits or governance attacks, audits don’t eliminate risk entirely.
Tokenomics dilution and reward inflation: High-yield offers might be token reward inflation rather than sustainable yield from protocol operations.
Liquidity risk / exit risk: Low-TVL pools can hinder withdrawal or expose users to more volatility when large withdrawals happen.
Chain- and protocol-specific risks: Fees, network congestion, chain hacks or bridge exploits can affect yields or access.
Mitigating measures are diversifying across protocols, using audited platforms, favoring high-TVL pools and being aware of protocol governance and reward token models.
Conclusion
While high APYs are attractive, the real value is in choosing platforms where long-term security and protocol credibility match yield potential.
The universe of yield farming platforms in 2025 offers many opportunities for passive yield generation in crypto. But the focus has shifted from just getting high APYs to choosing platforms based on security; liquidity, transparency and risk tolerance.
Aave; Curve, Yearn, PancakeSwap and Uniswap; stand out for being functional and reliable. Success in yield-farming will favor disciplined strategy; continuous monitoring and understanding what drives yield; not chasing headline percentages.
Glossary
DeFi (Decentralized Finance): Financial systems and protocols on blockchain; without centralized intermediaries..
Liquidity Provider (LP): Someone who deposits assets into a pool; and earns rewards from trades or protocol activity.
APY (Annual Percentage Yield): The annualized interest rate when interest is compounded.
TVL (Total Value Locked): The total amount of assets in a DeFi protocol. It’s a measure of its size and trust.
Impermanent Loss: Loss for LPs when price changes of assets in a pool; cause value to diverge from just holding them.
Yield Aggregator: A protocol that optimizes yield across many pools and platforms.
Frequently Asked Questions About Best Yield Farming Platforms
What is yield farming and how is it different from staking?
Yield farming is depositing crypto into DeFi protocols; like liquidity pools or lending platforms; to earn interest or tokens.
Staking is locking coins to secure a blockchain and earn rewards; less complex; often lower return and lower risk.
Are yield farming platforms safe?
Top platforms have audits and large TVL; but risks like smart-contract bugs; impermanent loss; token emission dilution and market volatility remain. Always use protocols with transparent history and manage risk.
How do the best yield farming platforms offer high returns?
They reward liquidity providers via fees; governance tokens or interest from lending pools. Auto-compounding and leveraged strategies also boost returns.
Can beginners use yield farming platforms?
Yes; but start with simple pools (e.g. stable-coin pairs); on trusted platforms like Curve or PancakeSwap. Ensure to understand fees, locking terms and risks like impermanent loss. Don’t use complex strategies until comfortable with DeFi.
What is impermanent loss and how does it affect farming?
Impermanent loss is when one provides liquidity in a pool and asset prices diverge, reducing value compared to just holding.
It’s a big risk for LPs; so many of the best yield farming platforms now offer stable-coin only pools or optimized LP strategies to reduce this.
GIP-140 revamps GnosisDAO voting with on-chain and beacon data.
GNO price dips amid profit-taking and technical resistance.
Liquidity limits and stablecoin rules may influence short-term sentiment.
The Gnosis price has experienced modest volatility following the passing of the GnosisDAO GIP-140 proposal, a major governance update aimed at overhauling the platform’s voting mechanisms.
The GIP-140 initiative replaces the current subgraph-based GNO strategy with a suite of strategies that read blockchain state directly from both the execution and beacon layers.
The proposal’s approval marks a significant step toward enhancing the accuracy and reliability of Snapshot voting while adding support for StakeWise tokens and reducing dependency on external data providers.
GIP-140: revamping voting for accuracy and inclusion
GIP-140’s passage reflects a broad consensus among GnosisDAO participants, with 82 votes cast, overwhelmingly in favour of the measure.
The core objective is to eliminate the subgraph dependency, which has historically caused delays and inaccuracies in voting power calculations.
The new system attributes voting power to GNO balances across both the Gnosis Chain and Ethereum, locked GNO holdings, validator balances, and StakeWise’s sGNO and osGNO tokens.
By pulling data directly from on-chain and beacon chain sources, the proposal seeks to create a more robust and transparent voting environment that can better reflect actual stakeholder influence.
The technical implementation involves updating Snapshot’s configuration via a SafeSnap transaction, pointing to aggregator contracts deployed on both Gnosis Chain and Ethereum, as well as a new beacon-chain strategy for staked GNO.
Delegation mechanisms have also been updated to integrate these new sources, ensuring a seamless transition for DAO members accustomed to existing workflows.
The changes position GnosisDAO to handle complex governance requirements while reducing reliance on third-party indexers like The Graph, which previously introduced inconsistencies.
Surprisingly, following the approval of GIP-140, the Gnosis price has seen a slight pullback, falling 0.89% over the past 24 hours and underperforming the broader crypto market, which gained 0.06%.
The price movement aligns with profit-taking behaviour after GNO achieved a 7.98% weekly gain and an 8.3% rise during October.
Technical indicators suggest the market is testing resistance around the 30-day simple moving average of $137.93 and the 61.8% Fibonacci retracement level at $138.47.
While the RSI remains neutral at 53.42, a bearish divergence in the MACD hints at potential short-term consolidation.
In addition, liquidity pressures stemming from CoinDCX’s June 2025 delisting continue to weigh on GNO trading activity.
Despite being months old, the delisting reduced retail access to the token, and the 24-hour turnover ratio of 1.08% remains relatively low compared with broader DeFi sector averages.
Regulatory uncertainties surrounding stablecoins, particularly the relaunch of USDS under the stricter US GENIUS Act, may also indirectly influence sentiment toward Gnosis Chain assets.
Nevertheless, milestones like Gnosis Pay’s $100 million transaction volume suggest that ecosystem adoption could counterbalance some of these headwinds.
Looking ahead
The combination of technical consolidation, lingering liquidity constraints, and regulatory considerations creates a cautious but watchful environment for Gnosis price movements.
Holding the $135–$137 zone could provide the stability needed for renewed momentum, particularly as GnosisDAO’s upgraded Snapshot strategies begin to reflect more accurate voting power across multiple token types.
In the coming weeks, the Gnosis price may respond to both market dynamics and the tangible impact of GIP-140’s execution, particularly if the changes enhance voting accuracy and encourage broader participation in the DAO.
For now, the community appears aligned, and the successful passage of GIP-140 represents a meaningful milestone that could shape GNO’s trajectory in both governance and market performance.
The U.S. Federal Reserve will announce its latest interest rate decision at the FOMC meeting today, October 28. The market expects a decent 25 basis point rate cut, a move already priced in by most investors. For that reason, the immediate impact on crypto markets may be limited.
At the time of writing, XRP is trading at $2.65, down about 1% over the last 24 hours. While price action remains muted, traders are closely watching how XRP might react once the rate decision is official.
Calm Before Movement
The broader crypto market has been relatively quiet this week. XRP, in particular, has lagged behind some altcoins that recently surged following ETF approvals, such as Hedera (HBAR) and Litecoin (LTC).
Hedera, for example, jumped nearly 10% in a day after confirmation of its upcoming ETF. That strong move caught many off guard, as the approval was widely expected but apparently not fully priced in. The sharp rally has led some analysts to believe the same could happen with XRP once its own ETF finally gets approval.
Why the FOMC Meeting Matters for XRP
A rate cut generally increases liquidity across markets, encouraging investors to move money into risk assets, including cryptocurrencies. If today’s decision confirms the expected cut, it could support a gradual rebound in XRP and the broader market.
Still, analysts warn that the scale of XRP’s next move will depend on how investors interpret the Fed’s tone. A more uncertain outlook from the central bank could limit gains in the short term.
Short-Term Outlook
From a technical standpoint, XRP faces strong resistance near $2.75 to $2.80, levels that it needs to reclaim to build upward momentum. Some short-term downside toward $2.55 remains possible before a new leg higher.
However, sentiment is improving as market conditions stabilize and excitement builds around a future XRP spot ETF. If fundamentals continue to strengthen, XRP could target the $3 mark soon.
After a sharp rally that sent the Official Trump (TRUMP) price token soaring in recent sessions, the momentum now appears to be cooling as the market enters a phase of equal bullish and bearish pressure. Traders are closely watching whether the token can sustain its gains or face a short-term correction amid broader market uncertainty. As buying momentum slows, the next few trading sessions could decide whether TRUMP’s price resumes its uptrend or confirms a near-term pullback.
Ecosystem Expansion and Massive Earnings Drive Official Trump Token’s Momentum
The Official Trump (TRUMP) token has captured market attention once again, surging nearly 30% after the announcement that USD1, a Trump-linked stablecoin, will launch on the Enso Chain. The move is seen as a key step in expanding the Trump crypto ecosystem, potentially enhancing TRUMP’s real-world utility and investor confidence. This expansion comes as momentum traders position for further gains, though short-term consolidation remains likely amid rising market volatility.
Adding to the buzz, a Reuters investigation revealed that the Trump Organisation generated approximately $802 million from crypto-related ventures between January and June 2025—surpassing its traditional business income during the same period. Of this, nearly $336 million reportedly originated from the TRUMP token, spotlighting the financial weight of the Trump-backed digital asset. However, the findings have reignited debate over governance, transparency, and political influence in crypto markets, with regulators and investors alike watching closely how the ecosystem evolves in the coming weeks.
TRUMP Price Analysis: Is A Bullish Monthly Close on the Horizon?
The Official Trump (TRUMP) token is showing signs of renewed strength after months of steady decline. Following a sharp rebound from its October lows, the price has broken above a key descending trendline for the first time since May, signalling potential bullish reversal momentum. Trading volume has spiked notably, reflecting increased investor interest. However, with the token now hovering near critical resistance around $7.20–$7.30, traders are watching closely to see if this breakout holds or fades into consolidation.
The chart shows TRUMP testing a long-term descending resistance trendline, with current price action slightly above the $7.20 resistance zone. The DMI indicator reveals tightening pressure between bulls (DI+) and bears (DI–), suggesting balanced momentum. Meanwhile, the RSI at 57 signals moderate bullish strength but not yet overbought, implying room for upside continuation. A decisive close above $7.30 could confirm a breakout toward $8.50, while rejection here may lead to a retest of the $6.20–$6.40 support region.
Conclusion—Will OFFICIAL TRUMP Reach $10?
The Official Trump (TRUMP) token’s recent rebound above its long-term trendline has re-energized bullish sentiment, but a sustained rally toward $10 will depend on continued ecosystem growth and broader market stability. A confirmed breakout above $7.50 could open the path toward $9.80–$10.00, especially if momentum strengthens alongside renewed buying volume. However, failure to hold above $6.20 may trigger another correction phase. For now, TRUMP stands at a crucial inflexion point—where market conviction will determine whether the next move is a breakout or a fade.
Bittensor (TAO) price surged over 10% in the past few hours, climbing above the $450 mark as renewed demand for its subnets and rising speculative activity fuelled fresh optimism in the AI crypto sector. The decentralized machine-learning network has seen a sharp spike in trading volumes and open interest, signalling growing investor confidence. As TAO breaks key resistance levels, traders are now eyeing the $500 milestone—raising the question: can this AI-powered blockchain sustain its bullish momentum?
Why Bittensor Price Is Rising?
Bittensor’s sharp rally can be attributed to a confluence of bullish technical and fundamental factors. The most immediate catalyst is the surging demand for Bittensor’s subnets, which recorded an 11% jump in market cap within 24 hours, reflecting growing usage and developer activity. On top of that, futures open interest spiked nearly 19%, signalling strong speculative participation.
Technically, TAO has broken above a long-term descending trendline, marking a key bullish reversal pattern. The breakout has drawn renewed attention from traders who see Bittensor as one of the most promising plays in the AI + crypto narrative, especially with major institutional interest brewing in decentralized machine learning networks.
Bittensor (TAO) Technical Outlook
From a technical standpoint, Bittensor’s breakout above $434 has flipped a crucial resistance level into support, confirming a bullish reversal on both the 4-hour and daily timeframes. The price has consistently formed higher highs and higher lows, signaling sustained buying momentum. Analysts point to $466–$475 as the next critical resistance zone, beyond which TAO could target $500 in the short term.
Bittensor (TAO) is showing strong bullish momentum, rebounding from the $280–$300 support zone and now testing the key resistance near $470. The price has surged above both the 50-day and 200-day moving averages, with the two lines converging—hinting at a potential golden cross, a classic bullish signal that often precedes strong upward trends. Rising volume confirms growing momentum, while the RSI near 63 suggests steady buying pressure. A breakout above $470could pave the way toward $500, with support around $360.
Conclusion
Bittensor’s recent price rally underscores growing confidence in both its AI-driven narrative and improving on-chain fundamentals. With rising subnet activity, expanding trading volumes, and a potential golden cross on the horizon, TAO appears technically well-positioned for further upside. However, the $470–$480 range remains a critical barrier that must be cleared for continuation toward $500 and beyond. As momentum builds, traders should watch for sustained volume and confirmation above resistance to validate the next phase of Bittensor’s bullish trend.
Traders face a mixed outlook, with BNB's deflationary mechanics potentially leading to a boost if demand grows, but technicals show the price stuck in a narrow range.
Trump Coin price has rebounded by double digits as whale buying continues and exchange balances retreat ahead of the Federal Reserve interest rate decision. Official Trump (TRUMP) jumped to a high of $8.17 on Monday, Oct. 27, up by 78%…
Pi Network price shows a strong bullish reaction from the 0.618 Fibonacci Golden Pocket, forming an engulfing candle that signals a reversal toward the $0.29 resistance. Pi Network (PI) has shown early signs of recovery after finding strong support at…
BitMine Immersion Technologies has jumped into the top tier of institutional crypto treasuries with total crypto, cash and “moonshot” investments of $14.2 billion, anchored by a whopping 3,313,069 ETH position; seemingly the largest Ethereum treasury in the world.
Chairman Tom Lee has described the strategy as pursuing what the firm calls its “alchemy of 5%” of Ethereum’s total supply.
For BitMine Ethereum holdings, this means $ETH is no longer just a speculative token, but a corporate reserve asset.
BitMine Ethereum Holdings Scale
BitMine’s recent announcement divulged that they now hold 3.31 million ETH tokens, or roughly 2.8% of Ethereum’s total supply.
The breakdown includes 192 BTC, $305 million in unencumbered cash, plus their “moonshot” investments, all totaling $14.2 billion.
Earlier in August, they reported 1.71 million ETH and crypto + cash assets of $8.8 billion.
How BitMine Built Its ETH Treasury
BitMine’s ETH strategy started with a $250 million private placement announced on June 30 2025, specifically for ETH accumulation.
From there; they scaled fast and by July; they had over 300,000 ETH worth over $1 billion.
By early August, they had 833,137 ETH ($2.9 billion). By August 24th; they had 1.71 million ETH with $8.8 billion in assets.
BitMine’s move resonates with a trend in corporate treasuries where instead of just Bitcoin, Ethereum is becoming a reserve asset. By holding ETH as a core treasury holding, BitMine is signaling that they believe in ETH’s role in decentralized finance, staking, smart-contracts and tokenization.
Tom Lee drew a historical parallel, calling the ongoing evolution: “[The] end of Bretton Woods … as transformational to financial services in 2025 as ending Bretton Woods was 54 years ago.”
Market and Investor Impacts
BitMine’s ETH accumulation has had effects. Their stock (BMNR) has gone up big time and is now one of the most traded stocks in the US with daily volumes in the billions.
Big investors like ARK Invest, Bill Miller III, Founders Fund (via Peter Thiel) and others are also reportedly behind the strategy.
For ETH markets, big public-treasury holders like BitMine set a new precedent: corporate accumulation, staking and ecosystem integration are part of how ETH is valued.
Conclusion
Going forward, market observers could monitor include how BitMine manages and deploys its ETH; whether it stakes, uses it for DeFi yield or holds it passively. The firm’s target of 5% of ETH supply is ambitious.
Also; how other companies respond; will more firms add ETH to their reserves? The whole ecosystem may change if BitMine Ethereum holdings becomes the corporate crypto strategy.
Finally; how this accumulation impacts ETH tokenomics, staking; supply concentration and market perceptions will make headlines.
Glossary
Ethereum (ETH): a crypto-asset used for the Ethereum blockchain; for smart contracts; staking and DeFi.
Treasury holdings: assets held long-term by a company for reserve or strategic purposes; not for short-term speculation.
Staking: locking cryptocurrency to support blockchain operations; and earn rewards.
Tokenization: converting real-world assets or rights into digital tokens on a blockchain.
Circulating supply: total number of tokens available in the market; for a given cryptocurrency.
Private placement: issuing securities directly to a limited number of investors; often used to raise capital for strategic initiatives.
Frequently Asked Questions (FAQs)
How much ETH does BitMine hold?
As of October 27, 2025; BitMine holds approximately 3,313,069 ETH.
What is the total value of BitMine’s crypto and cash holdings?
$14.2 billion in crypto, cash and “moonshots.”
What percentage of the total ETH supply does BitMine own?
BitMine says its holdings are about 2.8% of the total ETH supply.
Who are the major investors in BitMine’s strategy?
ARK Invest, Founders Fund (via Peter Thiel), Bill Miller III, Pantera Capital and Galaxy Digital.
What is BitMine’s target for its ETH holdings?
The company’s internal target is 5% of the total ETH supply, its “5% alchemy” goal.
Bitcoin price rose suddenly on Tuesday, Oct. 28, hitting a high of $116,200 as traders waited for the upcoming interest rate decision and Trump’s meeting with Xi Jinping. Bitcoin (BTC) has jumped by over 11% from its lowest level this…
181M tokens unlocked, raising dilution and sell-off fears.
Technical analysis shows weak momentum but hints at a possible rebound.
The GRASS price is under heavy pressure as the market braces for a massive GRASS token unlock event.
With 181 million new tokens — worth more than $80 million — set to flood the market today at 1:30 PM UTC, investors are watching closely to see whether this move signals a deeper downturn or a short-lived shakeout before recovery.
Built on Solana, the Grass network powers a decentralised data infrastructure where users share idle bandwidth to support AI and web-scraping applications.
But despite its strong fundamentals, the latest unlock threatens to overshadow its long-term potential with short-term volatility.
GRASS price struggles under selling pressure
Over the past 24 hours, the GRASS price has fallen by 2.9% to trade near $0.41, underperforming the broader crypto market, which slipped only 0.56%.
The token is now down more than 50% in the past 30 days, reflecting rising investor anxiety ahead of the unlock.
Notably, the upcoming token release will increase the circulating supply by nearly 58%, from 243 million to roughly 424 million tokens.
This surge in available coins raises significant dilution concerns, particularly in a market already grappling with low liquidity.
Unfortunately, data shows that trading volume has dropped by more than 25% over the past week, suggesting thin demand to absorb the incoming supply.
Historically, token unlocks of this magnitude have triggered immediate price declines of 10–30% or more, as early investors and contributors take profits.
GRASS’s decline of nearly 50% over the last month fits that trend, reinforcing the perception that the market has been pricing in the unlock for weeks.
The token unlock has overshadowed Grass’s funding optimism
Earlier this month, Grass secured a $10 million funding round led by Polychain Capital and Tribe Capital to expand its decentralised AI data network.
The investment validated the project’s DePIN model and its 8.5 million active users, but market reaction was subdued.
Instead of fueling a rally, the news coincided with a 6% drop in GRASS’s value as investors focused on the looming unlock.
Part of the concern stems from the nature of the funding, which included token allocations that may add to near-term selling pressure.
As a result, even fundamentally positive developments are being viewed through a bearish lens, with traders preferring to stay on the sidelines until the post-unlock price action stabilises.
Technical outlook hints at fragile stability
Technically, GRASS remains in a pronounced downtrend.
The token trades below all major moving averages, with its 7-day SMA near $0.4266 and 30-day SMA at $0.6243.
Momentum indicators confirm weakness — RSI sits around 35, signalling oversold conditions, while MACD is attempting a modest bullish crossover.
Chart patterns point to a large descending triangle formation, with GRASS hovering close to its lower boundary.
The next major support lies at $0.3126, marking the 2024 low, while resistance is seen near $0.4694 and more prominently at $0.9 — the key point of control (POC) on the Volume Profile indicator.
A breakout above this zone could mark the beginning of a recovery phase, but until volume returns, upside potential remains limited.
However, follow-through buying has been muted, suggesting that traders are still cautious ahead of the unlock.
What to expect after the GRASS token unlock?
The immediate aftermath of the GRASS token unlock will determine whether this event deepens the sell-off or serves as a reset for future growth.
If selling pressure spikes, GRASS could test new lows below $0.31.
However, if buyers absorb the new supply and RSI begins to recover, a short-term rebound toward resistance near $0.47 may follow.
While GRASS’ fundamentals, anchored in decentralised AI data infrastructure, remain solid, the market’s focus is squarely on supply dynamics and investor sentiment for now.
As the flood of tokens hits exchanges, GRASS will need a compelling proof of demand to convince traders that the worst is behind it.
Router Protocol completes migration with an airdrop on Ethereum.
ROUTE price gains momentum as the Router App launch boosts interest.
Analysts see breakout potential but warn of post-airdrop volatility.
Router Protocol is entering a decisive phase as two major developments converge: the token migration completes with an airdrop for unmigrated balances, and the Router App — powered by the project’s Open Graph Architecture — has gone live.
These events could reshape liquidity, user flows, and market sentiment for the ROUTE token.
Airdrop seals migration
Router Protocol confirmed that unmigrated ROUTE tokens on the legacy Router Chain will be distributed to eligible Ethereum wallets via an airdrop on October 28, 2025.
The team published the eligible-wallet list and framed the distribution as the final step in consolidating the token on Ethereum.
ROUTE Migration Update
As part of moving all ROUTE tokens from Router Chain → Ethereum, the below addresses have unmigrated tokens and hence will receive their tokens via airdrop on Ethereum chain.
Market participants typically react to migration completions in two ways: some see it as a trust-building milestone that simplifies token management and encourages broader exchange support, while others treat airdrops as near-term sell pressure events when recipients liquidate allocations.
That tension — immediate selling versus longer-term confidence — is why observers expect heightened volatility around the airdrop date.
The migration also follows a larger strategic pivot by the project away from maintaining an independent L1 towards providing cross-chain infra via OGA.
The sunset of Router Chain and consolidation on Ethereum removes fragmentation and ends on-chain inflation tied to validator rewards, according to community commentary.
Router Protocol’s Router App goes live
On August 28, the team launched the Router App, a cross-chain swapping interface built on Open Graph Architecture.
The App aggregates bridges and DEX liquidity across EVM and non-EVM chains, promising smarter routing and the ability to split and reassemble trades in real time.
The announcement positions Router App as the consumer-facing layer of a broader routing standard.
Technically, the Router App’s value proposition is twofold: it offers immediate utility by improving swap efficiency across many chains, and it signals a productization of Router Protocol’s core infra, which may attract both retail users and protocol integrators.
Early adoption metrics, and whether users move meaningful TVL into the App, will matter for price and perception.
ROUTE price reaction: analysts eye a potential breakout
As Router Protocol completes its migration and launches the Router App, analysts and traders are closely watching the ROUTE price for confirmation of a possible breakout.
The token has already shown early signs of strength, maintaining steady gains in recent weeks as attention builds around these milestones.
At press time, ROUTE traded at $0.004541, up 11.7% in 24 hours after hitting a low of $0.003865.
Crypto analyst Chetan has been among the most vocal, noting that ROUTE remains up over 70% since his initial call and is now breaking above a key trend line that has held since November 2024.
Chetan suggests that if the breakout sustains, ROUTE could climb to a minimum target between $0.033 and $0.039, with a maximum upside around $0.10–$0.11.
Chetan frames the setup as a high-risk, high-reward scenario — roughly 50% downside risk versus 5x to 15x potential reward — but stresses the need for patience, saying he’s watching how the quarterly candle closes before adding more.
$ROUTE still up 70% since the buy…. and nearly 2x since its lows…
and now breaking out first time from its November 2024 trend-line….
if the breakout happens then its a possible sign for continuation to 0.033$ – 0.039$ minimum…
At the same time, community member Jel has expressed renewed optimism, calling the potential “comeback of $ROUTE” “yuge”, reflecting growing bullish sentiment among long-term supporters.
Jel’s remarks echoed those of Ram from Router Protocol’s core team, who emphasised that the migration marks a fundamental reset for the ecosystem — validator rewards are ending, inflation is dropping to zero, and ROUTE is consolidating fully on Ethereum via Nitro.
Ram also noted that with consolidation complete, centralised exchanges are expected to fully support ROUTE on Ethereum, which could strengthen liquidity and accessibility.
The majority believe that completing the migration and delivering a live, functional cross-chain product could help the token rebuild credibility and attract more trading activity.
However, many warn that immediate volatility is likely after the airdrop as some recipients may take profits.
But if momentum continues alongside growing Router App adoption and Ethereum-based liquidity, the token could confirm its recovery narrative and extend its move higher.
Aster price establishes a double bottom at $1.04, a key high-timeframe support aligned with the value area low and 0.618 Fibonacci, signaling potential for a bullish reversal. Aster (ASTER) price has established a significant technical structure as price forms a double…
Chainlink price has bounced back by over 24.70% from its lowest point this month. This rebound could be short-lived despite some positive developments in the network. Chainlink (LINK) token rose to $18.72, up by 25% from its lowest point this…
The year is about to close in the next two months, which has piqued the curiosity of market participants for a much-missed altcoin rally. As a reason SUI price prediction 2025 narrative is in trend. The SUI is among the top coins that have previously displayed massive gains and have the capability to achieve similar or higher gains again.
Looking at SUI specifically, then its price action is entering a decisive stage as the asset consolidates within a broad symmetrical triangle after a historic rally in late 2024. With ecosystem metrics booming and on-chain activity reaching record highs, the coming months could determine whether SUI crypto reclaims its previous all-time highs.
SUI Price Action: From 950% Rally to Tight Consolidation
The second half of 2024 was nothing short of extraordinary for the SUI price, as it skyrocketed over 950% from $0.49 to an all-time high of $5.32. However, 2025 presented a different story. Following the euphoric rally, the SUI price chart displayed movements confined within a multi-month symmetrical triangle, indicating mounting accumulation.
As the trading range narrows, it reflects growing optimism and strengthened network fundamentals. Such consolidation phases often precede significant moves.
Currently, the $2 support level acts as the key area to watch. A breakdown below this threshold could open doors to a deeper correction toward $0.49, while holding this zone keeps bullish hopes alive.
Ecosystem Growth Bolsters SUI Price Forecast
Despite the choppy SUI price USD action, the project’s fundamentals remain remarkably strong. On-chain data shows the SUI crypto ecosystem continues to thrive. The network recently achieved an all-time high of 225 million total accounts, a clear sign of rising engagement and user participation.
Even more impressive, October 28th witnessed 923,966 new accounts created in a single day, showcasing rapid adoption momentum. This consistent expansion in network activity underlines investor confidence and reinforces the long-term viability of SUI’s ecosystem.
Additionally, SUI’s Total Value Locked (TVL) stands firm at around $1.89 billion, after touching an ATH of $2.62 billion earlier in October.
Stablecoin Market Cap Growth Fuels Optimism
Another key aspect of the current SUI price analysis is the notable uptick in stablecoin inflows in october. The stablecoin market cap surged from a dip around $560 million to $1.15 billion at the time of writing. This is reflecting increasing liquidity and ecosystem utility.
Rising stablecoin activity often signals deeper adoption, as users engage more with decentralized applications, yield protocols, and staking opportunities.
This gradual yet firm rise in stablecoin dominance reflects investor confidence in the network’s resilience, suggesting that the groundwork for the next bullish phase may already be underway.
SUI Price Prediction 2025: A Crucial Setup Before the Breakout
The SUI price prediction 2025 framework points to a decisive few months ahead. If aggressive buying emerges, a breakout from the symmetrical triangle could send prices surging back toward $5.32 before the year closes, possibly forming strong Marubozu candles on the SUI price chart.
However, a more gradual buildup could delay the explosive move to the first half of 2026, allowing the asset to consolidate between its triangle borders. Either way, the tightening pattern and strong on-chain foundation make SUI crypto one of the most intriguing assets to watch in the DeFi landscape.
ETH price with a potential surge could hit $6,925 in 2025.
The price of Ethereum could reach a high of $15,575 by 2030.
Amidst the turn of events, most cryptocurrencies are riding the bullish wave. And Ethereum, too, is receiving volumes. The Ethereum price today is $4150, with an intraday price change of -0.27%. Curious about where the ETH price is heading in the long run? Read our latest Ethereum price prediction for potential price targets.
What will be the ETH Price tomorrow?
Based on the current price trend, the ETH price tomorrow could range between $4,000 and $4,200.
Ethereum is trading short of its strong resistance at $5,000 and $5,250, while support holds at $3,762. For November 2025, if bullish momentum continues, ETH could test $5,250 as the potential high. On the downside, if selling pressure intensifies, the price might revisit $4,144 as a potential low. Considering the current trend and RSI near 46.5, the average price is expected to be around $4,700, assuming consolidation within the current range before a major breakout.
Month
Potential Low
Potential Average
Potential High
November
$4,144
$4,700
$5,250
Ethereum Price Prediction 2025
A spot-ETH ETF could be the next major milestone. If approved, it may attract billions in capital. On top of that, institutional activity is growing. Layer-2 growth and big firms like State Street and PayPal are also building on Ethereum. The next big step is the Fusaka upgrade, coming in November 2025. Before that, Pectra will roll out in Q4, with long-term changes like Verkle Trees and danksharding ahead. These will make Ethereum faster and cheaper.
Ethereum price has been trading in a symmetric triangle pattern since early 2021, a breakout could lead to the ETH coin price hitting a new all-time high of $9,428.11. Conversely, rising uncertainty or any unfavorable global economic events could pull the ETH price toward its annual low of $3,142.70. That being said, it could average out at around $6,285.41.
Year
Potential Low
Potential Average
Potential High
2025
$3,142.70
$6,285.41
$9,428.11
Ethereum Medium-Term Price Prediction
Year
Potential Low ($)
Potential Average ($)
Potential High ($)
2026
4,714.05
9,428.11
14,142.16
2027
7,071.08
14,142.16
21,213.24
ETH Price Prediction 2026
By 2026, the value of Ethereum is expected to reach a high of $14,142.16. On the other hand, the Ethereum price might drop to $3,142.70, with an average of $6,285.41.
Ethereum Price Forecast 2027
The Ethereum 2027 forecast expects the ETH coin price to make a new all-time high at $21,213.24. However, a correction based on market shortcomings may drive the ETH crypto to $7,071.08, with an average of $14,142.16.
Ethereum Long-Term Price Prediction
Year
Potential Low ($)
Potential Average ($)
Potential High ($)
2028
10,606.62
21,213.24
31,819.86
2029
15,909.93
31,819.86
47,729.79
2030
23,864.90
47,729.79
71,594.69
ETH Price Prediction 2028
In 2028, the chances of Ethereum dominating the crypto market rise as the ETH price potentially makes a new high at $31,819.86. On the other hand, the altcoin might fall to $10,606.62, making an average of $21,213.24.
Ethereum Price Forecast 2029
Approaching its all-time high of $47,729.79 in 2029, the Ethereum price is expected to surpass the psychological barrier of $40,000. In case of a correction, $ETH may reach a low of $15,909.93, with an average price of $31,819.86.
Ethereum Price Prediction 2030
As per our Ethereum Price Prediction 2030, the ETH crypto price is projected to reach a new all-time high of $71,594.69 in 2030, with a potential low of $23,864.90 and an average price of $47,729.79.
Based on the historic market sentiments and trend analysis of the largest altcoin by market capitalization, here are the possible Ethereum price targets for the longer time frames.
Year
Potential Low
Average Price
Potential High
2031
35,797.35
71,594.69
107,392.04
2032
53,696.02
107,392.04
161,088.06
2033
80,544.03
161,088.06
241,632.09
2040
~1,376,550
~2,753,110
~4,128,680
2050
~79,396,500
~158,793,000
~238,189,500
CoinPedia’s Ethereum Price Prediction
With factors like the growing Ethereum network, rising inflows, broader market recovery, and increased adoption, the ETH price will likely give multi-fold returns in 2025.
As per CoinPedia’s Ethereum price prediction 2025, the Bulls can hit $9,428.11 in 2025. Conversely, a rise in FUD amongst investors and a lack of updates could curb the value of 1 ETH at $3,142.70.
Year
Potential Low
Potential Average
Potential High
2025
$3,142.70
$6,285.41
$9,428.11
Market Analysis
Firm Name
2025
2026
2030
Changelly
$4,012.41
$5,375
$24,196
Coincodex
$6,540.51
$3,816.62
$6,660.08
Binance
$3,499.54
$3,674.52
$4,466.40
VanEck
$6,000
–
–
Ethereum price could shoot to $5,500 soon and $12,000 by 2025
-Tom Lee
*The Ethereum forecast mentioned above is the average targets set by the respective firms.
Stay ahead with breaking news, expert analysis, and real-time updates on the latest trends in Bitcoin, altcoins, DeFi, NFTs, and more.
Key Factors & Risks
Regulatory uncertainty from SEC delays and new global frameworks.
Centralization risk driven by institutional validators and staking growth.
Rapid ecosystem expansion with security token adoption and active staking.
Vulnerability to macroeconomic shifts like Fed policy changes and market sentiment.
Ongoing privacy and censorship risks from stricter compliance protocols.
FAQs
What is the ETH price prediction for 2025?
As per our Ethereum price forecast 2025, the ETH price could reach a maximum of $9,428.11.
What will Ethereum be in 5 years?
According to our Ethereum Price Prediction 2030, the ETH coin price could reach a maximum of $71,594.69 by 2030.
Is it better to buy Bitcoin or Ethereum?
While Ethereum is trusted for its stout fundamentals, Bitcoin continues to dominate with its widespread adoption.
Will Ethereum Go Back Up?
The $ETH price is expected to go up as the FUD settles and the altcoin season kicks off.
What is Ethereum 2.0?
Ethereum 2.0 is an updated version of the existing Ethereum blockchain, which aims to increase the efficiency, scalability, and speed of the Ethereum network.
Is ETH a good investment?
As the altcoin season begins, the short-term gains make Ethereum a lucrative buying option. However, the long-term promises of this programmable blockchain make it a viable long-term crypto investment.
How much would the price of Ethereum be in 2040?
As per our Ethereum price prediction 2040, Ethereum could reach a maximum price of $4,128,680.
How much will the ETH coin price be in 2050?
By 2050, a single Ethereum price could go as high as $238,189,500.
WLFI price consolidates near $0.15, showing signs of accumulation that could spark a bullish expansion toward the $0.19 resistance zone. WLFI (WLFI) price is showing early signs of strength as price action consolidates near the $0.15 level, forming what appears to…
Shiba Inu price is on the verge of a bullish reversal, as momentum picks up after the recent SHIB burn, with a potential for 25–35% gains from current levels. Shiba Inu price technical analysis Shiba Inu (SHIB) recently conducted another…
As leverage trading takes over the crypto scene in 2025, traders are learning the hard way that big rewards often walk hand in hand with bigger risks, but could smarter risk control finally make leverage safer than ever?
Crypto leverage trading is becoming a popular way to invest in digital markets. It lets traders open larger positions with a small amount of money, which attracts both beginners and experts.
This method allows traders to make more profit when the market moves in their favor. But it can also bring large losses if it is not used with proper care and understanding.
What Is Leverage in Crypto Trading?
Leverage refers to utilizing borrowed capital from an exchange for a larger trade. In crypto leverage trading, a trader with a capital of say $100 can trade as if they had say $1,000, fully using 10x leverage. This can create larger profits if the market goes in their favor.
But, equally important, this can create larger losses if the price moves against them. Leverage allows traders to benefit from even small price changes in coins like $BTC or $ETH. It is helpful for short-term trades and lets traders keep some of their money free for other uses.
But experts warn that leverage is not a guarantee of profit or easy money. Borrowed funds must be handled carefully to prevent losing the entire trade through liquidation.
How Does Crypto Leverage Trading Work?
In crypto leverage trading, the exchange lends money to increase the size of a trader’s position. The trader must keep enough margin in their account to support this larger trade. When the market moves in their favor, profits can grow quickly. But if prices move the other way, losses can rise just as fast.
When a trader’s balance drops below the required margin level, the exchange may automatically close the trade. This is known as liquidation and it often happens when the market moves very quickly.
Understanding how margin works can help traders stay away from liquidation. It is wise to plan every trade with care and know the risks before using leverage.
How to Use Leverage in Crypto Trading Safely?
Using leverage in trading requires a clear plan and a steady approach. Many traders choose to begin with a smaller level of leverage, like 2x or 3x, until they gain more experience. Using very high leverage can make the impact of price changes much stronger.
Taking time to understand the market and manage each position with care usually leads to steadier outcomes. Using stop loss and take profit orders can also bring more structure and safety to crypto leverage trading. They close trades on their own once prices reach a chosen level.
By using them, traders can protect their capital and capture profits even when they are not watching the market. Making these orders part of a plan often brings more order and calm to the trading process.
What Are the Best Risk Management Practices?
Good risk management plays a central role in crypto leverage trading. It is advised that traders use only a small portion of their funds for each trade. This way, a single loss will not affect the entire account.
Experts often suggest risking only one percent of total capital per trade to limit losses. Watching margin levels helps traders avoid liquidation. Closing trades early or adjusting their size can protect funds. Funding fees should also be checked, as they can reduce profit over time.
Why Is Emotional Control Important in Leverage Trading?
Crypto leverage trading can be thrilling but also stressful. Rapid changes in the market can cause traders to react with emotions instead of with logic. This often creates errors, such as adding leverage after a loss or executing trades even earlier than expected.
Keeping emotions in check will allow traders to create rational, unemotional trading decisions. More experienced traders will advise taking a break after a loss to understand what went wrong. Patience and self-control will protect your trading capital better than any strategy.
It is also ok to look and learn from others, but don’t follow blindly from what you see on social media. Each trader must develop their own method based on their experience and what they have researched.
Conclusion
Crypto leverage trading gives traders a way to grow their profits with smaller capital. Traders who understand the risks, manage their positions, and stay disciplined can trade more safely and confidently.
Understanding risk and using tools like stop loss orders help protect funds. In 2025, smart and patient use of leverage remains the key to lasting success in crypto trading.
Glossary
Leverage: Extra money you borrow to increase the size of your trade.
Margin: The small part of your money kept aside to support a trade.
Stop Loss: A safety tool that ends a trade to stop more loss.
Funding Fee: A small cost you pay for keeping a trade open longer.
Short Trade: You sell expecting the crypto price to go down.
Frequently Asked Questions About Crypto Leverage Trading
How does leverage work in crypto?
Leverage helps you trade with more money, so your profit or loss can become bigger.
Why do people use leverage in crypto?
People use leverage to try to make more money from small price changes.
Is crypto leverage trading risky?
Yes, it is risky because you can lose your money very fast if the market goes down.
How can traders stop liquidation?
Traders can stop liquidation by using small leverage and watching their margin level.
What is a good rule for managing risk?
A good rule is to risk only a small part of your money on each trade.
HBAR is up 16% in the last 24 hours, the best performer among the top 20 cryptocurrencies by market cap.
The coin rallied ahead of the Hedera ETF listing on the NYSE.
HBAR outperforms other major cryptocurrencies
HBAR, the native coin of the Hedera blockchain, is the best performer among the top 20 cryptocurrencies by market cap. It added 16% to its value in the last 24 hours, allowing it to cross the $0.20 mark.
The rally comes as the Canary HBAR ETF is set to commence trading on the New York Stock Exchange today. According to Bloomberg’s senior ETF analyst Eric Balchunas, several altcoin-focused crypto ETFs are set to begin trading, including the HBAR Fund by Canary.
The new ETFs will allow institutions to gain more exposure to the cryptocurrency market, with most of them trading Bitcoin and Ethereum-focused funds since the start of the year.
The listing comes as a surprise due to the ongoing U.S. government shutdown, with the Securities and Exchange Commission only retaining a few essential staff during this period.
However, HBAR’s price could rally higher in the near term thanks to this latest development.
HBAR eyes $0.23
The HBAR/USD 4-hour chart is bullish and efficient thanks to the ongoing rally, with the technical indicators suggesting a further upward rally. The MACD lines are within the positive territory, suggesting a bullish bias.
Furthermore, the RSI of 80 means that HBAR is close to entering the overbought region. If the bullish trend continues, HBAR could rally towards the next resistance level at $0.23400 over the coming hours. An extended rally would allow the coin to touch the $0.26 mark for the first time since August 22.
However, if the market undergoes a correction following this rally, HBAR could drop to the $0.18 level to cover the FVG left by the massive push. The low of $0.16 will provide support in the near to medium term to allow the coin to surge higher.
Solana ETFs’ launch has boosted institutional interest and market optimism.
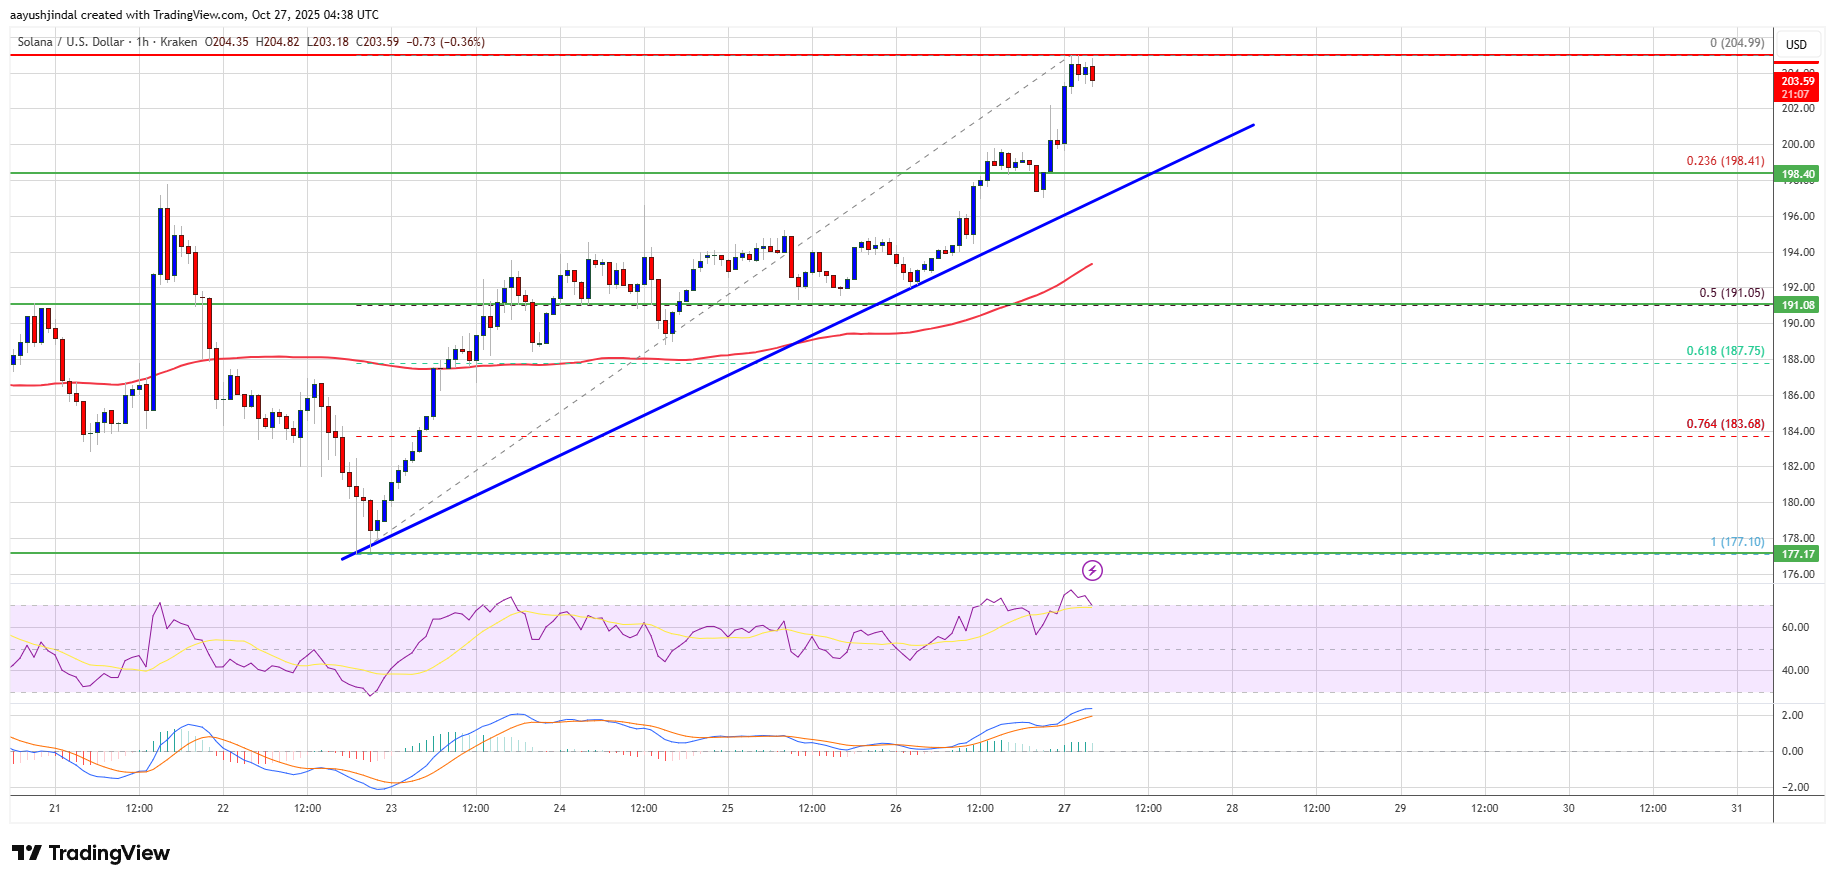
Bulls target $230 as SOL holds strong above the key $200 support zone.
Technical analysis shows rising momentum with resistance near $216–$227.
The long-awaited Solana ETFs have finally been approved, sparking renewed optimism across the crypto market.
The ETFs’ approval has reignited bullish momentum, with analysts believing that the Solana price could soon rally toward $230 and beyond.
Solana ETFs debut fuels optimism
Bitwise and Canary Capital have confirmed that their individual Solana ETFs officially begin trading on October 28 after weeks of regulatory uncertainty.
Bitwise’s product, launched under the ticker BSOL, serves as a gateway for institutional exposure to Solana, featuring staking powered by Helius Labs and a temporary management fee waiver.
– First U.S. ETP to have 100% direct exposure to spot SOL – Maximizing Solana’s 7%+ average staking reward rate* – Targeting 100% of assets staked – Staking through Bitwise Onchain Solutions, powered by… pic.twitter.com/Vo8Ko0qOCn
Grayscale has also moved swiftly, converting its Solana Trust (GSOL) into an ETF holding over $105 million worth of SOL.
Meanwhile, VanEck has also filed its sixth S-1/A amendment, with its Solana ETF status officially changed to “effective” and a 0.3% management fee established.
Adding to the growing momentum, Hong Kong’s first Solana ETF also began trading on Monday, marking Asia’s initial entry into the Solana ETF landscape.
Despite this wave of institutional activity, retail demand for Solana remains subdued.
Futures open interest sits near $9.75 billion — up slightly from the previous day but still below the $10 billion mark — indicating that traders are cautious amid market volatility.
Even so, analysts believe the ETF launches signal a critical turning point for Solana, reinforcing its legitimacy as an institutional-grade digital asset and providing the foundation for its steady hold above $200.
Bulls take charge as momentum builds
While retail demand for Solana remains unresponsive, the Solana price has been climbing steadily from $190 to $205, with short positions fading quickly.
Analysts note that bearish volume profiles are weakening while liquidity accumulates at higher price levels.
This shift has tilted momentum firmly in favour of buyers, with several technical indicators confirming the strength of the ongoing rally.
On the 4-hour chart, Solana trades above both its 50-day and 200-day moving averages, reinforcing the bullish setup.
The Ichimoku Cloud analysis shows a clear breakout, with price holding above key support between $197 and $201 — a signal that often precedes extended upward moves.
The Relative Strength Index (RSI) also hovers near 62, leaving room for additional gains before overbought conditions emerge.
Analysts now eye resistance zones between $204 and $208, followed by key hurdles at $216, $227, and $230.
Notably, a confirmed close above $205 could trigger a sustained rally toward these upper levels.
If momentum continues, higher targets around $237 and $253 come into view, aligning with Fibonacci retracement levels that mark previous swing highs.
Technical patterns hint at a repeat of 2023
Market observers have compared the current structure of Solana’s price chart to its 2023 breakout phase.
Analysts such as GalaxyBTC point to an ascending triangle pattern forming on the weekly chart, defined by a series of higher lows that indicate strong accumulation.
The critical support at $188 remains intact, representing the network’s largest volume cluster where many long-term holders entered the market.
A successful breakout above $200 would confirm the pattern and potentially lead to a test of $215 and $225, echoing the bullish behaviour seen two years ago.
The broader macro picture also appears supportive.
Some traders suggest that if the US Federal Reserve signals an end to quantitative tightening, it could inject much-needed liquidity into the market — providing another tailwind for Solana’s next leg higher.
Long-term outlook stays bullish
Even as short-term traders monitor resistance near $230, long-term analysts remain optimistic about Solana’s broader trajectory.
The asset has maintained a pattern of higher lows since early 2023, and its market structure mirrors the accumulation phase that preceded its previous bull run.
Projections place potential mid- to long-term targets around $300, $390, and even $520 if momentum and institutional demand persist.
In the near term, maintaining support between $198 and $200 is crucial.
If buyers continue to defend this zone, the Solana price could strengthen further, confirming its leadership among major altcoins.
As the first wave of Solana ETFs begins trading, the market’s sentiment has clearly shifted — bears are losing ground, and bulls now have their eyes fixed firmly on the $230 milestone.
Canary Capital’s HBAR and LTC ETFs approved for launch on Nasdaq.
The ETF approvals have sparked bullish momentum for Hedera and Litecoin prices.
Institutional interest in Hedera has also grown significantly with new global partnerships.
The long-awaited approval of the Hedera ETF and Litecoin ETF has arrived, marking a pivotal moment for both assets.
With trading set to begin on the Nasdaq, investor enthusiasm has driven renewed interest in HBAR and LTC, sending prices higher as markets react to the historic development.
A breakthrough amid a US government shutdown
In a surprising turn of events, Canary Capital confirmed that its spot ETFs tracking Hedera and Litecoin will launch tomorrow on the Nasdaq.
The approval comes despite the ongoing US government shutdown, which many assumed would halt all Securities and Exchange Commission (SEC) operations.
However, a recent procedural shift allowed issuers to bypass direct SEC intervention by letting their filings automatically go effective after 20 days.
According to Canary Capital CEO Steven McClurg, both ETFs have met all legal requirements and are ready to trade.
Bloomberg ETF analysts Eleanor Terrett and Eric Balchunas confirmed that the NYSE and Nasdaq have certified the required 8-A filings, the final step before shares can begin trading.
This development follows the model used for previous spot crypto ETFs, including those for Bitcoin and Ethereum, but with an even more dramatic twist, given the timing during a government shutdown.
🚨NEW: @CanaryFunds spot $HBAR and $LTC ETFs are now effective and will begin trading on the NASDAQ tomorrow, according to CEO @stevenmcclurg.
“Litecoin and Hedera are the next two token ETFs to go effective after Ethereum,” McClurg told me in a statement. “We look forward to… https://t.co/tPjsjLEE3R
The approval of the Hedera and Litecoin ETFs has energised the crypto market, sparking fresh optimism among investors who view it as another major step toward mainstream adoption.
Hedera’s native token, HBAR, has rebounded strongly, climbing to around $0.21 at press time and reclaiming critical technical levels.
Notably, HBAR’s rise above its 20, 50, 100, and 200 exponential moving averages signals a decisive bullish shift.
At the same time, the Litecoin price is attempting to break through its stubborn $100 resistance level.
LTC price briefly spiked above the $100 mark following the ETF announcement, reflecting heightened investor interest, though it has yet to confirm a full breakout.
Technical indicators, including the Relative Strength Index (RSI) and Moving Average Convergence/Divergence (MACD), suggest that a sustained move above $100 could mark the start of a broader bullish reversal for Litecoin.
Market data also shows a shift in trading behaviour.
Hedera’s open interest has declined from over $500 million earlier this year to roughly $163 million, indicating reduced speculative leverage.
This suggests that HBAR’s latest rally is being driven more by genuine spot demand than by leveraged futures trading — often a sign of healthier market growth.
Institutional momentum grows for Hedera
Beyond the ETF launch, Hedera’s recent institutional partnerships have strengthened its long-term outlook.
The network has been selected to participate in the Reserve Bank of Australia’s Project Acacia, exploring the use of distributed ledger technology (DLT) in tokenised financial markets.
It has also been chosen by the Bank of England for its DLT Challenge, further cementing Hedera’s position among credible blockchain platforms with real-world use cases.
Meanwhile, asset management giant T. Rowe Price has filed for an actively managed crypto ETF that may include both HBAR and LTC, signalling rising institutional confidence in these networks.
These developments are viewed as reinforcing the credibility of both assets at a time when regulated exposure through ETFs is gaining traction.
What traders should expect
If current momentum holds, Hedera price could test higher resistance zones near $0.25 and even $0.28 in the coming weeks, while Litecoin price may finally break through the $100 ceiling that has capped its rallies for months.
However, analysts maintain that Hedera (HBAR) must stay above $0.21, which has been established as the immediate support, for the bullish momentum to build.
At the same time, Litecoin (LTC) must stay above $99.67 for the $100 to come to effect.
Solana price is approaching a bullish breakout from a falling channel as its first U.S. spot ETF goes live. According to data from crypto.news, Solana (SOL) price rose 14% from its Oct. 23 low to an intraday high of $204.48…
Bitcoin (BTC) price continues to trade with upward momentum, recently reclaiming levels above $113,000 as market sentiment leans cautiously optimistic. The market has followed suit, with speculation of whether this momentum can be sustained amid tightening liquidity and rising volatility. However, several technical indicators now suggest a potential cool-off phase. This raises concerns of a short-term correction below the $110,000 support zone.
Is BTC Price Heading for a Pullback?
After rebounding sharply from lows near $107,800 earlier this week, Bitcoin has steadily reclaimed lost ground, climbing back above the $113,000 mark. This recovery reflects renewed buying pressure around key demand zones, supported by improving market liquidity and increased spot trading activity. However, BTC now faces a crucial test near the $114,500–$115,000 resistance area, where profit-taking has historically intensified. Momentum indicators hint at potential exhaustion, suggesting that if Bitcoin fails to secure a daily close above this range, a corrective drop toward $110,000—or even lower—could soon follow.
Another major reason to be bearish on Bitcoin is the recently formed CME gap with the lower range close to $110,000.
Bitcoin’s rebound from the $107,800 lows has lifted prices toward $114,600, yet the move now encounters a key CME gap between $110,700 and $113,500, as highlighted on the chart. This unfilled gap has become a focal point for traders, as Bitcoin often revisits these levels before establishing a sustained trend. The Ichimoku Cloud currently acts as dynamic resistance, with the upper boundary near $115,700 aligning with the gap’s top.
Historically, BTC has tended to “fill” such CME gaps before reversing direction, suggesting a possible short-term rejection if momentum weakens. Meanwhile, the RSI around 51 signals a neutral bias, indicating potential consolidation before the next major move.
Wrapping it Up
The recent rebound in Bitcoin (BTC) price underscores improving short-term sentiment, but the broader market remains cautious amid low volatility and mixed macro cues. A decisive move beyond the $115,700 cloud resistance could reignite bullish momentum across major altcoins, fueling renewed inflows into risk assets. However, failure to clear this zone may keep BTC range-bound, with traders eyeing $110,000 as a key defensive level. With upcoming macro events and ETF flows influencing liquidity, Bitcoin’s next move could set the tone for the entire crypto market heading into November.
Hyperliquid price rally appears to be cooling as a TD Sequential sell signal hints at short-term weakness despite strong on-chain catalysts. Hyperliquid was trading around $48.30 at press time, down 2.8% in the past 24 hours. Even with the daily…
Major cryptocurrencies slipped on Tuesday, Oct. 28 as investors turned cautious ahead of the Federal Reserve’s two-day policy meeting. Bitcoin fell 1.4% to $113,831, while Ethereum dropped 3.7% to $4,090. XRP declined 1% to $2.64, and BNB also fell 1.6%…
If you have been tracking the markets lately, you probably noticed that Hedera’s price just pulled off an impressive rally. HBAR price soared more than 10% in a single day and nearly 18.5% in a week. It has climbed above the important $0.20 level for the first time in months.
Why did this happen? The answer lies in the following 3 events. First, the much-anticipated launch of the Canary HBAR ETF (HBR) on Nasdaq opened the doors for institutional investors. Second, HBAR staged a breakout above major technical barriers, invalidating a long-standing bearish pattern. Finally, the broader altcoin rotation worked in HBAR’s favor.
HBAR Price Analysis
HBAR’s recent price action paints a striking picture of bullish revival. The current price sits at $0.2007, up over 10% in the last 24 hours and nearly 18.5% for the week. The surge comes with a robust 24-hour trading volume of $580.6 million and a market cap of $8.53 billion.
One of the most significant signals was the break above the 23.6% Fibonacci retracement level at $0.20116. This breakout also coincided with the price crossing above both its 30-day SMA at $0.19255 and the upper Bollinger Band, confirming that momentum shifted to the bulls. Additionally, the MACD histogram flipped positive (+0.0025).
On the sentiment side, HBAR’s surge invalidated a bearish descending channel. While the trend looks strong, the 14-day RSI sits at 48.45, which is considered neutral territory. This suggests there’s still room for upside before the token enters overbought conditions. The next test for the bulls is clear, immediate resistance looms at $0.233, the July swing high. If HBAR conquers this level, momentum could draw further inflows.
FAQs
What caused the recent HBAR price spike?
The HBAR rally is mainly driven by the new Canary HBAR ETF (HBR) launching on Nasdaq, a technical breakout above major resistance, and capital rotating from Bitcoin into altcoins.
Is HBAR’s current breakout sustainable?
HBAR’s breakout is supported by high trading volume, strong technical signals, and a neutral RSI. However, a retest of support levels may occur if bullish momentum fades.
What price levels should I watch next?
Traders should watch $0.233 as the next resistance. Support sits near $0.1925 (30-day SMA) and $0.1847, while holding above these keeps the bullish case intact.
ETH price is testing a crucial support level after carving out a bullish reversal pattern. Could a bounce from here put it back on track for a strong upward move? After rallying 10% to a weekly high of $4,232 on…
Cybersecurity in 2025 is not just the ability to ensure that hackers stay away. It is about securing massive networks, confidential data and millions of online interactions daily that make businesses alive. The world has never been more connected through global enterprise systems and that translates to more entry points to intruders. The 2025 Cost of a Data Breach Report by IBM states that the average breach now costs an organization and its visitors an average of 5.6 million dollars or approximately 15 percent more than it was only two years ago in 2023. That is a definite sign of one thing, that is, traditional methodologies are no longer enough.
This is where the blockchain-based cybersecurity protocols are starting gaining attention. Originally serving as the basis of cryptocurrencies, blockchain is becoming one of the most powerful barriers to enterprise systems. Blockchain is equally powerful in the cybersecurity domain because of the same characteristics that render it the optimal choice in the digital currency industry, transparency, decentralization, and immutability of data.
In this article, we shall endeavor to articulate clearly how blockchain will play its role in security to the large organizations. We are going to cover some of the definitions in the field of cybersecurity that will relate to blockchain, why cybersecurity is becoming such a large portion of 2025, and how it will be used by organizations to mitigate cybersecurity threats.
What Is Blockchain-Based Cybersecurity for Enterprises?
Blockchain can sound like a complicated word. But in simple terms, it means a digital record book that no one can secretly change. All transactions or actions recorded are checked and stored by many different computers at the same time. Even though one computer may be compromised, the “truth” is still safe among the other stored copies.
This is great for organizations. Large organizations run massive IT systems that have thousands of users, partners, and vendors accessing data. They hold financial records, customer data, supply chain documents, etc. If a hacker gets access to a centralized database, they can change or steal the information very easily. But with a blockchain, the control is distributed across the network, making it much harder for a hacker, especially in large organizations.
In a blockchain cybersecurity model, data can be broken into blocks and shared across the network of nodes (virtual), where the nodes will verify the data before being added to the blockchain. Once added, it is not possible to delete or modify it in secret. This makes it perfect for applications that require audit trails, integrity and identity management.
While blockchain is not an alternative to firewalls or antivirus software, it offers additional security similar to the solid base of a trusted solution that assures the data cannot be modified in secret. For example, a company could use blockchain to record every employee login and file access. If a hacker tries to fake an entry, the other nodes will notice the mismatch immediately.
Why Enterprises Are Turning to Blockchain for Cybersecurity in 2025
In 2025, there have already been digital attacks that have never been witnessed. In another instance, Microsoft declared in April 2025 that over 160,000 ransomware assaults took place every day, a rise of 40 percent compared to 2024. In the meantime, Gartner predicts that almost 68 percent of large enterprises will include blockchain as part of its security architecture by 2026.
Businesses are seeking blockchain since it eliminates a significant amount of historic burdens of possessing a digital security feature. The conventional cybersecurity functionality is based on a central database and central administrator. This implies that; in case the central administrator is compromised, the whole system may be compromised. Blockchain is not operated in this manner. No single central administrator can change or manipulate records in secrecy.
Here is a simple comparison that shows why many enterprises are shifting to blockchain-based protocols:
Feature
Traditional Cybersecurity
Blockchain-Based Cybersecurity
Data integrity
Centralized logs that can be changed
Distributed ledger, tamper-proof
Single point of failure
High risk if central server is hacked
Very low, multiple verifying nodes
Audit trail
Often incomplete
Transparent, immutable record
Deployment complexity
Easier setup but limited trust
Needs expertise but stronger trust
Cost trend (2025)
Rising due to more threats
Falling with automation and shared ledgers
As global regulations get tighter, enterprises also need systems that can prove they followed rules correctly. For instance, the European Union’s Digital Resilience Act of 2025 now requires financial firms to keep verifiable digital audit trails. Blockchain helps meet such requirements automatically because every transaction is recorded forever.
Another major reason is insider threats. In a 2025 Verizon Data Breach Report, 27 percent of all corporate breaches came from inside the company. Blockchain helps fix this problem by giving everyone a transparent log of who did what and when.
Key Blockchain Protocols and Technologies Used in Enterprise Cybersecurity
There are two main types of blockchains – permissionless and permissioned. A permissionless blockchain provides access to anyone publicly, for example, Bitcoin or Ethereum. A permissioned blockchain is typically used internally to an organization that only provides access to users with permission. Many enterprises tend to favor permissioned chains because of the security, compliance, and data control.
Let’s take a look at some of the form classes of blockchain technologies that are being used in enterprise cybersecurity today.
Smart contracts are programs that automatically run on the blockchain. A smart contract can execute the rules that are coded in the contract without an administrator needing to take action. For example, the smart contract would not permit an unauthorized user to access the information until an authorized digital key is used. The benefit of smart contracts is that they remove the human from the access granting process as a result limiting human error.
Identity and Access Management (IAM) with Blockchain
Traditional identity systems use central databases, which can be hacked or misused. Blockchain makes identity management decentralized. Each employee or partner gets a cryptographic identity stored on the blockchain. Access permissions can be verified instantly without sending personal data across multiple systems.
Threat Intelligence Sharing on Distributed Ledgers
Many enterprises face the same types of threats, but they rarely share that information in real time. Blockchain allows companies to share verified threat data securely without exposing sensitive details. IBM’s 2025 Enterprise Security Survey found that blockchain-based information sharing cut response time to new cyber attacks by 32 percent across participating companies.
Protocol / Technology
Use Case in Enterprise Security
Main Benefit
Permissioned Blockchain
Secure internal records and data sharing
Controlled access with strong audit trail
Smart Contracts
Automated compliance and access control
No manual errors or delays
Blockchain-IoT Networks
Secure connected devices in factories
Device trust and tamper detection
Decentralized IAM Systems
Employee verification and login
Reduces credential theft
Threat Intelligence Ledger
Global cyber threat data sharing
Real-time awareness and faster defense
How to Design and Deploy Blockchain-Based Cybersecurity Protocols in an Enterprise
Designing a blockchain-based security system takes planning. Enterprises must figure out where blockchain fits best in their cybersecurity setup. It should not replace every system, but rather add strength to the areas that need higher trust, like logs, identity, and access.
A good plan usually moves in stages.
Assessing Cybersecurity Maturity and Blockchain Readiness
Enterprises first need to check their current cybersecurity setup. Some already have strong monitoring systems and access control, others still depend on older tools. Blockchain works best when the company already understands where its weak spots are.
Designing Governance and Access Control
Blockchain does not manage itself. There must be rules about who can join the chain, who can approve updates, and how audits are done. Governance is very important here. If governance is weak, even a strong blockchain system can become unreliable.
Integration with Existing Systems
Enterprises use many other systems like cloud services, databases, and IoT devices. The blockchain layer must work with all of them. This is where APIs and middleware tools come in. They connect the blockchain with normal IT tools.
Testing and Auditing
Once deployed, the new blockchain protocol should be tested under real conditions. Security teams need to simulate attacks and watch how the system reacts. Regular audits should be done to check smart contracts and node performance.
Here is a table that explains the general process:
Phase
Key Tasks
Important Considerations
Phase 1: Planning
Identify data and assets that need blockchain protection
Check data sensitivity and regulations
Phase 2: Design
Choose blockchain type and create smart contracts
Think about scalability and vendor risk
Phase 3: Deployment
Install nodes and connect to IT systems
Staff training and system testing
Phase 4: Monitoring
Watch logs and performance on the chain
Make sure data is synced and secure
The companies that succeed in deploying blockchain for cybersecurity often start small. They begin with one department, like finance or HR, and then expand after proving the results. This gradual rollout helps avoid big technical shocks.
Real-World Use Cases of Blockchain Cybersecurity for Enterprises
By 2025, many global companies already started to use blockchain to protect data. For example, Walmart uses blockchain to secure its supply chain data and verify product origins. Siemens Energy uses blockchain to protect industrial control systems and detect fake device signals. Mastercard has been developing a blockchain framework to manage digital identities and reduce fraud in payment systems.
These real-world examples show how blockchain protocols are not just theory anymore. They are working tools.
Use Case
Industry
Benefits of Blockchain Security
Digital Identity Verification
Finance / Insurance
Lower identity theft and fraud
Supply Chain Data Integrity
Retail / Manufacturing
Prevents tampered records and improves traceability
IIoT Device Authentication
Industrial / Utilities
Protects machine-to-machine communication
Secure Document Exchange
Legal / Healthcare
Reduces leaks of private data
Inter-Company Audits
Banking / IT
Enables transparent, shared audit logs
Each of these use cases solves a specific pain point that traditional security tools struggled with for years. For instance, in industrial IoT networks, devices often communicate without human supervision. Hackers can easily fake a signal and trick systems. Blockchain creates a shared log of all signals and commands. That means even if one device sends false data, others will immediately see the mismatch and stop it from spreading.
In the financial sector, blockchain-based identity systems are helping banks reduce fraudulent applications. A shared digital identity ledger means once a person’s ID is verified by one institution, others can trust it without redoing all checks. This saves both time and cost while improving customer security.
Challenges and Risks When Using Blockchain for Enterprise Cybersecurity
Even though blockchain adds strong layers of protection, it also comes with some new problems. Enterprises must be careful during deployment. Many companies in 2025 found that using blockchain for cybersecurity is not as simple as turning on a switch. It needs planning, training, and coordination.
One of the biggest challenges is integration with older systems. Many large organizations still run software from ten or even fifteen years ago. These systems were never built to connect with distributed ledgers. So when blockchain is added on top, it can create technical issues or data delays.
Another major issue is governance. A blockchain network has many participants. If there is no clear structure on who approves transactions or who maintains the nodes, it can quickly become messy. Without good governance, even the most secure network can fail.
Smart contracts also come with code vulnerabilities. In 2024, over $2.1 billion was lost globally due to faulty or hacked smart contracts (Chainalysis 2025 report). A single programming error can create an entry point for attackers.
Then there is regulation. Legislations regarding blockchain are in their infancy. To illustrate, the National Data Security Framework 2025, which was launched in the U.S., has new reporting requirements of decentralized systems. Now enterprises have to demonstrate the flow of data in their blockchain networks.
Lastly, another threat is quantum computing. The cryptographic systems in the present could soon be broken by quantum algorithms. Although big-scale quantum attack is not occurring as yet, cybersecurity professionals already advise the implementation of post-quantum cryptography within blockchain applications.
Conclusion
Blockchain-based cybersecurity will transform the process of enterprise defense in the digital environment. In a blockchain, trust is encouraged by all members in the network where an organization usually depends on one system or administrator (or both) to keep the trust intact. It might not be short-term and might not be cost effective but it will be long term. In 2025, blockchain will be an enterprise security bargain, providing audit trails that are immutable, decentralized control, secure identities and more rapid breach detection.
Forward-looking organizations will have carbon floor plans, but they will also balance blockchain with Ai and quantum-resistant encryption techniques with conventional security layers. Our focus is not on replacing cybersecurity systems, but on strengthening cybersecurity systems with trustless verification outside of striking distance. In 2025, that is essential as hackers will make attacks and espionage more complex than ever, while blockchain offers something reliable and powerful, transparency that cannot be faked.
Frequently Asked Questions About Blockchain-Based Cybersecurity Protocols
What does blockchain actually do for cybersecurity?
Blockchain keeps records in a shared digital ledger that no one can secretly change. It verifies every action through many computers, which makes data harder to tamper with.
Are blockchain cybersecurity systems expensive for enterprises?
At first, they can be costly because they require integration and new software. But over time, costs drop since there are fewer breaches and less manual auditing.
How does blockchain help in preventing ransomware?
Blockchain prevents tampering and records all activity. If an attacker tries to change a file, the blockchain record shows the exact time and user. It also helps restore clean versions faster.
Is blockchain useful for small companies too?
Yes, but large enterprises benefit the most because they manage complex supply chains and sensitive data. Smaller firms can use simpler blockchain tools for data logging or document verification.
What industries are leading in blockchain cybersecurity adoption?
Financial services, manufacturing, healthcare, and logistics are leading in 2025. These industries need strong auditability and traceable data protection.
Glossary
Blockchain: A decentralized record-keeping system that stores data in blocks linked chronologically.
Smart Contract: Code on a blockchain that runs automatically when certain rules are met.
Node: A computer that helps verify transactions in a blockchain network.
Permissioned Blockchain: A private blockchain where only approved members can join.
Decentralization: Distribution of control among many nodes instead of one central authority.
Immutable Ledger: A record that cannot be changed once added to the blockchain.
Quantum-Resistant Cryptography: Encryption designed to withstand attacks from quantum computers.
Threat Intelligence Ledger: A blockchain system for sharing verified cyber threat data across organizations.
Final Summary
By 2025, blockchain has become a serious tool for cybersecurity in enterprises. From supply chain tracking to digital identity management, it helps companies create trust that cannot be faked. It records every change in a transparent and permanent way, reducing insider risk and external manipulation.
However, blockchain should not replace existing cybersecurity layers. It should work alongside traditional systems, adding trust where it was missing before. As businesses prepare for more advanced digital threats, blockchain stands out as one of the best answers, a shared truth system that protects data even when everything else fails.
Bitcoin (BTC) is showing renewed strength, reclaiming the $115,000 level after weeks of volatility and uncertainty. Bulls are attempting to build momentum for a potential impulse move higher, aiming to confirm a sustained bullish structure after the recent consolidation phase.
On-chain data continues to reveal a clear and repeating pattern tied to investor behavior and market cycles. Historically, when the percentage of Bitcoin supply in profit climbs above 95%, the market tends to enter an overheated phase, often leading to sharp corrections. These pullbacks serve as natural cooling periods, resetting sentiment and liquidity before the next major leg up.
Interestingly, each correction cycle has shown consistent bottoming zones around the 75% threshold, where long-term holders reaccumulate and market confidence begins to rebuild. More specifically, data highlights profit supply lows of 73% in September 2024, 76% in April 2024, and a recent rebound from 81%, signaling a potential mid-cycle recovery phase.
Bitcoin Supply in Profit Rises to 83.6% — Momentum Rebuilds Ahead of Key Threshold
According to top analyst Darkfost, the percentage of Bitcoin supply in profit has started to climb again, currently standing at 83.6%. This steady rise indicates that a growing share of Bitcoin holders are once again sitting on unrealized gains — a trend that often reflects improving sentiment and renewed market confidence.
Darkfost notes that this level can be interpreted as encouraging, suggesting that investors are willing to hold their BTC instead of realizing profits, anticipating further upside in the near term. Historically, such behavior has been characteristic of mid-cycle recovery phases, when fear starts to fade and accumulation resumes across both retail and institutional segments.
This stage of the cycle is considered healthy for rebuilding momentum, as it allows the market to stabilize after large corrections. Holders who previously capitulated often reenter at this stage, while long-term participants strengthen their positions, creating a more resilient market structure.
However, Darkfost cautions that once the supply in profit surpasses 95%, it typically signals overheated market conditions — a point where euphoria tends to replace rational conviction. In such phases, Bitcoin historically faces increased volatility and sharp corrections as overleveraged traders and short-term speculators take profits.
Bitcoin (BTC) is showing renewed bullish momentum, trading around $115,443 and successfully reclaiming key short-term support levels after weeks of consolidation. The daily chart highlights a strong recovery structure, with BTC breaking above both the 50-day and 100-day moving averages, signaling a shift in short-term market sentiment.
The next critical test lies at $117,500, a historical resistance zone that previously rejected multiple attempts in September and early October. A clear breakout and daily close above this level would likely confirm an impulse continuation toward $120K–$125K, opening the door for a more sustained uptrend.
Momentum indicators suggest strengthening buying pressure, while the recent bounce from the 200-day moving average near $107K underscores the market’s resilience. This level acted as a springboard for the current rally, aligning with the broader pattern of accumulation seen on-chain, where investor profitability is rising steadily.
However, BTC remains within a range-bound structure, and rejection at $117.5K could trigger short-term consolidation back toward $111K–$112K. Overall, Bitcoin’s technical outlook appears constructive — if the bulls can sustain above $115K and confirm strength above $117.5K, the market could transition into a new bullish leg, supported by improving investor sentiment and on-chain health.
Featured image from ChatGPT, chart from TradingView.com
So, I stumbled upon this interesting portable monitor, which is unusually large to be called "portable", but considering there are users who would want something that can be useful for both travel and regular use, the UMax 24 looked interesting. I have reviewed a few UPERFECT portable monitors, including the Dual-Stack UStation Delta Max, which is one of the best options for work and gaming. However, UMax's big 24.5-inch screen size makes it an interesting option for daily usage if you are considering a versatile option for your desktop and travel. Personally, I wanted to see if I could replace […]
Mike Selig has just been nominated by President Donald Trump to lead the Commodity Futures Trading Commission (CFTC).
According to multiple reports, crypto regulator Mike Selig is currently the chief counsel for the Securities and Exchange Commission (SEC) Crypto Task Force and has experience at the CFTC under former chair Chris Giancarlo.
The nomination comes as the Trump administration is trying to refine the regulation, oversight, and institutional framework of the digital assets space.
Who is Crypto Regulator Mike Selig?
Mike Selig’s background is a mix of traditional financial regulation and crypto-policy experience. He’s currently Chief Counsel for the SEC’s Crypto Task Force and has advised SEC Chair Jay Clayton.
Before that, he worked at the CFTC as a law clerk or counsel and was a partner at the law firm Willkie Farr & Gallagher, specializing in asset-management and digital-asset regulation.
He’s publicly commented on the classification of digital assets, including saying in 2023 that “XRP itself is simply computer code. A fungible commodity, like gold or whiskey.”
Hence, experts say he would bring regulatory gravitas and crypto awareness to the role.
The Timing and Strategy Behind the Nomination
Selig’s nomination comes at a time when the U.S. regulatory framework for crypto is in flux. Legislation like the CLARITY Act and the GENIUS Act are being set to clarify which agency oversees which types of digital assets.
Reports share that the CFTC and SEC just had joint discussions to eliminate fragmentation in crypto oversight. Crypto regulator Mike Selig is to replaces a previously stalled candidate, Brian Quintenz, whose appointment was met with industry push-back.
White House crypto adviser David Sacks described Selig as “deeply knowledgeable about financial markets and passionate about modernizing our regulatory approach” in his announcement.
What Selig’s Nomination Means for Crypto Markets
With Selig in charge, the CFTC may get more responsibility in the digital-asset space. The nomination is about the agency’s role in overseeing commodities and derivatives, including digital asset-related products.
Sources reported that Selig is charged with just as the CFTC is expected to take on new authority over the nearly $4 trillion crypto market.
Moreover, Selig’s comments and analysis of the Ripple Labs litigation show he’s comfortable classifying digital assets as commodities rather than securities, a big holding block in regulatory terms.
His appointment may make market participants open up more access to regulated platforms and vehicles.
Agency Boundaries and Oversight
The big question in crypto regulation has been jurisdiction: which agency regulates what? The SEC has always focused on securities, while the CFTC handles commodities and derivatives.
Crypto regulator Mike Selig’s nomination aligns with recent signals of cooperation between the two agencies. A joint roundtable held in September featured SEC Chairman Atkins and acting CFTC Chair Caroline Pham saying they would end decades of regulatory fragmentation.
Selig’s nomination reinforces that. According to expert analysis, his dual agency background means he can streamline overlapping regulatory mandates. That could mean clearer paths for token classification, custody frameworks, and digital-asset exchanges, fewer grey areas for issuers and investors.
Industry Reaction and Outlook
Industry has welcomed the nomination. The crypto community noted his previous comments and legal positions align with the adoption of digital assets. Charles Hoskinson, founder of Cardano, wrote on X:
“Chairman Selig is going to do a great job at the CFTC. I have full confidence in his ability and leadership.”
The media also said crypto regulator Mike Selig is seen as a market-friendly regulator compared to previous enforcement-heavy regimes. While confirmation by the Senate is still needed, the nomination itself is a signal that the regulatory environment may favor of more structured crypto oversight.
Conclusion
Crypto regulator Mike Selig’s nomination as CFTC chair means a big change for digital-asset oversight in the US. With experience at both the SEC and CFTC, Selig is put uo to lead at a moment of regulatory convergence, institutional engagement and legislative momentum.
His nomination means the US is doubling down on its goal to be a global hub for crypto innovation, with clearer rules and coordinated oversight.
The impact is expected to be far-reaching, from institutional access to token classification, custody services, and trading venues.
Glossary
CFTC: US regulatory agency that oversees commodity futures, options, and derivatives.
SEC: US federal agency; that enforces securities laws and regulates securities markets.
Crypto-Task Force: A unit within the SEC, focused on crypto-asset regulation, compliance, and enforcement.
Token classification: The legal determination of whether a digital asset is a security, commodity, or other asset class with regulatory implications.
Confirmation (Senate): The process by which the US Senate approves presidential nominees for agency leadership.
Regulatory convergence: The alignment of rules, mandates, and enforcement approaches across multiple agencies, to reduce conflict and overlap.
Frequently Asked Questions About Crypto Regulator Mike Selig
Who is Mike Selig and why is his background important?
Mike Selig is the current chief counsel for the SEC’s Crypto Task Force, previously worked at the CFTC and in private practice focused on asset-management and digital-asset regulation.
Why is this big for crypto?
He’s being nominated at a time of regulatory flux and legislative movement so clarity on oversight, token classification and institutional access might be seen.
What will the CFTC do under his leadership?
He may expand CFTC oversight of digital assets treated as commodities or derivatives and coordinate more with the SEC on securities-type tokens.
Is the nomination confirmed?
As of the latest report; he’s been nominated but still needs Senate confirmation before he can take the chair.
How is the crypto community reacting?
Many are positive; citing his prior legal commentary and regulatory experience. For example; Cardano’s founder is fully confident in his ability to lead the CFTC.
When market experts, watchers and enthusiasts speak of bull market in crypto, wild rallies, retail joy and altcoins mooning, are easily brought to mind . However, this cycle seems different. For many, the term crypto bull market no longer means euphoric highs, it feels like a grind.
The blockchains are active, big-name institutions are all in and the charts are up. But the energy and optimism of past cycles is missing. This is the backdrop that is making experts question why this crypto bull market grind has emerged, what’s shaping it and how it’s different from 2017 and 2021.
Institutions Took Over the Room
The tale around this cycle starts with institutions. Certain market reports call 2025 the year the “world went on-chain”, highlighting institutional adoption and stablecoins as the main themes. Traditional banking, asset management, and fintech firms have dabbled and built infrastructure, custody networks, and tokenization platforms.
As a recent sources put it, they say financial institutions have embraced crypto after years of watching from the sidelines.
This has changed the market. Instead of chasing altcoin hype, many big players are focused on regulated corridors, institutional custody and real-world asset tokenization.
In effect; they own the pipes through which retail traders must flow. The result therefore is that the cycle looks more like the maturation of crypto’s financial plumbing and less like the wild west of earlier years.
Memecoins Became the Culture Engine and the Drain
While institutions professionalized the space, the opposite force roared from the grassroots which are meme coins. Humor, irony and community tokens exploded across chains, changing the tone of the cycle. According to sources, what began as satire became the dominant narrative of 2024 and 2025.
Data shows meme coin market is still growing but in a weird way. In 2025, it is estimated to be 5-7% of global crypto market-cap, or $80-90 billion.
Platforms like Pump.fun on Solana enabled millions of tokens to launch, but most traders lost money while infrastructure owners made the money.
That changed the psychology of the cycle. Retail that once chased broad altcoin seasons found themselves playing mini-token launches and the odds were stacked against the individual.
The meme coin culture thrived but the era of alt-season joy became harder to sustain.
Macro Pressures Squeezed Risk Appetite
Beyond institutions and meme culture, the macro environment has had a big impact on this crypto bull market grind. High interest rates, risk-off sentiment and liquidity constraints reportedly killed speculative flows. And indeed in 2025, capital seems more expensive and speculative asset classes (many altcoins included) have fewer positive developments.
As a result, even though Bitcoin is at new highs, the rest of the market feels flat, lethargic or brutally repressed.
The interplay of institutional adoption which favors big, regulated assets, and macro caution which limits speculative leverage has created a cycle where growth exists but feels thin, incremental and far less exciting than previous bull runs.
Bitcoin’s Role in a Changing Narrative
Bitcoin on its own stays as the anchor. According to multiple market sources, Bitcoin price appreciation and growing legitimacy are backed by macro- and regulatory-driven forces not just hype. Reports say Bitcoin is core to crypto’s maturation.
This means the crypto bull market grind is less about risk-on altcoin explosions and more about consolidation, institutional ingress and standards of infrastructure.
For many in crypto, that is less exciting, but arguably more sustainable. The sentiment has shifted as this cycle is reinforcing the system rather than igniting wild outsized alts.
Conclusion
Combining these threads, a clearer picture of why the crypto bull market grind feels so different is obtained.
Institutional adoption has increased legitimacy but also anchored expectations around regulated assets rather than speculative up-swings.
Meme coins dominate cultural narratives but the upside is skewed and the environment is highly competitive and treacherous.
Macro conditions has restrained speculative flows and forced the market into a slower growth mode.
Bitcoin’s dominance means the broader market is less about wild rallies and more about incremental infrastructure growth and asset re-classification.
In short, this bull cycle is about transition from frontier experimentation to a more integrated, regulated, infrastructure-led phase of crypto.
This removes some of the fireworks but replaces them with the architecture of a financial system. For many who came for the “number goes up” style ride, the word “grind” feels apt.
Glossary
Altcoin: Any cryptocurrency other than Bitcoin.
Institutional adoption: The participation of big financial firms (banks; asset managers); in crypto assets and infrastructure.
Meme coin: A cryptocurrency built around internet memes; jokes or viral culture, with little underlying use.
Macro: Broad economic factors like interest rates, liquidity; inflation and risk appetite that affect asset markets.
Tokenization: Creating digital tokens to represent ownership of real-world assets; on a blockchain.
Bull: A market where prices are up everyone is positive and more people are buying.
Frequently Asked Questions About Crypto Bull Market Grind
Why does the 2025 crypto bull market feel different from past cycles?
Because the market is being shaped by institutional infrastructure; meme coin culture and macro constraints rather than widespread retail frenzy and broad alt-season surges.
Are meme coins still important in this cycle?
Yes, they are still culturally prominent and active, but their value dynamics are different. The infrastructure around them captures most of the returns and the environment is more competitive and less favorable for the average retail trader.
Is Bitcoin dominating because of maturity rather than hype?
Exactly. Bitcoin’s increasing institutional support; regulatory clarity and role as a foundational asset means it’s less subject to wild swings and more aligned with long-term finance systems.
Does this mean altcoins are dead?
Not dead, but altcoins face a tougher environment. With less speculative capital, more scrutiny and higher expectations for utility, only those with strong fundamentals and product-market fit are likely to perform.
Robinhood stock price continued its strong bull run and is slowly nearing its all-time high. Robinhood has jumped by 440% in the last 12 months, bringing its market capitalization to over $130 billion. It has soared by almost 2,000% from…
Rising open interest and whale buying signal bullish momentum.
The Hyperliquid price has seen a brief pullback after a significant surge today, shedding 1.2% to trade around $46.57.
Despite this short-term dip, the HYPE token remains up 19.5% over the past week, highlighting continued investor interest and optimism about the project’s long-term prospects.
The retracement follows a strong rally and reflects a blend of profit-taking, technical rejection, and growing competition in the decentralised derivatives space.
Competition and profit-taking weigh on sentiment
After a robust run last week, Hyperliquid encountered selling pressure near the 38.2% Fibonacci retracement level at $49.36.
The failed breakout prompted traders to lock in gains, leading to a brief correction.
The MACD histogram is flipping negative on the 4-hour chart, signalling weakening short-term momentum, while the RSI eased from overbought territory at 69.89, suggesting that the market needed a cooldown after a 19% weekly surge.
Part of the sell-off also reflects the growing rivalry between Hyperliquid and the newly launched Binance-backed Aster DEX.
Since its debut on September 17, Aster has attracted massive trading volumes, processing $20.8 billion on its first day compared to Hyperliquid’s $9.7 billion.
Aster’s rapid adoption and $2 billion in total value locked within a week have shifted liquidity across the decentralised perpetuals landscape, briefly denting Hyperliquid’s dominance.
Still, Hyperliquid maintains a commanding presence in the market.
With a $12.74 billion market cap and a total value locked (TVL) of $4.85 billion, it remains one of the largest decentralised derivatives platforms.
However, traders are watching closely as the project faces near-term headwinds from both external competition and internal supply pressures.
HYPE token unlock fears
The most immediate challenge facing HYPE is a looming token unlock event beginning on November 29.
Around 237.8 million tokens — roughly 24% of the total supply — will begin to unlock over 24 months.
At the current price, this adds nearly $500 million per month in potential sell pressure, partially offset by $65 million in monthly buybacks from the project’s treasury.
This could lead to a monthly imbalance of around $410 million, which could lead to near-term volatility as the market adjusts to the increased supply.
Despite these concerns, the project’s $1 billion treasury filing, connected to the Sonnet Bio and Rorschach merger, could help counterbalance some of the dilution fears.
The treasury’s size and strategic reserves give the team room to manage liquidity and maintain market confidence through buybacks or ecosystem growth initiatives.
On-chain data shows bullish undercurrents
While short-term traders may focus on resistance levels, derivatives, and on-chain data tell a more optimistic story.
Futures open interest (OI) on HYPE has surged from $1.27 billion last Wednesday to $1.97 billion on Monday, the highest level since early October.
Rising open interest signals new capital entering the market, typically an indicator of growing bullish conviction.
Data from CryptoQuant also shows that whales — large investors — are increasing their positions, with buy orders dominating both spot and futures markets.
This accumulation trend suggests that institutional and high-net-worth participants expect further gains ahead.
Network data reinforces this bullish sentiment.
According to Artemis Terminal, Hyperliquid’s 24-hour chain fee revenue reached $2 million, surpassing edgeX and BNB Chain.
High network fees often correlate with elevated trading activity and liquidity, signalling robust user engagement even amid short-term market uncertainty.
Key technical levels to watch for the Hyperliquid price
Technically, HYPE has shown resilience after breaking above its descending trendline and the 50-day exponential moving average (EMA) at $43.54.
Over the weekend, it held that level as support before climbing back above $48.57.
If the token closes above the next resistance at $51.15, analysts expect the rally to extend toward the record high of $59.46, last seen on September 18.
However, a failure to hold above the $43.54 EMA could open the door for a deeper correction toward the $41.6 support zone.
ZEC is the best performer among the top 30 cryptocurrencies by market cap, up 12% in the last 24 hours.
The coin is now trading above $350 and could rally higher in the near term.
ZEC surges above $350 as rally continues
ZEC, the native coin of the ZCash ecosystem, has continued its rally, up 12% in the last 24 hours. The rally comes after the coin added 380% to its value in the last 30 days, outperforming other major cryptocurrencies.
The positive performance comes after Solana, the world’s second-largest smart contract platform, launched wrapped ZEC via the Zolana bridge. The wrapped tokens function as standard Solana Program Library (SPL) tokens. Hence, they don’t offer the privacy protections inherent to native Zcash.
Furthermore, they are backed 1:1 by native ZEC but do not conceal balances or transaction data.
ZEC targets $400 as bullish trend continues
The ZEC/USD 4-hour chart is bullish and efficient thanks to the coin’s ongoing rally. The technical indicators are bullish, suggesting that buyers are currently in control. The bullish trend could see ZEC’s price surge higher in the near term.
The Relative Strength Index (RSI) of 67 shows a bullish bias, with the buyers currently in control. The MACD lines are also within the positive region, suggesting that the price could surge higher in the near term.
If the bullish trend continues, ZEC could rally towards the $400 level over the next few hours or days. An extended bullish run would allow ZEC to hit a multi-year high of $500 in the coming days or weeks.
However, if ZEC faces a correction following its recent run, it could retrace to the ILQ at $318 over the next few hours. Further downtrend could see ZEC drop to the major support and TLQ level at $235. This support level will likely hold in the medium term, allowing ZEC to build on its recent run.
Despite the drop, trading volume was only 7.55% above the weekly average, suggesting routine profit-taking rather than a significant shift in sentiment.
BNB price rebounds from $1,133 support following the 33rd quarterly token burn on the BNB Smart Chain, reinforcing bullish momentum toward higher resistance levels. Binance (BNB) price has rebounded sharply from the $1,133 support zone after the successful completion of the 33rd quarterly…
Pi Network price faces renewed selling pressure after a strong rejection at $0.29, with price action showing signs of weakness that may extend toward $0.19 support. Pi Network’s (PI) price action has turned sharply bearish following a clear rejection from…
The Dogecoin price shows quiet strength as retail sentiment stays weak. Dormant whales accumulated 15.1 million DOGE, worth about $2.95 million, signaling renewed long-term confidence.
The move contrasts sharply with soft trading activity among small investors. Many retail holders continue to sell into every minor rally, showing limited confidence in short-term gains. The cautious behavior reflects broader market uncertainty and hesitation to buy at current levels.
Whales Reactivate as DOGE Accumulation Rises
On-chain data reveals a steady accumulation of DOGE by high-value wallets. One whale address reactivated after months of dormancy, adding 15.1 million DOGE to its holdings.
It later sold 7,473 DOGE for about $1,450, leaving 15.19 million DOGE valued near $12.96 million. Analysts view this as a strong signal that institutional or early adopters are positioning ahead of the next market phase.
While retail traders appear cautious, large wallets are quietly adding exposure. This split in behavior highlights an ongoing tug-of-war between speculative exit and long-term accumulation.
Whale Accumulation Signals Faith
Dormant whale accumulation often precedes renewed confidence among experienced holders. These “smart money” actors typically buy when the Dogecoin price trades near historical support zones. Their activity indicates belief in a medium- to long-term recovery, even when short-term metrics appear bearish.
Whale wallets moving after long silence also suggest that value recognition is returning to the meme-coin sector. Despite a weak broader market, their actions may mark early groundwork for the next uptrend.
Weak Retail Sentiment Persists
Despite whale optimism, retail traders are doing the opposite. CryptoQuant data shows that the Spot Taker CVD remained negative through October, signaling sustained selling pressure. This metric reveals that most traders continue to execute aggressive sell orders rather than buy into dips.
SourceL CryptoQuant
Supporting this, Coinalyze data reports a persistent negative Buy–Sell Delta. Over the past 30 days, Dogecoin recorded 156.67 million in sell volume versus 154.88 million in buy volume — a net negative of 1.79 million DOGE. This imbalance confirms that retail enthusiasm has yet to return.
Source: Coinalyze
Technical Setup Remains Bearish
The DOGE USD price is still hovering below the main moving averages. It is bellow the 20,50,100 and 200 EMA lines which are pointing down. The Directional Movement Index supports this view, as the Positive Index is very close to 12 and the Negative was near 39.
Month
Minimum Price
Average Price
Maximum Price
Potential ROI
October
$0.192
$0.195
$0.198
-2.6%
November
$0.224
$0.237
$0.250
23%
December
$0.225
$0.232
$0.238
17.1%
Buyers need to break more than $0.20 (20 EMA level) for the Dogecoin price trend to become bullish. A follow-through recovery back above the 50–100 EMA zone.
Source: TradingView
Around $0.21 is likely to pave the way for an extension of the up-move towards the $0.22 intermediate hurdle in the near-term. If it does not, the price can remain range-bound between $0.17 and $0.20 for an extended period.
Market Momentum Building Slowly
Despite the present soft performance, Dogecoin price exhibits superior resilience when compared to larger altcoins. It was up more than 2% this week compared with the CD5 index. Trading volume was 9.8% above the seven-day average, a sign of institutional participation.
The pattern suggests “early-cycle momentum building,” says market strategist Rishi Patel of Bluepool Digital. “DOGE’s resilience while Bitcoin and Ethereum consolidate suggests rotation flows are returning to higher-beta assets,” Patel said.
Chart Indicators Show Stability
Technical charts indicate that dogecoin is supported by an uptrendline, drawn from $0.1949 low on the hourly chart. Steady re-tests at $0.2060–$0.2070 support indicate buyers remain in the market daily. RSI is sitting at around 58 on the 4-hour — just like you’d expect early in a trend.
The MACD indicator remains in the positive area but starts to narrow, indicating light consolidation following an attempt to break out. This action suggests re-accumulation, not exhaustion, analysts said. The bias remains bullish with sustained closes above $0.2085.
What Lies Ahead for Dogecoin Price
But if buyers take over, Dogecoin price may rise towards $0.22 and then at the end of this week or next, to $0.25 ahead of new conditions next month. But an inability to take out the resistance levels may extend sluggishness.
Although most long-term holders still talk about DOGE as a speculative — yet resiliently decentralized– digital asset. Its strong community and growing whale interest keeps its story running even in slow markets.
Conclusion
The Dogecoin price narrative today is emblematic of the quiet confidence beneath the surface. Whales that were previously dormant are accruing millions, while retail traders are even hopping out.
Technicals are still cautious, momentum indicates slow-building recovery. If DOGE can break above $0.20 and maintain, that will signify its next leg. For the time being, the whales seemed to be gambling that patience would pay.
Whale: A name for someone holding a large quantity of cryptocurrency who is able to manipulate the market.
Dormant Wallet: A cryptocurrency or blockchain wallet that has gone dormant, and is either empty or contains an insignificant sum of cryptocurrency.
On-Chain Data: Information written to a blockchain itself, which can be utilized to track wallet movements, transactions and the general health of network.
Retail Traders: Small, individual investors usually trading in small quantities who generally follow the short-term market favourite.
Spot Taker CVD: A measure of trading that compares volumes of buying and selling in the spot market, with negative values indicating pressure to sell.
Frequently Asked Questions About Dogecoin Price
1- Is the Dogecoin price bullish or bearish?
Short-term signals remain bearish, but whale accumulation hints at early bullish positioning.
2- Why are whales buying Dogecoin?
Dormant wallets suggest long-term investors see value at current levels and expect gradual recovery.
3- What price levels should traders watch?
Key resistance sits at $0.20 and $0.21. A breakout above $0.2085 could confirm new upside momentum.
4- Are retail traders supporting the move?
Not yet. Retail sentiment remains weak, with net selling pressure persisting for most of October.
In the latest development within the US-China trade deal, both countries have hinted at a peaceful agreement ahead of the meeting between Donald Trump and Xi Jinping. This development has sparked widespread enthusiasm within the crypto market, with experts and investors anticipating a potential rally.
According to Treasury Secretary Scott Bessent, Trump is likely to eliminate the 100% tariffs on Chinese imports, which were slated to take effect on November 1. The deal also includes a potential final agreement on the sale of TikTok in the US.
US-China Trade Deal Takes a Turn
Reportedly, senior finance and trade officials from the US and China met in Kuala Lumpur, Malaysia, to discuss trade ahead of a meeting that President Donald Trump scheduled with Chinese President Xi Jinping in South Korea, later Trump expressed hope the US and China were nearly ready to wrap up a trade deal, mentioning, “I have great regard for President Xi, and we will certainly end up with the deal.”
Li Chenggang, China’s senior trade negotiator, supported the agreement, but said it has to pass through the approvals in the Chinese administration. He noted,
“The US position has been tough. We have experienced very intense consultations and engaged in constructive exchanges in exploring solutions and arrangements to address these concerns.”
Scott Bessent Hints at Chinese Tariff Removal
On Sunday, following the discussion between officials, US Treasury Secretary Scott Bessent revealed the remarkable progress in the US-China trade deal. He stated that the US is likely to remove the 100% tariff imposed on Chinese imports. “I think we’ve reached a substantial framework for the two leaders who will meet next Thursday,” stated Bessent, adding,
“President Trump gave me a great deal of negotiating leverage with the threat of 100% tariffs on November 1, and I believe we have reached a very substantial framework that will avoid that and allow us to discuss many other things with the Chinese.”
Trump-Xi Meeting on Thursday
This week is poised to witness a series of macroeconomic events poised to reshape the crypto market. A significant event is the soon-to-happen encounter between Donald Trump and Xi Jinping. The two heads of state will talk about important matters like tariffs, rare earth exports, and agri-product payments on Thursday.
Since a cordiality agreement has apparently been made between the nations, the meeting is going to be a plus.. The meeting could result in final decisions on the Chinese tariff, China’s rare earth exports, and the TikTok sale.
How Will the Crypto Market React?
The potential US-China trade deal has sparked widespread enthusiasm and excitement in the crypto space. “Asset prices will get crazy this week if the US-China trade deal is announced and the Fed cuts interest rates. Buckle up,” said investor and analyst Anthony Pompliano.
Notably, the crypto market is sensitive to trade war developments. This is significantly evident from the recent crypto crash on October 11. Described as the greatest of all crypto falls ever, the 1011 crash occurred in response to Trump’s 100% tariff announcement.
Thus, if the upcoming meeting ends the ongoing US-China trade war with a peaceful agreement, it could propel the crypto market into new heights. As of press time, the market is in the green zone, reaching $3.89 trillion, up 2.37%. As the industry shows signs of recovery from the recent downturn, the upcoming US-China trade deal could trigger a remarkable rally.
Conclusion
In conclusion, optimism has once again returned to global markets, including cryptocurrency markets, based on expectations of a US-China trade deal. The countries have announced they are negotiating and Trump will likely not continue with his tariff proposals, and investors are gearing up for a rally. The peace-declaring resolution that would come from Thursday’s Trump-Xi meeting could mark a pivotal shift, restoring faith and igniting a bullish trend in cryptocurrency markets.
Frequently Asked Questions
When will the Trump-Xi meeting take place? The meeting is on Thursday in South Korea.
What are the main points of the trade agreement between the US and China? The agreement’s key points are the reduction of tariffs, the exportation of rare earths, and the sale of TikTok.
What is the implication of the deal for the cryptocurrency market? A peaceful trade resolution could enhance investor confidence and launch a strong crypto rally.
Glossary
Tariff: A tax that is levied by the government on goods that are imported, usually for the reason of protecting native industries or as part of a trade negotiations strategy.
Trade Deal: A pact that governments sign between each other, regulating trade terms like import and export restrictions and taxes, with the overarching goal of fostering economic collaboration.
Rare Earth Exports: Transportation of very important minerals that can be found in the electronics industry and technology, quite often a power point in trading negotiations.
TikTok Sale: The intended process of transferring the ownership or control of the highly regarded social networking app TikTok’s US subsidiary to satisfy American regulators’ demand.
Crypto Market: The worldwide trading platform for digital currencies such as Bitcoin and Ethereum, typically affected by changes in economic and political situations.
ETH is up 5.5% in the last 24 hours and is now trading above $4,100.
The coin could rally towards the $4,500 resistance level soon.
Ether hits $4,200 as the bullish trend returns
Ether, the second-largest cryptocurrency by market cap, is up by more than 5% in the last 24 hours. The rally allowed the coin to briefly hit the $4,200 level before retracing to now trade at around $4,160 per coin.
This latest development comes as Bitcoin and the broader cryptocurrency market recorded an excellent weekend. Bitcoin is trading above $115k once again after adding 3.5% to its value.
With Bitcoin, Ether, and other leading altcoins recording gains, the total cryptocurrency market cap now stands at $3.91 trillion. Ether could rally higher in the near term, with the technical indicators suggesting further buying pressure.
Ethereum could surge to $4,500 amid bullish indicators
The ETH/USD 4-hour chart is bearish and efficient despite Ether adding 5% to its value in the last 24 hours. The technical indicators suggest that Ether could face further buying pressure thanks to its rally.
Ether’s price surged by 5% last week, closing the weekly candle above the 50-day EMA at $4,129 on Sunday. It briefly climbed to $4,206 on Monday before retracing to now trading around $4,160.
The RSI of 67 shows a bullish momentum, with the MACD lines flashing a buying signal in the last few days. If Ether breaks and closes above its daily resistance of $4,232, it could continue its rally towards the next major resistance and TLQ level at $4,529. An extended bullish run could allow Ether to reclaim its recent high above $4,700.
However, if Ether faces a correction following its recent run, it could dip towards the major support level at $3,593.
7M users have migrated to Pi mainnet, boosting market confidence.
PI Network price is nearing a $0.30 breakout amid tight exchange supply and strong demand.
ISO 20022 integration could link Pi to SWIFT and global banking systems.
The Pi Network price has staged a strong rebound, with the PI coin surging above key resistance levels amid renewed market optimism.
This rally comes on the heels of a major mainnet migration involving 2.7 million users and growing anticipation ahead of the network’s ISO 20022 financial integration scheduled for November 22, 2025.
Bulls regain control as Pi Network adoption surges
Pi Network’s market momentum has accelerated in recent days, with the token’s price climbing more than 25% in 24 hours and over 30% over the week.
The price currently hovers near the $0.28 mark, just shy of the psychological $0.30 breakout target eyed by bullish traders.
The price surge follows the completion of mass Know Your Customer (KYC) verification that enabled 2.69 million “Pioneers” to migrate their tokens to the mainnet.
🚨Welcome to the Mainnet! A massive 2.69 million Pioneers have migrated their Pi in the last week alone after a huge KYC verification wave. The ecosystem is expanding rapidly as we approach the Nov 22 ISO 20022 integration. The future of finance is being built now🚀#PiNetworkpic.twitter.com/zU1Myw7oGJ
The migration marks one of the largest transitions in Pi’s history and signals growing confidence in the network’s long-term viability.
This migration has triggered a surge in market demand, particularly as millions of tokens were moved into circulation while exchange supplies tightened.
According to PiScan data, centralised exchanges (CEXs) recorded an inflow of more than 2.422 million PI tokens in the past 24 hours, but this was offset by strong accumulation activity.
Source: PiScan
In October alone, over eight million tokens exited exchanges, reducing available supply by roughly 2.4%.
This supply squeeze has been a key catalyst in Pi’s latest rally, easing sell pressure and fueling upward momentum.
Technical setup supports Pi Network price recovery
Technically, the Pi Network price is displaying a clear attempt to break out of a bullish pattern.
The token recently exceeded the 50-day Exponential Moving Average (EMA) at $0.2627, a level that previously acted as a strong resistance zone.
A sustained movement above $0.28 could be a confirmation of a breakout that could target $0.36 in the short term.
Momentum indicators, however, paint a mixed picture, with the Relative Strength Index (RSI) currently sitting above 58, suggesting the asset is approaching overbought territory.
At the same time, the Money Flow Index (MFI) hints at slowing inflows, creating the possibility of short-term consolidation before another push higher.
A failure to reclaim $0.28 could trigger a pullback toward $0.20, where strong support has held since mid-October.
The network’s strong fundamentals and reduced exchange supply continue to draw traders and long-term holders.
Pi’s recovery from its October low of $0.172 to recent highs around $0.29 underscores the renewed optimism surrounding the project.
ISO 20022 integration boosts real-world confidence
Beyond market charts, Pi Network’s ecosystem continues to mature rapidly.
The project’s upcoming ISO 20022 integration, aligned with the global financial messaging standard, is seen as a gateway to real-world adoption.
The move will allow Pi to connect more efficiently with banking systems, potentially enabling SWIFT compatibility for faster and cheaper cross-border transactions.
Built on the Stellar Consensus Protocol (SCP), Pi Network’s blockchain prioritises scalability, security, and energy efficiency.
This technical framework supports regulatory compliance while minimising environmental impact, positioning Pi alongside ISO 20022-compliant assets like XRP and XLM.
Community confidence has also strengthened as Pi’s automated KYC system verified over 3.36 million users, resolving one of the project’s major bottlenecks.
The growing mainnet base now stands at 2.69 million active users, reflecting sustained ecosystem expansion ahead of the November 22 milestone.
Outlook: Can Pi coin sustain its momentum?
The Pi Network price rebound reflects both technical recovery and growing ecosystem confidence.
While short-term traders eye the $0.30 resistance for signs of continuation, long-term observers point to Pi’s steady progress toward financial standardisation and global interoperability.
As the project approaches its ISO 20022 rollout, Pi Network is steadily bridging the gap between blockchain and traditional finance.
But whether the current bullish run holds or pauses for consolidation, the network’s growing user base, tighter token supply, and upcoming integrations suggest that the Pi Network price may be entering a defining phase in its evolution toward real-world adoption.
Bitcoin price breaks out of a local triangle pattern and rallies toward $115,000, but the move faces major resistance at the channel high where a potential bull trap could emerge. Bitcoin (BTC) price has successfully broken out of a local triangle…
As October draws to a close, optimism around Bitcoin price prediction 2025 is heating up. With BTC reclaiming key technical levels and macro events aligning in the final week of the month, November could emerge as the ignition point for a major bullish phase across crypto markets led by Bitcoin’s resurgence.
Macro Triggers Align for a Perfect Storm
This final week of October is shaping up to be one of the most pivotal in months. Multiple macro catalysts are converging simultaneously, as an analyst has mentioned that the end of quantitative tightening (QT) could be near, potential rate cuts have a higher likelihood than ever, a $1.5 trillion liquidity injection could boost US sentiment, and renewed U.S.-China cooperation could completely rejuvenate the market.
If these developments unfold as anticipated, the result could be a massive surge in global liquidity and risk appetite. The combination of macro, liquidity, and narrative dynamics sets a near-perfect stage for a breakout going into November.
Bitcoin price today is trading around $115,196, marking a sharp 12% rebound from its mid-October low of $103,750. This surge has propelled BTC price above its 200-day EMA, a historically significant indicator.
The last time Bitcoin crossed this level was in Q2 2025, it triggered a powerful upward rally, and similar momentum appears to be building again.
On the Bitcoin price chart, the move above all above major EMAs into new support zones. Now, sustaining above them reinforces bullish sentiment and increases the likelihood of continued upside in the BTC price USD range.
Based on the bullish circumstances from this week’s event, the coming November could see the primary target of $ 130,000 and the next target at $ 145,000 before the year concludes, if bullish momentum continues.
ETF Inflows Return as On-Chain Metrics Flash Green
Following a series of outflows, Bitcoin ETF products are now experiencing net positive inflows. On October 24, $90 million in fresh institutional capital flowed into Bitcoin ETFs, signaling renewed investor confidence.
If this momentum continues, october ending days could attract even more institutional liquidity into the market before heading into November.
Simultaneously, on-chain data reveals a steep decline in Bitcoin exchange reserves since September, implying mass accumulation by long-term holders.
Over the past ten days, nearly 7 million BTC have moved back into profit territory, including 5.1 million coins held by investors under six months, per an CryptoQuant insight. This shift indicates growing conviction among newer market participants and a strengthening market structure.
Psychological Shift Reinforces Bitcoin Price Forecast November 2025
Behaviorally, profitability breeds confidence. As short-term holders see consistent gains, they’re less likely to sell prematurely and more inclined to add to positions. This gradual transformation from short-term speculation to medium-term conviction is a hallmark of early bull market phases.
If Bitcoin maintains its position above these realized price levels, it could confirm a structural transition back to optimism potentially paving the way for another leg up in the broader crypto rally. With momentum, macro alignment, and ETF inflows all trending upward, the Bitcoin price prediction 2025 looks increasingly promising.
FAQs
How much will 1 Bitcoin cost in 2025?
As per Coinpedia’s BTC price prediction, the Bitcoin price could peak at $168k this year if the bullish sentiment sustains.
How much will 1 Bitcoin be worth in 2030?
With increased adoption, the price of Bitcoin could reach a height of $901,383.47 in 2030.
How much will the price of Bitcoin be in 2040?
As per our latest BTC price analysis, Bitcoin could reach a maximum price of $13,532,059.98
How high will Bitcoin go in 2050?
By 2050, a single BTC price could go as high as $377,949,106.84
Bitcoin Cash has burst back into the spotlight with a sharp upward move that is catching traders’ attention. In just one day, the BCH price has climbed 6.64% to $558.91, and in the past week alone, it’s rallied an impressive 16.28%. With the market cap pushing $11.17 billion and 24-hour trading volume spiking 65% to $774.45 million, Bitcoin Cash is showing real momentum.
What’s behind this comeback? First, fears of a $4 billion Bitcoin and BCH sale have eased now that repayments from the long-awaited Mt. Gox case are delayed until 2026. That has taken a big supply shock off the table for now. Adding fuel to the rally, T. Rowe inclusion of BCH in its crypto ETF filing is being seen as a nod of institutional validation.
BCH Price Analysis
Looking at the charts, Bitcoin Cash price has punched through both the 7-day and 30-day SMAs. It is now standing clear above $497.86 and $536.94. At $558.91, BCH is trading close to its daily peak of $564.25, miles above the session low of $536.57. The RSI14 sits at 58.45, which gives a neutral-to-bullish read. The MACD histogram has turned positive with a +5.82 print, supporting the bullish view.
A rising 24-hour volume, up nearly 66%, confirms that buyers are not just optimistic but also backing their conviction with real capital. Price is currently challenging the 23.6% Fibonacci retracement level at $577.32. This is a critical area, a clear close above $577 could open the door for a move toward the next resistance zone at $615. Contrarily, the $534 support level will be closely watched. Holding above it keeps the uptrend intact, while a break back below could lead to profit-taking.
The current backdrop suggests that traders are eyeing a potential bullish continuation, provided that volume stays high and no negative headlines emerge. With institutional interest growing and technicals aligning, Bitcoin Cash price prediction models are becoming increasingly optimistic for the week ahead. However, markets can turn quickly, so monitoring key levels and adjusting risk is crucial.
FAQs
What is driving Bitcoin Cash’s latest price rally?
This move is fueled by a mix of positive technical signals, a significant drop in sell-off fears due to the Mt. Gox repayment delay. And growing institutional interest as justified by ETF filings mentioning BCH.
What key levels should BCH traders watch?
Critical resistance sits at $577 and $615. Support is at $534. A close above $577 may trigger further gains, while a slip below $534 could spark selling.
Is the trend for BCH likely to remain bullish?
Momentum is bullish with rising volume and positive MACD. Still, staying above $534 is crucial for the rally to continue. A move below could stall upward momentum.
The broader crypto market appears to be approaching a major turning point and XRP price is positioned right in the middle of it. With liquidity expected to surge and macro catalysts aligning, XRP’s consolidation phase could soon give way to a decisive breakout, setting the tone for a new bullish cycle.
Liquidity Floodgates and Macro Dominoes Align
As the global economy braces for a series of synchronized macro shifts, risk assets like crypto are gaining renewed attention. The end of quantitative tightening (QT), the prospect of rate cuts, and a $1.5 trillion liquidity injection are building the foundation for what could be a historic rally.
Combined with easing U.S.-China tensions and strong S&P earnings, the current setup paints a “risk-on” environment. This perfect storm of liquidity, narrative, and capital rotation makes digital assets such as Bitcoin, Ethereum, and particularly XRP stand out among blue-chip cryptocurrencies.
XRP Price Enters a Symmetrical Triangle: Accumulation Before Expansion
Currently, XRP price hovers around $2.62, with a market cap of $157 billion and $4.49 billion in 24-hour trading volume. On the XRP price chart, the token is converging within a symmetrical triangle pattern.
This price compression indicates an extended accumulation phase. Smart money appears to be quietly positioning ahead of what could be a significant shift once volatility expands. The resilience of XRP price today highlights growing investor confidence despite ongoing macro uncertainties.
Interestingly, on-chain metrics from the XRP Ledger DEX are flashing bullish signals. Since May 2025, while price consolidation has continued, the DEX transaction count has been steadily rising shows that order activity and liquidity are building beneath the surface.
This surge in transactional engagement, including order placements and cancellations, reflects heightened participation from sophisticated traders. Such patterns typically precede strong price movements, suggesting that the market is “coiling the spring” for a sharp upside breakout once catalysts align.
ETF Momentum Could Redefine the XRP Narrative
Perhaps the most influential upcoming driver for XRP crypto is the growing anticipation around a potential XRP ETF launch. Recent discussions indicate that spot crypto ETFs for XRP, Solana, and Litecoin are ready for regulatory clearance once Washington resumes full operations.
Market commentators describe this situation as a “dam about to burst,” with the delay in approval being the only barrier holding back institutional inflows. Once lifted, the wave of new ETF products could dramatically increase XRP exposure, shifting it from an accumulation phase to a sustained XRP price rally.
FAQs
How much will XRP reach in 2025?
Analysts and AI forecasts project XRP could reach $5.05 by the end of 2025, driven by ETF approvals, partnerships, and regulatory clarity.
How much will 1 XRP be worth in 2030?
Based on compounding growth and adoption, projections estimate XRP could trade around $26.50 by 2030, with averages near $19.75.
Can XRP make you a millionaire?
Hypothetically, yes—if XRP reaches $500+ and an investor holds a significant amount (e.g., 2,000 XRP). However, this is speculative and depends on extreme long-term growth.
Is XRP a Good Investment?
XRP is considered a strong investment due to its institutional adoption, regulatory progress, and role in cross-border payments. However, it carries volatility risks like all cryptocurrencies.
XRP price rally found substantial resistance at the 50-day moving average despite its strong fundamentals, including the growing Ripple USD market cap and ETF inflows. Ripple (XRP) token jumped to a high of $2.6340, its highest point since October 11.…
The market opens with a calmer stride. Crypto prices reflect a modest bid across majors as funding normalizes and forced selling cools. Traders are watching policy signals and liquidity conditions, with attention on whether easing talk translates into sustained flows. Positioning looks cleaner than it did late last week, which tends to reduce whipsaws and gives price action a chance to breathe.
Bitcoin (BTC)
Bitcoin trades in a tightened range, and that alone feels constructive after a choppy weekend. The first task for bulls is to defend recent higher lows while pressing toward the upper band of resistance seen in overnight trade.
Derivatives data shows a softer pace of liquidations than earlier in the week. When volatility cools without a sharp drop in open interest, it often signals that participants are rebuilding positions with more caution. If macro headlines lean supportive, crypto prices can grind higher as systematic buyers follow momentum signals.
Ethereum (ETH)
Ethereum continues a measured catch-up. The market likes the improving depth on major pairs and the narrative around network activity stabilizing after the last burst of upgrades. Traders are focusing on the 4,200 to 4,300 zone as a pivot that can flip sentiment from cautious to constructive.
If spot demand holds into the close, the door opens for a test of the next shelf above. In that scenario, crypto prices for ETH tend to pull alt liquidity with them, especially in high quality large caps.
Ripple (XRP)
XRP is steady after recent swings. The coin’s behavior has been textbook range trading, with quick fades at resistance and fast rebounds near support. That rhythm suggests market makers are active and retail is respecting levels. A clean close above the mid-range would encourage momentum accounts to re-engage. If the tape stays quiet, crypto prices for XRP likely chop within the band until a higher time frame catalyst arrives.
BNB
BNB holds its footing above the prior breakdown area, which is a small but notable positive. The spot book shows buyers willing to defend incremental dips, and that has reduced the frequency of sharp wicks. The pair’s next step is to stabilize volume on up days rather than clustering activity during selloffs. If that shift continues, crypto prices for BNB can lean into a slow stair-step higher rather than relying on one-off squeezes.
Solana (SOL)
Solana carries a confident tone when broader risk appetite improves. Recent sessions show buyers returning on shallow pullbacks, which is usually a sign that intraday participants expect follow-through. A
s long as the market respects the nearest support shelf, the path of least resistance remains to the upside. Should liquidity thin out, the pair can still experience quick air pockets, but the medium view improves if higher lows keep printing. That backdrop often helps crypto prices across adjacent high beta names.
Context that matters beyond the tick-by-tick
Macro expectations sit front and center. A friendlier path for policy usually eases financial conditions, lowers discount rates, and supports risk assets. On the micro side, the liquidation profile has cooled and sentiment sits close to neutral. Neither euphoria nor panic is in control, which is often the recipe for a grind rather than a spike.
If exchange flows and spot demand improve together, crypto prices tend to hold gains more easily, and leadership broadens beyond a single coin.
Conclusion
This is a healthier tape than a few days ago. Bitcoin is calm, Ethereum is building, and the rest of the board is following in a sensible way. It is not a victory lap, but it is constructive. If macro signals remain supportive and the derivatives picture stays balanced, crypto prices can continue to firm into the week. If the tone sours, expect a quick check of nearby support, followed by another attempt to reset and climb.
Frequently Asked Questions
Where can readers see live crypto prices for top coins like BTC and ETH? Live quotes are available on major price dashboards and institutional terminals. The figures in this article come from real-time market feeds.
Why do policy odds affect crypto prices? Rate expectations change the price of liquidity. Easier policy often supports risk assets by lowering discount rates and easing financial conditions.
Do liquidations always push markets higher afterward? No. Large short liquidations can fuel a bounce, but if demand is weak, the effect fades quickly. Context matters.
Glossary of long key terms
Open interest The total number of outstanding futures or options contracts. Rising open interest with rising crypto prices can signal trend confirmation.
Market capitalization The combined value of all circulating crypto assets. It helps frame market size and dominance when comparing segments.
Policy rate probabilities Implied odds from futures that estimate the chance of an interest rate move at an upcoming meeting. Traders watch these odds because shifts can move crypto prices.
Liquidations Forced closures of leveraged positions when margin is insufficient. Heavy short liquidations can reduce immediate selling pressure and sometimes lift crypto prices.
Kraken revenue has reached unprecedented heights in the third quarter of 2025, marking a pivotal moment for both the exchange and the wider crypto market. The U.S.-based company reported $648 million in revenue and $178.6 million in adjusted EBITDA, a 114% year-over-year increase, underscoring the strength and resilience of its operations.
Kraken revenue increased 50% quarter over quarter, and adjusted EBITDA increased 124 percent, pushing profit margins to 27.6%, in what analysts term a clear sign of market maturity.
The exchange recorded a 23 percent increase in volume of trading of $561.9 billion in the last quarter, and currently has over $59.3 billion of client assets. Having 5.2 million funded accounts, Kraken is now on the same level with other major exchanges across the world, such as Coinbase and Binance.
The Kraken revenue growth was impressive and it did not occur in a vacuum. The success of the exchange is a year of strategic growth and product diversification. Its acquisitions of Small Exchange and NinjaTrader have strengthened its dominance in derivatives trading and broadened its access to the U.S market two areas where many competitors continue to have regulatory uncertainty.
Kraken IPO Speculation Gains Strong Momentum
Along the same innovative line, Kraken launched xStocks in collaboration with Backed, which enables investor crowds across 160 countries to trade U.S. equities into a token.
This innovative act blends conventional finance with Web3 because intermediaries and time constraints on the market have disappeared. Within several months, xStocks has produced over $5 billion in trading volume, which has additionally added to the overall Kraken revenue performance.
The robust Kraken financial results in Q3 have heightened market anticipations of an initial public offering (IPO). In 2025, the company had previously raised $500 million at a valuation of $15 billion and it is said to be undergoing another funding round that would potentially value the company at 20 billion a definite indicator of investor optimism regarding Kraken revenue growth and stability.
Kraken Joins Leading Public Crypto Exchanges
In case it becomes publicly traded in 2026, Kraken would be one of the publicly traded exchanges alongside Coinbase, Bullish and Gemini. However, the clear Proof-of-Reserves system, diversified revenue sources and excellent regulatory position put Kraken in a safer situation compared to most of its counterparts.
The gradually increasing Kraken revenue is more than just an indicator of financial success; it is the general change of the digital asset industry. The quarterly Proof-of-Reserves audits, adoption of distributed validator technology (DVT) to support Ethereum staking, and open reporting have gained the company a lot of institutional credibility.
With the Trump administration becoming increasingly crypto-friendly, the further integration of Kraken into U.S. regulated derivatives and institutional services can further drive Kraken revenue growth in the next few quarters.
Kraken revenue performance can be seen as a manifestation of the vision of a mature crypto company in a volatile and fast-moving landscape that is disciplined, profitable, and at the crossroads of traditional finance and the open economy of Web3.
Conclusion
Kraken’s record-breaking quarter signals more than financial strength it reflects the crypto industry’s steady shift toward institutional maturity. The shift towards a public listing by the exchange appears more and more definite, as it gains regulatory integration, product diversification, and transparency, making Kraken one of the shaping forces of the next stage in the evolution of world digital finance.
Follow us onTwitter andLinkedIn, and join ourTelegram channel to be instantly informed about breaking news!
Summary
Record profits: $648M revenue and $178.6M EBITDA in Q3 2025.
Innovation: xStocks drives global tokenized equity trading.
IPO prospects: Kraken eyes a potential 2026 listing.
As altcoins begin to show momentum, the SSR Oscillator continues to sit at cycle lows. This indicates that a large supply of liquidity could be deployed into the market soon. According to data from Coinglass, the Stablecoin Supply Ratio Oscillator…
Chainlink price is consolidating above $17 support, but technicals hint at a pullback toward the $15 zone — potentially setting the stage for the next major bullish leg toward $40–$46. Chainlink price technical analysis Chainlink (LINK) price is currently consolidating…
Watching Pi Coin price this week has been a rollercoaster. The excitement kicked off with an unexpected surge, pushing Pi up over 26% in a single day. This wild action has caught the attention of traders, but what reinforces the optimism is not just the price. It’s the story behind the numbers.
Successively, a technical breakout, millions of tokens moving off exchanges, and a wave of new KYC approvals have converged. Thereby, creating a near-perfect storm that reignited bullish sentiment in a market that had otherwise looked stagnant. Investors are now buzzing about whether Pi can sustain its run or if this is just a temporary spike.
Pi Price Analysis
As of today, Pi Coin price finds itself dancing around $0.2610, up a blistering 26.45% on the day and 26.26% over the week. What strikes me is the surge in trading volume, $108.27 million in just 24 hours, marking a massive 774% jump.
A closer inspection of the 4-hour chart reveals why traders got excited. First, Pi network price broke past both its 7-day SMA at $0.207 and the 30-day SMA at $0.23. Notably, a hidden bullish divergence showed up on the RSI, when it ticked higher from 40 to 46 even as the price dipped earlier this week. This tells us that buyers were keeping an eye out for a move.
The MACD histogram flipping positive (+0.00496) confirmed growing bullish momentum. This lined up perfectly with the 20 EMA crossing above the 50 EMA on the 4-hour chart. Consequently, the so-called golden cross usually unleashes a wave of buy pressure, and this time was no exception. However, resistance at $0.28 stands out as a pivotal level. A close above it could quickly attract breakout traders eyeing the next target at $0.36. Contrarily, a failure here or a drop below $0.20 could encourage profit-takers and risk a swift 20% correction.
Overall, Pi Coin is at a crossroads. If the price secures a daily close above $0.28, it could unlock fresh upside as confidence snowballs. But if resistance holds, expect short-term volatility and heightened risk of a retrace.
FAQs
Why is Pi coin price surging today?
The jump was sparked by bullish trading signals, a big drop in exchange supply, and a sharp rise in KYC-verified users, all fueling optimism and rapid buying.
Can Pi Coin Price hit $0.36 soon?
If Pi closes above the $0.28 resistance, momentum could quickly carry it to the $0.36 target, supported by strong trading volume and positive technicals.
What are the main risks for Pi right now?
The biggest risk is failing to break the $0.28 resistance. A reversal below $0.20 might lead to a 20% correction as recent buyers cash out.
The crypto market today is witnessing renewed bullish momentum, with Pi Network (PI) emerging as a top gainer amid altcoin recovery. In the past few hours, the PI price surged over 20%, rebounding sharply from the $0.21 support zone to trade around $0.26. This sudden rally comes as nearly 2.7 million users successfully migrated to the mainnet, marking a major milestone for the project and fueling optimism across the Pi community.
What’s Driving Pi Network’s Price Surge?
The recent rally in Pi Network’s price appears to be more than just a speculative bounce—it reflects improving market confidence and subtle on-chain shifts. Analysts point to increased user activity within the ecosystem, growing mainnet interactions, and renewed discussions around Pi’s future exchange listings. According to recent market data, Pi Network’s latest uptrend is backed by a combination of technical and fundamental factors:
Mainnet Migration Momentum — Over 2.69 million users completed KYC and migrated to the mainnet this week, signaling strong network participation.
Reduced Selling Pressure—A notable volume of PI tokens was moved off exchanges, tightening available supply and supporting prices.
Market Sentiment Shift—The broader altcoin market recovery and renewed investor interest in utility-driven projects have strengthened demand for Pi.
Speculative Trading Activity—As Pi remains unlisted on major centralized exchanges, limited liquidity has amplified short-term price volatility.
Can PI Price Sustain the Momentum?
Pi Network has been in a continuous downtrend since early 2025, printing lower highs and lower lows. However, today’s breakout above the long-term resistance line near $0.22 marks the first meaningful bullish signal in several months. The move is accompanied by strong buying volume, indicating that buyers are regaining control.
Key Technical Indicators
Supertrend (10, 3): The Supertrend indicator has flipped bullish for the first time in weeks, turning green near $0.20. Sustaining above this level could confirm a trend reversal.
Volume Surge: Trading volume soared to 193.7 million, the highest since May 2025, validating the breakout and showing fresh accumulation pressure.
RSI (Relative Strength Index): The RSI has climbed to 61.23, signaling increasing bullish momentum but still leaving room for further upside before reaching overbought territory.
Support and Resistance Levels
Zone
Type
Range
Immediate Support
Post-breakout base
$0.21–$0.22
Short-Term Resistance
Supply zone
$0.28–$0.30
Next Major Resistance
April swing highs
$0.35–$0.38
Critical Support
Breakdown level
$0.18
The zone between $0.28 and $0.30 represents a key test area. A decisive daily close above it could open the door for a push toward $0.34–$0.38. Failure to break through may lead to sideways consolidation between $0.21 and $0.28. The structure resembles a falling wedge pattern, a bullish reversal setup often seen after extended declines. Confirmation has been strengthened by the breakout above the wedge’s resistance line, rising RSI readings and a noticeable spike in trading volume.
This pattern implies a potential target near $0.34, derived from the measured wedge height added to the breakout point. Pi Network’s breakout above the descending trendline, supported by rising volume and positive RSI momentum, signals the first technical confirmation of a potential trend reversal. If the price manages to close above the $0.28–$0.30resistance area, PI could extend its rally toward $0.35–$0.38 in the near term.
However, traders should monitor volatility and avoid premature entries until volume confirms sustained buying pressure.
Caution Still Advised
Despite the surge, experts warn that Pi Network remains speculative. The project has yet to achieve a fully open mainnet or secure major exchange listings. Until these milestones are reached, price rallies may remain sentiment-driven rather than fundamentally supported.
Investors are advised to monitor:
Progress toward mainnet integration and ISO 20022 readiness
Exchange listing announcements
Partnerships or ecosystem expansions that enhance utility
If Pi Network continues its current pace of user migration and ecosystem development, analysts believe PI price could retest the $0.30–$0.35 range in the near term. However, without a confirmed listing or broader adoption, consolidation around current levels remains the most likely scenario.
The crypto market today is buzzing as the Ethereum (ETH) price edges closer to the $4,300 mark amid renewed bullish momentum and strong on-chain activity. However, analysts caution that a decisive monthly close above key resistance levels is essential to confirm the breakout and sustain upward momentum. With Bitcoin consolidating near local highs, investor attention has shifted toward Ethereum’s potential rally—positioning November as a make-or-break month for ETH’s long-term bullish trajectory.
Is the Capital Migrating from Ethereum to Bitcoin?
In the past week, specifically after the 20th of October, the Bitcoin ETF inflows have been steadily increasing, absorbing $446 million. However, the Ethereum ETF experienced a $244 million outflow led by Fidelity’s FETH with nearly $92.25 million. Interestingly, none of the nine ETH ETFs posted a net inflow. This indicates consolidation more than rotation, as every dollar leaving Ethereum could have found its way into Bitcoin’s vault.
Bitcoin has become the global liquidity sink and the black hole of the capital trust, as it doesn’t promise yield but permanence. This suggests the institutions are not betting against innovation but rather chasing immutability, as BTC doesn’t promise yield but permanence.
Can the ETH Price Rise Above $4,300 Amid Outflows?
Ethereum price has been consolidating between $3,682 and $4,300 since the start of the month and as the markets are approaching the month-end, a major breakout is awaited. The price, after the freefall from $4,732, is facing strong resistance at $4,271 which is the neckline of the double-bottom pattern. Currently, the ETH price is facing a similar action yet again, which raises concern over the next price action.
As seen in the above chart, the ETH price is trading below the Ichimoku cloud, suggesting the bearish influence over the token. On the other hand, the CMF undergoes a parabolic recovery from 0, hinting towards a significant influx of buying volume. However, the levels are yet to rise above the ascending trend line that keeps the possibility of trend reversal open. Therefore, the ETH price appears to have entered a decisive phase, as a rise above the neckline at $4,271 could push the levels to $4,500 or above. Meanwhile, a rejection from here could keep the price within the consolidated zone mentioned above.
Therefore, Ethereum’s current price action holds significant importance for the coming weeks. A decisive breakout above $4,300 could trigger a surge in liquidity, attracting strong buying interest and accelerating bullish momentum toward $4,800 and beyond. Such a move would greatly increase the likelihood of Ethereum reaching the $5,000 milestone before the end of 2025. However, analysts emphasize that a monthly close above $4,300 remains critical to validate the breakout and confirm the continuation of the long-term uptrend.
Bitcoin price has regained momentum as supply in profit rises and trend strength improves. As of this writing, Bitcoin is up 4% over the last day, trading at about $116,030. Now up 5.1% for the week and 5.7% for the…
VIRTUAL price has broken sharply from a months-long downtrend, fueled by a surge in agent-to-agent transactions following adoption of Coinbase’s x402 protocol. Virtuals Protocol (VIRTUAL) has recently staged an explosive breakout from a descending channel that had confined price action…
Pi coin price looks poised to break out of a falling channel after it formed a bullish MACD crossover on the daily chart. Is the token set to soar this week? According to data from crypto.news Pi Network (PI) went…
On Oct. 27, Ethereum broke past $4,200 having surged by 7.12%. The token has been on an upward trend following institutional accumulation and geopolitical momentum. Ethereum has been trading around $4,220 showing renewed bullish momentum after reclaiming the $4,000 psychological…
Solana started a fresh increase above the $200 zone. SOL price is now consolidating above $200 and might aim for more gains above the $208 zone.
SOL price started a fresh upward move above the $188 and $195 levels against the US Dollar.
The price is now trading above $200 and the 100-hourly simple moving average.
There is a bullish trend line forming with support at $198 on the hourly chart of the SOL/USD pair (data source from Kraken).
The pair could extend gains if it clears the $208 resistance zone.
Solana Price Jumps Again Above $200
Solana price started a decent increase after it settled above the $180 zone, like Bitcoin and Ethereum. SOL climbed above the $188 level to enter a short-term positive zone.
The price even smashed the $198 resistance. The bulls were able to push the price above $200. The price is now consolidating gains above the 23.6% Fib retracement level of the recent upward move from the $177 swing low to the $204 high.
Solana is now trading above $200 and the 100-hourly simple moving average. Besides, there is a bullish trend line forming with support at $198 on the hourly chart of the SOL/USD pair.
On the upside, the price is facing resistance near the $205. The next major resistance is near the $208 level. The main resistance could be $212. A successful close above the $212 resistance zone could set the pace for another steady increase. The next key resistance is $225. Any more gains might send the price toward the $232 level.
Another Pullback In SOL?
If SOL fails to rise above the $205 resistance, it could start another decline. Initial support on the downside is near the $198 zone and the trend line. The first major support is near the $192 level and the 50% Fib retracement level of the recent upward move from the $177 swing low to the $204 high.
A break below the $192 level might send the price toward the $184 support zone. If there is a close below the $184 support, the price could decline toward the $180 support in the near term.
Technical Indicators
Hourly MACD – The MACD for SOL/USD is gaining pace in the bullish zone.
Hourly Hours RSI (Relative Strength Index) – The RSI for SOL/USD is above the 50 level.
Rising retail fear and whale sell-offs are pressuring XRP’s price, but history suggests this phase of capitulation could mark the start of a rebound. As of this writing, XRP was up 1.7% over the last day, trading at $2.66. The…
Solana price has just stolen the spotlight among altcoins, breaking out with powerful momentum that has traders buzzing. The latest 6% daily surge comes on the back of a broader market rally led by Bitcoin’s impressive climb to $115k. As a result, Solana’s market cap now stands at a staggering $112.54 billion with daily trading volume rocketing nearly 90% higher, echoing a strong surge of interest.
The energy behind Solana’s move isn’t an accident. In the past 24 hours, $195M in altcoin shorts were liquidated as Bitcoin ramped higher, creating fuel for Solana’s breakout. A fresh wave of bullishness was also triggered after Solana’s co-founder, Anatoly Yakovenko, challenged Ethereum’s layer two security models.
SOL Price Analysis
SOL’s price rally has plenty of confirmation under the hood. The coin decisively reclaimed the $200 level after piercing both its 30-day SMA at $204.37 and its long-term 200-day SMA at $177.33. Technically, this marks a momentum shift, as price action closed above both the pivotal $197.6 region and the 50% Fib retracement of $205.42.
Talking about indicators, the MACD histogram just turned positive (+1.3), reflecting a bullish crossover and increasing upward momentum. With the RSI close to 59.31, there’s ample room for continued gains before the chart runs into the typical overbought zone above 70. SOL’s daily low and high from $193.61 to $204.88 carve out a new support base, this is while resistance now sits at $222.2.
What I’m watching next is how Solana holds above $205.42. Sustained closes above this level confirm the rally is real and could open the rallies towards $211.78 and $222.27. If buyers manage a weekly close above $222, then the chart’s structure positions the asset for a potential return to the $280 region.
“$SOL is still holding its 3-year support trendline. The most important level for Solana is $280, and a weekly close above it will trigger a massive rally. I still think $400-$500 SOL is happening this cycle.”
— BitBull
FAQs
Why is Solana’s price going up?
Solana’s price surge was jump-started by Bitcoin’s climb to new highs, which triggered a cascade of altcoin buying, forced liquidations of short positions, and renewed confidence from bullish narratives within the ecosystem.
Is Solana overbought at current levels?
SOL’s RSI is just shy of 60, suggesting there’s room before extreme overbought signals. Momentum and breakout confirmation point to more upside potential if key resistances are breached.
Which resistances should traders watch?
The next resistances are $211.78 and $222.27. If these levels are convincingly captured, then the path to $280 opens.
The crypto market today is witnessing explosive momentum as Bitcoin surges past the $115,000 mark, reigniting bullish sentiment across the board. Major altcoins like VIRTUAL, ZEC & DASH are skyrocketing, reflecting renewed investor confidence and growing market liquidity ahead of a high-volatility week. With traders eyeing key macro events and technical breakouts, the digital asset space is buzzing with optimism. The big question now—can this rally be sustained, or is the market gearing up for another round of sharp corrections?
Over the past few months, the Virtual Protocol price has been stuck within a descending parallel channel. The token attempted a breakout that resulted in forming yet another lower high, indicating the rising strength of the bears. However, it has broken above the structure following a strong influx of buying volume that suggests the VIRTUAL price is poised for a strong upswing.
The price broke above the channel with a huge rise in the buying pressure; however, the technicals point towards a consolidation ahead of the next breakout. The RSI entered the overbought range and appears to be flattening. On the other hand, On-Balance Volume spiked and continues to maintain a steady rise. Flattening RSI & rising OBV is usually a bullish signal, hinting towards accumulation during consolidation. It implies that smart money is quietly buying regardless of price movement and creating bullish pressure beneath the surface.
Therefore, traders can expect a cooling phase before breaking the resistance zone between $1.86 and $1.94 that may pave the way beyond $2 to reach $2.1.
Zcash (ZEC) Price Eyes 35% Rise to Hit $500
Zcash price is witnessing one of the bulliest months, not seen in the past few years. The buying volume rose back to the 2021 bull run days, which helped the price mark a steep rise after following a prolonged ascending consolidation. Currently, the ZEC price has surpassed one of the important resistances, which was the market top during the 2021 bull run. If the price sustains within the range, a continued upswing may help the price break higher targets.
As seen in the above chart, the ZEC price has broken the resistance zone between $293 and $316 and closed the weekly trade above this range. This suggests the bulls have held a tight grip over the rally, and the momentum may not fade as OBV remains escalated. Interestingly, the 50/200 weekly MA underwent a bullish crossover that could help the token sustain the upward trend and push towards the higher targets at 1.2 FIB at $471 and 1.4 FIB at $522.
Regardless of the 20% Jump Dash (DASH) Price Awaits a Breakout
Ever since the rally rose above the impact of the 2022 bear market, the DASH price has been stuck within a massive descending parallel channel. Every attempt of the token to break the resistance has resulted in a strong rejection, while the current scenario raises some hopes. The price has been defending the pivotal support just above $40 for a few weeks and hence flashes a huge possibility of a breakout above $60 in the coming days.
The DASH price remains within the descending parallel channel but has secured the pivotal support at the 200-day MA. With the volume spiking to the highest levels not seen in recent times, a breakout from the range could be imminent. On the other hand, the RSI has yet again entered the overbought range. Previously, this move followed a steep rejection, but the current rebound suggests there could be more room for the price to rise. Therefore, once the RSI reenters back into the overbought range, the price could break the channel and rise above the resistance zone between $61 and $63.
Once these levels are secured, the Dash price may enter a strong bullish trend and probably reach $100 in 2025.
Crypto prices today are on the green, rising for a second straight session as traders welcomed signs of easing U.S.–China trade tensions and growing expectations of a Fed rate cut. The total market value of all cryptocurrencies climbed 3.5% in…
Bitcoin cleared $112,000 on heavy volume and hovered near $114,500 late Sunday (UTC), while CoinGlass showed $319 million of short positions liquidated over 24 hours.
A lot of enthusiasts may not be thinking twice when it comes to achieving the highest possible frame rates, and this is why the Ryzen 7 9800X3D remains the top seller on most retailers. The processor launched last year, roughly one and a half years after the 7800X3D hit the retail shelves, and you may have already seen its terrific gaming performance, taking the "best gaming CPU" title from the 7800X3D. With newer architecture and crucial changes in the die design, the Ryzen 9800X3D always tops the charts, no matter what game benchmarks you look at. However, the Ryzen 7 […]
Yield Farming ist nicht tot, es hat sich verändert. Wenn die Marktliquidität dünn ist oder Anreize gestapelt werden, schnellen Renditen nach oben. Wenn das Kapital träge wird und die Finanzierung abkühlt, sinken Erträge auf Geldmarktniveau.
Die Profitabilität hängt davon ab, wo Kapital geparkt wird, und wie gut Risiken eingepreist sind. Uniswap v4 hat die Kosten für Liquiditätsanbieter gesenkt und eine klügere Gebührenstruktur eingeführt, entscheidend für die Nettoerträge.
Warum die Frage immer wieder aufkommt
In der letzten Krypto-Hausse jagten Farmer zweistelligen Renditen in riskanten Pools hinterher – und verloren durch Drawdowns und Hacks. Heute sieht das Bild professioneller aus. Stablecoin-Renditen liegen nahe den kurzfristigen US-Staatsanleihen, während strukturierte DeFi-Protokolle diese Zinsen in feste und variable Komponenten zerlegen, die handelbar sind. Laut Galaxy Research zeigen On-Chain-„Cash“-Tokens, wie Geldmarktzinsen durch die Kette weitergereicht werden – daher die Basisrenditen von etwa 4–5 %, solange die Geldpolitik straff bleibt.
Im Sommer 2025 lagen durchschnittliche Kreditrenditen auf Ethereum bei rund 4 %, in einigen Netzwerken etwas höher. Das bildete die Basis für risikoarme Strategien. Punkteprogramme, Liquidity Mining und Arbitrage-Trades lieferten die Zusatzrendite.
Was derzeit wirklich Ertrag bringt
Zwischen einfachem Lending und strukturierten Renditeprodukten besteht weiterhin eine Lücke. Ein Marktüberblick aus September zeigte: Blue-Chip-Lending lag im mittleren einstelligen Bereich, während Tokenisierungsplattformen auf bestimmte Assets höhere Fixzinsen anboten.
Durch Uniswap v4 wurde aktives Market-Making günstiger. Eng gesetzte Liquiditätsbereiche erlauben, mehr Gebühren zu verdienen – sofern die Kurse stabil bleiben. Der Haken: Wer zu eng setzt, riskiert Inventarverluste, wenn der Preis aus der Spanne läuft.
Das Sicherheitsrisiko bleibt
Sicherheit bleibt die größte Steuer auf Rendite. Verluste durch Hacks und Betrugsfälle übertrafen in der ersten Jahreshälfte 2025 bereits das Gesamtjahr 2024. Am häufigsten betroffen: kompromittierte Wallets und schwache Zugriffskontrollen.
Aave-Gründer Stani Kulechov erklärte im Oktober, dass „eingebettetes DeFi eine Billionen-Dollar-Chance für Fintechs“ sei – durch breitere Distribution und günstigere Zugänge zu Rendite. Auch Arthur Hayes sieht in sinkenden Zinsen einen Katalysator: „sUSDe zahlt 7 %, bereitet euch auf Billionen vor, die von Geldmarktfonds ins On-Chain-Yield fließen.“ Diese Ströme heben das Renditeniveau insgesamt an.
Die Mathematik hinter echtem Profit
Echter Gewinn ist nicht die beworbene APY. Entscheidend sind: Gasgebühren, Slippage, impermanente Verluste, Leihzinsen und Preisverzerrungen.
Uniswap v4 reduziert Kosten, Aaves nächste Version bündelt Liquidität über Märkte hinweg – was Zinsvolatilität mindert. Tiefe Märkte ermöglichen größere Positionen ohne Preisverzerrung, was Nettoerträge stabilisiert.
Wo die Extra-Rendite herkommt
Punkteprogramme, Partnerboni und Gebührenreformen können die Basisrendite anheben. Neue Governance-Vorschläge über Revenue-Sharing und Token-Rückkäufe erinnern Investoren daran, dass Protokollgewinne letztlich Tokenwert stützen. Wenn Gebührenströme stabil sind, wird Farming wieder zu einer kalkulierbaren Ertragsquelle – keine Lotterie.
Höchste APY-Raten: Signal oder Sirene?
Manche Dashboards zeigen Traumrenditen in kleinen, volatilen Pools – oft nur auf dem Papier. Sobald Kapital einfließt, verschwinden sie. Der einfache Test:
Wenn ein Angebot auf dünner Liquidität, massiven Token-Emissionen oder riskanten Assets basiert – Marketing. Wenn es auf geprüften Kreditmärkten mit hoher TVL läuft – Einkommen. Das ist die ehrliche Trennlinie im „Highest APY“-Narrativ.
Fix oder variabel?
Neu in diesem Zyklus: feste Zinssätze gegen variable On-Chain-Renditen. Das schafft Planbarkeit für Profis.
Ein großer Anbieter meldete nach neuen Produkten zweistellige Milliardenbeträge in festverzinslichen Positionen – ein klares Signal für Nachfrage nach Stabilität.
Risiken im Detail
Selbst in großen Protokollen konzentrieren sich Risiken auf wenige Punkte: Zugriffsrechte, private Schlüssel, Brücken. Diese Schwachstellen bleiben die Hauptursache von Verlusten.
Yield ist kein Gratisbuffet – Sicherheitsmanagement gehört zur Renditeberechnung. Profis wissen das längst.
Sollten die Leitzinsen 2026 sinken, dürften Basisrenditen fallen. Doch gleichzeitig könnten Kreditspreads wachsen, was neue Strategien ermöglicht.
„Embedded DeFi“ über Banken und Fintechs wird laut Kulechov den nächsten Schub bringen – mehr Einlagen fließen auf die Kette, in transparente Kreditmärkte.
Farmer, die auf große, geprüfte Protokolle setzen und Fixzinsen oder Hedges nutzen, erzielen stabilere Erträge. Weniger spektakulär, aber nachhaltiger.
Aave, Uniswap und andere mit klarer Architektur ziehen stetig TVL an – weil sie Planbarkeit schaffen.
Wie Redaktionen es einordnen sollten
Die richtige Überschrift handelt nicht von „dem Pool mit 100 % APY“, sondern von der Preisgestaltung von Zeit und Risiko. Wenn 5 % Basisrendite existieren und strukturierte Produkte 2–3 % Aufschlag für geprüfte Laufzeiten bringen, ist das ein echter Aufpreis – kein Subventions-Feuerwerk.
Fazit
Yield Farming ist 2025 weiterhin profitabel, aber selektiv. Gewinne entstehen dort, wo Tiefe real, Sicherheit solide und Anreize Zusatz statt Grundlage sind. Kurz gesagt: Highest APY ist kein Ziel, sondern ein Filter, um nachhaltige Cashflows zu finden – in einem Markt, der Risiken endlich erwachsen bewertet.
Häufige Fragen
Ist Yield-Farming 2025 noch profitabel? Ja – für disziplinierte Strategien mit geprüften Protokollen, stabilen Basisrenditen und klaren Gebührenstrukturen.
Was zerstört Rendite am schnellsten? Hacks, dünne Liquidität und schlechtes Risikomanagement.
Helfen sinkende Zinsen? Sie senken Basiserträge, bringen aber neue Nachfrage, wenn Kredite günstiger werden.
Sind feste Renditen nur ein Trend? Nein. Das Wachstum zeigt langfristige Nachfrage nach Stabilität.
Wohin sollte neues Kapital zuerst fließen? In etablierte Protokolle mit tiefen Märkten und geprüften Codes. Danach kann man Anreize schichten.
Yield farming is not dead; it is different. When depth is thin or incentives stack, yields pop. When the market is heavy and funding cools, yields slip toward money-market territory. The profit story depends on where capital parks and how well risk is priced. Uniswap v4 cut costs for liquidity providers and pushed smarter fee design, which matters for net returns.
Why the question keeps coming back
In the last cycle, farmers chased double-digit prints across exotic pools and got burned by drawdowns and hacks. This cycle looks more professional. Stablecoin rates cluster near front-end Treasuries, while structured yield protocols turn those rates into fixed and variable legs that can be traded. Galaxy’s research team described how on-chain “cash” tokens pass through the front-end curve, which is why base yields often sit near 4 to 5 percent when policy is tight.
Average lending yields on Ethereum hovered around the mid 4 percent range in mid 2025, with some networks a touch higher. That set the floor for many low risk strategies. From there, points, liquidity mining, and basis trades add the kicker.
What is actually paying today
There is still a spread between plain lending and structured yield. A snapshot from September showed blue chip lending near mid single digits, while yield tokenization platforms offered higher fixed coupons on specific assets. Uniswap v4’s lower gas and custom hooks made it cheaper to run active liquidity, so concentrated LPs can pick tighter ranges and capture more fees when volatility cooperates. The catch is inventory risk when price walks out of range.
The security overhang that never quite leaves
Security remains the biggest tax on returns. Losses tied to hacks and scams in the first half of 2025 already surpassed the full year prior, with compromised wallets and access control issues leading the league tables. This is why protocol choice and operational hygiene are part of the yield equation. A single slip can erase a year of returns.
When Aave’s founder, Stani Kulechov, talks about the next wave, lenders listen. In October, he told followers that “embedded DeFi” is a “trillion dollar opportunity for fintechs,” pointing to broader distribution and cheaper on-ramps for yield. He also argued that falling policy rates can set the stage for a fresh DeFi upswing.
Arthur Hayes has been blunt about rate paths and the migration of money market cash into on-chain instruments. In a recent post he wrote, “sUSDe yields 7%, get ready for trillions in MMF looking for better yields,” tying policy moves to a rotation into tokenized cash strategies. That kind of flow lifts the baseline that farmers build on.
Source X
The operating math that decides profit
Real profit is not the headline APY. It is net of gas, slippage, impermanent loss for LPs, borrow rates for levered loops, and token price drift.
Uniswap v4’s fee architecture and gas savings help trim costs. Aave’s next modular upgrade aims to unify liquidity across markets, which can deepen books and lower the volatility of borrowing costs. Deeper markets let farmers size up without moving price too much, which keeps fills clean.
Where the extra juice comes from
Points programs, partner incentives, and fee-sharing reforms can add a layer on top of base yields. A recent wave of proposals around revenue share and buybacks has reminded investors that protocol cash flows matter for token value, which feeds back into incentive budgets. When the market expects more durable fee flow, it becomes easier to justify measured farming risk rather than roulette.
Highest APY yield farming: signal or siren?
Some dashboards will always highlight headline rates on small, volatile pools. Those prints look great on paper. They often vanish once size shows up. Traders with a plan use a simple test.
If an advertised rate requires thin liquidity, heavy emissions, or exposure to an asset with unstable mechanics, it is marketing, not income. If the strategy sits on credit markets with deep TVL and transparent risk, it is closer to a paycheck than a lottery ticket. That is the honest divide inside any hunt for highest APY yield farming.
The fixed versus floating decision
One theme that did not exist at scale two years ago is the ability to lock a fixed rate against a floating leg on-chain. That turns a noisy stream of rewards into something a treasurer can plan around.
One large yield platform reported tens of billions in settled fixed yield and fresh TVL after new products went live, which shows real demand for certainty over hope. The choice between fixed and floating defines whether a farmer wants to clip a coupon or to speculate on the curve.
Where the risks hide in plain sight
Even in blue chip venues, risk concentrates in a few buckets. Access control failures and private key compromises are a larger share of losses than pure code bugs. Cross-chain bridges and permission problems keep showing up in incident reports.
Anyone who treats yield as free lunch will learn the hard way that security posture and custody flow are part of the APR. These facts do not scare professionals away. They force better process.
The narrative tailwinds
Macro matters. If policy rates drift lower into 2026, base on-chain rates would soften, but risk spreads can widen and volumes can grow.
Builders expect more distribution through banking and fintech channels, which would push more deposits into on-chain credit. As Kulechov put it, “embedded DeFi” opens the door for mainstream platforms to route customers into transparent yield. That path supports durable, repeatable flows rather than short lived emissions.
A reality check on performance
Farmers who stayed in the majors and used fixed rate wrappers or hedged LP positions have seen steadier returns than the last cycle’s mercenary playbook. The trade looks more like cash management with optionality.
It is slower, but it tends to stick. Platforms that integrate tokenized cash, structured rates, and cleaner LP rails have drawn consistent TVL. Aave’s footprint and upcoming version shift are a good example of how depth turns into a de facto benchmark for on-chain credit.
How editors should frame it for readers
The right headline is not about a single pool that shows a big number. It is about how the market prices time and risk. If the base is five percent and a structured leg offers several points more for a defined term with known counterparties and strong audits, that is a credible premium. If a farm needs thin books and an emissions firehose to get there, it is not a premium. It is a subsidy that will fade.
Subheading: Highest APY yield farming in context
This is the part that demands discipline. The phrase highest APY yield farming will always trend. Editors can educate by explaining why concentrated LP ranges, fee tier choice, rebalance cadence, and liquidity around the mid decide if that headline rate survives contact with real volume. The industry learned the lesson in 2022. The survivors track depth and duration first, and only then chase extra points.
Practical examples without hand-waving
A major lending venue offering mid single digit rates on stablecoins sets the base case. A structured platform strips and sells fixed coupons at a higher rate for a three-month term. An LP on a top AMM uses a narrow tick range around an event to capture bursts of flow with lower gas costs than last year. None of these ideas are flashy. They scale. The common thread is risk that can be measured.
So, is yield farming still profitable
Yes, but it is selective. Profit lives where depth is real, security is boring, emissions are a bonus rather than the spine of the return, and strategy pays more than it costs to run. In plain terms, highest APY yield farming is not a destination. It is a filter to find sustainable cash flow in a market that finally prices risk like adults.
Conclusion
Yield farming is still profitable for those who treat it like a business and not a raffle. The winning playbooks lean on depth, security, and cost control, then add structured yield or targeted LP activity when the setup is right. The market is moving toward cleaner products, better distribution, and stronger rails.
That is good for real users and it is good for editors who want to report numbers that hold up over time. In that framing, highest APY yield farming becomes a test of which venues can pay without pretending, and which strategies scale when the music changes.
Frequently Asked Questions
Is yield farming still profitable in 2025 It is profitable for disciplined strategies that prioritize deep, audited venues, stable base rates, and clear fee math. Stacks that include tokenized cash, fixed rate legs, or hedged LP positions tend to produce steadier results. The lure of highest APY yield farming is stronger than the reality unless the pool has real depth and known counterparty behavior.
What ruins returns the fastest Security events, thin liquidity that amplifies price moves, and poor inventory management. Reports show that compromised access and bridge issues are frequent culprits, which is why custody and permissions need adult supervision.
Do falling interest rates help or hurt Lower base rates can trim easy passive returns. They can also pull more users into DeFi if borrowing gets cheaper and products feel safer. Leaders in lending argue that a friendlier rate path sets the stage for a new upswing. Highest APY yield farming then becomes a story about volume and design, not handouts.
Are fixed yields a fad No. The growth in settled fixed yield and TVL suggests durable demand from users who want certainty. It looks like an on-chain cousin of corporate cash management. Farmers can still take a view by going long or short the floating leg. Highest APY yield farming can include fixed coupons if the structure is fair and transparent.
Where should new capital look first The majors. Deep lending markets, top AMMs, and structured yield platforms with audits and battle tested code. From there, layer on incentives or points. This is the healthier side of highest APY yield farming because base returns are solid before bonuses.
Glossary of long key terms
Concentrated Liquidity Provider Position A position on an automated market maker that earns fees only within a chosen price range. It provides higher capital efficiency but carries inventory risk if price exits the range. Uniswap v4 lowered costs to manage these positions at scale.
Fixed and Floating Yield Leg A structure where one side receives a fixed rate for a term while the other receives whatever the market pays. On-chain platforms tokenize both legs so users can trade or hold either stream of cash flows. Growth in settled fixed yield shows adoption.
Impermanent Loss The difference between holding tokens and providing them as liquidity in a pool. If price moves, the pool may underperform a simple hold. Active ranges and fee tiers can offset the drag when volume is strong. Uniswap v4’s features help reduce overhead.
Order Book Depth Around the Mid The amount of buy and sell liquidity close to the current price. Deep books absorb larger trades without big price moves. Depth is a hidden driver of net APY because slippage and missed fills eat return.
Tokenized Cash Strategy A token that passes through money market yields from short term Treasuries and repo. These APYs track the front end of the curve with small basis differences. Many farmers treat them as a base layer.
Unified Liquidity Architecture A design that aggregates borrowing and lending across markets to improve efficiency. Planned changes in top lending venues aim to reduce fragmentation and stabilize rates for farmers.
SOL lands on Fidelity's retail trading platform, Gemini launches the Solana edition of its credit card, and $188 emerges as the key support level to watch.
Shiba Inu price has plummeted by double digits from its highest point this year, and the ongoing performance of Shibarium, points to a steeper crash in the near term.
Analysts on X outlined five-digit targets for ether while Santiment said larger wallets have started adding again, framing a longer path higher if resistance gives way.
Updated on 25th October, 2025
This article was first published onThe Bit Journal.
Bull and bear traps in crypto are deceptive price patterns that can catch traders in volatile markets. These traps lure traders into false breakouts or breakdowns, causing big losses.
In crypto with thin liquidity and high volatility; spotting bull and bear traps early is essential to protecting one’s capital.
A bull trap is a fake breakout above resistance that reverses sharply down. A bear trap is the opposite; a fake breakdown below support that snaps back up.
Why Do Bull and Bear Traps in Crypto Happen?
Market psychology and manipulation are the main culprits. Whales or institutions can move crypto prices with big orders that create fake trends. Sudden news or events can also trigger temporary moves that look like real breakouts. Fear and greed play big roles. FOMO can get traders to buy into a fake rally, while panic can get them to sell into a fake dip.
The crypto market’s 24/7 nature and often-low liquidity amplify traps. For example, an altcoin with a small market cap can drop on one big sell order (a bear trap) or spike on a big buy (a bull trap).
Traders have noted that these engineered moves often serve to calm the bears or rack up stop losses. In other words, what looks like a new trend may be an attempt by insiders to feed on retail traders’ emotions.
Cryptos often swing 10-20% in a day and big players known as whales sometimes exploit this. Whales can push price above a key resistance, in other words, create a bull trap and then dump their holdings, forcing price down.
Conversely, whales can engineer a quick sell-off below support (a bear trap) to trigger panic selling, then buy the dip as price bounces back.
These maneuvers capture stop-loss liquidity and prey on FOMO (fear of missing out) or panic. Real crypto market examples show this. In June 2023, Solana (SOL) dropped 42% before a sudden rally caught shorts off-guard.
Likewise, Bitcoin had a false breakout in April 2021; briefly topped $54K then dropped 17%, trapping late buyers.
How to Spot Bull and Bear Traps in Crypto
These bull and bear traps in crypto can be spotted by watching technicals and context. Key signs include:
False Breakouts/Breakdowns: If price pops above resistance and then quickly drops, it’s a bull trap; if it drops below support and then bounces; it’s a bear trap. These fake moves often don’t hold.
Volume Divergence: Real breakouts have big volume. A breakout on low volume is to be suspected.
Indicator Divergence: Check RSI or MACD. If price makes a new high but RSI is flat or falling, that could be a bearish divergence and a bull trap. If RSI is oversold on a fake breakdown, it’s a bear trap.
No Retest: Real breakouts retest the broken level as new support or resistance on breakdowns. If price breaks a level and never comes back, it is important to be cautious. No retest can mean the breakout isn’t real.
Whale/On-Chain Signals: Watch on-chain data and large transfers. Unusual crypto inflows or outflows to exchanges may precede traps. For example, a large withdrawal or whale accumulation before price dips can be a bull trap, while a massive exchange inflow before a bounce can be a bear trap.
Advanced traders also use indicators like VWAP, On-Balance Volume (OBV) and on-chain analytics to confirm moves. If price goes far above the volume-weighted average price (VWAP), it may be an overbought move (bull trap).
How to Avoid Bull and Bear Traps in Crypto
Trade with Confirmation: Don’t act on a breakout immediately. Wait for the price to hold above resistance or below support and ideally retest the level as new support/resistance before entering.
Smart Stop-Losses: Place stop orders outside obvious trap zones. For example; set a stop just beyond a second support level rather than right at the first breakdown to avoid stop hunts.
Multiple Indicators: Don’t rely on one signal. Cross-check breakouts with volume; RSI/MACD, VWAP and on-chain data. Only go with moves that line up across several analyses.
Risk and Emotions: Trade smaller positions or go 50% size when in doubt. Avoid chasing breakouts driven by hype (FOMO) or panic. Use conservative leverage; since traps can trigger liquidations.
Stay Informed: Monitor crypto news and social media. If a price move lacks solid news or follows hype cycles; be cautious. Sometimes pausing trading for a bit after big news and watching how price behaves can prevent falling for a trap.
Learn from Experience: Keep a trading journal of setups. Reviewing past bull and bear traps in crypto helps train recognition skills and discipline when these patterns reappear in the market.
Signal/Indicator
Bull Trap
Bear Trap
Price Action
Spike above resistance then quickly fall
Drop below support then rapidly bounce up
Volume
Breakout on low volume (weak rally)
Breakdown on low selling volume
RSI/Indicators
Overbought reading, bearish RSI divergence
Oversold reading, bullish RSI divergence
Trader Psychology
FOMO-driven buying at highs
Panic-driven selling at lows
Crypto Example
Altcoin hype peak followed by crash
Sharp crypto dip that’s swiftly bought back
Expert Insights on Bull and Bear Traps in Crypto
Market analysts emphasize vigilance and context. A crypto strategist had previously said there could be a 2024-style bear trap in Bitcoin, when local highs aren’t broken, market makers might be setting shorts up for a squeeze.
His analysis had suggested traders should be skeptical of quick dips without fundamentals, as price can calm the bears with a sudden bounce.
Other experts also agree. Traders say bull/bear traps are all about herd behavior. Whales sometimes pump or dump prices to lure retail traders into buying at highs or selling at lows.
Experts advise waiting for confirmations such as a retest or multiple green indicators; before assuming a breakout is real.
Crypto trader Tokoni Uti suggests combining chart analysis with sentiment and on-chain data; since crypto can move on rumors. If a price move has no support, be it volume or on-chain activity, then it most likely a trap.
Conclusion
Bull and bear traps in crypto require caution from traders. By knowing what these traps look like and using multiple confirmation signals; investors can avoid being fooled by false breakouts or breakdowns.
Vigilance; strong risk management like stop-losses and small position sizes, and waiting for confirmation are really needed to surviving these unpredictable crypto moves. Remember; no strategy is foolproof; always be prepared to cut losses if a trap is suspected.
Glossary
Bull Trap: A deceptive breakout to the upside that reverses swiftly; catching the late buyers at the peak.
Bear Trap: A deceptive move downwards below support that reverses fast; catching the late sellers at the dip.
FOMO: “Fear Of Missing Out”; hype-induced buying; very frequent in bull traps, buyers are quite aggressive.
Liquidity: The degree of ease in buying/selling an asset.
Whales: The big players in the crypto market whose huge trades can influence the market direction.
Frequently Asked Questions About Bull and Bear Traps in Crypto
What is a bull trap in crypto?
A bull trap in crypto is when the price breaks above a resistance level; it looks like an uptrend but then reverses hard down; trapping traders who bought into the breakout.
What is a bear trap in crypto?
A bear trap in crypto is when the price breaks below a support level; it looks like a downtrend; then reverses up, trapping traders who sold or shorted expecting more down.
How do traders know if a breakout is a bull trap?
Look for low volume and no momentum. If price breaks resistance but on low volume, or if indicators like RSI don’t confirm the move, be suspicious. A quick reversal back below the breakout point is a bull trap.
How do whales create traps in crypto?
Whales create traps by placing big buy/sell orders. In a bull trap, they buy heavy to push price above resistance to lure buyers; then sell off, and price collapses. In a bear trap, they sell to push price below support to lure sellers; then buy back on the bounce.
Can news events cause bull and bear traps?
Yes. Sudden news or announcements often trigger quick; temporary moves. Traders may jump in on a headline-driven breakout; which then fizzes. It is important to wait and see if the move is supported by volume and price action before acting.
Intel has decided to tap into the ASIC and design business as its next major venture, and according to the latest comments by CEO Lip-Bu Tan, the effort will play a crucial role in the firm's operations. Intel's ASIC Business Could Turn The Firm's Foundry Into a 'Complete Package', Making it a Compelling Option For Big Tech For those unaware, Intel had recently announced the creation of the Central Engineering Group (CEG) to consolidate all the engineering talent within the firm into a single division. And this would give "more power to the engineers" onboard. The department is headed by […]
Cryptocurrency adoption is rising again as digital assets mature globally and move beyond hype-driven cycles. More first-time investors are entering the market in 2025, and this trend is expected to accelerate in 2026.
However, choosing a trading platform is not always easy for new users who want a secure place to buy their first Bitcoin or stablecoins. That is why identifying the best crypto exchanges becomes essential before risking any capital in a volatile market.
The best crypto exchanges for beginners are defined by simple navigation, strong security history, transparent fees, fair customer support and reliable regulation. Many trading platforms promise these features but only a few deliver consistently over time.
This article provides a neutral, research-based look at the best crypto exchanges for beginners in 2025 and 2026 without favoring any platform. It also evaluates user experience, security measures and educational features that help newcomers learn safely.
What Makes the Best Crypto Exchanges Beginner Friendly
The best crypto exchanges are not always the biggest or most popular platforms. Instead, they must balance regulation, safety and usability with fair pricing. A platform that confuses a beginner with complex trading tools or hidden fees can lead to costly mistakes. A beginner-focused platform should offer a clear dashboard design, fiat on-ramp support, and transparent security policies. Platforms with strong reputations are usually licensed or registered in at least one major financial jurisdiction.
Ease of use is important but security cannot be ignored. Responsible platforms support cold storage, biometric login, know your customer verification and withdrawal whitelists. Educational content is another key benchmark. The best crypto exchanges teach users step-by-step trading skills without overwhelming them.
Comparison Table of Leading Crypto Exchanges for Beginners in 2025
Below is a neutral overview of popular trading platforms used by beginners around the world. Fees are approximate and may vary based on account type or trading region.
Exchange Name
Headquarters
Trading Fees
Supported Cryptos
Regulation Status
Ideal For
Binance
Global
0.1 percent
350 plus
Licensed in several regions
Low fees
Coinbase
United States
0.5 percent average
250 plus
US regulated
Ease of use
Kraken
United States
0.16 maker, 0.26 taker
230 plus
US and EU regulation
Security
OKX
Seychelles
0.08 percent
300 plus
Licensed in Asia and EU
Advanced beginners
Bybit
Dubai
0.1 percent
300 plus
UAE and global registration
Derivatives
Bitstamp
Luxembourg
0.3 percent
80 plus
EU licensed
Long term investors
KuCoin
Seychelles
0.1 percent
700 plus
Global access
Altcoin variety
Gemini
United States
1.49 percent
90 plus
US regulated
Compliance
Gate.io
Cayman Islands
0.2 percent
1,400 plus
KYC compliant
Variety of tokens
Crypto.com
Singapore
0.075 percent
300 plus
Multiple jurisdictions
Mobile users
This comparison highlights that the best crypto exchanges for a beginner depend on priorities. Someone who values strict compliance may choose a regulated American platform while another user who values low fees might prefer a global platform.
Why Beginner Traders Need Regulated Platforms
There is a common mistake among new crypto investors who chase platforms with the highest bonuses or leverage offers. Beginner-friendly platforms should instead offer a safe environment with regulatory transparency. Regulation protects user funds in many ways. First, regulated exchanges are legally required to maintain certain compliance standards and segregate user funds. Second, they are subject to audits and security checks. Third, regulated exchanges are less likely to disappear overnight with user funds.
A compliance officer at a European trading firm said in a recent interview that “crypto regulation is not a barrier to growth. It builds user trust and long-term adoption.” He added that future exchanges will combine both speed and compliance to scale globally. This reinforces why selecting from the best crypto exchanges with licenses remains important.
User Experience Matters More Than Hype
Beginners quit fast if a crypto exchange feels complicated. A platform can offer a long list of features but still fail if users struggle to complete a basic buy order. The best crypto exchanges for beginners remove unnecessary friction. Their interfaces are intuitive and mobile-friendly. Simple options for buying crypto using cards, bank transfers or local payment methods must be included.
Many advanced exchanges use trading views loaded with candlestick charts, leverage sliders and margin warnings. These tools are useful for professional traders but they can be intimidating for a beginner. A beginner-focused platform keeps things clean and allows users to grow into advanced features over time. Good exchanges adapt to the learning curve of their users rather than forcing them into complexity.
A product designer for a major trading app recently said in a podcast interview that “designing for beginners does not mean limiting features. It means prioritizing clarity and reducing risk.” That philosophy explains why user experience remains a serious benchmark in evaluating the best crypto exchanges.
Some of the Top Beginner Friendly Exchanges With Key Features
Binance
Binance remains one of the most used platforms in the world by trading volume. It offers extensive cryptocurrency support and low trading fees. It includes tutorials, spot trading, staking options and a secure mobile app. Even though it has faced regulatory challenges in some markets, it remains a go to platform for users seeking a broad set of features. It also includes a beginner mode that hides advanced tools while still granting access to simple buying options. Its global reach and scalability are why it is constantly mentioned among the best crypto exchanges even in 2025.
Coinbase
Coinbase is known for its user-friendly design. It allows instant purchases using bank cards and local payment methods in multiple countries. It also features beginner education modules, simple crypto storage and recurring investment plans. Coinbase is regulated under American law, which attracts risk-conscious users. Its interface avoids clutter which helps people who want a simple introduction to crypto trading. The platform also includes crypto earning features and staking rewards, which appeal to long-term holders.
Kraken
Kraken has built a strong reputation in the industry for security and transparency. It has never been hacked in over a decade of operation. It offers margin trading, spot trading and futures but still maintains beginner accessibility. Kraken is registered in both the United States and Europe. Its customer support and strict security policies make it suitable for conservative investors who value stability. That is why it is consistently included in lists of the best crypto exchanges globally.
OKX
OKX has grown strongly in Asia and Europe with flexible fee structures and creative trading features. It offers copy trading which helps new users follow professional traders and learn trading strategies over time. The platform supports hundreds of cryptocurrencies and offers strong mobile support. It also operates a DeFi wallet that gives users access to Web3 features. It is one of the best crypto exchanges for people who want a balance between basic trading and advanced features.
Safety Practices on the Best Crypto Exchanges
Security is a top priority because crypto is still a target for cyberattacks. The best crypto exchanges protect users through cold wallet storage, two-factor authentication, and regular security audits. Some exchanges also introduce proof of reserves reports to show that they hold enough assets to cover withdrawals. This helps to build trust after past scandals in the industry.
User security also begins with good personal practices. Even though a platform may include biometric login and identity verification, users should add extra protection. Private devices should always be used to access exchange accounts. Passwords must be unique and not reused from other platforms. Trading accounts should never be shared and customer support impersonators should always be avoided.
A cybersecurity researcher from a blockchain analytics firm recently explained that “ninety percent of crypto losses can be avoided if users combine basic security habits with regulated platforms.” This shows that responsibility is shared between users and platforms.
Fees and Costs To Consider Before Trading
Many exchanges compete on fees but beginners often overlook hidden costs. The best crypto exchanges are transparent about their charges. Fees can include trading fees, withdrawal fees, network fees, conversion fees and card processing charges. Low fees are attractive but too many bonus campaigns or unrealistic returns can be a danger sign. It is safer to choose a trusted platform with fair pricing rather than a suspicious one that promises extreme benefits.
Stablecoin conversions and peer to peer trading are important for users in regions without strong banking access. The best crypto exchanges support multiple payment methods to allow users to fund their accounts smoothly. Credit cards may be convenient but they are usually more expensive than bank transfers.
Regional Access and Legal Availability
Crypto trading laws differ from country to country and this affects how beginners can choose the best crypto exchanges. A platform that operates in one region may be restricted or banned in another. For example, some exchanges are not licensed to operate in the United States but are fully active in Asia, Africa or the Middle East. Others focus on European and North American trading laws and do not accept registrations from certain regions.
Beginners should always check whether their chosen platform is authorized in their country. Regulation helps in cases where a platform faces legal issues or goes bankrupt. When platforms hold licenses under financial regulators, users may receive better protection. While not all global platforms are regulated in every region, it is advisable to choose one that at least follows international financial compliance standards.
Some governments are now adopting clearer rules for cryptocurrency operations. This shift started a strategy that allows trusted companies to launch licensed trading products. Industry analysts predict that 2026 will introduce stronger regulation across major economies. This trend suggests that the best crypto exchanges will be those that adapt quickly to legal clarity and maintain transparent operations.
How Beginners Should Choose a Crypto Exchange
Selecting the best crypto exchange is not about choosing the biggest brand. It is about finding the platform that aligns with personal needs. Some beginners prioritize mobile trading while others focus on low fees or regional accessibility. Long-term investors prefer security and simplicity, while active traders want deep liquidity.
Beginners should consider these personal filters before making a choice. They should check verified reviews from real users instead of relying only on influencer promotions. They should also avoid trading platforms that operate without any form of verification or licensing. Responsible beginners start small, learn gradually, and use platforms that emphasize transparency.
What Will Matter in 2026
The crypto market is known for rapid innovation. In 2026 it is expected that artificial intelligence trading features, tokenized real world assets and regulated stablecoins will gain wider adoption. As the market grows, exchanges will compete more on security and transparency than ever before. Experts believe that platforms that focus only on leverage trading without user education may lose credibility.
A market strategist at a digital asset firm recently said in an interview that “the future belongs to trusted platforms that combine speed, security and simple products.” This view reflects an industry trend that favours quality and compliance over aggressive marketing. The best crypto exchanges are expected to integrate stronger consumer protection features.
Conclusion
Cryptocurrency markets are evolving quickly and more people are entering digital finance. This is why research and responsible trading are necessary. The best crypto exchanges for beginners in 2025 and 2026 are not only defined by trading volume. They must also demonstrate security, user education and transparency. Platforms that value long-term trust will stand strongest in the next cycle.
Beginners should avoid emotional decisions. They should study risk, understand trends and choose a platform that suits personal goals. The safest way to enter this market is through licensed platforms with proven records. Digital assets hold opportunity but require caution. With the right platform and education, anyone can participate in the future of finance.
Frequently Asked Questions
What is the safest crypto exchange for beginners A safe exchange is one that follows regulation, provides strong security tools and offers insurance on user funds where available. Coinbase, Kraken and Bitstamp are often considered safe due to their regulatory frameworks.
Which exchange has the lowest fees for beginners Fee structures depend on region and trading volume. Binance and Crypto.com usually offer lower fees but users should still compare withdrawal and conversion fees.
Can a beginner start trading with a small budget Yes. Many of the best crypto exchanges allow users to start with as little as ten dollars. However, beginners should never invest more than they can afford to lose due to market volatility.
Which exchange is best for buying Bitcoin Many exchanges support Bitcoin purchases including Binance, Coinbase, Kraken and OKX. The best choice depends on location and payment method.
Are peer to peer platforms safe for beginners Peer to peer trading can be safe when users follow platform guidelines and trade only with verified users. However, centralized exchanges are easier for true beginners.
Glossary of Terms
Fiat Currency Traditional government issued money such as dollars, euros or pounds. It is used to buy cryptocurrencies on exchanges.
Spot Trading The direct purchase of a cryptocurrency for immediate settlement. It is the simplest form of crypto trading.
Liquidity A measure of how easy it is to buy or sell a cryptocurrency without causing price changes. High liquidity means smooth trading.
Cold Storage Offline storage of cryptocurrency in hardware wallets to prevent hacking or unauthorized access.
Proof of Reserves An audit method used by exchanges to show they hold enough assets to cover user balances.
Auf YouTube findest du die angesagtesten Videos und Tracks. Außerdem kannst du eigene Inhalte hochladen und mit Freunden oder gleich der ganzen Welt teilen.
Bitcoin stayed range-bound into 08:00 UTC on OCt. 25 as volume spiked on a defense of support and sellers capped rallies near the top of the recent corridor.
The internet is changing fast. What started as simple web pages has now become a world full of digital ownership, smart contracts, and crypto payments. This is the third generation of the internet, which is referred to as Web3. But there is one big problem. It is not easy to use.
There is a large number of individuals who wish to use blockchain applications, to them halted due to their lack of knowledge regarding how wallets, gas charges, and private keys function. It is even frightening to connect a wallet or authorize a purchase. That is why user experience, or UX, is so significant in Web3.
To put it in simple terms, UX refers to the ease or the difficulty of using a product. Poor UX causes users to abandon them, and good UX causes users to come back. Web3 UX is in the infancy stage, and everything is a bit complex. It must be simplified to access more users, like regular applications like Google Pay or Instagram.
In order to become something that people can bring into daily life, blockchain should become invisible. The user is not supposed to be aware that he or she is using it. The system should work smoothly in the background, and that is where the future of Web3 UX is heading.
What Makes Web3 Hard to Use Right Now
Even though Web3 is full of new ideas, it has one major weakness. It is still made for tech people, not for everyone. Many users find it too complex to even start.
There are three big reasons that make Web3 hard for most people today.
Complicated Wallet Systems
A crypto wallet is needed for almost every Web3 app. But for new users, setting it up can be confusing. There are seed phrases, passwords, private keys, and backup rules. One small mistake can make someone lose all their funds forever. In regular apps, people can reset their passwords easily. But in blockchain, once it’s gone, it’s gone.
This fear makes many people stop before even starting. A better UX will have to remove this fear by offering safe, easy recovery and clear steps.
Gas Fees and Transaction Confusion
Every blockchain transaction needs gas fees. These are small payments made to confirm the transaction. But users don’t always understand what gas is or why the price keeps changing. On busy days, the fees can go up suddenly, and that makes people angry or confused.
Future Web3 UX will need to make this automatic. The system should pick the right gas fee and show a simple message like “Your transaction will complete in 10 seconds.” That is how easy it should feel.
Lack of Clear Design and Instructions
Most Web3 sites are still built for developers. They often use tech words like “bridge,” “staking,” or “hash” that make no sense to regular users. Simple design, clear buttons, and easy words are what the next phase of Web3 UX needs.
Why Simplifying Blockchain UX Is Key for Mass Adoption
Blockchain will not go mainstream unless it becomes easy enough for anyone to use. Most people don’t want to think about how something works inside. They just want to use it and get results.
Simplifying Web3 UX means hiding the complicated parts and showing only what’s needed. When people can open an app, buy something, and sign a transaction without fear or confusion, that is when blockchain will really grow.
Better UX also means trust. When users feel safe and confident, they spend more time in the ecosystem. They explore NFTs, DeFi, and games. They bring friends too. That is how mass adoption starts. Here is an example of what before and after UX improvement can look like:
Action
Before UX
After Simplified UX
Send crypto
Enter address manually
Choose contact name
Pay gas fees
Set manually
Auto-calculated in app
Sign transactions
Use long wallet popups
One-tap confirmation
View balance
Check explorer
Visible inside the app
Manage keys
Manual backups
Cloud + social recovery
This table shows how simplification can make blockchain act more like normal apps. Small improvements like these can change everything for new users.
Once blockchain tools become simpler, more people will join. It is the same story as the early internet. At first, only developers used it. Then came browsers and search engines. The same will happen with Web3. When the UX becomes smooth, adoption will follow.
Major Projects and Platforms Leading UX Innovation in Web3
Some projects already understand how big UX is for the future. They are trying to fix problems and make blockchain easier to use for everyone.
MetaMask and Wallet Simplification
MetaMask used to feel complex for many new users, but over time, it improved. It added features like one-click token swaps, easy network switching, and now even mobile login. The app also shows warnings for risky websites, which helps protect beginners.
Coinbase and Easy Onboarding
Coinbase is known for making crypto easier for normal users. It hides complex actions behind simple buttons like “Buy,” “Send,” or “Receive.” The app also connects directly to Web3 dApps through its wallet extension, which removes many confusing steps.
Arbitrum, Polygon, and Low-Fee Layers
Another big improvement comes from networks like Arbitrum and Polygon. They help cut gas fees and make transactions faster. For users, this means cheaper actions and fewer failed transactions. That alone improves the overall experience.
Here’s a small table comparing some popular Web3 wallets and their UX features.
Wallet Name
Speed
Design Simplicity
Recovery Option
Cross-Chain Support
MetaMask
Medium
Good
Seed phrase only
Yes
Coinbase Wallet
Fast
Very Easy
Cloud backup
Yes
Trust Wallet
Fast
Simple
Recovery phrase
Yes
Rainbow Wallet
Medium
Modern UI
Social login
Partial
Phantom (Solana)
Very Fast
Excellent
Recovery via seed
No
This comparison shows that wallets are slowly moving toward simplicity. Future ones will likely combine the best of all: one-click recovery, low fees, and clean designs.
Role of AI and Automation in Web3 UX
Artificial intelligence is starting to play a big role in Web3 design. It helps remove small confusions and guide users better. AI can make blockchain easier in many ways, like automating gas fee selection, predicting user intent, and helping with lost keys.
Chat-Style Wallet Assistants
Some wallets now use chatbots that talk with the user. Instead of clicking through complex menus, users can just type what they want. For example, “Send 10 USDC to Alex,” and the AI assistant prepares the transaction.
Smart Transaction Tools
AI can also predict network congestion and suggest the best time to make a transaction. It can calculate the best fee for the fastest confirmation. This not only saves money but also makes blockchain use feel smooth and intelligent.
AI Feature
Benefit to Users
Example in Web3
Auto gas calculation
No manual setup
MetaMask AI plugin
Transaction prediction
Faster approvals
Arbitrum AI integration
Voice or chat commands
Easier to interact
AI wallet assistants
Fraud detection
Safer experience
Coinbase security AI
AI takes away guesswork. It turns a complex blockchain task into something anyone can do without fear. This mix of AI and UX is the next big step for Web3 apps.
How Cross-Chain UX Makes Blockchain Feel Unified
One of the biggest issues in Web3 is how many blockchains exist. Ethereum, Solana, BNB Chain, Avalanche, and so many more. Each one works differently and uses its own tokens. For normal people, this can be confusing. They don’t understand why they can’t move coins easily from one to another.
Cross-chain UX is trying to fix this. It means building apps that work across different blockchains in a single interface. When users can do everything from one place, blockchain starts to feel like one connected internet, not a group of small islands.
Single Interface for Multiple Chains
A big trend now is multi-chain wallets. These wallets let users send or receive tokens on many blockchains without leaving the app. For example, Trust Wallet and OKX Wallet support dozens of networks on one screen. Users can switch between chains like Ethereum or BSC without even knowing what’s happening under the hood.
This kind of experience hides the complexity and makes blockchain feel like a normal digital app.
Importance of Unified User Flow
Cross-chain UX makes things smoother for developers and users both. It means people can buy an NFT on Polygon and then use it in a game built on Arbitrum. No need to worry about bridges or manual transfers. That’s what future apps will look like: simple, connected, and user-friendly.
UX Feature
Old Way
New Cross-Chain UX
Token transfers
Bridge manually between chains
Done inside wallet
App access
One app per blockchain
One app for all chains
Fees
Pay in each network token
Unified gas token system
NFT use
Locked to one chain
Shared between multiple chains
Cross-chain UX is what will make blockchain feel complete. It removes the feeling of walls between chains and helps new users see Web3 as one whole ecosystem.
UX Design Trends Shaping the Future of Web3 Apps
UX design in blockchain is not just about color or buttons. It’s about making something hard feel natural. The way users interact with wallets, tokens, and dApps is changing fast. Some design trends are now leading the next wave of Web3 UX.
Gasless Transactions
Some platforms now pay the gas fee for users or let them pay it in stablecoins. This removes a big confusion. Users don’t need to know about ETH or MATIC tokens to make transactions. It feels more like using an app that just works.
Human-Readable Wallet Names
Instead of long wallet addresses, some projects now let users use simple names like “john.eth” or “sara.crypto.” These are called ENS (Ethereum Name Service) domains. It makes sending tokens easier and safer because no one has to copy long codes.
Social Recovery Instead of Private Keys
Losing a seed phrase used to mean losing everything. Now, wallets are adding social recovery. It means friends or trusted contacts can help restore access if someone forgets their password. This feels more like normal internet apps.
Trend
What It Fixes
How It Helps Users
Gasless payments
Removes gas confusion
Makes sending faster
Simple wallet names
Long codes are hard
Easier to share
Social recovery
Seed phrase loss
Safer access
Mobile-first design
Desktop-only use
Brings blockchain to phones
These design trends show that Web3 is learning from Web2. The goal is to make blockchain tools work for everyone, not just developers.
Challenges Developers Face While Simplifying Web3 UX
Although UX is improving, developers continue to struggle a lot in their attempt to make Web3 easy. Blockchain is not just a normal database, and that complicates things.
One of them is the challenge of simplicity and decentralization. Developers would like to simplify things, but they also wish to have the users in control. One such example is to make apps centralized by adding password recovery. Then they have to strike a compromise.
Slow onboarding is another issue. Upon registration, new users must create wallets, keys, network connectivity, and even purchase crypto first. That’s a lot for a beginner. Making this process easier without violating the blockchain regulations is time and testing.
Scalability and Performance
Some apps become slow when the network is busy. That also hurts UX. Developers must design systems that stay fast even with millions of users.
Developer Problem
Why It’s Hard
Example
Balancing control
Easy UX vs user ownership
Custodial vs non-custodial wallets
Complex onboarding
Too many steps for new users
Wallet setup confusion
Network limits
High gas and lag
Ethereum congestion
Security trade-offs
Simpler UX can mean risk
Auto-sign features
These problems show why Web3 UX is not easy to fix overnight. But step by step, it’s getting better with new ideas and community testing.
Conclusion
The future of Web3 depends on how easy it becomes to use. If people can use blockchain without stress or fear, it will spread faster than ever. Simplicity is not just about good design; it’s about trust. When apps are clear, users trust them more.
Blockchain started as a tech project, but it will become part of normal internet life through better UX. AI, automation, and multi-chain support are already showing that direction. One day, people won’t even say they are using blockchain; they will just use it. That’s when Web3 truly becomes mainstream.
Frequently Asked Questions About UX and Web3
What does UX mean in Web3?
The abbreviation of user experience is UX. In Web3, it refers to the ease or the complexity of using a blockchain application. With a decent UX, users should be able to buy, send, or trade crypto without worrying or having to understand technical aspects.
Why is Web3 UX more complex than normal apps?
Web3 applications are more difficult as they require distinguishing such aspects as keys, wallets, and gases payments that are not regularly encountered by ordinary users. All these are concealed behind some casually placed buttons in normal apps, but Web3 still displays too much technical data in the first place.
How can better UX help blockchain adoption?
Once Web3 apps are easy and approachable, they will be used more by people. The UX should be smooth as this creates a feeling of trust and confidence so that users can navigate crypto without fear. It transforms blockchain into one of the baffling technologies into something that anybody can use in everyday life.
What are examples of simple Web3 apps today?
Coinbase Wallet, Trust Wallet, and Rainbow Wallet are some of the already-improving wallets. They are designed with intuitive designs, quick logins, and simple recoveries. Such minor additions allow amateurs to get into Web3 without being confused and intimidated.
Will AI make Web3 easier to use?
Yes, AI can make blockchain apps much simpler. It can explain what transactions mean, help pick gas fees, warn about risky websites, and even recover lost accounts. With AI guidance, Web3 apps will feel smarter and more user-friendly for everyone.
Glossary
Web3
The next generation of the internet that runs on blockchain technology. It allows users to own their data, use crypto, and interact directly with decentralized apps instead of big companies controlling everything.
UX (User Experience)
How a person feels when using a product or app. In Web3, it means how easy or hard it is to use wallets, trade crypto, or understand smart contracts.
Blockchain
A digital system that records information in a secure and transparent way. It stores data across many computers so no one person or company can control it.
Wallet
A digital tool used to store and send cryptocurrencies. It can be a mobile app, browser extension, or hardware device that helps people manage their blockchain assets.
Gas Fee
A small payment made to blockchain validators who confirm and record transactions. It is like a service charge for using the blockchain network.
Summary
The future of Web3 depends on how simple it becomes to use. Right now, many people stay away from blockchain because it feels too technical. Complicated wallet setups, seed phrases, and gas fees confuse users who just want easy tools.
But the new wave of UX improvements is changing this. Developers and designers are focusing on clean interfaces, automatic gas settings, human-readable wallet names, and better onboarding experiences. AI is also stepping in to help people understand what they are doing without getting lost in blockchain terms.
Cross-chain tools are making it possible to move tokens between networks easily, so users no longer feel stuck in one place. This new direction is what will make blockchain as normal as using social media or online banking.
A future Web3 app might let someone buy, trade, or store digital assets without even realizing they are using blockchain. That’s the goal, to make Web3 so smooth and natural that it just works. When that happens, blockchain will finally reach the mainstream world and become a part of daily life.
XRP price rose by over 3% today, Oct. 24, as the crypto market rebounded, following encouraging Ripple ETF and options news. Ripple (XRP) token jumped to $2.4655, up by 80% from its lowest level this month. It has also formed…
Updated on 24th October, 2025
This article was first published on The Bit Journal.
The sudden news of President Trump’s full pardon to Changpeng Zhao (CZ), Binance’s founder, has sent shock waves through the crypto market. triggering a dramatic rally in Binance’s native token, BNB, which jumped by as much as 5-8% following the announcement
Analysts are calling this is a $BNB price reaction that is entirely driven by policy rather than actual fundamentals. With $BNB trading at a range of $1130 post pardon and a market capitalization of over $157 billion, this event is a stark reminder just how fast regulatory news can impact the valuations of digital assets.
The Pardon and Instant Price Effect
The pardon of CZ came after he had pleaded guilty to failing to maintain effective anti-money-laundering controls at Binance and served four months in jail.
Once the news came through about the pardon, $BNB price shot up. Sources reported that $BNB surged to about $1140 within minutes of the announcement.
With as much as 8% and its market value popping past $157 billion, market watchers have called this BNB price reaction, where regulatory relief acts as a trigger for a massive token price spike.
The Anatomy of the BNB Price Reaction
What makes this $BNB price reaction so notable is how fast and intense it was as well as the circumstances behind it. Unlike broad crypto rallies, this price surge was focused specifically on $BNB and was closely tied to the regulatory outcome affecting Binance and its founder.
According to news reports, analysts noted that the crypto market was clearly on edge and reacting sharply with $BNB price jump.
Traders were quick to point out that futures open interest had also spiked, along with sharp volume growth on $BNB pairs following the pardon news.
The rebound happened right after $BNB tested support levels around $1,050-$1,080; so experts say it was primed for an upside once the trigger came.
Tracking Volume, Transactions & Market Depth
While the market saw the raw price movement of $BNB, on-chain data also shows a massive increase in transfers and activity on the Binance chain and BNB Smart Chain. Reports shared that whale wallets snapped up $BNB right after the pardon announcement. Trading volume data matched typical relief rallies.
The market reaction was not limited to BNB. Aster, another digital asset associated with the Binance founder, also saw a rapid spike. Coingecko data shows that Aster, which had dipped below $1 for the first time since Sept. 20 just a day earlier, jumped by over 12% to reach $1.08 following the news.
Broader Implications of the BNB Price Move
For Binance, the pardon opens up the possibility of US re-entry, renewed banking relationships and institutional outreach. Crypto observers think this is a US policy shift:
“In their desire to punish the crypto industry, the Biden administration went after Mr. Zhao … I gave him a pardon.” – President Trump
For investors, the BNB price reaction means regulatory risk premiums might be compressing at least for the big players.
While the move was big, analysts caution that sustaining momentum will depend on tangible execution from Binance and follow-through on the regulatory front.
Conclusion
This BNB price reaction caused by President Trump’s pardon of CZ is a great example of how regulatory events can move crypto markets fast and hard.
With $BNB price surging and market sentiment flipping overnight, the event shows that policy and regulation are part of the the primary drivers of price in the digital asset space.
Whether this is the start of a sustained trend or just a sharp relief rally depends on what Binance does next and the evolving regulatory environment. For now the price has spoken and it reacted fast.
Glossary
Presidential pardon: An act by the US President to pardon a federal crime and restore civil rights.
Relief rally: A market bounce after a significant risk or overhang is removed.
On-chain volume surge: A sudden increase in blockchain transaction or token transfer volume.
Support band: A price level where buying interest is strong enough to stop the decline.
Regulatory overhang: An asset being discounted due to unresolved legal or regulatory risk.
Frequently Asked Questions About BNB Price Reaction After CZ Pardon
What triggered the BNB price reaction?
CZ’s pardon removed a big regulatory overhang for Binance, and traders piled into $BNB again and the price went up.
Will $BNB continue to go up strongly?
While the move was big, it depends on Binance’s actions, regulatory follow through and broader market context.
Was the price move BNB specific?
Mainly. Other tokens went up a bit, but $BNB went up much more, so it’s a token specific move rather than a market wide breakout.
What to watch now?
Key things to watch are BNB’s price consolidation, volume, Binance regulatory disclosures, chain activity and if the ecosystem grows.
Solmate Infrastructure is making waves with a nearly 50% stock surge after announcing a new validator hub in the Middle East and strategic $SOL purchases, but could this be the start of a major expansion for the Solana ecosystem?
Solmate Infrastructure has gained attention with its major expansions and smart $SOL purchases. The Nasdaq listed company is supported by Cathie Wood.
According to the sources, its stock rose nearly 50% after it announced plans for a validator hub in the Middle East and a strong mergers and acquisitions strategy. Experts say this shows Solmate Infrastructure is becoming an important force in building the Solana ecosystem.
What is Solmate Infrastructure and What Does SOL Represent?
The company also creates real world infrastructure like validators to support its work. These validators help process transactions on the Solana network. By combining its token investments with this infrastructure, the company improves the network’s performance.
This approach helps the company play a bigger role in growing the Solana ecosystem. Solana (SOL) is the main cryptocurrency of the Solana blockchain and is made for fast and low cost transactions.
Solmate Infrastructure uses its treasury of discounted $SOL to grow its operations and make strategic purchases. The company focuses on both real infrastructure and token holdings. Experts say this makes Solmate Infrastructure a unique player in the cryptocurrency market.
Why Did Solmate Infrastructure’s Stock Jump 50%?
The main reason for the stock surge was Solmate Infrastructure announcing a validator center in the Middle East. The company finished assembling its first validator hardware in a UAE data center. It also bought $SOL tokens at a 15% discount, including a $50 million purchase during the recent crypto downturn.
CEO Marco Santori said these purchases will help support validator operations and long-term growth. Investors reacted positively to the news, sending the company’s stock to an intraday high of $12.55.
This gives the company a market capitalization of around $754 million. Analysts say this shows strong confidence in Solmate Infrastructure’s expansion plans.
How is Solmate Infrastructure Expanding Its M&A Strategy?
Solmate Infrastructure has revealed a strong mergers and acquisitions plan focused on businesses in the Solana value chain. CEO Marco Santori said the goal is not to make quick profits. The company wants to buy businesses where its $SOL treasury can help them grow.
This strategy is aimed at building long-term value for both the company and the Solana ecosystem. The company is focusing on businesses where its $SOL treasury can drive growth. Experts say this strategy helps bring together important parts of the Solana ecosystem.
It also increases confidence among investors. Many believe this approach will strengthen the company’s long term position in the market. The company is supporting its mergers and acquisitions plans with a $300 million PIPE financing round.
Ark Invest, the Solana Foundation, and UAE based Pulsar Group are providing this funding. The money will help the company expand and make key purchases. Experts see this as a sign of strong backing from important investors.
What Role Does Institutional Interest Play in Solmate Infrastructure’s Growth?
Institutional holdings in Solana are rising quickly, with 20 firms owning more than 20.3 million $SOL tokens worth about $3.86 billion. This shows growing trust in Solana based projects.
The company is benefiting from this trend, especially with Ark Invest holding an 11.5% stake. Experts say this support adds credibility and helps the company carry out its infrastructure and M&A plans.
How Does Solmate Infrastructure’s Validator Center Impact the Market?
The new validator center in the UAE is a significant milestone for the company. It allows the company to combine physical crypto infrastructure with its existing $SOL holdings, creating a stronger foundation for operations.
This validator network will not only improve the company’s ability to process transactions but also support the growth and stability of the wider Solana ecosystem.
Industry experts note that by pairing discounted SOL purchases with validator operations, the company can increase both financial returns and its influence within the Solana network over the long term.
Conclusion
Solmate Infrastructure has become a key player in the Solana ecosystem. It combines discounted $SOL purchases with a new validator hub in the Middle East. The company is focusing on buying key businesses to grow its Solana operations.
These actions are helping it build a strong foundation for the future. Investors are paying close attention to the company. The market’s response shows that many have confidence in the company’s strategy.
Analysts say its mix of building infrastructure and managing $SOL tokens is setting an example. Other institutional players may follow this model to enter the Solana ecosystem.
Glossary
Solmate Infrastructure: Company that builds Solana tools and holds $SOL.
SOL: Solana’s coin for fast and cheap payments.
Validator: Computer that checks blockchain transactions.
M&A: When a company buys or joins another to grow.
PIPE Financing: Investor money to help a company expand.
Frequently Asked Questions About Solmate Infrastructure
Why did Solmate Infrastructure’s stock rise 50%?
The stock rose because the company started a Solana validator in the UAE and shared new M&A plans.
How does Solmate use its $SOL tokens?
Solmate uses $SOL tokens to run validators, grow its business, and buy Solana related companies.
What is Solmate’s M&A strategy?
Solmate buys Solana related companies to grow in the long term and make the Solana ecosystem stronger.
What is Solmate’s current market value?
After the stock rise, Solmate Infrastructure is worth about $754 million.
Will the stock rally continue?
Experts think the rally could continue if Solmate grows its validators and completes its M&A plans.
Technical breakout hints at reversal, but confirmation needs $1.00 break.
TVL surge and new listings boost adoption amid rising volatility.
After a steep correction that erased much of its September gains, the Avantis price has staged an impressive rebound, rising 73% over the past week and 31.9% in the last 24 hours.
The AVNT token is now trading around $0.86, still nearly 59% below its September peak of $2.66.
While the recovery has rekindled investor optimism, the question remains — can this rally hold, or is it merely a temporary reprieve in a larger downtrend?
Whales are still on the sidelines
Despite the sharp recovery, large investors appear hesitant to jump back in.
On the daily chart, the Chaikin Money Flow (CMF), a key indicator of whale participation, remains below zero, showing that major wallets are not yet accumulating AVNT.
Historically, the Avantis price has moved in tandem with whale inflows; its September surge to an all-time high coincided with CMF turning positive.
Since the indicator slipped below zero on September 26, the market has seen sustained selling pressure.
While CMF has slightly improved in recent sessions, the momentum is weak.
The lack of significant whale support casts doubt on the rally’s durability.
For a genuine reversal to take hold, CMF needs to cross decisively into positive territory, confirming renewed institutional confidence.
Technical patterns hint at a possible shift
From a technical standpoint, Avantis appears to be trying to flip its bearish script.
The token recently broke out of a falling wedge pattern on the 12-hour chart, a formation often associated with a trend reversal.
The Relative Strength Index (RSI) sits at 52.1, and the MACD histogram has turned slightly positive at +0.0088 — both signs of growing bullish momentum.
However, beneath these signals lies a warning.
Between October 10 and 21, the Avantis chart formed a hidden bearish divergence, where prices made lower highs while RSI posted higher highs.
This pattern can foreshadow weakening upside pressure.
A close above $1.00 would invalidate this bearish setup, confirming stronger buying interest.
Until then, traders remain cautious, especially with key support anchored around $0.57.
Rising TVL and platform growth fuel optimism
Fundamentally, Avantis’ ecosystem continues to show progress.
The project’s Total Value Locked (TVL) recently surpassed $111 million, up more than 430% in a month.
Much of this growth stems from its synthetic asset trading platform on Base Chain, which has attracted new liquidity and users.
The development of composable yield products is also boosting engagement, as AVNT’s staking and governance features tie directly to network revenue.
This rise in TVL not only reflects increasing adoption but also suggests stronger underlying demand for the AVNT token.
The platform’s expansion reinforces its long-term utility case, even as short-term market sentiment fluctuates.
Exchange listings have added liquidity — but also volatility
AVNT’s recent listings on Binance, Upbit, and Coinbase have dramatically increased liquidity, with daily trading volume now exceeding $307 million — roughly 2.4 times its market capitalisation.
Such high turnover indicates speculative enthusiasm, but it also underscores the market’s instability.
Following the listings in September, AVNT soared by nearly 400% before correcting by 60% in the weeks that followed.
The current rebound, though encouraging, remains fragile unless sustained by organic demand rather than short-term trading.
Avantis price outlook
In the short term, all eyes are on whether the Avantis price can maintain momentum above the $1.00 resistance.
Breaking this level would signal the start of a broader trend reversal and could open the path toward $1.32 and potentially $2.66 — the previous all-time high.
Failure to hold above $0.57, however, could invite renewed selling and a retest of lower levels near $0.46.
The current ApeCoin price rally is driven by a technical breakout and legal clarity.
The bullish momentum, however, remains weak below key moving averages.
Upcoming token unlock and low adoption pose downside risks.
ApeCoin price has showed a sharp intraday today, but the gains mask fragile market dynamics.
While traders cheer the 16.2% 24-hour jump and burst in volume, multiple indicators point to follow-through risk.
Technical signals waver
ApeCoin has posted a notable breakout above short-term moving averages, briefly crossing the 7-day SMA and the 30-day EMA.
The MACD histogram has flipped positive, and the RSI-7 has moved out of the oversold territory, giving traders a short-term bullish signal.
The trading volume has also spiked dramatically to roughly $147 million, an increase that accompanied the price surge and amplified market attention.
However, deeper trend metrics tell a different story.
On higher timeframes, APE still trades below its MA-20, MA-50, and the MA-200, which keeps the longer bias tilted toward sellers.
Several momentum indicators remain inconsistent: some show bullish crossovers, while MACD on daily charts and ADX readings suggest persistent bearish momentum.
That mix creates whipsaw risk for momentum traders.
Legal relief boosts sentiment but isn’t a cure
ApeCoin’s market sentiment improved after a US court ruling in early October that reduced regulatory overhang by finding APE and related NFTs did not meet the Howey Test criteria.
Following the ruling, crypto exchanges publicly reaffirmed support, and institutional concern eased.
There is no doubt that the court ruling removed a headline risk that had weighed on price discovery for months.
However, legal clarity alone does not guarantee sustained demand.
Institutional adoption requires clear use cases and measurable on-chain activity.
These integrations broaden APE’s utility narrative and paved the way for new product experiments.
However, reported TVL across those integrations was modest, implying speculative trading drove much of the volume surge.
The market reaction underscores a familiar pattern: headline integration announcements can trigger big short-term price moves, while real adoption takes time.
Until developers and users materially increase activity, price appreciation will remain vulnerable to profit-taking and broader crypto market moves.
What to watch: ApeCoin price levels to watch
Key technical thresholds are straightforward and actionable. Analysts point to $0.459 as a critical support level to sustain bullish momentum.
According to CoinLore, a confirmed move above $0.4841 would open room toward higher resistance at $0.6660 and then $0.8718.
Conversely, downside scenarios grow if APE fails to hold above $0.459, or if it drops toward the $0.3402–$0.3953 five-day expected range.
HBAR price struggles below resistance at $0.20 after rejection at the value area low, with fading volume suggesting weakness and a possible retest of $0.12 support. Hedera’s (HBAR) recent price action shows continued weakness following a harsh rejection from the $0.20…
Pump token price forms a breakout pennant around $0.003979 as volatility builds. A decisive move from this equilibrium zone could define the next major directional trend. Pump token price (PUMP) price action has entered a tightening consolidation phase, forming a pennant…
Dogecoin price has been trading around the $0.19 level for days, with relatively little action in the market. The wildly famous meme coin is currently exchanging hands between $0.18 and $0.20 with a bit more activity than the week before.
Now, some analysts think the calm will soon yield to a big rally. New technical signals suggest that the Dogecoin price is showing some signs of life as it looks at a breakout of $0.5 as bullish momentum slowly returns.
Market Developments and Analyst Insights
Crypto analyst EtherNasyonaL on platform X is fuelling a traders comeback full of hope once again. The analyst added that the Dogecoin price is now testing the lower boundary of a long-term rising channel that has been directing its growth since its inception.
Every time Dogecoin price has hit this bottom range historically, it has seen significant bumpbacks. These reversals frequently signal the beginning of strong upward thrusts. The current setup resembles those in the past that have preceded major Dogecoin price rallies, the analysis adds.
Dogecoin tumbled earlier this month due to a sudden market decline, but began recovering swiftly from solid support areas. This recovery is reminiscent of the early phases of the 2021 surge, which saw the price of Dogecoin grow from less than $0.10 to over $0.70 in months’ time.
On each rip off this trendline support has coincided with a recovery that led to new highs for the coin. The structure indicates that Dogecoin may be again poised to accelerate higher should pressure mount on the market, the pattern suggests.
Momentum Indicators Point to a Bottom
EtherNasyonaL’s analysis revealed that DOGE’s momentum indicators are now at historic lows. The Stochastic RSI, which measures momentum strength, shows a clear bottoming signal. The last time this pattern appeared, DOGE entered a strong bullish cycle shortly afterward.
The analyst described the current stage as one of “quiet, calm, yet determined recovery.” Although the market appears still, the Dogecoin price could be in the early accumulation phase that often precedes large upward moves.
Technical Outlook and Price Channel Structure
The long-term rising channel on the Dogecoin chart is still holding. The Dogecoin price is currently with its back up against the bottom of these curves, which have acted as a launch point for previous cycles. A bounce back from this zone might drive the price towards $0.5.
If the recovery strengthens, further targets may include $0.9 and $1, aligning with the previous all-time high region. For now, maintaining the channel’s lower range is crucial for confirming a bullish continuation.
On-Chain Data Strengthens Bullish Sentiment
On-chain activity also confirms the positive view. The amount of DOGE held in exchanges’ reserves is still decreasing, indicating that holders are moving coins into long term storage. This decrease in available supply has been followed by runs up in the price of Dogecoin.
Month
Min. Price
Avg. Price
Max. Price
Change
Oct 2025
$ 0.1896
$ 0.2132
$ 0.2476
25.35%
Nov 2025
$ 0.2070
$ 0.2228
$ 0.2357
19.30%
Dec 2025
$ 0.2281
$ 0.2341
$ 0.2406
21.78%
The level at $0.195 is being closely monitored by analysts. Continued movement above that level could indicate the onset of a Wyckoff-style markup phase, as institutional and algorithmic buyers return to the market.
Short-Term Risks and Key Support Levels
There are positive signs, but short-term caution is still in order. There is a strong support forming near the $0.194 level, below which it might revisit the $0.188 support zone. Preserving these watersheds are critical to the path of maintaining this bullish structure.
Institutional traders are waiting on volume to confirm. A strong volume breakout beyond $0.20 could confirm the beginning of the next leg of the uptrend. Without it, these side way rests can continue before any broader move takes hold.
Calm Before the Potential Breakout
Currently, DOGE is in a state of consolidation and calm – but history says it’s unlikely to stay that way. The technical and on-chain indicators suggest momentum is building under the surface. Traders view this as the quiet before the next wave.
As the overall crypto market takes a breather, Dogecoin might be at the forefront of the next wave of bullish speculation. Historical cycles highlighted that quiet periods like this generally lead to a surge in upwards momentum, so it is worth keeping an eye on.
Conclusion
The Dogecoin value is stable, but it could break one way or another. Strong technical support, low momentum readings and increasingly confident investors indicate that the next move could be to the upside.
If Dogecoin continues to hold above $0.194, it might be a sign of strength in the market. If $0.20 gets taken out with volume the price can head higher towards $0.5 and beyond hopefully.
Pi Network price has plunged to a record low despite some major ecosystem and KYC news. Pi Coin (PI) token was trading at $0.2052, today, Oct. 24, down by over 90% from its highest point this year. It has shed…
The a16z podcast, hosted by Erik Torenberg, recently featured a fascinating discussion with co-founder Marc Andreessen and General Partner Katherine Boyle on how cinema illuminates the American cultural psyche. The episode, “Marc Andreessen: How Movies Explain America,” delved into iconic films like *Once Upon a Time in Hollywood*, *Tropic Thunder*, and *Fight Club*, using them […]
The crypto market is eying a relief rally in the coming days after the mild US consumer inflation report. It may also benefit from the upcoming Federal Reserve decision and talks between Donald Trump and Xi Jinping. Crypto market may…
XRP price holds above the $2.30 support, showing signs of accumulation. A sustained close above this level could fuel a rally toward $3.75 and potentially new highs. XRP’s (XRP) price structure remains constructive as the asset consolidates above a key…
Recently, XRP dropped 15% as Bitcoin slipped just 1%, showing amplified volatility.
XRP ETF delays and $8.13M in liquidations deepened XRP’s monthly decline.
Analysts see XRP rebounding toward $5–$12 if ETF-driven supply shock hits.
XRP price has become the focal point of heated debate after the token slid roughly 15% over the past month while the Bitcoin price barely moved.
Market commentators and analysts are asking why XRP would suffer such a steep pullback when the broader market appeared comparatively steady.
The answer, they say, lies in correlation dynamics, liquidations, regulatory lag and nascent institutional activity.
The sharp divergence with Bitcoin
In October, both Bitcoin and XRP rallied, with Bitcoin staying above the six-figure levels and XRP flirting with the $3 mark.
Profit-taking followed quickly, and altcoins absorbed most of the pain.
Traders who had piled into XRP were hit especially hard; one stretch of trading erased about $8.13 million of leveraged positions within four hours.
That sequence amplified losses and sent XRP below the $2.50 support level it had failed to hold after the upswing.
Charles Gasparino, a senior correspondent known for market coverage, spotlighted the paradox: Bitcoin fell only about 1% over the month, yet XRP plunged around 15%.
Why is BTC down 1 percent over the past month but XRP is down 15 percent?
The contrast underscores a structural reality where XRP has historically tracked Bitcoin’s moves but with greater intensity.
When BTC stumbles or consolidates, that sensitivity can turn into outsized downside for XRP.
XRP price and the ETF supply shock
Beyond short-term mechanics, a longer-term narrative is reshaping investor expectations.
Analyst Zach Rector has argued that the launch of multiple spot XRP exchange-traded funds and similar institutional vehicles could effectively remove a substantial portion of circulating supply from the market.
According to Rector, that “supply shock,” Rector says, would create the conditions for a dramatic price re-rating, with conservative models pointing to targets ranging from $5 up to double-digit territory — even as high as $12 by December 2025.
🧵Final 2025 XRP Timeline 🧵 XRP November Pump Coming ✅ $5-$12 XRP by first part of December 🚨
The regulatory backdrop also matters. Bitcoin and Ethereum have benefited from cleared paths to ETF adoption that flooded both markets with fresh capital.
XRP, by contrast, still faces an unresolved approval picture for spot ETFs in many jurisdictions.
That delay has likely depressed demand from risk-averse institutional buyers and made the token more sensitive to retail flows and sentiment shifts.
At the same time, data points show growing institutional interest via derivatives: CME-listed XRP and Micro XRP futures have recorded substantial contract volumes over recent months, a sign that professional desks are increasingly engaging the token.
XRP price analysis
From a technical analysis standpoint, the $2.30 area acted as a concrete support during mid-month liquidations, and the bounce to around $2.50 suggests buyers remain interested at those prices.
A sustained break above $3.40 would, in many analysts’ views, open a path toward $5.5, and if ETF-driven supply lockups occur, upside to substantially higher levels becomes plausible.
On-chain signals constructively complicate the picture.
The XRP Ledger is approaching a major transaction milestone, nearing 100 million recorded transfers.
That activity signals ongoing utility and adoption within payments and DeFi niches where XRP has carved a role.
Such resilience in on-chain throughput can buttress confidence even when price action looks shaky.
Assessing the path forward means weighing an array of forces: correlation-driven volatility, liquidation dynamics, regulatory clarity, and institutional adoption through derivatives and potential ETFs.
Short-term traders must manage the heightened risk that comes with XRP’s amplified moves.
Long-term investors, on the other hand, should watch ETF developments and on-chain adoption as the main levers that could catalyse the next leg of momentum.
Trading volume for BNB increased nearly 35% above its seven-day average, with market analysts suggesting the price movement reflects long-term accumulation.