Normal view

Today — 29 October 2025Main stream

Solana Eyes $210 Before Its Next Major Move—Uptrend Or Fakeout Ahead?

29 October 2025 at 05:00

An analyst has explained how Solana could decide its next big move after rising to $210, the resistance level of a Parallel Channel.

Solana Has Been Trading Inside A Parallel Channel Recently

In a new post on X, analyst Ali Martinez has talked about how the trajectory of Solana is looking from the perspective of a technical analysis (TA) pattern. The pattern in question is a Parallel Channel, which forms whenever an asset’s price trades between two parallel trendlines.

The upper line of the channel is considered a source of resistance, meaning that tops can be probable to appear on retests of it. Similarly, the lower level is assumed to provide support to the price, helping it to arrive at bottoms. A breakout of either of these bounds can signal a continuation of the trend in that direction. That is, a surge above the Parallel Channel can be a bullish signal, while a drop under it may lead to bearish action.

There are a few different types of Parallel Channels, depending on how the channel is oriented with respect to the graph axes. Channels that have a positive slope are known as Ascending Channels, while those that slope downward are called Descending Channels.

In the context of the current topic, the third and simplest type is the one of interest: a Parallel Channel that’s also parallel to the time-axis. This case corresponds to a phase of true sideways consolidation in the asset.

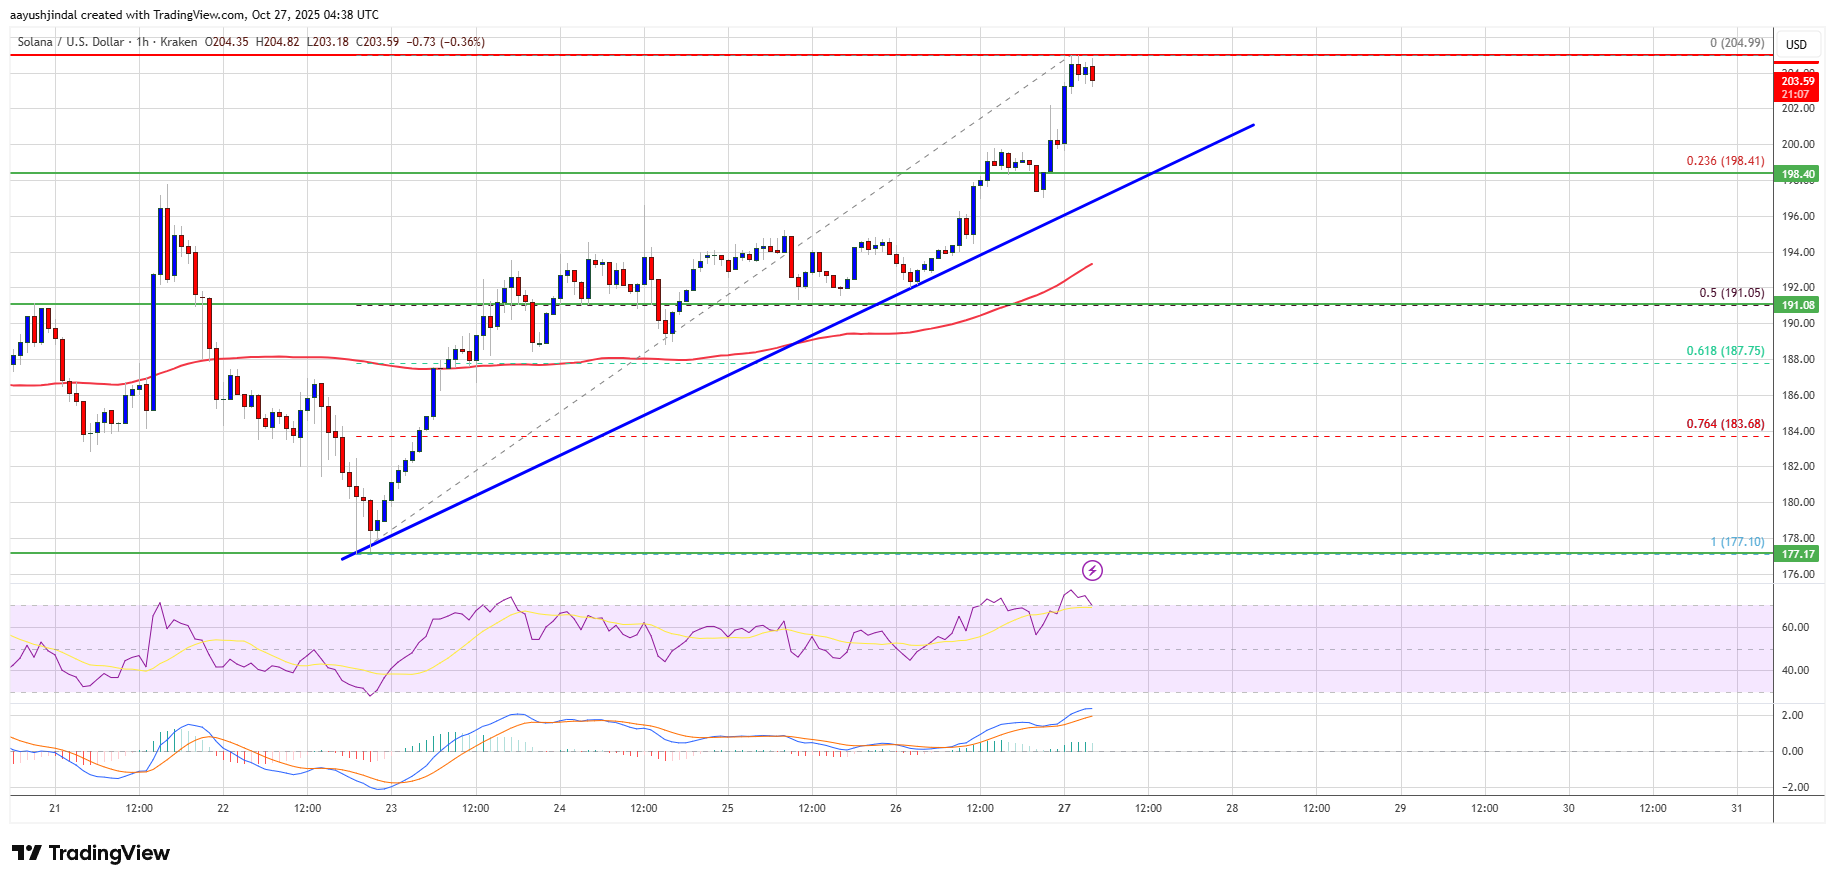
Now, here is the chart shared by Martinez that shows the Parallel Channel that the 4-hour price of Solana has been stuck inside for the last couple of weeks:

Solana Parallel Channel

As displayed in the above graph, Solana retested the lower level of the Parallel Channel last week and successfully found support. The cryptocurrency has since been rising and nearing the resistance level, located at $210. Considering the coin’s current trajectory, the analyst has noted that its price may be heading for a retest at $210 before making its next big move. However, the direction of such a move, if one happens, remains uncertain.

Given that the $210 level corresponds to the resistance line of the Parallel Channel, it’s possible that a retest could reject Solana all the way back down to the support level around $176. It’s also possible, though, that this retest could instead lead to a breakout. In this case, SOL could naturally see a sustained bullish push. It now remains to be seen which of the two scenarios will play out for the asset if the Parallel Channel holds and a retest takes place.

SOL Price

At the time of writing, Solana is floating around $200, up over 7.5% in the last seven days.

Solana Price Chart

Solana’s DeFi Stack Expands With SolsticeFi’s Risk-Controlled Yield Platform — Here’s How

29 October 2025 at 04:00

The Solana decentralized finance (DeFi) ecosystem just gained another powerful addition with the launch of SolsticeFi. This innovative new platform is poised to introduce a much-needed layer of risk-controlled yield generation, directly addressing one of the primary concerns for users venturing into the safety of their deposited capital.

SolsticeFi is reimagining how investors earn on Solana by introducing a defensively engineered approach to yield, one that directly protects the value of user deposits. According to crypto commentator Madissa’s post on X, one of SolsticeFi’s most compelling features is its ability to allow users to continue earning staking rewards while keeping their assets liquid and usable across the broader DeFi ecosystem.

How SolsticeFi Balances Risk While Generating Yield

This innovation created continuous opportunities for user to deploy their capital in other protocols without interrupting their base yield, instead of locking up funds. SolsticeFi platform is designed to prioritize full transparency and validator diversification, minimizing exposure to single-validator risks and opaque yield platforms. Furthermore, depositing capital into SolsticeFi provides support for SOL’s network security while generating sustainable returns for users.

Related Reading: Solana Stays Strong: Network Outperforms Rivals Amid AWS Outage Turmoil

Crypto analyst Hokage has also mentioned how Solana is improving and completely revolutionizing financial transaction speeds in traditional finance (TraFi), where transfers take days, settlements drag, and middlemen slow everything down.

SOL has changed the game by creating a new block every 400 milliseconds, and currently, the central to this acceleration is Bam, the new block assembly marketplace. This Bam will speed up how quickly user transaction gets picked up and integrated into a block, and slash inclusion times to an astonishing 50-100 milliseconds. Building on this is Alpenglow, which takes finality down to an incredible 100-150 milliseconds faster than a blink, and the point where the network confirms the user transaction is 100% done and irreversible.

One project that stands out in these ultra-fast ecosystem steps is SolsticeFi’s USX, a stablecoin specifically built to move at that speed, which enables users to send dollars, deploy capital, and settle instantly. Hokage concluded that “while these advancements might sound like pure sci-fi, if you’ve been around the SOL ecosystem, you would know it’s not.”

Market Confidence Returns To Solana

While SolsticeFi provides speed and reduces risk to Solana yield platforms, KOLS Manager at Binance, investor, and trader BitGuru, has noted that SOL’s price is currently showing a strong bullish setup, after following a steady downtrend and now stabilizing near key support.

As a result of that action, the SOL market is now pulling back with considerable strength, aiming to break above the critical $210 resistance level, a zone that has capped multiple attempts at recovery. A decisive breakout above $210 would likely trigger SOL’s next leg higher toward $230 and beyond.

Solana

Dogecoin Open Interest Crashes 50% From October Highs, Volume Is Worse, What’s Going On?

29 October 2025 at 01:00

Dogecoin (DOGE) is facing a steep market cooldown after weeks of heightened trading activity in early October. Data from CoinGlass shows that both Open Interest (OI) and trading volume for DOGE futures have crashed, indicating a sharp decline in the meme coin’s momentum. The latest figures reveal a significant pullback in derivatives activity and spot market participation, suggesting that traders may be retreating from speculative positions as volatility eases. 

Dogecoin Open Interest Crashes Over 60%

Dogecoin’s Open Interest has plunged dramatically from its October highs, reflecting a rapid exodus of leveraged traders from the market. According to CoinGlass, total exchange DOGE futures Open Interest has fallen over 62% from a peak of $5.03 billion on October 7 to $1.88 billion on October 28. This represents a drop to approximately 9.41 billion DOGE, valued at $ 0.20 per token.

Despite the decline in Open Interest, Binance, BitMEX, and Bybit continue to lead as the top exchanges with the highest Dogecoin futures activity. Still, the downturn has been widespread across exchanges. Kucoin recorded the largest drop in recent hours at 3.1%, followed closely by Bitget, which saw a 2.27% decline. Over the last 24 hours, Bitunix recorded the steepest drop in Open Interest, down 15.86%, while Crypto.com saw a 7.36% reduction. 

Dogecoin

Even Binance, which consistently leads Dogecoin futures trading, has seen a notable pullback. CoinGlass reports that the exchange’s Open Interest peaked at $964.7 million on October 7, marking a monthly high. Since then, it has fallen to $380.29 million (1.9 billion DOGE), representing a staggering 60.6% crash in just over three weeks.

Dogecoin Sees Even Worse Decline In Volume

Trading volume for Dogecoin has mirrored the collapse in Open Interest. CoinGlass data shows that Dogecoin’s futures volume heatmap across major crypto exchanges is in the red zone. Total trading volume had spiked to $20.45 billion on October 11, following the devastating crypto flash crash on October 10, but has since plummeted to $5.31 billion as of October 28. This represents a whopping 74% decline.

On individual exchanges, Binance’s DOGE trading volume dropped by 9.35% in the past 24 hours, while OKX saw a 13.69% decline. CoinEx recorded the largest volume decrease at 26.1%, followed by Gate.io at 23.94%. Popular exchanges like Bitget, Kucoin, and Bitunix also reported varying declines of 4.96%, 20.37% and 13.16%, respectively, as overall market liquidity thinned

However, a few exchanges bucked the downward trend, recording slight gains. dYdX saw its DOGE volume surge by 167.61%, HTX increased by 49.93%, and Hyperliquid rose by 23.88%. Bybit and MEXC also recorded modest gains of 24.98% and 1.88%, respectively. 

Alongside its decline in trading volume, CoinGlass notes that Dogecoin’s price performance has slipped. The meme coin is currently trading at $0.20, down 13.19% over the past 30 days and 2.86% in the last 24 hours.

Dogecoin

Here’s Why The XRP Price Still Isn’t Bearish Despite The 50% Flash Crash

29 October 2025 at 00:00

The XRP price recently saw a sharp drop that was very scary for many traders, and some in the crypto market think the chart looks weak now. However, an analyst on X, Cryptoinsightuk, disagrees. The analyst explains that XRP is not bearish right now, even after the 50% flash crash, and the price can still move higher when liquidity returns.

Low Downside Liquidity And Weekly Chart Still Looks Fine For The XRP Price

Cryptoinsightuk says that XRP has “no downside liquidity.” The analyst explains that sellers are not strong, so there is very little liquidity sitting below the current price level. It does not mean the XRP price will stay still, although it may move up and down for now. At some point, exchanges and market makers may push the price higher into deeper liquidity, where they can make money.

XRP Price 1

The analyst says that the flash crash does not damage the weekly chart. The weekly picture still shows a normal trend even after the sharp fall. He notes that online discussions are focusing on the monthly chart and using it to claim that XRP is weak, but the monthly chart alone is only one timeframe and not enough to call the price truly bearish. The slight drop shows weakness only on lower timeframes, not in the broader market structure, and Cryptoinsightuk believes the bigger structure is still pointing up, which is a key reason he does not see a bearish trend forming even after the 50% flash crash.

XRP Price 2

The analyst’s comment about market makers also gives hope to traders who worry that the XRP price will keep falling. When market makers see better opportunities at higher price levels, the price often moves up to where they want to make profits. It gives XRP a path to recovery later, rather than staying low. He keeps pointing to the weekly chart because it shows that XRP still holds its larger bullish setup even after the fear caused by the flash crash.

Higher Timeframes Look Strong, And RSI Fractal Points To A Move Up

Cryptoinsightuk further adds that higher timeframes are always more reliable for reading price trends and recommends looking at the XRP price chart over the past three months. In his view, the three-month chart looks good and supports a strong long-term trend. 

XRP Price 3

He also looks at the daily RSI, and it recently hit an oversold area. When this happened the last time, the XRP price later saw a strong move up. The analyst shared a fractal a few weeks ago that shows what a new “measured move” could look like if this same pattern repeats

XRP Price 4

The fractal suggests the XRP price could rise again from here. The oversold RSI signal suggests that buyers could return and push the price higher in the future. 

XRP price chart from Tradingview.com

Binance Whales Turn Active On Uniswap As Outflows Hit Multi-Month Highs – Details

28 October 2025 at 23:00

Uniswap (UNI) has been consolidating since the October 10 market crash, with price action stabilizing but volatility still lingering. The decentralized exchange (DEX) token has struggled to regain its previous momentum, reflecting the broader uncertainty across the altcoin market. Analysts remain divided on its short-term outlook — some view Uniswap as a key driver of Ethereum’s DeFi ecosystem and a potential leader in the next recovery phase, while others caution that lingering liquidity stress and waning trader activity could spark more turbulence ahead.

Despite this cautious backdrop, new on-chain data suggests a shift may be underway. According to CryptoQuant insights, Binance whales have become increasingly active on UNI, with large transactions and outflows spiking to multi-month highs. Historically, this type of whale behavior — especially when coupled with heavy exchange outflows — has been associated with accumulation phases and strategic repositioning by major players.

As Uniswap’s fundamentals remain solid, with trading volumes and user engagement steadily recovering, the renewed whale activity could indicate that smart money is quietly preparing for the next market leg. Whether this accumulation marks the early stages of a trend reversal or just a temporary pause before further volatility remains to be seen.

Uniswap Exchange Outflows Hit Multi-Month Highs

In recent days, Uniswap’s native token, UNI, has seen a notable uptick in large-scale activity, signaling renewed interest from major market participants. According to on-chain data from CryptoQuant, whale wallets — typically identified by the top 10 largest transactions — have begun moving significant amounts of UNI out of Binance. These outflows represent transfers from exchange wallets to external addresses, a behavior that often indicates accumulation or long-term repositioning by large holders rather than short-term trading.

UNI top 10 Whale Outflow on Binance | Source: CryptoQuant

The data highlights a daily peak of 17,400 UNI withdrawn from Binance, alongside a monthly peak of 5,250 UNI, marking a three-month high in whale activity. Historically, such outflow spikes tend to occur during accumulation phases, as whales seek to reduce exposure to centralized exchanges and secure tokens for longer-term holding or staking opportunities.

This renewed movement comes at a time when UNI is still digesting the market correction that began in July, with prices stabilizing but failing to regain strong upward momentum. Analysts interpret this surge in whale activity as a potential early indicator of confidence returning to the asset. If sustained, it could mark the beginning of a structural reversal — a shift from post-crash consolidation to the early stages of renewed accumulation and recovery.

UNI Price Analysis: Consolidation Persists as Whales Reenter the Market

Uniswap (UNI) continues to consolidate near the $6.50 level after a sharp correction that began in July 2025. The weekly chart shows a prolonged period of sideways movement following a breakdown from the $12 resistance zone, where bullish momentum previously failed to sustain. Despite multiple attempts to rebound, UNI remains below the 50-week and 200-week moving averages, both of which now act as dynamic resistance levels.

UNI consolidates around key level | Source: UNIUSDT chart on TradingView

The recent price action reflects investor hesitation, with the broader market still digesting the effects of the October 10 crash. However, volume analysis indicates that selling pressure has started to decline, suggesting that sellers may be exhausting and that accumulation could be forming at current levels.

From a technical perspective, the $6.00–$6.20 zone serves as immediate support, while a decisive reclaim above $8.00 would be required to shift market structure toward a potential mid-term recovery. Interestingly, the recent whale accumulation reported by on-chain data aligns with this stabilization phase — a pattern often seen near cyclical bottoms.

If Uniswap maintains support and market sentiment improves, UNI could attempt to retest the $10–$12 zone in the coming months. Conversely, a failure to hold above $6 could open the door for a retest of the 2024 range lows around $4.

Featured image from ChatGPT, chart from TradingView.com

Pundit Says XRP Price Will Not Teleport To $500 This Cycle, Shares ‘Realistic’ Targets

28 October 2025 at 22:00

A recent debate on the social media platform X has drawn attention to XRP’s long-term price outlook after an XRP enthusiast, Crypto Bitlord, proposed a rather wild scenario where the cryptocurrency teleports to $500 instantly. His post, which imagined XRP being used by the US government to pay off its $35 trillion debt, caused some reactions across the XRP community. 

In response, well-known crypto analyst ChartNerd stepped in to temper expectations, explaining that while XRP’s future is bright, such a leap to $500 is far from realistic this market cycle.

ChartNerd’s Take On Realistic XRP Targets

ChartNerd’s comments immediately stood out for their grounded tone, especially amongst reactions filled with predictions of explosive, instant gains. Responding directly to Bitlord’s vision of XRP rocketing to $500, ChartNerd clarified that XRP’s price will not trade at that price target this cycle. “$XRP will not teleport to $500,” he said.

Instead of a three-digit price, the analyst noted that the XRP price can only realistically reach the double-digit threshold in this cycle. “Realistically, it could definitely teleport to $13-$27 this cycle,” he continued.

This double-digit price target, although very bullish compared to XRP’s current price action, pales in comparison to other bullish projections from other crypto analysts, with many anticipating triple-digit price targets and others even predicting a run to $1,000 and beyond.

As conversations around potential XRP ETFs continue to gain momentum, one commenter asked ChartNerd whether his projections accounted for the billions in possible ETF inflows and the tokens expected to be locked in treasury funds and liquidity pools over the next few months. 

His response showed that his analysis was not detached from these developments. ChartNerd explained that even if XRP captured half of Bitcoin’s ETF trading volume from the past two years, the result would still translate to a market capitalization of roughly $1.2 trillion, bringing the price closer to his $27 upper target rather than $500.

Most ultra-bullish XRP price predictions are contingent on the cryptocurrency gaining adoption among banks and players in traditional finance. However, adoption models grow over years, not weeks, with ChartNerd adding that “these developments take time, and triple digits are not possible until many a year down the line.”

Staying Grounded Amid Bold Predictions

Another user remarked that Bitcoin once faced similar disbelief before breaching $100,000, meaning that XRP could surprise skeptics in the same way. ChartNerd, however, maintained his cautious stance with the response, “Highly unlikely imo, we shall see. I’ll stick to double digits.”

Such comparisons overlook the fundamental differences between Bitcoin’s and XRP’s market dynamics, especially when it comes to their circulating supplies.

At the time of writing, XRP is trading at $2.66, a 1% increase in the past 24 hours and a 9.2% rise over the last seven days. To reach the hypothetical $500 level, XRP would need to surge by roughly 18,690% from its current price. By contrast, hitting $13 or $27 would represent gains of approximately 388% and 915%, respectively.

XRP

Dogecoin Price Hasn’t Begun Its 3rd Wave Yet, ATH Above $0.8 Still In The Cards

28 October 2025 at 21:00

The recent Dogecoin market action has seen its price now hovering below $0.20 after surging to $0.208 in the past 24 hours. Despite the consolidation, analysts and traders are watching the meme coin closely, believing that the next major move could redefine its long-term trajectory. 

Among those voices is crypto analyst EtherNasyonaL, who predicted that Dogecoin’s third and most powerful bullish phase is still ahead. His technical analysis on the monthly chart presents a structure that reveals the groundwork for another massive uptrend to above $0.8 is already in motion.

Dogecoin’s First Two Bull Waves Set The Stage

The monthly candlestick price chart shared by EtherNasyonaL calls attention to Dogecoin’s cyclical nature since 2014, showing two completed bull waves and a third one forming. Each of these bullish waves was formed after Dogecoin broke above and then retested the upper trendline of a descending channel of lower highs that had confined its price action in the preceding years. This retest was also highlighted by a confluence of the 25 Moving Average (MA) indicator.

The first wave, which began in 2017, caused Dogecoin’s earliest exponential rise from near-zero levels, right when the meme coin entered into popular crypto discussions. The second, and far more explosive, bull wave occurred between 2020 and 2021, when Dogecoin surged from under $0.003 to an all-time high of $0.7316, which has stood until now. 

Each bull run started once Dogecoin reclaimed its 25-month moving average as support, following extended consolidation periods that spanned multiple months. The current setup reflects the same condition, as the 25MA line has once again turned upward, and Dogecoin has successfully retested the upper trendline of its previous descending channel, as shown in the chart below.

Dogecoin price

Dogecoin 1M price chart. Source: @EtherNasyonaL on X

3rd Bull Wave Setup: Resistance Retested, Accumulation Ongoing

The analysis reveals that Dogecoin has recently broken free from a long-term downtrend that spanned between mid-2021 and early 2025. Notably, recent crypto market liquidation events in October have seen the Dogecoin price complete a successful retest of the resistance level, now turned support, around the $0.17 to $0.20 price range. 

This successful retest also coincides with a simultaneous bounce off the bottom trendline of an ascending channel. EtherNasyonaL describes the current price action as Dogecoin “accumulating strength in the lower band of a years-long ascending channel.”

The projected trajectory on the chart above shows Dogecoin following its established pattern by moving from the lower region of the ascending channel to its upper boundary. If the third bull wave plays out as the previous two did, Dogecoin’s price could challenge its $0.73 all-time high and break into new price territories.  The first price target in this case is the $0.8 mark, and then as high as $4 in the long term. 

Dogecoin price chart from Tradingview.com

Yesterday — 28 October 2025Main stream

Analyst Predicts XRP Price Crash To $1.4 In Final Wave

28 October 2025 at 19:00

Crypto analyst CasiTrades has predicted that the XRP price could still crash to $1.4 in the final wave of this downtrend. This comes despite bullish catalysts such as the Fed rate cut, which could lift the altcoin to new highs. 

Analyst Predicts XRP Price Crash To $1.4

In an X post, CasiTrades stated that exchanges are aligning toward their .618 retracements, with Binance showing a crash to between $1.35 and $1.46 for the XRP price. She noted that this next wave down would complete the macro Wave 2 correction, setting the stage for the next Wave 3 impulse that could send XRP toward $6.50 or $10.

This came as the analyst remarked that the XRP price was at a major decision point, with the price continuing to test the Wave 4 highs. She noted that this resistance is making another wave down a possibility. To invalidate the move down, CasiTrades stated that XRP needs to break and hold above $2.82 on Binance. 

However, so far, the XRP price hasn’t done so, with CasiTrades noting that the price is still ranging between support and resistance. She explained that this leans toward this being a Wave 4, with the altcoin one final move lower before the next macro impulse. The analyst ruled out a V-shaped recovery, noting that price typically breaks through resistance immediately and decisively, which is not happening with the current price action. 

XRP

She further remarked that the hesitation suggests that selling pressure isn’t fully exhausted for the XRP price. However, CasiTrades assured that the deeper support levels aren’t a reason to panic, as they are high conviction accumulation zones. Meanwhile, the analyst highlighted a discrepancy in the price action on different exchanges. 

She noted that the XRP price on Binance wicked to $0.77 during the $19 billion liquidation event, while on Coinbase, XRP never reached its .618 retracement level. CasiTrades then reiterated that until $2.82 breaks, the price action favors one final wave down before the next major move up.

XRP’s Bull Run Isn’t Over

Crypto analyst Egrag Crypto has assured that the bull run isn’t over for the XRP price, despite predictions that the top may be in. He stated that as long as XRP holds above $2.20 and $1.97 as monthly closes, then there is no structural break. He also believes that the altcoin and other risk assets are about to “roar.”

Egrag Crypto noted that quantitative tightening is still active and that Fed rate cuts are just beginning. In line with this, he declared that the last leg up is still waiting to play out. He claimed that cycles don’t end when 50% of traders are cautious, but do when everyone is “drunk on euphoria.”

At the time of writing, the XRP price is trading at around $2.6, down in the last 24 hours, according to data from CoinMarketCap.

XRP

Bitcoin And Crypto Market Set To Bounce As Rate Cut Probabilities Touch 98.3%

28 October 2025 at 14:30

The next Federal Open Market Committee (FOMC) meeting is fast approaching, and the bets are already pouring in as to what it would mean for the Bitcoin and crypto industry. The last FOMC meeting took place in September, when the Federal Reserve ended up cutting rates down to 4-4.25% after months of no rate cuts. With this setting the tone, the expectations that another rate cut could be on the way are getting louder, with the FedWatch Tool showing a high percentage.

Market Expects Another Rate Cut To 3.75-4%

The next FOMC meeting is scheduled for Wednesday, October 29, 2025, and there is already a major clamor around what the Fed is planning on doing. The current market headwinds point to a favorable outcome for risk assets such as Bitcoin and other cryptocurrencies, with expected rate cuts.

Currently, the CME FedWatch Tool is showing that the probability of a rate cut has risen to 98.3% as of the time of this writing. This leaves only a 1.7% chance that the Federal Reserve will actually leave rates at their current levels, and there is zero chance that there will be a rate hike.

Fed FOMC

A reduction in the rate cuts is good for businesses all around, as lower interest rates mean better loan terms and increased spending and borrowing. Thus, it will increase the participation in the markets, from consumer goods to the stock market, and then make its way into newer markets such as Bitcoin and crypto.

Expectations For Bitcoin And Crypto Are Getting Higher

A rate cut by the Federal Reserve aligns with the more pro-crypto stance that the United States has been moving in since President Donald Trump was elected. Last week, the president pardoned the Founder and former CEO of the Binance crypto exchange, Changpeng Zhao, after he previously pled guilty to money laundering violations back in 2024. Zhao has since served a 4-month stint before the pardon from Trump came.

With the US embracing Bitcoin and crypto again, a rate cut will only further the ascent, allowing more investors to get into the market as liquidity frees up. The initial announcement has been known to trigger a rapid increase in the market. But as the news settles, the crypto market is expected to continue to rise in response.

However, nothing is certain until the FOMC meeting is complete and the announcement is made. For the Bitcoin and crypto market to remain bullish, inflation will also have to be reduced, as an increase could trigger more conservative stances from investors.

Bitcoin price chart from Tradingview.com (crypto)

Solana, Litecoin, Hedera ETFs Ready? Experts Expect Tuesday Launch Despite Goverment Shutdown

28 October 2025 at 12:00

Multiple crypto exchange-traded funds (ETFs) are set to launch this week despite the government shutdown, with investment products based on Solana (SOL), Litecoin (LTC), and Hedera (HBAR) seemingly ready to start trading as soon as Tuesday.

Big Week For Crypto ETFs

On Sunday night, Nate Geraci affirmed that the next two weeks will be key for the long-awaited spot crypto-based ETFs as Solana, XRP, LTC, and other ETF filings are “all lined up & ready for launch.”

Similarly, Bitwise CEO, Hunter Horsley, hinted that this week would be a “Big week,” suggesting progress related to its Solana Staking ETF. It’s worth noting that the crypto community has been awaiting the US Securities and Exchange Commission (SEC)’s approval of the investment products following the numerous ETF applications filed over the past few months.

Between August and September, the regulatory agency postponed the decision deadline of most applications by two months, pushing back the key dates to mid-October and mid-November. However, the government’s shutdown, which started on October 1, reduced the odds of the products receiving a green line during the expected timeline.

On Monday morning, ETF expert Erich Balchunas reported that multiple issuers were looking to launch their crypto-based ETFs this week, despite the government shutdown. According to the Bloomberg analyst, Canary Capital had filed 8-A forms for its spot Litecoin and Hedera ETFs, while Bitwise had filed one for its Solana Staking ETF.

“These are the ones rumored to be poss looking to launch (along w Grayscale solana) this week despite shutdown. Not a done deal but clearly preparations being made. Stay tuned,” Balchunas stated.

Solana, Litecoin, Hedera Products Take The Lead

Later, Balchunas confirmed the reports that the exchange had posted listing notices for Bitwise’s Solana Staking ETF, and Canary’s LTC and HBAR ETFs to launch on October 28, while Grayscale’s Solana trust is set to convert on Wednesday. “Assuming there’s not some last min SEC intervention, looks like this is happening,” the analyst added.

Crypto Journalist Eleanor Terret also shared the news, citing Canary’s CEO, Steven McClurg, who confirmed that the Canary spot HBAR and LTC ETFs will begin trading on Nasdaq on Tuesday.

“Litecoin and Hedera are the next two token ETFs to go effective after Ethereum,” McClurg told the journalist in a statement. “We look forward to launching tomorrow.”

Terret explained that despite the government shutdown, the launch is possible because “the operation of law does not always actually require an open government.”

According to the post, the 8-A forms are “just as important” as the S-1s filings: the former formally registers ETF shares under the Securities Exchange Act of 1934, while the latter registers the investment products under the Securities Exchange Act of 1933.

After NYSE certified all the 8-A filings for the ETFs above on Monday, shares can start trading, Terret affirmed, adding:

“Here’s the key: The issuers included language in their amended S-1s that lets them automatically go effective 20 days after filing. Typically, issuers delay S-1s until the SEC takes them effective, but the legal default is that the S-1 goes automatically effective without SEC intervention. That means the agency doesn’t need to approve them manually and the filings can go live on their own, even during the shutdown. So, long story short, all the legal boxes are checked and these ETFs are on track for launch.”

Solana, SOL, SOLUSDT

Bitcoin Fear & Greed Index Returns To Neutral As BTC Breaks $115,000

28 October 2025 at 10:00

Data shows the Bitcoin Fear & Greed Index has surged back into the neutral zone after the recovery rally in the cryptocurrency’s price.

Bitcoin Fear & Greed Index Now Has A Value Of 51

The “Fear & Greed Index” refers to an indicator created by Alternative that measures the average sentiment present among traders in the Bitcoin and wider cryptocurrency markets. The metric uses the data of the following five factors to determine the investor mentality: trading volume, market cap dominance, volatility, social media sentiment, and Google Trends.

The index uses a numerical scale running from zero to hundred for representing this sentiment. All values above 53 correspond to greed among the investors, while those below 47 to fear. The region between the two cutoffs naturally corresponds to a net neutral mentality.

Now, here is how the current Bitcoin market sentiment is like, according to the Fear & Greed Index:

Bitcoin Neutral Sentiment

As is visible above, the indicator has a value of 51, which suggests the trader sentiment is almost exactly in the balance right now. This is a notable change in market mood compared to just a few days ago.

Bitcoin Fear & Greed Index

As displayed in the chart, the Fear & Greed Index was inside the fear zone during the past few days. The despair among the traders was a result of the bearish price action that BTC had recently faced.

At one point, the indicator even fell to a low of 22, reflecting a state of “extreme fear.” This zone, which occurs below 25, corresponds to investors being the most bearish toward the market. There is a similar region for the greed side as well, called the “extreme greed,” situated above 75.

Historically, the extreme sentiments have been quite significant for Bitcoin and other cryptocurrencies, as they are where major tops and bottoms have tended to form. The relationship has been an inverse one, however, meaning extreme fear is where bottoms form, while extreme greed facilitates tops.

Since the extreme fear low earlier in the month, BTC has been on the way up, a potential indication that the contrarian signal of the sentiment may once again be in action.

The cryptocurrency has extended its recovery in a sharp manner during the last couple of days, which may be a potential reason why the Fear & Greed Index has surged back to the neutral territory now.

Though, for now, Bitcoin traders are still undecided on whether bullish action will follow next. It now remains to be seen whether they will embrace greed, or continue to be hesitant about the recovery.

BTC Price

At the time of writing, Bitcoin is floating around $114,900, up 3.6% over the last seven days.

Bitcoin Price Chart

Dogecoin (DOGE) Cools Off — Buyers Struggle To Sustain Recovery Above Key Levels

28 October 2025 at 09:48

Dogecoin struggled to rise above $0.210 and corrected some gains against the US Dollar. DOGE is now consolidating and might decline below $0.1980.

  • DOGE price started a fresh downside correction below $0.2035.
  • The price is trading below the $0.20 level and the 100-hourly simple moving average.
  • There was a break below a contracting triangle with support at $0.20 on the hourly chart of the DOGE/USD pair (data source from Kraken).
  • The price could aim for a fresh increase if it remains stable above $0.1940.

Dogecoin Price Starts Another Pullback

Dogecoin price started a fresh increase after it settled above $0.1920, like Bitcoin and Ethereum. DOGE climbed above the $0.20 resistance to enter a positive zone.

The bulls were able to push the price above $0.2020 and $0.2050. A high was formed at $0.2094 and the price is now correcting gains. There was a move below the 23.6% Fib retracement level of the upward move from the $0.1843 swing low to the $0.2094 high.

Besides, there was a break below a contracting triangle with support at $0.20 on the hourly chart of the DOGE/USD pair. Dogecoin price is now trading below the $0.20 level and the 100-hourly simple moving average.

Dogecoin Price

If there is another increase, immediate resistance on the upside is near the $0.2020 level. The first major resistance for the bulls could be near the $0.2050 level. The next major resistance is near the $0.210 level. A close above the $0.210 resistance might send the price toward $0.2150. Any more gains might send the price toward $0.2250. The next major stop for the bulls might be $0.2320.

More Losses In DOGE?

If DOGE’s price fails to climb above the $0.2020 level, it could start a downside correction. Initial support on the downside is near the $0.1970 level and the 50% Fib retracement level of the upward move from the $0.1843 swing low to the $0.2094 high. The next major support is near the $0.1935 level.

The main support sits at $0.190. If there is a downside break below the $0.190 support, the price could decline further. In the stated case, the price might slide toward the $0.1840 level or even $0.1780 in the near term.

Technical Indicators

Hourly MACD – The MACD for DOGE/USD is now gaining momentum in the bearish zone.

Hourly RSI (Relative Strength Index) – The RSI for DOGE/USD is now below the 50 level.

Major Support Levels – $0.1970 and $0.1935.

Major Resistance Levels – $0.2020 and $0.2050.

XRP Price Prediction: Consolidation Persists — Bulls Need Fresh Push For Breakout

28 October 2025 at 08:28

XRP price started a fresh increase above $2.50. The price is now showing positive signs and might rise further if it clears the $2.6880 resistance.

  • XRP price gained pace for a move above $2.50 and $2.550.
  • The price is now trading above $2.50 and the 100-hourly Simple Moving Average.
  • There is a bullish trend line forming with support at $2.60 on the hourly chart of the XRP/USD pair (data source from Kraken).
  • The pair could start a fresh increase if it clears the $2.6880 resistance.

XRP Price Holds Support

XRP price started a fresh increase after it settled above $2.40, like Bitcoin and Ethereum. The price surpassed the $2.420 and $2.50 resistance levels.

The bulls were able to push the price above $2.550 and $2.65. A high was formed at $2.6972 and the price is now consolidating gains above the 23.6% Fib retracement level of the recent move from the $2.327 swing low to the $2.6972 high.

The price is now trading below $2.60 and the 100-hourly Simple Moving Average. There is a bullish trend line forming with support at $2.60 on the hourly chart of the XRP/USD pair.

XRP Price

If there is a fresh upward move, the price might face resistance near the $2.650 level. The first major resistance is near the $2.6880 level, above which the price could rise and test $2.70. A clear move above the $2.70 resistance might send the price toward the $2.7650 resistance. Any more gains might send the price toward the $2.80 resistance. The next major hurdle for the bulls might be near $2.880.

Downside Correction?

If XRP fails to clear the $2.6880 resistance zone, it could start a fresh decline. Initial support on the downside is near the $2.60 level. The next major support is near the $2.5650 level.

If there is a downside break and a close below the $2.5650 level, the price might continue to decline toward $2.5120 or the 50% Fib retracement level of the recent move from the $2.327 swing low to the $2.6972 high. The next major support sits near the $2.4680 zone, below which the price could continue lower toward $2.420.

Technical Indicators

Hourly MACD – The MACD for XRP/USD is now losing pace in the bullish zone.

Hourly RSI (Relative Strength Index) – The RSI for XRP/USD is now above the 50 level.

Major Support Levels – $2.60 and $2.580.

Major Resistance Levels – $2.650 and $2.6880.

XRP Volatility Incoming? Ripple CEO Prepares Investors For What’s Next

28 October 2025 at 08:00

The XRP market is bracing for a new phase of intense volatility, with anticipation growing around key legal, regulatory, and institutional developments. Ripple CEO Brad Garlinghouse has recently addressed the XRP community, offering guidance and setting expectations for what is to come. 

XRP Unusual Stability May Be Setting Up A Major Move

The cryptocurrency world is buzzing with increased anticipation for XRP, following a series of strategic announcements from Ripple and compelling technical analysis. Popular crypto news source CryptosRus has highlighted on X that the altcoin is poised for a sharp move, as Ripple CEO Brad Garlinghouse has mentioned that investors should be prepared for a substantial shift.

At the core of this move, Ripple has just launched Ripple Prime, a new global prime brokerage service tailored for institutional clients. According to the company, Ripple Prime will be powered by Ripple’s foundational digital asset infrastructure, encompassing its robust solutions for payments, crypto custody, and stablecoin capabilities, alongside XRP.

However, CEO Brad Garlinghouse called this move another step toward building the internet of value, emphasizing that the XRP sits at the center of everything Ripple does. CryptosRus noted that the altcoin has recently bounced off a key support level at $2.33. This technical indicator is signaling a potential 30% rally, with an initial target of $3.45 or even higher, as market momentum continues to build.

An analyst known as TylerHillYT, who is also the president of FluenceGlobal and Co-Founder of the CSS, has also stated that the XRP price comeback is showing structural strength. In just a day, the token burn rate spiked 29%, mirroring its 29% price surge, signaling a synchronized increase in both on-chain demand and heightened investor activity.

XRP

This Ripple’s deeper expansion into traditional finance and the recent launch of Ripple Prime have caused the network usage to ramp up again. TylerHillYT emphasized that at the accelerated pace, XRP is not just riding a wave of market momentum, but it’s rebuilding its long-term narrative. However, the burn acceleration with renewed institutional traction could be the early signs of a sustained upward trajectory, pushing the token structurally toward the $3.00 mark.

Connecting Market Surge To Foundational Growth

While the digital asset market is vibrating with renewed excitement surrounding XRP, a prominent crypto influencer and creator on Binance and CMC, Jack, has revealed that the bulls have firmly smashed through the critical $2.55 resistance level with conviction. This decisive breakout has now set the immediate sights of traders on $2.80 and beyond.

Jack mentioned that whale activity is back, and the Open Interest (OI) is climbing steadily, while sentiment is flipping fast. If this powerful momentum holds, the next significant pit stop for XRP could be the $3.00 mark and beyond.

XRP

Ethereum Supported On Dips — Buyers Build Strength For Next Leg Higher

28 October 2025 at 07:08

Ethereum price started a decent increase above $4,000. ETH is consolidating gains and could aim for more gains above the $4,220 resistance.

  • Ethereum started a fresh upward move above $4,000 and $4,120.
  • The price is trading above $4,080 and the 100-hourly Simple Moving Average.
  • There is a bullish trend line forming with support at $4,055 on the hourly chart of ETH/USD (data feed via Kraken).
  • The pair could continue to move up if it trades above $4,200.

Ethereum Price Holds Gains

Ethereum price started a steady upward move above the $3,880 zone, like Bitcoin. ETH price surpassed the $4,000 and $4,120 levels to enter a short-term positive zone.

The price even spiked above $4,200. A high was formed at $4,252 and the price is now consolidating gains. There was a minor decline below the 23.6% Fib retracement level of the recent wave from the $3,708 swing low to the $4,252 high.

Ethereum price is now trading above $4,080 and the 100-hourly Simple Moving Average. Besides, there is a bullish trend line forming with support at $4,055 on the hourly chart of ETH/USD.

Ethereum Price

On the upside, the price could face resistance near the $4,180 level. The next key resistance is near the $4,200 level. The first major resistance is near the $4,250 level. A clear move above the $4,250 resistance might send the price toward the $4,320 resistance. An upside break above the $4,320 region might call for more gains in the coming sessions. In the stated case, Ether could rise toward the $4,480 resistance zone or even $4,500 in the near term.

Another Pullback In ETH?

If Ethereum fails to clear the $4,200 resistance, it could start a fresh decline. Initial support on the downside is near the $4,080 level. The first major support sits near the $4,050 zone and the trend line.

A clear move below the $4,050 support might push the price toward the $3,980 support or the 50% Fib retracement level of the recent wave from the $3,708 swing low to the $4,252 high. Any more losses might send the price toward the $3,840 region in the near term. The next key support sits at $3,780.

Technical Indicators

Hourly MACDThe MACD for ETH/USD is losing momentum in the bullish zone.

Hourly RSIThe RSI for ETH/USD is now below the 50 zone.

Major Support Level – $4,050

Major Resistance Level – $4,200

Bitcoin Trades Sideways — Consolidation Above Support Could Fuel Next Upside

28 October 2025 at 06:17

Bitcoin price is consolidating gains above $113,500. BTC could rise further if there is a clear move above the $115,750 resistance.

  • Bitcoin started a fresh upward move above the $114,000 resistance level.
  • The price is trading above $114,200 and the 100 hourly Simple moving average.
  • There is a bullish trend line forming with support at $113,900 on the hourly chart of the BTC/USD pair (data feed from Kraken).
  • The pair might continue to move up if it trades above the $115,750 zone.

Bitcoin Price Starts Consolidation

Bitcoin price formed a base and started a fresh increase above the $112,500 zone. BTC gained pace for a move above the main hurdle at $113,500.

It opened the doors for a move above $115,000 and the 100 hourly Simple moving average. Finally, the price spiked above $116,000 and is currently consolidating gains above the 23.6% Fib retracement level of the recent wave from the $106,718 swing low to the $116,309 high.

Besides, there is a bullish trend line forming with support at $113,900 on the hourly chart of the BTC/USD pair. Bitcoin is now trading above $114,000 and the 100 hourly Simple moving average.

Bitcoin Price

Immediate resistance on the upside is near the $115,000 level. The first key resistance is near the $115,500 level. The next resistance could be $115,750. A close above the $115,750 resistance might send the price further higher. In the stated case, the price could rise and test the $116,300 resistance. Any more gains might send the price toward the $117,500 level. The next barrier for the bulls could be $118,000.

Another Pullback In BTC?

If Bitcoin fails to rise above the $115,500 resistance zone, it could start a fresh decline. Immediate support is near the $114,000 level. The first major support is near the $113,500 level or the trend line.

The next support is now near the $111,000 zone. Any more losses might send the price toward the $110,500 support in the near term. The main support sits at $108,500, below which BTC might struggle to recover in the short term.

Technical indicators:

Hourly MACD – The MACD is now gaining pace in the bullish zone.

Hourly RSI (Relative Strength Index) – The RSI for BTC/USD is now above the 50 level.

Major Support Levels – $114,000, followed by $113,500.

Major Resistance Levels – $115,500 and $116,500.

Nearly $360M In Crypto Shorts Squeezed As Bitcoin Recovers To $116,000

28 October 2025 at 06:00

Data shows cryptocurrency short investors have suffered large liquidations during the past day as Bitcoin and altcoins have made a recovery.

Bitcoin, Ethereum Have Surged In The Last 24 Hours

Bitcoin and other cryptocurrencies have witnessed a rally during the past day, breaking away from the slump the market had earlier fallen into. At the height of this surge, Bitcoin broke past $116,000, while Ethereum touched $4,250.

The assets have since seen a small retracement. The chart below shows how BTC’s latest trajectory has looked.

Bitcoin Price Chart

At its current price of $115,400, Bitcoin is up about 4% on the weekly timeframe. Similarly, Ethereum at $4,160 is in a profit of 3.4%. Most other digital assets have seen similarly positive returns, although there are some outliers like Tron, which is down more than 7%. The market-wide recovery during the past day has meant that a large amount of short liquidations have piled up on the derivatives exchanges.

Crypto Market Liquidations Have Totaled At $467 Million

According to data from CoinGlass, about $467 million in cryptocurrency-related derivatives contracts have been liquidated over the last 24 hours. A contract is said to be “liquidated” when its platform forcibly shuts it down after it accumulates losses of a certain degree (as defined by the exchange).

Given that coins across the board have rebounded, the contracts crossing this threshold would mostly be the short ones. And indeed, the data would confirm so.

Bitcoin & Crypto Liquidations

As is visible above, liquidations related to bearish cryptocurrency bets have reached $358 million in this window, representing 76.6% of the total flush in the sector. Bitcoin led the liquidations with $177 million in contracts involved, while Ethereum contributed the second most with $130 million in contracts. Out of the rest, Solana witnessed the largest flush at $34 million.

Bitcoin & Other Cryptos

In some other news, Bitcoin spot exchange-traded funds (ETFs) have observed a notable amount of inflows over the past month, as CryptoQuant community analyst Maartunn has pointed out in an X post.

Spot ETFs refer to investment vehicles that allow investors to gain exposure to an asset without having to directly own it. The US SEC approved BTC spot ETFs in January of 2024. Here is the chart shared by the analyst that shows how the 30-day netflow for these vehicles has fluctuated since:

Bitcoin Vs Ethereum Spot ETFs

As displayed in the above graph, Bitcoin spot ETFs have seen inflows of $4.7 billion during the past month. Ethereum spot ETFs, which gained approval in mid-2024, have also enjoyed inflows in this period, although their value of $983 million is significantly less than BTC’s.

Bitcoin Supply In Profit Rises To 83.6% – Market Momentum Building Again

28 October 2025 at 03:00

Bitcoin (BTC) is showing renewed strength, reclaiming the $115,000 level after weeks of volatility and uncertainty. Bulls are attempting to build momentum for a potential impulse move higher, aiming to confirm a sustained bullish structure after the recent consolidation phase.

On-chain data continues to reveal a clear and repeating pattern tied to investor behavior and market cycles. Historically, when the percentage of Bitcoin supply in profit climbs above 95%, the market tends to enter an overheated phase, often leading to sharp corrections. These pullbacks serve as natural cooling periods, resetting sentiment and liquidity before the next major leg up.

Interestingly, each correction cycle has shown consistent bottoming zones around the 75% threshold, where long-term holders reaccumulate and market confidence begins to rebuild. More specifically, data highlights profit supply lows of 73% in September 2024, 76% in April 2024, and a recent rebound from 81%, signaling a potential mid-cycle recovery phase.

Bitcoin Supply in Profit Rises to 83.6% — Momentum Rebuilds Ahead of Key Threshold

According to top analyst Darkfost, the percentage of Bitcoin supply in profit has started to climb again, currently standing at 83.6%. This steady rise indicates that a growing share of Bitcoin holders are once again sitting on unrealized gains — a trend that often reflects improving sentiment and renewed market confidence.

Bitcoin Percent Supply in Profit | Source: CryptoQuant

Darkfost notes that this level can be interpreted as encouraging, suggesting that investors are willing to hold their BTC instead of realizing profits, anticipating further upside in the near term. Historically, such behavior has been characteristic of mid-cycle recovery phases, when fear starts to fade and accumulation resumes across both retail and institutional segments.

This stage of the cycle is considered healthy for rebuilding momentum, as it allows the market to stabilize after large corrections. Holders who previously capitulated often reenter at this stage, while long-term participants strengthen their positions, creating a more resilient market structure.

However, Darkfost cautions that once the supply in profit surpasses 95%, it typically signals overheated market conditions — a point where euphoria tends to replace rational conviction. In such phases, Bitcoin historically faces increased volatility and sharp corrections as overleveraged traders and short-term speculators take profits.

BTC Retests $115K Resistance: Bulls Regain Momentum

Bitcoin (BTC) is showing renewed bullish momentum, trading around $115,443 and successfully reclaiming key short-term support levels after weeks of consolidation. The daily chart highlights a strong recovery structure, with BTC breaking above both the 50-day and 100-day moving averages, signaling a shift in short-term market sentiment.

BTC testing key level | Source: BTCUSDT chart on TradingView

The next critical test lies at $117,500, a historical resistance zone that previously rejected multiple attempts in September and early October. A clear breakout and daily close above this level would likely confirm an impulse continuation toward $120K–$125K, opening the door for a more sustained uptrend.

Momentum indicators suggest strengthening buying pressure, while the recent bounce from the 200-day moving average near $107K underscores the market’s resilience. This level acted as a springboard for the current rally, aligning with the broader pattern of accumulation seen on-chain, where investor profitability is rising steadily.

However, BTC remains within a range-bound structure, and rejection at $117.5K could trigger short-term consolidation back toward $111K–$112K. Overall, Bitcoin’s technical outlook appears constructive — if the bulls can sustain above $115K and confirm strength above $117.5K, the market could transition into a new bullish leg, supported by improving investor sentiment and on-chain health.

Featured image from ChatGPT, chart from TradingView.com

Bitcoin Price Could See A New All-Time High Above $126,000 If It Breaks This Critical Level

28 October 2025 at 02:00

The Bitcoin price is positioning for a potentially explosive move that could take it well beyond its previous all-time highs. Analysts are closely watching a critical resistance level near $116,000, which may serve as the final hurdle before BTC catapults into uncharted territory above $126,000. 

Analyst Predicts New Bitcoin Price All-Time High

Crypto analyst Donny Dicey revealed in an X social media post this week that the $116,000 price level is the decisive zone Bitcoin must breach to confirm a breakout toward a new all-time high. His technical analysis suggests that once BTC achieves a clean break above this resistance area, momentum could swiftly carry it above $126,000. 

Notably, Bitcoin set a new ATH on October 6, 2025, after breaking through its previous record above $124,000 and climbing past $126,000. Since achieving this level, the price of BTC has fallen dramatically to $115,000. Dicey’s accompanying chart shows the market steadily recovering after testing support near $108,000, marked as a “market structure break” region, with bullish price action consolidating above $109,000. 

The analyst has emphasized that each day Bitcoin maintains a close above $109,000 strengthens the probability of a strong upward swing as the market heads into November. This period coincides with the Federal Open Market Committee’s (FOMC) next meeting, where investors are anticipating dovish signals such as rate cuts or the formal end of Quantitative Tightening (QT).

Bitcoin

Dicey also notes that bullish S&P 500 earnings, easing global trade tensions from a potential agreement between US President Donald Trump and China’s President Xi Jinping, and improving ISM manufacturing data point to a macro environment supportive of risk assets. A community member commented that whales may have underestimated how much BTC’s demand tends to persist during these conditions. Dicey responded that the same whales might become “exit liquidity” as Bitcoin accelerates higher, possibly missing out on the strongest phase of this cycle. 

Consolidation Above January Highs Signal Unbreakable Strength

In a follow-up analysis, Dicey highlighted Bitcoin’s remarkable stability above its January highs, describing its price structure as “unbreakable” amid global macroeconomic uncertainty. He pointed to several converging factors that reinforce BTC’s resilience, including ongoing fiscal and monetary expansion, a weakening US dollar, and renewed confidence in the global business cycle. 

The analyst also emphasized that geopolitical tensions tied to US-China relations appear to be subsiding. At the same time, ETF inflows and exponential growth in the Artificial Intelligence (AI) sector contribute to acting as tailwinds for digital assets. He disclosed that despite strong underlying fundamentals, skepticism remains widespread in the market.

According to him, many still believe in the traditional four-year cycle narrative, while retail enthusiasm has not fully returned. Furthermore, the Russell 2000 index has yet to breakout, and rotation from traditional assets, such as the S&P 500 and gold, into Bitcoin remains limited. With these developments subduing broader market participation, Dicey suggests it creates the perfect setup for a powerful rally in BTC once sentiment shifts decisively.

Bitcoin

Before yesterdayMain stream

Crypto Analyst Shows The Possibility Of The Ethereum Price Reaching $16,000

27 October 2025 at 21:30

Ethereum’s bullish momentum has intensified throughout the weekend, with the price climbing above $4,100. This steady recovery follows a strong rebound from the $3,500 region after a crash earlier in the month. 

Investor sentiment, as shown by trading volume and flows on exchanges, has turned optimistic amidst the recovery. Now that Ethereum’s price action is starting to turn bullish again, a new technical analysis shared by crypto analyst Freedomby40 on the social media platform X suggests that the current rally could be far from over, projecting a possible long-term climb to $16,000.

Wave Count Structure Points To A Continuation Phase

Freedomby40’s analysis, which is based on the Elliott Wave structure, presents Ethereum as currently positioned in an extended bullish sequence that began forming in late 2022. Posting the technical analysis on X, the analyst noted that Ethereum’s price action looks great for a continuation. 

His chart shows that the asset has just completed a corrective phase and is entering a renewed impulse wave, with support established between $3,225 and $3,563 at the 0.5 and 0.382 Fibonacci retracement zones, respectively. The analyst labels this zone as the ideal accumulation area for the next leg up, consistent with previous cycle structures seen in 2017 and 2021.

The Elliott Wave projection in his analysis presents a multi-layered confluence of impulse waves extending to the third degree. It illustrates that Ethereum is currently unfolding its fifth major impulse wave in a structure that traces back to mid-2022. 

The internal structure of this wave sequence also reveals a C wave in motion, which itself contains smaller sub-impulse waves. Within that C wave, Ethereum appears to be entering its own fifth sub-wave, which is known to be a decisively bullish wave.

Ethereum

Based on this setup, the analyst outlined two potential target zones on the chart: a green box representing the realistic price range for this wave cycle and a red box depicting the higher, more extended scenario that could push Ethereum’s market cap into the trillion-dollar level.

Fibonacci Extensions Predict Targets Of $9,000, $11,000, And $16,000

Freedomby40’s analysis identifies multiple price levels based on Fibonacci extensions from the current price action. The first price target is at $6,303, which is based on the 1.0 Fibonacci extension. This initial price target will see the Ethereum price break above its current all-time high, but this is the first of many.

The next target, the 1.236 extension, is positioned around $9,013. These two price targets ($6,303 and $9,013) were described by the analyst as very realistic. Possible extensions are at the 1.382 and 1.618 Fibonacci extension levels, corresponding to $11,210 and $16,077, respectively.

At the time of writing, Ethereum is trading at $4,160, up by 5.2% in the past 24 hours. Freedomby40’s outlook joins a growing list of ultra-bullish Ethereum price forecasts from institutional research desks and top analysts. Standard Chartered Bank recently raised its 2025 price target for Ethereum to $7,500, while projecting a potential long-term path to $25,000 by 2028.

Ethereum

Pundit Says XRP Price Risks Crash Below $1, Here’s Why

27 October 2025 at 20:00

Crypto analyst Bobby A is warning that the XRP price may face trouble soon. He says the large monthly chart is showing weak signs, and this could mean the market is turning bearish again. The analyst thinks the price might need to drop further before it can move higher. 

Bearish Signals Showing On The XRP Price Monthly Chart

Bobby A says the big XRP chart does not look healthy right now. He explains that many important monthly indicators are crossing bearishly. He says XRP is trading below the 1.618 level, and the price action there looks like a rejection rather than a breakout. He thinks this rejection is happening at a terrible time for XRP, noting that the monthly candle is closing near the BMSB line, another dangerous sign for the price.

XRP Price

Bobby A reminds traders that when the Bressert indicator crosses bearish on the monthly chart, history shows it has never been good for XRP. He believes that history could repeat itself, and these bearish signals are evident on the chart right now, suggesting the mid-term trend may not be strong. His analysis says that in six days, XRP will be facing the monthly candle close again, and facing it while price action is weak is usually not a good sign. He is worried because the chart’s overall structure shows more weakness than strength at this time.

He explains that when a chart shows this kind of technical damage, the smart move is to stay alert. He says traders must focus on risk control during times when the big charts start to flash warning signs. He shares this because he has trusted his chart study before when XRP was under $0.30, and now he needs to trust what he sees again with XRP above $2. He says the market can change very fast, and traders must be ready for those changes.

XRP May Drop To Lower Support Before Moving Up Again

Right now, XRP is already making a small move downward. Bobby A says this retracement is happening in real time. He warns that XRP could roll over again and retest lower price support levels. If this happens, the token price could fall under $1 to find more substantial support before it tries to recover. He believes there is a real and present risk that the price will crash below $1 if sellers keep pushing it down.

He advises traders to protect their money and manage their trades carefully. He says capital safety must come first in times like these. Even though he still believes in XRP’s long-term future and remains a strong supporter of the project, he feels the odds right now point to lower prices in the mid-term. He says this is because the latest market signs are not strong enough to support a big bullish move yet.

XRP price chart from Tradingview.com

Here’s What The XRP Open Interest Reset Means For The Price

27 October 2025 at 17:00

Crypto analyst CryptosRus has drawn attention to the open interest reset for XRP. The analyst also explained why this development could spark a major price surge for the altcoin. 

XRP’s Open Interest Drops To New Lows

In an X post, CryptosRus revealed that XRP’s open interest on Binance has dropped back to the same lows that were seen in May 2025. The analyst noted that back then, the liquidation flush sparked a massive rally for the altcoin, which pushed it to $3.50. He added that this time around, the open interest is at the floor again, but the price is holding around $2.6. 

CryptosRus stated that this means that leverage is gone while the strong hands are still holding XRP. The analyst predicted that if new liquidity enters, this setup could signal the next leg up for the altcoin. He added that rallies usually start when leverage is low, spot demand is strong, and shorts are trapped. 

XRP

Notably, XRP has witnessed new demand with the launch of the largest XRP treasury company, Evernorth. The company has already accumulated up to $1 billion in XRP with Ripple’s backing and has revealed plans to continue accumulating more, using gains from its DeFi activities. Notably, the company stated that it will purchase XRP on the open market, which is expected to impact the altcoin’s price. 

Meanwhile, the SEC is expected to approve the spot XRP ETFs once the U.S. government shutdown ends. This could drive new liquidity into the altcoin, boosting its price. Moreover, experts such as Canary Capital’s CEO Steven McClurg have predicted that the XRP ETFs could see more inflows in their first month than the Ethereum ETFs did. 

XRP Is Gearing Up For A ‘Face Melting’ Rally

Crypto analyst Ether stated that XRP is quietly gearing up to melt faces and that most aren’t even aware or ready for what is coming. This came as the analyst alluded to an earlier analysis, in which he revealed that a similar scenario from a previous cycle was playing out for the altcoin. 

Ethere stated that XRP’s cyclical structure is showing a striking similarity again. After the altcoin’s rally in 2017, its price was rejected from the 2013 all-time high (ATH) level and then retested the 2014 ATH level, which had previously acted as resistance. XRP then began its parabolic run after it accumulated strength in that range. 

Now, this same XRP price action is playing out again, according to Ether. He noted that after the strong surge in 2024, the altcoin’s price was rejected at the 2017 ATH level and retested the 2021 ATH level, which had previously acted as resistance. The analyst added that the power accumulation phase is now underway in this region and that once it is complete, the next parabolic run will be inevitable. 

At the time of writing, the XRP price is trading at around $2.63, up in the last 24 hours, according to data from CoinMarketCap.

XRP

100% Of Bitcoin Bull Market Peak Indicators Remain Untouched, Is There Still Room To Run?

27 October 2025 at 11:00

Over the years, a number of indicators have emerged that have often helped to pinpoint the Bitcoin bull market peak. These indicators have been triggered in previous cycles, and their triggers have often been a signal that it was time to get out of the market, as a new bear market is underway. However, this time around, even with the Bitcoin price hitting multiple new all-time highs, none of these cycle peak indicators have been triggered, suggesting that the market top has yet to be reached.

0 Out Of 30 Bull Market Peak Indicators Triggered

The Bull Market Peak Indicator tracker on the Coinglass website follows a total of 30 indicators that follow 30 indicators that show the progress of the Bitcoin bull market toward reaching a top. Some major ones include the Bitcoin Bubble Index, the Puell Multiple, the Bitcoin Rainbow Chart, and the Altcoin Season Index, among others.

Usually, these indicators are tracked on a scale of 0-100%, with 0% meaning that it is far from being triggered and 100% showing that an indicator has been triggered. If only a few of these get to the 100% mark and are triggered, it usually doesn’t mean that the Bitcoin peak has been reached.

However, even now, not one of these indicators has been triggered. Most continue to remain quite low, while the likes of the Bitcoin dominance are high, but still have not been triggered. For there to be a definite progress toward the Bitcoin market peak, at least half of these would have to be triggered.

Bitcoin bull market peak indicator 1

What This Means For Investors

Since none of the bull market peak indicators have been triggered, it means that the Bitcoin price might actually be far away from its all-time high. With the score still being 0 out of 30, it points to this being a time to hold, despite the declines that the market has suffered recently.

According to a previous report from Bitcoinist, this was the case a few months ago, and now two months later, the tracker remains the same. Thus, it could be that $126,000 is not the all-time high for Bitcoin, and that the market could end up getting an altcoin season after all.

In the case that more than half of the bull market peak indicators do get triggered, then it means that the top of the market is getting close. Once it gets to 30/30, then it signals the start of the next bear market, and this is when selling is at its highest in the market, leading to rapid price declines across the board.

Bitcoin price chart from Tradingview.com

Solana (SOL) Strengthens — Gradual Gains Indicate Renewed Demand From Buyers

27 October 2025 at 09:48

Solana started a fresh increase above the $200 zone. SOL price is now consolidating above $200 and might aim for more gains above the $208 zone.

  • SOL price started a fresh upward move above the $188 and $195 levels against the US Dollar.
  • The price is now trading above $200 and the 100-hourly simple moving average.
  • There is a bullish trend line forming with support at $198 on the hourly chart of the SOL/USD pair (data source from Kraken).
  • The pair could extend gains if it clears the $208 resistance zone.

Solana Price Jumps Again Above $200

Solana price started a decent increase after it settled above the $180 zone, like Bitcoin and Ethereum. SOL climbed above the $188 level to enter a short-term positive zone.

The price even smashed the $198 resistance. The bulls were able to push the price above $200. The price is now consolidating gains above the 23.6% Fib retracement level of the recent upward move from the $177 swing low to the $204 high.

Solana is now trading above $200 and the 100-hourly simple moving average. Besides, there is a bullish trend line forming with support at $198 on the hourly chart of the SOL/USD pair.

Solana Price

On the upside, the price is facing resistance near the $205. The next major resistance is near the $208 level. The main resistance could be $212. A successful close above the $212 resistance zone could set the pace for another steady increase. The next key resistance is $225. Any more gains might send the price toward the $232 level.

Another Pullback In SOL?

If SOL fails to rise above the $205 resistance, it could start another decline. Initial support on the downside is near the $198 zone and the trend line. The first major support is near the $192 level and the 50% Fib retracement level of the recent upward move from the $177 swing low to the $204 high.

A break below the $192 level might send the price toward the $184 support zone. If there is a close below the $184 support, the price could decline toward the $180 support in the near term.

Technical Indicators

Hourly MACD – The MACD for SOL/USD is gaining pace in the bullish zone.

Hourly Hours RSI (Relative Strength Index) – The RSI for SOL/USD is above the 50 level.

Major Support Levels – $198 and $184.

Major Resistance Levels – $205 and $208.

XRP Price Gains Traction — Buyers Pile In Ahead Of Key Technical Breakout

27 October 2025 at 09:08

XRP price started a fresh increase above $2.45. The price is now showing positive signs and might rise further if it clears the $2.680 resistance.

  • XRP price is attempting a fresh increase above the $2.50 zone.
  • The price is now trading above $2.50 and the 100-hourly Simple Moving Average.
  • There is a bullish trend line forming with support at $2.580 on the hourly chart of the XRP/USD pair (data source from Kraken).
  • The pair could start a fresh increase if it clears the $2.680 resistance.

XRP Price Eyes Steady Increase

XRP price formed a base above $2.320 and started a fresh increase, like Bitcoin and Ethereum. The price surpassed the $2.380 and $2.450 resistance levels.

The bulls were able to push the price above $2.50 and $2.55. A high was formed at $2.668 and the price is now consolidating gains above the 23.6% Fib retracement level of the recent wave from the $2.327 swing low to the $2.668 high.

The price is now trading below $2.50 and the 100-hourly Simple Moving Average. There is a bullish trend line forming with support at $2.580 on the hourly chart of the XRP/USD pair.

XRP Price

If there is a fresh upward move, the price might face resistance near the $2.660 level. The first major resistance is near the $2.680 level, above which the price could rise and test $2.750. A clear move above the $2.750 resistance might send the price toward the $2.80 resistance. Any more gains might send the price toward the $2.920 resistance. The next major hurdle for the bulls might be near $2.950.

Are Dips Supported?

If XRP fails to clear the $2.680 resistance zone, it could start a fresh decline. Initial support on the downside is near the $2.60 level. The next major support is near the $2.580 level.

If there is a downside break and a close below the $2.580 level, the price might continue to decline toward $2.50 or the 50% Fib retracement level of the recent wave from the $2.327 swing low to the $2.668 high. The next major support sits near the $2.450 zone, below which the price could continue lower toward $2.40.

Technical Indicators

Hourly MACD – The MACD for XRP/USD is now gaining pace in the bullish zone.

Hourly RSI (Relative Strength Index) – The RSI for XRP/USD is now above the 50 level.

Major Support Levels – $2.60 and $2.580.

Major Resistance Levels – $2.660 and $2.680.

Ethereum Moves Higher — Buyers Strengthen Grip Amid Renewed Market Optimism

27 October 2025 at 08:08

Ethereum price started a recovery wave above $4,000. ETH is moving higher but faces a couple of key hurdles near $4,220 and $4,250.

  • Ethereum started a fresh recovery above $4,000 and $4,120.
  • The price is trading above $4,120 and the 100-hourly Simple Moving Average.
  • There is a bullish trend line forming with support at $4,050 on the hourly chart of ETH/USD (data feed via Kraken).
  • The pair could continue to move up if it trades above $4,220.

Ethereum Price Eyes Steady Gains

Ethereum price started a minor recovery wave above the $3,880 zone, like Bitcoin. ETH price surpassed the $4,000 and $4,050 levels to enter a short-term positive zone.

The price even spiked above $4,220. A high was formed at $4,225 and the price is now consolidating gains. The price is stable above the 23.6% Fib retracement level of the recent increase from the $3,708 swing low to the $4,225 high.

Ethereum price is now trading above $4,150 and the 100-hourly Simple Moving Average. Besides, there is a bullish trend line forming with support at $4,050 on the hourly chart of ETH/USD.

Ethereum Price

On the upside, the price could face resistance near the $4,220 level. The next key resistance is near the $4,250 level. The first major resistance is near the $4,320 level. A clear move above the $4,320 resistance might send the price toward the $4,450 resistance. An upside break above the $4,450 region might call for more gains in the coming sessions. In the stated case, Ether could rise toward the $4,500 resistance zone or even $4,550 in the near term.

Another Decline In ETH?

If Ethereum fails to clear the $4,220 resistance, it could start a fresh decline. Initial support on the downside is near the $4,150 level. The first major support sits near the $4,120 zone.

A clear move below the $4,120 support might push the price toward the $4,050 support. Any more losses might send the price toward the $4,000 region in the near term. The next key support sits at $3,880.

Technical Indicators

Hourly MACDThe MACD for ETH/USD is gaining momentum in the bullish zone.

Hourly RSIThe RSI for ETH/USD is now above the 50 zone.

Major Support Level – $4,120

Major Resistance Level – $4,220

Bitcoin Accelerates Higher As Bulls Target Break Above $115,500 Resistance

27 October 2025 at 06:49

Bitcoin price is attempting to recover above $113,500. BTC could rise further if there is a clear move above the $115,500 resistance.

  • Bitcoin started a fresh recovery wave above the $113,500 resistance level.
  • The price is trading above $114,000 and the 100 hourly Simple moving average.
  • There is a bullish trend line forming with support at $113,350 on the hourly chart of the BTC/USD pair (data feed from Kraken).
  • The pair might continue to move up if it trades above the $115,500 zone.

Bitcoin Price Starts Fresh Increase

Bitcoin price declined again below the $108,000 level. BTC tested the $106,720 zone and recently started a fresh increase. There was a move above the $112,000 resistance level.

The bulls were able to pump the price above $113,500 and the 100 hourly Simple moving average. Finally, the price spiked above $115,000 and is currently consolidating gains above the 23.6% Fib retracement level of the recent wave from the $106,718 swing low to the $115,400 high.

Besides, there is a bullish trend line forming with support at $113,350 on the hourly chart of the BTC/USD pair. Bitcoin is now trading above $114,000 and the 100 hourly Simple moving average.

Bitcoin Price

Immediate resistance on the upside is near the $115,250 level. The first key resistance is near the $115,500 level. The next resistance could be $116,200. A close above the $116,200 resistance might send the price further higher. In the stated case, the price could rise and test the $117,000 resistance. Any more gains might send the price toward the $118,000 level. The next barrier for the bulls could be $118,800.

Another Pullback In BTC?

If Bitcoin fails to rise above the $115,500 resistance zone, it could start a fresh decline. Immediate support is near the $114,000 level. The first major support is near the $113,500 level or the trend line.

The next support is now near the $111,000 zone. Any more losses might send the price toward the $110,500 support in the near term. The main support sits at $108,500, below which BTC might struggle to recover in the short term.

Technical indicators:

Hourly MACD – The MACD is now gaining pace in the bullish zone.

Hourly RSI (Relative Strength Index) – The RSI for BTC/USD is now above the 50 level.

Major Support Levels – $114,000, followed by $113,500.

Major Resistance Levels – $115,500 and $116,500.

Chainlink Eyes 300% Upside As Road To $46 Forms – Analyst

26 October 2025 at 19:30

The Chainlink (LINK) market has experienced a significant uplift in the last week as prices grew by 7.64%. In line with the general crypto market, the altcoin produced a modest rebound from the deep correction levels seen in mid-October. Amid this price action, renowned market analyst Ali Martinez has shared a developing bullish pattern that suggests more profits ahead.

Buy The Dip At $15 – Here’s Why

In a recent X post on October 25, Martinez postulated that LINK could be gearing up for a major rally, with technical indicators hinting at an incoming bullish opportunity.  In analyzing the LINKUSDT daily chart, investors may have a chance to notch a 300% gain in the coming months.

Based on the chart analysis presented by Martinez, LINK is trading within a broad ascending parallel channel that has defined its market behavior since mid-2023. Notably, the altcoin last bounced off the lower boundary of this channel in June 2025 to trade as high as $28.00, before descending to current market prices around $18.00.


LINK

Martinez anticipates that LINK will complete its ongoing decline by revisiting the channel’s lower boundary, with the $15.00 zone, which aligns with the 0.618 Fibonacci retracement level, serving as the key area of interest. The analyst identifies $15.00  as a strong accumulation zone, advising investors to consider buying at that level. From there, LINK is expected to stage a recovery toward the upper boundary of the channel. 

However, Martinez cautions that the token could face interim resistance around $20.04, corresponding to the 0.786 Fibonacci level, which may trigger a brief pullback to $18.00  before a potential breakout rally. If this setup unfolds as projected, LINK could surge toward the $46.31  mark, matching the 1.272 Fibonacci extension, representing an upside of roughly 300% gain from the expected accumulation point.

LINK Market Overview 

At the time of writing, LINK trades at $18.21, reflecting a slight 2.41% gain in the past day. Meanwhile, the token’s daily trading volume has declined by 43.38% and is valuedat around $366 million. 

Looking at its monthly chart, LINK remains down by 11.05% despite the modest recovery seen in the last week, signaling that the token still needs further upside to fully reverse its recent losses and bring most new investors back into profit. With a market cap of $12.35 billion, LINK continues to hold its position as the twelfth largest cryptocurrency in the market. 

LINK

❌
❌