A nearly 2-million-won price tag on the Samsung Galaxy S26 Ultra has South Korea’s telecom giants scrambling. What follows may be the most calculated subsidy war this market has seen in a decade. Carriers in Korea are trying hard to attract Galaxy S26 buyers by offering real gold bars, Galaxy watches and so on as preorder bonus.
Samsung’s Galaxy S26 Ultra is expected to come with a price tag of 1,997,000 won. The company’s justification is legitimate enough, but a price point brushing up against the two-million-won ceiling is a provocation.
South Korea’s big three carriers, SKT, KT, and LG Uplus, know this.
It’s being reported that all three operators are preparing conversion subsidy packages that could stack up to 500,000 won on top of whatever publicly announced figures they are legally required to disclose.
Industry insiders are claiming that this S26 launch window is effectively the first major commercial event in which carriers have meaningful autonomous room to pile on support without bumping against the old subsidy ceilings.
SK Telecom
SK Telecom has launched a special promotion. Shoppers who will receive the notification will be awarded 3.75 grams of a physical gold bar as a prize. SKT is also offering a storage tier upgrade, delivering a 1TB model at the 512GB price point.
Korea Telecom
KT announced Galaxy Watch 8 units for subscribers committing to select premium plans, plus 50,000-won first-come, first-served discount coupons covering both the device itself and accessories.
LG Uplus
LG Uplus announced to bear the cost burden of switching from a network carrier to LG Uplus mid-term. Add up to 200,000 won in trade-in compensation on top of that, and Uplus is essentially paying customers to cross the street.
Strip away the gold bars and the free watches, and the underlying logic is straightforward: the Galaxy S26 is a device built to consume premium data.
All three carriers have their own AI assistant ecosystems in various states of development, and each would dearly love to establish a loyal user base before that market hardens.
The sales of Samsung devices are once again climbing in Japan, with the company ending a 5-year drought by returning to the Top 3 chart.
Samsung is focusing on improving sales in Japan and the result is visible; it has impressively managed to end the 5-year drought. The Korean tech giant is once again growing its presence in the country where it was struggling.
A new report reveals that Samsung has returned to the “Top 3” in both overall mobile phone and smartphone shipments for the first time in five years since 2020.
MM Research Institute (MMRI), via Newsis, reported that Samsung ranked third in both overall mobile phone shipments (including feature phones) and smartphone shipments in the Japanese market last year.
While specific shipment volume is unknown, it’s still great news. Apple led the market, and Google was the runner-up in Japan. This is the first time since 2020 that Samsung ranked in the top three across both metrics.
At that time, it also placed third in each category, but the following year, it rose to second only in the smartphone segment while falling in the overall shipment rankings due to competition.
Samsung’s market share continued to decline thereafter. The company dropped to fifth place in overall shipments in 2022, and remained fourth in both categories in both 2023 and 2024.
Industry observers believe that growing consumer interest in Japan in smartphones featuring artificial intelligence (AI) capabilities has contributed to Samsung’s recent sales recovery.
Samsung has locked in February 25 in San Francisco for the next Unpacked. The Galaxy S26 series will be unveiled at the event, and three core areas are worth paying attention to.
Preorders begin immediately after Unpacked, with retail sales starting on March 11. That timeline feels familiar; what does not feel routine is what Samsung is preparing to charge this year.
Here are the three main things that matter with the Galaxy S26.
1. Camera
The S26 Ultra is tipped to feature an f/1.4 aperture on its 200MP sensor. That is wider than what we saw on the S24 Ultra and S25 Ultra. A wider aperture lets in more light, more light means lower ISO, less noise, and fewer over-smoothed night shots.
The S25 series delivered reliable zoom and strong HDR. The S26 Ultra now needs to add subtlety, better skin tones, less aggressive sharpening, and more natural shadows. Hardware is only half the story; the image pipeline needs to evolve, too.
Samsung is finally moving to the 2nm GAA process with the Exynos 2600. Every model now gets 12GB of RAM and 256GB of memory as the baseline. This is not just a spec bump; it is a necessity for the new EdgeFusion on-device image generation.
The key phrase here is on-device; not cloud nor server, which means faster results and fewer privacy concerns. There is also a partnership with Perplexity for search. Samsung clearly does not want to be fully dependent on Google’s AI stack.
3. Price
Now the uncomfortable part. Samsung is reportedly increasing prices by around 99,000 won across the lineup. The base Galaxy S26 is expected to start at 1,254,000 won, whereas the Ultra could land at 1,797,000 won.
While Korean prices are widely expected to spike, the company may keep the pricing unchanged in the US. We have seen steady price creep since the S23 days, the S24 brought AI justification, and the S25 refined the hardware.
Verdict
The Galaxy S26 is shaping up to be about three things: serious on-device AI, a brighter and more ambitious camera system, and a clear price hike.
Samsung just did something very interesting with the Galaxy S26 Ultra performance. The upcoming flagship phone has broken all internal records in the latest benchmark.
Galaxy S26 Ultra is equipped with Snapdragon 8 Elite Gen 5 tuned for Samsung flagships. The smartphone has appeared with impressive single-core and multi-core scores on Geekbench, outclassing previous records.
While the score-wise increment feels small, the picture is even bigger. A phone that already outpaced the majority of its rivals is now breaking its own records. It’s something interesting that directly benefits its potential buyers.
From the benchmark, the Galaxy S26 Ultra was a unit crafted for the United States. It had 12GB of RAM and Android 16 preinstalled. The CPU features a dual-cluster design, with the two prime cores clocked at 4.74 GHz.
All in all, the Galaxy S26 Ultra now has a stabilized Geekbench score of around 3,500 in single-core and 11,500 in multi-core. Only improvements are now expected as the software is about to reach the hands of people for real feedback.
Samsung is unveiling the Galaxy S26 series on February 25. A live event will take place in San Francisco, California. Reservations are still open, letting you score $30 credit, up to $900 savings and entry in $5,000 giveaway.
Samsung Galaxy users in the US are about to get something international fans have enjoyed for years: proper, granular dual SIM management baked right into One UI.
The debate started on Reddit, where user slylteshared screenshots running the One UI 8.5 Beta on their Galaxy S25 Ultra.
As a US Mobile subscriber, the Samsung smartphone user showed off the new dual SIM preference options in all their glory, letting you toggle which SIM handles calls, which one takes messages, and which one carries your data.
International Galaxy users have had these settings for ages. The US market got left behind, and US carriers were almost certainly the blockage.
Carrier influence over software features is nothing new, and Samsung has historically played ball. With multi-SIM use slowly gaining traction stateside, that arrangement needed to change.
Source – slylte/Reddit | Via – AndroidAuthority
Once stable rollouts begin post-Unpacked, existing Galaxy owners outside the Beta Program should start seeing the update hit their devices. If you have been fighting with the lack of proper SIM controls, the wait is almost over.
Recently, Samsung pushed the fifth One UI 8.5 Beta update. While users are anticipating the official rollout next, the company has started internal testing of the sixth Beta. It should be available to S26 series phones early next month.
One UI 8.5 is shaping up to be the most significant upgrade yet. Based on the foundation of One UI 8, the upcoming mid-cycle iteration is not just a feature and design refresh, but also addressing long overdue complaints.
A new leak reveals all six interactive wallpapers of the Galaxy S26 series. It goes beyond the static wallpaper images, which surfaced from One UI 8.5 months ago.
Do not expect the kind of aggressive parallax effect you see on iPhones. Samsung’s approach here is more restrained, and honestly, that is probably the right call for a Galaxy audience that values clean UI design.
The effect responds to touch input and to the unlock gesture on the lock screen. Think of it less as a 3D pop and more as a living texture that acknowledges your interaction without screaming for attention.
The key mechanic that makes this practical is what happens when you actually unlock the phone. The wallpaper transitions into a static version the moment you land on the home screen.
Images of Samsung Galaxy S26’s Interactive Wallpapers
Video captures from the Telegram channel ProjectCipher show the lock screen editor on an early Galaxy S26 build, and there is a dedicated “Interactive” label sitting right in the wallpaper selection UI.
The label is there, it is prominent, and it signals that interactive wallpapers are being treated as a first-class feature in One UI 8.5, not an Easter egg.
Credit – ProjectCipher/Telegram
No animation overhead sitting in your app drawer. No battery drain from a continuously rendering layer behind your icons. The interactivity lives on the lock screen, which is exactly where it belongs.
Samsung clearly ran the numbers on resource consumption and made a call. Keep the visual flair where users see it most, which is the lock screen, and keep the home screen clean and fast.
All six wallpapers also give us a strong read on the Galaxy S26 lineup’s official color options. The early static files already had enthusiasts mapping out potential colorways, and the interactive versions reinforce those guesses.
Stay tuned to SammyFans for continued Galaxy S26 coverage as One UI 8.5 development progresses.
KITE crypto has quietly transitioned from low-volatility consolidation into full-blown on-chain expansion and the data doesn’t look accidental.
After weeks of relatively muted activity through December and early January, the network flipped a switch in late January. Whale transactions surged. Exchange flows accelerated. Volume exploded. And KITE price followed.
This wasn’t retail-led noise. It was coordinated capital movement.
Whale Transactions Spike First Then KITE Price Jumped
On-chain data tracking transactions above $100K and $1M shows a clear shift in behavior. Throughout December, large transfers were sporadic and inconsistent. But as January progressed, high-value transactions began clustering.
By late January and into February, whale activity accelerated sharply.
Notably, the spike in large transactions preceded the most aggressive phase of price expansion. That sequencing matters. It suggests whales positioned early, before volatility and broader participation increased.
Exchange Flows Turn High Velocity
Similarly, Active deposits and withdrawals rose sharply into February. Instead of one-sided deposit dominance, which would typically signal heavy distribution but the data shows both deposits and withdrawals expanding simultaneously. That suggests high turnover and active trading rather than simple exit flows.
This kind of tug-of-war dynamic is often seen during expansion phases, where capital rotates rapidly between participants. Because this means that Liquidity increased. Volatility increased. Participation increased, too.
MVRV Indicates Profitability Expansion
Meanwhile, the 30-day MVRV turned sharply positive heading into February, reflecting that short-term holders are now sitting on profits. The 365-day MVRV also climbed steadily, reinforcing the broader shift into profitability territory, too.
Even, the MVRV Z-score moved toward elevated levels, but not historically extreme blow-off territory. That balance is important.
It suggests KITE is in a profitable expansion phase, yet not conclusively overheated. Short-term profit-taking risk exists, but structural exhaustion signals have not yet fully emerged, which is kind of safety signal for longterm investors.
Volume and Volatility Confirm Speculative Phase
Clubbing all data with KITE Price, its momentum feels justified as it accelerated alongside surging volume in late January onwards. Volatility spiked aggressively too which is a hallmark of speculative expansion cycles.
Crucially, after the surge, price consolidated at higher levels instead of collapsing. That pattern supports the idea that demand absorption occurred during high turnover, rather than immediate distribution.
More Expansion Is Possible But With Risk Attached
The on-chain data points toward a growth phase rather than structural breakdown. However, elevated short-term MVRV and concentrated whale clusters mean the next move is critical.
If withdrawals begin consistently outpacing deposits and whale activity sustains, accumulation remains the dominant narrative. If deposits overwhelm and MVRV spikes aggressively, the tone could shift toward distribution.
For now, KITE appears to be operating inside an aggressive expansion cycle which is purely driven by whale positioning, rising volume, and even renewed speculative participation.
The next few weeks will determine whether this momentum builds into continuation or matures into volatility-driven shakeouts.
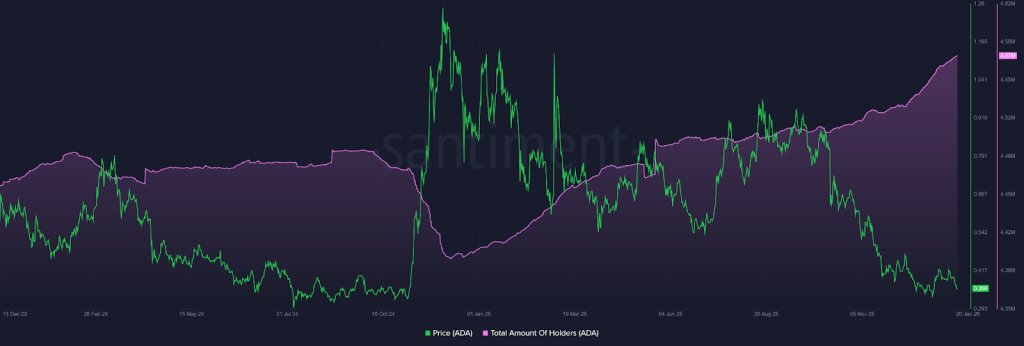
The XRP price isn’t behaving like the rest of the market. While the broader crypto space has shed billions in this recent crash led largely by Bitcoin and Ethereum but still XRP, the third-largest crypto asset excluding stablecoins, has not logged the third-largest valuation drop. In fact, relative performance shows it holding up better than Ethereum, BNB, and Solana, too.
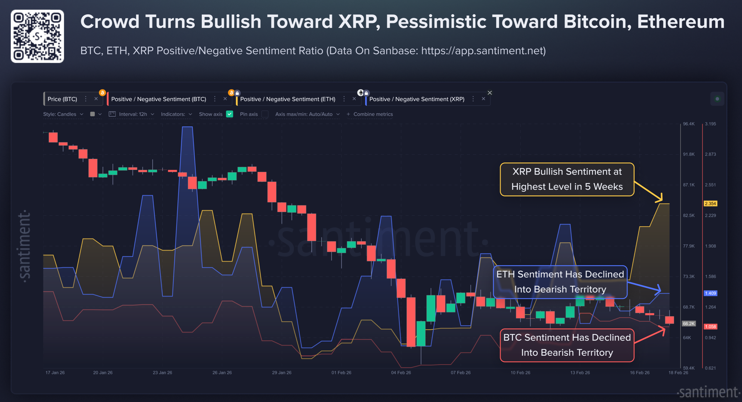
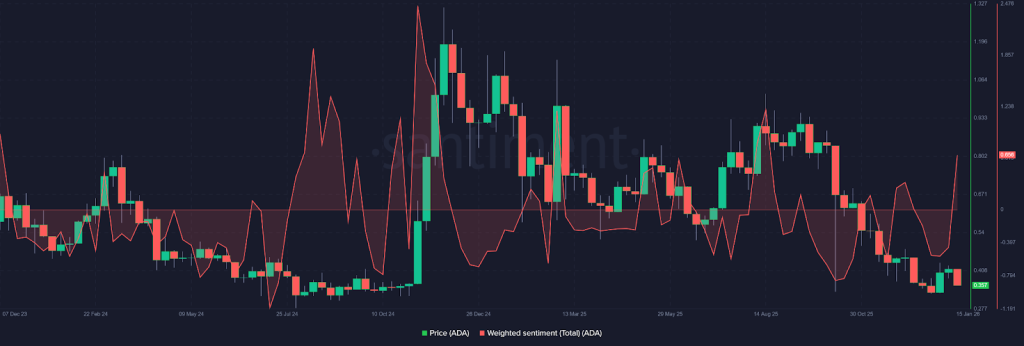
Sentiment Flips Bullish Again On XRP Price
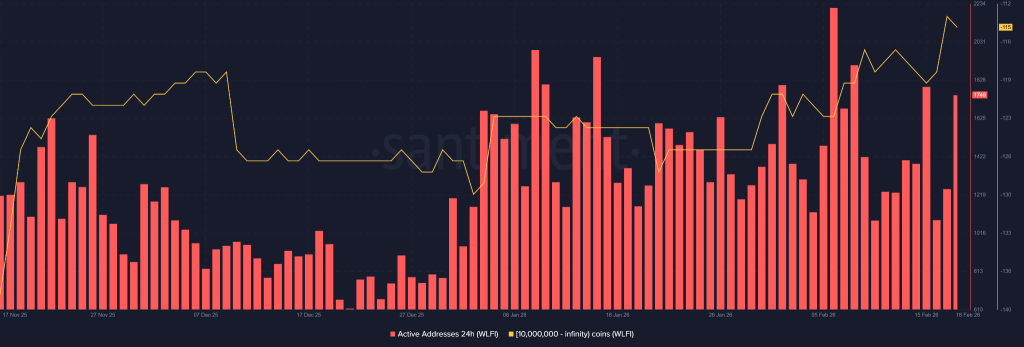
Here’s where it gets interesting. On February 19th, Santiment insights showed that social data shows bullish narratives fading around BTC and ETH, yet XRP has climbed to a five-week high in bullish sentiment. Buyers appear to be stepping in on dips, as a result of bullish chit chat, hinting that the XRP price chart may be entering a rebuilding phase rather than freefall.
Of course, sentiment alone doesn’t guarantee upside. But divergence during a market-wide slump usually catches attention.
Nasdaq Exposure in Focus
Evernorth has announced plans to list on Nasdaq under the ticker XRPN. If executed, that would place regulated XRP exposure directly in the hands of institutional investors even without them holding the asset itself.
Pension funds. Asset managers. Institutional desks. That’s the gap the listing is designed to close. Regulated wrappers have historically reshaped access narratives around digital assets, and this could influence the long-term XRP price prediction if capital channels open as expected.
But let’s be real, the most needed regulatory clarity is still the real hinge. And recently, Brad Garlinghouse has publicly suggested that U.S. market structure legislation could arrive as soon as April, assigning a 90% probability to near-term progress. The comment has fueled debate across policy and trading circles.
If clearer rules do arrive, it could shift XRP’s perception from speculative token to regulated bridge asset within the U.S. financial system. That’s a structural narrative shift, not just a price bounce.
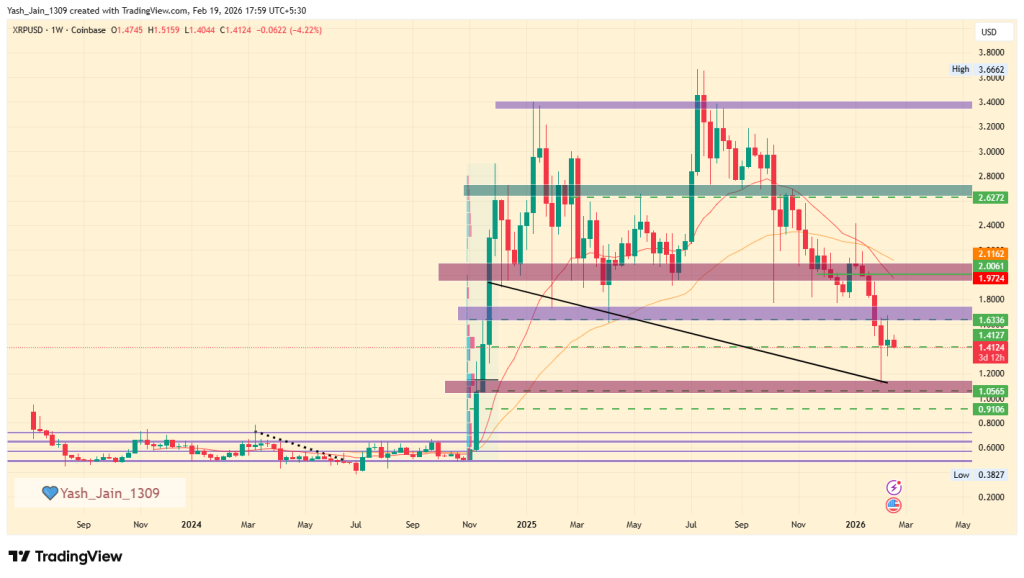
Meanwhile, technical optimism is building. One widely followed analyst has pointed to a three-day fractal mirroring XRP’s 2017 breakout structure. In that historical case, a prolonged consolidation gave way to a vertical surge toward all-time highs. Based on that projection, targets like $4 and even $9 have been floated, implying 2x to 7x gains from current levels.
Ambitious? Absolutely. But is it Possible? Then this market will decide, wether it’ll go the conservative route or ambitious.
For now, the XRP price sits at the intersection of resilience, rising sentiment, regulatory optimism, and bold fractal projections. Whether XRP/USD turns this divergence into dominance depends on how fundamentals and momentum converge in the weeks ahead. But if bears dominate again and push beneath the $1 mark, things would turn strongly bearish.
FAQs
Why is XRP holding up better than other cryptocurrencies?
XRP shows resilience as buyers step in during dips, and bullish sentiment remains strong despite broader crypto market declines.
How does bullish sentiment affect XRP price?
Rising positive chatter can attract buyers, signaling potential price rebounds even when major cryptos like BTC and ETH are falling.
How could U.S. regulatory clarity affect XRP?
Clear legislation may reframe XRP as a regulated bridge asset, reducing uncertainty and attracting institutional capital.
What is XRP’s short-term price outlook?
Technical patterns suggest potential upside to $4–$9 if bullish momentum continues, but falling below $1 would signal strong bearish risk.
Shortly after dropping the fifth Beta, Samsung has started testing One UI 8.5 Beta 6. With this move, Samsung has once again delayed the Stable rollout for the Galaxy S25 series.
Back in December, Samsung launched the One UI 8.5 Beta Program. Since its debut, the testing activity has been limited to the Galaxy S25 series. Meanwhile, the official unveiling is set to take place on February 25 in San Francisco.
Samsung has begun testing a new One UI 8.5 Beta for the Galaxy S26 series, which will be distributed as the Beta 6, via Alfaturk. The latest build carries PDA build version ending with ZZB7, with changes likely in the last digit.
Beta 4 brought Direct Voicemail, while Beta 5 debuted AI-powered Bixby. It seems the software has already hit the stability mark, and Samsung is now focusing on sequential deployment of new features from the S26 series.
If you’re on One UI 8.5 Beta 5, expect Beta 6 rollout early next month. Samsung may further stretch the Beta testing if more time is required. We may see up to seven/eight Beta builds like the previous One UI Beta testing programmes.
Stable One UI 8.5 update
With the Beta 6 testing, Samsung has made it clear: Stable update isn’t near. There’s no controversy as Samsung already confirmed the official rollout will begin in early March, with the new flagships debutting the new software.
The Galaxy S26 series is expected to go on sale on March 11. Samsung may not immediately share the software advancements with older devices. That said, existing models will likely begin receiving One UI 8.5 by April 2026.
Samsung Galaxy S26 series is unveiling next week, while a Philippines-based retailer has just accidentally published the product sale page, revealing key details including colors, price, and storage configuration.
Reservations are live for the next Galaxy, and the Unpacked event is scheduled for February 25. A live event is scheduled in San Francisco, while the new products will go on sale starting March 11, around the world.
Colors
As spotted by leaker Phonenurd, a Filipino retailer listed Galaxy S26 on sale. The device was featured in a total of six colors, including two online-exclusive shades.
The retailer listing revealed that the Galaxy S26 series will be available in these colors:
Sky Blue
Black
Cobalt Violet
White
Pink Gold
Silver Shadow
Price
From what the retailer listing shows, the Galaxy S26 could cost more than its predecessor. The upcoming flagship may start at 62,122 Philippine pesos in the Philippines, which translates to roughly $1,069.
Shared by @Phonenurd/X
Notably, the Galaxy S25 comes with a price tag of 54,090 (~ $929). There seems to be a substantial price hike in the Southeast Asian market. However, users would be getting the 512GB model while still paying for the 256GB one.
Take the pricing information as a pinch of salt, as it could also be a technical glitch. It’s also possible that the retailer may announce decent exchange bonuses and instant cashback promotions to reduce the price of the device.
Price prediction for 2026 targets $0.85, with potential highs of $3.50.
The Pi coin price forecast for 2030 highlights a price target as high as of $22.00
Pi Network’s vision of mobile-based crypto mining attracted millions worldwide, making it a standout community-driven project. However, its lack of exchange listings, limited liquidity, and minimal real-world integration now challenge its sustainability.
As the broader crypto landscape shifts toward utility-based projects and DeFi innovation, Pi Coin struggles to maintain relevance. As a reason, the PI price faced a seamless fall. While social and Google search curiosity still remains high, especially with growing searches like “1 Pi to INR” and “1 Pi to PKR,” the absence of strong fundamentals keeps Pi price recovery uncertain.
This is leaving investors questioning whether this once-hyped token can ever reclaim its lost glory. As a result, the current period aligns perfectly with the current year’s calendar to change soon, making people intrigued towards the PI price prediction for 2026-2030.
Pi’s price fell from $0.19-$0.28 in Q4 2025 to $0.1297 in January, reflecting strong bearish sentiment. Which followed a brief rise to $0.20 in February, overall recovery prospects for 2026 still remain bleak for PI/USD amid low liquidity in the crypto market. But, if the broader market improves, there may be a chance for even Pi to rally and recover to some of its lost levels.
PI Price Prediction 2026: Potential Scenarios for a Reversal
Pi’s price was firmly within its current consolidation range of $0.19-$0.28 in Q4 2025, but in January it failed to trade within this range, hitting a new low of $0.1297.
This means momentum was completely on the bearish side, and PI investors were dumping like they had no chance of ever recovering. Investors and traders assumed it had become a dead asset for now, considering it worse than memecoins.
Since the PI price prediction for 2026 still shows no significant improvement in the long term, after a devastating decline, a short-term momentum in February was observed that saw PI price rise to $0.20 briefly.
Now, at this stage, when PI price is at its weakest long-term levels, the short-term spike suggests a recovery chance, but that has further slimmed over several months of the crash. However, if it comes with a new plan to revive its ecosystem, this strong possibility could turn around the dying momentum it’s seeing.
Despite the challenges faced in December 2025 and since then, when the bear market suppressed momentum across the entire crypto sector, we’ve observed that no altcoin has managed to stage the anticipated rally. This was largely due to a lack of liquidity, with new investors still cautious, leaving many feeling apprehensive about the power of the bears.
However, the outlook for 2026 is optimistic for the sector, and if it flourishes, maybe PI could get a few drops of liquidity, too. Confidence is lower due to Q1 2026, but if the broader market improves, the odds of a substantial rally may increase.
Pi Coin Price Targets 2026 – 2030
Year
Potential Low ($)
Potential Average ($)
Potential High ($)
2026
$0.85
$2.25
$3.50
2027
$1.25
$3.25
$5.25
2028
$2.00
$5.50
$8.50
2029
$3.50
$8.50
$13.75
2030
$5.50
$13.75
$22.00
Pi Crypto Price Forecast 2026
The Pi crypto prediction for the year 2026 could range between $0.85 to $3.50. Considering the buying and selling pressure, the average price could be around $2.25 for that year.
Pi Coin Price Prediction 2027
During 2027, the Pi network value could reach a maximum trading value of $5.25 with a potential low of $1.25. Evaluating the market sentiments, the average price of this altcoin could settle at around $3.25.
Pi Token Price Projection 2028
By 2028, the value of a single Pi coin price could reach a maximum of $8.50 with a potential low of $2.00. With this, the average price could land at around the $5.50 mark.
Pi Network Price Analysis 2029
Looking forward to 2029, the Pi coin Price may range between $3.50 and $13.75, and a potential average value of around $8.50.
Pi Network Price Prediction 2030
As per our Pi Coin Price Prediction 2030, the Pi coin value in 2030 could reach a high of $22.00. However, the viral altcoin could record a low of $5.50 and an average price of $13.75, if the crypto market turns bearish.
Market Analysis
Firm Name
2025
2026
2030
CoinCodex
$ 2.08
$ 1.48
$ 2.63
priceprediction.net
$1.08
$1.61
$6.74
DigitalCoinPrice
$107.98
$125.57
$265.95
*The aforementioned targets are the average targets set by the respective firms.
Conclusion
The Pi Network’s recent developments—from major token accumulation and Banxa integration to Binance listing rumors—are clear indicators that Pi is no longer just a test project. As market conditions turn favorable and institutional interest grows, Pi Coin is entering a new phase of maturity.
Never Miss a Beat in the Crypto World!
Stay ahead with breaking news, expert analysis, and real-time updates on the latest trends in Bitcoin, altcoins, DeFi, NFTs, and more.
FAQs
Will Pi Network price recover in 2026?
Pi may recover in 2026 if liquidity improves, exchange listings expand, and overall crypto market sentiment turns bullish.
What is the Pi price prediction for 2026?
Pi price prediction for 2026 suggests a range between $0.85 and $3.50, depending on adoption progress and market momentum.
Can Pi Coin reach $1 again?
Yes, Pi can reach $1 if buying demand strengthens and the token breaks out of its long-term consolidation range.
What is the Pi Network price prediction for 2030?
Pi Network price prediction for 2030 targets a potential high near $22.00 if ecosystem growth and real-world utility improve.
Is Pi Coin a good long-term investment?
Pi carries high risk due to limited utility and listings, but long-term upside depends on successful integration and network adoption.
Predictions suggest PUMP could reach $0.01 in Q1 2026.
Long-term forecast sees PUMP reaching $0.22 by 2030 in a moderate scenario.
PUMP.fun (PUMP), a utility coin launch platform for launching Solana-based memecoins with its viral “no-code” model that makes token creation easy for everyday users.
By making token launches easy and viral, it has disrupted how traditional Web2 social platforms work. At the same time, lower costs and fewer technical barriers have attracted many first-time users who were earlier unable to experiment on-chain.
As memecoin launches continue to rise, investors are now asking whether PUMP.fun can move beyond hype and become a lasting part of the crypto ecosystem.
With that in mind, let’s take a closer look at our PUMP. fun (PUMP) price outlook for 2026 to 2030.
The PUMP/USD entered a reset phase marked by a falling wedge in Q4 2025. In January, it broke out to $0.0033, but insufficient demand led to a drop back to the $0.0016-$0.0018 zone in February.
If buying interest increases, it could rally again for a retest of $0.0033 if it successfully breaches with a daily close. Targeting $0.0050 or $0.0070 would be an ideal next move for PUMP price bulls, but resistance at $0.0033 remains strong; if it holds, it may signal ongoing consolidation.
PUMP Price Prediction 2026
On the daily chart of Coinbase, the PUMP/USD pair initially exhibited a pattern known as a tilted double bottom, which indicated a significant bullish demand during the third quarter of 2025. This bullish sentiment was evident through its rally to a price of $0.0089.
However, it is important to note that every substantial upward movement is typically preceded by a corresponding downward move, which can manifest as either a retracement or a complete reset within the market cycle. In the case of PUMP, there was no sustainable retracement to suggest a continuation of the trend. Instead, a reset phase was established during the fourth quarter of 2025, characterized by the development of a falling wedge pattern.
For investors, after an extended period of anticipation in January, the asset broke out of this wedge pattern, achieving a lower high peak of $0.0033. Nevertheless, the rally proved inadequate to signal a definitive change in character or trend due to insufficient demand, leading to a collapse in February, where it returned to the original demand zone, located between $0.0016 and $0.0018.
This situation clearly indicates that PUMP price remains within an accumulation phase. Once sufficient buying interest is established, the asset may have another opportunity to rally. Should this occur, it could potentially retest the $0.0033 level. If it manages to exceed this price with a daily closing above it, PUMP may target $0.0050, or even approach $0.0070. Conversely, if the price again encounters resistance at $0.0033, as observed in February, one may deduce that the asset’s consolidation phase will persist.
Pump. fun (PUMP) On-Chain & Supply Dynamics Analysis
Amidst market fluctuations, Pump.fun is actively reinvesting a substantial portion of its platform revenue to repurchase PUMP tokens each day. To date, this commitment has led to the buyback of an impressive $254.93 million worth of PUMP tokens, resulting in a meaningful reduction of 19.98% in the total circulating supply.
Despite recent market volatility, its dedication to daily buybacks has remained in the 95-106% range compared to the previous day’s purchases. This consistent reduction in available supply lays a solid foundation for potential price appreciation.
As market sentiment begins to shift positively, we anticipate that the decreased supply will significantly enhance the forthcoming wave of FOMO, which may propel the PUMP price to new heights.
PUMP.fun Price Prediction 2026 – 2030
Year
Potential Low ($)
Potential Average ($)
Potential High ($)
2026
$0.0019
$0.0036
$0.0053
2027
$0.0026
$0.0050
$0.0091
2028
$0.0039
$0.0075
$0.0142
2029
$0.0056
$0.0134
$0.0259
2030
$0.0088
$0.0260
$0.0430
PUMP.fun Price Prediction 2026
The PUMP market outlook suggests a steady climb toward an average of $0.0190 as platform adoption expands. Traders eyeing a PUMP breakout could see highs hitting $0.0230 if bullish momentum sustains throughout the year.
PUMP.fun Price Prediction 2027
According to the latest PUMP growth forecast, the token is expected to find a strong floor at $0.0250. Aggressive PUMP accumulation could propel the valuation to a high of $0.0440 as the Solana DeFi ecosystem matures.
PUMP.fun Price Prediction 2028
The PUMP value projection for 2028 highlights a significant rally, with an average trading price of $0.0680. Market analysts anticipate a PUMP surge toward $0.0810, driven by increased utility and token buyback mechanisms.
PUMP.fun Price Prediction 2029
A conservative PUMP target estimation places the low at $0.0650, while the average price aims for the $0.0950 milestone. The PUMP trajectory looks increasingly parabolic, with potential high-end targets reaching $0.1300 during peak market cycles.
PUMP.fun Price Prediction 2030
The long-term PUMP future trajectory indicates a massive leap, potentially reaching a psychological high of $0.2200. With an average PUMP price of $0.1500, the token is positioned to become a dominant asset in the meme-coin launchpad sector.
What Does The Market Say?
Year
2026
2027
2030
CoinCodex
$0.0061
$0.0037
$0.0072
pricepredictions
$0.0075
$0.0109
$0.0236
Suncrypto
$0.0035
$0.0065
$0.0350
CoinPedia’s PUMP.fun Price Prediction
After careful analysis, Coinpedia believes PUMP.fun’s long-term value depends more on steady creator activity than short-term hype. If the platform grows from a viral trend into a well-structured launch ecosystem, the token could perform better than expected.
If memecoin interest continues to rise, the PUMP token could climb above $0.0430 by 2030.
Year
Potential Low ($)
Potential Average ($)
Potential High ($)
2026
$0.0019
$0.0036
$0.0053
Never Miss a Beat in the Crypto World!
Stay ahead with breaking news, expert analysis, and real-time updates on the latest trends in Bitcoin, altcoins, DeFi, NFTs, and more.
FAQs
What is PUMP.fun and how does it work?
PUMP.fun is a no-code Solana platform that lets anyone launch memecoins easily, making token creation fast, low-cost, and accessible to first-time users.
What is the PUMP price prediction for 2026?
PUMP is projected to trade between $0.012 and $0.023 in 2026, with an average near $0.019 if buybacks and adoption remain strong.
Can PUMP.fun reach $0.04 or higher by 2030?
It’s possible if PUMP.fun becomes a lasting memecoin infrastructure platform with steady demand, strong revenues, and sustained retail adoption.
Is PUMP.fun (PUMP) a memecoin or a utility token?
PUMP is a utility token tied to the PUMP.fun platform, benefiting from user activity, token launches, and buyback mechanisms rather than pure meme hype.
Is PUMP.fun a good long-term investment?
PUMP.fun may suit high-risk, long-term investors who believe in creator-driven crypto platforms, but price depends on real usage, not short-term hype.
With innovation in cross-chain derivatives and rising on-chain activity, MYX could reach $30 by 2026 and up to $50 by 2030 if similar momentum continues.
MYX surged over 20,000% from June lows to September highs, making it one of the year’s best performers.
MYX Finance is positioning itself as a next-generation decentralized perpetual futures exchange, targeting traders who want on-chain transparency without sacrificing leverage and execution speed.
As centralized exchanges face increasing regulatory pressure, perpetual DEXs like MYX are attracting users looking for non-custodial alternatives.
While the overall cryptocurrency market is under pressure, MYX Finance’s native token (MYX) is moving in the opposite direction. The token jumped around 15% in the last 24 hours, trading near $3.5, even as Bitcoin, Ethereum, and most altcoins slipped lower.
At a time when overall market sentiment remains weak, MYX’s strong price action has turned heads. Making investors curious about the token growth, wondering what the future will be for these tokens.
With that in mind, let’s take a closer look at our MYX Finance (MYX) price outlook for 2026 to 2030.
MYX price saw bullish momentum with a rise to $7.56 in January 2025, but February’s decline broke key support levels, flushing out weak investors. The project remains solid due to its strong exchange use case, although its token is prone to manipulation. Early investors are still committed, and we may see consolidation in Q1 2026, but another decline could challenge the bullish outlook.
What is MYX Finance?
MYX Finance is known as a decentralized futures exchange designed to make derivatives trading more accessible, efficient, and user-friendly to the people who want’s to trade.
Unlike other traditional platforms, MYX incorporates a uniquely brought Chain-Abstracted Wallet that allows traders to move seamlessly across blockchains without manual bridging.
Its simplicity has an innovative two-layer account model that ensures users maintain custody of funds while enabling gasless transactions through a relayer network.
The another highlights that makes MYX more attractive is that this exchange supports leverage of up to 50x with zero slippage, powered by its matching pool mechanism. This enhances efficiency and reduces trading risks.
MYX Finance (MYX) Price Prediction 2026
The consolidation in Q4 2025, followed by a remarkable surge to $7.56 in January, underscores the strong bullish momentum we observed in MYX.
But in February, it declined much faster, and it didn’t stop at the multi-month ascending trendlines’ dynamic support; it even dipped below the $1.0 support of September 2025.
What this implies is the flushing of weak hands and repositioning of strong hands at much discounted prices. The project is not a dead chain; it has a strong use case: it’s an exchange with many users trading different asset pairs, so, utility-wise, it doesn’t have any issues. But its token is seen as very prone to manipulation by big players.
The late joiners in this asset have been flushed out, but early investors who haven’t given up on it are still on board and reluctant to square off yet.
Since the liquidity grab happened in Q1, we can now expect a consolidating range in the rest of Q1 2026, which will confirm buying. But if it sees a similar momentum following another decline, the bullish theory can be invalidated.
Fundamental Growth and Ecosystem Strength Stay Unaffected
With the October crash, many are thinking MYX is done for, but it’s the exact opposite because the price action might not be supporting now due to macro factors, but fundamentals have never been better.
As MYX Finance’s explosive growth is firmly rooted in robust on-chain fundamentals, moving beyond mere speculation. The platform has demonstrated consistent and significant expansion in user activity, evidenced by its surging monthly trading volume. This volume more than doubled during the year, climbing from $51 billion in January 2025 to $128.43 billion by late December.
Also, Earnings have more than doubled in the same period, jumping from $18 million to $57.45 million.
Apart from this, the TVL has taken a strong hit to a previous explosive growth to nearly $58 million by September, but by December, it has crashed down to $22.60 million.
If this momentum continues, MYX Finance could shed more TVL. However, if its adoption increases with MYX showing any price catalyst, its TVL could regain its lost levels once again in 2026.
MYX Finance Price Prediction 2026 – 2030
Year
Minimum Price
Average Price
Maximum Price
2026
$10.50
$18.00
$30.00
2027
$12.00
$24.50
$37.00
2028
$15.50
$29.00
$42.00
2029
$19.00
$35.00
$46.00
2030
$21.00
$38.00
$50.00
What Does The Market Say?
Year
2026
2027
2030
CoinCodex
$9.50
$14.99
$40.87
Pricepredictions
$6.3
$11.8
$28.09
DigitalCoinPrice
$7.41
$18.71
$37.75
Never Miss a Beat in the Crypto World!
Stay ahead with breaking news, expert analysis, and real-time updates on the latest trends in Bitcoin, altcoins, DeFi, NFTs, and more.
FAQs
What is MYX Finance and how does it work?
MYX Finance is a decentralized perpetual futures exchange offering up to 50x leverage, gasless trades, and non-custodial accounts across blockchains.
Is MYX Finance a good long-term investment?
MYX’s long-term potential depends on trader adoption, platform reliability, and growth of decentralized derivatives markets through 2026–2030.
What is the MYX price prediction for 2026?
For 2026, MYX is projected to trade between $2.8 and $10.44, depending on user growth, market conditions, and protocol performance.
Can MYX reach $40 or higher by 2030?
If MYX becomes a major on-chain derivatives platform with strong liquidity and revenue, long-term forecasts suggest prices near $40–$48 by 2030.
Samsung has developed a new camera noise algorithm, shipping with the Galaxy S26 series. Combined with the camera hardware, the new software advancement is expected to realize Samsung’s cleanest camera ever.
According to Samsung leaker IceUniverse, the Galaxy S26 series is coming with a brand new camera noise reduction algorithm.
Simply put, Samsung’s sky problem is finally getting fixed. If you’ve shot photos with a Galaxy flagship over the past few years, you know exactly what I’m talking about: that ugly, artifact-riddled gradient across blue skies.
The leaker describes the new algorithm as producing the best results ever seen on a Galaxy flagship. Sky shots show a clean, smooth, uniform blue; the kind of output that competing flagships have managed for a couple of generations now.
The 24MP mode is worth paying attention to specifically.
Samsung’s sensor binning approach on recent flagships has involved collapsing higher-resolution sensors down to a more manageable output for everyday shooting, which brings noise performance benefits but sacrifices fine detail.
The S26’s new algorithm appears to change that equation. Under high magnification, the 24MP output is reportedly retaining genuine clarity rather than the smeared, watercolor-like texture that aggressive noise reduction tends to produce.
Rumors have circulated suggesting Samsung may carry over sensor hardware from the S25 series rather than introducing entirely new imaging hardware for the S26.
The competitive landscape in 2026 flagship photography is brutal, and Samsung knows that its post-processing reputation has become a liability in certain enthusiast circles.
Samsung’s Galaxy Unpacked event for the S26 series is set for February 25. Like every year, the camera performance will almost certainly be one of the central talking points.
Samsung Galaxy S26 series is launching next week, and a new rumor signals the departure of a very useful feature. For some, it might even impact their purchasing decision, but Samsung’s move is likely aimed at enhancing device security.
X user SandeepAdap, who has shared credible Samsung intel in the past, claims that “Download Mode on Samsung devices is going away soon, starting with the S26 Series.”
No official confirmation, no Samsung statement. Just a single post that has power users across forums asking the same question: Is Odin finally dying?
If you don’t know what Download Mode is, consider yourself lucky. You’ve probably never had to use it. But for the rest of us, it has been a lifesaver, quite literally, for our devices.
Download Mode, often called Odin Mode, is a low-level boot state that lets you flash firmware directly to your Samsung device via a PC. It’s often used to rollback to a previous firmware if something is wrong with the new release.
Messing with it can permanently trip the Knox security fuse, locking you out of Samsung Pay and Knox-protected features forever. Its departure feels like a natural extension of Samsung’s ongoing push to tighten its ecosystem.
Knox has become a serious enterprise selling point, and having a widely documented hardware-level bypass sitting right there is a liability. It remains to be seen if Samsung bans Odin mode on existing models via a software update.
Have you ever used Odin to save your device or flash a custom ROM, and would this change affect your decision to upgrade to the Galaxy S26?
Samsung, in collaboration with KT Corporation, had a trial of 6G 7GHz, which crushed the impressive speeds of today’s 5G. Before anyone gets carried away, 6G is still aiming for 2030, but the speed jump here is serious.
Key Highlights
Samsung verified X-MIMO technology in the 7GHz band
Achieved peak downlink speeds of 3Gbps
Used ultra-high-density antennas with 4x the density of current 5G systems
Trial conducted with KT Corporation and Keysight Technologies
Testing involved eight simultaneous data streams to a single user
In a fresh outdoor field test, Samsung hit 3Gbps in the 7GHz band using its new X-MIMO antenna technology. This is not lab fantasy numbers, but a real-world style setup, outdoors, with partners and commercial-grade gear in the loop.
In this trial, eight data streams were transmitted simultaneously from the base station to a single user device. The result: 3Gbps peak downlink; for context, many 5G users today still hover well below 1Gbps in real-world scenarios.
This trial shows Samsung is not sitting back while others define 6G. The next-gen network tech will not just be about higher peak speeds. It will be about smarter networks, denser antennas, and spectrum that balances reach with raw capacity.
So far, it was unofficially known that the next-gen earbuds are arriving with the new Galaxy S series. Now, Samsung has almost officially confirmed that the Galaxy Buds 4 will be launched alongside the Galaxy S26 series next week.
Like elsewhere, Samsung published the Unpacked page on its Canadian website. The country’s landing page brings an FAQ section, which carries a confirmation of the Galaxy Buds 4 launch along with the Galaxy S26 flagships.
The first FAQ entry alone confirms that the Unpacked won’t be just limited to Galaxy S26 series reveal. Through FAQ, Samsung gave a clear answer without specifying the models, and fans are pretty excited for the earbuds.
“When is Galaxy Unpacked and launch for the new Galaxy phones and new Galaxy Buds?”
There are two key events for Samsung’s new Galaxy smartphones and Galaxy Buds, Unpacked and launch, which follow the schedule below.
The livestream of the Galaxy Unpacked event will be on February 25th, 2026 at 1:00 p.m. EST.
Samsung will also reveal the release date of its upcoming products. It’s widely known that the Galaxy S26 series will be available for purchase starting March 11. That said, the earbuds may share the release date with the flagships.
Source – Samsung Canada (Reserve Page)
Unpacked set for February 25
Galaxy Buds 4 and Buds 4 Pro are the most leaked products this year. From early clues in One UI to the recently leaked live images, Samsung’s premium earbuds are no longer a mystery unless there’s something more to expose.
Samsung is set to hold the Galaxy Unpacked on February 25, 2026. A live event will be held in San Francisco, California, while fans around the world can join the unveiling live through a YouTube livestream.
Samsung plans a strategic stake reshuffle to accelerate solid-state battery era. This battery technology is expected to replace the legacy lithium-ion solutions.
According to reports, Samsung SDI is bracing to cut/reduce its stake from Samsung Display to fund future investment, which includes the ESS (Energy Storage System) business and solid-state battery technology.
By selling its Samsung Display stake, Samsung SDI will likely strengthen its future businesses. Plans include conversion and expansion of existing lines to boost ESS production and add capacity for all-solid-state battery commercialization.
It’s reported that the Korean tech giant will pursue full-scale expansion of its all-solid-state battery production lines this year. It’s a significant development as the commercialization is expected in the year 2028.
Samsung SDI reportedly announced to sell its Samsung Display stake and other held assets in order to secure investment funds and improve its financial structure.
Pay attention, Samsung Display is 84.8 percent owned by Samsung Electronics and 15.2 percent by Samsung SDI. The battery wing’s stake in the display unit is estimated to be worth approximately KRW 10 trillion at book value.
Samsung SDI stated that the buyer, size, terms, and timing of the Samsung Display stake sale have not yet been determined.
A Samsung SDI representative said,
“We plan to review all relevant matters, including the counterparty, scale, terms, and timing, through the Sustainability Management Committee, composed solely of outside directors, before reporting to and obtaining approval from the board.”
Bixby has spent a long time playing catch-up to assistants powered by Gemini and GPT. With the One UI 8.5 Beta, Samsung Bixby is not just patching holes; it’s entering the same arena with conversational AI and real-time web search.
For the first time, it feels like Samsung is serious about making Bixby think in plain human terms.
Samsung has rebuilt Bixby in its One UI 8.5 refresh around natural language understanding. Now, Galaxy users no longer need to memorize menu names or dig through settings; just describe what you want.
If you ask, “Why is my phone screen always on when it’s inside my pocket?” Bixby checks context and surfaces relevant settings like Accidental Touch Protection. Instead of generic advice, it brings you straight to the toggle.
Bixby with Device Control
Real-time web search inside Bixby
Bixby can now pull live information from the open web and display results directly within its own interface. Ask it, “Find me hotels in Seoul that have swimming pools for kids.”
Bixby processes the request and shows relevant results in-app. It feels cohesive, part of the system rather than a gateway to another app. For users who live inside Samsung’s ecosystem, this integration is key.
The experience stays contained within One UI, which is subtle but powerful. Samsung is clearly building toward a model where Bixby becomes the glue between on-device controls and online intelligence.
Real-time web search in Bixby
Samsung needed Bixby to stop feeling like a legacy assistant and start behaving like a modern AI layer across One UI. This is that reset moment; it isn’t perfect yet, but it finally feels like Bixby is catching up rather than standing still.
The new Bixby beta arrives as part of One UI 8.5 in select markets: Germany, India, Korea, Poland, the UK, and the US. The company says broader expansion is planned, though exact timelines remain under wraps.
Samsung has released “Over the Horizon 2026” days before the Galaxy S26 steps onto the Unpacked stage. As expected, the company is using its signature anthem to set the tone before the hardware even gets a chance to speak.
This year’s theme is called“A Soundtrack of the Earth.”
The orchestral arrangement lands days before Samsung unveils the new Galaxy S series on February 25, which signals where the brand wants the conversation to go – “Harmony between technology and the planet.”
If you have followed this tradition, you know the drill. Each year, Samsung reinvents “Over the Horizon” to mirror its broader brand philosophy.
In 2024, we got a traditional Korean orchestra. In 2025, Samsung surprised us with a big band jazz spin. Now, for 2026, it goes full orchestral, no half measures.
Image source – Samsung
The arrangement paints mountains with brass and horns, then drifts into legato strings that mirror calm seas. It is Samsung doing what it does best at launch time, building atmosphere before the first spec sheet appears.
Samsung did not stop at a conventional Western setup. The arrangement weaves in the angklung, a traditional Indonesian instrument, blending its wooden resonance into a modern orchestral frame.
Eunike Tanzil owns the 2026 edition of Over the Horizon. Her style is lyrical but controlled, expressive without tipping into melodrama. She translates natural imagery into musical texture with a precision that fits Samsung’s messaging.
The Royal Philharmonic took to the booths at Abbey Road Studios in London. Producer and engineer Jonathan Allen handled the Dolby Atmos mastering, with careful microphone placement preserving natural spatial depth.
This is more than background music for a product launch. It is the opening chapter of the Galaxy S26 lineup’s story. If history tells us anything, Samsung rarely picks its soundtrack by accident.
What was witnessed in the MYX price isn’t just a dip. It collapsed severely. From an early February high of $6.94, the token has dumped over 80%, even slicing through a long-term ascending trendline that had been intact for months. This breach was the most unexpected, but it still occurred and even lost the crucial $1 support level from September 2024. Now, MYX/USD trades at $0.8762, shrinking its market cap to just $221.75 million, but questions about this dip are rising: Is it over for MYX, or was it a big player’s strategic move?
Is MYX Price Just Witnessing a Liquidity Grab or Is It an Ordinary Collapse?
An analyst on X called it weeks ago, describing whales as “liquidity grabbers” and refusing to chase what he viewed as a fake trend, that was keeping the price floated above $6. Looking at the MYX price chart now, it’s hard to argue that something this aggressive happened.
The breakdown below multi-month trendline support and the psychological $1 level wasn’t subtle. It wiped out leveraged longs. It crushed late buyers. It filtered weak hands fast.
But here’s the thing, the big destruction usually comes with silence.
MYX Exchange Activity Still Rising: What It Means for Its Token?
Despite the collapse, MYX exchange activity remains strong. The platform reportedly holds 178K users, and total earnings by mid-February climbed to $64.45 million, up from January’s $61.79 million. That’s not the profile of a ghost chain.
Revenue is increasing. Participation remains measurable. That doesn’t automatically translate into price strength, but it certainly challenges the “dead project” narrative.
So, what gives? Well, one interpretation is that the recent move was designed to flush excessive optimism and reset positioning. A classic overheat-and-cool cycle. And technically, the MYX price is now sitting in a key demand area after the vertical drop.
MVRV Reset: Hidden Bull Signal?
Here’s where it gets even more interesting. The collapse triggered a significant MVRV Z-Score reset. Previously, the asset had entered overvaluation territory. That imbalance between market value and holder cost basis has now been dramatically reduced.
In simple terms? The speculative froth has been cleared.
Historically, such resets can create healthier foundations for organic recovery only if demand stabilizes and accumulation begins. But, this doesn’t guarantee reversal, but it shifts the MYX price prediction narrative away from euphoria and toward valuation reset.
So, is it worth buying this dip? That depends on whether current demand holds and long-term participants step in. The MVRV structure suggests the excess has been wrung out. The platform metrics suggest it’s operationally alive. The chart suggests capitulation has already happened.
For now, the MYX price analysis shows that token sits at a crossroads technically wounded, structurally reset, and waiting for accumulation to either confirm recovery… or not.
Price predictions for 2026 range from up to $4.18.
Long-term forecasts suggest potential highs of $35.60 by 2030.
WLD price was almost $12 ATH but went crashing to $0.50 in the last remaining days of 2025. This has raised concerns among investors and traders about WLD’s future, and as a result, the Worldcoin price prediction 2026 has become a topic of significant discussion, with many being intrigued about its prospects in the coming year.
Its prolonged period of downtrend has left many wondering if the project’s initial buzz was fading. But, behind the scenes, Worldcoin is still quietly building its platform. Now, experts view Q1 2026 as a potential turning point where renewed momentum could be observed.
So many are now asking a crucial question: is this the start of a new chapter for Worldcoin? Will the project’s focus on decentralized identity and its connection to the AI sector be enough to fuel a powerful comeback and reclaim its spot in the market spotlight?
Let’s delve into the anticipated Worldcoin price predictions 2026 to 2030 and the years to come.
Entering 2026 in a dire state was not appealing to investors, as they did not take the opportunity to buy back at discounted prices. Consequently, both January and February saw prices decline, reaching as low as $0.27 in February.
If the crucial support level at $0.31 fails to hold, the price may experience further stagnation or may need to retest its floor near $0.27.
Worldcoin Price Prediction 2026
Following a false breakout to $2.12 in 2025, the bearish trend persisted, extending into the first quarter of 2026, where prices dipped as low as $0.27. The broader market conditions have significantly impacted liquidity within the cryptocurrency sector, leading traders and investors to remain on the sidelines until clearer market signals emerge.
In February, the market found itself in a precarious situation, struggling to stabilize. Investor sentiment remained tepid, with many individuals hesitant to capitalize on opportunities despite substantial price discounts.
Currently, the critical support level at $0.31 has failed to withstand selling pressure. As a result, the price may not only remain stagnant but could also experience further declines.
WLD On-Chain Analysis
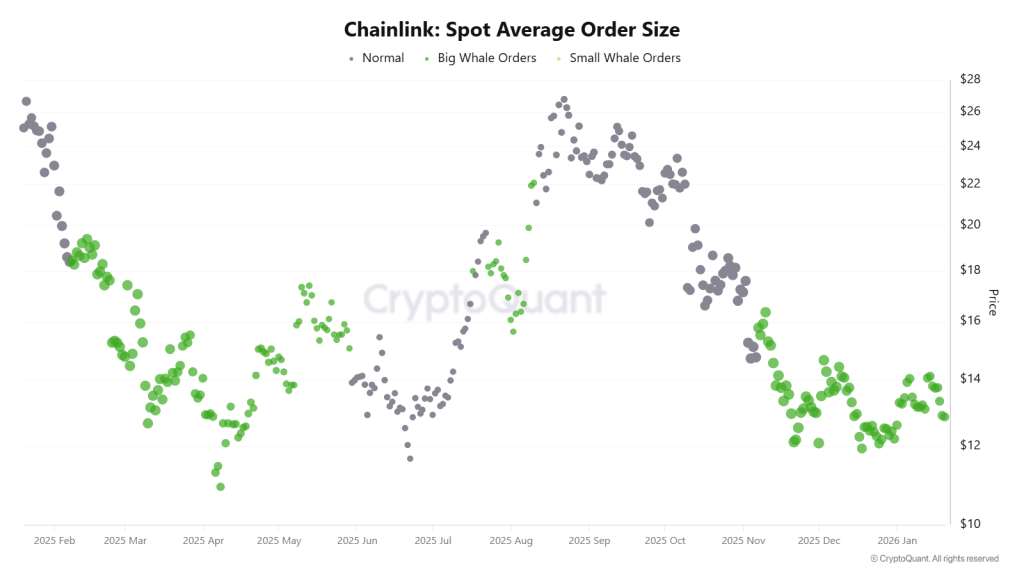
The WLD Spot Average Order Size chart reveals persistent green clusters into January 2026, indicating sustained “Big Whale” participation. This heavy institutional accumulation suggests that smart money is aggressively building positions, viewing the current price range as a high-conviction entry point.
Similarly, development activity on Worldcoin is surging to new local highs in January 2026, showcasing intense builder commitment. This spike in innovation, combined with whale interest, creates a powerful fundamental divergence that historically precedes a massive price reversal.
WLD Price Forecast 2026 – 2030
Year
Potential Low ($)
Average Price ($)
Potential High ($)
2026
2.50
6.00
9.50
2027
7.00
11.25
15.70
2028
10.75
15.95
21.15
2029
15.65
21.60
27.50
2030
19.75
27.75
35.60
This table, based on historical movements, shows Worldcoin price to reach $35.60 by 2030 based on compounding market cap each year. This table provides a framework for understanding the potential Worldcoin price movements. Yet, the actual price will depend on a combination of market dynamics, investor behavior, and external factors influencing the cryptocurrency landscape.
Worldcoin Price Forecast 2026
Worldcoin’s price for 2026 is projected to range between $2.50 and $9.50, with an average price of approximately $6.00.
WLD Price Prediction 2027
Worldcoin’s price for 2027 is expected to fluctuate between $7.00 and $15.70, with an average price of around $11.25.
Worldcoin Price Forecast 2028
Worldcoin’s price for 2028 is anticipated to be between $10.75 and $21.15, with an average price of about $15.95.
WLD Token Ai Price Forecast 2029
Worldcoin’s price for 2029 is projected to vary from $15.60 to $27.50, with an average price of roughly $21.60.
Worldcoin AI Token Price Prediction 2030
Worldcoin’s price for 2030 is expected to fluctuate between $19.75 to $35.60, with an average price of approximately $27.75.
Market Analysis
Firm Name
2026
2030
Swapspace
$1.30
$2.07
coincodex
$2.40
$4.30
DigitalCoinPrice
$3.02
$4.06
*The targets mentioned above are the average targets set by the respective firms.
Never Miss a Beat in the Crypto World!
Stay ahead with breaking news, expert analysis, and real-time updates on the latest trends in Bitcoin, altcoins, DeFi, NFTs, and more.
FAQs
What is Worldcoin?
Worldcoin is a cryptocurrency project aiming to distribute digital assets to a global audience through a unique identity-verification system.
What is the current price of 1 Worldcoin?
At the time of writing, the price of one WLD token was $ 0.00349731.
What is the Worldcoin price prediction for 2026?
WLD price forecasts for 2026 suggest a potential range between $2.50 and $9.50, depending on market recovery and technical breakouts.
What is the Worldcoin price prediction for 2030?
Long-term models suggest WLD could trade from about $19.75 to $35.60 by 2030 under bullish conditions.
What is the Worldcoin price prediction for 2040?
While speculative, extended growth forecasts envision potential for WLD beyond 2040 based on adoption and tech use cases.
Is Worldcoin a good long-term investment?
Worldcoin offers long-term potential due to its focus on decentralized identity and AI, but it remains volatile and requires risk awareness.
What factors influence WLD price the most?
WLD price is driven by AI narrative strength, user adoption, token supply dynamics, market sentiment, and overall crypto market trends.
The live price of the Polygon coin is $ 0.21819891.
POL price predictions for 2026 suggest potential highs of $0.7548.
Long-term forecasts indicate POL could reach $4.94 by 2030.
Polygon (POL) has a mind-blowing Layer-2 scaling solution project for Ethereum, which is primarily designed to address slow speeds and the network’s high transaction fees.
As a result, Polygon is seen as a revolutionary framework for developers and users, as it attracts by offering a more efficient Ethereum experience, which is the reason contributing to POL’s price value, too.
Through, POL, which is its native token (formerly MATIC), is utilized for transaction fees and network governance, in the framework of interconnected Ethereum-compatible blockchain networks.
Its use case makes it an attractive altcoin, and even its token POL price is attracting attention. The coin is expected to show a surge in the coming sessions, but it would require a technical eye to understand.
Therefore, if you are curious about whether the POL price can rebound to $1. Will Polygon go up? And is Polygon a good investment? We bring our Polygon Price Prediction for 2025 – 2030 to explore the POL price prediction.
In 2025 and 2026, prices dipped to $0.0850 within a narrowing wedge. If we see a breakout above this level, we could be looking at exciting price increases to $0.19, $0.30, and even $0.42. However, it is important to keep in mind that if market sentiment does not get better, we might continue to see some dips in the POL price.
Polygon Price Prediction 2026
In 2025, we witnessed significant pessimism in price action, a trend that firmly carried into 2026, with prices persisting on a downward path.
The price has been moving within a narrowing falling wedge, and by February, it reached a critical $0.0850, aligning with the lower edge of the channel.
This level is pivotal for the POL/USD pair; if demand returns, we are poised to break this narrowing range, allowing for a potential retest of $0.19. But, a decisive breach above this level will signal a breakout from the falling wedge pattern, paving the way for higher price targets, such as $0.30 and $0.42.
However, if sentiment does not improve as anticipated, the falling wedge may continue to narrow until it encounters demand. Given the current market drawdown, it’s crucial to recognize that the likelihood of the POL price continuing to decline is substantial.
POL On-Chain Analysis
The on-chain landscape for POL is flashing a major recovery signal as the 30-day moving average of Daily Active Addresses (DAA) shows a clear and sustained upward trend in early 2026.
This metric serves as the vital heartbeat of the ecosystem, indicating that organic utility and user engagement are returning to the network at a steady, reliable pace. Unlike temporary spikes that often signal speculative noise, a rising 30-day average suggests a strengthening network effect and a growing demand for blockspace.
For investors, this return of on-chain activity is a fundamental precursor to price appreciation, as it confirms that the ecosystem is not only retaining its base but actively expanding its reach.
Complementing this surge in network activity is a powerful development in supply distribution, specifically within the “whale” and institutional cohorts. Addresses holding between 100,000 and 10 million POL have seen significant growth, signaling a phase of high-conviction accumulation by “smart money.”
This specific bracket often represents mid-to-large-scale investors who lead market cycles by absorbing supply during consolidation phases. This strategic positioning by larger entities reduces sell-side pressure and creates a robust fundamental floor for the asset.
When rising active addresses align with such aggressive whale accumulation, it speaks a definitively bullish language for the POL trajectory, suggesting that the most influential market participants are preparing for a major expansion in value.
Polygon Price Prediction 2026 – 2030
Year
Potential Low ($)
Potential Average ($)
Potential High ($)
Polygon Price Action 2026
$0.18870
$0.47179
$0.75488
POL Price Prediction 2027
$0.30194
$0.75488
$1.20782
Polygon Crypto Price Forecast 2028
$0.48311
$1.20782
$1.93252
POL Coin Price Projection 2029
$0.77297
$1.93252
$3.09205
Polygon Price Prediction 2030
$1.23676
$3.09205
$4.94729
This table, based on historical movements, shows POL price to reach $4.94 by 2030 based on compounding market cap each year. This table provides a framework for understanding the potential POL price movements. Yet, the actual price will depend on a combination of market dynamics, investor behavior, and external factors influencing the cryptocurrency landscape.
Polygon Price Action 2026
Anticipating further expansion, MATIC’s potential high for 2026 is projected to be $0.75488, while the potential low is estimated at $0.18870, resulting in an average price of $0.47179.
POL Price Prediction 2027
MATIC crypto can make a potential high of $1.20782 in 2027, with a potential low of $0.30194, leading to an average price of $0.75488.
Polygon Crypto Price Forecast 2028
As the POL price progresses, the potential high price for 2028 is projected to be $1.93252, with a potential low of $0.48311, resulting in an average price of $1.20782.
MATIC Coin Price Projection 2029
Polygon coin price potential high for 2029 could be $3.09205, while a potential low of $0.77297, with an average price of $1.93252.
Polygon Price Prediction 2030
With an established position in the market, POL’s potential high for 2030 is projected to be $4.94729. On the flip side, a potential low of $1.23676 will result in an average price of $3.09205.
Market Analysis
Firm Name
2025
2026
2030
CoinCodex
$ 0.71
$ 0.50
$ 0.90
Binance
$0.24
$0.26
$0.31
Flitpay
$6.25
$4
$10.4
Never Miss a Beat in the Crypto World!
Stay ahead with breaking news, expert analysis, and real-time updates on the latest trends in Bitcoin, altcoins, DeFi, NFTs, and more.
FAQs
Is Polygon (POL) a good long-term investment?
Polygon is considered a strong long-term project due to its Ethereum scaling role, active development, and growing ecosystem, but it still carries market risk.
What is the Polygon price prediction for 2026?
For 2026, POL price forecasts suggest a potential range between $0.10 and $0.75, depending on market recovery and technical breakout patterns.
Can Polygon reach $5 by 2030?
Some long-term projections indicate POL could approach $4–$5 by 2030 if adoption accelerates and the crypto market enters a sustained growth cycle.
What factors affect Polygon (POL) price the most?
POL price is influenced by Ethereum demand, network usage, market liquidity, macroeconomic trends, and overall investor sentiment in crypto markets.
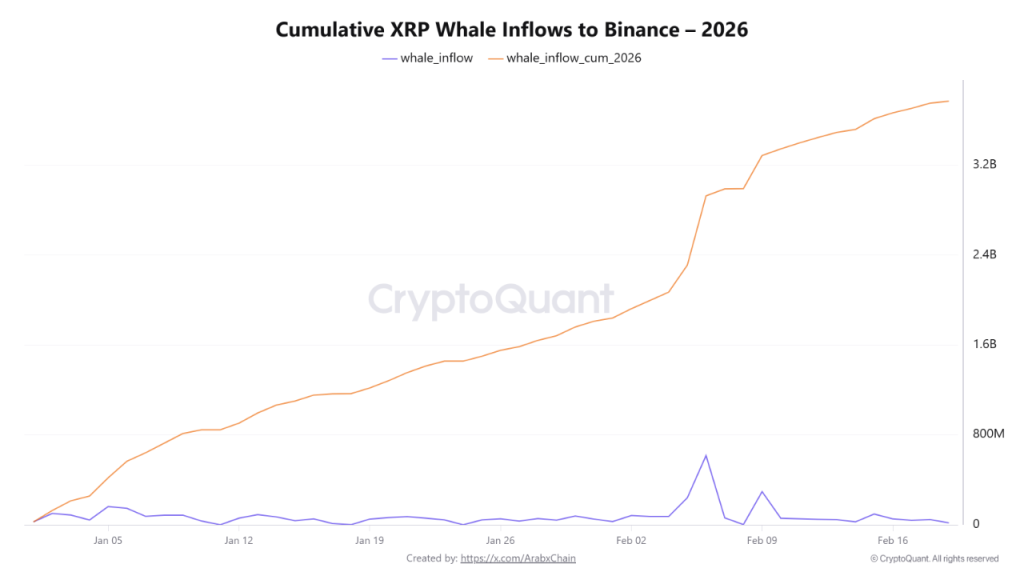
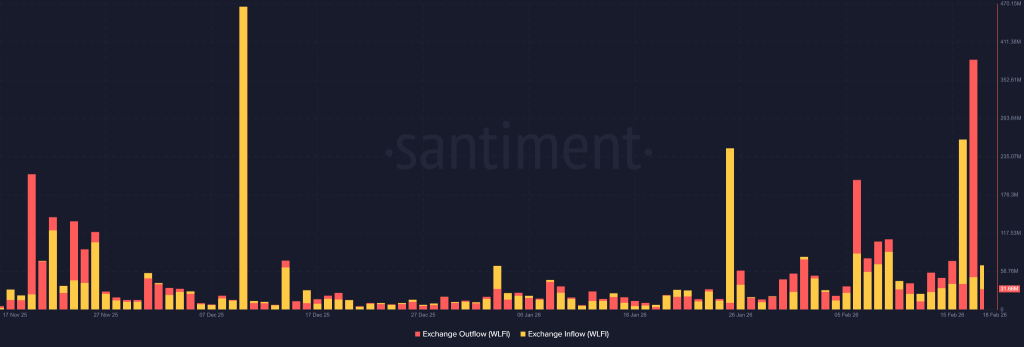
The XRP price is walking a tightrope. On one side, 3.8 billion coins have flowed from whale wallets into Binance since the start of 2026. On the other, exchange supply is quietly declining and bullish sentiment just hit a five-week high.
Confused? You should be. Let’s decode.
Whales Move Billions to Binance
The cumulative flow chart shows a steady, systematic rise in XRP deposits from large holders into Binance, totaling roughly 3.8 billion XRP since January. Not one-off spikes. Not panic transfers. A gradual, deliberate climb.
Then February arrived.
The curve steepened. Inflows accelerated noticeably during the first half of the month, suggesting whales weren’t just testing the waters in fact they were positioning on the dips.
Historically, per CryptoQuant analyst Arab Chain, its evident that always heavy whale inflows to exchanges have coincided with short-term corrections or strategic repositioning ahead of a new trend forming.
That means liquidity could be sitting on the table.
Now, that doesn’t automatically equal dumping. Some flows may support trading pairs or internal exchange operations. But let’s not pretend billions in potential sell-side liquidity are irrelevant to the XRP price chart, yet.
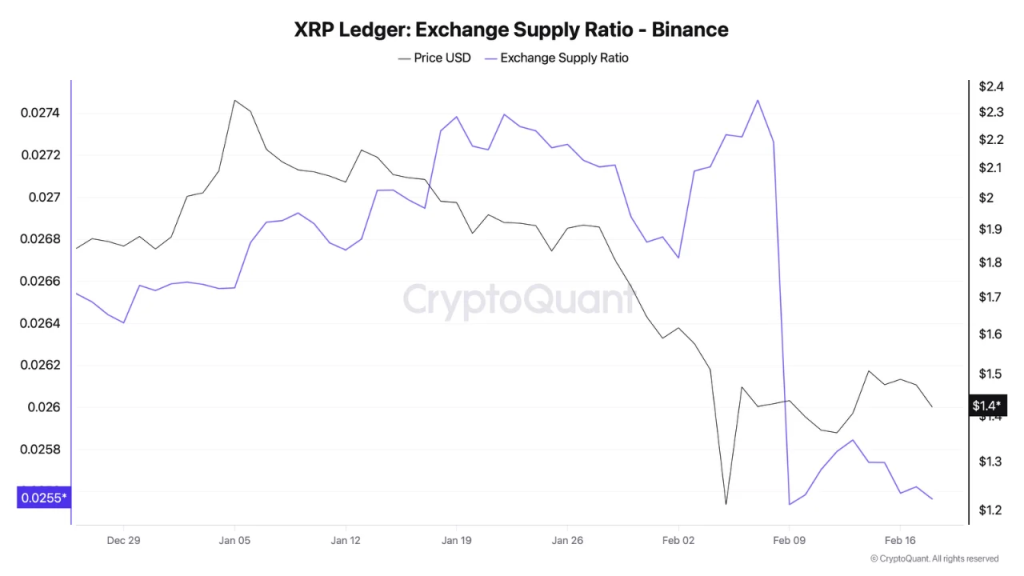
Supply Ratio Drops Despite Inflows
Well, here’s the twist.
While whales are sending coins in, the XRP supply ratio on Binance has declined from 0.027 to 0.025 over the past ten days. Roughly 200 million XRP left the exchange in that window.
That dynamic suggests accumulation by another class of investors. Historically, declining exchange reserves reflect long-term conviction, as tokens are withdrawn into private wallets instead of being left in a liquid trading environment.
And context matters.
Per analyst Darkfost, the XRP price has corrected around 40% since the beginning of the year. For some investors, that kind of pullback doesn’t scream “sell.” It whispers “opportunity.”
So, what does this mean for any XRP price prediction? It paints a mixed picture for today. But, whales appear prepared. Retail or long-term holders appear to be accumulating and even if price dips more accumulation could continue.
That tension is the story.
Sentiment Swings Back to XRP
Meanwhile, Santiment insights also confirms that the social data has begun to show a surge in bullish sentiment toward XRP as well, which is now at a five-week high, even as broader crypto social commentary toward Bitcoin and Ethereum has cooled.
Part of that optimism traces back to February 17th partnership expansion news involving Ripple and GOSH Charity. The collaboration aims to unlock crypto philanthropy, allowing global supporters to donate digital assets more easily and quickly.
That’s not just feel-good PR. Increased utility means more transaction flow potential. In theory, that real-world use case adds a narrative tailwind to XRP/USD beyond speculation alone.
So where does that leave the XRP price?
Billions in whale inflows. Declining exchange supply ratio. Rising bullish sentiment. A 40% year-to-date correction.
The stage is set. Whether it resolves into volatility or a trend shift is what the market will decide next.
Samsung is bringing a One UI 8.5-inspired software update screen redesign to Galaxy Watch users. Galaxy Wearable app is receiving a new update, which installs a redesigned interface, accessible for smartwatch users.
One UI 8.5 brings a gradient background behind the software label, which is now available for Samsung Watch users on One UI 8.0 Watch. The design system is newer, but Samsung brought it to One UI 8.0 Watch.
This UI tweak shows Samsung’s work of unifying the software design across its devices. UI visuals, inspired by the mobile screen, are provided to wearables. It’s a step beyond feature expansion from mobile to watch in sync.
The design change has been spotted in version 2.2.17.26020951, via LarrySWhite and Aptivi. The screenshots are derived from the app’s interface on mobile. You can also trigger it by performing a software update check.
Since it’s an app-level tweak, the appearance will depend on the OS version of your wearable. It would appear regardless of the phone model and its operating system.
One UI 8.0 Watch is the latest wearable operating system. It introduced major design changes to Galaxy Watch models. The new tile system is a significant shift in elevating the usability of the smart wrist-worn gadget.
One UI 8.5 Beta Program is underway, and the official version will go official next week. Existing Samsung devices should start receiving the new changes with updates by April this year, starting with the Galaxy S25 series.
Price predictions suggest that ALGO has the potential to hit $0.65 to $1.35 by the end of 2026.
Long-term forecasts indicate potential highs of $5.65 by 2030.
Algorand’s strong push for scalability, security, and decentralization is paying off. With the launch of AlgoKit 3.0 in Q1 2025 and growing developer interest, ALGO adoption has improved and is now on the rise. The rising adoption is beneficial for an asset, as it is directly proportional to a token’s price.
But the big question for intrigued market participants still remains: Can ALGO Price hit $1 this cycle? Read our in-depth Algorand Price Prediction 2025 and long-term outlook through 2030 to find out.
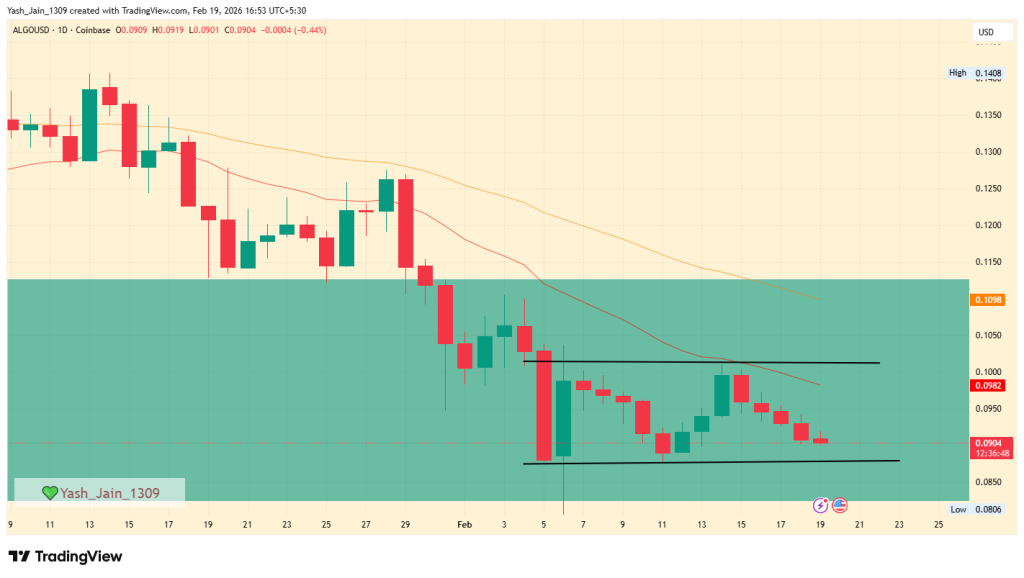
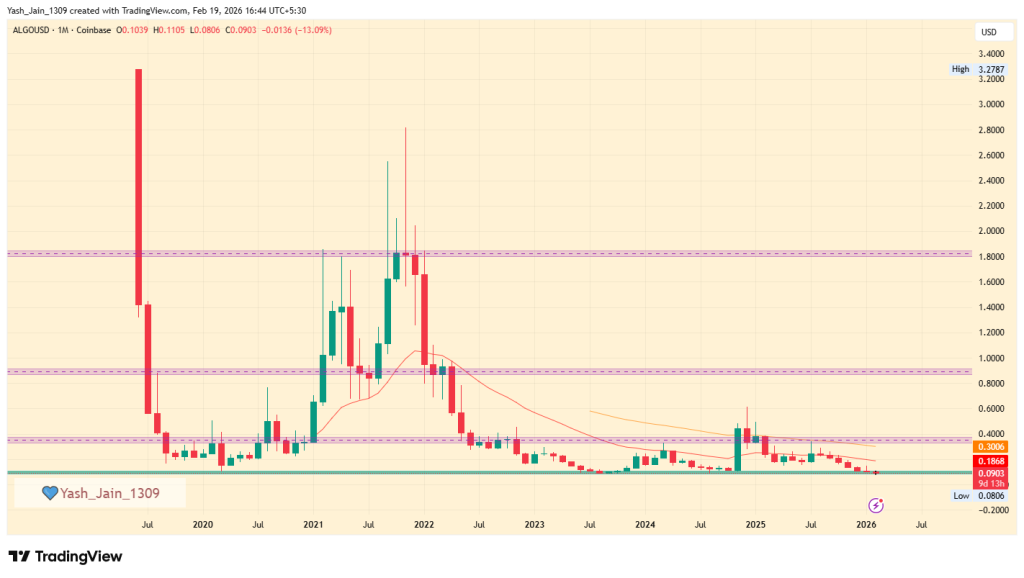
Since the 2021 crash, ALGO price has struggled to regain the $0.4000 mark and has hit a new all-time low of $0.0806 in Q1 2026. The market remains unstable, but if conditions improve, ALGO could recover to around $0.2000, provided it closes above that level. Otherwise, it may continue to consolidate near its lows.
Algorand February Price Prediction 2026
In January, the price fell below the $0.1125 support level and dropped to $0.0806 by February. Although it briefly dipped, it managed to climb back and trade within a demand area. Despite being in a multi-year demand zone, the anticipated bullish momentum has not yet materialized. There are only a few days left until the ALGO price moves into March 2026.
If broader market momentum supports the price and it breaks out of the current consolidation, February could end near $0.1108, and Q1 might see a rise toward $0.1400. However, if the downward trend continues, the price may slide back to $0.0806 or even lower.
ALGO Price Prediction 2026
Since the crash in 2021, ALGO’s price has struggled to recover beyond the $0.4000 mark and has remained in a consolidation phase on the monthly chart below this level. In Q1 2026, it slipped beneath this monthly consolidation range and marked a new all-time low (ATL) of $0.0806, yet it continues to consolidate around the lower edge of this multi-year range.
The broader market shows no bullish developments, and even blue-chip cryptocurrencies are facing challenges, making the entire altcoin market unstable in the first quarter of 2026. However, there are still many days remaining before the end of Q1 in March 2026, and ALGO is trading near the lower edge, where demand could increase if the broader market improves.
In this scenario, ALGO’s price could potentially recover to $0.1400. However, to move beyond this point, it needs to achieve a monthly close above $0.1400. Otherwise, it will likely continue to consolidate near the lower border of the monthly range.
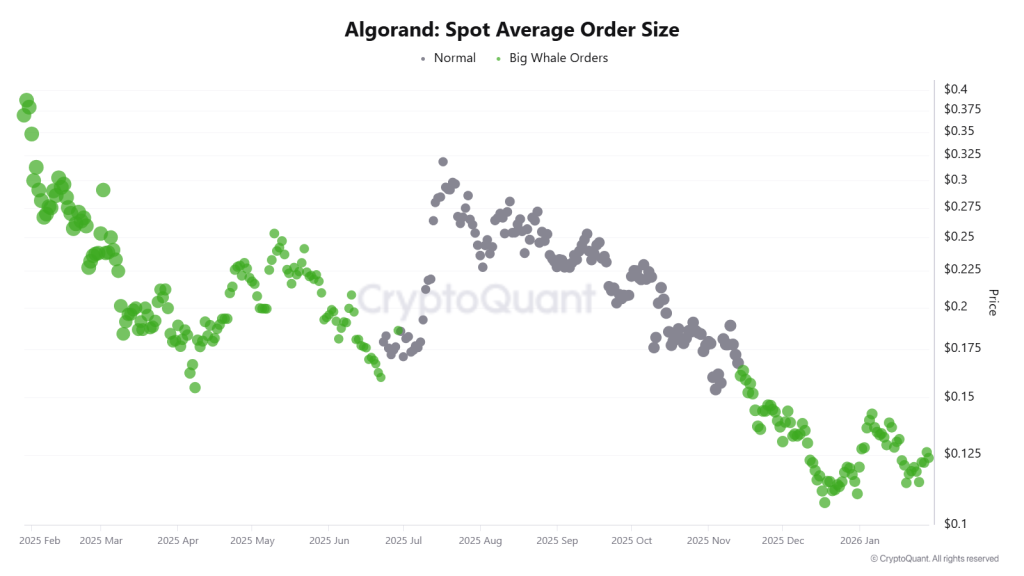
AVAX Onchain Outlook
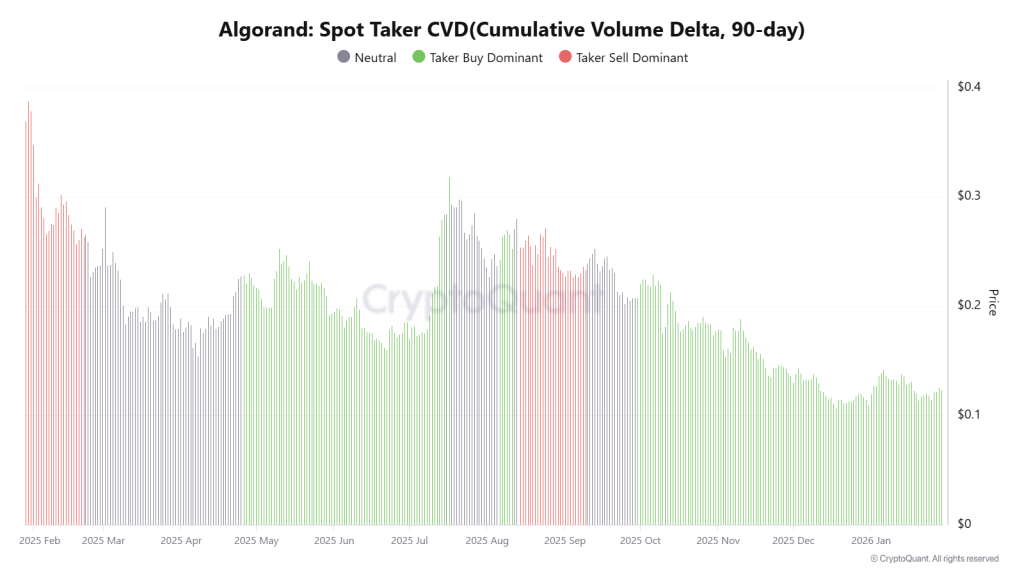
The on-chain outlook for Algorand (ALGO) is flashing bullish signals that suggest a transition from retail-led speculation to institutional-grade accumulation. A notable increase in average order sizes indicates that “whale” investors are actively participating, effectively absorbing supply during consolidation phases to reduce downside risk.
Simultaneously, the 90-day Cumulative Volume Delta (CVD) has entered a “Taker Buy Dominant” phase, which historically correlates with upward price movement as aggressive buyers consistently outpace sellers in the open market. These metrics, paired with a “cooling” spot and futures volume bubble map, suggest the market is moving through a healthy period of stabilization and building the necessary liquidity for a potential breakout.
Algorand Price Targets 2026 – 2030
Year
Potential Low ($)
Potential Average ($)
Potential High ($)
2026
0.65
1.0
1.35
2027
0.90
1.50
2.00
2028
1.40
2.10
2.90
2029
1.75
2.95
4.15
2030
2.50
4.05
5.65
Algorand (ALGO) Price Forecast 2026
Moving forward to 2026, the ALGO price may record a maximum price of $1.35. With a potential low of $0.65, the average price could settle at around $1.0.
ALGO Coin Price Projection 2027
Looking ahead to 2027, the Algorand crypto token may range between $0.90 and $2.0. With this, the average trading price could settle at around $1.50 for the year.
Algorand Crypto Price Action 2028
In 2028, the ALGO coin with a potential surge could reach a high of $2.90, a low of $1.40, and an average of $2.10.
ALGO Token Price Analysis 2029
Moving into 2029, the Algorand coin could range between $1.75 and $4.15. Considering the buying and selling pressure, the average price could settle at around $2.95.
ALGO Price Prediction 2030
By 2030, the value of a single Algorand token could reach a high of $5.65, a low of $2.50, and an average of $4.05.
Market Analysis
Firm Name
2025
2026
2030
Currencyanalytics
$0.67
$0.97
$4.06
Priceprediction.net
$0.18
$0.258
$1.10
DigitalCoinPrice
$0.82
$1.28
$2.60
Never Miss a Beat in the Crypto World!
Stay ahead with breaking news, expert analysis, and real-time updates on the latest trends in Bitcoin, altcoins, DeFi, NFTs, and more.
FAQs
What is the Algorand price prediction for 2026?
Algorand’s price in 2026 is forecasted between about $0.65 and $1.35, with an average near $1 if momentum and adoption improve.
What is the ALGO price prediction for 2027?
In 2027, ALGO may range from $0.90 to $2.00, with an average price around $1.50, depending on market demand and adoption.
How much will Algorand (ALGO) be worth in 2030?
By 2030, ALGO could reach a high of $5.65, a low of $2.50, and an average price of $4.05, reflecting growing adoption.
How much will Algorand be worth in 10 years?
Over the next 10 years, ALGO could reach $5.65 at its peak, driven by network growth, adoption, and real-world asset tokenization.
What factors influence Algorand’s price growth?
Network adoption, scalability, institutional participation, and real-world asset tokenization are key factors driving ALGO’s price potential.
One UI 8.5 Beta 5 lands in the US, the final vibe check before Galaxy S26 takes the stage. February 25 is almost here, and the countdown to the Galaxy S26 series is getting real.
For Samsung fans in the United States, this week feels different. One UI 8.5 Beta 5 is finally rolling out stateside, and it feels like the last Beta firmware before the company begins releasing the Stable software update.
After hitting Germany, South Korea, the UK, India, and Poland, the One UI 8.5 Beta 5 build, tagged ZZAN, is now reaching US Beta testers. When a Beta spreads this wide and this late in the cycle, it usually means Samsung is nearly done.
Beta 5 comes in at around 547 megabytes; that is not a flashy feature drop. It is not packed with new UI tricks or surprise toggles buried three menus deep. This is polishing and deploying finishing touches before full rollout.
Samsung is clearly focusing on stability, squashing the lingering bugs. It feels like the kind of update you push when you are confident in the foundation and just want everything to feel right.
Bugs that have been fixed
Applied Bixby version update
The Beta 5 update includes a critical version update for Samsung’s voice assistant. When Samsung tunes Bixby this late in the beta cycle, it signals that the assistant will have a visible role in the Galaxy S26 presentation.
This is its final tune-up before the spotlight hits. Expect tighter responses, better system integration, and fewer awkward pauses. It usually means the build is feature-complete and very close to what will ship publicly.
Samsung has announced that Samsung Health is evolving into a one-stop healthcare app in India.
Starting February 24, 2026, Samsung Health users will see a new feature called Find Care rolling out via an app update. The move comes through a partnership with PharmEasy and Tata 1mg, two of India’s leading health-tech platforms.
With Find Care integrated directly into Samsung Health, Galaxy users can order medicines, book diagnostic tests, and consult doctors online without leaving our favorite health app.
Everything sits inside the same interface where you already track your steps, heart rate, ECG, sleep, and more. It reflects Samsung’s push toward building a more complete digital health ecosystem, especially in a market as dynamic as India.
Kyungyun Roo, Managing Director, Samsung Research Institute, Noida, said:
“Our goal is to make healthcare more accessible and convenient for everyone. By integrating ‘Find Care’ Service in the Samsung Health app we are taking a significant step towards achieving this vision. ‘Find Care’ has been thoughtfully designed to meet the evolving needs of our users. We are committed to continuously innovating and enhancing our services to improve our user’s experience.”
PharmEasy is offering a six-month complimentary PharmEasy Plus membership to Samsung Health users who complete their first transaction through the app.
The membership includes benefits like added savings and free delivery. It is a smart incentive, and frankly, a strong nudge for users to try the new feature early.
Gaurav Verma, Chief Business Officer at PharmEasy (API Holdings) stated:
“Our collaboration with Samsung Health marks a significant step in integrating everyday technology with accessible healthcare. This partnership offers added savings, free delivery benefits and much more. It empowers users with greater value, accessibility, and control over their healthcare journey”
Tata 1mg’s Vice President Medical Affairs Dr Rajeev Sharma highlighted its potential to drive innovation in digital therapeutics and expand access beyond traditional clinical settings.
“The collaboration between Samsung and Tata 1mg empowers users to take charge of their well-being outside of traditional healthcare settings. This partnership has the potential to drive innovation in digital therapeutics, further enhancing the accessibility and effectiveness of health solutions for all.”
Samsung Health on Galaxy devices already supports tracking of physical activity, heart rate, blood pressure, ECG, sleep patterns, calorie intake, medication reminders, and even Health Records. Adding real healthcare services on top of that shifts the app from being a tracker to becoming a true health hub.
Samsung has just kicked off the One UI 8.5 Beta 5 update’s rollout to the Galaxy S25 series. It’s available for download as Beta 4 in India and Beta 5 in Germany, the UK, and South Korea. Fans in the US will also join the party soon.
In a surprising development, Samsung has begun the One UI 8.5 Beta 5 update distribution to the Galaxy S25, S25+, and S25 Ultra. If you’ve joined the Beta Program and still participated, check for the latest OTA, ends with ZZAN.
The software weighs 553 MB, carries the latest security patch dated February 5, 2026, and includes one major improvement. The changelog signals the installation of an updated Bixby version, which enhances the usability experience.
Beta 5 release indicates that the One UI 8.5 Stable will go live soon. The size of this update and the changelog’s content carry strong vibes. Minimal changes are usually meant to final phase of finishing touches.
With Beta 4, Samsung provided major usability improvements. The update also installed a new feature called Direct Voicemail. We’re going hands-on with the ZZAN build to find what’s not mentioned in the changelog.
Samsung launches the Galaxy S26 series next week, along with One UI 8.5. The firmware will begin rolling out on March 11, the day new flagships go on sale. However, older devices would be a little late in receiving the update.
Get the Beta 5 on your Galaxy through Settings > Software update > Download and install.
Credits – Android Flatform / Samsung Members (Korea)
The memory market is currently a wild west of soaring prices and supply pinches, but Samsung Electronics isn’t just riding the wave, but directing it.
Reports from South Korea reveal that Samsung is conducting aggressive, periodic reviews of its memory production mix amid soaring prices.
While the industry fixates on the “HBM-or-bust” narrative, Samsung is executing a calculated dual-track masterclass that leverages its sheer scale to dominate both the AI future and the high-margin present.
With average DRAM prices revised upward to a staggering 90-95% increase for the first quarter, the profitability of general-purpose memory has suddenly caught up to the specialized AI stacks.
For those claiming Samsung was behind in the AI race, the response has arrived in the form of mass shipments. Samsung recently confirmed it has begun delivering its sixth-generation HBM4 to major customers, including Nvidia.
Prices for PC DRAM alone are forecasted to climb 91% this quarter. Samsung is sitting on a goldmine because approximately 70% of its total output is currently dedicated to this general-purpose memory.
An industry insider commented, “Samsung has far greater flexibility than its competitors in adjusting its product mix. General-purpose DRAM is a very strong cash generator, making a dual-track strategy essentially unavoidable.”
Samsung is using its HBM4 leadership to lock in the AI giants like Nvidia and OpenAI, while simultaneously using its legacy dominance to harvest record profits from the global DRAM shortage.
One UI 9 will be the next major upgrade, and its interface visuals started to leak early. Samsung has successfully deployed One UI 8.0, and Beta testing of One UI 8.5 is underway. Samsung has already started internal testing of Android 17-based One UI 9.
Samsung’s One UI 8 retains the legacy software update interface. Major changes have been made to the One UI 8.5 version, slapping a signature wallpaper background as well. One UI 9 takes it to the next level with refinements.
Software update page
Samsung improved the software update interface in One UI 9. The new design retains One UI 8.5 aesthetics, with primary changes arriving in visuals. The software label has been updated to “One UI 9.0” and background image has been updated.
One UI 9 also retains One UI 8.5 floating buttons, via @Mohammed_K_2010. The software page brings two buttons on the top, one at each side. There’s a back button on the left and a hamburger menu on the right corner of the interface.
Image – Samsung updated software update page’s design in One UI 9
Samsung Internet
Samsung Internet, as always, is starting to receive major changes from the new operating system early. As discovered by the team at SammyGuru, the browser app has added a new “Compact” layout and integrates an “Ask AI” key.
Chrome remains the mobile browser king on Android, but Samsung is putting impressive efforts into upgrading its own version. The adoption of the Perplexity-powered Ask AI button is the latest example of the intense efforts.
Samsung Internet in One UI 9 | Credit – SammyGuru
With the internal firmware leaked, we expect more inputs and visuals to appear sequentially. The industry is currently busy with the Galaxy S26 series, which is set to launch on February 25 at a live Unpacked event in San Francisco.
Samsung is unveiling the Galaxy S26 Ultra next week, and your current Galaxy device can score you a decent exchange value. While official values will be disclosed after Unpacked, we now have estimated trade-in values of the top phones.
Reservations for the Galaxy S26 Ultra are already live, offering you a free $30 credit, enhanced exchange values, and entry into a $5,000 giveaway. If you plan an upgrade to the S26 Ultra, what should be the trade-in value?
We have a potential value.
Galaxy S series
Samsung phones lose resale value faster than Apple iPhone models. The situation of Google phones is even worse, and why shouldn’t it be?
If you own a recent Galaxy flagship, you are entitled to the maximum value. The older the Galaxy, the lesser the exchange value. Most owners of recent flagships, like the S24 Ultra, might not be planning a purchase this year.
Galaxy S22 Ultra – $210-$310
Galaxy S23 Ultra – $350-$400
Galaxy S24 Ultra – $700-$800
Samsung Galaxy S24 Ultra (left) and S25 Ultra (right)
Galaxy Z series
Samsung’s foldable phones are even more expensive than the top-tier Galaxy S device. Yet, the difference isn’t visible when it comes to exchange values. Your Ultra phone may earn you a little more than the pricey foldable.
Galaxy Z Fold 3 – $170-$270
Galaxy Z Fold 4 – $225-$325
Galaxy Z Fold 5 – $300-$400
Galaxy Z Fold 6 – $600-$700
These are estimated trade-in values that aren’t final. The final value depends on your phone’s physical and functional condition. A working phone with dents and scratches may harm its value even if it launched recently.
Who should upgrade this year?
Galaxy S26 Ultra is a great upgrade for those rocking an S23 Ultra or earlier flagship. If you’re on the S24 Ultra and want to move on from those sharp corners, you can consider upgrading to the Galaxy S26 Ultra this year.
Samsung is likely to offer a $150 discount during preorders. It could be available for those reserving the upcoming devices early. You may not need any trade-in to secure this discount; however, an official confirmation is awaited.
Samsung has done it again. With its latest 3GPP Excellence Award, Samsung now holds a record eight wins, the most of any player in the mobile standards arena.
On February 19, Samsung officially announced this historic achievement. It is a signal of who is quietly writing the rulebook for the next decade of wireless.
The honor went to Eko Onggosanusi of Samsung Research America, recognized at the 3GPP global standards meeting in Gothenburg, Sweden.
The 3GPP Excellence Award celebrates individuals who shape the technical backbone of global mobile networks. Onggosanusi’s work sits at the very core of that backbone: the physical layer of radio access networks, specifically RAN Working Group 1.
The innovative achievement will anchor the 6G experience. Industry discussions around 6G point toward immersive XR, holographic calls, and seamless 8K or even 16K streaming.
These use cases demand extreme data rates and near zero latency. The move comes at a time when early 6G research is shifting from whiteboard concepts to concrete technical proposals within 3GPP.
Through Samsung Research and its Standards and Mobility Innovation Lab, the company has consistently invested in upstream standardization.
Owning key contributions in MIMO means Samsung influences how chipsets, base stations, and handsets evolve across the ecosystem. 6G remains years away from rollout, with most forecasts placing initial deployments in the early 2030s.
Standards work today determines what those networks can do. Samsung is not waiting for the market to ask for 6G. It is building the blueprint.
Samsung has now shown Galaxy S26 AI image generation speed that’s insane. The new teaser highlights that the “Galaxy AI has learned some new tricks” and that’s where things get a lot more interesting.
In a new teaser, Samsung spotlighted the AI image generation speed of the Galaxy S26 series. It seems a showcase of the EdgeFusion technology that works behind the scenes to let users edit and create images on the fly.
We are seeing a strategic shift in Samsung’s marketing strategy. The focus has quietly shifted from Privacy Display to Galaxy AI. The company has recently revealed the Galaxy AI Camera capabilities and AI editing tools.
Now, Samsung is displaying the feature in action. The video shows giving a text prompt that extracts within a few seconds. A man is seen sitting comfortably, and he gives a text prompt – “Add party animals.”
Source – Samsung
While it’s a showcase of the AI feature, the execution is shown live in the scene rather than a device mockup. Shortly after giving the prompt, the system adds living dogs at all the appropriate places, and they look literally real.
Samsung confirmed it comes under the “next level of photo editing.” EdgeFusion works inside, letting users generate images on-device. The execution time has been improved significantly, with edits made in a few seconds.
Galaxy S26 series is set to be unveiled on February 25 in San Francisco. The pricing is expected to remain unchanged stateside. Reservations are live, offering a free $30 credit, up to $900 trade-in savings and $5,000 giveaway.
The WLFI price just ripped 25% higher intraday and no, it wasn’t random. A so-called “golden ticket” style invitation for an event at Mar-a-Lago flipped sentiment fast, and traders wasted no time piling in. Momentum didn’t just tick up. It exploded.
Futures Volume Goes Parabolic
Futures activity spiked 225%, with volume reaching $921.63 million. Open interest surged 58% to $288 million. That’s not subtle positioning that’s aggressive exposure.
And when leverage floods in, liquidations follow. Over the past 24 hours, total liquidations hit $2.34 million. Shorts took the bigger hit at $1.69 million, while longs saw just $649.33K wiped out. That imbalance tells you exactly who got squeezed as the WLFI price squeezed higher.
Well, here’s the kicker. On-chain data also showed a spike in daily active addresses. Most likely tied to the Mar-a-Lago event buzz, which features 38 speakers on the panel. Whether it delivers “market-shaping insights” or not, perception alone was enough to spark intraday demand.
Whales Accumulate, Exchanges Drain
Behind the scenes, bigger players appear to be stepping in. The 10 million-to-infinity holder cohort has been trending upward, suggesting whale accumulation during this surge. At the same time, exchange outflows flipped inflows which is never a neutral signal. Tokens are moving off platforms, not onto them.
That shift matters. It suggests the 25% move may not be purely speculative froth. If supply keeps tightening on exchanges while demand spikes, the WLFI price chart could reflect that imbalance quickly. But let’s be real. Intraday hype doesn’t automatically equal sustainable trend.
Key Levels on WLFI Price Chart
Technically, a wedge pattern is in play on the daily timeframe. The $0.100 zone has emerged as a key demand area, showing intraday support and reclaiming the 20-day EMA in the process.
If bullish momentum continues, clearing $0.140 becomes critical. That level dynamically aligns with the 50-day EMA band and could open the door toward $0.160 by month’s end.
So what’s next? Short term, the WLFI price prediction leans constructive as long as $0.100 holds. But zoom out, and the longer-term outlook still depends on broader demand expansion.
The event could be a catalyst or just a spark. Either way, for now, the WLFI price isn’t moving quietly.
The Bitcoin price is hovering in a range of $60K to $70K and quietly sketching a structure that feels eerily familiar. If this is a bullish divergence phase like the one after the 2021 crash, then the current Bitcoin price prediction might frustrate impatient bulls more than outright bears ever did.
First Top Shock Repeats
Based on an analyst theory, March 2021 gave us the first major top. Because at this time, the momentum overheated. Retail was euphoric. RSI stretched thin. Then the sharp correction arrived.
Fast forward to December 2024, First time the 2021 Ath was flipped. This became the first top of this cycle, after 2021 crash.
Then second top came in October 2025 when 126K was reached. Now in 2026, the structure is uncomfortably similar.
Markets cool off after vertical expansion. That’s not drama, it’s mechanics and how BTC price action has been. The level it holds points to two main theories, first failure to hold $60K and market crashes more and second it repeats what it did afterwards 2022.
Therefore, if price avoids slipping under $60K while forming a bullish RSI divergence, it would resemble the 2022 reset phase that followed the 2021 crash. Not identical. But close enough to raise eyebrows.
Second Peak, Weaker Momentum
Lets have a look at follow up momentum after each primary bullish rallies. In march 2021 the primary rally marked first top and October 2021 showed a follow up momentum that delivered the second top. It looked strong. It felt bullish.
But momentum was already weaker than the first peak. Then came those slow, grinding weeks of red candles.
Now if we look at October 2025. Then its second top again and like previous history the next RSI divergence seems like an option.
Since, history doesn’t replay perfectly. Still, it tends to rhyme and this one feels almost scripted only if $60K isn’t lost.
The Boring Base Phase
Similar to 2022 exhaustion phase where momentum was range bound which is often called boring phase.
Now this phase in 2026 seems like a possibility. As weekly RSI is hovering near zones that previously marked exhaustion again.
But this is boring phase that tests investors patience and filters out weak hands. So it isnt this easy to look at fireworks in BTC price.
This is the part nobody enjoys. Compression. Sideways drift. Narrative fatigue. But structurally, this is where long-term cycles tend to rebuild.
Well, here’s the kicker. The previous peak-to-new-ATH cycle took roughly 30 months. From the 2021 top to the 2024 breakout, so the key player here was time, not hype ans neither was the catalyst.
If the same rhythm applies from the October 2025 second top, then that stretches meaningful expansion toward 2027–2028 and most of the 2026 could pass in compression.
Even the projected $120K to $130K zone wouldn’t arrive tomorrow. It would arrive late, if we look at history.
So, what’s next? If history’s cadence holds, the Bitcoin price may simply be grinding through its “base-building” chapter. No collapse. No instant moonshot. Just time doing what it has always done to Bitcoin/USD compress first, expand later.
And if this cycle truly isn’t different, then the real Bitcoin price analysis suggests breakout might be delayed, not denied.
Samsung builds the most secure Android phones on the planet, yet its newest “Secure Chat” feature is not coming to Galaxy devices. It is for employees only.
Trusted news outlet Korea Herald reports that Samsung Electronics and other major Samsung Group affiliates have quietly rolled out a Secure Chat mode inside their in-house messaging platform to stop leaks.
Samsung Secure Chat mode
The feature arrives after multiple internal meeting materials, including executive-level instructions, surfaced on anonymous platforms like Blind almost in real time.
Once a chat room is marked Secure Chat, copy and paste is blocked. Message forwarding is disabled. Screenshots cannot be taken. Chat records cannot be saved to a personal PC.
Every protected room is clearly labeled, leaving no ambiguity about the restrictions in place. The controls operate at the system level, which means employees cannot bypass them with casual workarounds.
Samsung’s internal notice frames it as a dual mission: protect sensitive business information and shield employee privacy. The logic is simple: if redistribution is technically impossible, leaks become exponentially harder.
The irony will not be lost on Galaxy fans. Samsung Knox remains one of the strongest mobile security platforms in the consumer market, yet this highly restrictive chat protection is walled off from the public.
It turns out the underlying technology could easily align with One UI’s security stack. A future Galaxy S-series update could, in theory, introduce a consumer-facing Secure Chat toggle inside Samsung Messages or a partner app.
Samsung Galaxy phones are finally getting a new Google Play system update. Following the release of the One UI 8 update, Galaxy devices were stuck on older versions.
Samsung phones running One UI 8 have started receiving a new Google Play system update. The latest release installs the January 2026 version, which elevates Google Play and several core Android functions and security.
On the Google Play services side, three updates rolled out across the month.
The biggest quality-of-life addition is the ability to view transactions from other devices and online purchases made with virtual card numbers, right from Google Wallet. Wallet also gained the ability to create digital IDs on demand.
For anyone under 18, there’s now support for signing into Android Automotive devices under certain conditions, something that previously wasn’t possible at all.
Security got a notable bump too, with NFC security keys that support the CTAP2 standard now usable for account authentication across phones, tablets, TVs, cars, PCs, and Wear OS.
Your device can now back up logs in a way that’s tamper-resistant and limits who can access them. Data transfers between devices also got a compatibility improvement, and the supervision opt-out process was updated.
The Play Store saw a few smaller but noticeable tweaks.
Search results now collapse subtasks under the “Organized by AI” section. Game achievements can update in real time within the store. Besides, prize selection for certain promotions now lets you pick from multiple options.
Android System Intelligence added new language support for Message Armour. Android WebView shipped two updates (versions 144 and 145), both bringing the usual security patches, bug fixes, and new tools for developers building apps.
Here’s everything new in GPSY January 2026:
Android WebView v145 (2026-01-28)
Improvements to security and privacy and updates for bug fixes.
New developer features for Google & 3rd party app developers to support functionality related to displaying web content in their apps.
Important: Some features may be experimental and available to certain users.
Google Play services v26.03 (2026-01-26)
Account Management
[Wear] New developer features for Google and third party app developers to support Account Management related processes in their apps.
[Auto] With this update, Google Accounts for users under 18 that were unable to sign in to Automotive devices before can now sign in when specific conditions are met.
Security & Privacy
[Auto, PC, Phone, TV, Wear] This update allows account authentication through NFC security keys that support CTAP2.
Utilities
[Phone] You’ll get an improved compatibility when you move your data across devices.
Wallet
[Phone] You can now create digital IDs when needed.
[Phone] Bug fixes for Wallet related services.
Google Play Store v49.9 (2026-01-26)
[Phone] This update collapses subtasks in Organized by AI section in search results.
Android System Intelligence B.21 (2026-01-22)
[Phone] Message Armour new languages support; Maintenance changes.
Private Compute Services B.21 (2026-01-19)
[Phone] Maintenance changes.
Google Play services v26.02 (2026-01-19)
Account Management
[Phone] This feature updates the opt-out of supervision process and may require parental approval.
Developer Services
[Phone] New developer features for Google and third party app developers to support Location & Context related processes in their apps.
Device Connectivity
[Wear] This update adjusts text and icons in backup settings on Wear OS devices.
Security & Privacy
[Phone] With this new feature, your device securely backs up logs with privacy protection and tamper resistance, and limits access to the user.
System Management
[Auto, PC, Phone, TV, Wear] Bug fixes for System Management & Diagnostics related services.
Google Play Store v49.8 (2026-01-19)
[Phone] Adds support for real-time updates of unlocked game achievements in the Play Store.
Google Play services v26.01 (2026-01-12)
Developer Services
[Phone] New developer features for Google and third party app developers to support Location & Context related processes in their apps.
System Management
[Auto, PC, Phone, TV, Wear] Updates to system management services that improve Stability.
Wallet
[Phone, Wear] You can now view transactions from other devices and online purchases that use virtual card numbers.
Google Play Store v49.7 (2026-01-12)
[Phone] Allow users to select from multiple prizes instead of receiving a single one.
Android WebView v144 (2026-01-07)
Improvements to security and privacy and updates for bug fixes.
New developer features for Google & 3rd party app developers to support functionality related to displaying web content in their apps.
Important: Some features may be experimental and available to certain users.
Samsung’s One UI 8.5 Beta is still fresh on the Galaxy S25 series, yet attention is already drifting to One UI 9 user interface. That’s the nature of this ecosystem; the moment one beta stabilizes, whispers about the next major version begin.
Fresh images shared by TarunVats suggest One UI 9, which is expected to run on Android 17, could further improve the One UI 8.5 user interface.
The leaked Quick Share interface shows a more compact floating bar at the bottom. The tabs appear rounder, tighter, and visually more integrated with the overall layout. It is a small tweak, but it looks more refined than ever.
The bar does not just float; it almost blends into the content layer, creating a subtle sense of depth. A slightly slimmer, more rounded bottom bar frees up vertical real estate. It also adds a level of sophistication that feels closer to Samsung’s design.
That said, this is reportedly an early internal build. Samsung is known to pivot hard based on beta feedback. Features get toned down, shapes get flattened and animations get simplified.
Screenshots courtesy Tarun Vats, via SamMobile
The latest One UI 8.5 Beta introduced a subtle but meaningful visual shift. In a major design shift, the company has replaced the old rectangular bottom bars from One UI 8.0 with floating, pill-shaped tabs.
Samsung could double down on the rounded aesthetic. Or it could partially revert if usability concerns pop up. One UI 9 is widely expected to debut alongside the Galaxy Z Fold 8 and Z Flip 8 in the second half of the year.
India is not just a volume story anymore. It is quietly becoming a premium story. With Samsung facing a demand slowdown in the West, India looks like an impressive opportunity for the future.
According to EDaily, Samsung India posted revenue of 18.41 trillion won (around $12.7 billion) in 2025, with net profit hitting 1.54 trillion won (roughly $1.06 billion).
That is roughly 8 percent top-line growth and nearly 10 percent bottom-line growth year on year. In this climate, that is not a rounding error; that is momentum. That said, twenty trillion won in annual revenue is now within reach.
Counterpoint Research reported that smartphones priced above 30,000 rupees made up 22 percent of total shipments last year, an all-time high; an 11 percent jump in just one year. Samsung held 22 percent of the market by revenue.
Home appliances tell a similar story
Mordor Intelligence expects India’s major home appliance market to grow from about 54.6 billion dollars this year to nearly 72 billion dollars by 2031.
Samsung entered India when the country’s consumer electronics market was still forming. It stayed through currency crises, tax reforms, and brutal price wars. Now, as Western demand cools, that long patience looks more like foresight.
An industry insider noted, “Samsung Electronics has built an ecosystem spanning home appliances and smartphones through AI, giving it an advantage in targeting emerging markets,” adding, “India is likely to become a breakthrough for the home appliance and TV markets, which are facing structural downturns.”
Samsung just confirmed a massive benefit for its fans. Galaxy S26 buyers will get free double storage upgrade. The company has silently sweetened its reservation benefits in India, adding the storage upgrade freebie.
Galaxy S26 series – Free storage upgrade
Samsung’s storage upgrade promotion doesn’t need explanation. It’s pretty famous among the Galaxy fans worldwide. Despite DRAM and NAND flash costs skyrocketing, Samsung is keeping the famous perk alive.
Galaxy S26 buyers can purchase the 512GB variant while still paying for the 256GB. The Ultra version will be available in a 1TB model as well. That said, you can score 1TB by paying for the 512GB variant in India.
At present, the freebie is confirmed for India. Samsung should bring it to fans around the world, regardless of markets. It’s a silent engine that pushes the sales of newly launched Samsung flagship smartphones.
Source – Samsung India
Earlier, Samsung confirmed three major perks upon reservations. If you preorder the new Galaxy phones, you get an assured voucher worth INR 2,699. Lucky consumers win up to INR 5,000 voucher and entry in an INR 50,000 giveaway.
Value lock-in is a new promo added to the India store. It lets you lock in the exchange price of your current device. If you enroll for the program via WhatsApp, you will be able to grab the full exchange value during preorders.
Google I/O 2026 is official; keynotes are set for May 19 and 20 and Samsung fans typically watch from the sidelines.
For years, I/O has felt like a Pixel-first show. Google builds it, Pixel debuts it, and everyone else adapts later. Galaxy users get the features, but not the spotlight; meanwhile, this year feels different.
The reason is simple: AI, XR, and deeper platform control. All three directly affect One UI, Galaxy AI, and Samsung’s next hardware cycle. If you own a Galaxy device, this keynote is not just background noise; it is early intel.
Android 17
Google pushed the first Android 17 Beta on February 13. As expected, it tweaks system defaults, improves navigation behavior across foldables and slabs, refines color profiles, and adds smarter device pairing.
The bigger narrative is design direction. Rumors suggest Android 17 may experiment with a more “liquid glass” aesthetic. Think softer layers, more depth, more translucency. Google rarely lands a final look in Beta form.
Image – Google I/O 2026
One UI historically absorbs Google’s visual cues and reshapes them with Samsung’s own design language. Expect the One UI 9 to take whatever Android 17 experiments with and refine it for Galaxy foldable phones.
Gemini
At I/O 2026, Gemini will dominate the stage. Expect tighter integration across apps, Chrome, and possibly even more cross-device continuity.
If Google announces expanded Gemini APIs or new on-device AI capabilities, the Galaxy S26 series could be first in line to take advantage. If Gemini becomes more context-aware across apps, Samsung can localize that experience inside One UI.
Gemini integrating with Apple’s ecosystem this year shows Google is platform-agnostic when it wants to be. Expect Samsung to further differentiate Galaxy AI, even if Gemini powers part of it.
XR
Google will likely provide updates on Android XR.
I/O 2026 kicks off at 10 a.m. PST on May 19 at Shoreline. The keynote will be livestreamed, talking about AI, Android, Chrome, and cloud initiatives. For the Samsung fans, this is not just Google’s show, but a preview of the next upgrade cycle.
Samsung has started teasing what could be the most software-heavy camera shift in Galaxy history. Galaxy S26 series keeps the majority of the camera hardware unchanged, and the 2026 upgrade is realized by AI features.
Ahead of Galaxy Unpacked on February 25, 2026, in San Francisco, Samsung is previewing a unified Galaxy AI camera experience for the Galaxy S26 series.
The pitch is simple on paper: capture, edit and share in one frictionless flow. No jumping between apps, nor exporting files just to fix exposure or crop out distractions. Every brand says something similar, but Samsung is adding a twist.
Samsung describes it as a multimodal system, meaning you can interact with the camera and editing tools more naturally, whether that is through text prompts, context-aware suggestions, or smart post-processing.
Galaxy S26’s biggest camera upgrade
Galaxy S26 will allow users to turn a bright daytime shot into a convincing night scene. Not just darken the frame, but rebuild it with realistic lighting and atmosphere.
It can also restore missing details in photos, which suggests aggressive computational reconstruction when highlights are blown out or shadows are crushed.
There is also multi-photo merging, combining several shots into one final image directly on the device. These tools are apparently powered by Samsung’s new EdgeFusion technology.
Samsung appears to be betting that software, not silicon alone, will carry the Galaxy S26 camera story. It is a clear signal that the company sees AI-driven post-processing as its edge against rivals.
If the company nails the unified flow, where capture, AI enhancement, and sharing feel like one continuous motion, it could reduce friction in a way that matters more than a few extra megapixels ever will.
We will see the full end-to-end Galaxy camera experience next week at Galaxy Unpacked in San Francisco.
Samsung Galaxy S26 series is equipped with creative AI capabilities. Galaxy Unpacked is set to be held next week. Meanwhile, Samsung has now previewed some of the upcoming Generative AI features of the devices.
Galaxy S26 series features the most cohesive camera experience. We will discuss the potential camera upgrades in a different post. Samsung revealed so much about the camera improvements of the new flagships.
Samsung released three videos that display image editing, including AI (artificial intelligence) generation. While the company stayed silent on the tech, the new editing experience is powered by EdgeFusion technology.
EdgeFusion solution is the key driver behind Galaxy S26’s upgraded AI editing experience. It ensures on-device AI image editing and generation. The execution time is merely seconds, elevating your everyday experiences.
In the videos released, Samsung showcased fixing missing objects, generating objects and transforming pictures. These creative capabilities once required professional skills or hours of editing.
Samsung says such editing is now possible on the new Galaxy phones in minutes. Beyond that, the entire system is supported by Natural Language, meaning you can ask the phone what to do in your own words.
The first video shows Galaxy AI bringing back an eaten bite to the cupcake in seconds. The picture doesn’t lose its aesthetics, feel, or shape, all natural.
Another video previews the AI-powered Sketch to Image generating a UFO in the sky. A simple sketch in the sky shot has turned into a real element.
Lastly, a picture of a dog has turned into a beautiful sticker pack. It not only keeps the primary aesthetics at the center but also generates stickers in different poses and moods.
Analysts predict PEPE could reach $0.0000539 by 2026.
Long-term forecasts suggest potential highs of $0.0002733 by 2030.
Pepe Coin (PEPE), the memecoin inspired by the iconic frog meme, has rapidly become a standout in the crypto world. Ranked just behind Dogecoin and Shiba Inu, PEPE’s explosive rise—boasting gains of over +130325085.96% from its all-time low—has captured investor attention globally.
As it maintains its position among top memecoins, many are now asking: Will PEPE price go parabolic by the end of 2025? In this article, explore CoinPedia’s in-depth PEPE coin price prediction for 2025, and discover long-term forecasts that look ahead to 2030.
PEPE’s price has faced challenges due to low liquidity and cautious investor sentiment, a trend that has continued into Q1 2026. A price increase is possible in the remainder of Q1 2026 if new capital enters the market, especially given the recent tightening of the PEPE/USD trading range. However, if this influx of capital does not occur, a decline toward $0.00000120 could be likely.
PEPE Price Prediction 2026
PEPE’s price has struggled in Q4 2025 due to low liquidity and cautious investor sentiment. This has continued in January 2026, and February is following that cautious investor, too.
The broader market is in an extreme fear phase, and prices are collapsing. However, if new capital flows in, a price rise is likely in the rest of Q1 2026, as this outlook is supported by a tightening trading range, which indicates a potential breakout more than ever. The PEPE price has faced challenges for several months, falling short of the expectations set by experts and investors alike, primarily due to an overarching risk-off sentiment within the memecoin space.
However, it’s essential to acknowledge that the current low market liquidity and cautious investor behavior have kept new capital on the sidelines amid a series of bearish trends.
Nevertheless, it is also a fact that entering the crypto market through memecoins remains one of the most accessible and easiest methods available. Therefore, should new liquidity begin to flow in, we can undoubtedly anticipate a bigger rise in PEPE’s price. Q1 2026 stands out as an ideal timeframe for this potential resurgence, and the compression of the falling wedge shows compression of the trading range that confirms the effectiveness and reliability of these trendlines that have been containing the price of PEPE since 2025, and the odds of a rally to pop out soon have greatly risen.
But, if it fails and collapses, then a decline toward $0.00000120 is expected, where we saw a rally sprouting back in early 2024.
PEPE On-Chain Outlook
As per the metric “90-day Spot Taker CVD”, the cumulative difference between market buy and market sell volumes has turned positive and is increasing, indicating that high-conviction traders are aggressively market-buying PEPE rather than waiting for passive fills at lower prices.
This aggressive participation is a hallmark of a robust accumulation phase, in which market demand begins to outpace available liquidity, often serving as a precursor to a volatile price expansion.
Given that similar green clusters on the historical chart preceded significant rallies in mid-2024 and mid-2025, the current uptick suggests that “smart money” is positioning for a major move as the asset stabilizes near its current support levels in January 2026.
PEPE Price Prediction 2026 – 2030
Year
Potential Low ($)
Potential Average ($)
Potential High ($)
2026
0.0000179
0.0000359
0.0000539
2027
0.0000269
0.0000539
0.0000809
2028
0.0000404
0.0000809
0.0001214
2029
0.0000607
0.0001214
0.0001822
2030
0.0000910
0.0001822
0.0002733
This table, based on historical movements, shows PEPE price to reach $0.0002733 by 2030 based on compounding market cap each year. This table provides a framework for understanding the potential PEPE price movements. Yet, the actual price will depend on a combination of market dynamics, investor behavior, and external factors influencing the cryptocurrency landscape.
Pepecoin Price Forecast 2026
Our PEPE price prediction suggests that the price of PEPE in 2026 might range between $0.0000179 and $0.0000539, with the average price of the meme coin at $0.0000359.
Pepe Coin Price Prediction 2027
For 2027, we predict that the price of PEPE could range between $0.0000269 and $0.0000809, and the average price of the meme coin is expected to be around $0.000539.
Pepecoin Price Targets 2028
As per our Pepe Coin Price Prediction, in 2028, the price could range between $0.0000404 to $0.0001214, with the average price of the meme coin at $0.0000809.
Pepecoin Price Projection 2029
For 2029, the price of PEPE could range between $0.0000607 and $0.0001822, with the average price of the meme coin expected to be around $0.0001214.
Pepe Coin Price Prediction 2030
Based on our Pepecoin price forecast, the price of PEPE in 2030 might range between $0.0000910 to $0.0002733, with the average price of the meme coin predicted to be around $0.0001822.
PEPE Coin Market Analysis
Firm Name
2026
2030
Changelly
$0.0020
$0.015
CoinCodex
$ 0.000026
$ 0.000047
Binance
$0.000014
$0.000017
Never Miss a Beat in the Crypto World!
Stay ahead with breaking news, expert analysis, and real-time updates on the latest trends in Bitcoin, altcoins, DeFi, NFTs, and more.
FAQs
How much is Pepe coin worth?
The current price of Pepecoin is $ 0.00000440.
What factors could drive PEPE’s price growth in the coming years?
PEPE’s price depends on meme coin market sentiment, liquidity inflows, social media trends, and broader crypto cycles rather than fundamentals alone.
Is PEPE a high-risk investment compared to other cryptocurrencies?
Yes. As a meme coin, PEPE is highly volatile and sentiment-driven, making it riskier than utility-based cryptocurrencies with real-world use cases.
How does PEPE compare with Dogecoin and Shiba Inu?
PEPE competes mainly on community hype and trading momentum, while DOGE and SHIB benefit from longer histories and broader ecosystem support.
What is PEPE price prediction for 2026?
PEPE could trade between $0.0000179 and $0.0000539 in 2026, depending on meme coin demand, liquidity inflows, and overall crypto market momentum.
What is PEPE price prediction for 2027?
In 2027, PEPE may range from $0.0000269 to $0.0000809 if bullish sentiment and retail participation remain strong across meme coins.
What is PEPE price prediction for 2028?
PEPE’s price in 2028 could move between $0.0000404 and $0.0001214, driven by broader market cycles rather than project fundamentals.
What is PEPE price prediction for 2030?
By 2030, PEPE could reach up to $0.0002733 in optimistic scenarios, though prices will remain highly sensitive to market sentiment and risk appetite.
Price predictions for 2026 range from $0.80 to $4.15.
Long-term forecasts suggest ONDO could reach $9.30 by 2030.
ONDO Finance in the RWA sector is a hot topic, investors are closely eyeing its future potential. Especially as its native token ONDO continues to build credibility and momentum through high-profile developments.
Moreover, Ondo Finance is known to be a leading RWA provider on the Solana chain and it is witnessing growing institutional interest, ONDO has solidified itself as a major player in the Real World Asset (RWA) space.
With such attraction, the ONDO price prediction 2026 is what analysts and retail investors are intrigued about. But how far can it go from here? Let’s dive into the detailed ONDO price forecast from 2025 to 2030.
ONDO/USD has been declining since early 2025, reaching a support level around $0.20 in February 2026. A potential reversal may occur if it breaks the $0.60 resistance. Key targets for Q1 2026 are $0.80 and $1.20.
ONDO Price Prediction February 2026
On the daily chart, the ONDO price fall continued in January and February, and also began on a bearish note. But since mid-February, it has shown bullish momentum after retesting the lower boundary of the falling wedge pattern. Also, the falling wedge range is narrowing, and ONDO/USD is rising from a key support level. February could see a revisit to the $0.50-$0.60 range. If it breaks above this range too, then it may aim for $0.80, which could be a significant target. However, if it fails to do so, the price may continue to consolidate around the support level or potentially decline further.
ONDO Price Prediction 2026
The weekly chart for ONDO/USD shows a declining trend since the start of 2025, following a high of $2.14. The descending trendline acted as a strong hurdle, characterized by lower highs and lower lows in price action, indicating reduced price volatility. The persistent bearish pressure on the weekly chart signals bear dominance.
The same price fall continued in Q1 2026, and January and early February have taken a severe hit, but it has reached February 2024, based on support around $0.20 in early February 2026, and some bullish reaction is also caught, which indicates that a reversal may be possible before Q1 completes in March 2026.
Looking ahead to the first quarter of 2026, the market may be ready for a rally, especially if it breaks through the $0.50-$0.60 resistance. The recent establishment of $0.20 as a support level, along with increased demand for ONDO, suggests that buyers may be willing to re-enter the market at this price.
If the market surpasses this hurdle, the next big targets for ONDO/USD would be $ 0.80 and $1.20 for Q1 2026.
ONDO Price Analysis: Onchain Outlook
The on-chain data indicate that although the price is currently capped and has been consolidating for several months, the on-chain metrics have strengthened significantly despite the weak ONDO price action. Since January 2024, the number of confirmed transactions sent to a project’s contracts has increased. By December 2025, the project had surpassed 1.3 million transactions, making it the second-largest project for real-world asset (RWA) issuance after BitGo.
Additionally, the “Spot Average Order Size” maintains high levels (represented by green dots) while the price is declining; it is a classic signal of Whale Absorption. Therefore, this Consistent whale activity confirms institutional conviction in the RWA (Real World Asset) sector.
ONDO Cryptocurrency Price Target 2026 – 2030
Year
Potential Low ($)
Potential Average ($)
Potential High ($)
2026
1.65
2.75
4.15
2027
2.20
3.65
5.25
2028
2.95
4.30
6.90
2029
4.75
5.60
8.45
2030
5.35
7.45
9.30
Ondo Coin Future Forecast 2026
The price projection of ONDO crypto for 2026 could range between $0.20 to $2.15, with an average trading price of roughly $1.25.
Ondo Token Price Prediction 2027
This altcoin could hit a potential high of $5.25 in 2027, with a potential low of $2.10, and an average price of $3.65.
ONDO Price Prediction Next Bullrun 2028
By 2028, forecasts indicate a potential low of $2.95 and a high of $6.90. This could bring the average price to $4.30.
Ondo Price Forecast Long-term 2029
During 2029, the price of the Ondo token is anticipated to reach a minimum of $4.75, with a maximum of $8.45, and an average price of $5.60.
ONDO Coin Price Growth Potential 2030
ONDO coin price may reach a high of $9.30 in 2030. With a potential low of $5.35. With this, the average price could settle at around $7.45.
Market Analysis
Firm Name
2025
2026
2030
Changelly
$1.32
$1.87
$8.26
priceprediction.net
$1.34
$2.03
$8.43
DigitalCoinPrice
$2.01
$2.29
$5.01
Never Miss a Beat in the Crypto World!
Stay ahead with breaking news, expert analysis, and real-time updates on the latest trends in Bitcoin, altcoins, DeFi, NFTs, and more.
FAQs
How much is Ondo crypto worth today?
At the time of writing, the price of the Ondo token was $ 0.27589182.
What is the ONDO price prediction for 2026?
ONDO price in 2026 is projected to range between $1.65 and $4.15, with an average near $2.75 if RWA adoption continues to grow.
Is Ondo Finance a good long-term investment?
Ondo Finance shows long-term potential due to strong on-chain growth and its leading role in the real-world asset sector, though market risk remains.
What is the Ondo price prediction for 2030?
By 2030, ONDO price could reach up to $9.30, with sustained growth driven by institutional adoption and expansion of tokenized assets.
Price prediction for 2026 suggests a potential high of $55.
Long-term forecasts indicate LINK could reach $195 by 2030.
Chainlink has emerged as a game-changing decentralized oracle network, enabling smart contracts to connect seamlessly with real-world data, APIs, and traditional financial systems. As the crypto market evolves, Chainlink’s role continues to expand, especially with its Cross-Chain Interoperability Protocol (CCIP) gaining traction. Its native token, LINK, not only powers the ecosystem but has also caught the attention of investors and analysts. As a result, institutional interest surged, leading to the launch of the LINK ETF by Grayscale in early December 2025.
With LINK price showing signs of a potential breakout and strong on-chain fundamentals backing its rise, the big question remains: Can LINK coin price hit $50 in December 2025? Let’s dive into this detailed Chainlink price prediction 2026–2030 to find out.
Chainlink (LINK) is currently around $8.50, and odds suggests a dip to crucial support between $4.15 and $6.05 is highly likely if bearish sentiment elevates more. In shortterm, from $8.50 bulls may try a fight to $12 or $15, but persistent bearish pressure might lead it back to the lower range.
Chainlink Price Targets February 2026
In January, the LINK price struggled to maintain the $13 level and dropped to $7 by early February. However, it has made a slight recovery and is attempting to stay above the $8.50 range. If it can establish this level as support, a rise back to $12 or $15 may be possible. Conversely, if it fails to hold above $8.50, the price could fall to the last line of defense, which is between $4.15 and $6.05.
Chainlink Price Prediction 2026
The weekly chart highlights an important price range for Chainlink (LINK) between $4.15 and $6.05. For many years, this range has provided crucial support, preventing the price from declining further.
In 2023, the price surged from this range, reaching a high of $31 by late 2024. However, bearish market conditions took over, leading to a consistent decline from 2025 onward. Early 2026 continued this downward trend, with the price now struggling around $8.50.
This support level is significant in the short term, as a reversal from this point could lead to a retest of the $12 or $15 levels. Historically, prices do not drop straight down without a challenge from bullish investors. However, if selling pressure remains strong and demand fails to meet expectations, the price may approach the $4.15 to $6.05 demand area again.
Looking ahead, the Chainlink price prediction for 2026 indicates the potential for a significant price surge similar to the explosive rally observed in 2020. Analysts suggest that if momentum and market sentiment align positively, the price could see a reversal, but it would take time to process that kind of price action.
Year
Potential Low ($)
Potential Average ($)
Potential High ($)
2026
35
50
55
Chainlink On-Chain Analysis
In the LINK on-chain metrics, both spot and futures markets are clearly exhibiting a Taker Buy-Dominant phase. It shows that buyers are actively executing at market prices without waiting for pullback opportunities. This is simply a strong sense of conviction rather than speculative strategies.
Additionally, the Average Order Size in both the spot and futures markets has escalated into the “Big Whale” category. This shift signals the involvement of institutional participants, who significantly influence LINK’s market structure, rather than retail trading flows.
Chainlink Price Targets 2026 – 2030
Year
Potential Low ($)
Potential Average ($)
Potential High ($)
2026
35
50
55
2027
48
64
80
2028
58
85
104
2029
70
108
141
2030
85
147
195
This table, based on historical movements, shows Chainlink price to reach $195 by 2030 based on compounding market cap each year. This table provides a framework for understanding the potential LINK price movements. Yet, the actual price will depend on a combination of market dynamics, investor behavior, and external factors influencing the cryptocurrency landscape.
LINK Crypto Price Forecast 2026
As per Chainlink’s Price forecast for 2026, the high price could be $55, the low may reach $35. This makes the average around $50.
LINK Price Prediction 2027
Moving to 2027, the LINK Price projects that it might hit a high price of $80 potentially. With a $48 low and an average of $64.
Chainlink Price Analysis 2028
Moving to 2028, the Chainlink Price Forecast predicts a high price of $104. On the flip side, the low may fall to $58, and the average is projected to be around $85.
LINK Coin Price Prediction 2029
As per Chainlink Price Forecast 2029, LINK’s high price is predicted to be $141, with a low of $70 and an average of $108.
Chainlink Price Prediction 2030
Finally, as per the Chainlink Price Forecast 2030, LINK’s price can reach a high price of $195. With a low of $85 and an average of $147.
Market Analysis
Firm Name
2026
2030
Changelly
$25.83
$140.70
coincodex
$6.44
$14.79
Binance
$18.43
$22.40
Mitrade
$32.22
$139.2
Investing Haven
$54.10
$80
Flitpay
$62.6
$110
*The aforementioned targets are the average targets set by the respective firms.
Never Miss a Beat in the Crypto World!
Stay ahead with breaking news, expert analysis, and real-time updates on the latest trends in Bitcoin, altcoins, DeFi, NFTs, and more.
FAQs
How much is Chainlink worth?
At the time of writing, the value of one LINK crypto token was $ 8.85819606.
What is the price prediction for Chainlink in 2026?
Chainlink price prediction for 2026 suggests LINK could trade between $35 and $55, with an average price near $50 under bullish conditions.
How much will 1 Chainlink be worth in 2030?
By 2030, 1 Chainlink could be worth between $85 and $195, depending on adoption, market cycles, and long-term crypto growth.
Where will Chainlink be in 5 years?
In five years, Chainlink is expected to be a core Web3 infrastructure, with broader adoption and a potential price range of $80–$140.
Is Chainlink a good long-term investment?
Chainlink is considered strong long term due to its real-world utility, oracle dominance, institutional adoption, and expanding cross-chain ecosystem.
What factors influence Chainlink price predictions?
LINK price is driven by oracle demand, CCIP adoption, staking growth, institutional interest, crypto market cycles, and global liquidity trends.
The HBAR price is trying to look resilient at $0.100, but the derivatives market isn’t buying the optimism. Beneath the surface, funding data and futures positioning suggest traders are still leaning bearish even after last week’s headline boost.
Funding Flips, Bears Take Control
Let’s start with the mood check. According to Coinglass OI-weighted funding rate data, the metric still turned negative on Monday and stands at -0.0048% on Tuesday. That may look minor, but it tells a clear story that short sellers are paying longs. In other words, more traders are betting on downside than upside.
That shift matters. As negative funding rate often reflects sustained bearish positioning, and right now it suggests that confidence in a rebound is thin. The broader HBAR price chart mirrors this hesitation, with upside attempts struggling to gain traction beyond short-term bounces.
Meanwhile, futures open interest has slid to $108.82 million, continuing a steady decline. Falling OI typically signals waning participation. Traders are stepping back. Liquidity is thinning. And that’s rarely a sign of aggressive accumulation.
FedEx Boost, Short-Term Spark
Now here’s where it gets interesting. After the announcement that FedEx would join the Hedera Council, the HBAR price caught a short-term bid and pushed back toward the $0.100 level. That kind of corporate association tends to generate headlines and, briefly, demand.
But let’s be real: price reaction alone doesn’t erase broader sentiment.
ETF flows aren’t providing much backup either. The last recorded inflows were close to $1 million on February 6. Since then? Nothing. In fact, most trading days since launch have seen zero inflows, with only a handful posting positive numbers. That’s hardly the kind of consistent institutional appetite that shifts a trend.
So while the FedEx development last week added a spark, it hasn’t translated into sustained capital rotation into HBAR/USD markets.
The $0.150 Survival Zone
Technically, $0.150 is shaping up as the line in the sand. If HBAR price prediction manages to climb back toward that zone from CMP of $0.100, it could act as a short-term magnet. But indicators suggest the move may face exhaustion there. RSI currently sits at 52.07 neutral territory, but with room to stretch. A push toward $0.150 could drive it into overbought conditions.
At the same time, CMF at -0.02 shows tentative recovery, yet similar setups in July and October stalled between $0.14 and $0.18 before price rolled over again. That historical context weighs on any aggressive HBAR price prediction.
Interestingly, AO and MACD are showing growing bullish momentum, though both remain below the zero line. That suggests upside potential may continue at least until major resistance is tested.
So what’s next? If the HBAR price breaks and sustains above $0.150 in Q1 2026, the structure could shift. But if it remains suppressed beneath that ceiling, the probability of further lows stays firmly on the table.
Bitcoin is currently trading at: $ 67,985.66802674
Predictions suggest BTC to hit $150K to $250K before 2026 ends.
Long-term forecasts estimate BTC prices could hit $900K by 2030.
After a historic 2025 that saw Bitcoin shatter records and flip the legendary $125,000 mark, the market has taken a sharp, cooling turn. The early weeks of 2026 have been defined by a “sell-the-news” reality check, leaving many to wonder if the bull run has finally run out of steam or if we are simply witnessing the ultimate “buy the dip” opportunity.
The landscape has shifted. With a pro-crypto administration in the White House and institutional giants like MicroStrategy and Metaplanet treating BTC as a foundational reserve asset, the rules of the game have changed. No longer just a speculative play for retail traders, Bitcoin is now a geopolitical chess piece and a corporate balance sheet staple.
But as the price tests crucial support levels, the big question remains: Is this a temporary correction before a march toward $200,000, or the start of a long-term reset?
In this deep dive, we break down the Bitcoin price prediction for 2026–2030, exploring the massive trends, regulatory shifts, and institutional moves driving this historic cycle. If you want to know where the floor is and how high the ceiling goes. read on for the full scoop.
Coinpedia’s BTC Price Prediction 2026
In early 2026, Bitcoin is in a correction phase after peaking at around $126,296 in October 2025. A potential bottom may occur around December 2026, with significant support expected between $25,900 and $30,350. Historical trends suggest this decline could reach 70%-76%, potentially bringing Bitcoin down to the lower border of the ascending broadening wedge’s support. This period may mark the end of the bear market, with 426 days in total, similar to historical correction periods, and pave the way for a rally in the next year.
What is the Bitcoin price prediction for today?
The BTC price may range between $66,452.48 and $68,269.03 today.
As of February 2026, the price of Bitcoin is currently hovering between $66,000 and $70,000, following a significant decline from its late January support near $87,000. In the near term, the support level at $60,000 is critical for preventing Bitcoin price from dropping to lower price points.
The recent consolidation suggests a potential relief rally that could probably target the $92K and $97K marks. For now, short-term sentiment appears to be shifting towards bullish, as the Crypto Fear and Greed Index has recovered from 5 to 14. Although it still indicates a status in the Extreme Fear zone, but it could move toward the neutral area if short-term demand drives a relief rally.
Additionally, the 50-day EMA is currently below the 200-day EMA, indicating that a death cross still in play and has been in effect since mid-November. Also, a shorter-term death cross between the 20-day and 50-day EMA bands occurred in late January, further reinforcing the prevailing bearish trend.
Meanwhile, February initially saw volatility, and now this choppy market behavior may continue until there is a significant return of buyers. If buyers re-enter the market in substantial numbers, the primary target for February is projected to be $78,000, with a secondary target of $92,000 in the short term, potentially extending to $97,000, which was the high in mid-January 2026.
Although the bearish market structure remains dominant, any potential shift towards a bullish trend will depend on overcoming the 200-day EMA. Until such a breakthrough occurs, the overall long-term market outlook will remain bearish.
Bitcoin Price Prediction 2026
The current price action in early 2026 confirms that Bitcoin price is following a well-defined historical rhythm within its long-term ascending wedge. After reaching a peak of approximately $126,296 in October 2025, the market has entered a significant correction phase.
This peak was not accidental; it represented a direct hit on the upper resistance boundary of the wedge pattern that has governed Bitcoin’s macro price action for years. Historically, these touches lead to extended periods of decline the first major crash from $21,000 lasted 427 days, while the second from $69,000 lasted 426 days. If this 14-month corrective cycle holds true, we are looking at a “target date” for a definitive bottom around December 2026.
The intensity of the sell-off in February 2026 was largely driven by a failure to reclaim the $87,800–$92,950 supply range. According to the anchored volume profile, this zone represented the highest momentum area of the previous bearish move, and once it flipped from support to resistance, the downward pressure has accelerated. Since markets don’t go straight, there will be attempts to rise in the name of relief rallies, and the nearest relief rally could come targeting $97K, but the likelihood is high that these will occur in the future as fakeouts and result in further decline.
As we look toward the remainder of 2026, the charts suggest that the most significant high-momentum demand area sits much lower, specifically between $25,900 and $30,350.
This range represents a crucial “interest zone” where institutional buyers previously stepped in and where the lower support of the ascending wedge is likely to converge by year-end.
Statistically, Bitcoin’s major crashes have shown a trend of diminishing returns in terms of percentage drawdowns. The late 2017 onwards crash saw an 87.25% decline, and the 2022 crash reached 78.65%. Following this trajectory of “dampening volatility,” the current third crash is projected to result in a 70%-76% approx decline. From the $126,000 ATH, a 76% correction would push the price toward that critical $30,000 region.
Consequently, the prediction for December 2026 is a final test of the wedge’s lower border within this demand zone, marking the end of the current bear cycle and setting the stage for the next period of accumulation and next big rally could occur in 2027 onwards.
BTC Price Indicator Analysis 2026
Similarly, the technical indicators shows that Bitcoin price has already entered a danger zone we haven’t seen in years. On a deeper look at the monthly RSI, BTC has a legendary track record of never hitting “oversold” levels; it usually bottoms out right around the 40 mark. Right now, we’re sitting at 44.49 and sliding fast. This isn’t just a dip it’s the classic signal that the bearish momentum is finally taking over and heading for that historical floor.
The indicators under the hood are screaming the same thing. The MACD has already locked in a bearish cross, and the gap between the lines is widening. In past crashes, the selling hasn’t stopped until those lines flattened out near the zero mark. We aren’t even close to that “exhaustion” point yet, meaning there is plenty of room for this to bleed out further.
Even the “smart money” indicator (CMF) is still showing positive inflows for now, but that’s actually the scary part. Once that green line snaps below zero and heads toward -0.20, that’s when the real panic hits. We aren’t at the end of the crash; we’re in the middle of it. Don’t mistake this for exhaustion, as the collapse toward the pattern’s lower border would soon intensify.
Month
Potential Low
Potential Average
Potential High
2026
$30,000-$45,000
$90,000 – $101,000
$115,000 – $118,000
Bitcoin Price On-chain Outlook
Liquidation data shows roughly $5.81 billion on the short side, compared with just over $380 million on the long side. That imbalance matters because it’s completely dominated by bears and bulls, with no room for survival. It suggests traders are leaning into weakness rather than preparing for a sustained rebound.
In other words, the futures market isn’t buying the bounce. It’s betting against it.
And if BTC price drifts lower again, that heavy short positioning could amplify volatility rather than cushion it. This is why any BTC price prediction right now carries asymmetric risk.
Moreover, the BTC long-term holder SOPR chart shows a current value of 0.7, which is below 1, indicating that more long-term investors are selling at a loss. And it’s seen when more holders keep selling at a loss, this metric has a history of hitting the 0.2-0.3 mark, which has truly seen a fresh demand. For now, the long-term trend is more bearish.
Recent Events Affecting Bitcoin’s Price
The transition from late 2025 into early 2026 saw Bitcoin flip from a booming success story into a struggling “bear market.” After hitting its peak in October, the excitement cooled off fast as the fundamental pillars holding up the price began to crumble at the same time.
By December, the “cheap money” era felt officially over. The Federal Reserve confirmed that high interest rates weren’t going anywhere, and the nomination of Kevin Warsh to replace Jerome Powell signaled a shift toward even tighter financial discipline. This left investors spooked, fearing a future without the safety net of central bank support.
The situation worsened in January when big institutional players started pulling their money out of spot ETFs to lock in profits. At the same time, rising tensions between the U.S. and Iran proved that Bitcoin isn’t yet seen as a “safe haven” but investors ditched crypto for actual gold to avoid the risk.
Finally, a “double blow” of bad news drained what was left of the market’s momentum. Crucial crypto legislation, the CLARITY Act, got stuck in the Senate, leaving the industry in legal limbo. Meanwhile, new fears about quantum computing threats to blockchain security started to circulate. Together, these events broke the market’s confidence, pushing the price toward the lower end of its long-term trend.
Bitcoin Crypto Price Prediction 2026 – 2030
Year
Potential Low ($)
Potential Average ($)
Potential High ($)
BTC Price Forecast 2026
150K
200K
230K
BTC Price Prediction 2027
170K
250K
330K
Bitcoin Predictions 2028
200K
350K
450K
BTC Price 2029
275K
500K
640K
Bitcoin Price Prediction 2030
380K
750K
900K
BTC Price Forecast 2026
The BTC price range in 2026 is expected to be between $150K and $230K.
BTC Price Prediction 2027
Subsequently, the Bitcoin price range can be between $170K to $330K during the year 2027.
Bitcoin Predictions 2028
With the next Bitcoin halving, the price will see another bullish spark in 2028. Specifically, as per our Bitcoin Price Prediction, the potential BTC price range in 2028 is $200K to $450K.
BTC Price 2029
Thereafter, the BTC price for the year 2029 could range between $275K and $640K.
Bitcoin Price Prediction 2030
Finally, in 2030, the price of Bitcoin is predicted to maintain a positive trend. Indeed, the BTC price is expected to reach a new all-time high, ranging between $380K and $900K.
Based on the historic market sentiments and trend analysis of the largest cryptocurrency by market capitalization, here are the possible Bitcoin price targets for the longer time frames.
Year
Potential Low ($)
Potential Average ($)
Potential High ($)
2031
$540,830.43
$901,383.47
$1,261,936.86
2032
$757,162.60
$1,261,936.86
$1,766,711.60
2033
$1,059,945.80
$1,766,711.60
$2,473,477.75
2040
$5,799,454.28
$9,665,757.13
$13,532,059.98
2050
$161,978,188.65
$269,963,647.74
$377,949,106.84
Bitcoin Prediction: Analysts and Influencers’ BTC Price Target
“Jack Dorsey, former Twitter CEO (now X), predicts Bitcoin could exceed $1 million by 2030 due to its ecosystem growth and increasing adoption.”
Cathie Wood, CEO of Ark Invest, projects Bitcoin to reach $1.5 million by 2030, driven by institutional adoption and its position as digital gold.”
“Wall Street broker Bernstein believes 2026 will mark the start of a tokenization “supercycle,” maintaining its $150,000 Bitcoin price target for this year and $200,000 for the 2027 cycle peak.”
“Brad Garlinghouse, the Ripple CEO, predicts Bitcoin will hit $180,000 in 2026, due to favorable market and regulatory conditions.”
Never Miss a Beat in the Crypto World!
Stay ahead with breaking news, expert analysis, and real-time updates on the latest trends in Bitcoin, altcoins, DeFi, NFTs, and more.
FAQs
What are the biggest risks to Bitcoin’s price in 2026?
Major risks include global recessions, tighter crypto regulations, declining liquidity, or a sustained breakdown below key support levels.
How much will BTC be worth in 2030?
Bitcoin price forecasts for 2030 range from $380K to $900K, driven by scarcity, long-term adoption, and expanding institutional participation.
What will be the price of Bitcoin in 2050?
While uncertain, many long-term projections suggest Bitcoin could exceed $1 million by 2050 if it becomes a global store of value.
Is Bitcoin still a good hedge against inflation in the long term?
Bitcoin’s fixed supply makes it attractive as an inflation hedge, especially during currency debasement and long-term economic uncertainty.
The live price of the Cardano token is $ 0.28065516.
Price prediction suggests potential to reach $2.75 to $3.25 by year-end 2026.
Long-term forecasts indicate ADA could hit $10.25 by 2030.
The Cardano price prediction 2026 is generating significant buzz in the crypto market, as the last quarter is soon to close in few days, boosting interest for the next altcoin. The 2025 for ADA/USD began with numerous fundamental updates strengthening its future, including the transformative Plomin Hard Fork, but 2026 seems even more constructive.
Now, Questions abound: “Will Cardano spearhead the altcoin movement?” and “What heights can ADA reach by 2050?” Explore this Cardano price prediction 2026 and beyond, filled with expert insights and ambitious forecasts.
Coinpedia’s Cardano Price Prediction
The Cardano price outlook for 2026 is promising, driven by its extraordinary 4,000% surge in 2020 and currently holding strong at a significant support level. With a positive shift in market sentiment, even a moderate increase could lead to a remarkable 1,000% rise, positioning Cardano around $4.50.
A more conservative target of $1.40 indicates a solid 300% gain based on existing trends. Analysts are broadly optimistic that upcoming ETF approvals will boost institutional adoption and market stability, with price projections ranging from $2.05 to $2.80.
The ADA price is currently experiencing a significant monthly sell-off. However, early February has revealed a crucial demand zone where new buying interest seems to be responding in the short term, but if the broader market improves, then more demand is likely to emerge, setting the stage for a potential bullish rally. Additionally, the lower boundary of the falling wedge is providing solid support, indicating that a price spike could be imminent at some point. Therefore, it is anticipated that ADA could potentially reach $0.40 this month. On the other hand, if BTC collapses again, ADA might drop to $0.20 or even lower.
Cardano AI Price Prediction For February 2026
Source
Low Price
Average Price
High Price
Gemini
$0.85 – $0.95
$1.00 – $1.20
$1.30 – $1.50+
BlackBox
$0.65
$1.00
$1.50
ChatGPT
$0.75
$0.95
$1.25
ADA Price Prediction 2026
The Cardano price forecast for 2026 points to an important support level on its weekly chart, a range that has consistently acted as a strong pivot point for price trends, and is currently giving off signals of another potential rally. This support level is known for displaying remarkable resilience over time, suggesting that if Cardano price USD can maintain its position above this threshold once again, it could pave the way for significant price movements in 2026.
Looking back at Cardano’s historical performance on the weekly chart, it shows an extraordinary rally in 2020, when the asset posted staggering gains of nearly 4,000%. During that bullish phase, the Cardano price USD spent an extended period consolidating around the dynamic support trendline, which appears to be a strategic accumulation at discounts from smart money, contributing significantly to its eventual surge.
If the current market sentiment shifts positively, a resurgence in investor confidence could lead to a recovery. Not ambitiously, even modestly, past performance could give a tremendous surge. Last year’s performance was 4000%. If we assume 1/4 of that momentum, it would result in an increase of approximately 1000%, potentially elevating Cardano’s price to $4.50 by 2026.
Conversely, a more conservative approach suggests a realistic price target of around $1.40, indicating a potential increase of about 300%. This estimate remains feasible, especially since it is based on fundamental analyses and market trends that are not reliant on speculative triggers, such as the possible approval of exchange-traded funds (ETFs).
Additionally, many experts propose that these ETFs could significantly impact the market by boosting institutional investment and improving market stability. In a situation where ETF approvals occur and retail investor excitement rises, Cardano’s price could realistically range from $2.05 to $2.80.
Scenario
Potential Low
Average Price
Potential High
Without ETF Approval
$0.85
$1.10
$1.25
With ETF Approval + Retail Surge
$1.20
$1.65
$2.05
Bullish Breakout (with ETF & macro support)
$1.50
$2.05
$2.80
Cardano On-chain Analysis
As per Cardano’s on-chain metrics, “Smart Money” accumulation phase is the best observation right now, because the divergence between retail and institutional holders is more vivid than ever.
As the number of addresses holding between 10 and 1 million ADA is declining, and the consistent surge in the 10 million to 100 million coin bracket confirms this, this represents a major supply consolidation. The observation shows that these mega-whales are strategically absorbing the “weak hands” during price dips, effectively building a rock-solid fundamental floor for the asset. Also, the fact that the 1M to 10M coin bracket is also growing confirms that professional high-net-worth investors seem to be positioning for a recovery, too.
Similarly, the surge to 4.57 million total holders despite a grueling 2025 proves that Cardano’s ecosystem is expanding its reach even in a “stress test” environment. This growth in the holder base suggests that the asset is not being abandoned; rather, it is being redistributed into a more stable, long-term foundation. When a holder count rises as prices fall, it signals that the market views current levels as a deep-value opportunity rather than a reason to exit.
Additionally, the Weighted Sentiment flipping the 0 line to 0.656 is a crucial momentum trigger. Professionally, this “0-line flip” indicates that the aggregate social and market bias has shifted from fear to optimism.
Combined with the strategic whale accumulation, this sentiment pivot suggests that the “disbelief” phase is ending and that a bullish rally is likely once the remaining retail sell pressure is fully absorbed by the growing whale cohorts.
Cardano (ADA) Price Prediction 2026 – 2030
Price Prediction
Potential Low ($)
Average Price ($)
Potential High ($)
2026
2.75
3.00
3.25
2027
4.50
4.75
5.00
2028
5.25
5.50
5.75
2029
6.75
7.25
7.75
2030
9.00
9.75
10.25
This table, based on historical movements, shows ADA prices to reach $10.25 by 2030 based on compounding market cap each year. This table provides a framework for understanding the potential Cardano price movements. Yet, the actual price will depend on a combination of market dynamics, investor behavior, and external factors influencing the cryptocurrency landscape.


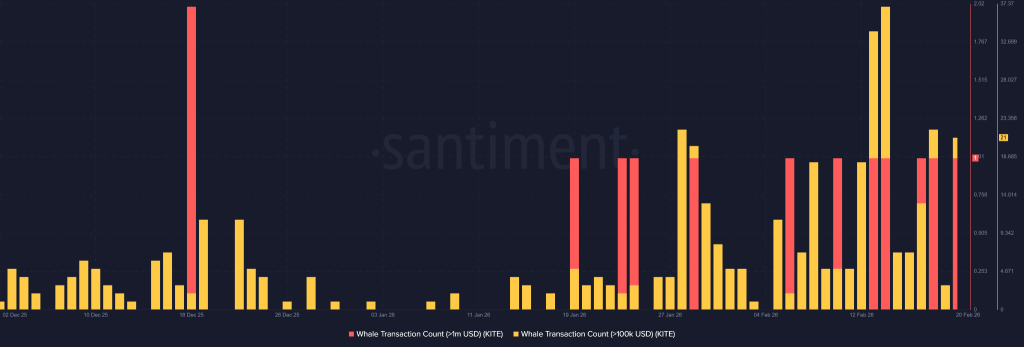
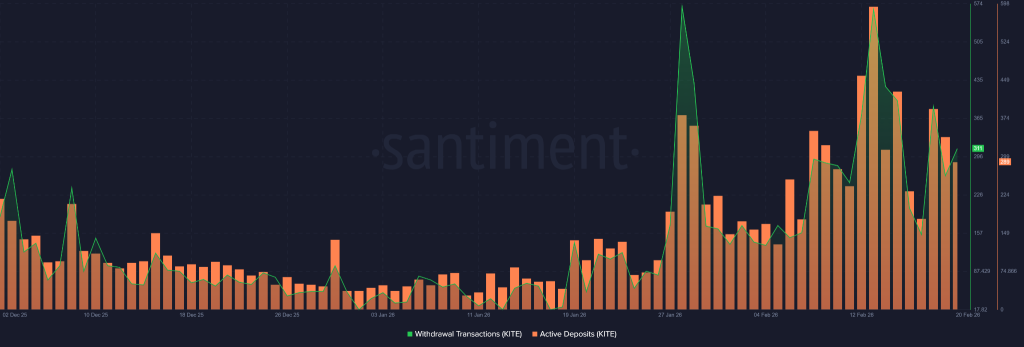
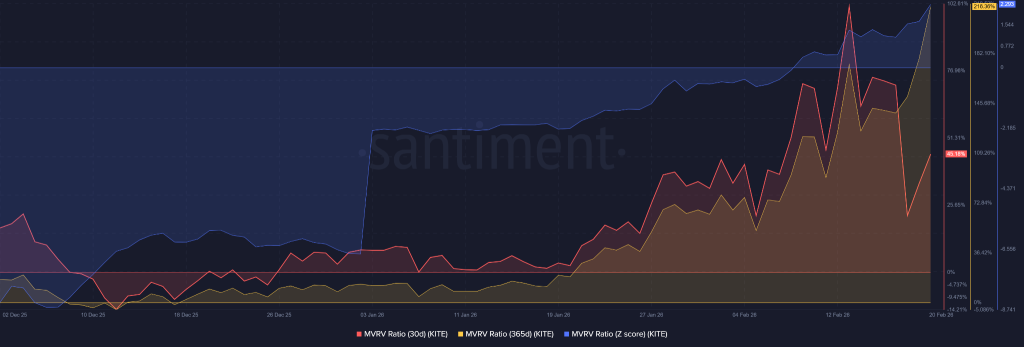
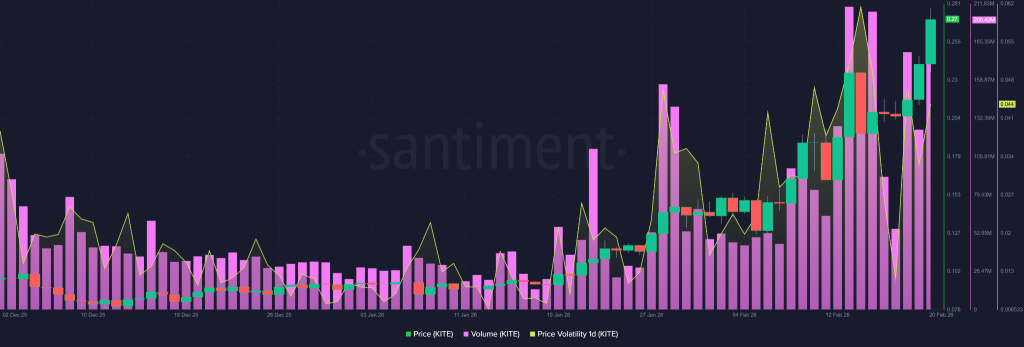
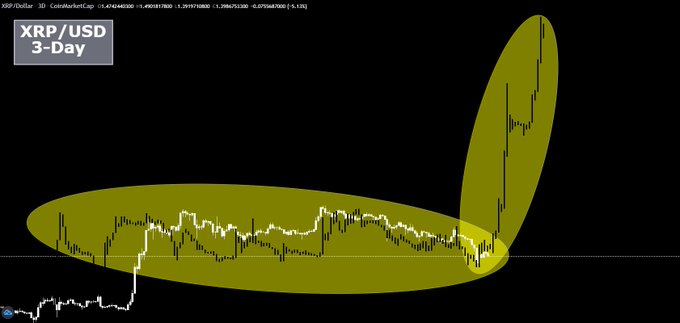


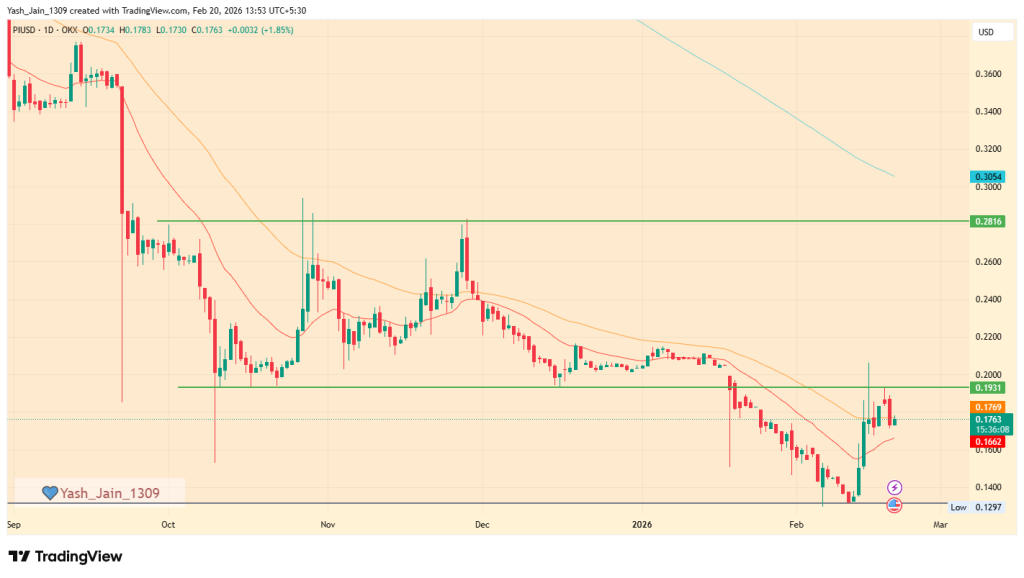
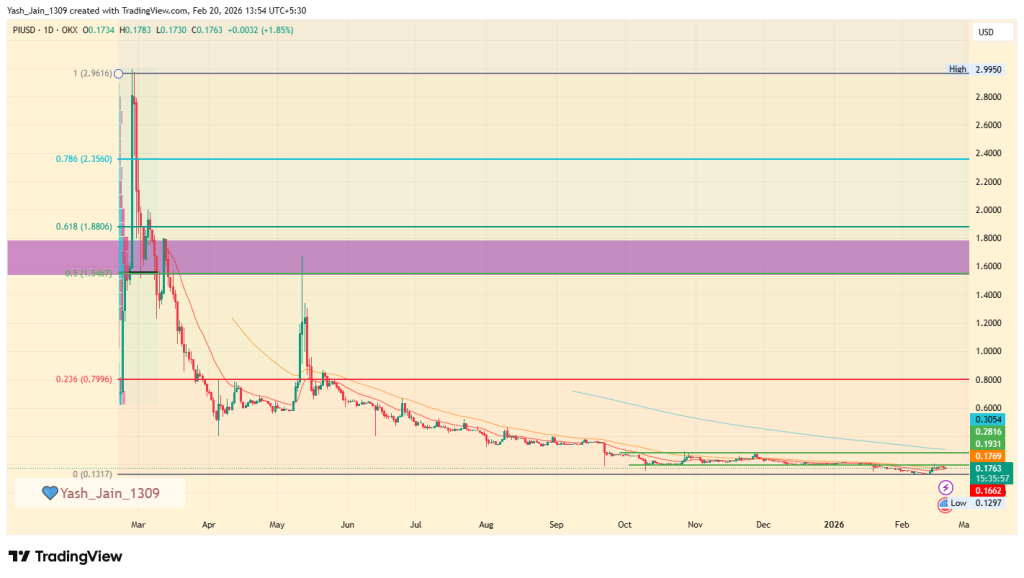
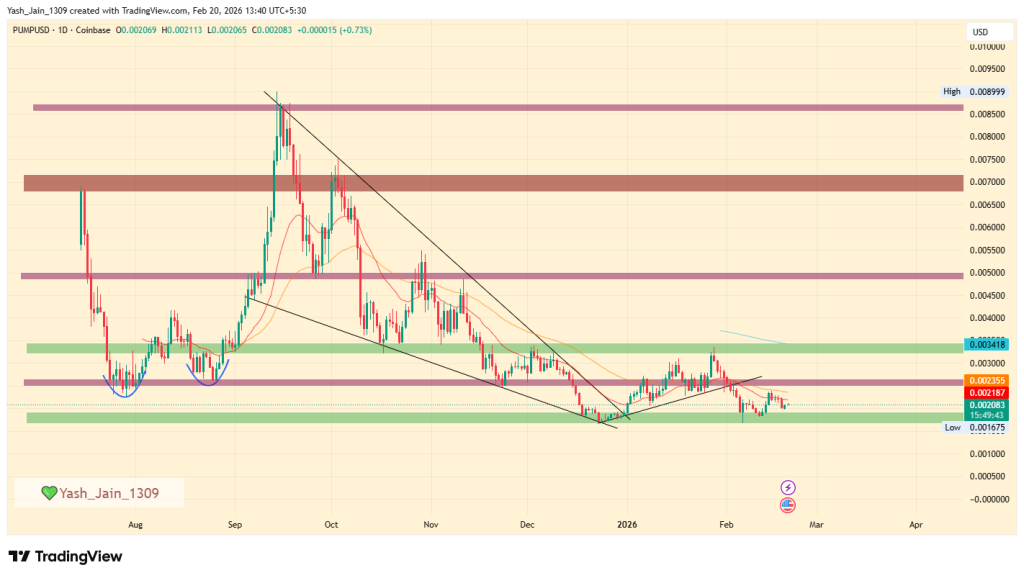
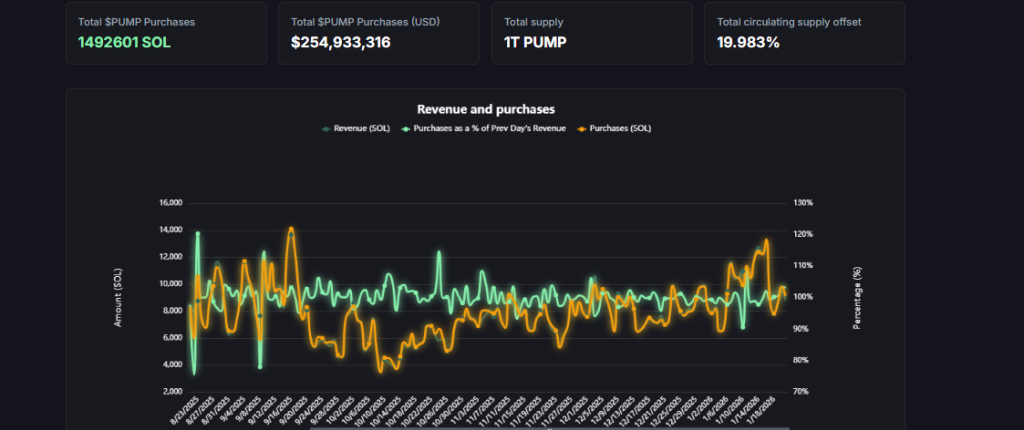
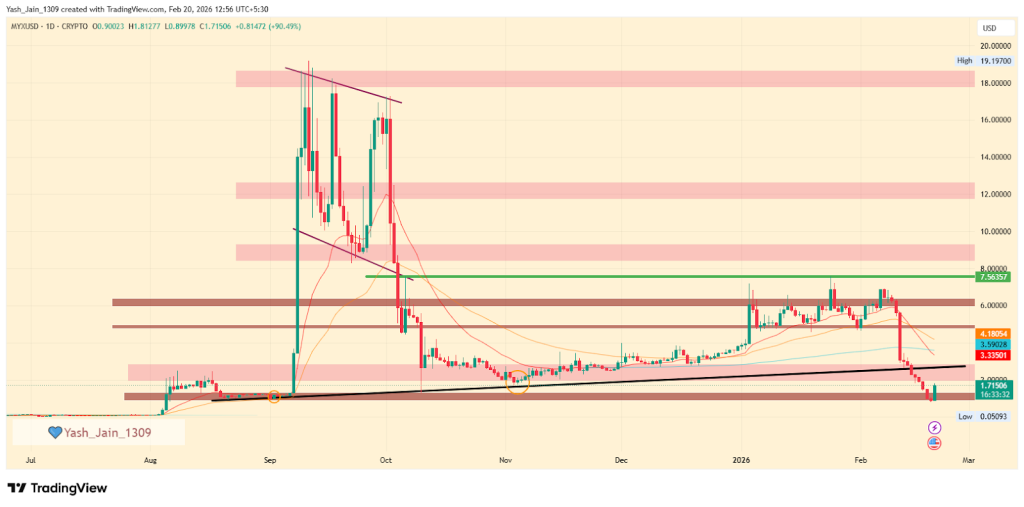
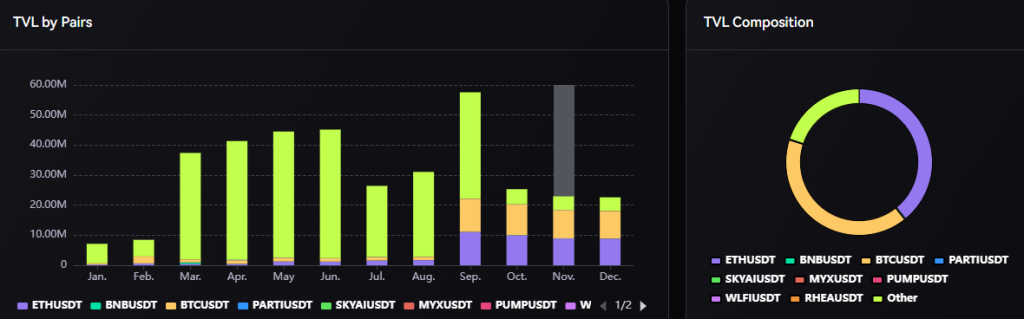


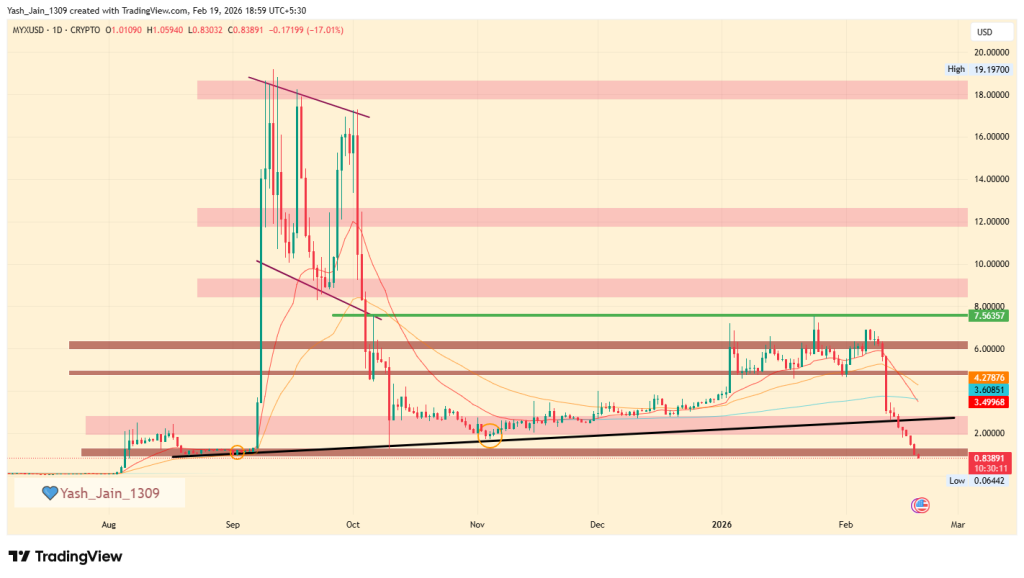
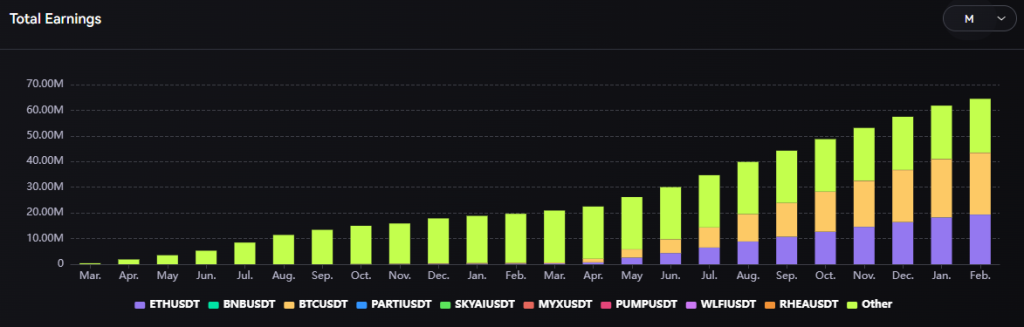
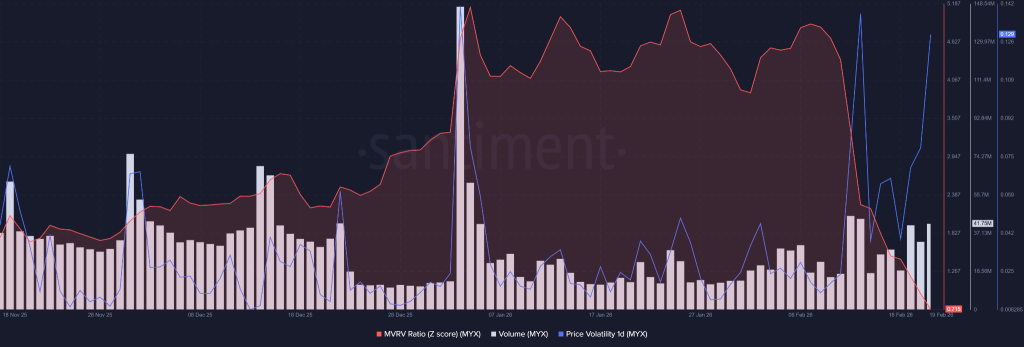
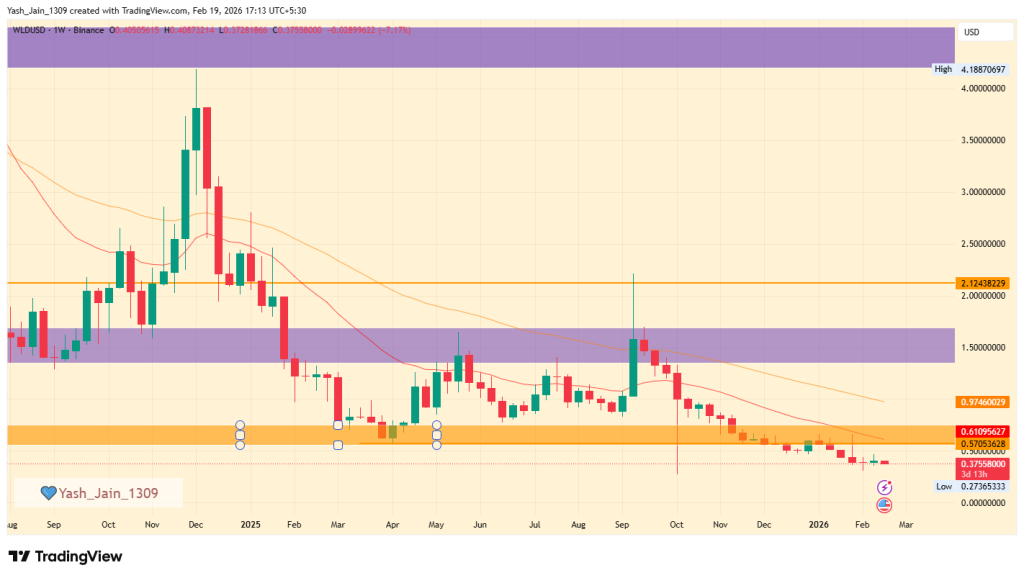
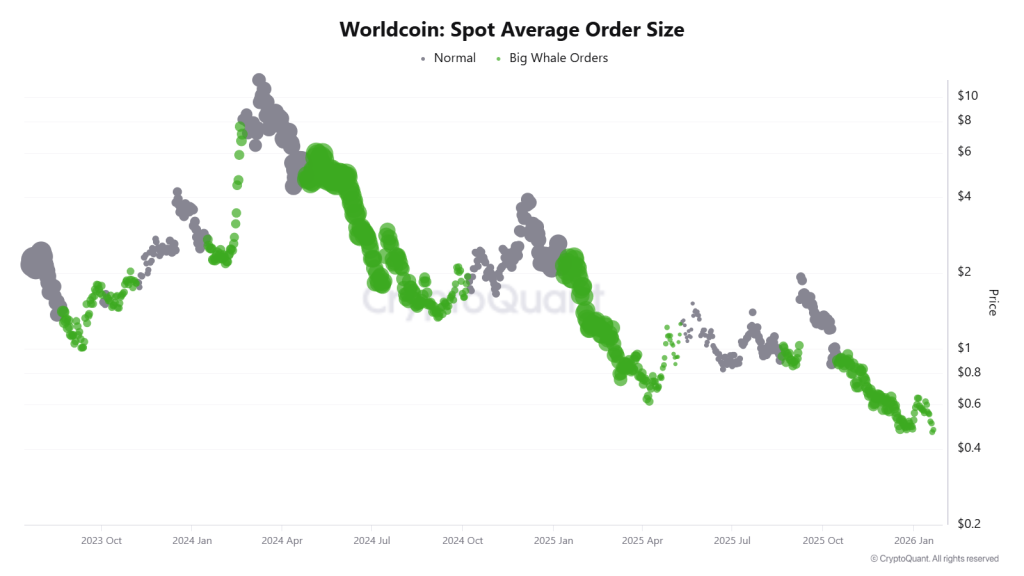
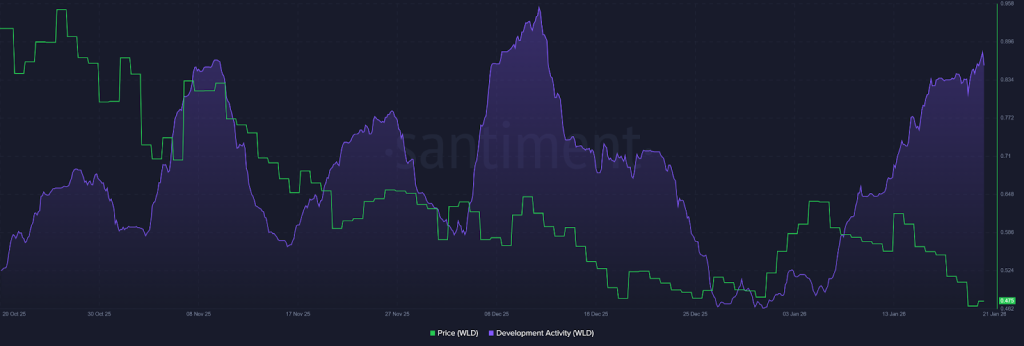
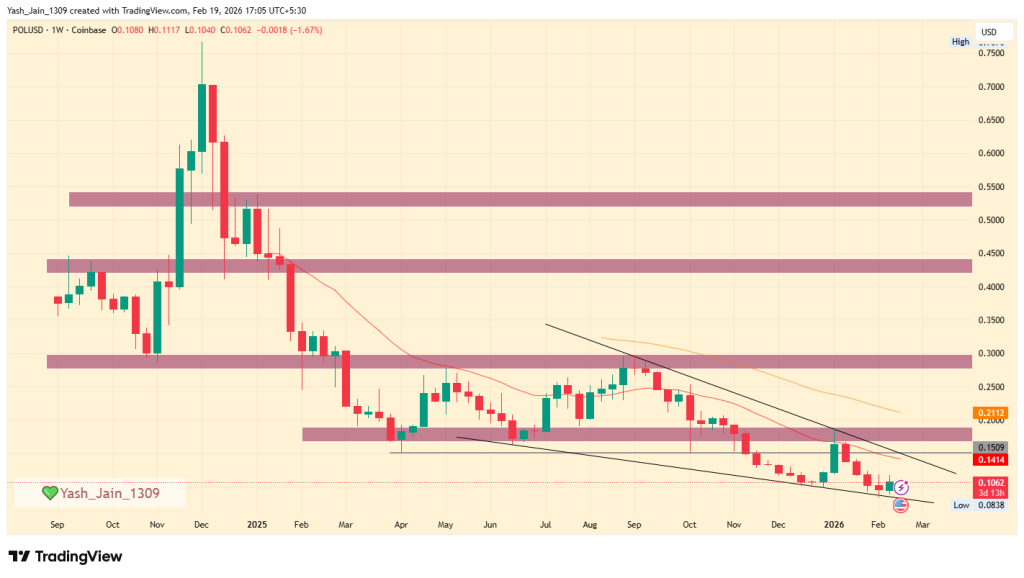
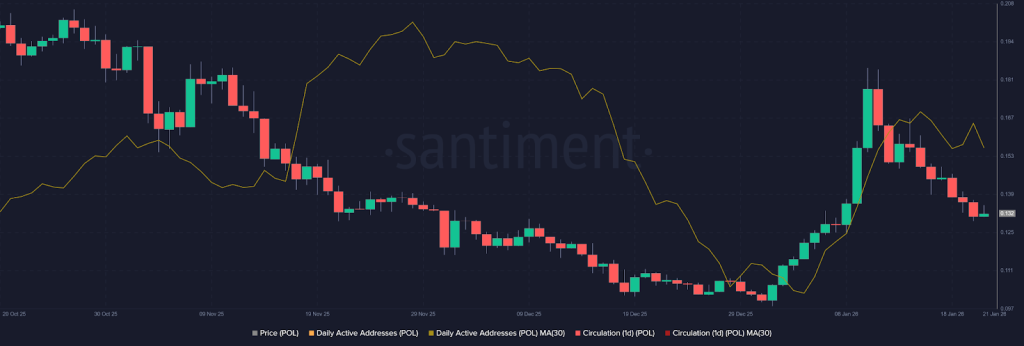
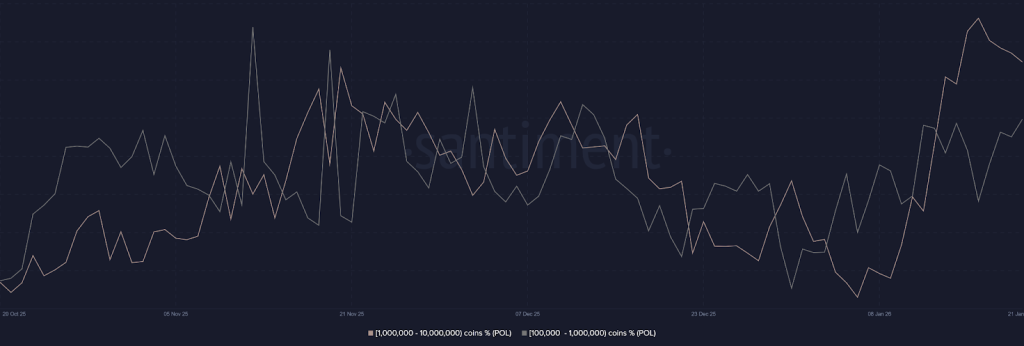
![XRP Community Day [Live] Updates](https://image.coinpedia.org/wp-content/uploads/2026/02/05161327/XRP-Price-Drops-10-as-Leverage-Dries-Up-and-Whale-Activity-Remains-Absent-1024x536.webp)