Bitcoin price continued its semi-green week for a bit today trading above $115,000 today and briefly reaching $116,077. Since then, bitcoin’s price has dumped to the mid $112,000s, according to Bitcoin Magazine Pro data.
This bitcoin price movement comes as traders weigh the Federal Reserve’s upcoming interest-rate decision and renewed optimism in the U.S.-China trade relations.
Data from Bitcoin Magazine Pro showed a 1.6% daily gain for BTC before the dump in late afternoon.
Despite historical trends of Bitcoin pulling back ahead of major U.S. economic events, the cryptocurrency held steady ahead of Wednesday’s Federal Open Market Committee (FOMC) meeting, where a 25-basis-point rate cut is widely expected.
Traders remain divided on near-term price targets. Some believe the market may be bottoming and an uptrend could follow for the rest of the week, while others believe $117,000 as a potential pre-Fed local top before BTC revisits the CME futures gap near $111,000.
The broader macro backdrop also supported risk-on assets. Gold fell to under $4,000 per ounce, its lowest since Oct. 6, helping fuel gains in Bitcoin and altcoins.
Bitcoin price enters tight range
Bitcoin’s price has entered one of its tightest trading ranges in history, moving between $106,000 and $123,000 for over four months. This extended calm has driven volatility to record lows on six-month metrics — levels that have historically preceded major directional moves. The weekly Bollinger Band Width, a key volatility indicator, has reached its lowest reading ever, suggesting that a large expansion in volatility could be imminent.
In past cycles, similar compression periods have led to price surges exceeding 65% within 100 days.
Applying those historical patterns implies a potential target of $170,000–$180,000 by 2026 if Bitcoin follows a comparable trajectory. However, these low-volatility phases can persist for months before breaking out, meaning Bitcoin may continue trading sideways into early 2026.
Corporate crypto buying
Corporate and institutional crypto activity is also making headlines. Japanese hotelier-turned-Bitcoin treasury Metaplanet Inc. announced a $500 million share buyback, while Cathie Wood and Ark Invest increased its holdings in Block Inc. by $30.9 million across three ETFs.
Wood, known for her $1.5 million Bitcoin prediction, is one of the most bullish investors in crypto. Through ARK Invest, she has consistently invested millions in major crypto-related stocks.
Her firm held positions in Circle Internet Group, Coinbase, Robinhood, and Bitmine Immersion Technologies.
Recently, ARK expanded its crypto exposure by purchasing about $31 million worth of Block Inc. shares. The ARK Innovation ETF bought 210,916 shares, the ARK Next Generation Internet ETF added 59,827 shares, and the ARK Fintech Innovation ETF acquired 114,842 shares.
A recent debate on the social media platform X has drawn attention to XRP’s long-term price outlook after an XRP enthusiast, Crypto Bitlord, proposed a rather wild scenario where the cryptocurrency teleports to $500 instantly. His post, which imagined XRP being used by the US government to pay off its $35 trillion debt, caused some reactions across the XRP community.
In response, well-known crypto analyst ChartNerd stepped in to temper expectations, explaining that while XRP’s future is bright, such a leap to $500 is far from realistic this market cycle.
ChartNerd’s Take On Realistic XRP Targets
ChartNerd’s comments immediately stood out for their grounded tone, especially amongst reactions filled with predictions of explosive, instant gains. Responding directly to Bitlord’s vision of XRP rocketing to $500, ChartNerd clarified that XRP’s price will not trade at that price target this cycle. “$XRP will not teleport to $500,” he said.
Instead of a three-digit price, the analyst noted that the XRP price can only realistically reach the double-digit threshold in this cycle. “Realistically, it could definitely teleport to $13-$27 this cycle,” he continued.
This double-digit price target, although very bullish compared to XRP’s current price action, pales in comparison to other bullish projections from other crypto analysts, with many anticipating triple-digit price targets and others even predicting a run to $1,000 and beyond.
As conversations around potential XRP ETFs continue to gain momentum, one commenter asked ChartNerd whether his projections accounted for the billions in possible ETF inflows and the tokens expected to be locked in treasury funds and liquidity pools over the next few months.
His response showed that his analysis was not detached from these developments. ChartNerd explained that even if XRP captured half of Bitcoin’s ETF trading volume from the past two years, the result would still translate to a market capitalization of roughly $1.2 trillion, bringing the price closer to his $27 upper target rather than $500.
Most ultra-bullish XRP price predictions are contingent on the cryptocurrency gaining adoption among banks and players in traditional finance. However, adoption models grow over years, not weeks, with ChartNerd adding that “these developments take time, and triple digits are not possible until many a year down the line.”
Staying Grounded Amid Bold Predictions
Another user remarked that Bitcoin once faced similar disbelief before breaching $100,000, meaning that XRP could surprise skeptics in the same way. ChartNerd, however, maintained his cautious stance with the response, “Highly unlikely imo, we shall see. I’ll stick to double digits.”
Such comparisons overlook the fundamental differences between Bitcoin’s and XRP’s market dynamics, especially when it comes to their circulating supplies.
At the time of writing, XRP is trading at $2.66, a 1% increase in the past 24 hours and a 9.2% rise over the last seven days. To reach the hypothetical $500 level, XRP would need to surge by roughly 18,690% from its current price. By contrast, hitting $13 or $27 would represent gains of approximately 388% and 915%, respectively.
This article was first published on The Bit Journal. Bitcoin surged past $116,000 on Monday morning after U.S. Treasury Secretary Scott Bessent announced a “very substantial framework” for a trade agreement between Washington and Beijing.
Although a video of 79-year-old President Donald Trump dancing when he landed in Malaysia caught social media attention throughout the weekend, it was the words of Bessent that led to the optimistic reaction of global markets and investors, which boosted both stocks and cryptocurrencies.
Bitcoin Surge Mirrors Global Market Optimism
The Bitcoin surge was accompanied by an increase in traditional markets, as stocks also opened higher in Asia and the U.S, reflecting renewed optimism on reducing trade tensions between the two largest economies in the world.
Trump arrived in Kuala Lumpur on Sunday to pay a visit to the 47 th Association of Southeast Asian Nations (ASEAN) summit where his delegation is said to have assisted in brokering a peace deal between Cambodia and Thailand. Bessent, in the meantime, had signed various memorandums of understanding (MOUs) with Asian collaborators on rare earth mineral cooperation the strategic victory at a time of continued global realignments of supply chains.
U.S.-China Talks Spark Global Market Optimism
Nevertheless, the greatest achievement was the behind-the-scenes talks made by Bessent with the Chinese officials, which led to a tentative framework of trade that sought to end months of trade stalemate. Bessent said during an interview on NBC:
“We’ve created a framework for the two leaders to discuss on Thursday in Korea.I think it will be fantastic for U.S. citizens, for U.S. farmers, and for our country in general.”
The markets reacted quickly to the announcement. Bitcoin surge momentum drove the price to $114,217.55 at the time of writing, a 1.93 percent rise on the last day and 4.73 percent on the week, respectively. The cryptocurrency has been ranging between $113,015.30 and $116,273.31 since Sunday, which is one of the most stable and bullish weekends of the cryptocurrency in the last several months.
Bitcoin Surge Fuels Derivatives Market Expansion
Trade activity increased accordingly. The 24-hour trading volume of Bitcoin increased by 87.11 percent to reach $62.55 billion, and market capitalization increased by 1.95 percent. The crypto market dominance of the asset did not significantly change at 59.63, increasing by a small margin of 0.01%.
The enthusiasm was reflected in derivatives markets. According to Coinglass data, open interest in Bitcoin futures rose 3.05 to $76.18 billion and total liquidations reached $140.97 million. Bitcoin surge had a big impact on short positions where they sustained a loss of $123.30 million and long traders suffered a relatively small loss of $17.67 million.
Bitcoin Surge Momentum Builds Ahead APEC
The most recent Bitcoin boom, analysts argue, highlights the extent to which cryptocurrency markets are following macroeconomic trends and geopolitical changes. The recent surge of Bitcoin demonstrates how vulnerable the digital goods are to conventional market drivers such as trade policy and diplomatic co-operation, according to one Singapore-based trader.
The following week may be a key one. On Thursday, Donald Trump and Chinese President Xi Jinping will hold an initial meeting on the Asia Pacific Economic Cooperation (APEC) summit in South Korea where both the leaders are likely to agree on the specifics of the proposed trade setup.
Should the discussions lead to tangible gains, analysts foresee the potential further increase of the Bitcoin surge and even new all-time highs by early November.
Conclusion
As global markets ride a wave of optimism, all eyes now turn to Thursday’s APEC summit in South Korea. The anticipated Trump–Xi meeting could determine whether the current Bitcoin surge and stock market rally evolve into sustained economic momentum or fade with unmet expectations.
Follow us onTwitter andLinkedIn, and join ourTelegram channel to be instantly informed about breaking news!
Summary
Bessent announced a major U.S.-China trade framework during Trump’s ASEAN visit.
The news sparked a Bitcoin surge past $116,000 and boosted global stocks.
Bitcoin trading volume jumped 87%, with futures and market cap rising.
Focus shifts to the APEC summit for Trump–Xi trade discussions.
Glossary of Key Terms
Bitcoin Surge: Rapid rise in Bitcoin’s price.
Scott Bessent: U.S. Treasury Secretary behind the trade deal news.
A pro-crypto bill will be tabled today in the French Parliament by the center-right Union of the Right and Centre (UDR) party, led by lawmaker Éric Ciotti, marking the first time such a comprehensive legislative proposal on cryptocurrency has been introduced in France.
The initiative calls for a national Bitcoin Strategic Reserve and aims to position the cryptocurrency as a form of “digital gold” to strengthen financial sovereignty.
The proposed legislation would see France aim to acquire up to 2% of Bitcoin’s total supply — roughly 420,000 BTC — over the next seven to eight years, according to journalist Gregory Raymond.
To manage the reserve, the bill envisions the creation of a Public Administrative Establishment (EPA), similar in structure to France’s gold and foreign-currency holdings.
Funding for the Bitcoin reserve would come from multiple sources. Surplus nuclear and hydroelectric energy would power public Bitcoin mining operations, with adapted taxation for miners to encourage domestic participation.
BREAKING: French politician Éric Ciotti introduced a bill to adapt “the new monetary order by embracing Bitcoin and crypto.” pic.twitter.com/fS7ILfhPq3
Back in July, French lawmakers submitted a proposal to convert surplus electricity into economic value through Bitcoin mining. The bill outlined a five-year experimental program allowing energy producers to use excess power — particularly from nuclear and renewable sources — for mining.
The July initiative aimed to tackle France’s recurring issue of energy overproduction, as producers were often forced to sell surplus electricity at a loss due to limited storage. The proposal described this as an “unacceptable economic and energy loss.”
This new bill would also allow France to retain crypto seized during legal proceedings, and a quarter of funds collected via popular savings schemes, such as the Livret A and LDDS, would be allocated to daily Bitcoin purchases — approximately 15 million euros per day, or 55,000 BTC per year.
Pending constitutional approval, citizens could also pay certain taxes in Bitcoin.
France explores stablecoins for payments
The bill also emphasizes the use of euro-denominated stablecoins for everyday payments, recognizing them as a credible alternative to traditional payment networks.
Transactions under €200 would be exempt from taxation and social contributions, and payment of taxes in euro stablecoins would be allowed.
To support industry development, the legislation proposes adapting electricity taxation for mining through a progressive excise duty and flexible tariffs for data centers. It also encourages institutional adoption of Bitcoin and other crypto-assets via Exchange Traded Notes (ETNs) and calls for revisions to European prudential rules, which currently impose high risk-weightings on certain crypto-assets, limiting the use of crypto as collateral for “Lombard” loans.
Despite its ambitious scope, the bill faces steep political hurdles. The UDR holds only 16 of 577 seats in the National Assembly, making adoption unlikely without broader support, per Raymond.
SoFi Technologies (NASDAQ: SOFI) raised its full-year profit forecast on Tuesday after reporting record third-quarter results that beat Wall Street expectations, driven by fee revenue and more user growth across its financial products.
CEO Anthony Noto said the company remains on track to launch crypto trading by the end of the year, with plans to roll out its own SoFi USD stablecoin in the first half of 2026 — marking its biggest step yet into the digital asset economy.
SoFi said adjusted revenue climbed 38% year-over-year to $950 million, surpassing analyst estimates of $886.6 million.
This move echoes that of banking giant Morgan Stanley. Earlier this quarter, Morgan Stanley announced plans for crypto trading for retail clients on its E*Trade platform, partnering with Zerohash for liquidity, custody, and settlement.
Adjusted profit for SoFi more than doubled to $0.11 per share in the three months ended September 30, topping expectations of $0.08 per share. Shares of SoFi rose 3.8% in pre-market trading following the announcement, according to Reuters reporting.
Founded as a student loan refinancing startup, SoFi has evolved into a full-scale financial services platform offering products ranging from IPO investing to credit cards and high-yield savings accounts.
The company now boasts a market capitalization of roughly $36 billion, cementing its position among the leading players in the fintech sector.
Earlier this year in June, SoFi announced that it had reintroduced spot crypto trading and launched plans for a blockchain-based global remittance service after halting crypto services in 2023 due to regulatory constraints.
The company said SoFi members would again be able to buy, sell, and hold cryptocurrencies such as Bitcoin within its platform.
In addition to reinstating crypto trading, SoFi revealed a new self-serve international money transfer feature, expected to go live soon.
The service would let SoFi Money users send funds across dozens of countries directly from the SoFi app, with transfers conducted over secure blockchain networks.
Recipients would receive local currency instantly, with full fee and exchange-rate transparency provided upfront and 24/7 access to transactions.
Back in June, CEO Anthony Noto said SoFi viewed blockchain and crypto as central to the future of financial services, emphasizing the company’s goal of offering members more control and flexibility across their financial lives.
Bitcoin priceis once again testing the patience of traders, moving within one of the tightest percentile price ranges in its history. For more than four months, BTC has traded between roughly $106,000 and $123,000. This period of quiet has pushed volatility to its lowest level ever recorded on six-month metrics. Each time in the past that volatility has fallen to similar depths, it has been followed by a major trending move.
Bitcoin Price Volatility Compression
The current lull stands out even compared to previous phases of consolidation in this cycle. Despite occasional liquidations and sharp wicks, the broader price structure has barely shifted since June. One of the most telling metrics is the weekly Bollinger Band Width — the indicator has now reached its lowest weekly reading ever. In every past instance that Bitcoin’s bands have squeezed to this degree, bitcoin price volatility expansion followed shortly after.
When Bitcoin Price Volatility Returns
Periods of ultra-low volatility have never lasted long. In this cycle alone, there have already been five examples where similar consolidations ended with significant moves exceeding 65% gains within 100 days. Averaging those historical fractals to today’s setup would imply a potential bitcoin price target between $170,000 and $180,000 by 2026 if the next expansion phase mirrors prior behavior.
However, bitcoin price volatility compression does not guarantee immediate upside. Previous examples have shown that these low-volatility periods can extend for several months before a breakout occurs. Bitcoin could continue to trade sideways through late Q1 2026, oscillating within the current range before direction is decided.
Macro Catalysts for Bitcoin Price Volatility
Several macro factors could serve as a catalyst for renewed bitcoin price volatility. The Federal Reserve is expected to announce another rate cut, which markets currently price at near-certainty. Gold’s recent reversal after setting new highs also hints at potential capital rotation. If even a small fraction of that capital migrates toward Bitcoin amid falling rates and renewed risk appetite, the effect could amplify any breakout once volatility expands.
Conclusion: The Next Big Bitcoin Price Move
Volatility naturally declines as Bitcoin matures from a multi-billion to a multi-trillion-dollar asset, but the cyclical nature of expansion and contraction remains. The current compression phase has lasted unusually long, and historically such conditions have preceded powerful multi-month trends.
The final months of 2025 and early 2026 may test this pattern once again. With bitcoin price volatility metrics at record lows, macro conditions turning supportive, and market sentiment subdued, Bitcoin appears poised on the edge of its next major move.
Disclaimer: This article is for informational purposes only and should not be considered financial advice. Always do your own research before making any investment decisions.
BOB’s new system enables bitcoin holders to borrow stablecoins against their BTC, keeping assets secured on Bitcoin and addressing a major obstacle to Bitcoin DeFi.
Investors are worried about increasing government debt and debasement and are flocking to gold and crypto, says Larry Fink. Bitcoin’s credibility as a macro hedge just got a major boost. On Tuesday, October 28, BlackRock CEO Larry Fink put the…
Shares of Trump-linked American Bitcoin are still up 20% over the week as the company nears the 4000 BTC mark. Despite Bitcoin trading close to its historic highs, treasury companies continue to accumulate Bitcoin. Still, on Tuesday, October 28 shares…
A widely shared seasonality snapshot is making the rounds ahead of month-end: a Coinglass heat map of Bitcoin’s monthly returns, reposted by trader Daan Crypto Trades. The table spans 2013–2025 and shows November as the statistical outlier in Bitcoin’s calendar—both for eye-popping gains and for sharp drawdowns in certain years.
Bitcoin November Preview
“November is Bitcoin’s best month based on historical performance. By far,” Daan wrote on X, pointing to an average November change of +46.02% across the dataset. That figure is visibly distorted by November 2013’s +449.35% surge, the single largest monthly move on the board. He added: “The average gain over all these months is +46.02%. But this is heavily skewed by a single monthly gain in November 2013. Bitcoin went up +449.35%!! that month.”
The raw counts back up the reputation without the hyperbole. Out of the 12 Novembers listed (2013–2024), 8 finished green—2013 (+449.35%), 2014 (+12.82%), 2015 (+19.27%), 2016 (+5.42%), 2017 (+53.48%), 2020 (+42.95%), 2023 (+8.81%), and 2024 (+37.29%)—while 4 were negative—2018 (-36.57%), 2019 (-17.27%), 2021 (-7.11%), and 2022 (-16.23%).
The median November change sits at +10.82%, a more conservative central tendency that dampens the 2013 effect. Excluding 2013 entirely, the simple average for November drops to roughly +9.35% across the remaining 11 years, underscoring how one month can skew mean-based seasonality.
Context from the broader table matters. November’s average is the highest of any month on Coinglass’s grid, ahead of October’s +20.30% average, while December shows a far more mixed profile with a +4.75% average but a -3.22% median—an imbalance consistent with outlier-driven months.
September, long maligned by traders, retains a negative average (-3.08%) over the full period. The 2024 row itself captures the push-and-pull of this cycle’s narrative: double-digit gains in February, March, May, October, and November, offset by meaningful drawdowns in April, June, and August, and a negative December print to close the year (-2.85%).
Lessons From Prior Cycles
Daan’s framing extends beyond simple seasonality. “November & December is when the 2013, 2017 & 2021 cycles topped out. It’s also where the 2018 & 2022 cycles bottomed out,” he noted. That observation lines up with the historical inflection points most market participants remember: the late-2013 mania and subsequent crash, the December 2017 peak, the November 2021 all-time high, and the December 2018 and November 2022 washouts.
The Coinglass grid cannot timestamp intramonth highs or lows, but the clustering of major pivots into the final two months of the year is consistent with the market’s folklore and with the returns pattern that shows both exceptionally strong up months and some of the cycle’s most punishing down months in this window.
The practical takeaway—again in Daan’s words—is not categorical bullishness, but regime risk: “All in all, an eventful last 2 months of the year generally speaking. Whether it’s on the bullish or bearish side, volatility and big market pivots have been the theme into the end of the year.” The heat map supports that characterization.
November’s distribution spans the widest extremes on record—from +449.35% at the top to -36.57% on the downside—with a two-thirds hit rate for green months and a median gain in the low double digits. December, by contrast, has produced both cycle tops and cycle bottoms despite a modest average, a reminder that average and median statistics can obscure the path risk that defines Bitcoin’s fourth quarter.
Seasonality is not destiny, and the sample is limited. Still, the data-backed message is clear: as November approaches, Bitcoin’s historical pattern has been less about quiet trend continuation and more about variance—the kind that has marked both euphoric blow-offs and capitulation lows.
Strategy Inc., the company led by Michael Saylor that rebranded from MicroStrategy, was hit with a junk credit grade on Monday as S&P Global Ratings flagged its heavy concentration in Bitcoin and weak dollar liquidity.
According to S&P, the firm’s balance sheet is tied closely to the price of Bitcoin and carries risks that traditional ratings models find hard to treat as stable collateral.
Bitcoin Holdings Drive The Score
Based on reports, Strategy’s Bitcoin stack is enormous — about 640,808 BTC on its books — worth roughly $73 billion to $74 billion at recent prices.
S&P said that while the company owns a large digital-asset hoard, the volatility of that asset and the company’s limited cash flow make it risky under S&P’s credit rules.
S&P assigned a B- issuer credit rating and kept the outlook stable. That B- places the company squarely in non-investment-grade territory, signaling a higher chance of stress if markets turn against it.
S&P Global Ratings has assigned Strategy Inc a ‘B-‘ Issuer Credit Rating (Outlook Stable) — the first-ever rating of a Bitcoin Treasury Company by a major credit rating agency. https://t.co/WLMkFqkkCb
Reports have disclosed that S&P was particularly concerned about a mismatch: most obligations are owed in US dollars, but most of the company’s value sits in Bitcoin. This gap can force the sale of Bitcoin to meet dollar payments if prices slide.
Analysts and commentators pointed to sizable convertible securities and preferred-stock commitments that add cash demands on the company. According to filings and market write-ups, the firm faces billions of dollars in convertible and preferred obligations spread over coming years.
Saylor and Strategy have made repeat purchases of Bitcoin as part of their stated plan. Those buys have created big unrealized gains on paper, but S&P’s methodology largely treats the token differently from traditional equity when measuring risk-adjusted capital.
Liquidity, Access To Markets
S&P noted that, for now, Strategy still has access to capital markets, which is why its outlook is stable rather than immediately negative.
But the rating agency warned that a sharp drop in Bitcoin’s price or any sudden tightening of funding channels could trigger a further downgrade.
Market participants will watch funding costs, preferred dividend payments and convertible notes for signs of stress.
Investors reacted with mixed signals in early trading. Some buyers treated the downgrade as a formal recognition of a known risk, while others judged the move as a calibration that won’t stop Saylor’s accumulation strategy if markets stay calm.
Trading volume and price swings in both Strategy shares and Bitcoin may rise as traders reassess odds.
Featured image from Gemini, chart from TradingView
This article was first published on The Bit Journal: Why did the MSTR stock price double despite being given a dismal S&P credit rating, and what does that say about the status of Bitcoin as a financial asset?
The world’s leading Bitcoin treasury firm, Strategy, saw its MSTR stock price double despite receiving a dismal S&P credit rating of B-. The firm maintained that Strategy’s weak liquidity and narrow focus could easily lead to its future collapse.
According to a post by Strategy on the social media platform X, S&P Global Ratings placed the Bitcoin treasury firm in speculative, non-investment-grade territory — aka “junk-bond” status — despite the outlook remaining stable. However, Strategy CEO Michael Saylor noted that his company was the first digital asset treasury to receive an S&P credit rating, which, he said, was a clear indication of the company’s ongoing success.
Confidence in Strategy’s Long-Term Strategy
Despite the low rating, which indicates a lack of confidence, Strategy’s MSTR stock price turned positive, rising 2.27%, implying about 114% upside from Friday’s close and suggesting that investors had confidence in the firm’s long-term Bitcoin strategy. The special attention from investors at a time when the S&P credit rating took a dim view could serve as a milestone for the cryptocurrency industry.
The firm defended its decision to give a poor S&P credit rating, citing Strategy’s balance sheet as overwhelmingly tied to Bitcoin and stating that its low dollar liquidity and negative risk-adjusted capital outweighed strong access to prudent debt management and capital markets. S&P opines that the company’s structure creates an inherent currency mismatch: most assets are held in bitcoin, while debt and dividend obligations are denominated in U.S. dollars. Commenting on their report, the firm stated in their press release:
“We view Strategy’s high bitcoin concentration, narrow business focus, weak risk-adjusted capitalization, and low U.S. dollar liquidity as weaknesses.”
Facts the S&P Credit Rating Overlooked
In reaction to the rating, Matthew Sigel, head of digital assets research at VanEck, posted on X saying:
“The company can service debt for now, but is vulnerable to shocks.”
However, crypto economics are known to live and die on community hype, and Strategy’s branding could be an “X factor” that the S&P credit rating may not have incorporated into its system. Even now, new digital asset treasury firms are still referred to as “MicroStrategies,” a nod to the original company’s outsized reputation. Also, the S&P credit rating may have overlooked that TradFi is increasingly integrated with the broader crypto industry.
Conclusion
Despite the firm’s dismal S&P credit rating, Strategy assigned it a stable outlook, citing its past success in maintaining access to capital markets and managing debt maturities. With the next major maturity date set for 2028, the Bitcoin treasury firm has room to improve, as long as Bitcoin’s price doesn’t collapse.
Glossary of Key Terms
Strategy: A company that has a dual business model: it sells AI-powered enterprise analytics software, but its primary Strategy is to hold a large amount of Bitcoin on its balance sheet.
MSTR: MSTR is the stock ticker for Strategy Inc. (formerly MicroStrategy).
Bitcoin treasury firm: A publicly traded corporation that holds a significant amount of its corporate assets in Bitcoin as part of its treasury strategy.
Frequently Asked Questions about Strategy and Bitcoin Treasury Companies
What is Strategy (MicroStrategy) famous for?
Initially, the company focused on developing software for data mining and business intelligence. Currently, the firm’s Strategy involves leveraging its balance sheet to acquire BTC as a primary treasury reserve asset.
How do Bitcoin treasury companies work?
At their core, Bitcoin treasury companies are firms dedicated to accumulating a digital asset, regardless of whether that was the business’s original intent.
What is MicroStrategy’s Bitcoin Strategy?
MicroStrategy raises capital through convertible notes to buy Bitcoin, which helps Bitcoin’s price rise as they buy a lot of it. The MSTR stock price rises as the value of their bitcoin assets increases, and with a higher stock price, Strategy can raise even more money and buy more bitcoin.
Bitcoin price rose suddenly on Tuesday, Oct. 28, hitting a high of $116,200 as traders waited for the upcoming interest rate decision and Trump’s meeting with Xi Jinping. Bitcoin (BTC) has jumped by over 11% from its lowest level this…
The next Federal Open Market Committee (FOMC) meeting is fast approaching, and the bets are already pouring in as to what it would mean for the Bitcoin and crypto industry. The last FOMC meeting took place in September, when the Federal Reserve ended up cutting rates down to 4-4.25% after months of no rate cuts. With this setting the tone, the expectations that another rate cut could be on the way are getting louder, with the FedWatch Tool showing a high percentage.
Market Expects Another Rate Cut To 3.75-4%
The next FOMC meeting is scheduled for Wednesday, October 29, 2025, and there is already a major clamor around what the Fed is planning on doing. The current market headwinds point to a favorable outcome for risk assets such as Bitcoin and other cryptocurrencies, with expected rate cuts.
Currently, the CME FedWatch Tool is showing that the probability of a rate cut has risen to 98.3% as of the time of this writing. This leaves only a 1.7% chance that the Federal Reserve will actually leave rates at their current levels, and there is zero chance that there will be a rate hike.
A reduction in the rate cuts is good for businesses all around, as lower interest rates mean better loan terms and increased spending and borrowing. Thus, it will increase the participation in the markets, from consumer goods to the stock market, and then make its way into newer markets such as Bitcoin and crypto.
Expectations For Bitcoin And Crypto Are Getting Higher
A rate cut by the Federal Reserve aligns with the more pro-crypto stance that the United States has been moving in since President Donald Trump was elected. Last week, the president pardoned the Founder and former CEO of the Binance crypto exchange, Changpeng Zhao, after he previously pled guilty to money laundering violations back in 2024. Zhao has since served a 4-month stint before the pardon from Trump came.
With the US embracing Bitcoin and crypto again, a rate cut will only further the ascent, allowing more investors to get into the market as liquidity frees up. The initial announcement has been known to trigger a rapid increase in the market. But as the news settles, the crypto market is expected to continue to rise in response.
However, nothing is certain until the FOMC meeting is complete and the announcement is made. For the Bitcoin and crypto market to remain bullish, inflation will also have to be reduced, as an increase could trigger more conservative stances from investors.
U.S. spot Bitcoin ETFs recorded roughly 446 million dollars in net inflows for the week, reversing the prior soft patch and hinting that institutions still buy the dips. Over the same stretch, spot Ether products saw about 244 million dollars in outflows, a notable contrast that kept the market honest after a frantic first half of October.
Daily prints show how quickly sentiment can turn. After four straight sessions of redemptions, Bitcoin funds swung to a single-day net inflow near 477 million dollars as prices steadied, a flip that broke the losing streak and re-anchored flows.
What the divergence actually signals
The split is not just about winners and laggards. Bitcoin’s rebound suggests allocators continue to treat it as the cleanest expression of crypto beta, especially when macro is noisy and liquidity is patchy. Ether’s outflows, meanwhile, reflect a different set of questions that investors still need answered, from staking mechanics inside fund structures to the timing and scope of future product features. The weekly etf total underscores that rotation within crypto is active rather than passive right now.
Context helps. Earlier in October, a monster print north of one billion dollars flowed into Bitcoin ETFs in a single session as price tagged fresh highs, a reminder that headline inflows often cluster near emotionally charged levels. That history makes last week’s steadier, mid-range rebound feel more durable, not less.
Price drivers to watch next
Flows do not move in a straight line. The week’s split sits against a backdrop of macro cross-currents, including intermittent risk-off wobbles and questions about policy data timeliness. Short squeezes and funding resets can add noise. Even so, the path of least resistance remains tied to whether Bitcoin ETFs keep printing green on more days than not, especially if breadth widens beyond a handful of big issuers. Recent records around 125,000 were pinned on ETF demand, so subsequent rallies will likely need the same sponsorship.
Ether’s challenge is more nuanced. Capital wants clarity on product design and the roadmap for yield features. Until those mechanics are settled, Ether funds may trade more like satellite positions in multi-asset portfolios, making them sensitive to weekly rebalancing. That does not preclude sharp risk-on weeks. It simply means the hurdle for sticky inflows is higher.
The bottom line
The week delivered a clean message. Bitcoin ETFs attracted fresh capital while Ether funds leaked. The daily swing back to inflows suggests the buyer is still there, even if conviction arrives in bursts. If the next few prints confirm breadth across issuers and steadier intake, price can follow. If not, expect more chop around well-watched levels while investors wait for the next catalyst.
Frequently asked questions
What exactly changed last week in ETF flows? Bitcoin ETFs added about 446 million dollars for the week that ended 24 October, while Ether funds lost about 244 million dollars, marking a clear divergence between the two largest crypto assets.
Did one big day drive the Bitcoin number? A single day near 21 October saw roughly 477 million dollars in net inflows, which helped flip the weekly tally back to positive after a red streak.
Are large daily inflows reliable signals for price? Huge prints can coincide with local peaks, as seen earlier in October, so traders often look for persistence across multiple sessions rather than one-off spikes.
What are analysts saying publicly? Nate Geraci highlighted multi-billion weekly intake for spot Bitcoin ETFs. Other analysts pointed to advisors dominating known Ether ETF holders, which can magnify tactical shifts.
Glossary of long key terms
Exchange-traded fund (ETF) A regulated fund that tracks an asset and trades on stock exchanges, allowing investors to gain exposure without holding the underlying coins.
Net inflows and outflows The difference between new money entering a fund and money leaving it over a set period. Positive net inflows imply demand, while outflows imply the opposite.
Advisor-dominated holder base A fund ownership profile where registered investment advisors represent a large share of known holders, which can increase sensitivity to model-driven rebalancing.
Product breadth across issuers A sign of healthier demand where multiple funds, not just one or two, attract consistent inflows, reducing reliance on a single vehicle for price support.
Metaplanet, widely known as “Japan’s MicroStrategy”, has taken a major step forward in its long-term strategy by launching a 75 billion JPY share repurchase program.
This comes after the company faced a setback with a decline in its mNAV, and aims to make better use of capital and boost returns for shareholders.
Metaplanet has established a share repurchase program to enhance capital efficiency and maximize BTC Yield. The Board also approved a credit facility to enable flexible execution as part of the company’s capital allocation strategy. https://t.co/zucPBrIqOQ
In its latest disclosure, Metaplanet noted that recent market volatility and a decline in its mNAV have led to its stock being undervalued.
The mNAV compares the company’s enterprise value to the market value of its Bitcoin holdings. When it falls below 1.0x, the company’s shares are seen as trading below their fair value based on BTC reserves.
To address this, Metaplanet launched a capital management plan designed to maximize BTC yield and improve capital efficiency.
Metaplanet’s stock is currently trading at 499 JPY, up 2.5% over the past day and roughly 18% over the last five days. Its mNAV has also recovered to 1.03 as of the time of writing.
The buyback program will cover up to 150 million common shares, representing about 13.13% of its total outstanding shares, excluding treasury shares. It will run from October 29, 2025, to October 28, 2026 and buybacks will be conducted through purchases on the Tokyo Stock Exchange under a discretionary trading agreement.
$500M Credit Line Announced
In order to give the company more flexibility in carrying out the repurchase program, the board has also approved a credit facility with a borrowing limit of up to USD 500 million (around JPY 76.4 billion).
This allows the company to secure funds using its Bitcoin holdings as collateral whenever needed. The funds raised could be used for additional Bitcoin purchases, investments in its Bitcoin Income business, or share buybacks.
The credit line also plays a major role in the Company’s financial strategy and is expected to serve as bridge financing ahead of its planned issuance of preference shares.
Metaplanet’s Capital Allocation Policy
Metaplanet has also created a new Capital Allocation Policy designed to maximize sustainable value creation. It will be guided by three fundamental principles.
Metaplanet plans to actively utilize preferred shares, to strengthen BTC yield and enhance long-term shareholder value. It will avoid new issuances when mNAV is below 1.0x, and pursue them only when mNAV exceeds 1.0x and valuations and strategic conditions clearly support long-term shareholder value.
And if mNAV falls below 1.0x, the Company will actively consider share buybacks to enhance BTC yield and shareholder value.
It also noted that the funding sources for share repurchases may include cash reserves, funds raised from preferred share issuances, credit facilities, or income generated by its Bitcoin-related business operations.
Since April 2025, the company has expanded its Bitcoin Treasury Strategy, now holding 30,823 BTC, making it the fourth-largest public Bitcoin holder globally and the largest in Asia.
The company is also committed to its long-term goal of acquiring 210,000 BTC by the end of 2027.
Despite what appears to have been a setback, Metaplanet continues to show strong conviction in Bitcoin’s long-term potential.
Bitcoin (BTC) price continues to trade with upward momentum, recently reclaiming levels above $113,000 as market sentiment leans cautiously optimistic. The market has followed suit, with speculation of whether this momentum can be sustained amid tightening liquidity and rising volatility. However, several technical indicators now suggest a potential cool-off phase. This raises concerns of a short-term correction below the $110,000 support zone.
Is BTC Price Heading for a Pullback?
After rebounding sharply from lows near $107,800 earlier this week, Bitcoin has steadily reclaimed lost ground, climbing back above the $113,000 mark. This recovery reflects renewed buying pressure around key demand zones, supported by improving market liquidity and increased spot trading activity. However, BTC now faces a crucial test near the $114,500–$115,000 resistance area, where profit-taking has historically intensified. Momentum indicators hint at potential exhaustion, suggesting that if Bitcoin fails to secure a daily close above this range, a corrective drop toward $110,000—or even lower—could soon follow.
Another major reason to be bearish on Bitcoin is the recently formed CME gap with the lower range close to $110,000.
Bitcoin’s rebound from the $107,800 lows has lifted prices toward $114,600, yet the move now encounters a key CME gap between $110,700 and $113,500, as highlighted on the chart. This unfilled gap has become a focal point for traders, as Bitcoin often revisits these levels before establishing a sustained trend. The Ichimoku Cloud currently acts as dynamic resistance, with the upper boundary near $115,700 aligning with the gap’s top.
Historically, BTC has tended to “fill” such CME gaps before reversing direction, suggesting a possible short-term rejection if momentum weakens. Meanwhile, the RSI around 51 signals a neutral bias, indicating potential consolidation before the next major move.
Wrapping it Up
The recent rebound in Bitcoin (BTC) price underscores improving short-term sentiment, but the broader market remains cautious amid low volatility and mixed macro cues. A decisive move beyond the $115,700 cloud resistance could reignite bullish momentum across major altcoins, fueling renewed inflows into risk assets. However, failure to clear this zone may keep BTC range-bound, with traders eyeing $110,000 as a key defensive level. With upcoming macro events and ETF flows influencing liquidity, Bitcoin’s next move could set the tone for the entire crypto market heading into November.
Open interest climbing from $25 billion to nearly $30 billion reflects fresh leverage entering the market — a double-edged sword that could amplify upside momentum above $112,000 but heighten liquidation risks below $110,000, an analyst noted.
Data shows the Bitcoin Fear & Greed Index has surged back into the neutral zone after the recovery rally in the cryptocurrency’s price.
Bitcoin Fear & Greed Index Now Has A Value Of 51
The “Fear & Greed Index” refers to an indicator created by Alternative that measures the average sentiment present among traders in the Bitcoin and wider cryptocurrency markets. The metric uses the data of the following five factors to determine the investor mentality: trading volume, market cap dominance, volatility, social media sentiment, and Google Trends.
The index uses a numerical scale running from zero to hundred for representing this sentiment. All values above 53 correspond to greed among the investors, while those below 47 to fear. The region between the two cutoffs naturally corresponds to a net neutral mentality.
Now, here is how the current Bitcoin market sentiment is like, according to the Fear & Greed Index:
As is visible above, the indicator has a value of 51, which suggests the trader sentiment is almost exactly in the balance right now. This is a notable change in market mood compared to just a few days ago.
As displayed in the chart, the Fear & Greed Index was inside the fear zone during the past few days. The despair among the traders was a result of the bearish price action that BTC had recently faced.
At one point, the indicator even fell to a low of 22, reflecting a state of “extreme fear.” This zone, which occurs below 25, corresponds to investors being the most bearish toward the market. There is a similar region for the greed side as well, called the “extreme greed,” situated above 75.
Historically, the extreme sentiments have been quite significant for Bitcoin and other cryptocurrencies, as they are where major tops and bottoms have tended to form. The relationship has been an inverse one, however, meaning extreme fear is where bottoms form, while extreme greed facilitates tops.
Since the extreme fear low earlier in the month, BTC has been on the way up, a potential indication that the contrarian signal of the sentiment may once again be in action.
The cryptocurrency has extended its recovery in a sharp manner during the last couple of days, which may be a potential reason why the Fear & Greed Index has surged back to the neutral territory now.
Though, for now, Bitcoin traders are still undecided on whether bullish action will follow next. It now remains to be seen whether they will embrace greed, or continue to be hesitant about the recovery.
BTC Price
At the time of writing, Bitcoin is floating around $114,900, up 3.6% over the last seven days.
Bitcoin price surged to $115,000 on Monday, rising more than 1% in 24 hours, as optimism over easing U.S.–China trade tensions and renewed investor appetite for risk assets lifted global markets.
According to Geoffrey Kendrick, Head of Digital Asset Research at Standard Chartered Bank, Bitcoin price may “never fall below $100,000 again” if this week’s macro tailwinds continue.
In a note to clients, Kendrick said that improving trade relations between Washington and Beijing have flipped last week’s market fear into “hope.”
U.S. Treasury Secretary Scott Bessent’s weekend statement that restrictions on China’s rare earth exports could be postponed for a year, combined with reports that Beijing plans to buy large quantities of U.S. soybeans, sparked a relief rally across equities, commodities, and crypto.
China, U.S trade deals and FOMC rate cuts
The agreement, expected to be finalized after the upcoming Trump–Xi summit in South Korea, has renewed risk appetite and pushed the bitcoin-to-gold ratio back above pre-October 10 levels — the date when 100% tariff threats sent markets tumbling.
Kendrick pointed to fresh inflows into spot bitcoin ETFs as another key signal of strength. Over $2 billion exited U.S. gold ETFs late last week, and if even half of that re-enters bitcoin funds, he said, it would mark a major vote of confidence.
The analyst also highlighted macro tailwinds, including expectations for a 25-basis-point rate cut at Wednesday’s Federal Open Market Committee (FOMC) meeting — a move widely seen as bullish for bitcoin.
Meanwhile, investors are watching a packed earnings calendar from both tech and crypto heavyweights. Microsoft, Meta, and Google are set to report on Wednesday, followed by Apple, Amazon, Coinbase, and Strategy (formerly MicroStrategy) later in the week.
“If this week goes well — bitcoin may never fall below $100,000 again,” Kendrick said.
Bitcoin price outlook
While bulls have made modest progress with Bitcoin, stronger resistance remains overhead at $117,600 and $122,000, leaving bears largely in control.
If Bitcoin manages to surpass $122,000, professionals note the next target could be the upper boundary of a broadening wedge pattern at $128,000.
Support levels remain critical for maintaining bullish momentum. The key short-term support at $106,900 held throughout last week, helping stabilize the market.
Falling below this level could open the path toward the $105,000–$102,000 support zone, which has already been tested twice, with a third test raising the likelihood of a breakdown.
Beyond that, $96,000 represents a crucial long-term support level for the broader bull market, acting as a do-or-die floor if prices decline further.
As of press time, bitcoin was trading at $115,041, up 1.22% over the past 24 hours.
Trump-linked American Bitcoin Corp, co-founded by Eric and Donald Trump Jr., just acquired 1,414 Bitcoins valued at $163 million, boosting its total holdings to 3,865 BTC worth nearly $445 million. Formed in March after a merger with Hut 8’s mining assets, American Bitcoin listed on Nasdaq in September. The company combines mining with direct buys, and now ranks among the top 25 public Bitcoin holders globally.
Metaplanet is seeking to maximize its Bitcoin returns be exercising a massive share buyback program. Metaplanet’s board has approved a large-scale ¥75.4 billion (~$500 million) share repurchase program as part of its Bitcoin-focused capital strategy. Announced on Oct. 28, the…
In the first-ever rating for a Bitcoin treasury company, S&P just rated Michael Saylor’s Strategy Inc. a B- junk credit. S&P Global Ratings has assigned Strategy Inc., the Bitcoin-treasury company formerly known as MicroStrategy, a B- credit rating, placing it six…
Bitcoin edged higher on Sunday as signs of easing US-China trade tensions lifted risk assets, while Strategy’s founder hinted the company kept adding to its Bitcoin holdings.
Strategy Keeps Buying
Michael Saylor posted a chart on October 26 that uses orange dots to mark recent purchases. The visual cue has become his shorthand for new buys.
Based on reports, Strategy added 387 BTC between October 13 and October 20, bringing its total to 640,418 BTC. That number is striking on its own. It shows a steady, deliberate approach to buying even when prices are volatile.
Strategy’s disclosed average cost for its Bitcoin stands at $74,010. The company’s moves lately have been small compared with September, when it took in more than 7,000 BTC across several large transactions. The size of any fresh purchases this week has not been publicly revealed.
At the same time, Bitcoin’s market moves were influenced by broader news. The price of Bitcoin rose about 1.6% on Sunday, while Ethereum gained roughly 2.8%. Short-term swings appear driven more by headlines than by a single company’s actions.
Based on reports, at prices a little over $115,000 per BTC, Strategy’s Bitcoin stash is valued at around $72 billion. That valuation implies a paper gain of more than $25 billion over a total cost basis of about $47.4 billion since the program began in 2020.
Reports have logged 83 separate purchase events in that time, a pattern that has left investors with a clear view of the firm’s playbook: buy repeatedly and report afterward.
Some of the buying was concentrated in September, when the firm added thousands of coins in a few large moves. Recently, however, allocations have looked smaller and more frequent. That shift suggests a preference for steady accumulation rather than single big bets.
Buying Behavior And Market Response
Strategy shares have been trading above the company’s net asset value. That fact suggests investors are comfortable owning MSTR as a way to gain Bitcoin exposure without buying the token directly. The company’s method — announce purchases after the fact and let the market reflect the holdings — has been consistent and predictable.
Geopolitical Headlines Drive Volatility
Meanwhile, officials from the US and China signaled progress in trade talks, and that helped calm some investors. According to reports, Scott Bessent told CBS News he expected the threat of 100% tariffs and an immediate export control regime to have receded.
Earlier in October, China announced tighter limits on rare earth exports used in chip manufacturing. On October 11, US President Donald Trump said he would impose an additional 100% tariff on Chinese goods and planned export controls on certain software to take effect on November 1.
Those days of sharp rhetoric caused heavy losses across markets and triggered one of the largest liquidation events in crypto this year.
Featured image from Gemini, chart from TradingView
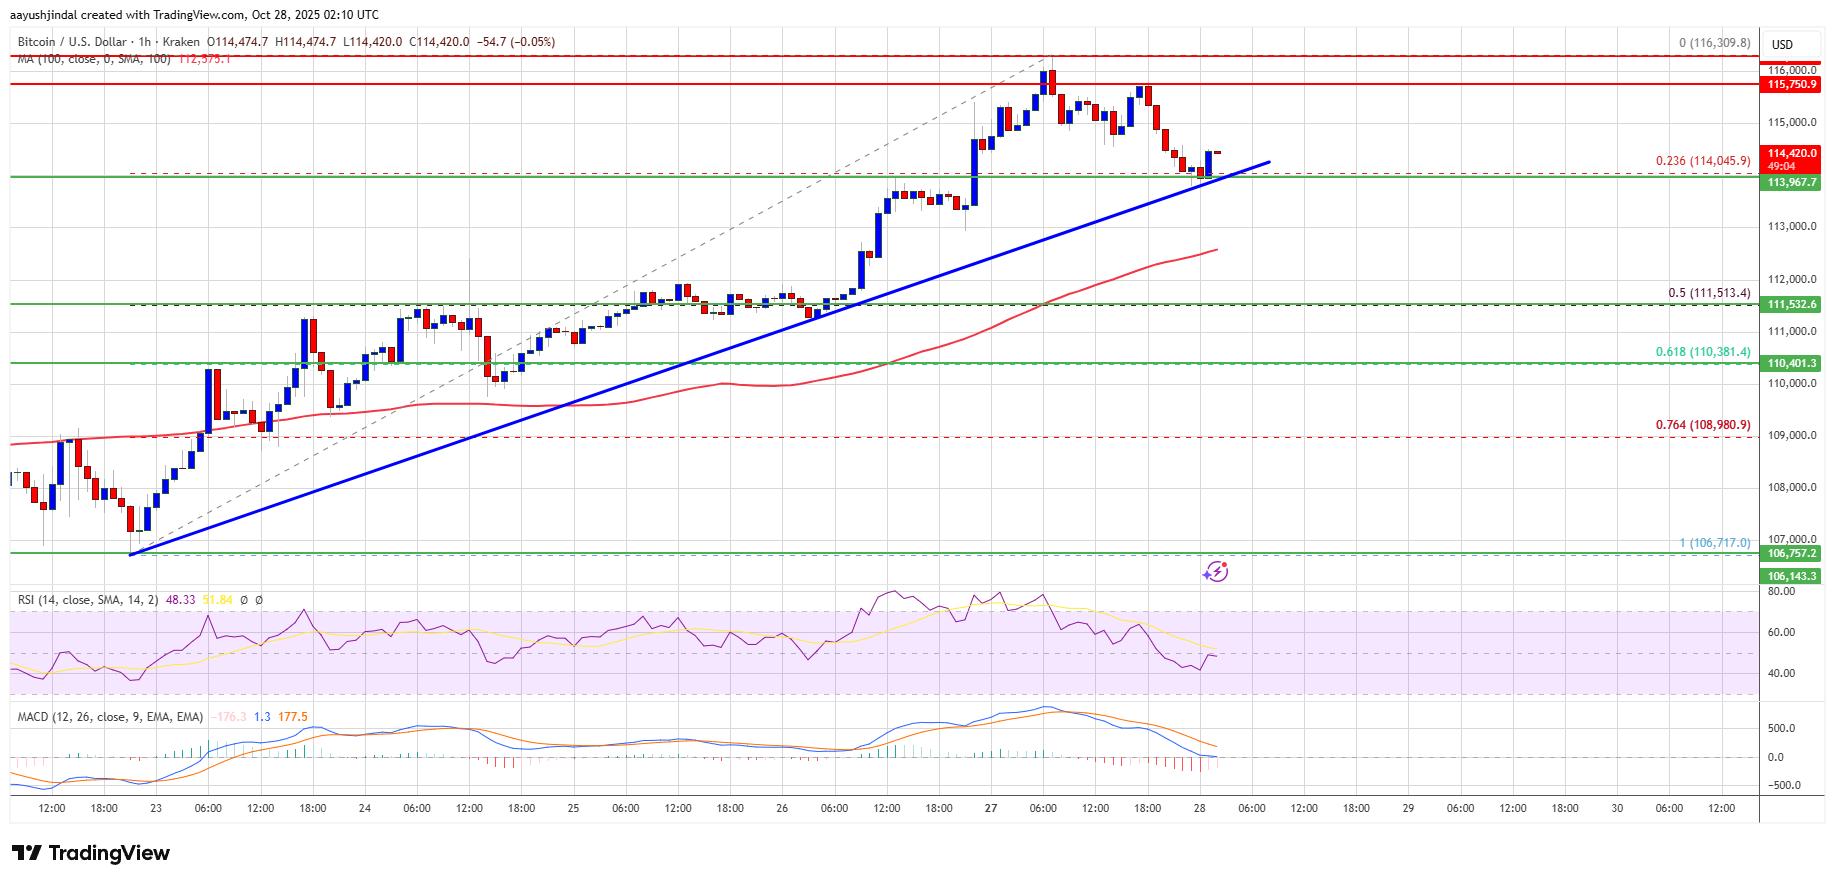
Bitcoin price is consolidating gains above $113,500. BTC could rise further if there is a clear move above the $115,750 resistance.
Bitcoin started a fresh upward move above the $114,000 resistance level.
The price is trading above $114,200 and the 100 hourly Simple moving average.
There is a bullish trend line forming with support at $113,900 on the hourly chart of the BTC/USD pair (data feed from Kraken).
The pair might continue to move up if it trades above the $115,750 zone.
Bitcoin Price Starts Consolidation
Bitcoin price formed a base and started a fresh increase above the $112,500 zone. BTC gained pace for a move above the main hurdle at $113,500.
It opened the doors for a move above $115,000 and the 100 hourly Simple moving average. Finally, the price spiked above $116,000 and is currently consolidating gains above the 23.6% Fib retracement level of the recent wave from the $106,718 swing low to the $116,309 high.
Besides, there is a bullish trend line forming with support at $113,900 on the hourly chart of the BTC/USD pair. Bitcoin is now trading above $114,000 and the 100 hourly Simple moving average.
Immediate resistance on the upside is near the $115,000 level. The first key resistance is near the $115,500 level. The next resistance could be $115,750. A close above the $115,750 resistance might send the price further higher. In the stated case, the price could rise and test the $116,300 resistance. Any more gains might send the price toward the $117,500 level. The next barrier for the bulls could be $118,000.
Another Pullback In BTC?
If Bitcoin fails to rise above the $115,500 resistance zone, it could start a fresh decline. Immediate support is near the $114,000 level. The first major support is near the $113,500 level or the trend line.
The next support is now near the $111,000 zone. Any more losses might send the price toward the $110,500 support in the near term. The main support sits at $108,500, below which BTC might struggle to recover in the short term.
Technical indicators:
Hourly MACD – The MACD is now gaining pace in the bullish zone.
Hourly RSI (Relative Strength Index) – The RSI for BTC/USD is now above the 50 level.
Major Support Levels – $114,000, followed by $113,500.
Data shows cryptocurrency short investors have suffered large liquidations during the past day as Bitcoin and altcoins have made a recovery.
Bitcoin, Ethereum Have Surged In The Last 24 Hours
Bitcoin and other cryptocurrencies have witnessed a rally during the past day, breaking away from the slump the market had earlier fallen into. At the height of this surge, Bitcoin broke past $116,000, while Ethereum touched $4,250.
The assets have since seen a small retracement. The chart below shows how BTC’s latest trajectory has looked.
At its current price of $115,400, Bitcoin is up about 4% on the weekly timeframe. Similarly, Ethereum at $4,160 is in a profit of 3.4%. Most other digital assets have seen similarly positive returns, although there are some outliers like Tron, which is down more than 7%. The market-wide recovery during the past day has meant that a large amount of short liquidations have piled up on the derivatives exchanges.
Crypto Market Liquidations Have Totaled At $467 Million
According to data from CoinGlass, about $467 million in cryptocurrency-related derivatives contracts have been liquidated over the last 24 hours. A contract is said to be “liquidated” when its platform forcibly shuts it down after it accumulates losses of a certain degree (as defined by the exchange).
Given that coins across the board have rebounded, the contracts crossing this threshold would mostly be the short ones. And indeed, the data would confirm so.
As is visible above, liquidations related to bearish cryptocurrency bets have reached $358 million in this window, representing 76.6% of the total flush in the sector. Bitcoin led the liquidations with $177 million in contracts involved, while Ethereum contributed the second most with $130 million in contracts. Out of the rest, Solana witnessed the largest flush at $34 million.
In some other news, Bitcoin spot exchange-traded funds (ETFs) have observed a notable amount of inflows over the past month, as CryptoQuant community analyst Maartunn has pointed out in an X post.
Spot ETFs refer to investment vehicles that allow investors to gain exposure to an asset without having to directly own it. The US SEC approved BTC spot ETFs in January of 2024. Here is the chart shared by the analyst that shows how the 30-day netflow for these vehicles has fluctuated since:
As displayed in the above graph, Bitcoin spot ETFs have seen inflows of $4.7 billion during the past month. Ethereum spot ETFs, which gained approval in mid-2024, have also enjoyed inflows in this period, although their value of $983 million is significantly less than BTC’s.
Bitcoin (BTC) is showing renewed strength, reclaiming the $115,000 level after weeks of volatility and uncertainty. Bulls are attempting to build momentum for a potential impulse move higher, aiming to confirm a sustained bullish structure after the recent consolidation phase.
On-chain data continues to reveal a clear and repeating pattern tied to investor behavior and market cycles. Historically, when the percentage of Bitcoin supply in profit climbs above 95%, the market tends to enter an overheated phase, often leading to sharp corrections. These pullbacks serve as natural cooling periods, resetting sentiment and liquidity before the next major leg up.
Interestingly, each correction cycle has shown consistent bottoming zones around the 75% threshold, where long-term holders reaccumulate and market confidence begins to rebuild. More specifically, data highlights profit supply lows of 73% in September 2024, 76% in April 2024, and a recent rebound from 81%, signaling a potential mid-cycle recovery phase.
Bitcoin Supply in Profit Rises to 83.6% — Momentum Rebuilds Ahead of Key Threshold
According to top analyst Darkfost, the percentage of Bitcoin supply in profit has started to climb again, currently standing at 83.6%. This steady rise indicates that a growing share of Bitcoin holders are once again sitting on unrealized gains — a trend that often reflects improving sentiment and renewed market confidence.
Darkfost notes that this level can be interpreted as encouraging, suggesting that investors are willing to hold their BTC instead of realizing profits, anticipating further upside in the near term. Historically, such behavior has been characteristic of mid-cycle recovery phases, when fear starts to fade and accumulation resumes across both retail and institutional segments.
This stage of the cycle is considered healthy for rebuilding momentum, as it allows the market to stabilize after large corrections. Holders who previously capitulated often reenter at this stage, while long-term participants strengthen their positions, creating a more resilient market structure.
However, Darkfost cautions that once the supply in profit surpasses 95%, it typically signals overheated market conditions — a point where euphoria tends to replace rational conviction. In such phases, Bitcoin historically faces increased volatility and sharp corrections as overleveraged traders and short-term speculators take profits.
Bitcoin (BTC) is showing renewed bullish momentum, trading around $115,443 and successfully reclaiming key short-term support levels after weeks of consolidation. The daily chart highlights a strong recovery structure, with BTC breaking above both the 50-day and 100-day moving averages, signaling a shift in short-term market sentiment.
The next critical test lies at $117,500, a historical resistance zone that previously rejected multiple attempts in September and early October. A clear breakout and daily close above this level would likely confirm an impulse continuation toward $120K–$125K, opening the door for a more sustained uptrend.
Momentum indicators suggest strengthening buying pressure, while the recent bounce from the 200-day moving average near $107K underscores the market’s resilience. This level acted as a springboard for the current rally, aligning with the broader pattern of accumulation seen on-chain, where investor profitability is rising steadily.
However, BTC remains within a range-bound structure, and rejection at $117.5K could trigger short-term consolidation back toward $111K–$112K. Overall, Bitcoin’s technical outlook appears constructive — if the bulls can sustain above $115K and confirm strength above $117.5K, the market could transition into a new bullish leg, supported by improving investor sentiment and on-chain health.
Featured image from ChatGPT, chart from TradingView.com
The Bitcoin price is positioning for a potentially explosive move that could take it well beyond its previous all-time highs. Analysts are closely watching a critical resistance level near $116,000, which may serve as the final hurdle before BTC catapults into uncharted territory above $126,000.
Analyst Predicts New Bitcoin Price All-Time High
Crypto analyst Donny Dicey revealed in an X social media post this week that the $116,000 price level is the decisive zone Bitcoin must breach to confirm a breakout toward a new all-time high. His technical analysis suggests that once BTC achieves a clean break above this resistance area, momentum could swiftly carry it above $126,000.
Notably, Bitcoin set a new ATH on October 6, 2025, after breaking through its previous record above $124,000 and climbing past $126,000. Since achieving this level, the price of BTC has fallen dramatically to $115,000. Dicey’s accompanying chart shows the market steadily recovering after testing support near $108,000, marked as a “market structure break” region, with bullish price action consolidating above $109,000.
The analyst has emphasized that each day Bitcoin maintains a close above $109,000 strengthens the probability of a strong upward swing as the market heads into November. This period coincides with the Federal Open Market Committee’s (FOMC) next meeting, where investors are anticipating dovish signals such as rate cuts or the formal end of Quantitative Tightening (QT).
Dicey also notes that bullish S&P 500 earnings, easing global trade tensions from a potential agreement between US President Donald Trump and China’s President Xi Jinping, and improving ISM manufacturing data point to a macro environment supportive of risk assets. A community member commented that whales may have underestimated how much BTC’s demand tends to persist during these conditions. Dicey responded that the same whales might become “exit liquidity” as Bitcoin accelerates higher, possibly missing out on the strongest phase of this cycle.
Consolidation Above January Highs Signal Unbreakable Strength
In a follow-up analysis, Dicey highlighted Bitcoin’s remarkable stability above its January highs, describing its price structure as “unbreakable” amid global macroeconomic uncertainty. He pointed to several converging factors that reinforce BTC’s resilience, including ongoing fiscal and monetary expansion, a weakening US dollar, and renewed confidence in the global business cycle.
The analyst also emphasized that geopolitical tensions tied to US-China relations appear to be subsiding. At the same time, ETF inflows and exponential growth in the Artificial Intelligence (AI) sector contribute to acting as tailwinds for digital assets. He disclosed that despite strong underlying fundamentals, skepticism remains widespread in the market.
According to him, many still believe in the traditional four-year cycle narrative, while retail enthusiasm has not fully returned. Furthermore, the Russell 2000 index has yet to breakout, and rotation from traditional assets, such as the S&P 500 and gold, into Bitcoin remains limited. With these developments subduing broader market participation, Dicey suggests it creates the perfect setup for a powerful rally in BTC once sentiment shifts decisively.
Bitcoin’s price action was rather subdued last week, keeping traders guessing whether or not we would see another large drop in price entering the weekend. Price held above the lows, however, slowly plodding a little bit higher to close out the week at $114,530. Bulls should not be overly disappointed with this price action, as they did reclaim the $112,200 resistance level, and are now closing in on conquering the next resistance level at $115,500. The bears are still sitting comfortably in control, though, with stronger resistance levels hanging overhead that the bulls have yet to challenge. This may be an interesting and volatile week ahead, with the FOMC meeting on Wednesday and a slough of large companies reporting third-quarter earnings.
Key Support and Resistance Levels Now
Nothing has materially changed from last week’s resistance levels as the bulls have made little progress. Heavy resistance is still sitting at $117,600 and $122,000 above there, so the bears aren’t feeling any real pressure yet. If by chance this week gets above $122,000, we will look to the upper boundary of our broadening wedge pattern at $128,000.
Holding above the prior week’s low is a positive sign for the bulls, while they managed to maintain price above the key short-term support of $106,900 last week as well. This level must hold going forward, as closing below $106,900 opens the door back down to the $105,000 to $102,000 support zone that has already been tested twice. A third test of this support zone would be more likely to break it than to hold it. $96,000 is the long-term bull market support below here, a do-or-die support level if the price were to slide down and test it.
Outlook For This Week
Expect significant volatility this week, especially on Wednesday, as we have the Federal Reserve’s interest rate decision and ensuing Powell speech, followed by major earnings reports from Microsoft, Meta, and Google after market close. Bulls will look to hold $109,000 as a floor into this week, as doing so would position them to maintain upward momentum. Looking at the Momentum Reversal Indicator, we are currently sitting on an 8-count entering Monday. This is a warning candle that we may see momentum begin to fade. Tuesday should bring the 9-count at which point we should expect at least a pause on upward momentum and a 1 to 4 day correction in price. So if bulls can push price up to the 0.618 Fibonacci Retracement at $117,600 by Monday night or Tuesday morning, we should expect to see a rejection ther,e and we can re-assess after Wednesday’s FOMC and earnings reports play out.
Market mood: Bearish – While the bulls gained some ground last week, the bears remain stoic and strong. The bulls must push the price past $122,000 to take back control.
The next few weeks If bulls can manage to survive through this week, there are still some potential headwinds on the horizon. The US-China tariff dispute may or may not be resolved by the end of next week; a negative outcome will likely send all markets lower. Additionally, the US courts’ ruling on the legality of Trump’s tariffs is expected by November 5th. If these tariffs are reinstated, we should expect markets to head lower to price this impact in.
Terminology Guide:
Bulls/Bullish: Buyers or investors expecting the price to go higher.
Bears/Bearish: Sellers or investors expecting the price to go lower.
Support or support level: A level at which the price should hold for the asset, at least initially. The more touches on support, the weaker it gets and the more likely it is to fail to hold the price.
Resistance or resistance level: Opposite of support. The level that is likely to reject the price, at least initially. The more touches at resistance, the weaker it gets and the more likely it is to fail to hold back the price.
Fibonacci Retracements and Extensions: Ratios based on what is known as the golden ratio, a universal ratio pertaining to growth and decay cycles in nature. The golden ratio is based on the constants Phi (1.618) and phi (0.618).
Broadening Wedge: A chart pattern consisting of an upper trend line acting as resistance and a lower trend line acting as support. These trend lines must diverge away from each other in order to validate the pattern. This pattern is a result of expanding price volatility, typically resulting in higher highs and lower lows.
Momentum Reversal Indicator (MRI): A proprietary indicator created by Tone Vays. The MRI indicator tracks buyer and seller momentum and exhaustion, providing signals to indicate when to expect momentum to fade and accelerate.
American Bitcoin Corp. (Nasdaq: ABTC), a Trump family–backed mining platform, has expanded its Bitcoin holdings to 3,865 bitcoin, adding 1,414 bitcoin since September through a combination of mining production and secondary market purchases.
The Miami-based firm, which describes itself as “America’s Bitcoin infrastructure backbone,” said the latest accumulation includes coins held in custody and those pledged for miner purchases under its ongoing procurement deal with Bitmain.
The update continues a rapid expansion trajectory that began earlier this year when Hut 8 spun out its U.S. mining arm as a separate, publicly traded entity.
American Bitcoin initially held around 500 BTC at the time of the carve-out, then purchased another 1,726 BTC between July and August for approximately $205 million.
Those holdings were pledged to Bitmain as collateral for a $314 million order of 16,299 Antminer U3S21EXPH units — nearly the full 15 EH/s option under the companies’ strategic supply agreement. Most of those machines will be hosted at Hut 8’s new Vega site in Texas, a 400-megawatt facility central to American Bitcoin’s push toward 25 EH/s of proprietary hashrate.
“We believe one of the most important measures of success for a Bitcoin accumulation platform is how much Bitcoin backs each share,” said Eric Trump, co-founder and chief strategy officer. “As part of that conviction, we are focused on providing transparent updates as we aim to increase our holdings.”
JUST IN: Trump Family-backed BTC miner American Bitcoin acquires 1,414 Bitcoin.
Executive Chairman Asher Genoot added that American Bitcoin’s integrated mining model allows it to lower its average cost per Bitcoin compared with treasury-style vehicles that buy on the open market.
“That structural advantage allows us to compound Bitcoin value per share more efficiently for our investors,” he said.
Shares of ABTC have been volatile since their September debut, rising 11% on Friday to close at $5.62 after recovering from midweek lows below $5.
The company, valued around $5.1 billion, remains one of the most closely watched plays in the sector — both for its aggressive expansion plans and its deep ties to the Trump family.
At the time of writing, the stock is trading at $5.83 and Bitcoin is trading at $115,000 after a couple of tumultuous weeks.
Gryphon, American Bitcoin merger
Earlier this year, Gryphon Digital Mining merged with American Bitcoin Corp., the Trump family–backed subsidiary of Hut 8, to form what they claim could become the most efficient pure-play Bitcoin miner in the industry.
The all-stock merger saw Gryphon shareholders own about 2% of the combined entity and American Bitcoin stakeholders hold 98%.
The merger, now finalized, provides American Bitcoin with a faster route to public markets and combines Gryphon’s mining technology with American Bitcoin’s capital strength and large-scale reserve strategy.
Michael Saylor’s Strategy continues to buy Bitcoin, despite the asset trading near historic highs. While markets debate whether bitcoin is overheated, Michael Saylor is still buying, showing his continued confidence in BTC’s long-term trajectory. On Monday, September 27, Strategy reported…
How did a lone Bitcoin miner beat one-in-ten-million odds to find a block worth $347,000, and what does it reveal about solo mining in 2025? Solo miner claims rare Bitcoin win A recent post on Reddit’s r/Bitcoin community caught the…
The Robert Kiyosaki Ethereum prediction says that Ethereum, which is trading around $4,170, could be at the start of a big rise. Robert Kiyosaki believes this price level may give patient investors a strong chance to grow their wealth.
Robert Kiyosaki, the writer of Rich Dad Poor Dad, shared his opinion that Ethereum today reminds him of Bitcoin in the early days. He stated that people buying Ethereum will one day experience the same gains as those who bought Bitcoin when it was also valued at around $4,000.
Who is Robert Kiyosaki and What Does His Ethereum Prediction Mean?
Famous author and investor Robert Kiyosaki, the author of Rich Dad Poor Dad, often expresses his belief in the value of owning real assets, not just depending on paper money.
Recently, he has taken a strong liking to Ethereum and its future value. Robert Kiyosaki’s Ethereum prediction reflects his belief that Ethereum could have a run like Bitcoin.
Why Is Robert Kiyosaki Suddenly Bullish on Ethereum?
Robert Kiyosaki is excited about Ethereum because he believes that fiat currencies are in decline, and he believes that investors will need real digital assets for security throughout the rest of their lives.
Robert Kiyosaki is known for leading the use of gold, silver and Bitcoin, and now he has classified Ethereum with them. The Robert Kiyosaki Ethereum prediction focuses on the fact that ETH is real money due to its utility and scarcity driving its value.
What Makes Ethereum a Key Player in Kiyosaki’s View?
In his recent talk, Robert Kiyosaki said Ethereum has many real uses, such as in finance and smart contracts. He explained that these uses make it much more than just a coin to trade.
The Robert Kiyosaki Ethereum prediction says that real and practical uses could help Ethereum rise over time. He thinks that these uses will keep attracting more people and businesses to the network.
How Does Ethereum Compare to Bitcoin in This Context?
Kiyosaki’s comparison between Ethereum at $4,000 and Bitcoin when it was at the same price has drawn strong attention. He believes both reached a point where more people could begin to use them widely.
The Robert Kiyosaki Ethereum prediction presents ETH as the next version of Bitcoin with similar potential for major growth. Kiyosaki thinks Ethereum could follow a path like Bitcoin’s as blockchain technology continues to develop.
What Are Experts Saying About His Forecast?
Analysts say Robert Kiyosaki’s opinions often shape how investors think because of his long experience in finance. Some experts share Kiyosaki’s positive outlook and note that Ethereum has a solid network with updates that could make it quicker and easier to use. They believe these changes may help its value grow over time.
Other analysts point out that Bitcoin has a fixed supply, while Ethereum’s supply can change depending on network activity. Because of this, they say the prices of the two coins may not always move in the same direction.
Even so, the faith expressed in the Robert Kiyosaki Ethereum prediction keeps people in the market talking. Many investors are watching closely to see how Ethereum’s value will change in the future.
The Broader Meaning Behind Kiyosaki’s Statement
Kiyosaki often talks about the idea of saving what he calls real money, such as gold, silver, Bitcoin, and now Ethereum. This shows that he does not fully trust traditional paper currencies.
He said that people who buy Ethereum at $4,000 could be like those who bought Bitcoin when it was at the same price. Through the Robert Kiyosaki Ethereum prediction, he points to Ethereum as both a way to protect wealth and a chance for future growth.
The Practical Strengths Supporting Ethereum’s Case
Ethereum’s staking system, support for NFTs, and growing interest from large investors make it different from many other digital assets. Kiyosaki pointed to these features as key reasons Ethereum could perform well over time.
He believes these strengths prove that Ethereum holds true and lasting worth in the market. The Robert Kiyosaki Ethereum prediction links these strong points to a chance for a big increase in value.
Kiyosaki thinks Ethereum could grow the same way Bitcoin did when it first started rising. He believes it has the power to play a big part in the future of online investing.
Could Kiyosaki’s Perspective Signal a Market Turning Point?
When a well known investor like Robert Kiyosaki shares his thoughts, many people in the market pay attention. His view on Ethereum strengthens the idea that blockchain assets are becoming an important part of today’s investments.
The Robert Kiyosaki Ethereum prediction invites people to see crypto as more than just a gamble. It suggests that digital assets can be real tools for building wealth as technology continues to evolve.
Conclusion
The Robert Kiyosaki Ethereum prediction presents Ethereum at $4,000 as the starting point for a new era of digital growth. Although no prediction can be guaranteed, Kiyosaki’s belief matches the wider view that blockchain technology is shaping the future of finance.
If his idea turns out to be right, those investing in Ethereum today could see success similar to early Bitcoin holders. This makes his prediction one of the most closely followed in the cryptocurrency world.
Glossary
Generational Wealth: Wealth saved to help future family members.
Passive Income: Money that keeps coming in without daily work, like staking rewards.
Staking: Keeping crypto locked to help its system and earn more coins.
Blockchain: A secure digital book that records every crypto transaction.
Robert Kiyosaki: A famous author who teaches people smart ways to handle money.
Frequently Asked Questions About Robert Kiyosaki’s Ethereum Prediction
What did Robert Kiyosaki say about Ethereum?
He said buying Ethereum at arround $4,000 could be a big chance, like buying Bitcoin early.
Why is Kiyosaki bullish on Ethereum?
He thinks Ethereum has strong use in DeFi, gaming, and AI, and could build wealth over time.
Does Kiyosaki think Ethereum is the next Bitcoin?
Yes, he thinks Ethereum could become as big as Bitcoin one day.
What does Kiyosaki mean by “real money”?
He means assets like gold, silver, Bitcoin, and Ethereum that hold value over time.
Can Ethereum give passive income?
Yes, through staking, users can earn rewards for helping run the Ethereum network.
MSTR stock price remained under pressure on Monday after Michael Saylor’s Strategy continued its Bitcoin accumulation. Strategy stock was trading at $294, down by 36% from its highest point this year and 46% below its all-time high of $542. This…
What began as a triumphant October for bitcoin quickly devolved into chaos as a $19 billion derivatives wipeout and a 17% price plunge left traders reeling.
As October draws to a close, optimism around Bitcoin price prediction 2025 is heating up. With BTC reclaiming key technical levels and macro events aligning in the final week of the month, November could emerge as the ignition point for a major bullish phase across crypto markets led by Bitcoin’s resurgence.
Macro Triggers Align for a Perfect Storm
This final week of October is shaping up to be one of the most pivotal in months. Multiple macro catalysts are converging simultaneously, as an analyst has mentioned that the end of quantitative tightening (QT) could be near, potential rate cuts have a higher likelihood than ever, a $1.5 trillion liquidity injection could boost US sentiment, and renewed U.S.-China cooperation could completely rejuvenate the market.
If these developments unfold as anticipated, the result could be a massive surge in global liquidity and risk appetite. The combination of macro, liquidity, and narrative dynamics sets a near-perfect stage for a breakout going into November.
Bitcoin price today is trading around $115,196, marking a sharp 12% rebound from its mid-October low of $103,750. This surge has propelled BTC price above its 200-day EMA, a historically significant indicator.
The last time Bitcoin crossed this level was in Q2 2025, it triggered a powerful upward rally, and similar momentum appears to be building again.
On the Bitcoin price chart, the move above all above major EMAs into new support zones. Now, sustaining above them reinforces bullish sentiment and increases the likelihood of continued upside in the BTC price USD range.
Based on the bullish circumstances from this week’s event, the coming November could see the primary target of $ 130,000 and the next target at $ 145,000 before the year concludes, if bullish momentum continues.
ETF Inflows Return as On-Chain Metrics Flash Green
Following a series of outflows, Bitcoin ETF products are now experiencing net positive inflows. On October 24, $90 million in fresh institutional capital flowed into Bitcoin ETFs, signaling renewed investor confidence.
If this momentum continues, october ending days could attract even more institutional liquidity into the market before heading into November.
Simultaneously, on-chain data reveals a steep decline in Bitcoin exchange reserves since September, implying mass accumulation by long-term holders.
Over the past ten days, nearly 7 million BTC have moved back into profit territory, including 5.1 million coins held by investors under six months, per an CryptoQuant insight. This shift indicates growing conviction among newer market participants and a strengthening market structure.
Psychological Shift Reinforces Bitcoin Price Forecast November 2025
Behaviorally, profitability breeds confidence. As short-term holders see consistent gains, they’re less likely to sell prematurely and more inclined to add to positions. This gradual transformation from short-term speculation to medium-term conviction is a hallmark of early bull market phases.
If Bitcoin maintains its position above these realized price levels, it could confirm a structural transition back to optimism potentially paving the way for another leg up in the broader crypto rally. With momentum, macro alignment, and ETF inflows all trending upward, the Bitcoin price prediction 2025 looks increasingly promising.
FAQs
How much will 1 Bitcoin cost in 2025?
As per Coinpedia’s BTC price prediction, the Bitcoin price could peak at $168k this year if the bullish sentiment sustains.
How much will 1 Bitcoin be worth in 2030?
With increased adoption, the price of Bitcoin could reach a height of $901,383.47 in 2030.
How much will the price of Bitcoin be in 2040?
As per our latest BTC price analysis, Bitcoin could reach a maximum price of $13,532,059.98
How high will Bitcoin go in 2050?
By 2050, a single BTC price could go as high as $377,949,106.84
Strategy acquired 390 BTC for approximately $43.4 million, at an average price of $111,053 per bitcoin, achieving a strong 26% yield in 2025 year-to-date. As of October 26, 2025, the company holds a total of 640,808 BTC purchased for around $47.44 billion, with an average cost of $74,032 per bitcoin. This reflects MicroStrategy’s continued confidence and aggressive strategy in bitcoin accumulation and investment growth this year.
Switzerland parliament member Samuel Kullmann reveals that he is currently working to incorporate Bitcoin into the constitution and national reserves. According to a video circulating online, Swiss MP Samuel Kullmann said that he and his team are working towards getting…
American Bitcoin is rapidly approaching a 4,000 BTC treasury, with its holdings now at 3,865 BTC following a disciplined period of accumulation and mining. According to a press release dated Oct. 27, American Bitcoin Corp. executed a significant accumulation play,…
The market opens with a calmer stride. Crypto prices reflect a modest bid across majors as funding normalizes and forced selling cools. Traders are watching policy signals and liquidity conditions, with attention on whether easing talk translates into sustained flows. Positioning looks cleaner than it did late last week, which tends to reduce whipsaws and gives price action a chance to breathe.
Bitcoin (BTC)
Bitcoin trades in a tightened range, and that alone feels constructive after a choppy weekend. The first task for bulls is to defend recent higher lows while pressing toward the upper band of resistance seen in overnight trade.
Derivatives data shows a softer pace of liquidations than earlier in the week. When volatility cools without a sharp drop in open interest, it often signals that participants are rebuilding positions with more caution. If macro headlines lean supportive, crypto prices can grind higher as systematic buyers follow momentum signals.
Ethereum (ETH)
Ethereum continues a measured catch-up. The market likes the improving depth on major pairs and the narrative around network activity stabilizing after the last burst of upgrades. Traders are focusing on the 4,200 to 4,300 zone as a pivot that can flip sentiment from cautious to constructive.
If spot demand holds into the close, the door opens for a test of the next shelf above. In that scenario, crypto prices for ETH tend to pull alt liquidity with them, especially in high quality large caps.
Ripple (XRP)
XRP is steady after recent swings. The coin’s behavior has been textbook range trading, with quick fades at resistance and fast rebounds near support. That rhythm suggests market makers are active and retail is respecting levels. A clean close above the mid-range would encourage momentum accounts to re-engage. If the tape stays quiet, crypto prices for XRP likely chop within the band until a higher time frame catalyst arrives.
BNB
BNB holds its footing above the prior breakdown area, which is a small but notable positive. The spot book shows buyers willing to defend incremental dips, and that has reduced the frequency of sharp wicks. The pair’s next step is to stabilize volume on up days rather than clustering activity during selloffs. If that shift continues, crypto prices for BNB can lean into a slow stair-step higher rather than relying on one-off squeezes.
Solana (SOL)
Solana carries a confident tone when broader risk appetite improves. Recent sessions show buyers returning on shallow pullbacks, which is usually a sign that intraday participants expect follow-through. A
s long as the market respects the nearest support shelf, the path of least resistance remains to the upside. Should liquidity thin out, the pair can still experience quick air pockets, but the medium view improves if higher lows keep printing. That backdrop often helps crypto prices across adjacent high beta names.
Context that matters beyond the tick-by-tick
Macro expectations sit front and center. A friendlier path for policy usually eases financial conditions, lowers discount rates, and supports risk assets. On the micro side, the liquidation profile has cooled and sentiment sits close to neutral. Neither euphoria nor panic is in control, which is often the recipe for a grind rather than a spike.
If exchange flows and spot demand improve together, crypto prices tend to hold gains more easily, and leadership broadens beyond a single coin.
Conclusion
This is a healthier tape than a few days ago. Bitcoin is calm, Ethereum is building, and the rest of the board is following in a sensible way. It is not a victory lap, but it is constructive. If macro signals remain supportive and the derivatives picture stays balanced, crypto prices can continue to firm into the week. If the tone sours, expect a quick check of nearby support, followed by another attempt to reset and climb.
Frequently Asked Questions
Where can readers see live crypto prices for top coins like BTC and ETH? Live quotes are available on major price dashboards and institutional terminals. The figures in this article come from real-time market feeds.
Why do policy odds affect crypto prices? Rate expectations change the price of liquidity. Easier policy often supports risk assets by lowering discount rates and easing financial conditions.
Do liquidations always push markets higher afterward? No. Large short liquidations can fuel a bounce, but if demand is weak, the effect fades quickly. Context matters.
Glossary of long key terms
Open interest The total number of outstanding futures or options contracts. Rising open interest with rising crypto prices can signal trend confirmation.
Market capitalization The combined value of all circulating crypto assets. It helps frame market size and dominance when comparing segments.
Policy rate probabilities Implied odds from futures that estimate the chance of an interest rate move at an upcoming meeting. Traders watch these odds because shifts can move crypto prices.
Liquidations Forced closures of leveraged positions when margin is insufficient. Heavy short liquidations can reduce immediate selling pressure and sometimes lift crypto prices.
Bitcoin price has regained momentum as supply in profit rises and trend strength improves. As of this writing, Bitcoin is up 4% over the last day, trading at about $116,030. Now up 5.1% for the week and 5.7% for the…
According to NYDIG research, Bitcoin’s price moves are driven more by the strength of the US dollar and broad liquidity conditions than by direct ties to inflation.
Greg Cipolaro, NYDIG’s global head of research, said the data show weak and inconsistent links between inflation measures and Bitcoin. That view shifts attention away from the old narrative that Bitcoin is mainly an inflation hedge.
Inflation Link Weak
Cipolaro argued that expectations for inflation are a slightly better signal than headline inflation readings, but still not a tight predictor of Bitcoin’s price.
Instead, Bitcoin and gold both tend to gain when the US dollar weakens. While gold’s inverse relation with the dollar is long established, Bitcoin’s opposite movement to the dollar is newer but visible.
Gold And Bitcoin React To Dollar Moves
Based on reports, gold has historically climbed as the dollar falls. Bitcoin is following that pattern, though its correlation is less steady than gold’s.
As Bitcoin becomes more connected with mainstream finance, NYDIG expects that its inverse relationship with the dollar will likely strengthen.
This makes sense to traders who price everything in dollars and seek alternatives when the greenback loses purchasing power.
Interest Rates And Money Supply
Cipolaro highlighted interest rates and money supply as the two major macro levers that move both gold and Bitcoin.
Lower interest rates and looser monetary policy have tended to support higher prices for these assets.
In simple terms: when borrowing costs drop and liquidity rises, Bitcoin often benefits. The note framed gold as more of a real-rate hedge, while Bitcoin is described as acting like a gauge of market liquidity — a subtle but important distinction for investors.
Illiquid Supply Drops, Selling Pressure Returns
On-chain data show signs of renewed selling. Reports say illiquid Bitcoin — coins held in long-dormant wallets — fell from 14.38 million earlier in October to 14.300 million on the 23rd of October.
That change means roughly 62,000 BTC, worth about $6.8 billion at recent prices, moved back into circulation. In the past, large inflows did exert price pressure. In January 2024, a substantial sum of coins came available that caused the price momentum to soften.
According to Glassnode data, there has been a consistent selloff from wallets holding from 0.1 to 100 BTC, and first-time buyer supply has contracted down to ~213,000 BTC.
The overall assessment from a macro perspective and on-chain metrics is not favorable. Demand from new buyers appears to be lighter, momentum traders appear to have stepped aside, and more coins are now available to trade. This combination can blunt rallies or deepen pullbacks until liquidity conditions improve or the dollar weakens.
Featured image from Gemini, chart from TradingView
Over the years, a number of indicators have emerged that have often helped to pinpoint the Bitcoin bull market peak. These indicators have been triggered in previous cycles, and their triggers have often been a signal that it was time to get out of the market, as a new bear market is underway. However, this time around, even with the Bitcoin price hitting multiple new all-time highs, none of these cycle peak indicators have been triggered, suggesting that the market top has yet to be reached.
0 Out Of 30 Bull Market Peak Indicators Triggered
The Bull Market Peak Indicator tracker on the Coinglass website follows a total of 30 indicators that follow 30 indicators that show the progress of the Bitcoin bull market toward reaching a top. Some major ones include the Bitcoin Bubble Index, the Puell Multiple, the Bitcoin Rainbow Chart, and the Altcoin Season Index, among others.
Usually, these indicators are tracked on a scale of 0-100%, with 0% meaning that it is far from being triggered and 100% showing that an indicator has been triggered. If only a few of these get to the 100% mark and are triggered, it usually doesn’t mean that the Bitcoin peak has been reached.
However, even now, not one of these indicators has been triggered. Most continue to remain quite low, while the likes of the Bitcoin dominance are high, but still have not been triggered. For there to be a definite progress toward the Bitcoin market peak, at least half of these would have to be triggered.
What This Means For Investors
Since none of the bull market peak indicators have been triggered, it means that the Bitcoin price might actually be far away from its all-time high. With the score still being 0 out of 30, it points to this being a time to hold, despite the declines that the market has suffered recently.
According to a previous report from Bitcoinist, this was the case a few months ago, and now two months later, the tracker remains the same. Thus, it could be that $126,000 is not the all-time high for Bitcoin, and that the market could end up getting an altcoin season after all.
In the case that more than half of the bull market peak indicators do get triggered, then it means that the top of the market is getting close. Once it gets to 30/30, then it signals the start of the next bear market, and this is when selling is at its highest in the market, leading to rapid price declines across the board.
The crypto market today is witnessing explosive momentum as Bitcoin surges past the $115,000 mark, reigniting bullish sentiment across the board. Major altcoins like VIRTUAL, ZEC & DASH are skyrocketing, reflecting renewed investor confidence and growing market liquidity ahead of a high-volatility week. With traders eyeing key macro events and technical breakouts, the digital asset space is buzzing with optimism. The big question now—can this rally be sustained, or is the market gearing up for another round of sharp corrections?
Over the past few months, the Virtual Protocol price has been stuck within a descending parallel channel. The token attempted a breakout that resulted in forming yet another lower high, indicating the rising strength of the bears. However, it has broken above the structure following a strong influx of buying volume that suggests the VIRTUAL price is poised for a strong upswing.
The price broke above the channel with a huge rise in the buying pressure; however, the technicals point towards a consolidation ahead of the next breakout. The RSI entered the overbought range and appears to be flattening. On the other hand, On-Balance Volume spiked and continues to maintain a steady rise. Flattening RSI & rising OBV is usually a bullish signal, hinting towards accumulation during consolidation. It implies that smart money is quietly buying regardless of price movement and creating bullish pressure beneath the surface.
Therefore, traders can expect a cooling phase before breaking the resistance zone between $1.86 and $1.94 that may pave the way beyond $2 to reach $2.1.
Zcash (ZEC) Price Eyes 35% Rise to Hit $500
Zcash price is witnessing one of the bulliest months, not seen in the past few years. The buying volume rose back to the 2021 bull run days, which helped the price mark a steep rise after following a prolonged ascending consolidation. Currently, the ZEC price has surpassed one of the important resistances, which was the market top during the 2021 bull run. If the price sustains within the range, a continued upswing may help the price break higher targets.
As seen in the above chart, the ZEC price has broken the resistance zone between $293 and $316 and closed the weekly trade above this range. This suggests the bulls have held a tight grip over the rally, and the momentum may not fade as OBV remains escalated. Interestingly, the 50/200 weekly MA underwent a bullish crossover that could help the token sustain the upward trend and push towards the higher targets at 1.2 FIB at $471 and 1.4 FIB at $522.
Regardless of the 20% Jump Dash (DASH) Price Awaits a Breakout
Ever since the rally rose above the impact of the 2022 bear market, the DASH price has been stuck within a massive descending parallel channel. Every attempt of the token to break the resistance has resulted in a strong rejection, while the current scenario raises some hopes. The price has been defending the pivotal support just above $40 for a few weeks and hence flashes a huge possibility of a breakout above $60 in the coming days.
The DASH price remains within the descending parallel channel but has secured the pivotal support at the 200-day MA. With the volume spiking to the highest levels not seen in recent times, a breakout from the range could be imminent. On the other hand, the RSI has yet again entered the overbought range. Previously, this move followed a steep rejection, but the current rebound suggests there could be more room for the price to rise. Therefore, once the RSI reenters back into the overbought range, the price could break the channel and rise above the resistance zone between $61 and $63.
Once these levels are secured, the Dash price may enter a strong bullish trend and probably reach $100 in 2025.
Bitcoin price is attempting to recover above $113,500. BTC could rise further if there is a clear move above the $115,500 resistance.
Bitcoin started a fresh recovery wave above the $113,500 resistance level.
The price is trading above $114,000 and the 100 hourly Simple moving average.
There is a bullish trend line forming with support at $113,350 on the hourly chart of the BTC/USD pair (data feed from Kraken).
The pair might continue to move up if it trades above the $115,500 zone.
Bitcoin Price Starts Fresh Increase
Bitcoin price declined again below the $108,000 level. BTC tested the $106,720 zone and recently started a fresh increase. There was a move above the $112,000 resistance level.
The bulls were able to pump the price above $113,500 and the 100 hourly Simple moving average. Finally, the price spiked above $115,000 and is currently consolidating gains above the 23.6% Fib retracement level of the recent wave from the $106,718 swing low to the $115,400 high.
Besides, there is a bullish trend line forming with support at $113,350 on the hourly chart of the BTC/USD pair. Bitcoin is now trading above $114,000 and the 100 hourly Simple moving average.
Immediate resistance on the upside is near the $115,250 level. The first key resistance is near the $115,500 level. The next resistance could be $116,200. A close above the $116,200 resistance might send the price further higher. In the stated case, the price could rise and test the $117,000 resistance. Any more gains might send the price toward the $118,000 level. The next barrier for the bulls could be $118,800.
Another Pullback In BTC?
If Bitcoin fails to rise above the $115,500 resistance zone, it could start a fresh decline. Immediate support is near the $114,000 level. The first major support is near the $113,500 level or the trend line.
The next support is now near the $111,000 zone. Any more losses might send the price toward the $110,500 support in the near term. The main support sits at $108,500, below which BTC might struggle to recover in the short term.
Technical indicators:
Hourly MACD – The MACD is now gaining pace in the bullish zone.
Hourly RSI (Relative Strength Index) – The RSI for BTC/USD is now above the 50 level.
Major Support Levels – $114,000, followed by $113,500.
South Korea’s publicly listed Bitplanet has begun its daily Bitcoin accumulation program, purchasing 93 BTC on Oct. 26 as part of a long-term plan to build a 10,000 BTC treasury. The move marks the country’s first fully regulated Bitcoin purchase…
The Kobeissi Letter reported bank cash at the Federal Reserve fell to about $2.93 trillion; Adam Livingston says that level signals a shift that would favor bitcoin.
On-chain data shows roughly 62,000 BTC have moved out of long-term storage since mid-October, softening one of this cycle’s strongest tailwinds. But steady whale accumulation and a moderate short-side cleanup helped prices stabilize near $114K.
Bitcoin cleared $112,000 on heavy volume and hovered near $114,500 late Sunday (UTC), while CoinGlass showed $319 million of short positions liquidated over 24 hours.
The XRP/BTC monthly chart has finally snapped the long diagonal that’s capped XRP since 2018, and one analyst on X thinks that shift could rewrite the pecking order. Posting under the handle X Finance Bull (XFB), the analyst argued that XRP will soon start to outperform Bitcoin.
This is because the XRP/BTC pair has not only broken out but also retested the trendline as support, and this has certified the start of a new buildup of momentum.
Retest Of A Six-Year Breakout Trendline
The mid-October flash crash that rippled through the crypto market left a visible mark on the XRP/BTC chart, creating a deep downward wick that momentarily dipped below the long-standing resistance trendline. However, as Bitcoin started to recover to above $110,000, XRP struggled to keep up and lost ground relative to Bitcoin.
Interestingly, price action shows that this move was short-lived, and XRP has started to recover against Bitcoin in recent trading sessions. As shown on the monthly candlestick timeframe chart below, the wick fell to the exact level of the breakout retest, a point where former resistance turned into new support.
This breakout occurred in late 2024/early 2025, when XRP outperformed Bitcoin for three consecutive months. From there, the XRP/Bitcoin pair was able to break out of a downward-sloping resistance trendline of lower highs spanning over six years.
Since then, however, 2025 has been characterized by more months of Bitcoin outperforming XRP than months of XRP outperforming Bitcoin, with October falling into the former group of months. Particularly, during the flash crash, the XRP/BTC pair plunged to around 0.000007 before rebounding almost immediately, a move that, according to XFB, represents the long-awaited retest of the broken trendline.
Since that retest, XRP has recovered impressively, with the pair maintaining a monthly close above the diagonal that once acted as a ceiling. This technical confirmation signals the completion of the breakout from the 2018 to 2024 downtrend that had defined XRP’s multi-year underperformance against Bitcoin. The monthly structure is now displaying the early signs of an upward shift, with the pair trading around 0.00002258 BTC.
XRP To Decouple And Outperform Bitcoin?
According to the analyst, XRP is about to undergo a rally that massively outperforms Bitcoin and melts the face of many Bitcoin maximalists. XFB’s chart outlines two target zones ahead for XRP: 0.00014688 BTC and 0.00023009 BTC. The first target corresponds to the consolidation area seen between 2018 and 2019, while the second represents a major resistance cluster from the earlier phase of XRP’s creation. If XRP/BTC rallies to those levels, it would amount to approximately a 6x and 10x gain relative to Bitcoin, respectively.
The analyst also connects the technical setup to Ripple’s growing institutional ecosystem. He pointed to Ripple Prime, GTreasury, Metaco, Standard Custody, and Rail as part of the infrastructure that’s setting up XRP as a bridge asset for global finance. These partnerships give XRP an edge heading into the coming months, as it moves into real institutional utility and starts outperforming Bitcoin.
If these developments continue, the incoming decoupling of the XRP/BTC pair could become one of the most significant events for XRP. At the time of writing, XRP is trading at $3.63, up by 3.5% in the past 24 hours.
Featured image from Unsplash, chart from TradingView
Major cryptocurrencies are trading higher ahead of a busy week featuring key Federal Reserve and Bank of Japan rate decisions alongside earnings reports from influential Mag 7 stocks.
The move comes as the BTC/gold ratio — a measure of Bitcoin’s relative value against the yellow metal — flashed its most oversold reading in nearly three years last week.
This disclosure highlights the growing acceptance and integration of cryptocurrency investments among US lawmakers, potentially influencing regulatory perspectives.
The feature is developed with Tether and was announced at the Plan ₿ Forum in Lugano, Switzerland. The first BTC tip was sent to content creator David Freiheit.
On CNBC, Tom Lee said Fed cuts and fading skepticism could lift U.S. stocks into year-end and that crypto may rebound as open interest resets and technicals improve.
Bitcoin stayed range-bound into 08:00 UTC on OCt. 25 as volume spiked on a defense of support and sellers capped rallies near the top of the recent corridor.
Rumble is making good on its CEO’s year-old vision, evolving from a video hub into a nascent digital economy where content and cryptocurrency merge, offering a tangible use case for Bitcoin as a direct payment method. On Oct. 24, the…
SpaceX has again transferred Bitcoin worth millions of dollars to news wallets, with $134 million in the flagship cryptocurrency moved on Friday, October 24. Onchain data from blockchain analytics firm Arkham shows a wallet linked to the aerospace company, which…
The Federal Reserve’s quantitative tightening (QT) program may soon come to an end. Strategists at JPMorgan and the Bank of America believe that the central bank will stop shrinking its roughly $6.6 trillion balance sheet this month, bringing an end to the Fed quantitative tightening.
According to a recent Bloomberg report, these Wall Street giants have moved up their QT program predictions due to a surge in dollar funding costs. They initially anticipated the move in December or early 2026.
JPMorgan Predicts Fed Quantitative Tightening End
JPMorgan and Bank of America strategists predict that the development will occur this month, effectively ending the $6.6 trillion balance sheet unwind from the Federal Reserve.
The Fed QT program, a large and influential market factor since it began in 2022, allows the Fed’s balance sheet of $6.6 trillion to be reduced without replacing maturing Treasury and mortgage-backed securities to gradually remove excess liquidity from the financial system to fight inflation and achieve economic stability. However, with rising borrowing costs in repo and funding markets, concerns are growing about reserve scarcity in the banking system.
In a client note, Bank of America’s Mark Cabana and Katie Craig wrote, “Money markets at current or higher levels should signal to the Fed that reserves are no longer ‘abundant.’” They urged to “cut the crap before things snap.”
At the same time, JPMorgan strategist Teresa Ho noted that markets have become increasingly frictional, highlighting the Fed’s dwindling reverse repo facility as a key warning sign. “Markets have been operating with much more friction,” noted the strategist. This development has led TD Securities and Wrightson ICAP to revise their expectations for the end of quantitative tightening to October. However, Barclays and Goldman Sachs anticipate a slightly later conclusion to the runoff.
Several other Wall Street analysts, including those from Wrightson ICAP, Evercore ISI, and Jefferies, also predict that the Federal Reserve will conclude its QT program by the end of October.
What the Fed Says?
Notably, the central bank chair, Jerome Powell, indicated that the balance sheet reduction is likely to conclude when reserves reach a level “somewhat above” what’s considered ample, aiming to prevent market disruptions. He added, “We may approach that point in the coming months.” This suggests the bank is nearing the end of the Fed quantitative tightening program.
Another noteworthy event the market is watching closely in the wake of the QT program is whether the Fed will do anything about interest rates at the FOMC meeting later this month, scheduled for October 28-29. Powell and some others have mentioned the possibility of rate cuts at previous meetings.
But it is uncertain if a rate cuts may occur at the FOMC meeting, as the government shutdown has now entered the 23rd day with no signs of resolution. The lack of major data releases, starting with the jobs report among others, is putting the Federal Reserve in a challenging position.
How Will This Impact Bitcoin and Crypto?
If the Fed stops QT, liquidity would dry up, and we would experience a monetary loosening that would bring forth more investment, lower Treasury yields, and demand risk assets like Bitcoin.
Historically, Bitcoin has performed well during QE periods and poorly during QT periods. For instance, during QE from 2020-2021, Bitcoin moved from $7,000 to $69,000. However, once QT began in 2022, as liquidity was tightening, Bitcoin moved from $47,000 down to $15,000. Now, many analysts believe that if the Fed quantitative tightening were to go away, there is a possibility that fresh inflows into Bitcoin may rise and the price may surge.
Fed Quantitative Tightening to Boost Bitcoin Price
According to the long-standing analyst Michaël van de Poppe, Bitcoin has been trapped in a sideways move between $100,000 $120,000 in the last six months, which indicates that it is likely going to create a major break either way. Additionally, he expects the next movements of the currency to come from the FOMC meeting, potential rate cuts in the future, and monetary policy changes.
Conclusion
The expected cessation of the Fed’s quantitative tightening and the possible cuts in rates will be a strong factor for the inflow of liquidity into the financial system, raising the risk appetite that in turn might drive the prices of Bitcoin higher.
Frequently Asked Questions
What does the Federal Reserve’s quantitative tightening (QT) program entail? The QT program is the Fed’s major action of the decade, where its asset holding is reduced by $6.6 trillion thereby balancing and normalizing the dollar’s liquidity in the global financial system as a measure to fight inflation.
How could the cessation of QT impact Bitcoin in any way? The cessation of QT could increase the financial system’s liquidity and thereby turn investors towards higher risk assets. This could result in an increase in the price of Bitcoin.
Glossary
Quantitative Tightening: It is a central bank action to reduce its balance sheet by selling or not rolling over securities, thus resulting in a decrease of the monetary base in the financial system.
Quantitative Easing: A central bank action that enlarges its balance sheet by purchasing securities leading to a monetary base increase in the financial system.
Federal Reserve: The U.S.A. central bank that has the ultimate power to decide the money supply and control the banking industry.
Balance Sheet: A financial report showing the assets, liabilities, and equity of a company or, in this case, the Federal Reserve.
FOMC Meeting: A gathering of the Federal Open Market Committee, which decides on the money supply, interest rates, and hence opining on the central bank’s position regarding quantitative easing or tightening.
What could be the driving force behind the sharp outflow, despite Bitcoin and Ethereum ETFs experiencing a $619 million inflow only a few days ago?
Analysts are concerned about a fading momentum in both Bitcoin and Ethereum ETFs, which has led to mass investor outflows. After a combined inflow of at least $619 million last Tuesday, signaling investor confidence, the energy faded the following day, with Bitcoin and Ethereum ETFs recording significant outflows.
A Sense of Fear Prevails in the Market
According to data from Fairside, BlackRock’s IBIT led the outflow from Bitcoin and Ethereum ETFs, with over $100 million exiting the market. This was followed by other ETFs, including Fidelity, Grayscale, Bitwise, VanEck, and Invesco, that recorded smaller inflows that may have helped soften the overall decline. It’s worth noting that the outflows from the Bitcoin and Ethereum ETFs occurred when BTC briefly surged past $111K before retreating to around $108K early Tuesday.
Ethereum ETFs, on the other hand, were also under pressure, recording $145.7M in outflows, extending a three-day streak of withdrawals. According to most analysts, the trend indicates that investors were treading cautiously, balancing short-term price swings and were concerned about broader market volatility.
The optimism experienced earlier in the week proved short-lived, as both Bitcoin and Ethereum ETFs saw outflows. Total withdrawals peaked at $120 million, with Bitcoin funds losing $101.29 million and Ethereum ETFs shedding $18.77 million. Currently, the broader cryptocurrency market sentiment remains cautious, with the Crypto Fear & Greed Index at 27, indicating that fear prevails.
Investor Confidence Fluctuating
The cautious mood is reflected in the continued outflow from Bitcoin and Ethereum ETFs despite prices inching higher. For some reason, investors are hesitant to make any firm commitments due to uncertainty about the market’s short-term direction.
While the general market trend shows active investor interest in spot Bitcoin and Ethereum ETFs, the sentiment keeps fluctuating. The strong rebound on Tuesday shows how quickly capital can flow when investors are confident, while the pullback on Wednesday shows that traders remain cautious.
Conclusion
The latest activity in Bitcoin and Ethereum ETFs comes hot on the heels of mixed performance in the broader cryptocurrency market. Historically, when spot prices rebound, investor confidence flows suggest that institutional traders may still be wary of potential price corrections.
Unlike the spot market, Bitcoin and Ethereum ETFs may react more slowly due to associated fund mechanics, investor reporting schedules, and capital reallocation strategies. The ongoing pullback in Bitcoin and Ethereum ETFs suggests that crypto investment products may behave differently from their underlying tokens.
Glossary to Key Terms
ETFs: Cryptocurrency exchange-traded funds (ETFs) track the price performance of cryptocurrencies by investing in a portfolio linked to their instruments, which can be traded on regular stock exchanges, and investors can hold them in their standard brokerage accounts.
ETF Inflows: Fund flow measures the cash moving into and out of financial assets over specific time periods, often used to understand investor sentiment. Net inflow can signal investor optimism or caution in the market.
ETF Outflows: When ETF shares are converted into the component securities, this is referred to as ETF outflow. ETFs depend on the effectiveness of the arbitrage mechanism for their share prices to track net asset value.
Market rebound: In the world of stocks, a rebound is a period in which prices rise after a prior decline or bearish phase.
Frequently Asked Questions about Bitcoin and Ethereum ETFs
What happened to crypto ETFs on Wednesday?
Bitcoin and Ether ETFs experienced severe outflows they losing $101 million and $19 million, respectively.
Which Bitcoin ETFs were most affected?
The most significant casualties of the outflows were Grayscale’s GBTC, Fidelity’s FBTC, and Ark’s ARKB, which reversed Tuesday’s gains.
Which funds record inflows despite the downturn?
According to available data, BlackRock’s IBIT and ETHA continued to attract strong investor interest despite the ongoing outflows.
What does this mean for the crypto market outlook?
The midweek pullback in crypto ETFs signals that investors were treading cautiously amid ongoing market volatility.
JPMorgan Chase plans to let institutional clients use Bitcoin (BTC) and Ethereum (ETH) as collateral for loans by the end of 2025, according to a Bloombergreport.
The new program, expected to roll out globally, will rely on a third-party custodian to safeguard pledged assets. The bank already allows crypto-linked exchange-traded funds (ETFs) as collateral, but this expansion would enable clients to borrow against their direct crypto holdings.
The shift could make it easier for institutions to access liquidity without selling long-term digital asset positions — a use case that has gained traction among hedge funds and family offices.
The development represents a broader acceptance of digital assets across the financial sector. Other major banks, including Morgan Stanley, BNY Mellon, State Street, and Fidelity, have been expanding crypto custody and trading services amid increasing regulatory clarity in the U.S. and abroad.
JPMorgan first began exploring lending against Bitcoin in 2022 but the project was delayed, according to Bloomberg.
Jamie Dimon’s changing tone on crypto
JPMorgan CEO Jamie Dimon has long been one of crypto’s most vocal skeptics, previously calling Bitcoin a “fraud” and a “pet rock.” In 2023, he said he was “deeply opposed” to Bitcoin and claimed it was used mainly for illicit activity.
However, his tone has recently softened. “I don’t think we should smoke, but I defend your right to smoke,” Dimon said earlier this year. “I defend your right to buy Bitcoin, go at it.”
In 2023, JPMorgan CEO Jamie Dimon said he was "deeply opposed" to Bitcoin and that it was for criminals.
Today, JPMorgan plans to allow institutional clients to use Bitcoin as collateral. pic.twitter.com/WMPg8qy9UW
Despite Dimon’s reservations, JPMorgan has steadily increased its crypto exposure. The bank has launched the J.P. Morgan Deposit Token (JPMD) — a blockchain-based alternative to stablecoins — and expanded its Kinexys blockchain network, which now processes more than $2 billion in daily transactions across carbon markets, supply chain finance, and cross-border payments.
Bitcoin and Ethereum prices rise
Following the news, Bitcoin rose in the past 24 hours to trade above $111,000, while Ethereum gained 2% to hover just below $4,000, according to Bitcoin Magazine Pro data.
Back in July, JPMorganChase and Coinbase announced a strategic partnership to make Bitcoin and crypto access easier for their customers.
The deal included a direct bank-to-wallet connection, the ability to redeem Chase Ultimate Rewards points for crypto, and credit card funding for Coinbase accounts. Both the bank-to-wallet and rewards features were set to launch in 2026.
TradFi giant JPMorgan is reportedly planning to allow its institutional clients to use Bitcoin and Ethereum as loan collateral some time within this year. According to a report by Bloomberg, JPMorgan will start allowing their institutional clients to use Bitcoin…
After months of steady gains, BTC is slipping below key cost-basis levels as long-term holders sell into strength and traders retreat to defensive derivatives.
The offering, developed with non-custodial BTC lending startup Debifi, targets institutions and high-net worth borrowers who don't want to give up control of their assets.
The release of September's Consumer Price Index (CPI) is expected to show a 3.1% rise in the cost of living from a year earlier, the highest in 18 months, according to FactSet.
Need to know what happened in crypto today? Here is the latest news on daily trends and events impacting Bitcoin price, blockchain, DeFi, NFTs, Web3 and crypto regulation.