Bitcoin traders 'excess loss-realization' may push BTC price below $44K

Bitcoin price dropped 25% in 2022 and 50% in 2018 after similar on-chain loss signals, a warning sign for BTC’s next move.
Bitcoin price dropped 25% in 2022 and 50% in 2018 after similar on-chain loss signals, a warning sign for BTC’s next move.
The post Official Trump (TRUMP) Price Prediction 2026, 2027-2030: How High Can TRUMP Go? appeared first on Coinpedia Fintech News
OFFICIAL TRUMP (TRUMP), the political-themed memecoin linked to U.S. President Donald Trump, has become one of the most watched and volatile tokens in the market.
Its sharp rise in 2025 was driven by election hype, strong celebrity support, and massive social media attention. This pushed TRUMP into the spotlight as a cultural trend, not just another cryptocurrency.
So, let’s dive deep into our in-depth analysis of TRUMP Price Prediction 2026–2030, to find out what’s coming for the investors.
| Cryptocurrency | OFFICIAL TRUMP |
| Token | TRUMP |
| Price | $3.3525
|
| Market Cap | $ 779,455,677.35 |
| 24h Volume | $ 94,304,619.7978 |
| Circulating Supply | 232,497,992.3344 |
| Total Supply | 999,999,184.8687 |
| All-Time High | $ 75.3518 on 19 January 2025 |
| All-Time Low | $ 1.2084 on 18 January 2025 |
The excitement around the Trump asset had diminished significantly. However, it attempted to revive interest with the launch of a game on the App Store, which shifted perceptions. Now, with the highly anticipated “Trump Billionaire Game” set to debut on the App Store on May 5, 2026, the outlook for recovery in 2026 appears strong, despite the challenges faced in 2025.
February was not surprising, with price action remaining range-bound, but it occurred around the lower border of a falling wedge pattern. If demand picks up, a bounce to $6 could happen in March. Conversely, if it does not rise, a decline to lower levels is also a possibility.
In 2025, the TRUMP token did not appear to be a dead asset, particularly with the announcement of the “Trump Billionaire Game,” which added a utility aspect beyond its initial memecoin status. The launch is scheduled for May 5th, 2026, on the Apple Store.
However, the outlook for 2026 is complicated by the 2025 market performance, where bulls struggled significantly against robust bearish sentiment. This dynamic reflects the speculative and often volatile nature of TRUMP’s price movement throughout 2025.
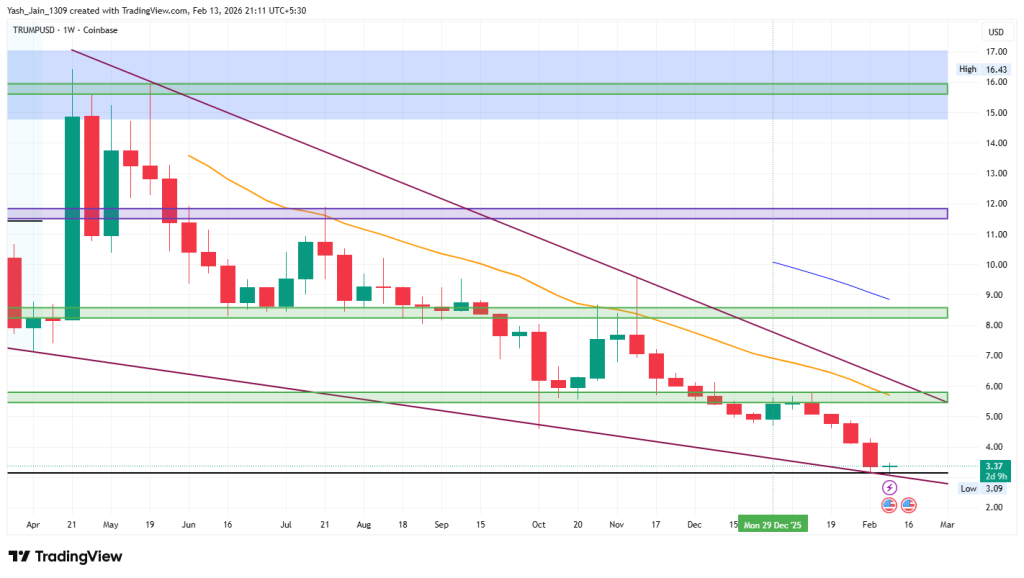
As we look forward to the possibilities that 2026 may bring, particularly with Donald Trump’s ongoing influence in the political arena, the potential for adoption is indeed compelling. On the price front, the weekly chart showcases an intriguing setup; we’ve recently seen a demand coming back around $3.00-$4.00 range in February. The price pattern indicates a falling wedge, reflecting a tightly compressed trading range, much like a coiled spring ready to unleash its energy.
Given this technical formation, a rebound appears likely. If bullish momentum emerges in rest of Q1 2026, it will be crucial to monitor the $5.50 resistance level. A decisive breakout above this level could signal a significant rally, potentially advancing toward $8.50 as the uptrend unfolds and could extend to $16 if demand remains stable.
| Year | Potential Low ($) | Potential Average ($) | Potential High ($) |
| 2026 | $3 | $18 | $26 |
On-chain analysis of the OFFICIAL TRUMP (TRUMP) token in January 2026 reveals a significant bullish divergence characterized by institutional-grade absorption. Over the last 30 days, a clear redistribution of supply has occurred, which means that retail addresses holding between 10 and 10,000 coins have been consistently offloading their positions, while high-conviction “whale” addresses especially those holding between 100,000 and 1,000,000 TRUMP coins, have moved into an accumulation phase.
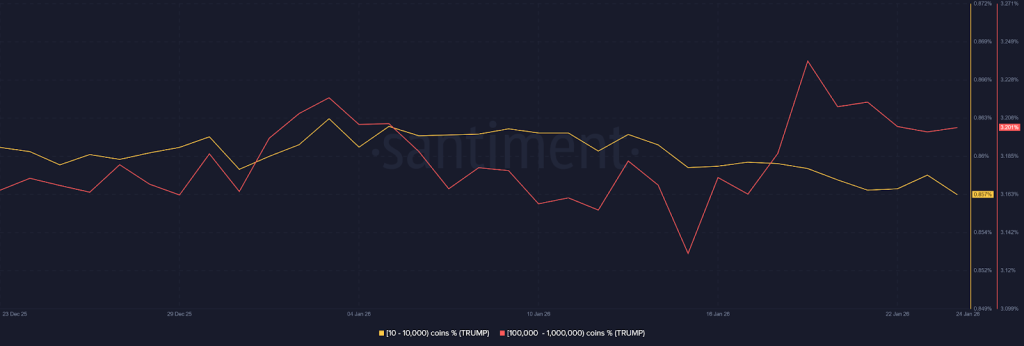
This “smart money” behavior suggests that larger entities are leveraging short-term retail panic and distribution as liquidity to build substantial long-term positions. This is laying the structural groundwork for a powerful upward trend as market sentiment stabilizes.
| Year | Potential Low ($) | Potential Average ($) | Potential High ($) |
| 2026 | $5.00 | $7.10 | $11.20 |
| 2027 | $6.05 | $12.65 | $18.90 |
| 2028 | $8.20 | $18.20 | $27.50 |
| 2029 | $12.40 | $28.10 | $44.80 |
| 2030 | $18.10 | $45.10 | $69.90 |
By 2026, the value of a single OFFICIALTRUMP coin price could reach a maximum of $42.00, with a potential low of $14.00. With this, the average price could land at around the $28.00 mark.
Looking forward to 2027, the TRUMP coin Price may range between $21.00 and $42.00, and a potential average value of around $63.00.
The Trump price could achieve the $94.25 milestone by the year 2028. However, the viral memecoin could record a low of $31.50 and an average price of $62.00 if the crypto market turns bearish.
During 2029, the TRUMP crypto could reach a maximum trading value of $141.50 with a potential low of around $88. Evaluating the market sentiments, the average price of this altcoin could settle at around $94.50.
The TRUMP memecoin crypto prediction for the year 2030 could range between $70.75 to $212.25. Considering the buying and selling pressure, the average price could be around $141.50 for that year.
| Firm Name | 2025 | 2026 | 2030 |
| Mudrex | $60 | $100 | $600 |
| Icobench | $100 | $150 | $500 |
| Binance | $13.93 | $14.63 | $17.78 |
According to CoinPedia’s analysis, TRUMP could recover from its 2025 decline if strong social buzz returns. As per our price outlook, renewed interest in political-themed tokens may help TRUMP climb toward a possible $11.58.
However, if the market turns cautious, the token may drop back toward $5.0 before finding stable support.
| Year | Potential Low ($) | Potential Average ($) | Potential High ($) |
| 2026 | $5.0 | $7.18 | $11.58 |
Stay ahead with breaking news, expert analysis, and real-time updates on the latest trends in Bitcoin, altcoins, DeFi, NFTs, and more.
The TRUMP token is a political-themed memecoin that surged due to election buzz, celebrity attention, and strong community hype.
Analysts expect TRUMP to trade between $5.00 and $11.20 in 2026, depending on market liquidity, sentiment, and political momentum.
Yes, if market demand rises, TRUMP could test the $20 zone by 2028 as memecoins mature and investor interest strengthens.
Community activity, strong market cycles, and sustained interest in political tokens may push TRUMP toward higher long-term levels.
The post Bitcoin SV Price Prediction 2026, 2027-2030: Will BSV Price Hit $100? appeared first on Coinpedia Fintech News
Bitcoin SV price (BSV) has been on muted growth trajectory compared to other altcoins. Since the beginning of the year, signaling prolonged bearish sentiment, Bitcoin SV (BSV) has consistently traded below its 200-day EMA band.
Despite attempts to gain traction, the asset has failed to show any long-term bullish reversal, raising doubts among investors and traders about its recovery potential.
Even it’s a non-profit organization, BSV association, optimistic activities like successful collaboration and hackathon events are not manifesting on the BSV price chart
Many ask: “Can BSV Price break bearish trend above 200-day EMA?, “Is BSV a hidden gem waiting for its breakout, or just another risky bet?”. In this Bitcoin SV price prediction 2025 article, we’ll explore the future for BSV Price from 2025 through 2030.
| Cryptocurrency | Bitcoin SV |
| Token | BSV |
| Price | $15.1252
|
| Market Cap | $ 302,399,326.13 |
| 24h Volume | $ 13,491,321.9976 |
| Circulating Supply | 19,993,037.50 |
| Total Supply | 19,993,037.50 |
| All-Time High | $ 491.6354 on 16 April 2021 |
| All-Time Low | $ 11.8148 on 06 February 2026 |
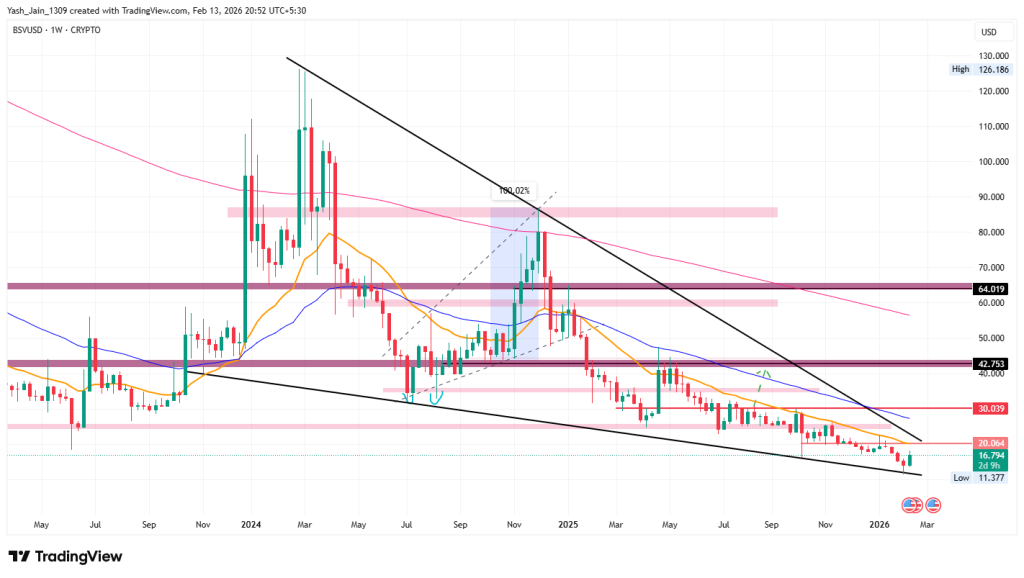
Bitcoin SV (BSV) is exhibiting promising signs of recovery as it approaches an important support level within a falling wedge pattern. Should BSV successfully reverse and surpass the $20 resistance, there is a fantastic opportunity for it to achieve remarkable price levels of $30 and even $64 by year-end, contingent upon increased demand. Conversely, it may continue to consolidate if conditions do not favor growth.
The current price of Bitcoin SV (BSV) presents a notable opportunity for investors. Although 2025 experienced heavy challenges after 2024’s high, things seem to be changing for BSV. The price prediction for BSV in 2026 points to a more optimistic future ahead.
This optimism stems from recent chart observations that have revealed what was hidden amid the intense downtrend in the BSV/USD price. The pattern that emerged was a falling wedge, which has significantly compressed the trading range over the last two years. This compression suggests a strong potential for a positive shift in 2026, which should be considered despite the recent price fluctuations.
The projections for Q1 2026 align well with this falling wedge, which has been forming for multiple years, indicating that the trading range is approaching a critical point. Many believe that a substantial bounce could occur, offering a promising outlook for the asset.
While past price action has shown some terrific declines, Q1 saw a retest from the lower border of the falling wedge. From a distance, BSV/USD appears to have taken a stable footing. It appears to have laid a solid foundation that could benefit from better, more favorable macroeconomic conditions in the future. Signs indicate that 2026 could be a significant rally year, and investors anticipate bullish demand.
With stabilizing market conditions, there appears to be potential for considerable upward movement. The immediate resistance level to watch is $20 and $30; if these two levels are surpassed, we could see an ascent towards levels at $42 and $64 later. However, if demand does not improve, consolidation might continue for an extended period.
The 90-day Taker CVD is negative and declining, indicating that aggressive sellers have dominated the market. This means that those hitting the bid are selling more than they buy, which likely drives the BSV price down due to excess supply.
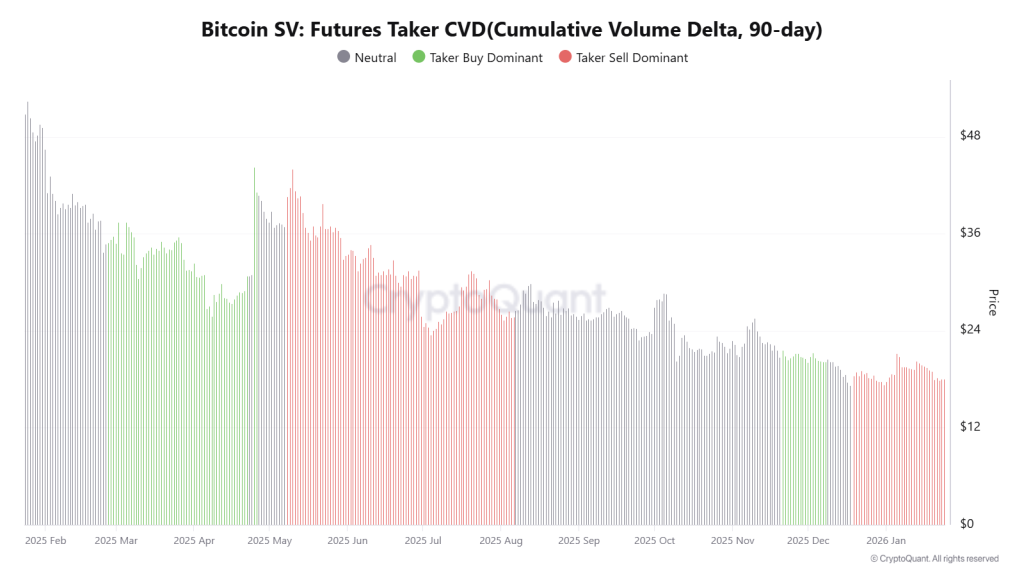
However, the large average order sizes indicated by the green dots on the chart suggest otherwise. When these order sizes remain high while prices drop, it signals that whales or big investors are placing significant buy orders. These players are absorbing the selling pressure, allowing retail investors to sell at lower prices into their large orders.
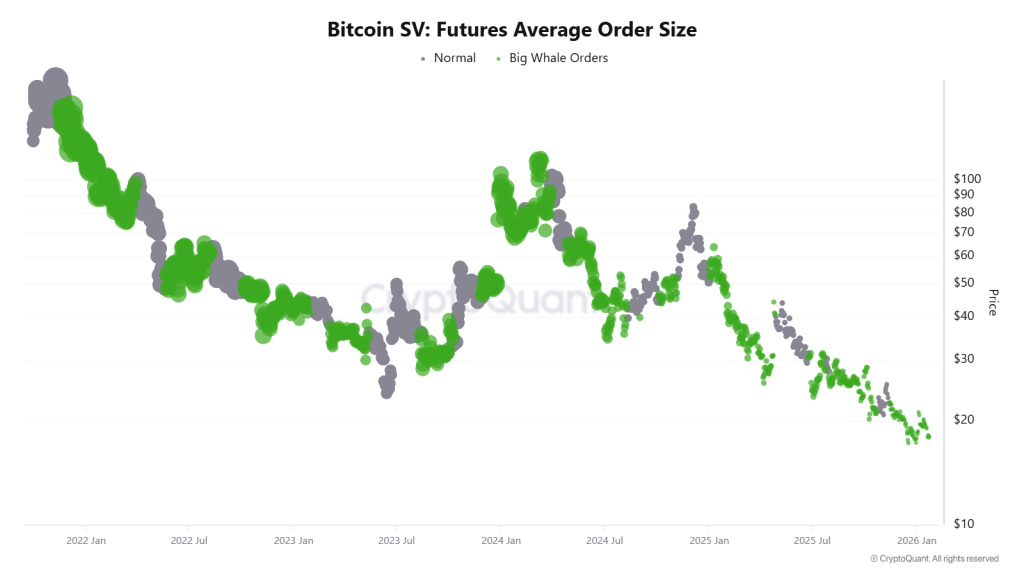
Historically, when high-value orders continue during a price decline, it suggests the market may be nearing a liquidity bottom.
| Year | Potential Low ($) | Average Price ($) | Potential High ($) |
| 2026 | 60 | 90 | 130 |
| 2027 | 75 | 95 | 145 |
| 2028 | 85 | 115 | 155 |
| 2029 | 95 | 125 | 165 |
| 2030 | 105 | 135 | 175 |
This table, based on historical movements, shows BSV price to reach $175 by 2030 based on compounding market cap each year. This table provides a framework for understanding the potential BSV price movements. Yet, the actual price will depend on a combination of market dynamics, investor behavior, and external factors influencing the cryptocurrency landscape.
BSV price prediction for 2026 anticipates a potential low of $60 and a high of $130, with an average price projected at $90.
In 2027, the BSV token price can range between $75 and $145, with an average price of approximately $95.
Based on the altcoin’s price history, it can target a potential low of $85 and a potential high of $155, with an average price expected to be $115.
Bitcoin SV price targets in 2029 are estimated to range from $95 to $165, with an average price of around $125.
The potential low for Bitcoin SV in 2030 is forecasted at $105, the potential high at $175, with an average price expected to be $135.
| Firm Name | 2025 | 2026 | 2030 |
| Digital Coin price | $78 | $94 | $199 |
| Coindataflow | $75 | $36 | $70 |
| Coincodex | $26 | $21 | $35 |
| Swapspace | $23 | $46 | $360 |
Stay ahead with breaking news, expert analysis, and real-time updates on the latest trends in Bitcoin, altcoins, DeFi, NFTs, and more.
BSV could range from $60 to $130 in 2026, with an average price around $90, showing potential for a bullish reversal.
By 2030, BSV may reach $105–$175, averaging $135 if adoption grows and market conditions remain favorable.
Long-term 2040 predictions are uncertain, but if growth continues, BSV could rise steadily with the broader crypto market.
BSV focuses on fast, low-cost transactions and enterprise use, while BTC is primarily a store of value. Choice depends on goals.
Risks include prolonged bearish trends, weak investor sentiment, regulatory uncertainty, and underperformance versus other altcoins.
The post Clarity Act Crypto 2026 Odds Crash as Tariffs Rattle Markets appeared first on Coinpedia Fintech News
The Clarity Act Crypto 2026 narrative just took a punch to the gut. Polymarket odds collapsed from 82% to 53%, and suddenly the industry’s long-awaited regulatory “holy grail” looks like another stalled promise.
For months, firms across crypto and traditional finance treated this bill as the framework that would finally divide oversight between the U.S. Securities and Exchange Commission and the Commodity Futures Trading Commission. Stablecoin issuers were eyeing it as a playbook for compliance. Institutions saw certainty. Now? Institutional Uncertainty is back in charge.
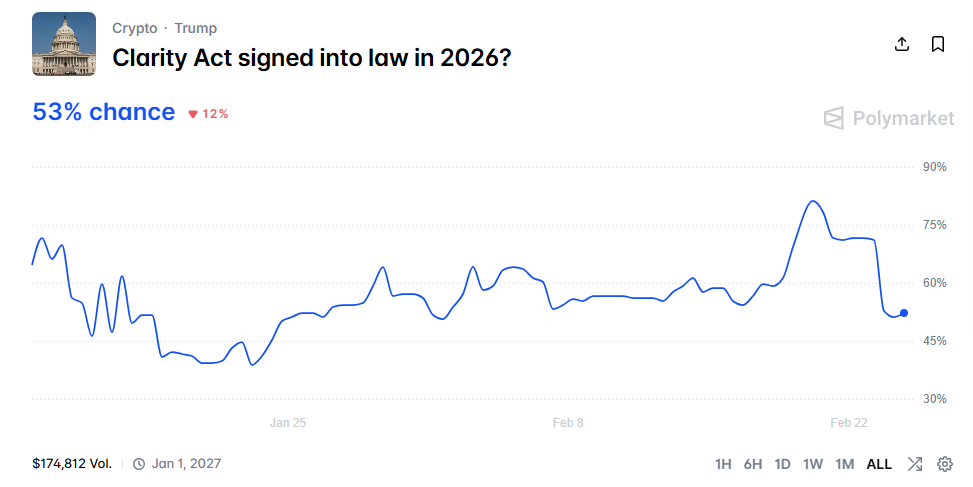
The Polymarket Odds Collapse isn’t just a prediction market glitch. It’s a signal. Confidence in regulatory clarity dropped 30 percentage points this week. That’s enough to flip positioning from opportunistic to defensive, as it clearly reveals confidence has taken a huge hit.
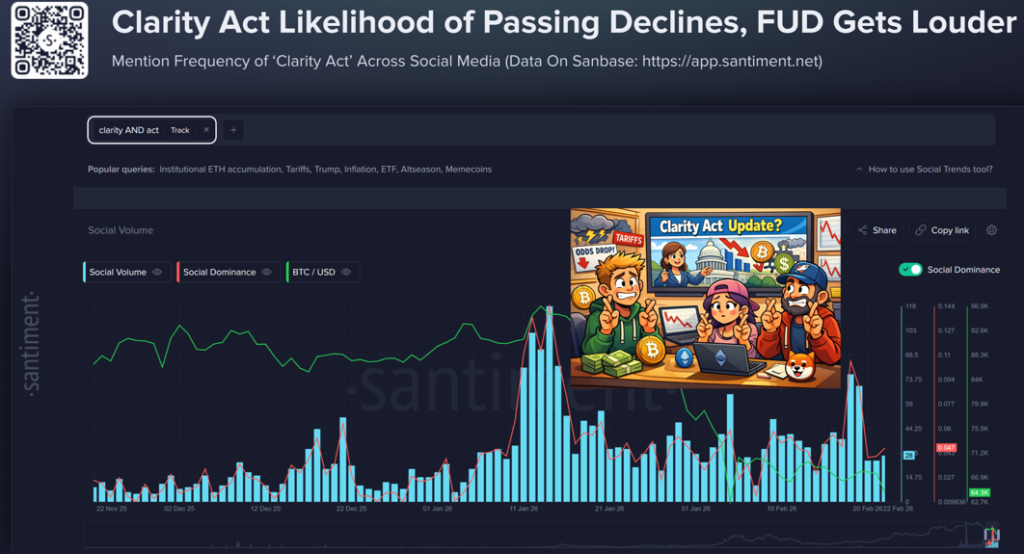
Without legislative guardrails, the “regulation by enforcement” fear creeps back in. Big banks hesitate. Treasury desks de-risk. Crypto FUD 2026 becomes the prevailing mood.
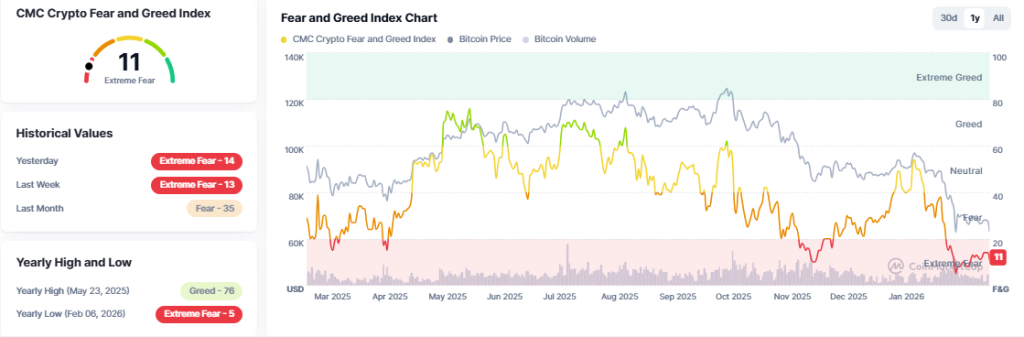
And mood matters. The Crypto Fear and Greed Index is sitting in Extreme Fear territory, with readings between 11 and 14. That’s not mild anxiety but that’s felt like capitulation energy.
As if Washington gridlock wasn’t enough, macro just added fuel to the fire. Despite a Supreme Court of the United States decision striking down earlier tariff authorities, the administration pivoted to Trade Act Section 122 to implement a new 15% Global Tariff 2026 effective February 24.
The result? Renewed inflation fears. “Higher-for-longer” interest rate chatter. Liquidity drains from risk markets.
Crypto, which has increasingly traded like a high-beta tech proxy, doesn’t love macro friction. Bearish Momentum feeds on it.
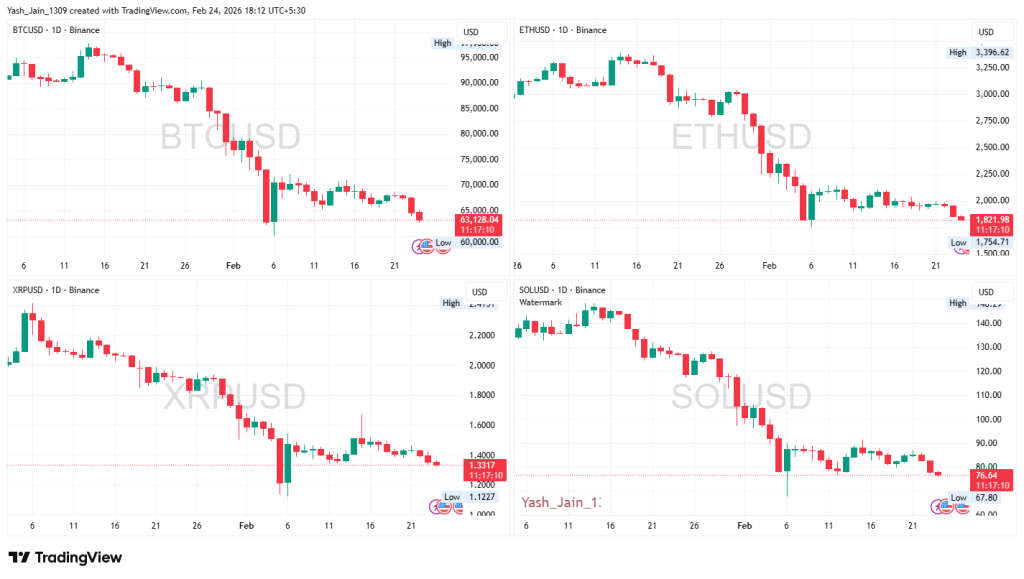
The majors tell the story in price.Bitcoin Support Levels slipped $65,000 are under pressure, with $60,000 looming as the psychological floor. It’s stuck in an identity crisis hard money hedge or speculative asset?
Ethereum isn’t faring much better. ETH broke $1890 and is approaching $1750. Without legal clarity, its RWA and stablecoin narrative loses oxygen.
Solana Retrace is underway too, drifting back toward $75 after breaking $80. High developer activity hasn’t insulated it from macro-driven shakeouts.
XRP, despite its unique regulatory history, has slipped as well and trades under $1.35, moving largely in sync with broader market stress.
So what’s next for Clarity Act Crypto 2026? Right now, the market is holding its breath. Until the legislative path reopens or tariff tensions cool, prices across the board are likely to stay compressed under the weight of uncertainty fatigue.
The post Bitcoin Price Prediction 2026, 2027 – 2030: How High Will BTC Price Go? appeared first on Coinpedia Fintech News
After a historic 2025 that saw Bitcoin shatter records and flip the legendary $125,000 mark, the market has taken a sharp, cooling turn. The early weeks of 2026 have been defined by a “sell-the-news” reality check, leaving many to wonder if the bull run has finally run out of steam or if we are simply witnessing the ultimate “buy the dip” opportunity.
The landscape has shifted. With a pro-crypto administration in the White House and institutional giants like MicroStrategy and Metaplanet treating BTC as a foundational reserve asset, the rules of the game have changed. No longer just a speculative play for retail traders, Bitcoin is now a geopolitical chess piece and a corporate balance sheet staple.
But as the price tests crucial support levels, the big question remains: Is this a temporary correction before a march toward $200,000, or the start of a long-term reset?
In this deep dive, we break down the Bitcoin price prediction for 2026–2030, exploring the massive trends, regulatory shifts, and institutional moves driving this historic cycle. If you want to know where the floor is and how high the ceiling goes. read on for the full scoop.
In early 2026, Bitcoin is in a correction phase after peaking at around $126,296 in October 2025. A potential bottom may occur around December 2026, with significant support expected between $25,900 and $30,350. Historical trends suggest this decline could reach 70%-76%, potentially bringing Bitcoin down to the lower border of the ascending broadening wedge’s support. This period may mark the end of the bear market, with 426 days in total, similar to historical correction periods, and pave the way for a rally in the next year.
The BTC price may range between $62,709.82 and $66,496.74 today.
| Cryptocurrency | Bitcoin |
| Token | BTC |
| Price | $63,425.2546
|
| Market Cap | $ 1,268,132,658,279.09 |
| 24h Volume | $ 43,188,754,564.9082 |
| Circulating Supply | 19,994,128.00 |
| Total Supply | 19,994,128.00 |
| All-Time High | $ 126,198.0696 on 06 October 2025 |
| All-Time Low | $ 0.0486 on 14 July 2010 |
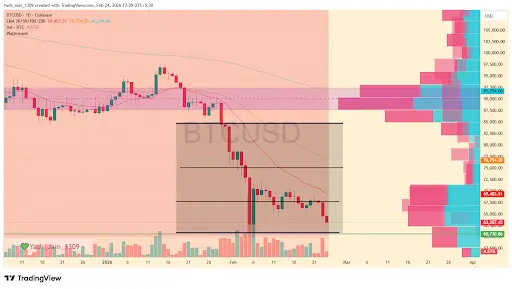
As of late February 2026, Bitcoin’s price has declined from its support level near $65,000. In the near term, the critical support level at $60,000 is essential for preventing a further downturn in Bitcoin’s price. The Crypto Fear and Greed Index remains in the Extreme Fear category; however, it may transition to neutral if short-term demand triggers a relief rally. Conversely, the index may deteriorate further should Bitcoin continue its downward trajectory.
Furthermore, the 50-day Exponential Moving Average (EMA) is currently below the 200-day EMA, signaling a death cross that has been in effect since mid-November. Additionally, a shorter-term death cross between the 20-day and 50-day EMA occurred in late January, further solidifying the prevailing bearish trend.
This volatile market behavior is likely to persist until there is a significant influx of buyers. Should buyers return to the market in substantial quantities, a reversal may occur, accompanied by a relief rally. The primary target for March is projected at $78,000, with a secondary target of $92,000 in the short term, potentially rising to $97,000, which was the peak reached in mid-January 2026. Already, we are seeing a dominant bearish market structure; any decline below $60,000 could exacerbate the odds of a relief rally in March.
The current price action in early 2026 confirms that Bitcoin price is following a well-defined historical rhythm within its long-term ascending wedge. After reaching a peak of approximately $126,296 in October 2025, the market has entered a significant correction phase.
This peak was not accidental; it represented a direct hit on the upper resistance boundary of the wedge pattern that has governed Bitcoin’s macro price action for years. Historically, these touches lead to extended periods of decline the first major crash from $21,000 lasted 427 days, while the second from $69,000 lasted 426 days. If this 14-month corrective cycle holds true, we are looking at a “target date” for a definitive bottom around December 2026.
The intensity of the sell-off in February 2026 was largely driven by a failure to reclaim the $87,800–$92,950 supply range. According to the anchored volume profile, this zone represented the highest momentum area of the previous bearish move, and once it flipped from support to resistance, the downward pressure has accelerated. Since markets don’t go straight, there will be attempts to rise in the name of relief rallies, and the nearest relief rally could come targeting $97K, but the likelihood is high that these will occur in the future as fakeouts and result in further decline.
As we look toward the remainder of 2026, the charts suggest that the most significant high-momentum demand area sits much lower, specifically between $25,900 and $30,350.
This range represents a crucial “interest zone” where institutional buyers previously stepped in and where the lower support of the ascending wedge is likely to converge by year-end.
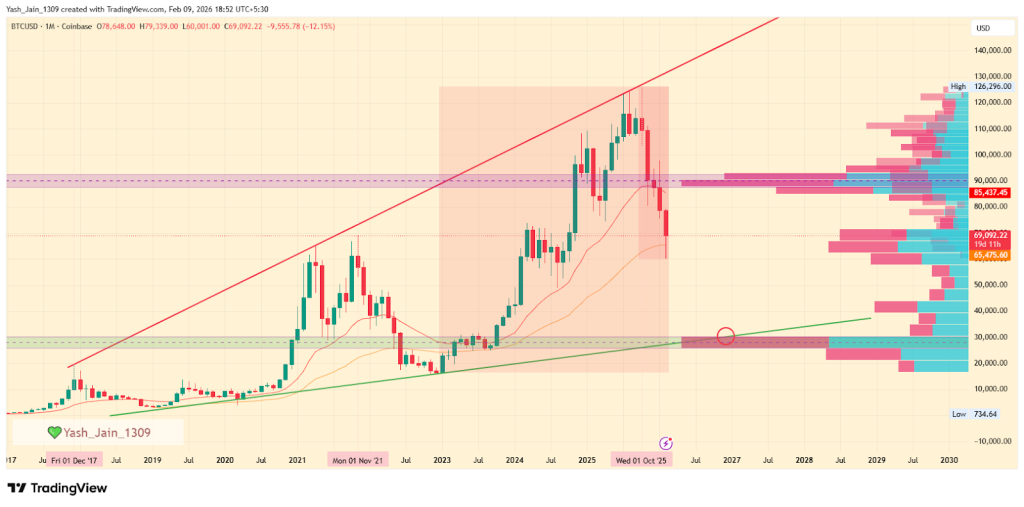
Statistically, Bitcoin’s major crashes have shown a trend of diminishing returns in terms of percentage drawdowns. The late 2017 onwards crash saw an 87.25% decline, and the 2022 crash reached 78.65%. Following this trajectory of “dampening volatility,” the current third crash is projected to result in a 70%-76% approx decline. From the $126,000 ATH, a 76% correction would push the price toward that critical $30,000 region.
Consequently, the prediction for December 2026 is a final test of the wedge’s lower border within this demand zone, marking the end of the current bear cycle and setting the stage for the next period of accumulation and next big rally could occur in 2027 onwards.
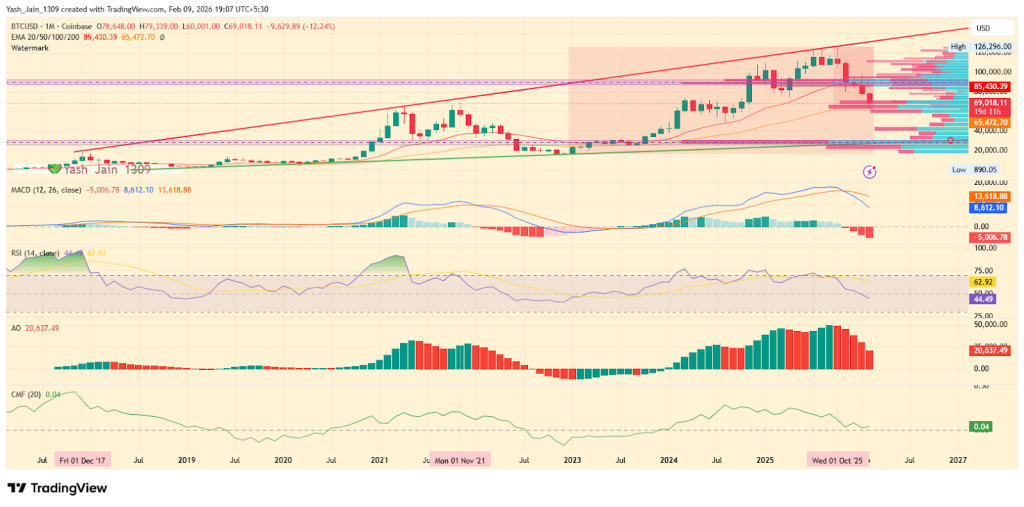
Similarly, the technical indicators shows that Bitcoin price has already entered a danger zone we haven’t seen in years. On a deeper look at the monthly RSI, BTC has a legendary track record of never hitting “oversold” levels; it usually bottoms out right around the 40 mark. Right now, we’re sitting at 44.49 and sliding fast. This isn’t just a dip it’s the classic signal that the bearish momentum is finally taking over and heading for that historical floor.
The indicators under the hood are screaming the same thing. The MACD has already locked in a bearish cross, and the gap between the lines is widening. In past crashes, the selling hasn’t stopped until those lines flattened out near the zero mark. We aren’t even close to that “exhaustion” point yet, meaning there is plenty of room for this to bleed out further.
Even the “smart money” indicator (CMF) is still showing positive inflows for now, but that’s actually the scary part. Once that green line snaps below zero and heads toward -0.20, that’s when the real panic hits. We aren’t at the end of the crash; we’re in the middle of it. Don’t mistake this for exhaustion, as the collapse toward the pattern’s lower border would soon intensify.
| Month | Potential Low | Potential Average | Potential High |
| 2026 | $30,000-$45,000 | $90,000 – $101,000 | $115,000 – $118,000 |
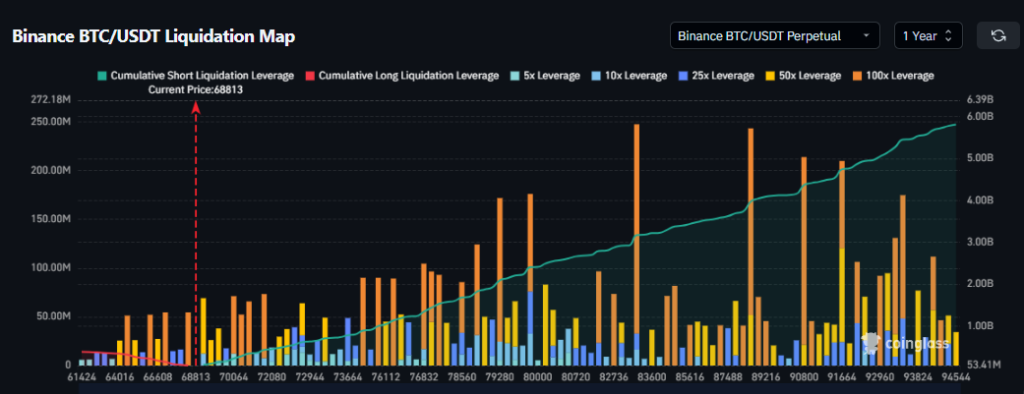
Liquidation data shows roughly $5.81 billion on the short side, compared with just over $380 million on the long side. That imbalance matters because it’s completely dominated by bears and bulls, with no room for survival. It suggests traders are leaning into weakness rather than preparing for a sustained rebound.
In other words, the futures market isn’t buying the bounce. It’s betting against it.
And if BTC price drifts lower again, that heavy short positioning could amplify volatility rather than cushion it. This is why any BTC price prediction right now carries asymmetric risk.
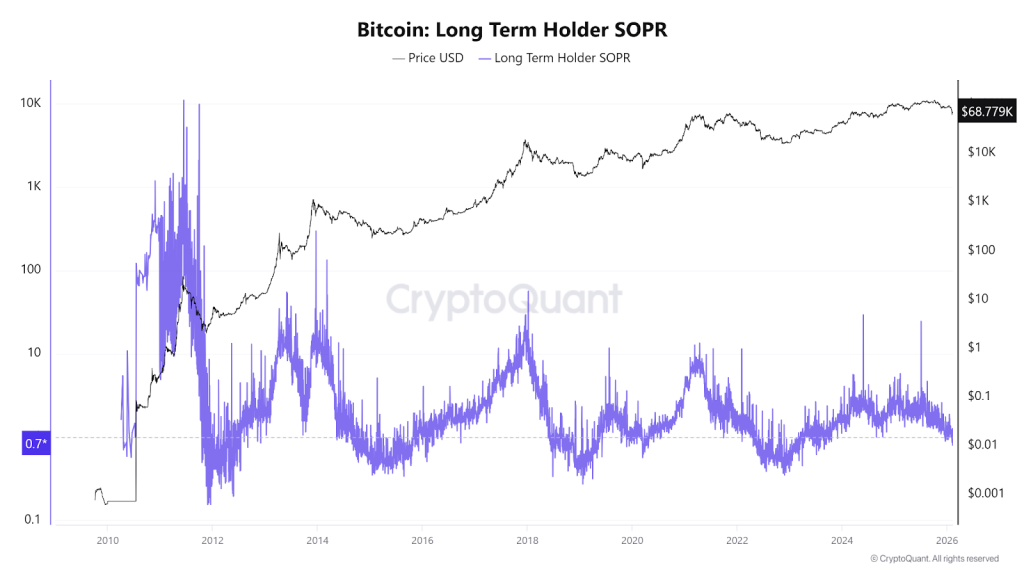
Moreover, the BTC long-term holder SOPR chart shows a current value of 0.7, which is below 1, indicating that more long-term investors are selling at a loss. And it’s seen when more holders keep selling at a loss, this metric has a history of hitting the 0.2-0.3 mark, which has truly seen a fresh demand. For now, the long-term trend is more bearish.
| Year | Potential Low ($) | Potential Average ($) | Potential High ($) |
| BTC Price Forecast 2026 | 150K | 200K | 230K |
| BTC Price Prediction 2027 | 170K | 250K | 330K |
| Bitcoin Predictions 2028 | 200K | 350K | 450K |
| BTC Price 2029 | 275K | 500K | 640K |
| Bitcoin Price Prediction 2030 | 380K | 750K | 900K |
The BTC price range in 2026 is expected to be between $150K and $230K.
Subsequently, the Bitcoin price range can be between $170K to $330K during the year 2027.
With the next Bitcoin halving, the price will see another bullish spark in 2028. Specifically, as per our Bitcoin Price Prediction, the potential BTC price range in 2028 is $200K to $450K.
Thereafter, the BTC price for the year 2029 could range between $275K and $640K.
Finally, in 2030, the price of Bitcoin is predicted to maintain a positive trend. Indeed, the BTC price is expected to reach a new all-time high, ranging between $380K and $900K.
Based on the historic market sentiments and trend analysis of the largest cryptocurrency by market capitalization, here are the possible Bitcoin price targets for the longer time frames.
| Year | Potential Low ($) | Potential Average ($) | Potential High ($) |
| 2031 | $540,830.43 | $901,383.47 | $1,261,936.86 |
| 2032 | $757,162.60 | $1,261,936.86 | $1,766,711.60 |
| 2033 | $1,059,945.80 | $1,766,711.60 | $2,473,477.75 |
| 2040 | $5,799,454.28 | $9,665,757.13 | $13,532,059.98 |
| 2050 | $161,978,188.65 | $269,963,647.74 | $377,949,106.84 |
“Jack Dorsey, former Twitter CEO (now X), predicts Bitcoin could exceed $1 million by 2030 due to its ecosystem growth and increasing adoption.”
Cathie Wood, CEO of Ark Invest, projects Bitcoin to reach $1.5 million by 2030, driven by institutional adoption and its position as digital gold.”
“Wall Street broker Bernstein believes 2026 will mark the start of a tokenization “supercycle,” maintaining its $150,000 Bitcoin price target for this year and $200,000 for the 2027 cycle peak.”
“Brad Garlinghouse, the Ripple CEO, predicts Bitcoin will hit $180,000 in 2026, due to favorable market and regulatory conditions.”
Stay ahead with breaking news, expert analysis, and real-time updates on the latest trends in Bitcoin, altcoins, DeFi, NFTs, and more.
Major risks include global recessions, tighter crypto regulations, declining liquidity, or a sustained breakdown below key support levels.
Bitcoin price forecasts for 2030 range from $380K to $900K, driven by scarcity, long-term adoption, and expanding institutional participation.
While uncertain, many long-term projections suggest Bitcoin could exceed $1 million by 2050 if it becomes a global store of value.
Bitcoin’s fixed supply makes it attractive as an inflation hedge, especially during currency debasement and long-term economic uncertainty.
The post Espresso (ESP) Token Soars 120% Following Upbit and Bithumb Listings What Traders Need to Know appeared first on Coinpedia Fintech News
The Upbit listing news wasn’t just a whisper because it led to a massive explosion. And that’s exactly what happened in the ESP token when South Korea’s top exchanges, Upbit first and then Bithumb, listed it.
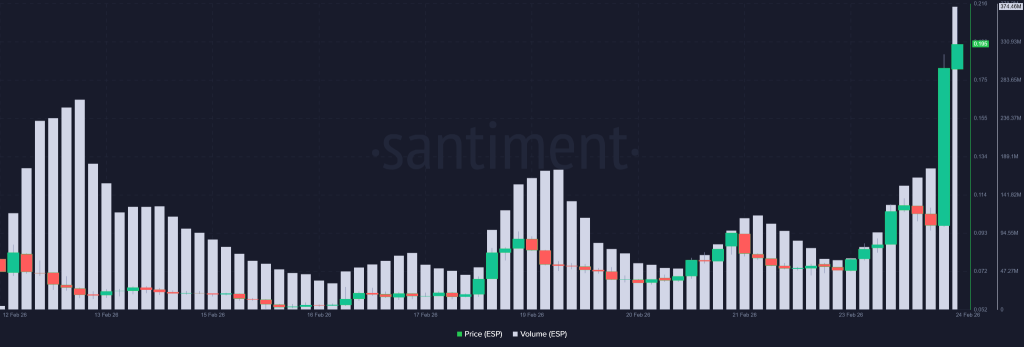
The result? A vertical move. Over 120% surge to a fresh all-time high. Where we saw 24-hour volume balloon to $374.46 million. That’s not casual interest, that’s traders piling in because of listing news.
Before the listing, on-chain metrics were already picking up steadily. Development activity climbed this week. Daily active addresses rose to 2,019. That’s not noise that’s the reflection of usage and development of its ecosystem.
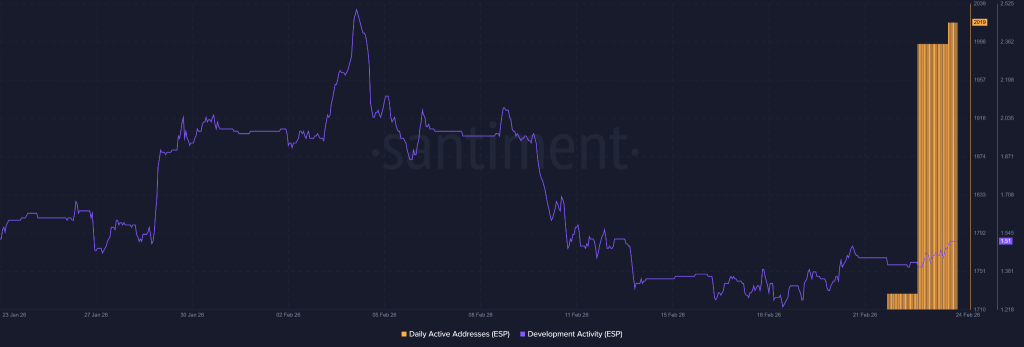
And usage do matters. Espresso Systems isn’t pitching itself as just another altcoin. It’s official website shows that its building shared sequencing infrastructure for Ethereum Layer 2s. Fast finality of roughly six seconds. Cross-rollup interoperability. Decentralized block space ordering.
In plain terms? Rollups don’t have to rely on a single centralized sequencer anymore. That’s infrastructure-level utility. And the ESP token sits right in the middle of it.
now governance, the holders of ESP tokens operate the DAO. For the purpose of staking, Validators are required to lock their ESP tokens to enhance network security. Consequently, the Rollups compensate in ESP’s as fees for sequencing services.
So rising on-chain metrics especially active addresses and development growth align directly with token utility. More usage means more demand pressure. That’s the theory.
Now layer that with enhanced liquidity from a major South Korean listing, like the upbit listing news and bitthumb listing news. Accessibility increases. Price discovery becomes sharper. Rollup developers who need ESP operationally now have deeper markets to source it.
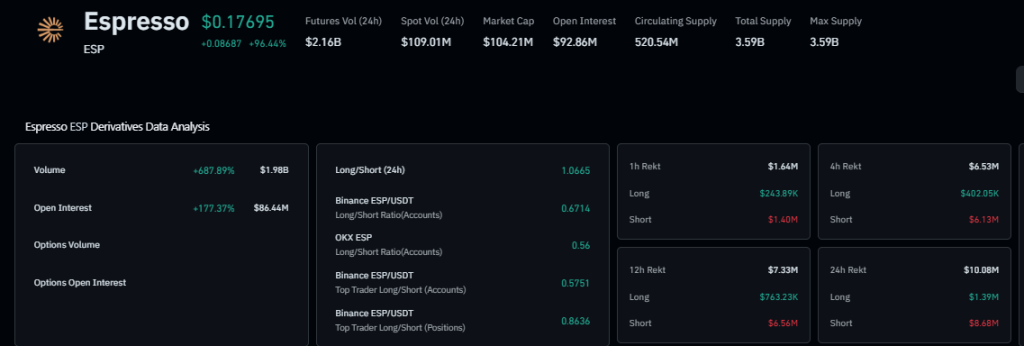
And derivatives traders didn’t sit this one out either. Proof is its Futures volume that exploded 687% to $1.98 billion. Open interest climbed 177% to $86.44 million. The long-short ratio sits at 1.0665, leaning bullish.
Liquidations tell the real story. Shorts lost $8.68 million in the past 24 hours. Long liquidations? Just $1.39 million. That’s a classic squeeze of short positions.
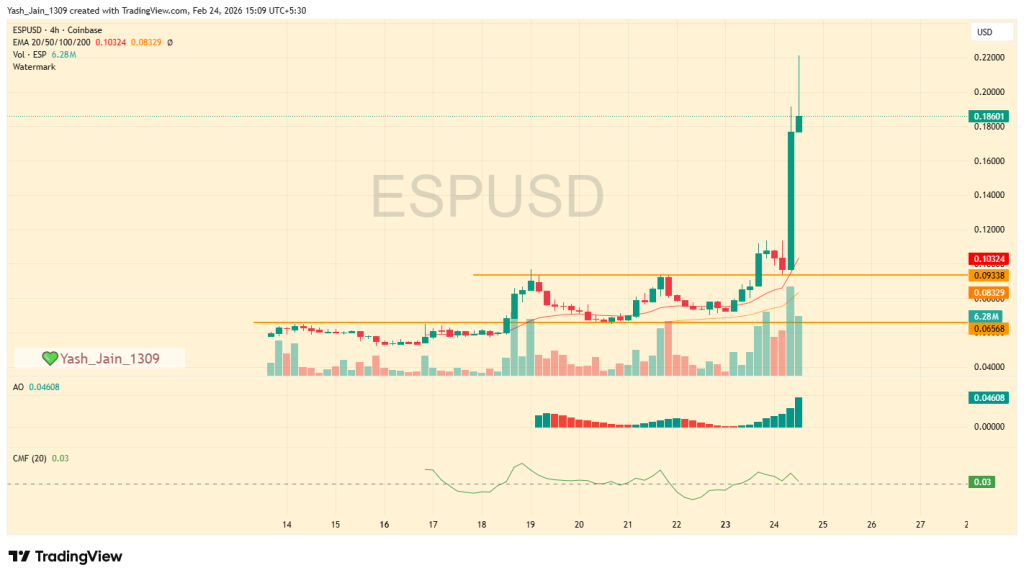
On the 4-hour ESP price chart, the token rocketed from $0.0933 to a peak of $0.2200. That’s a dramatic move in a compressed time window.
Of course, profit-taking followed. Price has already cooled back to $0.1933 not unusual after a 120% spike. Momentum traders got their payday. Long-term holders are probably watching carefully.
So now, what happens next is on its Adoption and demand, which will decide that. If rollup utilization continues rising and staking demand strengthens, the utility loop could sustain interest. But if volume fades post-listing, volatility may take over.
For now, one thing is clear: this Upbit listing news and Bitthumb listing news didn’t just bump liquidity but it flipped the ESP price chart into overdrive.
ESP is the utility token for Espresso Systems. It is used for DAO governance, staking by validators to secure the network, and as a fee payment for rollups using the decentralized sequencing service.
Espresso Systems provides shared sequencing infrastructure for Ethereum Layer 2s. It enables fast finality, cross-rollup interoperability, and decentralized block space ordering, removing the need for centralized sequencers.
While the listing has boosted liquidity and adoption metrics, potential investors should monitor sustained rollup usage and staking demand. The utility narrative is strong, but post-listing volatility is common.
Samsung has an updated LockStar version for One UI 8.5 devices, which carries a new unlock animation and functional enhancements.
With its One UI 8.5 refresh, Samsung LockStar gained some serious upgrades for the unlock animation segment. Now, the company is expanding the directory with a new addition called “Swirl,” and it’s ready to refresh your lockscreen.
Samsung enthusiast TarunVats showcased the new Swirl unlock animation in action. Unlocking the device using biometrics or PIN launches the transition that takes you to the home screen through a quick swirl animation effect.

Source – TarunVats/X
Additionally, the LockStar update improves manual brightness range for Full screen AOD. It’s a major feature of the Galaxy S25 series, which is gaining functional-level improvements to elevate the user experience.
Samsung specifically noted the enhancements provided to the status bar visibility. Galaxy users can expect even clearer status bar visibility while editing the unlock animation. Here’s the changelog of the LockStar update:
The updated LockStar is available on Galaxy Store.
One UI 8.5 is currently available on the Galaxy S25 series, that too on the Beta channel. The software is set to be officially revealed tomorrow. Samsung is expected to open the Stable One UI 8.5 rollout following the S26 series sale.
The post One UI 8.5 LockStar gains a new unlock animation and enhancements appeared first on Sammy Fans.
EU energy labels for the Galaxy S26 series have surfaced less than 36 hours before launch, and they reveal something few expected: better efficiency, but potentially weaker long-term battery health than the Galaxy S25.
The labels, obtained by Ytechb, cover the full lineup: the Galaxy S26, S26+, and S26 Ultra. They outline energy efficiency, endurance per cycle, repairability, durability ratings, and battery lifespan under the EU’s standardized testing framework.
Moving from 2000 cycles to 1200 cycles represents a reduction in long-term battery longevity. For users who keep their phones for four or five years, cycle count matters as it impacts how quickly battery capacity degrades over time.
The labels list battery endurance at 1200 charge cycles before dropping to 80 percent health. The Galaxy S25 series and several other recent Samsung devices were rated for 2000 charge cycles to reach that same 80 percent threshold.
On paper, the efficiency story looks strong. All three models carry an A-class energy efficiency rating. That puts them among the most power-efficient phones under the EU system. The standardized battery endurance test shows:
Those are solid numbers, especially considering the battery sizes are not dramatically larger than previous models. If the labels are accurate, Samsung has squeezed more usable time out of similar capacity cells.
All three devices are rated A for repeated free-fall reliability. The lineup carries an IP68 certification, meaning they are fully dust-tight and can survive submersion in up to 3 meters of fresh water for at least 30 minutes.
The Galaxy S26 series reportedly earns a C grade for repairability, suggesting moderate difficulty for component replacement. With launch day just hours away, official confirmation is close.

The post Galaxy S26 may trail S25 in long-term battery health appeared first on Sammy Fans.
Samsung just posted a 15-second clip that might go down as one of the sharpest pre-Unpacked jabs in recent memory. With the fresh Galaxy S26 teaser, Samsung roasts Apple and the photo editing limits of its iPhone and iOS.
The ad opens on a woman, carrying an iPhone, complete with the aged notch design and squarish camera setup on the back. The irony is that Samsung refrained from using the recent iPhones, which fully adopted Dynamic Island.
She is trying to erase her ex from a photo. Tap, smudge, and try again. The results look half-baked; ghosting artifacts everywhere. The message is clear: Apple’s so-called Object Removal is still playing catch-up.
The phrase Can your phone do that is clever because it avoids naming Apple. In the context of the iPhone 17 cycle and the broader iOS 26 AI push, it reads like a challenge.

Samsung is framing Apple as safe, controlled, and limited. Meanwhile, Galaxy AI is being positioned as creative, expressive, and even a little chaotic in the best way.
The Galaxy maker has done this before, but this time it feels more surgical. Using an actual iPhone as the prop is not accidental, but a direct shot at Apple’s ecosystem lock-in strategy.
Object removal is not new. Samsung has had Object Eraser in the Gallery for years. What this teaser signals is a serious upgrade.
Apple’s Clean Up tool in recent iOS builds handles basic object removal. It runs largely on devices and struggles with complex backgrounds.
The post Samsung roasts Apple iPhone in savage Galaxy S26 teaser appeared first on Sammy Fans.
Samsung owned the 2025 market in Europe, and the Galaxy was the region’s top-selling phone. Apple gained an upper hand in the fourth quarter, given the iPhone 17’s release, but the thunder didn’t help much against Samsung.
According to Omdia, the European smartphone market declined by 1% in 2025 to 134.2 million units. Samsung led Europe mobile phone market in 2025, and Galaxy A56 was the region’s top-selling smartphone.
Samsung remained Europe’s largest smartphone vendor in 2025, with shipments marginally growing to 46.6 million units. Apple grew 6% to 36.9 million this year, reaching a record-high 27% market share in Europe.
Europe’s bestseller belonged to Samsung, but the situation was entirely different in the US. Apple iPhones remain the top-selling phone stateside. Samsung manages to get its Galaxy A1x model ranked in the top 10 chart.
Xiaomi ranked third with 16% market share as it declined 1% to 21.8 million units. Motorola remained fourth despite declining 5% to 7.7 million units. HONOR climbed into Europe’s top five as it grew 4% to 3.8 million units.
Europe’s five largest smartphone vendors continued to gain combined share, reflecting the importance of scale for long-term success in the region.
According to Runar Bjorhovde, Senior Analyst at Omdia:
In 2026, concerns around memory pricing have created a challenging outlook. In Europe, which made up just 10.8% of all smartphones shipped worldwide in 2025, the biggest question is which vendors are most likely to prioritize the region if hit by price increases or supply shortages.

The post This Samsung phone outsold every iPhone in Europe in 2025 and it’s not the S25 Ultra appeared first on Sammy Fans.
The Galaxy S25 series was a hit in 2025, and Samsung is on the verge of releasing its successor lineup. This article tracks the complete specifications of the Samsung Galaxy S26 Ultra smartphone, based on leaks and reliable inputs.
Samsung is set to launch the Galaxy S26 Ultra on February 25, 2026, but the specifications mentioned in this article may change. For now, do not take this information as a confirmed spec or feature of the upcoming device.

Source – Sahil Karoul
Display
Samsung’s displays are always best-in-class, and the S26 Ultra aims to continue that legacy.
Performance
Galaxy S26 Ultra uses Snapdragon 8 Elite Gen 5 for Galaxy, a chipset tailored for Samsung flagships. The chip will be manufactured using TSMC’s 3nm process technology, offering significant gains in CPU, GPU, and especially NPU.
A key rumor indicates the S26 Ultra will be one of the first phones to use new LPDDR5X RAM clocked at 10.7Gbps. This is a substantial speed bump from the 8.5Gbps RAM in the S25 Ultra, offering various improvements.
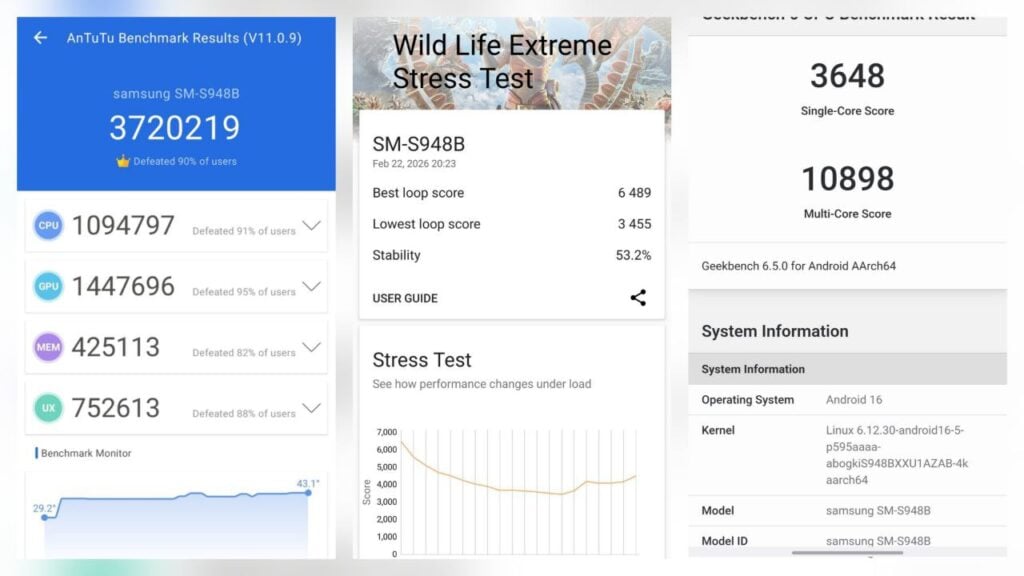
Images: Samsung Galaxy S26 Ultra AnTuTu, 3D Mark and Geekbench test results
Camera
Samsung’s Galaxy S26 Ultra is expected to be paired with:
A dual-telephoto system.
The device may use a new telephoto camera with 10MP resolution, trimmed down from a 12MP lens, featuring 3x optical zoom at a 1/3.94-inch sensor size, smaller than the Galaxy S25 Ultra’s 1/3.52-inch image sensor.
Additionally, the Galaxy S26 Ultra will have a 50MP periscope with a 1/2.52-inch sensor size. This camera will offer 5x optical zoom capabilities and enhanced light intake as compared to its predecessor, the S25 Ultra.
The bigger punch-hole:

Battery and charging
This is the upgrade users have been requesting for years. Samsung isn’t bringing a capacity upgrade to the Galaxy S26 Ultra. The battery will remain 5,000mAh, but the wired and wireless charging will upgrade to 60W and 25W, respectively.
Disclaimer: This is an Article Based on Leaks and Rumors
The information presented in this article is based on early leaks, supply chain rumors, and industry analyst speculation circulating as of February 23, 2026.
The post Samsung Galaxy S26 Ultra Complete Specifications: Everything you should know appeared first on Sammy Fans.
Samsung officially announced Galaxy Book6 prices and release date in the US. The company also revealed that its latest laptops will join the unveiling of the Galaxy S26 and Buds 4 series at the February 25 Unpacked event.
The Galaxy Book6 lineup introduces three models: Galaxy Book6, Book6 Pro, and Book6. The laptops feature Galaxy AI, incredible performance, and a symmetric and sleek design.
The latest laptops are crafted to be slim while retaining a premium feel. Both Galaxy Book6 Pro and Galaxy Book6 Ultra boast a notably slimmer profile, measuring just 11.9mm and 15.4mm, respectively.
Samsung confirmed that beginning March 11, the Galaxy Book6 series will be available throughout the US. Galaxy Book6 Ultra starts at $2,449.99, Galaxy Book6 Pro starts at $1,599.99, and Galaxy Book6 starts at $1,049.99.
Interested buyers can reserve the Galaxy Book6 series in Grey color. Consumers who reserve the latest devices receive a $30 credit upon pre-order and auto-enroll for a chance to win a $5,000 gift card to use on Samsung.com.
Additionally, Samsung says it will offer up to $900 trade-in credits. Even if you don’t trade your existing device, you will receive a $150 credit. These offers are applicable when you reserve and preorder through Samsung.com.

Source – Samsung
The post Samsung reveals Galaxy Book6 prices and release date in the US appeared first on Sammy Fans.
Samsung Galaxy S26 Ultra is a spec monster, yet it reportedly lacks a power-off tracking feature.
Despite Google rebranding and expanding its Find My Device network into Find Hub, Samsung’s Galaxy S26 lineup appears to miss one of its most practical recovery features: powered-off tracking.
Friends over at AndroidAuthority spotted a revealing entry on Google’s Issue Tracker. A Google employee shared logs from a Galaxy S26 Ultra while investigating a font-related issue. Buried inside was this line:
[ro.bluetooth.finder.supported]: [false]
It indicates that the Galaxy S26 Ultra does not support Bluetooth-based device finding after the phone is powered off. Google introduced this capability with the Pixel 8 series and continues it with the Pixel 9 lineup.
Google’s Find Hub powered-off tracking allows a device to be located for several hours after it has been turned off. Nearby Android phones act as anonymous relays through Find Hub, helping pinpoint a lost device.
This is not a minor convenience, but a real-world safety net, and Samsung still is not using it. Samsung fans often point to SmartThings Find and say, “We already have offline tracking.”
Samsung’s system relies on nearby Galaxy devices acting as “Find Nodes.” However, once the device is fully shut down, SmartThings Find stops working.
Google’s powered-off tracking is different. It leverages low-level Bluetooth functionality that survives shutdown for a limited window; that’s the key distinction.
What do you think, SammyFans? Is the lack of powered-off tracking on the Galaxy S26 Ultra a serious miss, or is Samsung’s SmartThings Find system sufficient for your needs?
The post Samsung Galaxy S26 Ultra lacks powered-off tracking feature appeared first on Sammy Fans.
Just a few hours more, and the world will witness 2026’s first mega reveal. Samsung is unveiling the Galaxy S26 series on February 25 at an in-person Unpacked, and the event will livestream on YouTube as well.
At the Unpacked event, Samsung will uncover the Galaxy S26 series, Buds 4 series, upgrades to Galaxy AI, and the new One UI 8.5. Galaxy S26 Ultra is the star of the show, but millions of fans are excited for the software update.
AI will dominate the Unpacked event, similar to the past few years. Samsung doesn’t have much to showcase other than software advancements. The Privacy Display feature will be the main highlight of the Galaxy S26 Ultra.
Samsung has also cut Snapdragon utilization from 100 percent to around 75 percent this year. In place of Qualcomm chip, the company is utilizing Exynos 2600, its in-house SoC made using 2nm process, in the Galaxy S26 series.
Exynos 2600 may also see some limelight at the Galaxy S26 launch. It brings significant upgrades in terms of CPU, GPU, and NPU. Leaked S26 Ultra promos already confirmed enhancements of the Snapdragon versions.
Samsung confirmed new earbuds will also be unveiled at the Unpacked event. The Galaxy Buds 4 series includes a standard and a Pro variant. These models bring major design refinements and a tweaked charging case.
The company has altered how owners will place the earbuds in the case. The blade light has been removed in line with improving the battery life. Various AI features have been added to improve the listening experience.
Samsung has been running One UI 8.5 Beta Program on the Galaxy S25 series. The new software will officially be unveiled at the Unpacked event.
The Galaxy S26 series will go on sale on March 11, 2026, marking the rollout of the official One UI 8.5 software. Samsung confirmed existing devices will receive the new features and updates sequentially.
Unpacked event to go live at:
As of 10 a.m. PT (Pacific Time)
The post Galaxy S26 Unpacked Official Livestream: February 25, 2026 appeared first on Sammy Fans.

The post Solana Price Cools Off, But Whales Load Up for a Rebound? appeared first on Coinpedia Fintech News
The Solana price isn’t exactly screaming strength right now. Volume bubble maps across both spot and futures markets show a clear cooling trend after what can only be described as overheating phases. And right now? Sell pressure is dominating.
If you zoom out on the Solana price chart, the pattern since 2021 is pretty consistent. After every volume exhaustion phase, there’s a neutral reset. Accumulation begins quietly, marked by mild “heating” traces, before eventually sliding into another overheating cycle. That’s the rhythm.
At the moment, we’re stuck in the green zone meaning bears haven’t stepped aside. The market still looks vulnerable, and price action suggests a potential solid demand area sitting around $48 to $50.
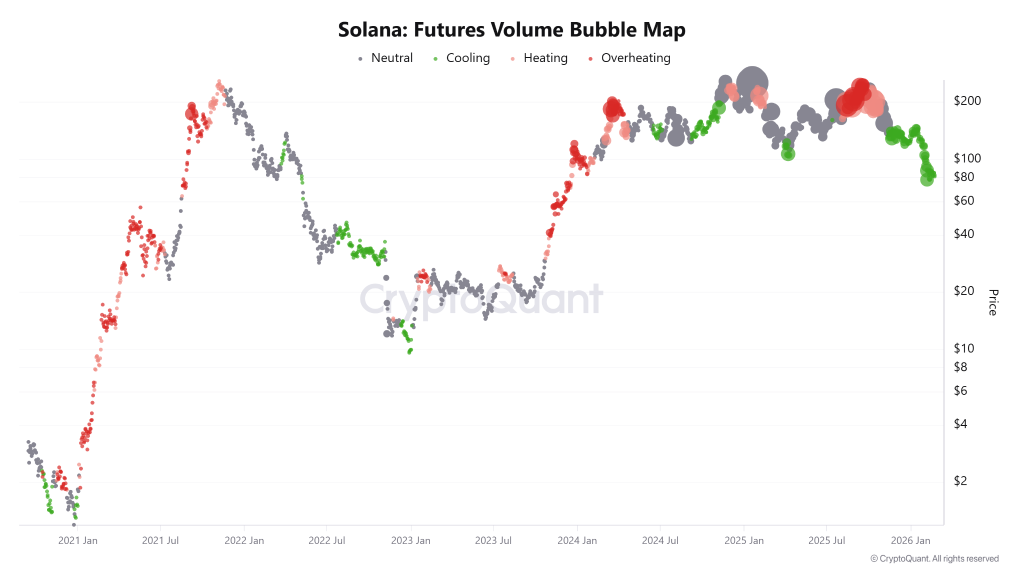
Here’s the uncomfortable truth: stable footing won’t come until volume across both spot and futures resets to neutral. Historically, that neutral zone is where real accumulation builds.
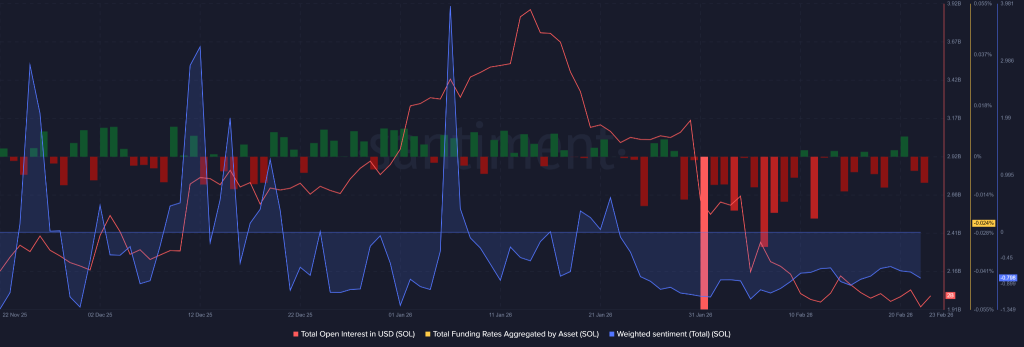
Right now, though, open interest has dropped sharply from $3.88 billion down to $2 billion. That’s not subtle. Leverage has been wiped out. Yet funding rates are recovering from the red zone toward the 0% line.
Translation? Some futures traders are quietly reopening leveraged long positions even while the broader downtrend remains intact.
The SOL/USD structure still leans weak, but derivatives positioning hints that at least a segment of the market believes the worst might be priced in.
Now here’s where it gets interesting. Despite the bearish tape and heavily negative weighted sentiment at 0.798, certain large players are going the other way. One whale deposited $2 million in USDC and opened a 20× leveraged long position on Solana. That’s not defensive behavior but that seem’s like his conviction for a relief rally.
Whale "0x4A2" deposited $2M $USDC into #HyperLiquid and increased its $SOL (20x) long position and still has an open order to further increase the position.
— Onchain Lens (@OnchainLens) February 23, 2026
The whale also holds a $ETH (20x) long position valued at $11.14M.https://t.co/phu0w0FPui pic.twitter.com/iJCXCQJWIe
There’s more. The percentage of stablecoin supply held by wallets above $5 million on the Solana network is rising. That suggests whales are accumulating dry powder within the ecosystem rather than exiting it. In on-chain terms, it’s often viewed as a positioning phase ahead of tactical deployments.
Long-term sentiment still tilts bearish. A move toward the $48–$50 region carries higher probability than a straight-line recovery. And yet, short-term signals also hint at a mood shift.
Daily active addresses are rising. New contracts are being deployed. Network fees are climbing. Utilization is up. Markets don’t usually fall in straight lines, and if accumulation is quietly forming, a relief rally isn’t off the table.
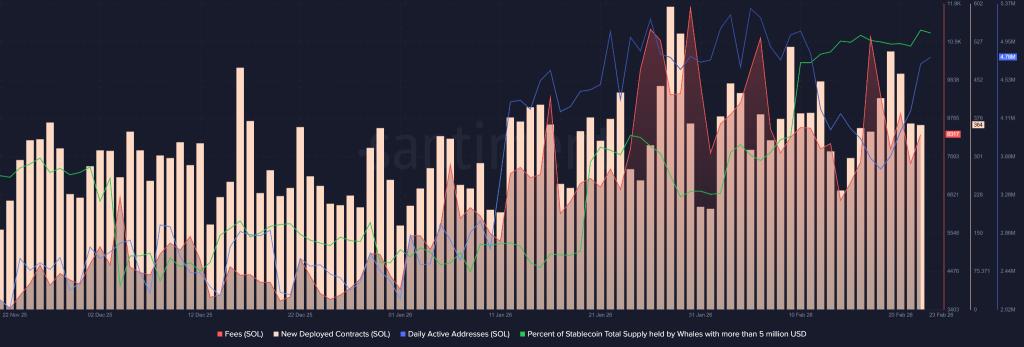
A bounce from the $75–$80 support area could ignite a move toward $160 before heavier sell pressure returns. That’s not a trend reversal but that could be a potential tactical rally within a broader downtrend.
So what does this mean for Solana price prediction narrative?
Simple. Structurally weak. Tactically interesting. Until volume resets and accumulation confirms on the Solana price chart, the Solana price remains caught between exhaustion and opportunistic whale positioning.

The post Ripple (XRP) Price Prediction 2026, 2027-2030: Will XRP Reach $5? appeared first on Coinpedia Fintech News
XRP price currently stands at $2.99, with a market capitalization of $179.79 billion. Analysts and AI forecasts alike suggest that XRP could reach $5.05 by the end of 2025. Long-term XRP price predictions also place it as high as $26.50 by 2030, with an ultra-bullish target of $526 by 2050.
Ripple (XRP) remains one of the top five crypto assets in the world, gaining traction as institutional adoption ramps up and its prolonged legal battle approaches resolution. Since President Trump’s return to office, XRP has seen a resurgence in on-chain activity, investor sentiment, and even XRP ETF approved turned it into a bluechip asset.
Now, making this the most ideal time for XRP price prediction 2026-2030 to be in more focus. Read this to know in depth what’s coming next in XRP.
| Cryptocurrency | XRP |
| Token | XRP |
| Price | $1.3751
|
| Market Cap | $ 83,903,837,132.61 |
| 24h Volume | $ 3,189,771,438.2748 |
| Circulating Supply | 61,018,583,977.00 |
| Total Supply | 99,985,712,847.00 |
| All-Time High | $ 3.8419 on 04 January 2018 |
| All-Time Low | $ 0.0028 on 07 July 2014 |
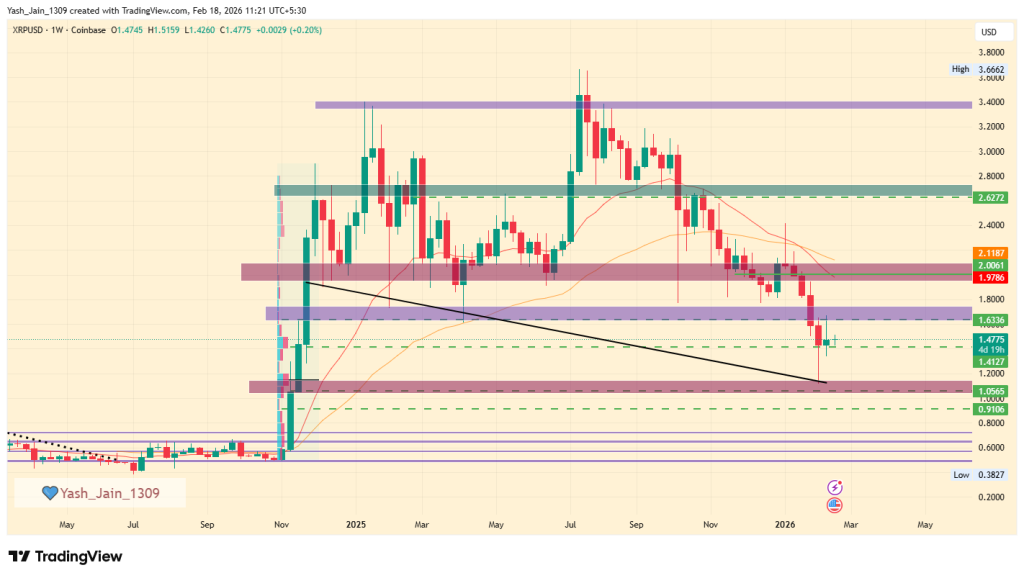
The XRP price has jumped from a recent low of $1.15, which is near a demand zone from late Q4 2024. After testing this demand area, A brief rise past $1.63 was caught. But, not a weekly close $1.63 has happened yet, but if it happens, it could lead to targets of $2.00 or $2.62 by Q1 2026. If it fails to break $1.63, a drop to $1.00 may occur.
In February, the price of XRP experienced a notable increase after bouncing back from a low of $1.15, indicating that more people are getting interested in buying it again.
But, how the price behaves for the few remaining days of February will depend on whether it can rise above $1.51. If it does, we might see it move up to around $1.63. However, if it drops below $1.35, it could fall further to the $1.10 to $1.00 range.
On the positive side, if XRP price did manages to get past $1.63 and continues to gain strength, the next important levels to look for would be $1.75 and $2.00 by March 2026. Conversely, if the price falls below $1.00, that could slow down its upward trend, and March might bring more uncertain price movements.
The weekly chart for XRP price indicates notable weakness, with the price declining to $1.15, thereby retesting the demand zone established in late Q4 2024. However, in February, there was a rapid rebound from this short-term demand level, which momentarily elevated the price to $1.65 before it subsequently fell back below $1.65 and above the $1.41 region.
Should the price continue its recovery and successfully surpass the $1.63 threshold with a weekly close, the uptrend may persist, potentially reaching targets of $2.00 or even $2.62 by Q1 2026. Conversely, if $1.63 serves as a resistance level and the price experiences a reversal, one can anticipate a decline to $1.00, with Q1 potentially characterized by consolidation around the $1.00 level.
| Year | Potential Low | Potential Average | Potential High |
| 2026 | $1.75 | $3.45 | $5.05 |
The XRP Ledger: DEX Transaction Count chart indicates a significant bullish divergence starting from May 2025. While the price is consolidating, the activity in decentralised exchanges (DEX) is increasing sharply.
The high transaction volume, which includes both orders placed and cancelled, shows that experienced traders are actively positioning themselves and adding liquidity in anticipation of a future price movement.
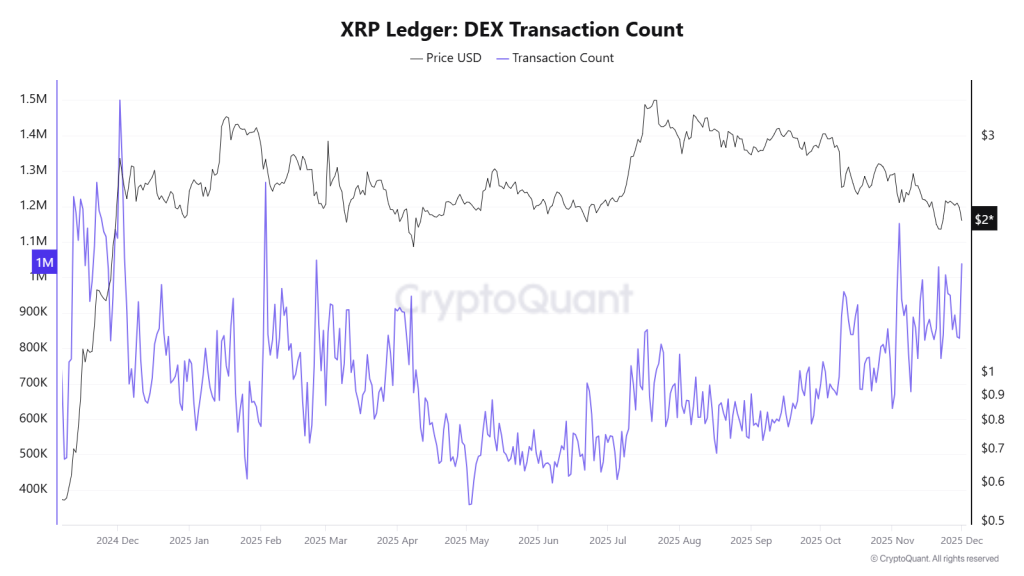
As a result, this on-chain metric suggests that the market is preparing for a powerful and sustainable rally in the XRP price ahead.
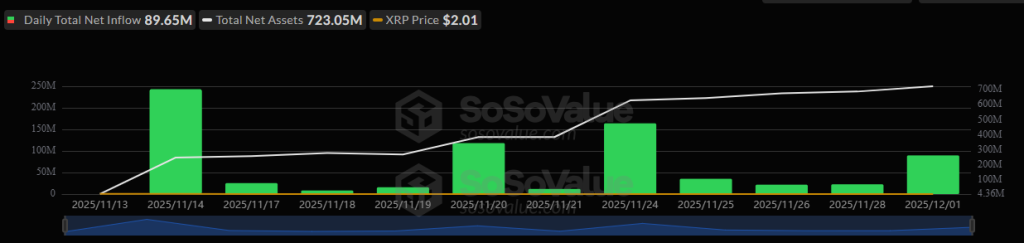
Also, the biggest fact right now in December is that altcoin liquidity is drying up. Projects securing new liquidity channels like ETFs have a better chance of long-term survival, and since November 14th, the XRP ETF has been seeing positive inflows consistently, despite what price action is, and so far, Cumulative Total Net Inflow has crossed $756 million, while total net assets are worth $723.05 million, by December 1st.
| Year | Potential Low ($) | Potential Average ($) | Potential High ($) |
| XRP Price Prediction 2026 | 5.50 | 6.25 | 8.50 |
| Ripple Price Prediction 2027 | 7.00 | 9.0 | 13.25 |
| XRP Price Prediction 2028 | 11.25 | 13.75 | 16.00 |
| XRP Price Prediction 2029 | 14.25 | 16.50 | 21.50 |
| XRP Price Prediction 2030 | 17.00 | 19.75 | 26.50 |
This table, based on historical movements, shows XRP price prediction 2030 to reach $26.50 based on compounding market cap each year. This table provides a framework for understanding the potential XRP price movements. Yet, the actual price will depend on a combination of market dynamics, investor behavior, and external factors influencing the cryptocurrency landscape.
Based on historic price sentiments and XRP’s rising popularity, here are the XRP future price projections beyond 2030, where Ripple price forecasts suggest that it has become more speculative. Therefore, assuming continued adoption and dominance, XRP may see aggressive valuations in the decades ahead.
| Year | Potential Low ($) | Potential Average ($) | Potential High ($) |
| 2031 | 25.00 | 29.50 | 35.25 |
| 2032 | 31.50 | 36.75 | 41.25 |
| 2033 | 35.75 | 42.25 | 47.75 |
| 2040 | 97.50 | 135.50 | 179.00 |
| 2050 | 219.25 | 331.50 | 526.00 |
A look at this table, highlights the XRP price prediction 2040 and XRP price prediction 2050 potential high ambitious targets but this reflect a transformative vision for XRP as a dominant global payment player.
| Firm Name | 2025 | 2026 | 2030 |
| Changelly | $2.05 | $3.49 | $17.76 |
| Coincodex | $2.38 | $1.83 | $1.66 |
| Binance | $2.16 | $2.27 | $2.76 |
Stay ahead with breaking news, expert analysis, and real-time updates on the latest trends in Bitcoin, altcoins, DeFi, NFTs, and more.
Analysts estimate XRP could trade between $1.75 and $5.05 in 2026, depending on ETF inflows, adoption growth, and overall crypto market momentum.
XRP price predictions for 2030 range from $17 to $26.50 if adoption, ETF growth, and crypto market expansion continue steadily.
By 2040, forecasts suggest XRP could trade between $97 and $179 if global payment adoption and institutional demand expand significantly.
XRP may suit long-term investors who believe in cross-border payment adoption and regulatory clarity, but price volatility remains a key risk.
ETF inflows, Ripple network expansion, legal clarity, and rising on-chain activity are major factors that could support higher XRP prices.
The post Is XRP Price Facing $45 Million Whale Dump Risk? appeared first on Coinpedia Fintech News
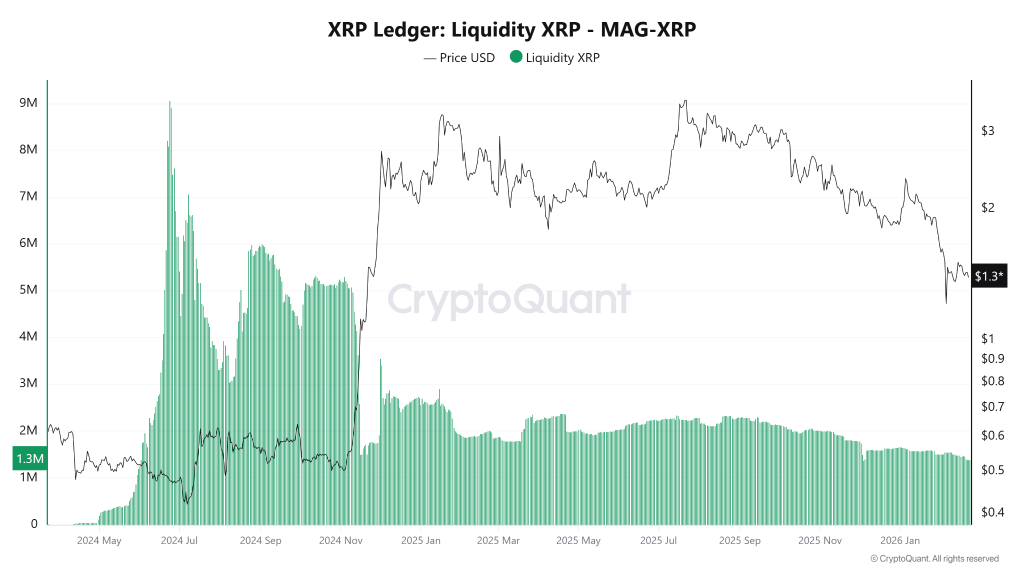
The XRP price had momentum. Liquidity expanded during the rally phase, USD depth grew, and the market had enough capital cushion to sustain upward moves. But now? That cushion is thinning.
Because, USD liquidity the capital depth supporting XRP markets has been declining. During the expansion phase, deeper liquidity allowed price to move higher without dramatic instability. Recently, though, that depth has faded. Thinner markets mean higher sensitivity. Volatility doesn’t need much fuel when the order books aren’t as thick as they used to be.
And that’s just one side of the equation.
On the token side, XRP liquidity had compressed noticeably before the previous breakout. Reduced active supply often precedes strong directional moves and that’s exactly what happened.
Now XRP liquidity is trending lower again, resembling those earlier pre-expansion conditions.
So why isn’t the XRP price ripping higher again?
Well, here’s the detail: since, whales are dumping but it appears to be preparing another exit door.
Data from CryptoQuant highlights a steady and systematic rise in cumulative whale inflows into Binance throughout 2026. Since January, the curve hasn’t spiked randomly, it’s climbed consistently. That’s why XRP price has been so sticky around $2 in 2025 and dipped to $1.40 presently.
The acceleration became clearer in early February, per the latest query run on CryptoQuant’s Arab Chain dashboard. The pace of cumulative whale deposits increased compared to January, suggesting larger players are transferring balances to exchanges more aggressively.
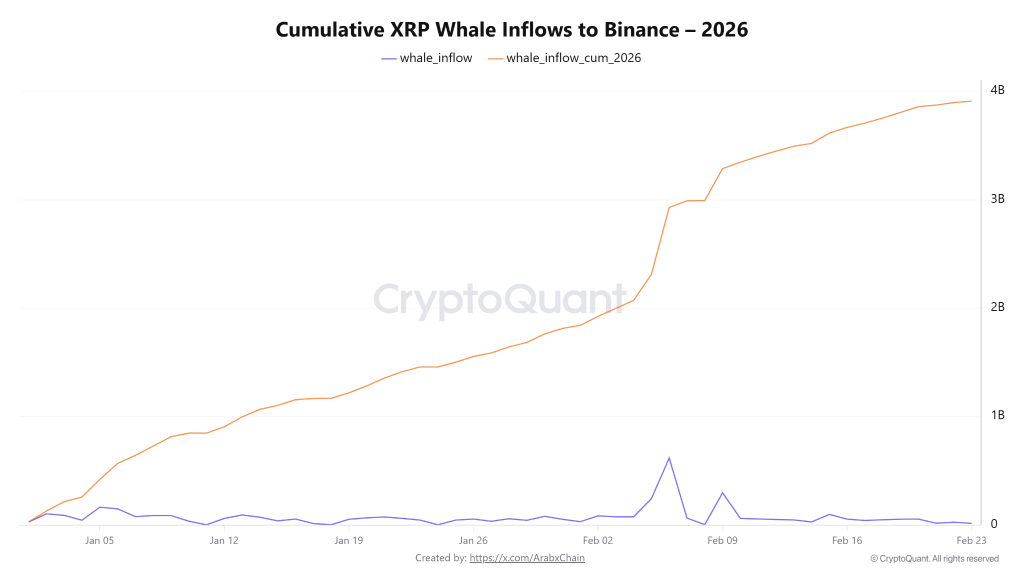
Historically, increased whale flows to exchanges often coincide with short-term corrections or heightened volatility. With cumulative exchange flows rising, the theoretical liquidity available for sale is now higher than before.
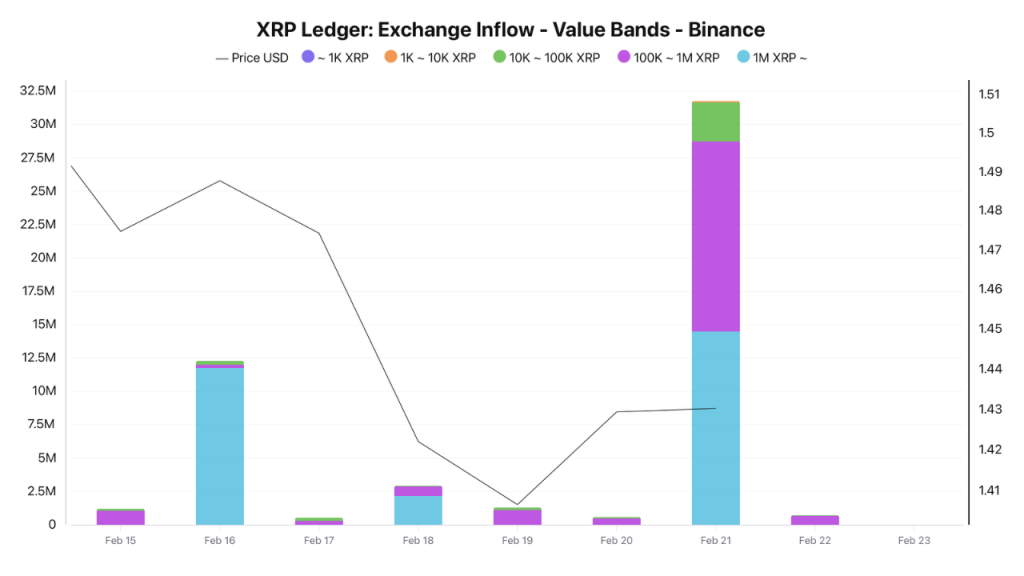
This week alone saw more than 31 million XRP transferred to Binance in a single day.
Altogether, that’s nearly $45 million in potential sell-side pressure. Not catastrophic, but definitely worth watching on any XRP price chart.
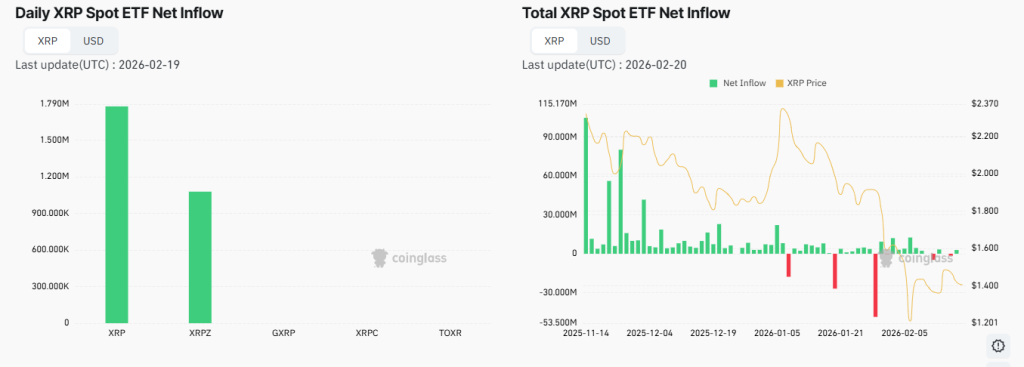
Meanwhile, inflows and outflows for the XRP ETF have slowed significantly. Reduced net activity signals fading momentum since launch. In plain terms, buyers aren’t stepping in aggressively and sellers aren’t rushing either.
Add in broader market indecision, with bitcoin ranging and offering little directional clarity, and altcoins like XRP are left without a strong macro tailwind.
So, If liquidity keeps thinning and whale deposits persist, recovery could remain capped in the near term. The XRP/USD pair doesn’t just need compressed supply, it needs demand to absorb it.
Until that balance shifts, the XRP price analysis suggests it may struggle to regain sustained upward momentum.
The post Bitcoin Cash Price Prediction 2026, 2027 – 2030: Will BCH Hit $1000? appeared first on Coinpedia Fintech News
With Bitcoin smashing through the $100K barrier, all eyes are now on Bitcoin Cash (BCH) as traders wonder—will BCH price follow with a banana move of its own? Beyond hype, Bitcoin Cash is proving its value in the real world. Ranked 4th on Crypwerk’s global adoption list, BCH is gaining traction for its speed, low fees, and merchant-friendly design.
If you’re searching for answers to “Will Bitcoin Cash go up further?” — you’re not alone. In this Bitcoin Cash price prediction 2026–2030, we dive into the technicals and adoption trends shaping the next big BCH Price Prediction.
| Cryptocurrency | Bitcoin Cash |
| Token | BCH |
| Price | $537.7659
|
| Market Cap | $ 10,754,807,703.82 |
| 24h Volume | $ 421,260,329.4291 |
| Circulating Supply | 19,999,050.00 |
| Total Supply | 19,999,050.00 |
| All-Time High | $ 4,355.6201 on 20 December 2017 |
| All-Time Low | $ 75.0753 on 15 December 2018 |
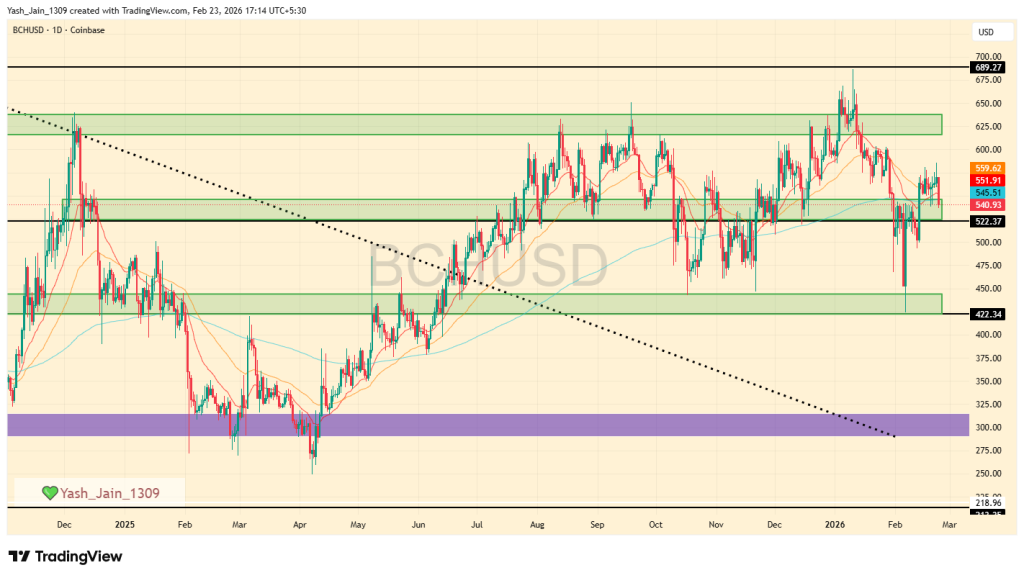
Q1 2026 could initiate a rally based on the success of the multi-year descending triangle pattern. On a 1-M timeframe, BCH/USD is in a consolidation between $425 and $689. But, sustaining above $689 would signal a trend shift. However, dropping below $450 risks a quick decline, with $300 as a critical support level.
In January, the price of Bitcoin Cash (BCH) briefly peaked at $689 before dropping back down. This decline led to a test of a support level around $422 in February.
By the end of February, the price showed some signs of recovery, reaching about $550. This indicates that buyers are attempting to push the price up, but sellers are still quite strong.
As February comes to a close soon, BCH is trading above a critical support level at $522. The price could either rise towards $625 or drop below $522 again. If it falls below $522, it might continue to decline towards $422 in March. Therefore, staying above $522 is important during February, as it will help determine the overall trend for the first quarter of 2026.
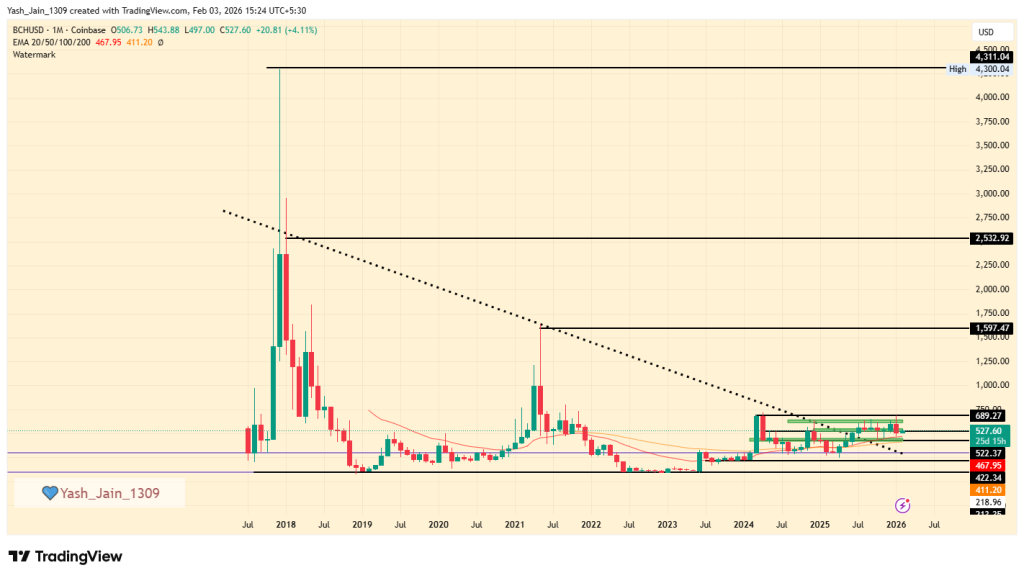
Q1 2026 is set to be the most attractive period for the rally to truly kick off, because H2 2025 onwards it has broken out of a multi-year descending triangle pattern on the monthly chart, and ever since then it has mostly consolidated in a range of $425-$689. The range is quite big on a shorter timeframe, but on a longer timeframe, like monthly, it’s an ordinary consolidation whose movements are not as big as they sound compared to its historical price action.
In Q1 2026, it continues to consolidate in its range and has hit $689 once. And now, if it sustains above it in the coming months, that will signify a “Change of Character (ChoCh)” on the monthly chart, marking a significant long-term trend shift and unlocking potential for higher targets ahead.
Also, under the worst-case scenario, if the BCH price drops below critical support at $450, we could see a swift decline. The $300 level is expected to serve as a strong line of defense against further declines; however, breaking this level would completely delay the current long-term bullish sentiment
| Year | Potential Low | Potential Average | Potential High |
| 2026 (conservative) | $300 | $605 | $1200 |
| Year | Potential Low ($) | Potential Average ($) | Potential High ($) |
| 2026 | 300 | 689 | 1,160 |
| 2027 | 680 | 925 | 1,160 |
| 2028 | 795 | 1,135 | 1,475 |
| 2029 | 1,025 | 1,480 | 1,955 |
| 2030 | 1,350 | 2,010 | 2,675 |
This table, based on historical movements, shows BCH price to reach $2675 by 2030 based on compounding market cap each year. This table provides a framework for understanding the potential BCH price movements. Yet, the actual price will depend on a combination of market dynamics, investor behavior, and external factors influencing the cryptocurrency landscape.
In 2026, Bitcoin Cash price could project a low price of $300, an average price of $689, and a high of $1,160.
As per the Bitcoin Cash Price Prediction 2027, BCH may see a potential low price of $795. Meanwhile, the average price is predicted to be around $1,135. The potential high for BCH price in 2027 is estimated to reach $1,475.
Looking ahead to the Bitcoin Cash Price Prediction 2028, BCH is expected to have a low price of $1,025. With an average price of $1,480, the BCH price could make a high of $1,955.
Finally, by 2029, Bitcoin Cash Price Prediction anticipates a low price of $1,350, an average price of $2,010, and a high of $2,675.
For the year 2030, Bitcoin Cash Price Prediction forecasts a low price of $1809, an average price of $2705, and a high of $3410.
Stay ahead with breaking news, expert analysis, and real-time updates on the latest trends in Bitcoin, altcoins, DeFi, NFTs, and more.
BCH price prediction for 2026 ranges from $680 to $1,160, depending on whether it confirms a long-term bullish trend shift.
Bitcoin Cash could trade between $1,350 and $2,675 by 2030 if adoption rises and market conditions remain favorable.
By 2040, Bitcoin Cash could see significantly higher valuations if global payments adoption expands, though forecasts remain speculative.
Yes, BCH could grow through wider merchant adoption, faster payments, and improved on-chain utility in real-world transactions.
BCH has long-term potential due to low fees, fast transactions, and growing merchant adoption, but price depends on broader crypto market trends.
Revisiting previous highs is possible if BCH sees sustained adoption and a confirmed long-term trend reversal, though it’s not guaranteed.
Samsung’s Galaxy Enhance-X app is getting a major design overhaul in One UI 8.5, along with Good Lock vibes. With the latest update to the AI-powered application, editing on a Galaxy phone just got a lot more serious.
Enthusiast GalaxyTechie revealed the One UI 8.5-based Galaxy Enhance-X app with Good Lock vibes. The app’s version 16.3.00.31 brings a major change to the user interface and adds support for installable plugins.
Samsung has quietly rebuilt the app around a cleaner, more deliberate layout that mirrors One UI 8.5 aesthetics. Open the updated app and you are greeted with a new three tab structure: Plugins, Home, and History.
Rounded elements, refined spacing, and subtle animations give it that One UI 8.5 flavor.

Credit – Galaxy Techie
The real headline feature is the new Plugin system. Samsung is introducing downloadable plugins that expand editing functions. Right now, the spotlight is on nine Film Style Filters; each preset leans into a distinct film inspired mood.
Cinematic Glow stands out as it adds a soft, dreamy bloom to highlights. There is also a Focus Shift tool that intelligently isolates a subject and blurs the background.

Credit – Galaxy Techie
Beyond editing, version 16.3.00.31 introduces stronger document tools: annotation, translation, PDF to JPEG conversion, and even bulk editing. This turns the app into a lightweight productivity companion for scans, notes, and markups.
Samsung is clearly positioning Enhance-X as more than a filter app. With this update, it feels integrated, purposeful, and aligned with the broader Galaxy AI direction.
The post Galaxy Enhance-X adopts One UI 8.5 design and Good Lock vibes appeared first on Sammy Fans.
Samsung pushes new software updates with tighter security and smoother performance. Meanwhile, the latest update on the Galaxy S22 series has caused a severe issue: endless restarts.
Reports from Reddit, via Piunikaweb, confirm the Galaxy S22 series endless reboots. Shortly after installing the update, some users say their phones began restarting over and over again. Some describe devices overheating or freezing to the point of being unusable.
This is not limited to a single model; both the base S22 and the Ultra are mentioned repeatedly in user threads. A few owners say their devices became so unstable that they were effectively unusable.
Some users tried a factory reset as well, but it didn’t make any impact. Several users attempted recovery mode wipes, only to find the boot loop returning. Others went deeper, clearing cache partitions or even reflashing firmware through PC tools.
There is one workaround that appears to help in some cases. Updating the One UI Home app seems to stabilize certain affected devices.
To be clear, this does not appear to be affecting every Galaxy S22 owner. Some users responding to the same threads say their devices updated without issue.
Security patches are supposed to protect devices, not send them into an endless restart. The silence from Samsung so far only adds to the anxiety; there is no detailed public statement so far.
If you own a Galaxy S22 device and it’s functioning accurately, don’t update its software as for now.
The post Galaxy S22 caught in endless reboots after latest Samsung update appeared first on Sammy Fans.
In a shocking twist, a Dubai-based retailer has already put the Galaxy S26 Ultra on sale at a significantly higher price. The seller is selling African units of the Galaxy S26 Ultra, now in 512GB as well, and the price dropped significantly.
YouTuber Sahil Karoul announced the pre-launch purchase of the Galaxy S26 Ultra for 12,000 AED in Dubai. It’s almost double the price of the flagship phone when it goes on sale around March 11, 2026.
After tons of leaks, the YouTuber revealed that the device is now 4,000 AED cheaper than the first purchase. It brings the pre-launch mode’s price to around 8,000 AED in Dubai, which is still 1.5x more expensive than the real cost.
What’s more, the 512GB version is also selling in the market. Anyone willing to pay such huge money for an early treat can visit the store and make the purchase.
It has just made Unpacked boring and raises questions about Samsung’s product control strategy. While we were awaiting a slew of promotional material, the internet was flooded with in-hand shots and videos, that too without control.
Source – Sahil Karoul
The post Sabotage? Galaxy S26 Ultra 512GB on sale in Dubai; huge price drop appeared first on Sammy Fans.
Galaxy Unpacked is officially scheduled for this Wednesday. The wait is almost over, and yet, in a shocking twist, the Galaxy S26 Ultra unboxing has already happened.
Hours before Samsung takes the stage in San Francisco, a retail unit of the Dubai and African variant surfaced online via Sahil Karoul. The pre-launch unboxing of Galaxy S26 Ultra stole the thunder from Samsung Unpacked.
Galaxy S26 Ultra in its White colorway is shown in the video. It gives us the cleanest look at the retail box, what it contains inside, and how the phone looks. The Dubai-based YouTuber also tested the device on various segments.
Samsung has removed the individual camera rings this time. The rear now looks flatter, more unified, with a circular periscope module that stands out subtly against the White finish. Rounded edges are back, prioritizing in-hand comfort.
Source – Sahil Karoul
Coming to the front, the Galaxy S26 Ultra has more rounded corners. The difference is clearly visible from the screen size, more than the back view. Key specs like refresh rate and resolution remain unchanged.
Privacy Display is the biggest highlight of the Galaxy S26 Ultra. The YouTuber tested out the phone’s signature feature outdoors. It practically saves on-screen content from peeping eyes, as shown in the unboxing video itself.

Source – Sahil Karoul
Gaming performance has been tested across different titles. The device runs effectively faster and cooler than its predecessor. The new Snapdragon 8 Elite Gen 5 for Galaxy chip is paying off the technological upgrades here.
The Unboxing video will follow camera review soon, as promised by Sahil. The first impressions video alone features some initial daytime and low-light shots. The software looks stable, with more improvements likely ahead.
The post Full Galaxy S26 Ultra unboxing just made Samsung Unpacked boring appeared first on Sammy Fans.
Samsung starts February 2026 update rollout to the Galaxy S25, S25+, S25 Ultra, S25 Edge and S25 FE. The firmware has just dropped in South Korea, and users around the world are lining up to grab the latest patch.
Galaxy S25 (Edge too) users in Korea can identify the February 2026 update via PDA build version ending with BZB2. If you own a Galaxy S25 FE, the firmware ends with AZB2, as the device has an edge over the main models.
Earlier this month, Samsung revealed its February patch brings fixes for 37 vulnerabilities. The package is dominated by patches provided by Samsung. Google’s participation is here, but the contribution is minimal.
February patch is necessary before the major One UI 8.5 upgrade. It sets the foundation for the next big release, slated after the Galaxy S26 release. If Samsung holds the rollout in March, we may see the OTA dropping in April.
How to update
Updating software on Samsung phones doesn’t require manual flashing. You just need to enter System Settings and initiate the Software update.
Before you begin, make sure your phone is charged above 50 percent. While not necessary, creating a backup of your device’s settings and data is always a good precaution.
The post Breaking: Samsung releases February 2026 update for Galaxy S25 Ultra, Edge and FE appeared first on Sammy Fans.
After Qualcomm, Samsung has now formally confirmed the big Galaxy S26 reveal with Snapdragon. The next Unpacked is just days away, and the lineup is bringing the world’s fastest and most advanced mobile processors this year.
Samsung is seemingly treating Exynos 2600 as a side project, as no promo material or social handle posts promoting the in-house chip. In a recent development, Samsung has now teased a big reveal, the Galaxy S26 series, with Snapdragon.
Snapdragon 8 Elite Gen 5 for Galaxy is tuned specifically for Samsung flagships. It has an overclocked central processing unit (CPU) over the standard version, bringing two prime cores clocked at 4.74 GHz.
A leaked Galaxy S26 Ultra promo revealed that the chip delivers 39 percent better NPU, 24 percent more capable GPU and 19 percent faster CPU than the Snapdragon 8 Elite.
Exynos is making a comeback to Samsung flagships in 2026. The company has succeeded in approving Exynos 2600 for the Galaxy S26 series. It’s the world’s most advanced processor manufactured on a 2nm process.
A larger portion of the Galaxy S26 series will still feature the Snapdragon 8 Elite Gen 5 for Galaxy processor. Specifically, all the S26, S26+ and S26 Ultra variants in the US, Canada and China will use Qualcomm-made processors.

The post Samsung confirms what Galaxy S26 fans were hoping for appeared first on Sammy Fans.

The Ethereum co-founder still has over 7,000 ETH left to sell, a supply overhang that could push the ETH price lower in the coming days.
Samsung has reportedly finalized the Galaxy S26 Ultra prices, and South Korean consumers may be paying up to 20 percent extra. The smartphone’s top-tier variant might be getting a steep price hike of roughly $300 in Korea.
According to Chosun, Samsung Galaxy S26 Ultra prices have been decided. The company is raising prices across the memory variants. If you’re considering getting the 1TB model, you might have to take a step back.
The report says that the S26 Ultra is set to launch at 1,797,000 won (~ $1,250) for 256GB, 2,050,900 won (~ $1,425) for 512GB and 2,545,400 won (~ $1,765) for 1TB. By storage capacity, the price hike grows steeper with larger storage.
The price figures are for South Korea; USD converted at the exchange rate as of February 23.
Comparison with the S25 Ultra
The 1TB model has been finalized at 2,545,400 won (~ $1765). This is 418,000 won (~ $290) more than the previous Galaxy S25 Ultra 1TB (2,127,400 won/~ $1475), representing an increase of approximately 20%.
The Galaxy S26 Ultra 512GB model is priced at 2,050,900 won, up 11.3% from the previous model (1,841,900 won). The 256GB model is set at 1,797,000 won, a 5.8% increase from its predecessor (1,698,400 won).
The spike in prices is fueled by rising costs of components. Over the past couple of months, the costs of DRAM and NAND flash memory chips have skyrocketed. It remains to be seen if the impact is seen in the United States.
An industry insider noted,
“The Ultra lineup has a high proportion of large-capacity storage adoption, and as memory prices have surged recently, the cost burden for higher-capacity options like 1TB has been more significantly reflected in pricing.”
Get ready for Unpacked on February 25.

Image courtesy – @KaroulSahil/X
The post Galaxy S26 Ultra final prices leak; 16GB (1TB) variant jumps $300? appeared first on Sammy Fans.
Samsung last year dumped Bluetooth features from the S Pen on the Galaxy S25 Ultra, and the new Galaxy S26 Ultra repeats that lack.
A video leaked of a pre-launch retail unit confirms that the Galaxy S26 Ultra doens’t feature Bluetooth-powered S Pen features. It’s not a sudden shift, but retained from the previous year’s flagship model.
YouTuber Sahil Karoul, who is the world’s first person to own the S26 Ultra, tested the S Pen on the device. The demo video showcases that the device repeats the lack of Bluetooth, erasing hopes for an upgraded S Pen.
When Samsung removed Bluetooth support, Galaxy S25 Ultra buyers criticized the move and asked if it’s a start of the complete removal of the S Pen in the following year(s).
S Pen faced two massive shifts in 2025, and 2026 looks no different. The Galaxy S26 Ultra still lacks S Pen features seen in the S24 Ultra and previous models. Air Actions are the first victim of the lack of Bluetooth in the stylus.

Galaxy S26 Ultra has increased the curvature of its corners. Samsung also pushed the S Pen silo to the edge, making the upper button rounded on one side. It makes the S Pen vulnerable if it’s inserted incorrectly or by accident.
The post Galaxy S26 Ultra repeats the S25 Ultra’s S Pen mistake appeared first on Sammy Fans.
Alongside the upcoming Galaxy S26 series, Samsung is rolling out an upgraded “New Galaxy AI Subscription Club.” It looks like a richer bundle, but it’s a more complex bet on how long you plan to hold onto your phone.
Galaxy S26 introduces enhanced AI Subscription Club
Samsung launched enhanced Galaxy AI Subscription Club ahead of the Galaxy S26 series debut. Now the headline change: a new 3-year tier priced at KRW 8,900 per month ($6.18). The existing 1-year and 2-year plans remain at KRW 6,900 per month ($4.79).
What you get for that higher monthly fee is Samsung Care+ Smartphone Loss & Damage coverage for 36 months, along with a 25 percent residual value guarantee if you return the device at the end, with loss coverage that is new at this tier.
The plan allows one loss claim per year with a 25 percent deductible. Damage claims are unlimited, with a 25 percent deductible. It also includes battery replacement, free repairs, and in-home service.
The new 3-year plan trades higher short-term value retention for longer protection against the worst-case scenario: losing the device entirely.
To qualify for the residual value payout, you must return the device within two months, including the final subscription month.
Subscribers get up to KRW 3,000,000 ($2,083.33) in compensation for cyber financial crimes such as phishing or smishing, with no deductible.
There is also up to KRW 500,000 ($347.22) in coverage for online direct transactions or shopping fraud, though here the deductible is 20 percent of the loss or KRW 100,000 ($69.44), whichever is greater.
Customers who enrolled in the 1-year plan with a Galaxy S25 and re-enroll after buying a new Galaxy device will receive three months of free subscription fees, plus one year of Samsung Fire & Marine 365 Travel Insurance.
Samsung Electronics Korea VP Jung Ho-jin commented:
“The renewed New Galaxy AI Subscription Club has been designed to offer customers broader choices and wider coverage. We will continue to evolve our subscription services to meet changing smartphone usage patterns and customer needs.”
The original program, introduced last year, bundled a residual value guarantee of up to 50 percent, Samsung Care+ damage coverage, and accessory discounts. Samsung says 1 in 5 customers who bought flagship unlocked models signed up.
Image via Alfaturk16
The post Samsung boosts AI Subscription Club benefits for Galaxy S26 appeared first on Sammy Fans.
A fresh theory surrounding the next Galaxy S Ultra phone is gaining traction, and this one is rooted in optics rather than wishful thinking. Samsung may have equipped the Galaxy S26 Ultra periscope camera with ALoP technology.
According to analysis shared by @MyDaebakCafe on X, Samsung looks to have applied All Lenses on Prism (ALoP) technology to the Galaxy S26 Ultra periscope camera. If this holds true, it would mark a meaningful shift.
The claim is not coming out of thin air. It is based on macro-level visual inspection of the camera module. Specifically, how light appears to interact with the periscope structure beneath the cover glass.
Shape or tetraprism systems
In conventional folded zoom designs, light enters the module and hits the prism first. The prism then redirects the light sideways into a horizontal optical stack. The side effect is a visible “deep well” when you peer into the camera.
All Lenses on Prism
Instead of placing the prism at the top of the stack, Samsung’s ALoP design positions the lens elements directly on top of the prism. Light hits circular glass first, then travels through refractive curves before reaching the prism below.
The visual evidence suggests the S26 Ultra module shows circular lens elements sitting flush against the cover glass rather than buried in a rectangular cavity.
Image courtesy – @KaroulSahil/X
By stacking lenses above the prism, Samsung can shorten the overall module length. It also allows for larger apertures; a wider aperture means more light gathering and more light means brighter shots and cleaner zoom.
If the Galaxy S26 Ultra is indeed the first mainstream device to adopt it, Samsung seems to be pivoting toward a more refined periscope strategy after iterating through multiple zoom configurations.
The post Galaxy S26 Ultra periscope boasts ALoP camera technology? appeared first on Sammy Fans.
Privacy Display turns out to be the most intelligent feature crafted in recent years. Samsung is aggressively marketing the Privacy Display as a critical feature of the Galaxy S26 Ultra, and a new leak just exposed its strongest mode.
A Dubai-based YouTuber has already bought the Galaxy S26 Ultra by paying almost double the retail cost. Samsung is set to reveal the new phones on February 25, but this pre-launch purchase has flooded the internet with early leaks.
Display settings in Galaxy S26 Ultra feature a Privacy display toggle. Next to it is a secondary mode entitled “Maximum privacy protection.” Switching it on launches the maximum on-screen content security on the device.
Privacy display toggles do the same work on the Galaxy S26 Ultra, but if you want the strongest anti-peeping, you need to switch on “Maximum privacy protection,” via IceUniverse.

In a recent leak, we’ve seen the user interface and customizable options of the Privacy screen feature. The menu allows you to set up the feature to work when and how to function, along with specific app preferences.
Samsung is reportedly utilizing Flex Magic Pixel in the Galaxy S26 Ultra. The Privacy Display feature is backed by this technology alone. Its combination with software and artificial intelligence makes it a truly useful solution.
Galaxy S26 series reveal is scheduled for February 25 at a mega Unpacked event. Samsung is offering up to $900 savings upon trade-in. Reservation is free and enters you into a $5,000 giveaway in the United States.
The post Galaxy S26 Ultra’s strongest Privacy Display mode exposed appeared first on Sammy Fans.
Samsung Galaxy S26 Ultra’s first real-world AnTuTu, 3DMark, and Geekbench test results are already out, even before the official debut. The device is powered by an overclocked Snapdragon 8 Elite Gen 5 for Galaxy chipset.
AnTuTu, 3DMark and Geekbench scores out
Samsung’s Galaxy S26 Ultra scored 3.72 million on AnTuTu, alongside 3,648 in Geekbench 6 single-core and 10,898 in multi-core testing. Source – Sahil Karoul
In 3DMark Wild Life Extreme stress testing, the S26 Ultra posted 53.2 percent stability. Peak temperature on the S26 Ultra reportedly reached 44 degrees Celsius during testing.
For context, the S25 Ultra balanced closer to 70 percent under similar conditions.
Images: Samsung Galaxy S26 Ultra AnTuTu, 3D Mark and Geekbench test results
he data suggests a meaningful jump over the Galaxy S25 Ultra, especially in multi-core throughput. CPU gains look healthy, and GPU performance also appears strong.
A 3.72 million AnTuTu score is no small feat. The 53 percent stability figure looks less like a hardware limitation and more like unfinished optimization work. 3,648 points in single-core and 10,898 points in multi-core on Geekbench will even improve.
It is worth noting that this is a pre-launch device running non-final firmware.
Early Galaxy S24 and S25 units also showed uneven stability prior to release, only to improve noticeably with launch firmware and subsequent updates. With the official release expected on March 11, Samsung still has time to refine the software.
If Samsung tightens things up before release, the retail S26 Ultra could deliver not just record breaking peak numbers, but also the sustained performance fans actually care about.
The post Galaxy S26 Ultra real-world AnTuTu, 3DMark and Geekbench test results surface appeared first on Sammy Fans.
Samsung has increased the Galaxy S26 Ultra corner curvature, which ends up making S Pen insertion trickier than the S25 Ultra.
Days before Samsung’s February 25 Unpacked event in San Francisco, YouTuber Sahil Karoul posted hands-on footage of what he claims is a Galaxy S26 Ultra, which shows S Pen insertion has become a bit tricky.
The video shows Karoul correcting an earlier mistake: the stylus must be inserted tip-down, with precision. The dramatically rounded bottom corners reject anything less, a cost of the design overhaul.
On the Galaxy S25 Ultra, the slot was forgiving. Users could slide the S Pen in from either orientation without thinking. Muscle memory handled the rest, with the S26 Ultra appearing far less tolerant.
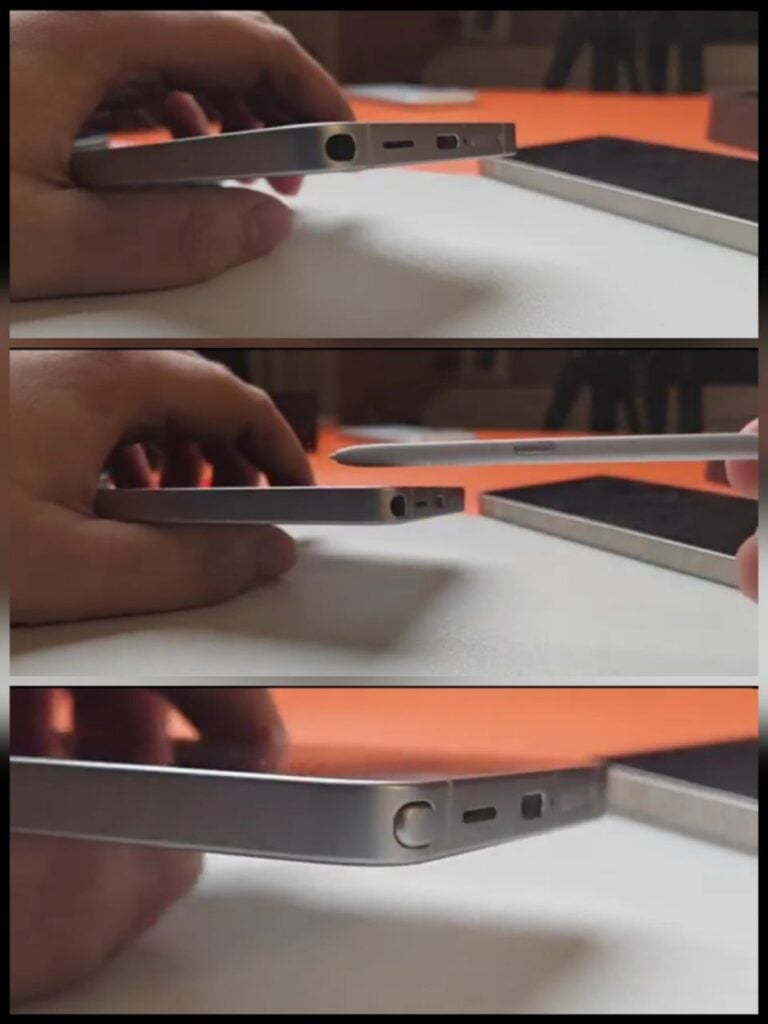
Source – Sahil Karoul (X)
A stylus that demands careful alignment risks becoming an ergonomic headache. Notably, the design shift came before rumors that the S27 Ultra could ditch a stylus compartment.
It seems the design change in S26 Ultra is aimed at turning the S Pen into a headache, leading buyers to wish for its departure from the following year’s flagship smartphone.
The same source also exposed the Privacy Display feature in action. The screen turns completely dim from the side angle, restricting exposure to others in crowded places.
Samsung is set to reveal the Galaxy S26 series on February 25. Reservations are already live, securing you a $30 free credit, up to $900 trade-in savings and entry into a $5,000 giveaway.
The post Inserting S Pen in Galaxy S26 Ultra is trickier than the S25 Ultra appeared first on Sammy Fans.

Futures traders slashed bearish Bitcoin bets last month, a shift that preceded a 70% rally in 2025 and a 190% increase in the BTC price in 2023.
A week before Samsung is scheduled to take the stage on February 25, a Galaxy S26 Ultra has surfaced in the most unlikely way possible: real-live hands-on leak.
The device shown on camera appears fully retail-ready. More importantly, it offers a clear look at how Samsung’s latest design looks against the S25 Ultra, Vivo X300, Oppo Find X9 Pro, and iPhone 17 Pro Max. Credit – KaroulSahil
Placed side by side, the S26 Ultra appears as an evolution rather than a redesign. Compared to the S25 Ultra, the new S26 Ultra introduces a little more rounded corners, a bigger selfie snapper cutout, and a prominent camera island.
Image courtesy – @KaroulSahil/X
You may like:
Galaxy S26 Ultra leak against its Apple, Oppo and Vivo alternatives
The Vivo X300, positioned to the left in the image, embraces a large circular camera module. Next to it, the Oppo Find X9 Pro uses a rectangular island with rounded edges. Then there is the Apple iPhone 17 Pro Max.
Apple continues with its square camera plateau, housing three large lenses in a triangular arrangement. Vivo adopts a large circular camera module, which dominates the upper third of the phone. Oppo flagship features a rectangular island with rounded edges, with sensors grouped into a unified plate.
The Galaxy S26 Ultra, in contrast, avoids a camera island altogether. The individual lens rings preserve a flatter back surface outside the lens area.

Image courtesy – @KaroulSahil/X
Viewed edge-on, the S26 Ultra appears marginally slimmer than the Vivo X300 and roughly comparable to the Oppo Find X9 Pro. iPhone 17 Pro Max remains the most squared off of the group; its rails are thick and rigid.
With Unpacked just days away, this early hands-on gives us a rare pre-launch comparison.
The post Real Galaxy S26 Ultra seen next to S25 Ultra, iPhone 17 Pro, Vivo X300 and Oppo Find X9 Pro in surprise leak appeared first on Sammy Fans.
Privacy Display is the signature feature of Galaxy S26 Ultra, which has just revealed in real life. A retail store in Dubai is already selling the latest flagships, opening a door to massive leaks days before the official unveiling.
This is not a concept demo, nor a press render.
It is a retail unit, running production software, with the privacy feature toggled on and off in real time. The video (via KaroulSahil) shows the holder seeing a clear UI, while the side angle looks almost completely blank.
The effect appears to be digitally toggled, not permanently baked in like traditional privacy protectors. It gives Samsung a wide edge over Apple as it has not integrated hardware-level privacy filtering into its iPhones.
Based on early teasers and what we are seeing in the leak, Samsung is layering intelligence on top of the panel:

Source – @KaroulSahil/X
Samsung began the Galaxy S26 Ultra teasers with Privacy Display alone. Later teaser doubled down on this technology. The feature is backed by Flex Magic Pixel, and the company internally calls it Zero-Peeking Privacy.
The South Korean tech giant has integrated a switchable optical layer directly into the panel stack. It’s said that when the privacy mode is off, you get full color accuracy and the panel’s full brightness.
Long-term durability, impact on power consumption, and real-world edge cases remain unknown. However, the implementation looks far more refined than any stick-on solution fans have tested over the past decade.
February 25 is when Samsung will put the Galaxy S26 Ultra on stage and explain this on its own terms.

The post Here’s your first real look at Galaxy S26 Ultra Privacy Display appeared first on Sammy Fans.
Samsung Galaxy S26 Ultra brings no change in battery compared to the Galaxy S25 Ultra, and newly leaked promo material signals no significant development in the charging aspect, despite the rumored 60W upgrade.
Fresh promo material leaked by @ya_sking12767 gives us an early look at the Galaxy S26 Ultra ahead of its expected February 25 launch. The headline feature everyone wanted to see? Faster charging. Maybe even a bigger battery.
If you were hoping for a massive upgrade, you might want to lower your expectations. Yes, there is talk of 60W charging. No, the battery is not bigger, and the leaked 30-minute charging figure tells a story that users will recognize.
The Galaxy S25 Ultra launched with a 5,000mAh battery. The Galaxy S26 Ultra, based on leaked materials, keeps the exact same capacity. From a hardware perspective, 5,000mAh is mature and safe, but it’s unexciting.
Rumors have pointed to a jump from 45W to 60W wired charging on the S26 Ultra. But the leaked promo slide says 75 percent in 30 minutes, which is exactly what Samsung advertised for the S25 Ultra with 45W charging.
If those numbers are accurate, then in real-world use, we are looking at the same charging curve. Peak wattage does not equal sustained wattage, as mobile devices rarely pull max power for the entire session.
Unless the South Korean tech giant has improved efficiency in the final 0 to 100 stretch or optimized thermal management to maintain higher speeds longer, the practical battery charging gain could be negligible.
Verdict
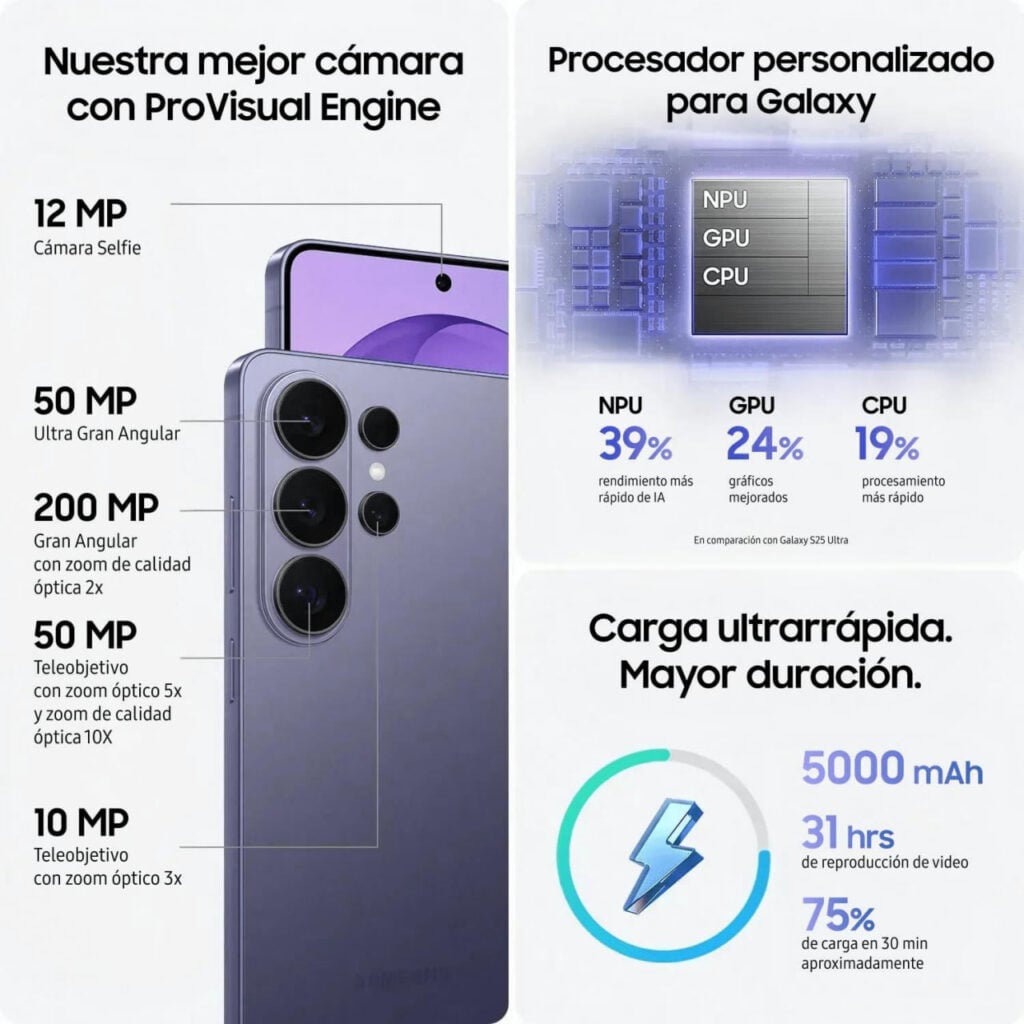
Image via @ya_sking12767
The post Galaxy S26 Ultra vs S25 Ultra: What’s really new in battery and charging? appeared first on Sammy Fans.
You are quite familiar with the OK Google and Hey Google hotwords to trigger Google Assistant and Gemini. It started with Google Assistant and was retained in Gemini, despite a major technological shift. Now, Samsung devices are set to get a second hotword called Hey Plex, and it will summon Bixby-powered Perplexity.
Samsung today announced Perplexity as a second AI agent on Galaxy devices, starting with the Galaxy S26 series. The upcoming flagships will bring an upgraded Bixby that relies on Perplexity for real-time web search.
Galaxy phones offer two easy ways to launch a virtual assistant. Either you press and hold the side key or call the Hey Plex hotword. Both actions result in the same outcome; the preferred assistant will come into effect on the fly.
Users will be able to access Perplexity through a dedicated voice wake phrase, “Hey Plex,” or via quick-access controls such as pressing and holding the side button, making contextual assistance easy to reach when needed.
The new voice wake phrase is inspired by the name of the AI assistant and is easy to remember and pronounce. Calling Hey Plex will summon Bixby, and it will be ready for a web search to gather results from the internet.
Samsung says the new Bixby is deeply embedded across select apps, including Samsung Notes, Clock, Gallery, Reminder, and Calendar, as well as select third-party apps. Perplexity’s AI agent enables smoother, multi-step workflows.
Pay attention, Samsung recently rolled out the new Bixby with Perplexity AI to Galaxy S25 series. Users who are running the One UI 8.5 Beta can access the new assistant. Hey Plex is expected to be provided as well through app updates.
Hey Google will remain available on Samsung phones.
The post Forget Hey Google, Hey Plex is coming to Samsung devices appeared first on Sammy Fans.

The post MVRV 30-D Turned Positive: Is Injective Price 20% Jump Just a Start? appeared first on Coinpedia Fintech News
The Injective price isn’t moving quietly anymore. It just ripped 20% intraday, and no, this isn’t one of those random pumps out of nowhere. There’s capital behind it. Real capital.
Pineapple Financial (NYSE: PAPL) has accelerated its INJ buying spree, announcing another $2 million acquisition on February 19, 2026, under its ongoing market cash purchase program. That pushes its treasury play deeper into the Injective ecosystem and signals this isn’t a one-off headline grab.
The firm now holds 7.02 million INJ tokens, according to its DAT dashboard. Conviction? They say it hasn’t changed.
Let’s not sugarcoat it but public equity treasury strategies buying crypto isn’t exactly new. But Pineapple positioning itself around Injective specifically? That’s deliberate.
This isn’t just passive exposure. It’s active open-market buying. The company is building around INJ crypto as a strategic asset, and its reserves suggest it’s not done yet.
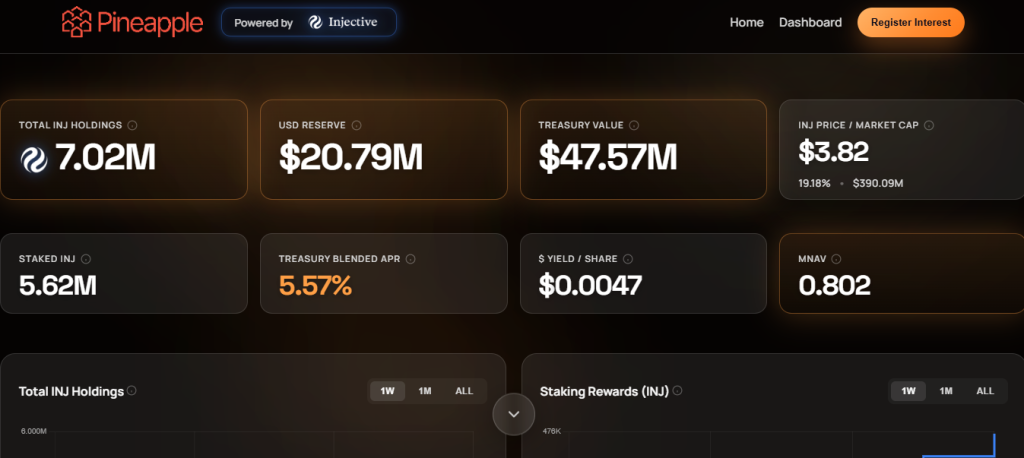
Meanwhile, supply dynamics are tightening. Onchain data highlights that the exchange balances have dropped. Supply outside exchanges climbed to 98.63 million INJ from this week’s low of 97.90 million. That’s accumulation behavior. Whether you’re watching the Injective price chart or on-chain dashboards, the direction is clear: coins are leaving exchanges.
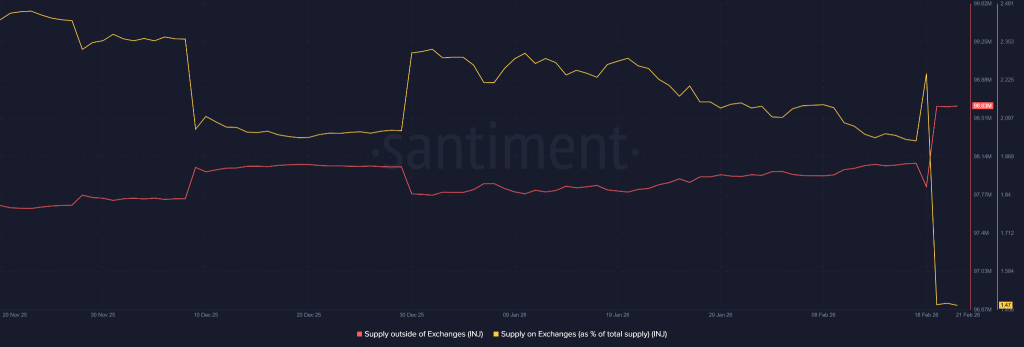
Now here’s the main delight. This week saw INJ community BuyBack that completely, burning approximately 54,999 INJ permanently. Deflationary mechanics plus treasury accumulation? That’s not a bad combination if you’re building a bullish narrative.
Adding to that a newly approved proposal, IIP-620, introducing a technical blockchain upgrade. Dynamic gas fees will now be capped within a logically aligned range relative to minimum gas price,which in simple terms, fewer wild fee spikes during congestion.
A new proposal with a technical blockchain upgrade has just been approved in the Injective ecosystem. Now the dynamic gas fee will not be able to increase beyond a logically allowed level aligned with the minimum gas price.
— Injective Core (@Injective_Core) February 20, 2026
Fees are becoming more stable and predictable, limiting… pic.twitter.com/Oap9H4jhdk
More predictability. Less chaos. Markets noticed. When writing, the INJ/USD pair is currently trading at $3.86, giving the network a $386 million market cap. And yes, that 20% intraday surge followed weeks of steady bullish developments.
Technically speaking, there’s a 24-month compressed falling wedge pattern reacting bullishly this week. If the upper boundary breaks, short-term targets point toward $8.00. That’s the immediate level being watched for Q1 2026.
Stretch that scenario further and some are eyeing $20 longer term, though let’s be real, that won’t happen overnight.
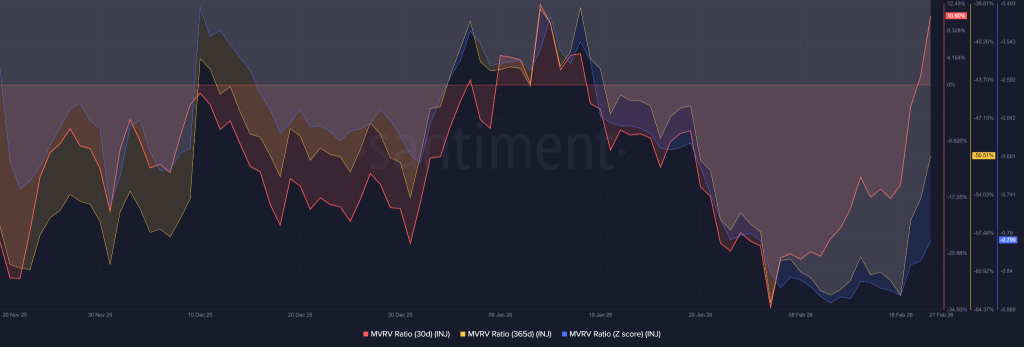
On-chain metrics? Mixed, but improving.
30-day traders are back in profit based on MVRV 30-D. Longer-term 365-day holders are still underwater. The MVRV Z-score sits negative at 0.799, but it’s curving upward. Recovery mode, not euphoria.
So where does this leave the Injective price prediction narrative?
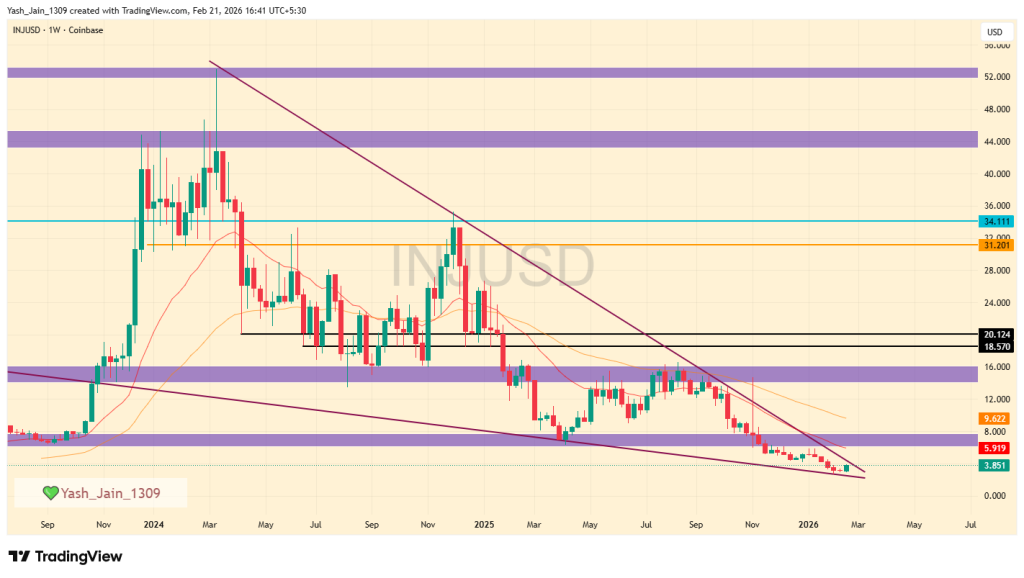
Somewhere between disciplined accumulation and a potential technical breakout. If the wedge gives way and treasury buying continues, the $8 test could come sooner than skeptics expect. For now, the Injective price is doing what bulls have been waiting months to see, it’s finally reacting and follow through depends on further accumulation demand.

The post Cardano Price Prediction 2026, 2027 – 2030: Will ADA Price Hit $2? appeared first on Coinpedia Fintech News
The Cardano price prediction 2026 is generating significant buzz in the crypto market, as the last quarter is soon to close in few days, boosting interest for the next altcoin. The 2025 for ADA/USD began with numerous fundamental updates strengthening its future, including the transformative Plomin Hard Fork, but 2026 seems even more constructive.
Now, Questions abound: “Will Cardano spearhead the altcoin movement?” and “What heights can ADA reach by 2050?” Explore this Cardano price prediction 2026 and beyond, filled with expert insights and ambitious forecasts.
The Cardano price outlook for 2026 is promising, driven by its extraordinary 4,000% surge in 2020 and currently holding strong at a significant support level. With a positive shift in market sentiment, even a moderate increase could lead to a remarkable 1,000% rise, positioning Cardano around $4.50.
A more conservative target of $1.40 indicates a solid 300% gain based on existing trends. Analysts are broadly optimistic that upcoming ETF approvals will boost institutional adoption and market stability, with price projections ranging from $2.05 to $2.80.
| Cryptocurrency | Cardano |
| Token | ADA |
| Price | $0.2727
|
| Market Cap | $ 9,835,463,397.76 |
| 24h Volume | $ 410,721,757.6888 |
| Circulating Supply | 36,069,809,187.3334 |
| Total Supply | 44,994,844,967.6822 |
| All-Time High | $ 3.0992 on 02 September 2021 |
| All-Time Low | $ 0.0174 on 01 October 2017 |
At present, the price of ADA is navigating a notable sell-off. But, early February has revealed a promising demand zone, indicating a resurgence of buying interest in the short term. Should the broader market improve, we may witness an increase in demand, setting the stage for a potential bullish rally.
Additionally, the lower boundary of the falling wedge is providing strong support, suggesting that a price surge could happen at any time, but short-term support at $0.2510 holds strong value.
Accordingly, if demand increases then we anticipate that ADA might reach an impressive value of $0.40 within this month. Conversely, if the overall market experiences a downturn again, including even declines in major assets like BTC again, then this could negatively affect ADA/USD, possibly driving it down to $0.20 or lower.

The Cardano price forecast for 2026 points to an important support level on its weekly chart, a range that has consistently acted as a strong pivot point for price trends, and is currently giving off signals of another potential rally. This support level is known for displaying remarkable resilience over time, suggesting that if Cardano price USD can maintain its position above this threshold once again, it could pave the way for significant price movements in 2026.
Looking back at Cardano’s historical performance on the weekly chart, it shows an extraordinary rally in 2020, when the asset posted staggering gains of nearly 4,000%. During that bullish phase, the Cardano price USD spent an extended period consolidating around the dynamic support trendline, which appears to be a strategic accumulation at discounts from smart money, contributing significantly to its eventual surge.
If the current market sentiment shifts positively, a resurgence in investor confidence could lead to a recovery. Not ambitiously, even modestly, past performance could give a tremendous surge. Last year’s performance was 4000%. If we assume 1/4 of that momentum, it would result in an increase of approximately 1000%, potentially elevating Cardano’s price to $4.50 by 2026.
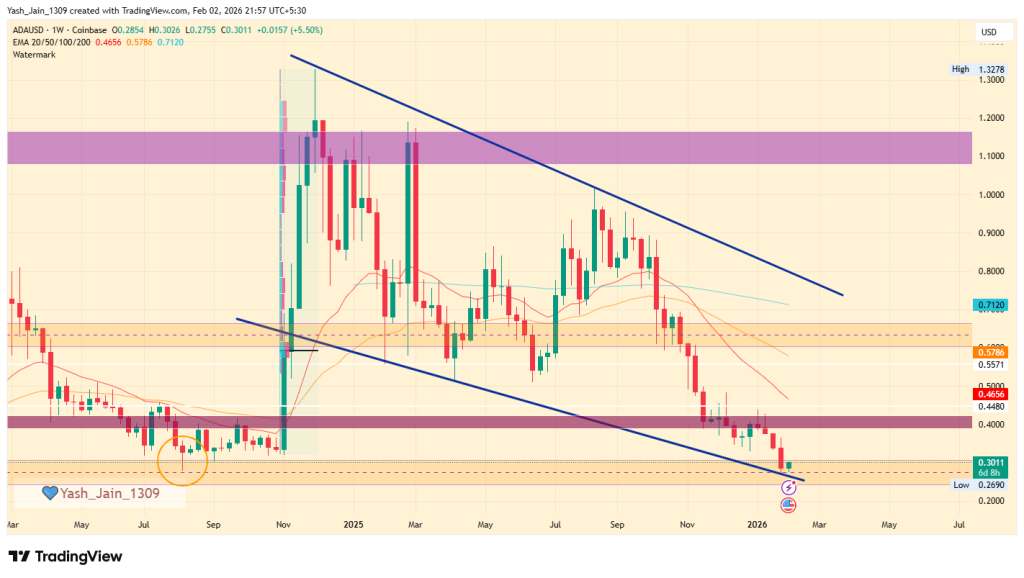
Conversely, a more conservative approach suggests a realistic price target of around $1.40, indicating a potential increase of about 300%. This estimate remains feasible, especially since it is based on fundamental analyses and market trends that are not reliant on speculative triggers, such as the possible approval of exchange-traded funds (ETFs).
Additionally, many experts propose that these ETFs could significantly impact the market by boosting institutional investment and improving market stability. In a situation where ETF approvals occur and retail investor excitement rises, Cardano’s price could realistically range from $2.05 to $2.80.
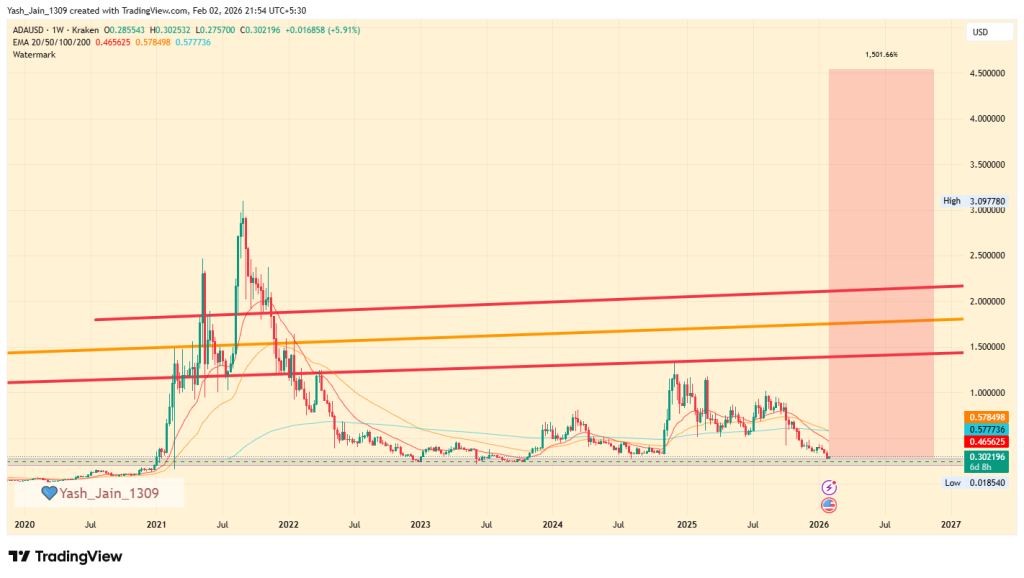
| Scenario | Potential Low | Average Price | Potential High |
| Without ETF Approval | $0.85 | $1.10 | $1.25 |
| With ETF Approval + Retail Surge | $1.20 | $1.65 | $2.05 |
| Bullish Breakout (with ETF & macro support) | $1.50 | $2.05 | $2.80 |
As per Cardano’s on-chain metrics, “Smart Money” accumulation phase is the best observation right now, because the divergence between retail and institutional holders is more vivid than ever.
As the number of addresses holding between 10 and 1 million ADA is declining, and the consistent surge in the 10 million to 100 million coin bracket confirms this, this represents a major supply consolidation. The observation shows that these mega-whales are strategically absorbing the “weak hands” during price dips, effectively building a rock-solid fundamental floor for the asset. Also, the fact that the 1M to 10M coin bracket is also growing confirms that professional high-net-worth investors seem to be positioning for a recovery, too.
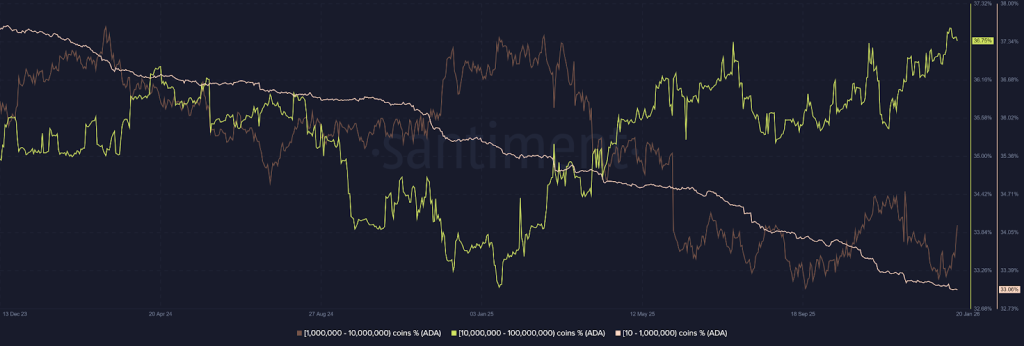
Similarly, the surge to 4.57 million total holders despite a grueling 2025 proves that Cardano’s ecosystem is expanding its reach even in a “stress test” environment. This growth in the holder base suggests that the asset is not being abandoned; rather, it is being redistributed into a more stable, long-term foundation. When a holder count rises as prices fall, it signals that the market views current levels as a deep-value opportunity rather than a reason to exit.
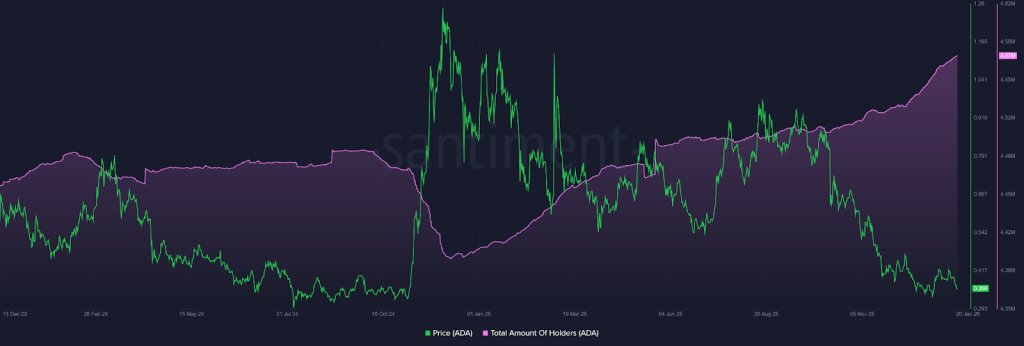
Additionally, the Weighted Sentiment flipping the 0 line to 0.656 is a crucial momentum trigger. Professionally, this “0-line flip” indicates that the aggregate social and market bias has shifted from fear to optimism.
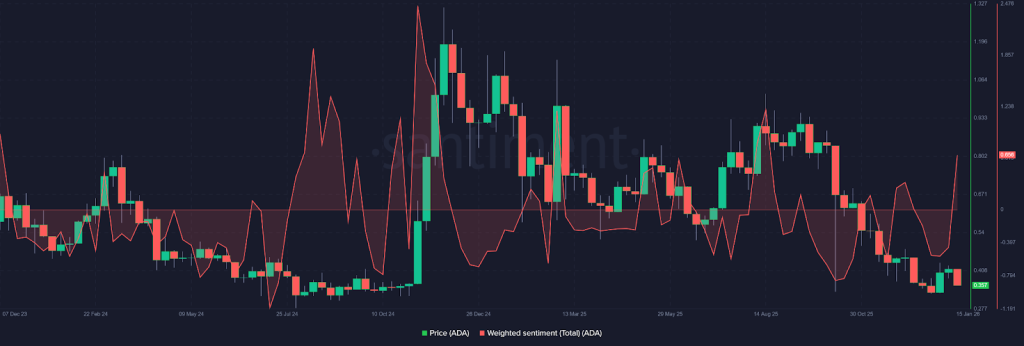
Combined with the strategic whale accumulation, this sentiment pivot suggests that the “disbelief” phase is ending and that a bullish rally is likely once the remaining retail sell pressure is fully absorbed by the growing whale cohorts.
| Price Prediction | Potential Low ($) | Average Price ($) | Potential High ($) |
| 2026 | 2.75 | 3.00 | 3.25 |
| 2027 | 4.50 | 4.75 | 5.00 |
| 2028 | 5.25 | 5.50 | 5.75 |
| 2029 | 6.75 | 7.25 | 7.75 |
| 2030 | 9.00 | 9.75 | 10.25 |
This table, based on historical movements, shows ADA prices to reach $10.25 by 2030 based on compounding market cap each year. This table provides a framework for understanding the potential Cardano price movements. Yet, the actual price will depend on a combination of market dynamics, investor behavior, and external factors influencing the cryptocurrency landscape.
| Year | Potential Low ($) | Potential Average ($) | Potential High ($) |
| 2031 | 10.50 | 11.00 | 11.25 |
| 2032 | 13.75 | 14.25 | 14.75 |
| 2033 | 17.50 | 18.50 | 19.75 |
| 2040 | 34.25 | 51.75 | 69.25 |
| 2050 | 128.25 | 228.75 | 329.50 |
Based on the historic market sentiments and trend analysis of the altcoin, here are the possible Cardano price targets for the longer time frames.
Stay ahead with breaking news, expert analysis, and real-time updates on the latest trends in Bitcoin, altcoins, DeFi, NFTs, and more.
Cardano could trade between $2.75 and $3.25 in 2026 if market sentiment improves, adoption grows, and key support levels hold.
Cardano is considered a long-term project due to its research-driven development, scalability upgrades, and focus on decentralization.
ETF approval, institutional adoption, network upgrades, and improved macro conditions could all positively impact ADA’s price.
In five years, ADA could trade between $7 and $10 if Cardano adoption grows, scalability improves, and the crypto market enters a strong cycle.
By 2030, Cardano could be valued around $9 to $10 based on long-term growth, network usage, and sustained investor confidence.