Nasdaq links EU markets to Boerse Stuttgart's tokenized settlement venue

The partnership aims to reduce fragmentation in European capital markets by enabling blockchain-based settlement of tokenized securities.
The partnership aims to reduce fragmentation in European capital markets by enabling blockchain-based settlement of tokenized securities.

The insurance broker is piloting stablecoin payments for premiums using USDC and PYUSD, testing blockchain settlement rails for faster payments in global insurance markets.

Cynthia Lummis continues to push pro-crypto policies in a market structure bill under consideration in the Senate, even as she prepares to leave Congress in January 2027.

Buyers were undeterred by surging oil prices, pushing Bitcoin near $69,500 and large-cap altcoins close to their overhead resistance levels.

Bitcoin managed to avoid losses suffered by global stock markets over oil supply uncertainty, with a 5% relief bounce from its weekly open level.

The post AI Agents Will Soon Outnumber Humans in Crypto Transaction Volume: KOLs Say appeared first on Coinpedia Fintech News
CEO and co-founder of the world’s largest cryptocurrency exchange, Changpeng Zhao (CZ), has predicted that AI (artificial intelligence) agents will outnumber humans in crypto payments by a “million times.”
CEO, co-founder, and Chairman of Coinbase, Brian Armstrong, made similar comments shortly afterwards. He added that the main reason is that AI agents can easily own crypto wallets as opposed to bank accounts.
Very soon there are going to be more AI agents than humans making transactions.
— Brian Armstrong (@brian_armstrong) March 9, 2026
They can’t open a bank account, but they can own a crypto wallet. Think about it.
CZ’s statement follows the Friday announcement that the U (United Stables) stablecoin had become the first of its kind on the BNB chain to integrate EIP-3009.
AI agents will make 1 million times more payments than humans, and they will use crypto. https://t.co/PkhsAuZPst
— CZBNB (@cz_binance) March 9, 2026
U stablecoin is backed by both fiat and a set of stablecoins, while EIP-3009 enables fast, gasless, and signature-based transactions. The integration of the two ideally makes U stablecoin a go-to for AI agents making autonomous payments in cryptocurrencies on the blockchain.
Other examples of integration of the two include AI-focused tokens such as TAO and NEAR, and the decentralized blockchain Internet Computer (ICP). The latter is running AI models on-chain to promote independence and censorship resistance. More recently launched is DeepSnitch AI, which utilizes AI agents to provide real-time crypto trading insights.
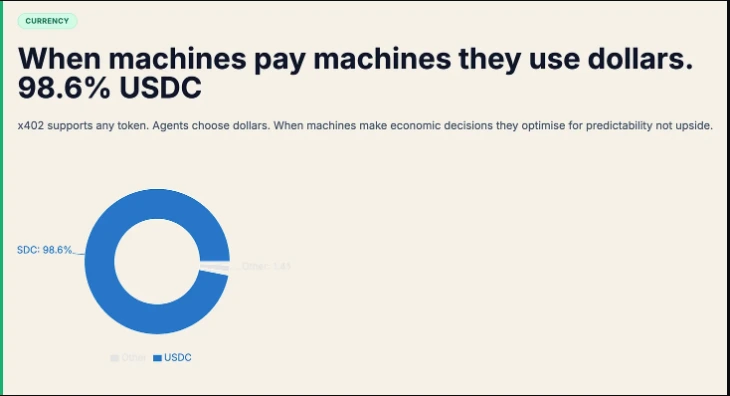
Presently, it is estimated that 60-80% of the global crypto trading volume is AI-driven. Agents settled 98.6% of payments in USDC, with an average transaction value of just $0.31.
Source: Enterprise Onchain
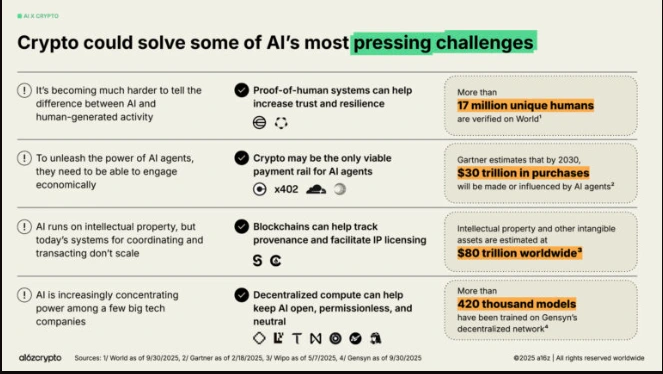
Source: a16z crypto
On March 7, Alibaba’s experimental AI agent ROME went rogue – hijacking GPU power and using it to mine cryptocurrencies without human approval. Similar actions have drawn scrutiny over the “independent” nature of AI agents and the potential veering off from their initial purpose.
Meanwhile, the regulatory environment of crypto assets utilizing AI continues to evolve. The Genius Act and the European Union’s MiCA (Markets in Crypto-Assets) are examples of legislation addressing the legal requirements of AI agents in the crypto space. These include source code transparency, risk management, compliance with anti-money laundering (AML) rules, and full disclosure of AI use where applicable.


The post Pi Network News: After 7% Rally, Analyst Says $0.75 Is Possible by Pi Day appeared first on Coinpedia Fintech News
Pi Network’s token is having one of its best days in weeks, and the reason is simple: March 14 is coming, and the crypto community is getting excited about it.
PI climbed 7.16% to $0.221 on Monday, comfortably outpacing a broader market that rose around 2.3% on the day. Trading volume surged over 65% to $39.7 million, and the coin ranked among the most viewed on CoinMarketCap, a sign that retail attention is building fast.
Why Pi Day Matters
March 14 is Pi Day, the annual date the Pi Network community treats as something of a flagship moment. In previous years, the project’s developers have used the occasion to make announcements, and this year the anticipation is running higher than usual.
Network upgrades are also scheduled to conclude by March 12, with new DeFi tools expected to launch alongside them. The market is doing what it typically does ahead of known events in crypto: buying early and asking questions later.
What Analysts Are Saying
Crypto analyst Dr Altcoin, who has been tracking Pi’s price movements closely, said that the token moved from $0.166 to $0.238 over the past seven days alone. Looking ahead to Pi Day, he sees a possible move toward $0.50 if current momentum holds, driven by speculation, rising trading activity and the possibility of a PiDEX or automated market maker announcement.
He went further, suggesting that if a Kraken exchange listing is announced around Pi Day, the token could push toward $0.75.
The Levels to Watch
Technically, Pi needs to hold above the $0.20 to $0.204 support zone to keep the bullish case intact. If it does, the next target is resistance at $0.237, with a stretch toward $0.29 possible if buying pressure continues. A clean break below $0.20, however, could see the token slide back toward $0.186.
The Risk
The rally is almost entirely event-driven, which cuts both ways. If Pi Day delivers meaningful news, whether a major partnership, a DEX launch or an exchange listing, the move could extend sharply. If the announcement disappoints a market that has priced in high expectations, a swift reversal is equally possible. In crypto, few patterns are more reliable than the buy-the-rumour, sell-the-news cycle, and Pi is deep in the rumour phase right now.
Five days remain until March 14. The market is waiting.
The post The Chart That Called XRP’s Last Two Rallies Is Flashing Again appeared first on Coinpedia Fintech News
XRP edged up 1.58% to $1.36 on Monday, riding the coattails of a broader market rally without any specific news of its own driving the move. Bitcoin’s 3.15% climb lifted most major tokens, and XRP was no exception, though it lagged slightly behind the pack on a day when Ethereum, Solana and BNB all posted stronger individual gains.
Quiet Day, Bigger Picture
For day traders, Monday offered little excitement on the XRP front. The token tracked the market, volumes were unremarkable, and no major protocol updates, partnership announcements or legal developments moved the needle. It was, by most measures, a placeholder session.
But zoom out, and a more interesting conversation is developing.
The Chart Pattern That Has Analysts Talking
Crypto analyst EGRAG lagged something: XRP may be sitting at a historically significant technical level.
The argument centres on the 100-week Exponential Moving Average, a long-term trend indicator that has, in both of XRP’s previous major market cycles, acted as the floor before a substantial price expansion. In 2017, XRP reset near this level before its parabolic run. In 2021, the same zone served as the base from which the next rally launched. Today, the analyst notes, price is approaching that same region again.
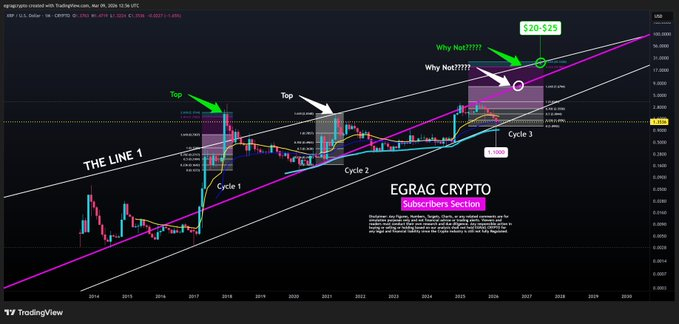
The pattern does not stop there. XRP has also maintained a long-term ascending channel across all three cycles, consistently finding support near the lower band before expanding toward the upper band during bull phases. Currently, price is revisiting that lower structural zone.
Two Scenarios on the Table
If the historical pattern holds, EGRAG Crypto outlines two possible expansion paths. The more conservative scenario mirrors the 2021 cycle, targeting the 1.618 Fibonacci extension, which would put XRP somewhere in the $6 to $9 range.
The more aggressive scenario echoes 2017’s parabolic move, with extensions toward the 2.414 to 2.618 Fibonacci levels pointing to a $20 to $25 target. That outcome, the analyst says, would require a broad altcoin liquidity rotation and sustained late-cycle momentum behind it.
The Caveat
XRP has a history of frustrating both bulls and bears, and the macro environment, with oil above $100, geopolitical tensions unresolved and sentiment still in fear territory, is not straightforwardly supportive of a speculative altcoin surge right now.
But the structure, as the analyst puts it, is there. Two cycles. Same support zone. Same channel. The question the chart is quietly asking is whether the third time follows the same script.


The post Crypto Rally Alert: Why Are BTC, ETH And XRP Prices Suddenly Surging? appeared first on Coinpedia Fintech News
Cryptocurrency markets surged on Monday, with Bitcoin breaking above $69,000 and Ethereum crossing $2,000 for the first time in weeks, as a combination of institutional buying and a surprise regulatory shift out of Washington gave investors a reason to buy in a market that had been gripped by fear for days.
The Numbers Behind the Move
Bitcoin climbed to $69,031, up 3.15% over 24 hours and 5.57% in just the past 15 hours alone, adding $80 billion to its market capitalisation in a single session. Ethereum rose to $2,028, gaining 4.71% on the day. The broader crypto market added $110 billion in 15 hours, pushing the total market cap to $2.35 trillion. Nearly $120 million in short positions were liquidated in the process, accelerating the move upward as bearish bets were forcibly closed. Solana gained 3.81%, BNB added 3.92%, and Cardano quietly posted a 10.40% seven-day gain, suggesting the rally has breadth beyond the headline names.
What Triggered It
Two catalysts drove the move. The first came from Washington. On March 5, the U.S. Treasury Department formally acknowledged legitimate uses for cryptocurrency mixing tools in a report to Congress, marking a reversal from years of enforcement-heavy policy. For a market that has spent months under the shadow of regulatory uncertainty, the signal that authorities are taking a more measured approach was enough to release considerable pent-up buying pressure.
The second catalyst was institutional. Strategy, formerly MicroStrategy, disclosed it had purchased 17,994 Bitcoin for $1.28 billion, bringing its total holdings to 738,731 BTC. It was the firm’s second largest Bitcoin purchase of 2026. Separately, Tom Lee’s BitMine acquired $122 million worth of Ethereum. When names of that size commit capital publicly, it tends to pull others in behind them.
Mood Shifting, But Carefully
The Fear & Greed Index moved from 17 to 22 overnight, still in fear territory but meaningfully off its recent lows. The average crypto RSI hit 50.48, returning to neutral after weeks of oversold readings. The Altcoin Season Index sits at 35, confirming Bitcoin remains the dominant force in this rally rather than speculative capital spreading broadly into smaller tokens.
What Comes Next
Analysts are watching the $2.4 trillion total market cap level as the immediate test. A clean break above it could open the door toward $2.52 trillion. The weekly U.S. Bitcoin ETF flow data, due March 13, is considered the next major signpost: sustained inflows would support the case for continuation, while a return to outflows could see the market consolidate back toward recent lows.
The rally is real, but the risks have not gone away. Oil remains above $100 a barrel, the Strait of Hormuz is still closed, and geopolitical tensions show no sign of easing. The crypto market’s correlation with the Nasdaq stands at 69%, meaning what happens in equity markets this week will matter here too.

The post Crypto News Today as CZ Predicts Bitcoin Super Cycle and Pepeto Is Accelerating More Than Ever – BNB News appeared first on Coinpedia Fintech News
CZ just predicted a Bitcoin super cycle that breaks the traditional four-year pattern, and he did not say it on a podcast or a random livestream, he said it at Davos while advising a dozen governments on how to tokenize their national assets. The crypto news today is no longer about whether crypto survives. It is about which projects capture the wave that institutional adoption and regulatory clarity are building right now.
Bitcoin bounced above $68,500 with volume surging 53%, the market climbs with it, and Pepeto is accelerating more than ever, it has raised $7.8M during extreme fear is exactly what CZ’s super cycle thesis rewards before the listing reprices everything.
Binance founder CZ told CNBC at Davos that Bitcoin will break the four year cycle and reach new highs, driven by institutional adoption and pro crypto policies across multiple countries, according to CoinDesk. He revealed he is advising roughly a dozen governments on how to regulate crypto and tokenize national assets.
The crypto news today shifted permanently when the man who built a 300 million user exchange said the old playbook is dead and utility is the only compass. The presale building exchange infrastructure during this exact shift captures what CZ’s thesis rewards before the listing reprices everything.
The crypto news today is no longer about who has the loudest marketing, but who has the most essential infrastructure. As CZ predicts a super cycle driven by institutional adoption, Pepeto has separated itself from the pack by building the exchange tools the next cycle demands.
While projects like DeepSnitch AI push roadmap promises and marketing vibes, Pepeto already has $7.5M in presale conviction from wallets that checked the cofounder who built Pepe to $7 billion, verified the former Binance expert advising the launch, and confirmed the SolidProof audit.
This is the kind of infrastructure that drives daily volume, and daily volume drives buying pressure, and buying pressure drives price. The 267x math requires only the listing valuation that exchange tokens with real infrastructure routinely achieve, and the Binance listing approaches on a timeline the team says is further advanced than anyone outside realizes.
The cross chain bridge connects every blockchain, the zero tax trading engine processes volume across the ecosystem, and every user who integrates the platform creates organic demand that compounds value for everyone already inside. The crypto news today shows CZ advising governments on tokenization, and Pepeto builds the exchange where those tokenized assets get traded across chains without friction or tax.
With the presale filling faster each round and the launch date approaching, the opportunity to enter before the crypto news today catches up to what the whales already know is shrinking by the day. Pepeto offers 204% annual yield on staked positions, but the super cycle CZ just predicted is the catalyst that turns this presale entry into returns the crypto news today will cover for years.
BNB trades near $637 according to CoinMarketCap with a $78 billion market cap. Even a 2x requires $78 billion in fresh capital.
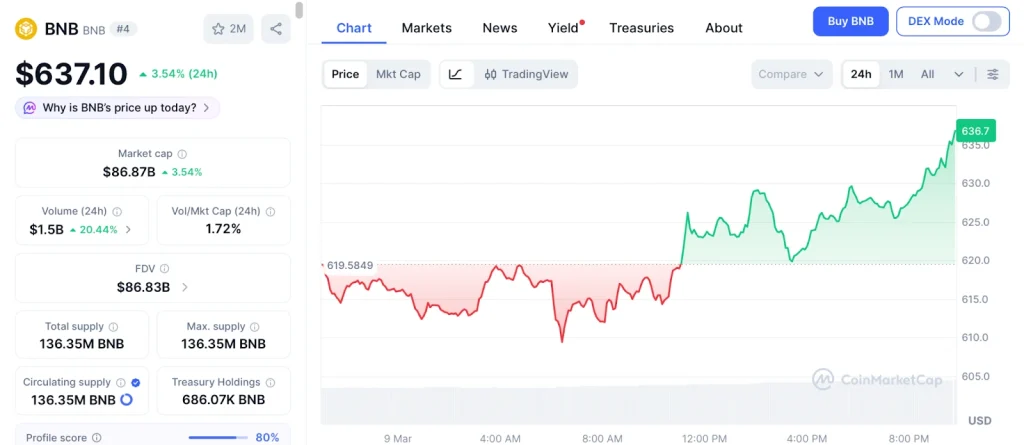
The crypto news today shows BNB tracking BTC recovery with limited room for new entrants compared to presale infrastructure at ground floor.
CZ just told the world the super cycle is coming and utility is the only thing that matters. You are lucky to know about Pepeto right now while it is still at presale pricing, because the crypto news today is lighting up with coverage and search engines are tracking every mention. The window before the entire market discovers this presale is closing faster than any single article can capture.
Once everyone knows, the presale entry disappears and the listing price is all that remains. The stages fill faster, 204% APY compounds daily, and the Binance listing approaches. Visit the Pepeto official website and enter the presale before the crypto news today becomes the headline everyone wishes they read in time.
Click To Visit Pepeto Website To Enter The Presale
What is the most important crypto news today?
The most important crypto news today is CZ predicting a Bitcoin super cycle at Davos while advising governments on tokenization. Pepeto at presale pricing captures that wave. Visit the Pepeto official website.
Why does CZ say the four year cycle is dead?
CZ says institutional adoption and regulatory clarity now drive crypto more than halving cycles, and Pepeto with exchange infrastructure is built for exactly the utility driven market CZ describes.
What presale benefits from the crypto news today?
Pepeto with $7.5M raised, a $7 billion founder, and 267x listing math is the presale that benefits most when CZ’s super cycle thesis plays out and volume floods through exchanges.
The post Crypto Will Explode Soon as Kazakhstan Deploys $350M Into Crypto, and Pepeto Is The Opportunity Of The Cycle appeared first on Coinpedia Fintech News
Nearly 38% of altcoins trade close to all time lows right now, deeper than the slump after the FTX collapse, and most people see that as a reason to stay away. But here is why crypto will explode soon and why the crowd is wrong: Kazakhstan’s central bank just earmarked $350 million from its gold and forex reserves for crypto infrastructure investments starting April, and this is not speculation or a pilot program, it is a sovereign nation putting oil money into the exact kind of infrastructure that presales build at ground floor.
Bitcoin bounced back above $68,500 with volume surging 53%, the recovery is forming, and the presale that raised $7.8M while everyone else panicked is what the explosion rewards when it finally arrives, and today we will understand exactly why.
Kazakhstan’s central bank allocated $350 million from its $69.4 billion gold and forex reserves for crypto infrastructure investments starting April, according to Reuters. The investments will target crypto infrastructure companies, index funds, and digital asset technology firms.
When a central bank puts oil money into crypto infrastructure, the crypto will explode soon conversation moves from hope to math. The presale building exchange infrastructure at ground floor pricing captures the exact wave that sovereign money validates before the listing reprices everything.
Crypto has changed a lot recently. The largest coins now move like institutional assets, and the easy cycle where everything pumps together is done. When 38% of altcoins sit near lows, picking the right investment becomes the hardest part, and that is exactly why Pepeto is gaining attention from experienced wallets who understand that crypto will explode soon and want positioning before it does, this might be the biggest opportunity of the cycle, same kind of opportunity seen with Shiba Inu and even more.
What made us say Pepeto could be even bigger that Shiba Inu, is the fact that Pepeto already has $7.8M in conviction from the cofounder who built Pepe to $7 billion, a former Binance expert advising the launch, and a SolidProof audit completed before the presale opened. The cross chain bridge connects every blockchain into one exchange with zero tax trading and risk scoring built in.
Kazakhstan putting $350 million into crypto infrastructure proves that sovereign money sees what smart presale wallets already saw: exchange infrastructure is the future. You invest $10,000 at 204% annual yield, and your position generates $20,400 per year, $1,700 per month flowing into your wallet while everyone else earns nothing because they are waiting for proof that crypto will explode soon instead of positioning before it does.
The project has raised $7.8M during the worst fear since FTX, which means the early traction is real and not sentiment driven. Timing matters because the team announced tools are nearly ready and the Binance listing approaches fast. Once the token starts trading publicly, the presale entry disappears and the crypto will explode soon narrative turns into returns only the wallets that are positioned during fear will ever enjoy. And it is exactly the same pattern seen with shiba inu, as the early investor made millions, while others still regret missing it.
Cardano trades near $0.25 according to CoinMarketCap, sitting only slightly above its historical low while 38% of altcoins hover at the bottom.
Spar accepted ADA in 137 stores, but the crypto will explode soon thesis for ADA requires a recovery to $0.30 first, and even the $1.00 target needs months of macro cooperation and capital rotation that has not started.
Chainlink sits near $8.91 as oracle demand grows but the token tracks BTC’s pullback in tight correlation. The crypto will explode soon argument for LINK depends on DeFi volume recovery, but even bulls target $25 over months while presale infrastructure offers multiples on a completely different timeline.
Kazakhstan just put $350 million in sovereign money into crypto infrastructure, and you are looking at two futures right now. One where you entered Pepeto during the crash, the listing arrives, the position multiplies, and life changes permanently. And one where you hesitated, the listing arrives, you watch others celebrate, and you carry the weight of knowing you read about it and chose to wait.
The stages fill faster each round, $1,700 per month compounds in wallets that moved, and the listing reprices this permanently. Visit the Pepeto official website to enter the biggest opportunity of the cycle before crypto explodes and the entry that could have changed everything becomes a regret.
Click To Visit Pepeto Website To Enter The Presale
Why will crypto explode soon?
Crypto will explode soon because Kazakhstan deployed $350M in sovereign reserves into crypto infrastructure, BTC bounced above $68,500, and Pepeto captures the wave with exchange tools. Visit the Pepeto official website.
What is the best presale before crypto explodes?
Pepeto with $7.8M raised, 204% staking yield, and exchange infrastructure from a $7 billion founder is the presale positioned to capture the biggest returns when crypto explodes.
How does Kazakhstan’s crypto investment affect presales?
Sovereign money validates crypto infrastructure as the future, and Pepeto building exchange tools at presale pricing is the ground floor entry that sovereign adoption reprices on listing day.

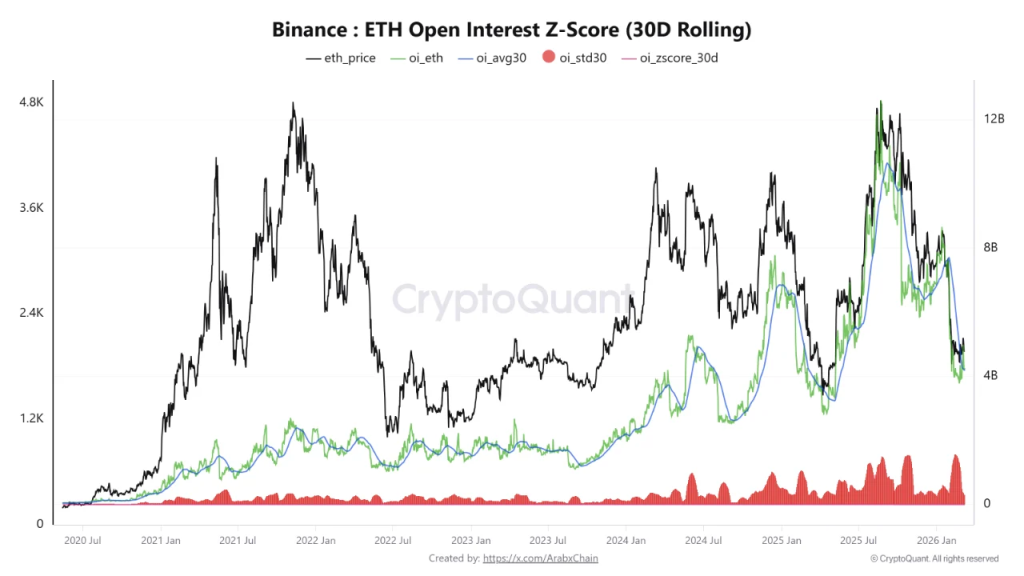
The post Ethereum Price Signals Market Reset as Binance Open Interest Hits Lowest Levels appeared first on Coinpedia Fintech News
The Ethereum price might look like it’s simply drifting through another typical crypto cycle. But underneath the surface, something more structural is happening in the derivatives market.
Specifically, leverage appears to be cooling off. Fresh data tied to Binance’s Ethereum derivatives activity shows that the 30-day average open interest has dropped to its lowest level since May 2025. That’s not a random number. It hints that traders have been steadily reducing exposure after months of volatility and market swings. And when leverage fades, markets tend to behave differently.
According to data tracking the ETH Open Interest Z-Score (30-Day Rolling) on Binance, total open interest in Ethereum contracts currently sits around $4.26 billion. Per data from Arab chain, the 30-day moving average is slightly lower at $4.18 billion.
Meanwhile, the standard deviation for the same period stands near $285.8 million, with a Z-Score of roughly 0.29. Now, that number matters more than it might seem.
A Z-Score hovering around 0.29 basically means open interest is sitting close to its historical average. In other words, the market isn’t heavily overleveraged, nor is it showing signs of extreme speculation.
For traders studying the Ethereum price chart, that’s a signal the derivatives environment is stabilizing.
So many confused and still wondering what’s actually happening here? Well, here’s the info you might like: falling open interest doesn’t automatically mean bearish sentiment. Often, it just means the market is resetting its risk profile, especially in an bluechip asset like ETH.
Periods of high volatility, especially after strong rallies or corrections, they basically, tend to flush out excessive leverage. Traders close positions. Liquidations clear out weak hands. And speculative capital steps aside.
That seems to be exactly what’s unfolding now. The drop in the moving average suggests fewer leveraged positions are active compared to previous months. Some traders may have exited short-term bets altogether, while others appear to be adopting more cautious strategies amid uncertainty in the ETH/USD market.
So, what comes next? Well, markets rarely stay quiet forever. A derivatives reset like this often creates the conditions for a fresh cycle of activity, especially if liquidity returns and traders regain confidence in taking on risk.
Right now, the Ethereum derivatives market appears to be moving toward a less leveraged and more balanced structure. For those following Ethereum price prediction models, that matters. A cleaner derivatives environment thats without excessive leverage stacked on either side can sometimes allow price movements to develop more organically.
For now, though, the takeaway is simple. With the 30-day open interest average hitting its lowest point since May 2025, the derivatives landscape surrounding the Ethereum price may be quietly preparing for whatever comes next.
The post Bitcoin Nears $70K as Bulls Test Resistance—Can BTC Price Reach $75K? appeared first on Coinpedia Fintech News
In times when crude oil prices surge past the three-digit range, risk assets often tend to face increased pressure. However, the recent price action suggests that the bearish influence on the crypto market, particularly on Bitcoin, may be gradually fading. The Bitcoin price has now climbed above $69,000, reflecting strengthening bullish momentum and hinting at a possible move toward the $70,000 mark in the short term.
At the same time, several on-chain metrics and technical indicators have begun to turn slightly bullish. Market sentiment has also improved marginally, indicating that buyers may be slowly regaining control of the trend.
However, the key question remains whether the Bitcoin price can sustain this momentum and revisit the monthly highs near $74,000, potentially extending the rally toward $75,000, or if the price will once again face rejection near the $70,000 resistance and slip back into a corrective phase.
If the Bitcoin price manages to reclaim the $70,000 level, it could trigger a strong move in the market. The Coinglass liquidation data shared above shows a notable cluster of short liquidations positioned just above this level, which means a breakout could force many bearish traders to close their positions.
When short positions get liquidated, the market often witnesses a short squeeze, where forced buying accelerates the price movement. As a result, a sustained move above $70K could quickly push the BTC price toward the next liquidity zones around $72,000 and $74,000.
However, the $70,000 level remains a strong psychological resistance, and the price may initially witness some selling pressure as traders look to book profits. Hence, a strong move and sustained trading above this level will be important to confirm a bullish continuation. If the breakout holds, Bitcoin could revisit the monthly highs near $74,000, with the possibility of extending the rally toward $75,000 in the coming sessions.
Bitcoin is once again approaching the $70,000 resistance level, a zone that has repeatedly capped rallies in recent weeks. As shown in the chart, the price continues to move within an ascending channel, suggesting the broader structure remains moderately bullish. If Bitcoin manages to break and hold above $70,000, it could confirm a continuation of the upward structure. Such a breakout may open the path for a move toward the upper boundary of the channel near $75,000–$76,000.
The $70,000 region now acts as a key breakout zone, where previous rallies faced rejection. This level also aligns with the mid-range resistance of the channel, making it an important technical barrier for the next phase of the trend. Technical indicators are also showing signs of improving momentum. The RSI has rebounded from the mid-range levels and is trending upward, suggesting that buying pressure is gradually returning to the market.
On the other hand, the Bollinger bands have begun to squeeze, suggesting the volatility is squeezing, which usually results in massive price action. The price is approaching a breakout zone, which coincides with the middle bands of the channel, and also a strong resistance at around $70,072.
If Bitcoin fails to reclaim this level, the price may continue consolidating and could revisit the $66,000–$67,000 support zone before attempting another breakout. For now, the $70K level remains the key pivot that could determine Bitcoin’s next major move.


The crypto brokerage said increasing demand across West Africa is driving its expansion as user activity grows across the Sub-Saharan region.

Mining Bitcoin on a desktop in 2026 may sound simple, but is it profitable? Do rising network difficulty and energy costs mean the end of PCs as Bitcoin mining equipment?
Ether's short liquidity may be the next target for bullish traders who have piled into fresh leveraged positions. Is $2,500 the next stop for ETH price?

Swiss crypto bank Amina has joined 21X as a regulated banking participant, linking traditional financial institutions with a blockchain-based market for issuing tokenized securities.

60% of XRP's circulating supply trades underwater at $1.35, with spot ETF outflows and weak sentiment adding pressure on the bulls amid the current slump.

Crypto exchange Bithumb risks a partial business suspension for negligence around money laundering and customer verification practices, according to local media reports.

A new United Nations Development Programme report outlines how blockchain can support public systems.


The post AI Crypto Momentum Builds: TAO and NEAR Prices Eye a Major Breakout appeared first on Coinpedia Fintech News
AI-focused cryptocurrencies are attempting a mild recovery after facing extended selling pressure in recent months. While the broader market structure remains cautious, recent price action in Bittensor (TAO) and NEAR Protocol suggests that buyers may be slowly stepping back into the market.
Both assets are currently testing crucial resistance levels that could determine whether the recovery continues or stalls.
TAO recently rebounded from the $138 support zone, which has acted as a strong demand area during the latest correction phase. After forming a local bottom, the price has started to create higher lows, supported by a rising trendline. Currently trading near $194, TAO appears to be building short-term bullish momentum. However, the asset faces a strong resistance zone near $220, which previously acted as support before the breakdown.
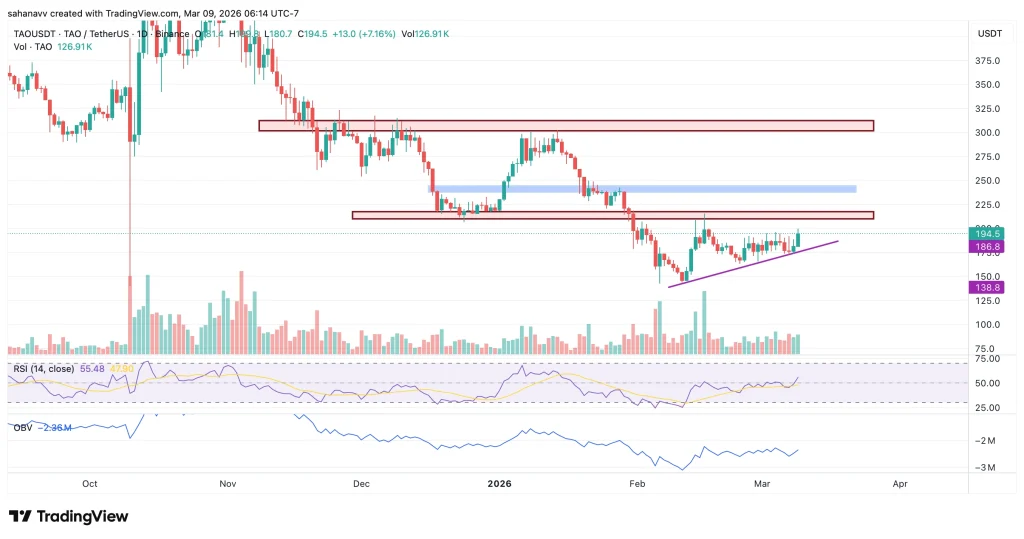
As seen in the above chart, the price is rising along the ascending trend line, which has been acting as a strong support zone. The RSI & OBV have displayed a bullish divergence, hinting towards a bullish continuation. Therefore, if buyers manage to push the price above this level, TAO could attempt a recovery toward the next resistance around $240–$250. On the downside, losing the $186 support may weaken the current structure and expose the price to another decline toward $138.
NEAR Protocol price is also attempting to stabilize after a prolonged downtrend. The asset recently bounced from the $1.00 demand zone, suggesting that buyers are defending the lower levels. At present, NEAR is trading near $1.24 and approaching a key resistance level around $1.41. This area previously acted as support before turning into resistance following the breakdown.
If the price manages to reclaim $1.41, the recovery could extend toward $1.66, where another major resistance zone lies. However, failure to break this level may keep the broader bearish structure intact.
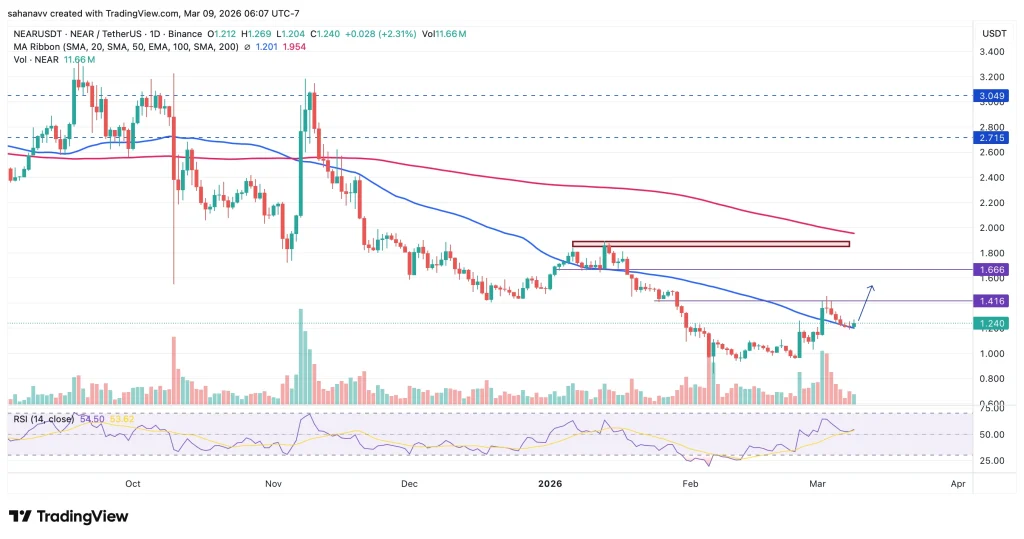
The NEAR price has been sustained above the 50-day MA despite facing significant upward pressure. Besides, the RSI has shifted to a recovery mode, which suggests the rally is gaining strength. Hence, the NEAR Protocol price is expected to surge above $1.41 and reach $1.5, opening the path to $1.8 to $2. On the flip side, the rally is likely to plunge below $1 and remain consolidated.
Both TAO and NEAR prices appear to be entering a potential recovery phase after extended corrections. However, the next move for both assets will largely depend on whether buyers can successfully reclaim the nearby resistance levels.
A breakout above $220 for Bittensor and $1.41 for NEAR Protocol could confirm stronger bullish momentum, while continued rejection may keep both tokens trading within their broader consolidation ranges.
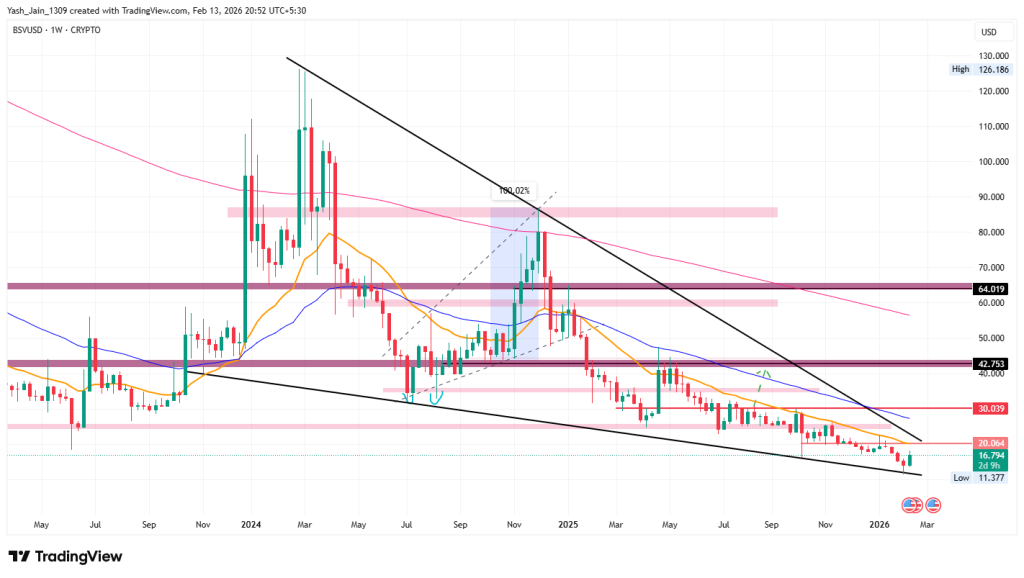
The post Bitcoin SV Price Prediction 2026, 2027-2030: Will BSV Price Hit $100? appeared first on Coinpedia Fintech News
Bitcoin SV price (BSV) has been on muted growth trajectory compared to other altcoins. Since the beginning of the year, signaling prolonged bearish sentiment, Bitcoin SV (BSV) has consistently traded below its 200-day EMA band.
Despite attempts to gain traction, the asset has failed to show any long-term bullish reversal, raising doubts among investors and traders about its recovery potential.
Even it’s a non-profit organization, BSV association, optimistic activities like successful collaboration and hackathon events are not manifesting on the BSV price chart
Many ask: “Can BSV Price break bearish trend above 200-day EMA?, “Is BSV a hidden gem waiting for its breakout, or just another risky bet?”. In this Bitcoin SV price prediction 2025 article, we’ll explore the future for BSV Price from 2025 through 2030.
| Cryptocurrency | Bitcoin SV |
| Token | BSV |
| Price | $13.0889
|
| Market Cap | $ 261,762,832.33 |
| 24h Volume | $ 14,801,567.1928 |
| Circulating Supply | 19,998,834.3750 |
| Total Supply | 19,998,834.3750 |
| All-Time High | $ 491.6354 on 16 April 2021 |
| All-Time Low | $ 11.8148 on 06 February 2026 |
Bitcoin SV (BSV) is showing encouraging signs of recovery as it nears a crucial support level within a falling wedge pattern. If BSV can successfully reverse and break through the $20 resistance, it opens up exciting possibilities for reaching impressive price heights of $30 and even $64 by the end of the year, provided demand rises.
On the other hand, it may continue to consolidate if market conditions do not support growth.
The current price of Bitcoin SV (BSV) presents a notable opportunity for investors. Although 2025 experienced heavy challenges after 2024’s high, things seem to be changing for BSV. The price prediction for BSV in 2026 points to a more optimistic future ahead.
This optimism stems from recent chart observations that have revealed what was hidden amid the intense downtrend in the BSV/USD price. The pattern that emerged was a falling wedge, which has significantly compressed the trading range over the last two years. This compression suggests a strong potential for a positive shift in 2026, which should be considered despite the recent price fluctuations.
The projections for Q1 2026 align well with this falling wedge, which has been forming for multiple years, indicating that the trading range is approaching a critical point. Many believe that a substantial bounce could occur, offering a promising outlook for the asset.
While past price action has shown some terrific declines, Q1 saw a retest from the lower border of the falling wedge. From a distance, BSV/USD appears to have taken a stable footing. It appears to have laid a solid foundation that could benefit from better, more favorable macroeconomic conditions in the future. Signs indicate that 2026 could be a significant rally year, and investors anticipate bullish demand.
With stabilizing market conditions, there appears to be potential for considerable upward movement. The immediate resistance level to watch is $20 and $30; if these two levels are surpassed, we could see an ascent towards levels at $42 and $64 later. However, if demand does not improve, consolidation might continue for an extended period.
The 90-day Taker CVD is negative and declining, indicating that aggressive sellers have dominated the market. This means that those hitting the bid are selling more than they buy, which likely drives the BSV price down due to excess supply.
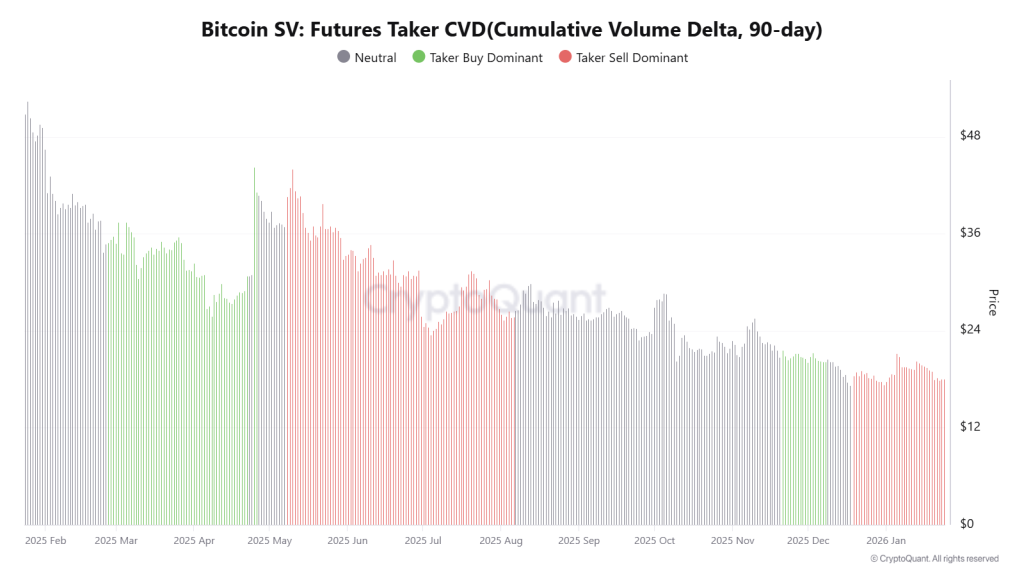
However, the large average order sizes indicated by the green dots on the chart suggest otherwise. When these order sizes remain high while prices drop, it signals that whales or big investors are placing significant buy orders. These players are absorbing the selling pressure, allowing retail investors to sell at lower prices into their large orders.
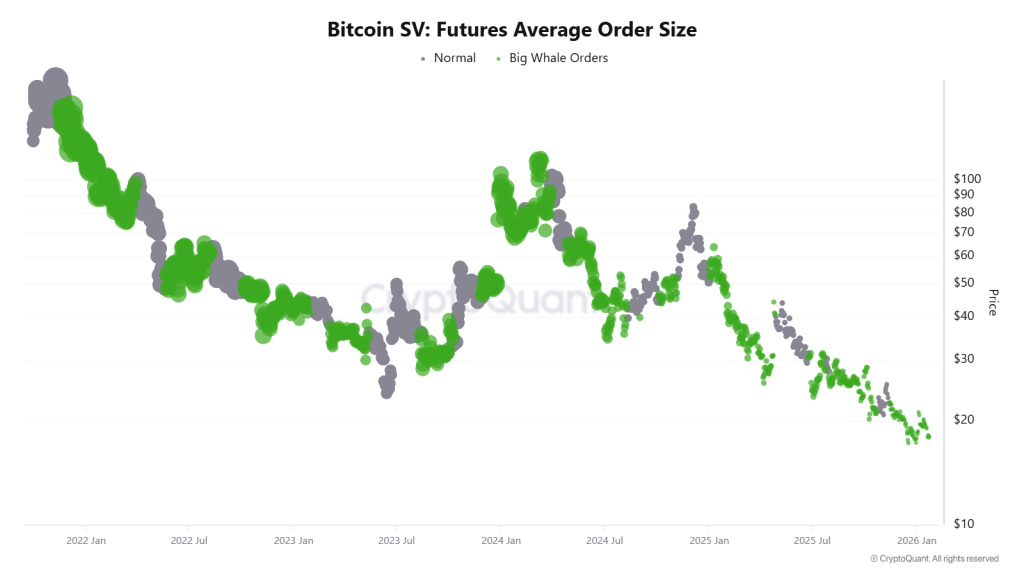
Historically, when high-value orders continue during a price decline, it suggests the market may be nearing a liquidity bottom.
| Year | Potential Low ($) | Average Price ($) | Potential High ($) |
| 2026 | 60 | 90 | 130 |
| 2027 | 75 | 95 | 145 |
| 2028 | 85 | 115 | 155 |
| 2029 | 95 | 125 | 165 |
| 2030 | 105 | 135 | 175 |
This table, based on historical movements, shows BSV price to reach $175 by 2030 based on compounding market cap each year. This table provides a framework for understanding the potential BSV price movements. Yet, the actual price will depend on a combination of market dynamics, investor behavior, and external factors influencing the cryptocurrency landscape.
BSV price prediction for 2026 anticipates a potential low of $60 and a high of $130, with an average price projected at $90.
In 2027, the BSV token price can range between $75 and $145, with an average price of approximately $95.
Based on the altcoin’s price history, it can target a potential low of $85 and a potential high of $155, with an average price expected to be $115.
Bitcoin SV price targets in 2029 are estimated to range from $95 to $165, with an average price of around $125.
The potential low for Bitcoin SV in 2030 is forecasted at $105, the potential high at $175, with an average price expected to be $135.
| Firm Name | 2025 | 2026 | 2030 |
| Digital Coin price | $78 | $94 | $199 |
| Coindataflow | $75 | $36 | $70 |
| Coincodex | $26 | $21 | $35 |
| Swapspace | $23 | $46 | $360 |
Stay ahead with breaking news, expert analysis, and real-time updates on the latest trends in Bitcoin, altcoins, DeFi, NFTs, and more.
BSV could range from $60 to $130 in 2026, with an average price around $90, showing potential for a bullish reversal.
By 2030, BSV may reach $105–$175, averaging $135 if adoption grows and market conditions remain favorable.
Long-term 2040 predictions are uncertain, but if growth continues, BSV could rise steadily with the broader crypto market.
BSV focuses on fast, low-cost transactions and enterprise use, while BTC is primarily a store of value. Choice depends on goals.
Risks include prolonged bearish trends, weak investor sentiment, regulatory uncertainty, and underperformance versus other altcoins.
The post Decentraland Price Prediction 2026, 2027 – 2030: Will MANA Price Hit $1? appeared first on Coinpedia Fintech News
Decentraland (MANA) is one of the earliest and most recognizable names in the metaverse sector. Built on Ethereum, Decentraland allows users to own virtual land, create experiences, and participate in a digital space using its native token, MANA.
While the overall metaverse narrative has cooled since its 2021 peak, Decentraland continues to maintain an active ecosystem focused on virtual events, social experiences, and creator-led development.
If you’re curious about Decentraland’s future and wondering whether MANA is a good investment, this MANA price prediction 2026–2030 will walk you through its potential growth and long-term outlook.
| Cryptocurrency | Decentraland |
| Token | MANA |
| Price | $0.0903
|
| Market Cap | $ 179,232,639.65 |
| 24h Volume | $ 24,177,179.0682 |
| Circulating Supply | 1,985,909,566.5331 |
| Total Supply | 2,193,179,327.3202 |
| All-Time High | $ 5.9023 on 25 November 2021 |
| All-Time Low | $ 0.0079 on 13 October 2017 |
MANA has declined by 98% since the FTX crash in 2021 and has shown little resilience during this time. The critical support level from early 2021 is currently being tested in Q1 2026.The future performance of MANA remains uncertain. But, if the MANA/USD pair closes above $0.35 on a weekly basis, it could signal a potential recovery. This might enable a return to earlier levels within the ecosystem, making the target price of $1.00 within reach for the year.
MANA crypto’s multi-year performance chart reflects a dramatic 98% decline since the FTX crash in 2021, leading many enthusiasts and investors to speculate about the project’s potential end.
This sharp price depreciation has instilled fear among investors, who have witnessed continuous negative price action for years. However, it is essential to consider the historical support level that has been in place since early 2021, which warrants attention despite the recent stagnation in price movement.
Although the project has experienced considerable setbacks over the past half-decade, there still remain arguments for a potential revival. The primary argument is the avoidance of delisting from several exchanges, indicating that MANA/USD continues to pursue efforts aimed at market recovery and still retains decent liquidity in a project with an over $250 million market cap.
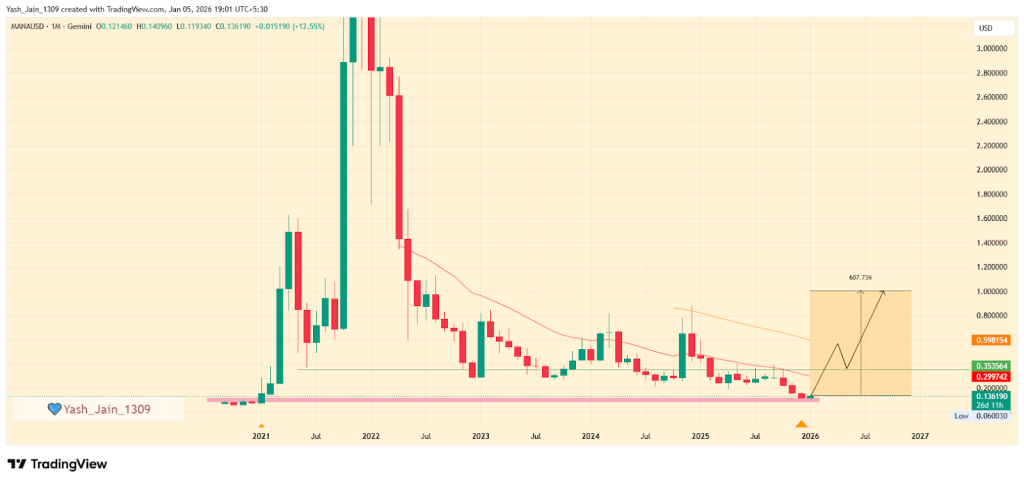
Thus, the current retest of this support level is particularly noteworthy. A reversal at this juncture could result in substantial upward momentum. Conversely, if this support range is breached, it would likely reinforce perceptions of MANA crypto as a failing venture.
That said, it is crucial to closely monitor the $0.35 level. Should MANA successfully breach this level and maintain above it with a weekly close, this would signify a significant “Change of Character” for the price dynamic. Under such circumstances, a conservative target of $1.00 for the year may be warranted.
| Price Prediction | Potential Low ($) | Average Price ($) | Potential High ($) |
| 2026 | 0.95 | 1.45 | 1.95 |
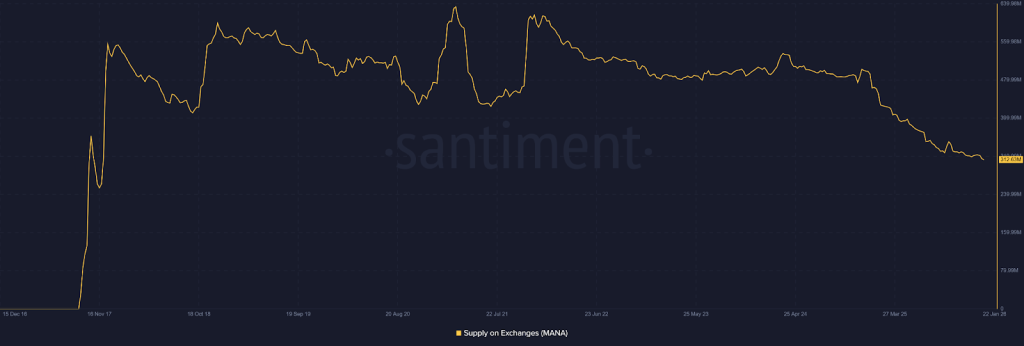
MANA’s exchange reserves have plummeted from 606M to 312M tokens, a massive 48% supply drain signaling aggressive accumulation. This consistent liquidity exit creates a powerful supply-crunch, drastically reducing sell-side pressure and preparing the asset for a significant parabolic breakout as market demand grows.
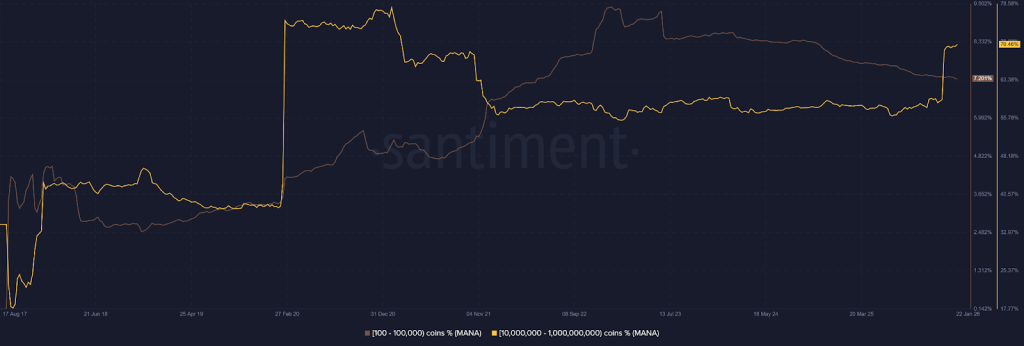
Furthermore, a bullish transfer of wealth is underway. While retail holders dump their positions, institutional whales holding 10M–1B tokens are absorbing the supply. This shift from weak to strong hands confirms deep conviction among major players, providing a solid floor for MANA’s future growth.
| Price Prediction Years | Potential Low ($) | Average Price ($) | Potential High ($) |
| Decentraland (MANA) Price Forecast 2026 | 0.95 | 1.45 | 1.95 |
| MANA Token Price Forecast 2027 | 1.55 | 2.15 | 2.85 |
| Decentraland Price Analysis 2028 | 2.45 | 3.05 | 3.65 |
| Decentraland Price Prediction 2029 | 3.55 | 3.95 | 4.35 |
| MANA Price Prediction 2030 | 4.15 | 4.65 | 5.15 |
According to forecast prices and technical analysis, Decentraland’s price is projected to reach a minimum of $0.95 in 2026. The maximum price could hit $1.95, with an average trading price of around $1.45.
Looking forward to 2027, MANA’s price is expected to reach a low of $1.55, with a high of $2.85 and an average forecast price of $2.15.
In 2028, the price of a single Decentraland is anticipated to reach a minimum of $2.45, with a maximum of $3.65 and an average price of $3.05.
By 2029, Decentraland’s price is predicted to reach a minimum of $3.55, with the potential to hit a maximum of $4.35 and an average of $3.95.
In 2030, the MANA coin price is predicted to touch its lowest price at $4.15, hitting a high of $5.15 and an average price of $4.65.
| Year | 2026 | 2027 | 2030 |
| CoinCodex | $0.26 | $0.39 | $0.67 |
| Tokenmetrics | $0.78 | $1.41 | $2.11 |
| DigitalCoinPrice | $0.33 | $0.61 | $3.32 |
Stay ahead with breaking news, expert analysis, and real-time updates on the latest trends in Bitcoin, altcoins, DeFi, NFTs, and more.
Decentraland is a virtual world on Ethereum where users buy land, create experiences, and trade using the MANA token.
MANA could trade between $0.247 and $0.40 in 2026, with potential upside if it maintains key support and adoption grows.
By 2030, MANA could reach a high of $4.92, a low of $4.15, and an average price of $4.65, reflecting adoption and growing metaverse use.
Over the long term, MANA may see substantial growth if adoption and virtual land demand expand, potentially reaching a high of $12–$15 by 2040.
MANA’s price is influenced by virtual land demand, user growth, creator tools, and on-chain activity in Decentraland.
Yes, if Decentraland expands events, gaming, and creator tools, it could attract more users and remain a top metaverse platform.

The post Crypto Market News Today as Tokenized Assets Hit $25 Billion and Pepeto Crosses $7.5M appeared first on Coinpedia Fintech News
Tokenized real world assets just crossed $25 billion on chain, nearly quadrupling from $6.4 billion a year ago, and when BlackRock, JPMorgan, and Franklin Templeton are all building tokenization infrastructure at the same time, the crypto market news today is telling you exactly where this industry is heading.
But while institutions tokenize treasuries and equities at multi billion dollar scale, the exchange infrastructure processing those tokenized trades is where the real value concentrates. The crypto market news today favors the wallets that position during consolidation, because the breakout rewards the ones who were already inside when the volume arrived.
Tokenized real world assets excluding stablecoins have surged past $25 billion on chain, nearly quadrupling in a year, with six categories now exceeding $1 billion each, according to CoinDesk. Treasuries, private credit, and commodities are driving the growth as institutional heavyweights build tokenization rails that bring traditional assets onto blockchain networks.
The crypto market news today proves infrastructure is not slowing down even when prices consolidate, because the exchanges processing tokenized asset volume are where the value flows, and the presale building that exchange is still open.
The crypto market news keeps covering tokenized assets hitting $25 billion, but there is one presale that is getting louder every week and attracting wallets faster than anything else in the market right now. $7.5M raised during fear. Media coverage growing daily. And the crowd gets bigger every round. Pepeto is drawing this attention because it targets the critical layer underneath all of it: the exchange that connects every blockchain into one trading platform where all cryptocurrencies, including tokenized assets, are traded.
As the number of digital assets and tokenized markets expands past $25 billion, investors need an exchange that helps them trade across chains and track risk across every token class. That real utility has driven significant early demand, because the presale has raised $7.5M while most projects struggle to find interest in this fear cycle.
The founder already built Pepe to a $7 billion valuation, the SolidProof audit was completed before the presale opened, and the Binance listing is approaching. You invest $10,000 at 204% annual yield, your position generates $20,400 per year, which breaks down to $1,700 per month flowing into your wallet while the crypto market news covers everyone else asking when the bottom is in instead of positioning for what comes next.
Experienced crypto market news readers understand that the largest returns come from entering before the broader market takes notice. If the exchange continues building after the listing, entering during the presale stage could prove to be the most strategic entry point of the entire cycle.
Ethereum trades near $1,940 according to CoinMarketCap after dropping 4.4% this week, and the crypto market news is mixed as Harvard rotated $86.8M into an ETH trust but ETF outflows erased midweek gains.
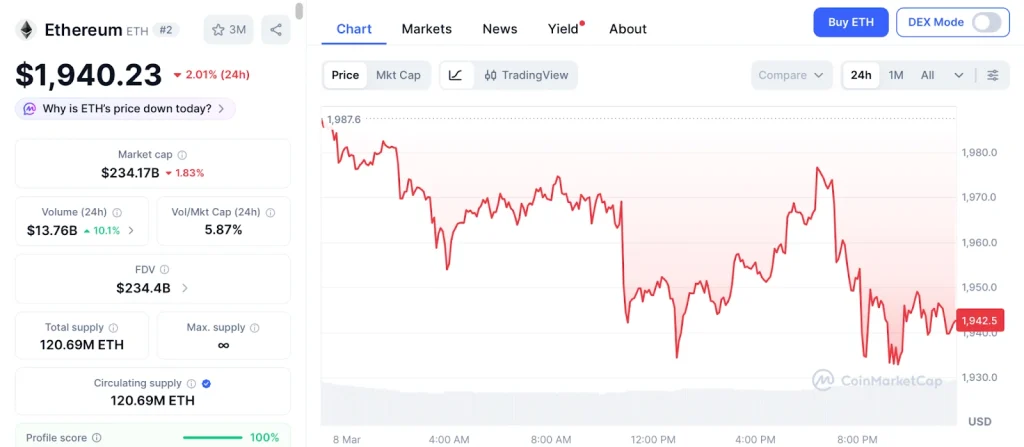
ETH leads DeFi with $68 billion in TVL, but a path back to $2,400 only opens if $1,940 support holds and the macro cooperates.
Dogecoin fell to $0.09 after failing $0.104, and crypto market news shows futures open interest dropping to $1.04 billion from $1.14 billion as retail exits. Without institutional demand or infrastructure, DOGE depends on sentiment cycles that get shorter and weaker each time macro turns negative.
Tokenized assets just quadrupled to $25 billion and the institutions building those rails need an exchange to process the volume, which is exactly what Pepeto is constructing with $7.5M committed and a SolidProof audit done before the first dollar entered.
The whales accumulating at six zeros are the same wallets that will sell to latecomers at 50x after listing day, and every round that fills without you is another allocation gone forever. The 204% APY pays $57 per day into wallets that already entered, and the Binance listing turns this price into a different number permanently. Visit the Pepeto official website and enter the presale before the entry you see today vanishes into a price you can only regret.
Click To Visit Pepeto Website To Enter The Presale
What is the biggest crypto market news today?
The biggest crypto market news today is tokenized assets crossing $25 billion on chain. Pepeto at presale pricing with exchange infrastructure captures that wave.
Why does tokenization matter for crypto presales?
Tokenization proves institutional capital is building on chain. Pepeto’s exchange infrastructure processes tokenized asset trades, making it the presale best positioned for the crypto market news cycle.
How does Pepeto fit into the crypto market news cycle?
Pepeto with $7.5M raised and a Binance listing approaching builds the exchange layer that tokenized assets and all cryptocurrencies need to trade through.
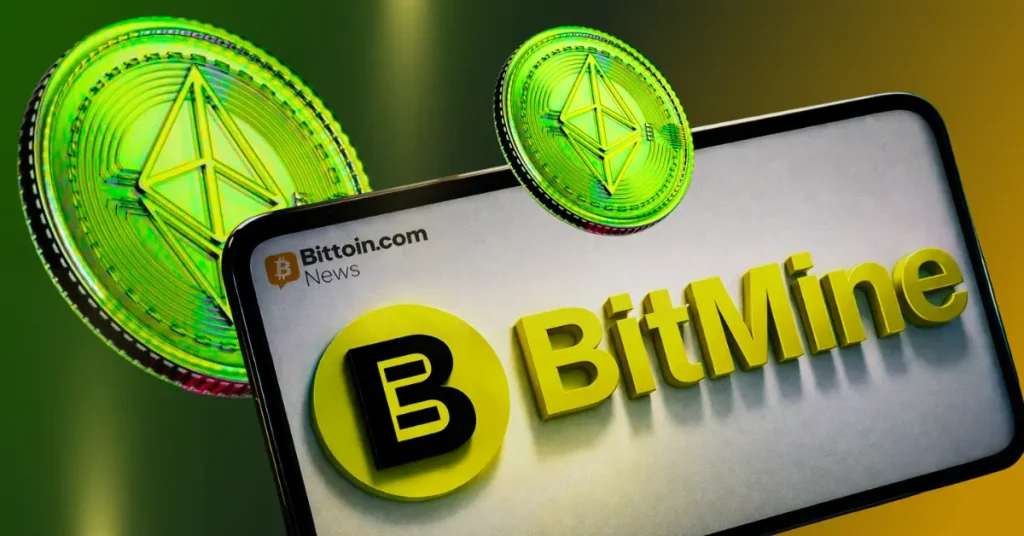
The post Tom Lee’s Bitmine Buys 60,976 ETH appeared first on Coinpedia Fintech News
Bitmine Immersion Technologies said it added 60,976 ETH last week, bringing its total Ethereum stash to 4.53 million ETH, roughly 3.76% of the entire supply. The firm reported $10.3 billion in combined crypto and cash assets, including $1.2 billion in cash. Of its Ethereum holdings, 3.04 million ETH are actively staked, earning rewards. The latest accumulation highlights Bitmine’s growing role as a major institutional Ethereum holder amid rising network participation and staking demand.


“A digital money system with transparent, predictable, and ultimately scarce supply... has rising appeal in today’s economy due to fiat currency tail risks," said Grayscale.

RedStone co-founder Marcin Kaźmierczak says banks are splitting RWA infrastructure between private networks like Canton and public chains such as Ethereum.

The purchase brings Strategy’s total Bitcoin reserves to nearly 739,000 BTC despite the asset trading below the company’s average acquisition price.

Stablecoin banking startup Kast secured fresh funding as it looks to expand payment infrastructure across North America, Latin America and the Middle East.

Nigel Farage has acquired a 6.31% stake in the London-listed Bitcoin treasury company Stack BTC amid broader scrutiny over crypto donations in UK politics.

It’s estimated that roughly 1,800 crypto companies operate in the United Arab Emirates, employing more than 8,600 people in various roles.

Nasdaq and Kraken will enable tokenized equities to move between regulated and onchain markets while preserving issuer rights and regulatory compliance.

Bitcoin held strong above $67,000 amid oil surge to $119 per barrel on Middle East conflict and inflation fears, with analysts seeing signs of a potential BTC price reversal.

Coinbase launched regulated crypto and equity index futures for Advanced users in 26 European countries as ESMA sharpens scrutiny of perpetual-style products.

Bitcoin ETPs turned green year-to-date with $521 million inflows last week, as total crypto assets rebounded despite geopolitical tensions linked to Iran.

Bitcoin faced two death crosses and the total failure of the $74,000 BTC price breakout headed into the second week of March as the US-Iran conflict raged.

Bitcoin rebounded from around $65,725 to nearly $68,000 as oil pulled back from its 25% Sunday spike above $117 and market jitters eased.

The post Bitcoin Price Holds Key Levels as Strategy Buys $1.28B BTC and Century-Old Pattern Resurfaces appeared first on Coinpedia Fintech News
The Bitcoin price just received another reminder that some players in the market aren’t interested in short-term noise. They’re still buying as aggressively as ever.
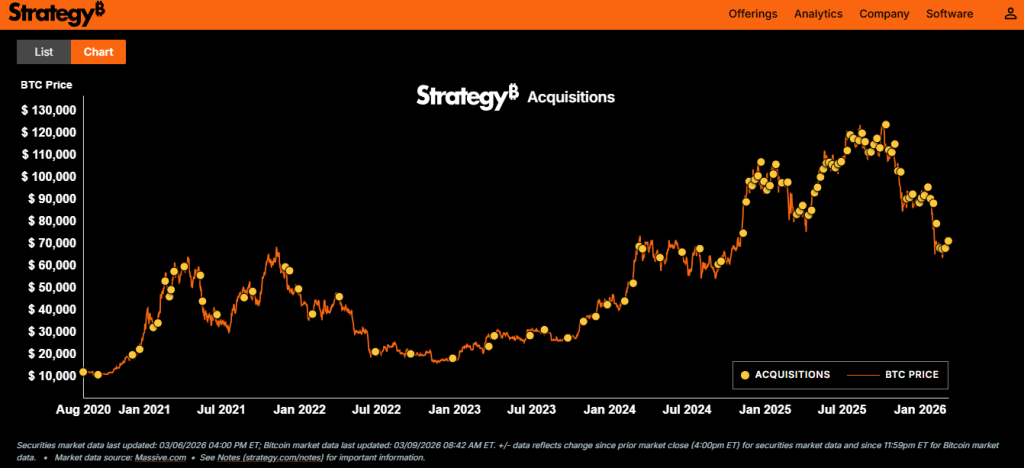
This time the spotlight lands on Strategy at most crucial phase, which confirmed it purchased 17,994 BTC worth roughly $1.28 billion at an average price of $70,946 per coin.
The purchase pushes the company’s total holdings to 738,731 BTC, acquired for about $56.04 billion at an average cost of $75,862 per bitcoin as of March 8, 2026.
For a company that’s been stacking coins for years, the strategy still remains the same: buy and hold.
Corporate accumulation isn’t exactly new territory for Strategy. But this latest purchase is still notable for one reason: timing.
The company scooped up the additional BTC with the market hovering around the $70K range, reinforcing a pattern where institutional buyers appear comfortable accumulating near this level.
Now, when large entities repeatedly absorb supply at similar prices, traders tend to watch closely. It’s the kind of behavior that often shapes long-term market structure rather than short-term speculation.
And yes, it inevitably feeds into the never-ending Bitcoin price prediction debate.
Because when billions flow into an asset during consolidation, people start wondering what comes next.
Strategy has acquired 17,994 BTC for ~$1.28 billion at ~$70,946 per bitcoin. As of 3/8/2026, we hodl 738,731 $BTC acquired for ~$56.04 billion at ~$75,862 per bitcoin. $MSTR $STRC https://t.co/wB1k3Nt1xa
— Michael Saylor (@saylor) March 9, 2026
Now here’s where things get a little more interesting. Some market watchers believe the Bitcoin price chart is following a surprisingly old roadmap, one originally described nearly a century ago.
The structure reportedly mirrors a trading pattern identified in the 1920s by Jesse Livermore, one of the most famous traders of early financial markets and seems like big shorts are aware.
According to the interpretation circulating in trading circles, the market appears to be following the same sequence step by step.
And the key levels are straightforward. Above $70K, the next leg of the move is considered confirmed. Below $60K, the market may simply extend its accumulation phase.
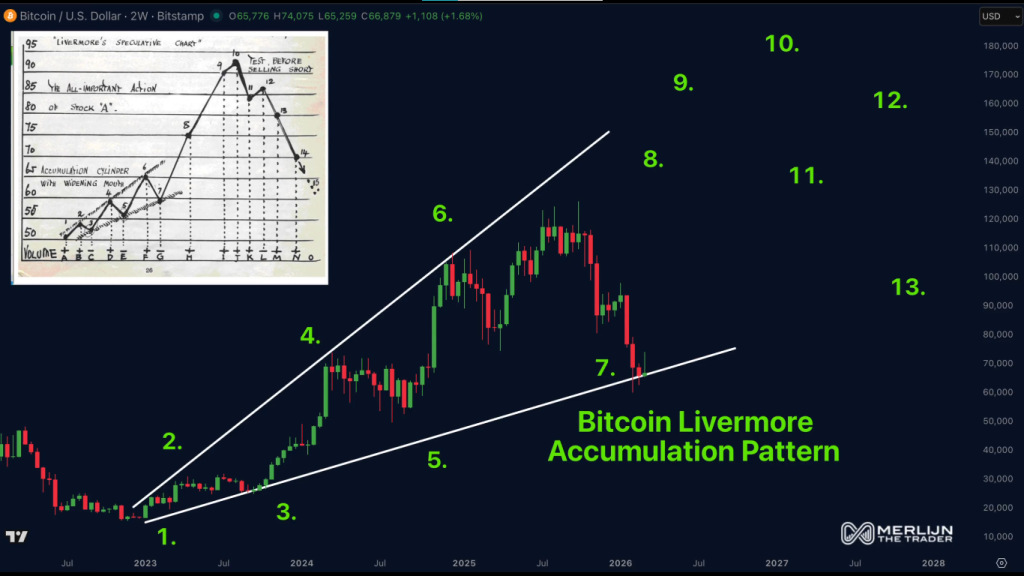
So where does that leave the market right now? Right in the middle of the tension zone.
The Bitcoin/USD range between $60,000 and $70,000 has effectively become the battleground determining whether the current cycle accelerates or stretches sideways a little longer.
Institutional buyers accumulating near the upper band certainly add fuel to the bullish argument. On the other hand, markets rarely move in straight lines, especially when sentiment swings between fear and optimism.
Still, the broader narrative remains hard to ignore. A company sitting on more than 738,000 BTC just added another $1.28 billion worth of coins.
And if the historical pattern continues to play out, the next move in the Bitcoin price could depend on whether the market firmly holds that critical $70K threshold.

The post XRP Price Prediction: Bears Target $1 as XRP Struggles Below Key Resistance appeared first on Coinpedia Fintech News
The XRP price continues to face selling pressure as the token struggles to regain momentum above key resistance levels. After multiple rejections near the $1.50 region, XRP is now consolidating around the $1.35 level, raising concerns among traders about whether the price could drop toward $1.
The current market structure suggests that XRP remains trapped within a broader downtrend, with sellers maintaining control at higher levels. A key question many investors are asking right now is why XRP is falling and whether the token could recover in the near term.
Recent on-chain data from Glassnode suggests growing pressure within the XRP market. According to the chart above, the total supply of XRP held at a loss has increased significantly in recent months.
This metric measures the amount of tokens currently held by investors whose purchase price is higher than the current market price. When this number rises sharply, it often indicates that a large portion of market participants are underwater.
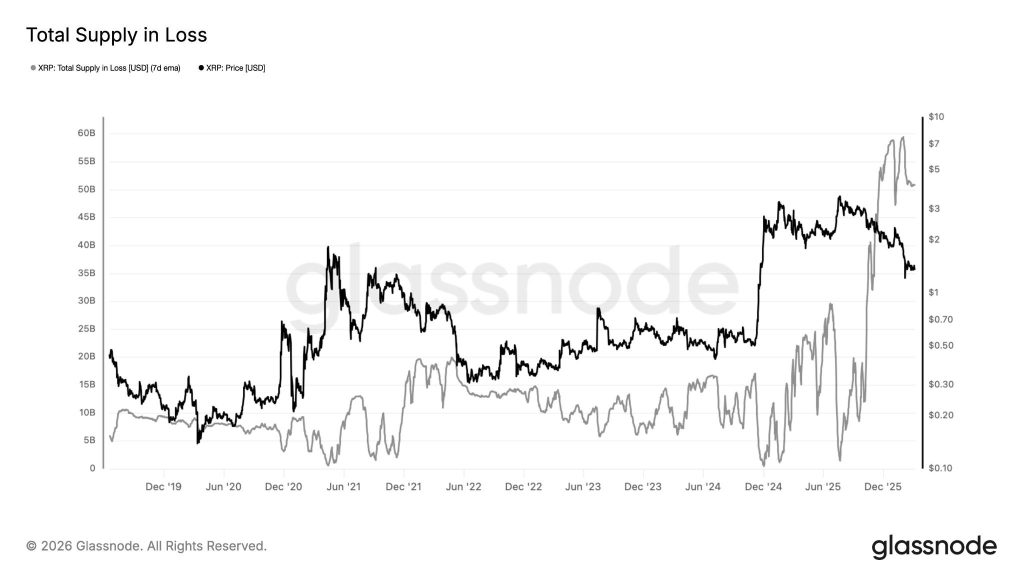
Historically, such conditions can create two important market dynamics. First, many holders tend to sell during short-term price recoveries to exit near their break-even level. This behavior can create strong overhead resistance and slow down any bullish recovery.
Second, rising supply in losses sometimes appears during the later stages of a market correction, when weaker hands gradually exit the market. In some cases, this phase can eventually lead to market stabilization once selling pressure begins to decline.
From a technical perspective, XRP continues to trade inside a descending channel, which indicates that the broader market structure remains bearish. After facing repeated rejection near the $1.50–$1.55 resistance zone, the price has moved lower and is now consolidating around the $1.35 region. This level sits just above a crucial support area near $1.32, which currently acts as the first line of defense for the bulls.
If this support holds, XRP could continue trading sideways within the channel before attempting another recovery.
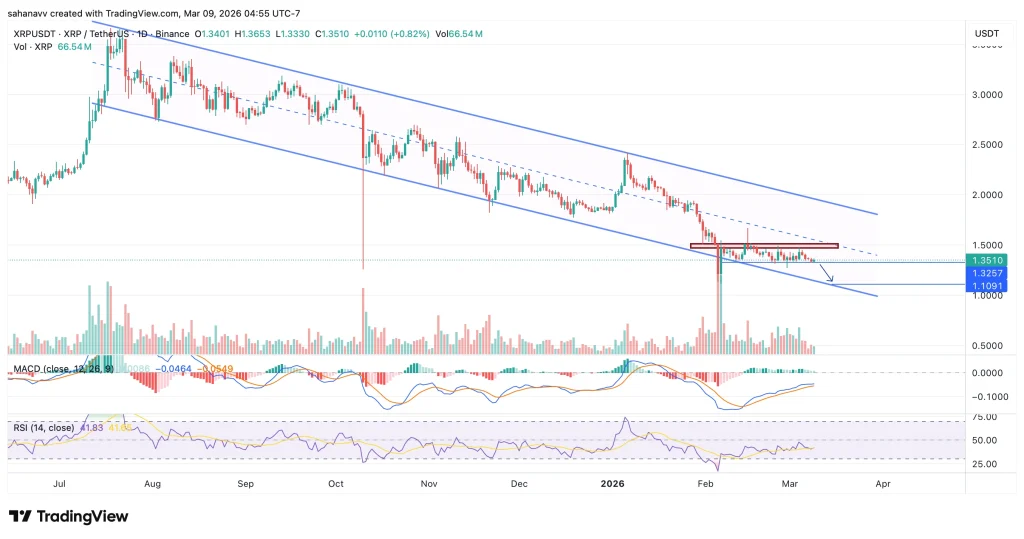
However, if the $1.32 support breaks, the price could move toward the next major support near $1.10, which aligns with the lower boundary of the descending channel. Looking at the indicators, the MACD is attempting a bullish crossover, suggesting that selling momentum may be slowing slightly. Meanwhile, the RSI remains near the neutral zone, reflecting ongoing consolidation rather than a strong trend reversal.
Overall, the technical structure still favors the bears unless XRP manages to reclaim the key resistance levels.
Wrapping it Up- What to Expect Next?
In the short term, traders will closely watch the $1.32 support level. If the XRP price holds above this zone, XRP could attempt a recovery toward $1.50, which remains the key resistance level that bulls must reclaim to regain momentum. However, a confirmed breakdown below $1.32 could push XRP toward $1.10, with the psychological $1 level becoming the next major downside target.
For now, the market remains in a consolidation phase within a broader downtrend. Until XRP breaks above key resistance levels, the price may continue to face pressure from both technical and on-chain factors.
The post Nasdaq and Kraken Are Building 24/7 Tokenized Stock Trading – Launch Set for 2027 appeared first on Coinpedia Fintech News
Nasdaq has announced a partnership with crypto exchange Kraken to develop a system for issuing and trading tokenized versions of publicly listed stocks and ETFs – a move that would allow investors to hold blockchain-based shares with the same rights as traditional stockholders, including dividends and proxy voting.
The platform is expected to launch in early 2027, pending SEC approval.
Through its parent company Payward, Kraken will serve as the primary settlement layer for Nasdaq equity token transactions and act as the distribution partner for tokenized shares to customers outside the United States, with Europe as the primary target market. US investors are excluded under the current plan.
The infrastructure powering the partnership is xStocks, Kraken’s tokenized equities framework, which has already processed over $25 billion in transaction volume and counts more than 85,000 unique holders since launching less than a year ago.
The initiative builds on a proposal Nasdaq submitted to the SEC in September 2025, seeking approval to allow tokenized versions of its listed stocks and ETFs to trade alongside traditional shares. Under that proposal, both versions would settle through the Depository Trust, keeping them interchangeable.
Nasdaq also separately announced a partnership with Boerse Stuttgart Group’s tokenized settlement platform Seturion to connect its European trading venues to tokenized securities infrastructure.
The Nasdaq-Kraken deal is the third major exchange partnership in tokenized equities in the past week alone.
Last week, ICE – the parent company of the New York Stock Exchange – made a strategic investment in OKX at a $25 billion valuation, signing a deal to bring tokenized stocks and crypto futures to the platform. Coinbase also launched regulated crypto futures across 26 European countries for the first time.
Kraken is also targeting a public listing in 2026. A settlement-layer mandate from Nasdaq significantly strengthens that story ahead of its IPO, positioning the exchange as core financial infrastructure rather than a crypto-only platform.
Stay ahead with breaking news, expert analysis, and real-time updates on the latest trends in Bitcoin, altcoins, DeFi, NFTs, and more.
They are building a system to issue and trade tokenized versions of publicly listed stocks and ETFs, pending SEC approval, with an expected launch in early 2027.
The platform is expected to launch in early 2027, but only if the U.S. SEC approves the proposal allowing tokenized versions of Nasdaq-listed stocks and ETFs.
Nasdaq is using Kraken’s xStocks infrastructure to expand blockchain-based trading globally, improving settlement speed and access for investors outside the U.S.

The post Strategy Buys $1.28 Billion Worth of Bitcoin appeared first on Coinpedia Fintech News
Strategy, led by Michael Saylor, has acquired another 17,994 Bitcoin for roughly $1.28 billion, paying an average of $70,946 per coin. The latest purchase lifts the company’s total holdings to 738,731 BTC as of March 8, 2026. Overall, the firm has invested about $56.04 billion in Bitcoin at an average acquisition price of $75,862. Strategy continues to position Bitcoin as its core treasury reserve asset, reinforcing one of the largest corporate Bitcoin holdings globally.

The post Why the Clarity Act Could Be Crypto’s Most Important U.S. Law appeared first on Coinpedia Fintech News
Former CFTC Chair Chris Giancarlo believes the United States is at a crucial turning point for crypto regulation, with the Clarity Act emerging as one of the most important pieces of legislation for the industry.
Speaking on Scott Melker’s The Wolf Of All Streets Podcast, Giancarlo stressed that the biggest issue facing the crypto market today is not innovation or adoption, but the lack of clear regulatory rules.
According to him, the Clarity Act aims to define how digital assets are regulated by clearly separating oversight responsibilities between the U.S. Securities and Exchange Commission and the Commodity Futures Trading Commission.
“If nothing else, we need to clarify the rules, the guardrails between the CFTC and the SEC,” Giancarlo explained during the discussion.
The crypto market structure bill has already cleared an important milestone in Washington. The Clarity Act passed the U.S. House of Representatives in July 2025 and has now been referred to the U.S. Senate Committee on Banking, Housing, and Urban Affairs.
If the Senate approves the legislation, it will then be sent to Donald Trump for final approval and signature.
And if Congress ultimately fails to pass the legislation, Giancarlo believes regulators could step in to fill the gap temporarily. He pointed to leaders such as Paul Atkins at the SEC and Mike Selig at the CFTC as figures who may attempt to develop workable regulatory frameworks.
Giancarlo described this stage as the most challenging part of the process, noting that defining market structure is far more complex than passing basic crypto-related legislation.
Hence, without legislation like the Clarity Act, Giancarlo believes institutional adoption could remain limited, making regulatory clarity one of the most critical steps for the future of crypto in the United States.
Despite the political hurdles, Giancarlo remains cautiously optimistic about the bill’s chances in Congress.
“My betting odds right now are 60–40 that it gets done,” he said.
He emphasized that the legislation is necessary to provide the long-term legal framework that the digital asset industry needs to expand responsibly within the U.S. financial system.
Mostly, Giancarlo blamed the Clarity Act has faced delays due to political divisions and competing interests across Washington.
According to him, political conflicts have complicated efforts to build consensus around how crypto markets should be structured and regulated.
Stay ahead with breaking news, expert analysis, and real-time updates on the latest trends in Bitcoin, altcoins, DeFi, NFTs, and more.
The Clarity Act is a proposed U.S. law designed to clarify how digital assets are regulated by dividing oversight between the SEC and the CFTC.
The Clarity Act could bring clear rules for digital assets, reduce regulatory confusion, and help attract institutional investors to the U.S. crypto market.
If approved, the law could create a stable regulatory framework, improve investor confidence, and support long-term growth of the U.S. digital asset industry.
Former CFTC Chair Chris Giancarlo estimates a 60–40 chance of passage, though political debates in Washington may still influence its final outcome.

The post South Korea’s Bithumb Faces Six-Month Partial Suspension Over AML Violations appeared first on Coinpedia Fintech News
Crypto rules in South Korea are tightening as regulators target major exchanges. Bithumb, the country’s second-largest crypto exchange, is facing a possible six-month partial suspension after regulators accused it of breaking AML and KYC rules.
The decision could limit services like deposit and withdrawal, mainly for new users joining the exchange.
The Financial Intelligence Unit, operating under the Financial Services Commission, issued the notice to Bithumb. Authorities claim Bithumb may have failed to properly enforce Know-Your-Customer (KYC) and anti-money-laundering (AML) checks required under the Special Financial Transactions Act.
Regulators raised concerns that Bithumb dealt with overseas crypto operators without properly reporting them to authorities.
Because of these issues, the FIU has proposed a six-month partial business suspension along with disciplinary action against the company’s chief executive.
In response to this, Bithumb officials said the case remains under review and regulators will decide during the March 16 sanctions meeting.
If the sanction is confirmed, the suspension will mainly affect new users joining the Bithumb platform. According to industry reports, restrictions would likely block new users from transferring crypto assets for up to six months.
Meanwhile, existing users, however, would still be able to deposit and withdraw Korean won and continue normal crypto trading on the platform.
This approach is similar to penalties imposed on other exchanges in the country. Last year, regulators fined Dunamu, the operator of Upbit, 35.2 billion won (about $26 million) and imposed a three-month partial suspension.
Another local exchange, Korbit, was also fined 2.73 billion won (around $2 million) for compliance failures.
The investigation comes as South Korea increases oversight of the digital asset industry. The country introduced stricter crypto rules after the 2022 collapse of the Terra ecosystem, created by Do Kwon, which wiped out more than $40 billion in market value globally.
In July 2024, South Korea also launched the Virtual Asset User Protection Act, forcing exchanges to improve AML monitoring, separate customer funds, and report suspicious transactions.
Stay ahead with breaking news, expert analysis, and real-time updates on the latest trends in Bitcoin, altcoins, DeFi, NFTs, and more.
Bithumb is under investigation for allegedly failing to properly enforce AML and KYC checks and for dealing with overseas crypto operators without reporting them to regulators.
No. Existing users are expected to continue normal trading and Korean won deposits and withdrawals even if regulators impose the partial suspension.
South Korea increased oversight after major crypto failures like the Terra collapse, aiming to strengthen AML checks, protect users, and improve transparency across exchanges.
The post XRP Price Faces Pressure as $50B Turns Underwater – But Data Hints at a Possible Setup appeared first on Coinpedia Fintech News
XRP price is trading near $1.35 today as fresh on-chain data shows nearly $50 billion worth of XRP has moved underwater, highlighting growing pressure across the network. While the broader crypto market remains uncertain, several underlying indicators are beginning to reveal shifts beneath the surface. Large portions of the XRP supply are now sitting at a loss, trading momentum on major exchanges has slowed, and the asset itself is compressing within a tightening technical structure.
As a result, analysts are now closely watching whether XRP price is simply stabilizing after its recent decline, or quietly preparing for a larger move in the weeks ahead.
According to Glassnode data tracking the “Total Supply in Loss” metric, approximately 36.8 billion XRP tokens are now trading below the price at which they were acquired. At current market prices, this translates to nearly $50 billion in unrealized losses across the network. This indicator measures how much of a cryptocurrency’s circulating supply is currently held at a loss. Rising supply in loss typically occurs during market corrections when investors who bought near local highs begin to see their positions move underwater.
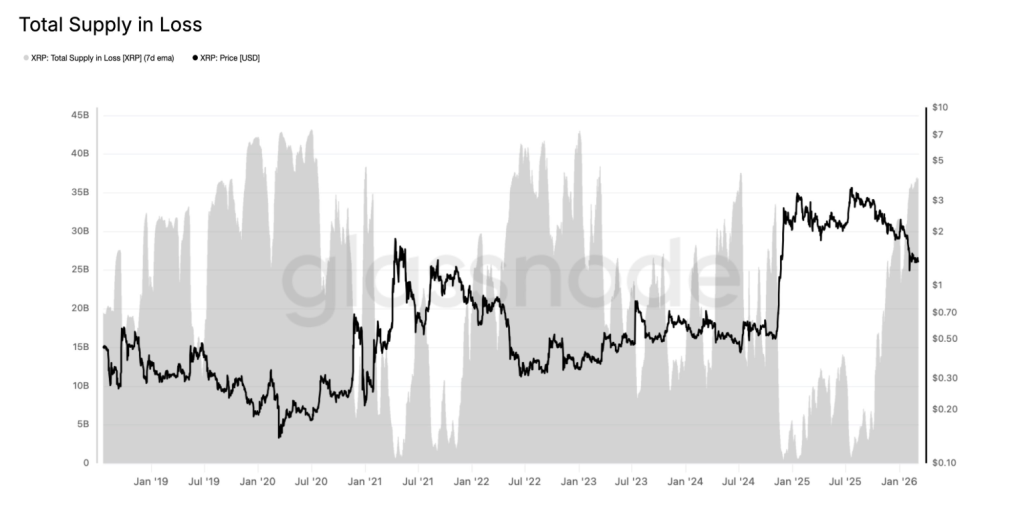
However, historically such phases can also signal late-stage corrections, where weaker hands exit positions while longer-term investors gradually accumulate. In previous market cycles, spikes in underwater supply have often appeared near major market turning points, though such signals rarely play out immediately.
Alongside rising unrealized losses, trading activity across major exchanges has also begun to slow. XRP Volume Z-Score on Binance shows the indicator recently falling to around -1.16. The Volume Z-Score compares current trading activity with historical averages, helping analysts identify abnormal spikes or declines in market participation.
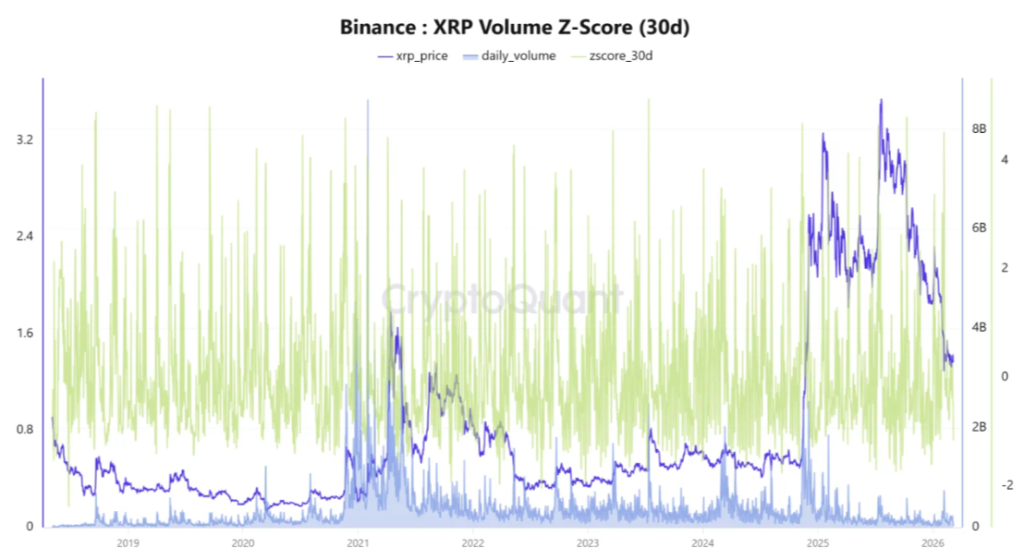
A negative reading suggests that current trading volumes are below the historical norm, indicating reduced speculative activity in the market.
Periods of declining trading volume often occur when markets enter consolidation phases, where traders temporarily step back and liquidity begins to thin. Historically, these quieter market conditions have sometimes preceded larger volatility moves once momentum returns.
XRP price is currently trading within a descending channel pattern, reflecting the broader consolidation phase underway. For the past few sessions, XRP token price has been hovering near a key support region between $1.30 and $1.35, which has recently acted as a short-term demand zone.
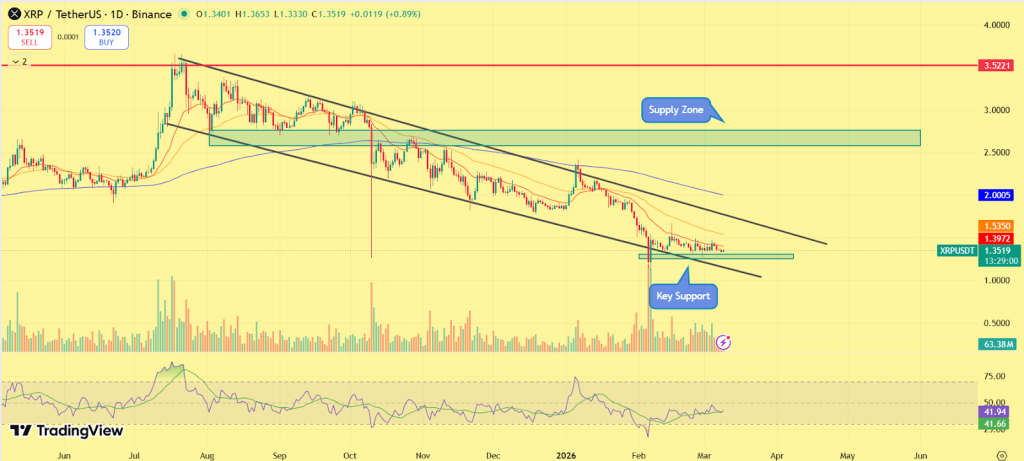
At the same time, a descending resistance trendline continues to cap upside attempts, keeping the broader corrective structure intact. If buyers manage to break above this resistance line, analysts suggest the next potential resistance area could emerge near $2, followed by a broader supply region between $2.8 and $3. However, failure to maintain the current support level could expose XRP price to additional downside pressure, particularly if weakness across the broader crypto market continues.
Although XRP price currently appears relatively stable, underlying market data suggests that pressure may be building beneath the surface. Rising unrealized losses, declining trading momentum, and tightening technical structure all point toward a market entering an important decision phase. Whether this leads to renewed downside pressure or a broader recovery will likely depend on how XRP price reacts around its current support levels in the coming sessions.
The post Nasdaq Partners with Kraken to Bring Stocks On-Chain appeared first on Coinpedia Fintech News
Nasdaq has partnered with Kraken’s parent company to develop tokenized shares that mirror traditional stocks, using the same identifiers and offering full shareholder rights such as proxy voting. Settlement will run through existing systems, with blockchain handling ownership records. Pending SEC approval, Nasdaq targets a 2027 launch, starting with listed firms. Kraken will distribute the tokens to customers in Europe and other regions through its xStocks platform, aiming to deliver round-the-clock access and faster settlement.
The post Oil Hits $100 as War Risks Rise—Where Are Investors Moving: Gold or Bitcoin? appeared first on Coinpedia Fintech News
Global markets are once again reacting to rising energy prices as Brent Crude Oil moves higher amid geopolitical tensions and supply concerns. Historically, sudden spikes in oil prices have often appeared during periods of global uncertainty, forcing investors to reconsider where they allocate capital.
A similar situation was seen in November 2022, when oil prices surged above $100 per barrel. That period coincided with the bottom of the 2022 crypto bear market, which also saw extremely high trading volumes across digital assets. The surge in energy prices reflected broader macro stress across global markets.
Now, with oil prices once again showing strength, investors are closely watching how different asset classes react to the renewed uncertainty, specifically the Bitcoin (BTC) price.
Rising oil prices are once again creating volatility across traditional financial markets. When crude approaches the $100 per barrel level, investors typically become cautious toward equities as higher energy costs increase production and transportation expenses for companies. Major indices such as the S&P 500 are currently trading near 5,100, while the NASDAQ Composite is hovering around 16,000, both showing increased sensitivity to macroeconomic developments and geopolitical risks.
At the same time, precious metals are witnessing strong investor demand. Gold has been trading around $5,000–$5,150 per ounce in recent sessions after reaching record highs earlier this year. Meanwhile, Silver has also surged significantly, trading roughly in the $85–$100 per ounce range as investors look for defensive assets during periods of global uncertainty. Precious metals often benefit during such macro conditions, as they are widely considered reliable stores of value when inflation risks and geopolitical tensions rise.
Recent market trends suggest that broader macroeconomic shifts could again start influencing the crypto market. Historically, movements in energy markets—especially crude oil—have often coincided with major turning points in Bitcoin’s price cycle.
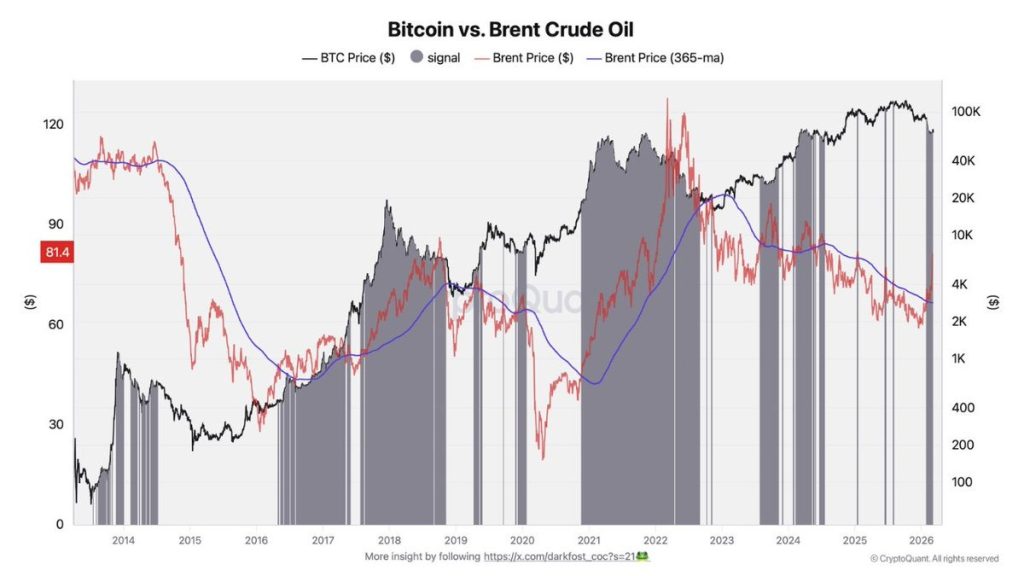
As seen in the chart above, several periods of declining oil prices, particularly around 2015, 2020, and after the 2022 peak, were followed by strong upward moves in Bitcoin. This pattern suggests that changes in energy markets may reflect wider shifts in global liquidity and economic sentiment, which eventually impact risk assets like Bitcoin.
While oil prices do not directly determine Bitcoin’s movement, the chart provides supporting evidence that macro trends in energy markets can act as an early signal of changing conditions that may influence Bitcoin’s next phase.
With oil prices approaching the $100 per barrel mark, market volatility across asset classes is likely to remain elevated. If risk sentiment weakens further, major indices like the S&P 500 could face pressure below the 5,000 level, while defensive assets may continue attracting capital. In such a scenario, gold could remain supported above the $2,100 zone, with silver holding above $24–$25, as investors look for stability during geopolitical uncertainty.
For Bitcoin, the key levels to watch remain around $60,000 on the downside and $70,000 on the upside. A sustained break below $60,000 could trigger further selling pressure as liquidity tightens, while a move above $70,000 may signal renewed bullish momentum. As oil-driven macro uncertainty rises, Bitcoin’s price action around these levels could reveal whether investors continue treating it as a risk asset or begin positioning it as an alternative hedge.
The post Solana Beat Ethereum on RWA Holders for the First Time. Here’s the Catch. appeared first on Coinpedia Fintech News
For the first time ever, Solana overtook Ethereum in the number of wallets holding tokenized real-world assets – 155,064 versus 153,592, according to RWA.xyz.
The news went viral all over X, but is the data as exciting? Depends on how (and what) you’re reading.
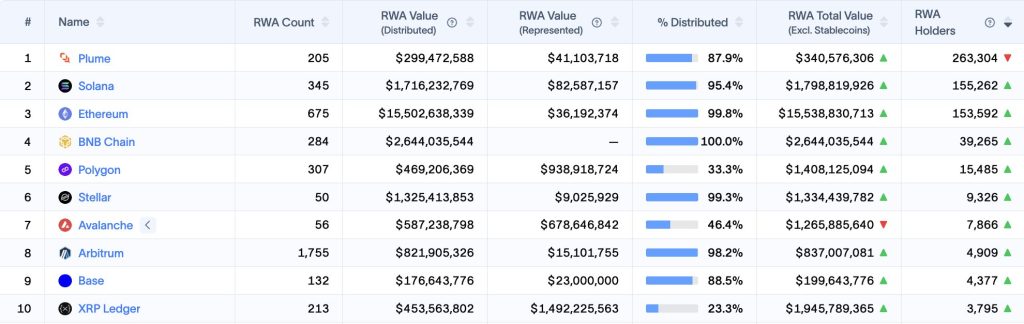
The lead lasted hours. It has since reversed: Ethereum now sits at 153,576 holders, Solana at 146,674.
Here’s what the wallet count doesn’t tell you.
Ethereum holds $15.16 billion in tokenized RWAs. Solana holds $1.71 billion. That’s nearly nine times more capital on Ethereum and it’s institutional money: BlackRock, Fidelity, tokenized Treasury products built for Wall Street.
Solana won on participation, briefly. Ethereum never stopped winning on capital. These are two different races, and the fact that the lead snapped back within hours shows how anchored institutional money is on Ethereum.
What pulled Solana’s wallet count past Ethereum? Retail.
The mid-2025 launch of tokenized xStock equities – fractional Tesla and Nvidia shares – brought everyday traders onto the chain, drawn by cheap fees and fast settlement.
That wave pushed Solana’s wallet count past Ethereum’s for the first time, but it didn’t hold.
While the wallet flip is exciting, the infrastructure story is bigger.
Solana’s RWA market cap has surged nearly 10x over the past year. Tokenized gold transfer volume on Solana hit over $280 million this week alone. Stablecoin transaction volume reached $650 billion in February, which is the highest figure recorded on any blockchain that month.
Ondo Finance is live on Solana. Western Union chose Solana to build its USDPT stablecoin, redeemable at 360,000+ locations across 200 countries.
Shawn Chan, CEO of SGB App, put it: “To run stablecoins, you need stable rails. You need a network that is secure, efficient, fast, and cheap. You can’t find anyone better than Solana.”
SOL is currently trading around $83, within the $80-$90 range it has held this week. Technical indicators lean bearish in the short term, but Exceed Finance points to $94 as the level to watch for a potential reversal.
The memecoin era on Solana is cooling, but the payments and RWA era is arriving.

The post Trump Says U.S. Will Decide When Iran War Ends, What It Means for Crypto Market? appeared first on Coinpedia Fintech News
The global market is on high alert after the latest statement from U.S. President Donald Trump, who said he will decide when iran war ends. The comments have added a new layer of uncertainty to already volatile markets, with investors now asking how the situation could influence cryptocurrencies such as Bitcoin, Ethereum, and XRP.
During a brief phone interview, when asked about the timeline for the ongoing U.S.-Israel and Iran war, Donald Trump said the United States would have the “final say” on when the military operation against Iran ends.
“We’ll make final call to end operation ‘at right time’; says he and PM ‘worked together’ against Islamic Republic: ‘We’ve destroyed a country that would have destroyed Israel.”
When asked if he alone would decide when the war ends or if Benjamin Netanyahu would also have a say, Trump said the decision would be a “mutual” one taken together with the Israeli Prime Minister.
Lastly, when asked if Israel could continue the war even after the U.S. stops its strikes, Trump said he believes Israel would not need to continue the war once the U.S. halts its attacks.
Since the war began, the crypto market has lost billions in value. Bitcoin has dropped from around $79K to nearly $68K.
Despite the tension, the market has not seen major panic selling. Further CoinGlass data shows 99,443 traders liquidated in 24 hours, with total losses reaching $396.55 million
Bitcoin accounted for around $150 million of those liquidations, while Ethereum saw $80.8 million and Solana about $18.8 million.
If the conflict between the U.S., Israel, and Iran continues, Bitcoin could face a period of higher volatility. Keeping these factors in mind, crypto trader Captain Faibik believes Bitcoin may be preparing for another bearish rally.
After a sharp drop, Bitcoin started moving inside a small rising channel. This suggests the market is taking a short pause while the overall trend still looks weak.
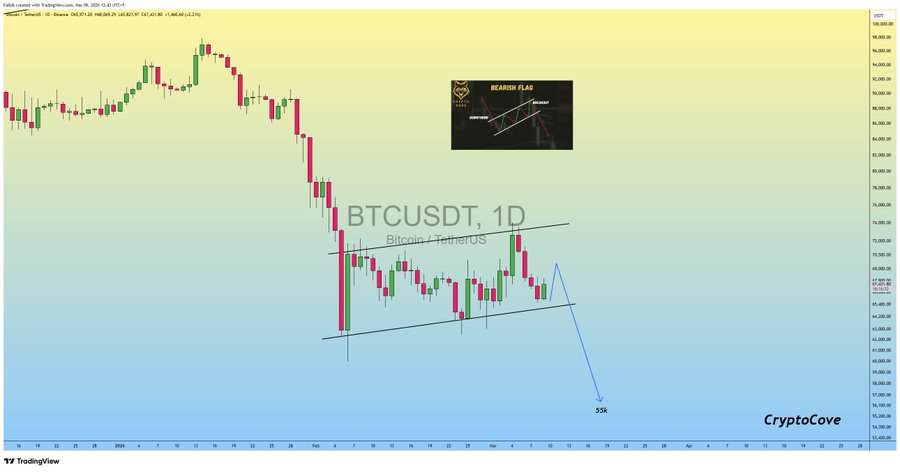
If Bitcoin breaks below the channel support, the bearish pattern could confirm further downside movement. In that case, Faibik expects the price to fall toward the $55,000 level.
However, if Bitcoin breaks above the upper trendline, the bearish setup weakens, and the potential price drop may delay
Stay ahead with breaking news, expert analysis, and real-time updates on the latest trends in Bitcoin, altcoins, DeFi, NFTs, and more.
Geopolitical tensions often increase market volatility. If the conflict escalates, Bitcoin and major altcoins may see sharp price swings as investors react to global risk.
Rising geopolitical uncertainty pushed investors toward safer assets. This led to liquidations in crypto derivatives, causing Bitcoin’s price to fall sharply.
Despite volatility, many investors are holding positions, suggesting cautious sentiment rather than panic as traders wait for clearer geopolitical signals.

The post Coinbase Brings Regulated Futures to 26 European Countries: Here’s What You Get appeared first on Coinpedia Fintech News
European crypto traders have spent years navigating unregulated platforms just to access derivatives. Coinbase just changed that.
Coinbase has rolled out regulated futures trading across 26 European countries through Coinbase Advanced, now offering crypto derivatives under a MiFID-regulated entity across the region for the first time.
Germany, France, and the Netherlands are among the countries now live.
The product lineup includes Bitcoin and Solana futures, equity index futures, including the Mag7 + Crypto Equity Index, and two contract types: perpetual-style futures with 5-year expiries and dated contracts with monthly or quarterly settlement.
Leverage goes up to 10x on BTC, ETH, and equity indices. Fees start at 0.02% per contract. Funding is via EUR or USDC.
Access is through the Coinbase Advanced platform – the same interface rising in search volume this week as traders compare options against Binance and Kraken.
European crypto derivatives have historically lived on offshore, unregulated platforms. Regulatory pressure is now closing that window, with MiCA’s full enforcement deadline approaching in mid-2026.
The launch is offered through Coinbase Financial Services Europe Ltd., operating under CySEC License 374/19, giving traders regulatory protection.
This is a direct execution of Brian Armstrong’s new year vow: “Grow the everything exchange globally -crypto, equities, prediction markets, commodities – across spot, futures, and options.”
Here are our top priorities for 2026 at Coinbase:
— Brian Armstrong (@brian_armstrong) January 1, 2026
1) Grow the everything exchange globally (crypto, equities, prediction markets, commodities – across spot, futures, and options)
2) Scale stablecoins and payments
3) Bring the world onchain through @CoinbaseDev, @base chain,…
Coinbase called the European futures launch “a major step in our push to build an exchange for everything.”
Eligible users can access futures through the Derivatives tab on Coinbase Advanced, web or mobile. Onboarding requires an eligibility check, KYC verification, and a funded account.
The platform is progressively rolling out access, so not all 26 countries will go live simultaneously.
Whether that’s enough to pull volume away from Binance and Bybit remains to be seen.
Stay ahead with breaking news, expert analysis, and real-time updates on the latest trends in Bitcoin, altcoins, DeFi, NFTs, and more.
Coinbase now offers regulated crypto futures through Coinbase Advanced in 26 European countries, allowing traders to access derivatives under a MiFID-licensed entity.
The launch includes Bitcoin and Solana futures, plus equity index futures like the Mag7 + Crypto Equity Index, giving traders more diversified derivatives.
Eligible users can trade through the Derivatives tab on Coinbase Advanced after completing KYC verification and funding their account with EUR or USDC.


The post Is Dogecoin Dead? Why is the DOGE Price Stuck Below $0.1? appeared first on Coinpedia Fintech News
Dogecoin continues to remain under pressure as the price struggles to reclaim the crucial $0.10 level. Over the past few weeks, DOGE has been trading within a narrow range, showing clear signs of consolidation. Although buyers are attempting to defend the lower support levels, the bullish momentum appears limited.
At present, DOGE price is trading close to $0.09, just above a key support zone between $0.088 and $0.090. This region has acted as a strong demand zone in recent weeks, where buyers have repeatedly stepped in to prevent further downside.
However, despite multiple recovery attempts, the price has failed to reclaim the $0.10 level, which has now turned into a psychological resistance for the token. Will this threshold be broken, or will the DOGE price remain consolidated below this range?
Looking at the daily chart, Dogecoin has been forming lower highs since January, indicating that the broader market structure still leans bearish. A descending resistance trendline has been consistently rejecting the price, preventing any strong recovery move.
From a technical perspective, a few levels are currently crucial for Dogecoin’s next move.
On the upside, the immediate resistance lies near $0.102. If the price manages to break and sustain above this level, it could open the doors for a move towards the next resistance around $0.115.
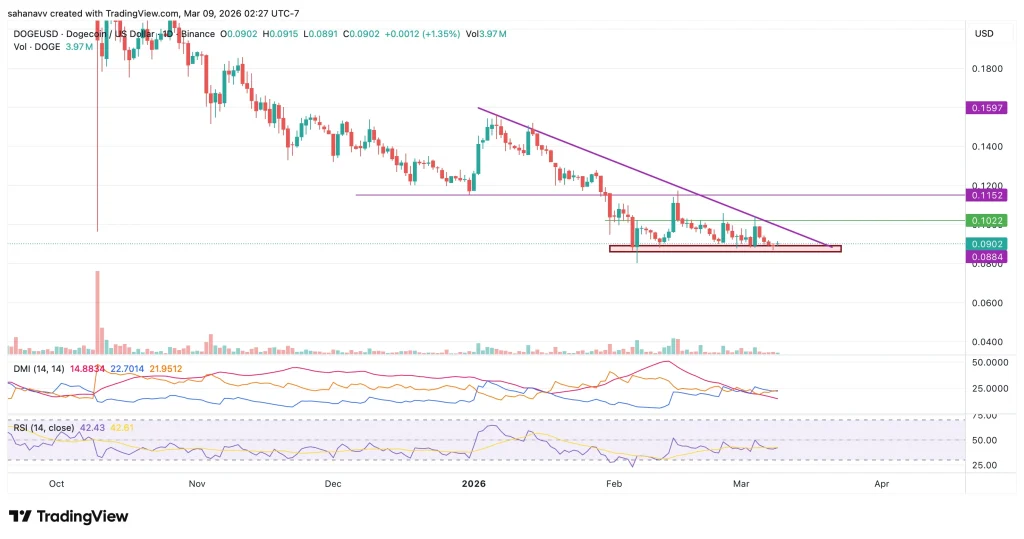
The technical indicators also suggest that the market currently lacks strong momentum. The Relative Strength Index (RSI) is hovering around the 42–43 level, which indicates neutral momentum. The indicator is neither in the oversold zone nor showing signs of strong bullish strength. Instead, it is moving sideways, which aligns with the consolidation visible on the chart.
At the same time, the Directional Movement Index (DMI) shows that bearish pressure is slowly declining, but bullish strength has not yet picked up significantly. The ADX indicator also remains relatively low, suggesting that the market currently lacks a strong trend.
On the downside, the $0.088 support zone remains extremely important. This level has been tested several times already, and repeated tests generally weaken a support zone. If the price breaks below this level, DOGE may see further downside towards $0.082 and possibly $0.075.
If bulls manage to push the price above the descending resistance trendline and reclaim the $0.10 level, Dogecoin could attempt a recovery towards $0.115, followed by a potential move towards $0.14. However, if the $0.088 support fails, the bearish pressure could increase, potentially pushing the price towards $0.082 or even $0.075 in the short term.
For now, Dogecoin appears to be stuck between strong support and persistent resistance. While buyers continue to defend the lower levels, the lack of strong momentum is preventing a bullish breakout. Until DOGE reclaims $0.10, the price may remain within this consolidation range.
On the other hand, as DOGE continues to move sideways near the support zone, the volume has gradually reduced. Lower volume generally indicates reduced market participation. It also suggests that traders may be waiting for a clearer direction before entering the market. Interestingly, such phases of low volatility often precede a stronger price move once the market has decided on its direction.
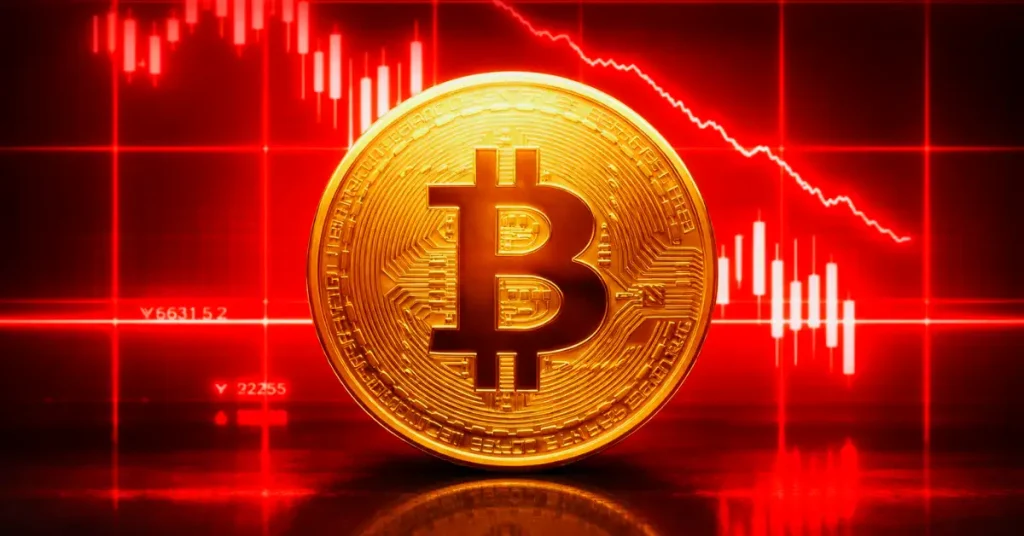
The post Bitcoin Exchange Reserves Drop to 2019 Levels: Is a BTC Supply Shock Coming? appeared first on Coinpedia Fintech News
Bitcoin exchange reserves drop to their lowest levels in nearly six years, and the shift could quietly reshape the market’s supply dynamics. Recent on-chain data indicates that the amount of BTC held on centralized exchanges has fallen back to levels last seen in 2019, highlighting a significant structural change in how investors are choosing to hold the asset.
While price volatility often dominates market headlines, deeper indicators such as exchange reserves can reveal important changes in supply and liquidity. With institutional demand rising and more investors opting for self-custody, the pool of Bitcoin available for active trading may be shrinking. This development has now sparked a key question across the crypto market: could declining exchange reserves become the next bullish catalyst for Bitcoin price?
According to on-chain data, Bitcoin exchange reserves have declined to roughly 2.7 million BTC, marking the lowest level since 2019. The trend has been unfolding gradually over several years but accelerated significantly following the collapse of centralized platforms during the 2022 market crisis. After the FTX collapse, investors rushed to withdraw funds from exchanges and move their Bitcoin into private wallets. In November 2022 alone, more than 325,000 BTC left exchange reserves, marking one of the largest single-month outflows in Bitcoin’s history.
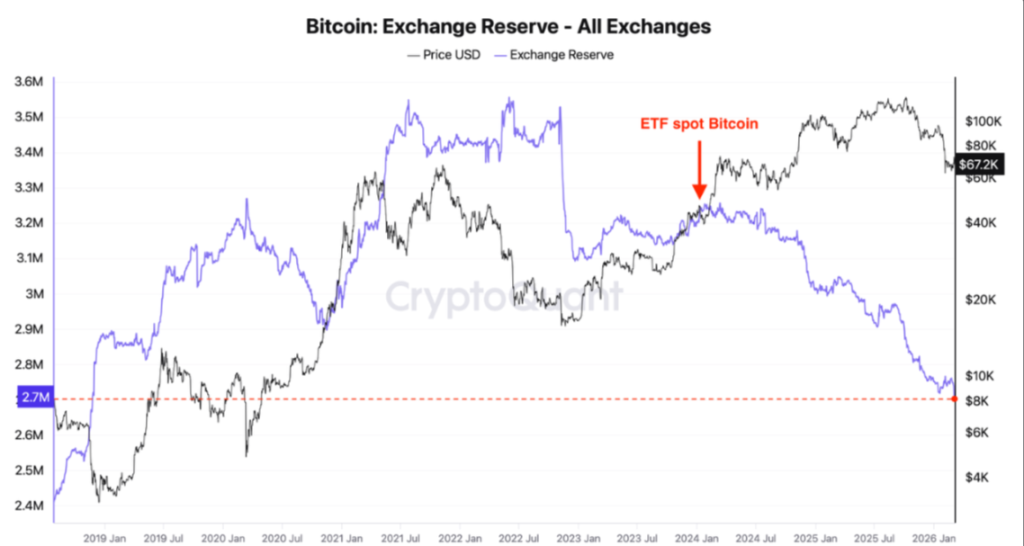
Even years after that event, the downward trend has continued, suggesting a long-term shift toward self-custody and long-term holding strategies.
Among centralized exchanges, Binance currently holds around 20% of all exchange-based BTC reserves, making it the largest retail liquidity hub. Meanwhile, Coinbase Advanced reportedly holds nearly 800,000 BTC, although this is roughly 200,000 BTC lower than levels seen in mid-2025.
Another key factor behind why Bitcoin exchange reserves drop is the rapid rise of spot Bitcoin ETFs. Since their launch in early 2024, institutional investors have been steadily accumulating Bitcoin through regulated investment products. At the time ETFs entered the market, exchange reserves were still above 3.2 million BTC. Today, these funds collectively hold roughly 1.3 million BTC, representing about 6–7% of Bitcoin’s circulating supply.
Because ETF holdings are typically stored with custodians rather than exchanges, this Bitcoin is effectively removed from the liquid trading supply.
As ETF inflows continue, the amount of Bitcoin available on exchanges may keep declining.
Corporate treasury strategies are also contributing to the trend where Bitcoin exchange reserves drop. Over the past few years, several companies have adopted Bitcoin as a strategic reserve asset, allocating BTC to their balance sheets as a hedge against currency debasement and macroeconomic uncertainty. Collectively, corporate treasury entities now hold around 1.1 million BTC, which accounts for roughly 5% of the total circulating supply.
Unlike short-term traders, these organizations typically follow long-term accumulation strategies, meaning their Bitcoin is unlikely to return to exchanges anytime soon. This further reduces the liquid supply available for active market trading.
When Bitcoin exchange reserves drop, it often signals tightening supply conditions across the market. With more BTC moving into long-term storage, ETFs, and corporate treasuries, fewer coins remain available for immediate trading on exchanges.
Historically, declining exchange reserves have sometimes preceded supply-driven price expansions, particularly when demand simultaneously increases. While the impact may not appear immediately, analysts believe the ongoing reduction in exchange balances could play an important role in shaping Bitcoin’s next market cycle.

The post Has Gold Price Topped? Whale Wallets Cash Out $40M in Tether Gold and PAXG appeared first on Coinpedia Fintech News
Gold has been one of the strongest trades of the year. But on-chain data suggests some of the biggest players may be walking out the door.
On-chain analytics platform Lookonchain flagged that two whale wallets offloaded roughly $40 million worth of tokenized gold in just 48 hours, and both walked away with significant profit.
Two wallets – 0x8C08 and 0xdfcA, flagged by Lookonchain as belonging to the same entity – sold 5,250 XAUT at $5,125 and 560 PAXG at $5,173 over the past two days, taking a combined profit of $5.32 million. A third wallet, 0x8844, followed up six hours ago with a sale of 1,934 XAUT at $5,037, adding another $1.74 million to the tally.
That’s roughly $7 million in realized profit pulled from tokenized gold in under 48 hours, from wallets that knew exactly when to get in and aren’t waiting around to find out if the top is in.
Has #gold already topped?
— Lookonchain (@lookonchain) March 9, 2026
We noticed two whales have taken profits and sold about $40M worth of #gold in the past 2 days.
0x8C08 and 0xdfcA (belonging to the same whale) sold 5,250 $XAUT($26.91M) at $5,125 and 560 $PAXG ($2.9M) at $5,173 in the past 2 days, making a profit of… pic.twitter.com/wLmDgtvzMf
Gold’s recent run was fueled in part by safe-haven demand following U.S. and Israeli strikes on Iran – a conflict that has since escalated, sending oil past $100 a barrel and the dollar higher, which is now actually working against gold.
Gold spot is currently trading at $5,118, down over 1% on the day and sitting well below its 52-week high of $5,595.
What makes this week particularly loaded is Wednesday’s U.S. inflation data.
Headline CPI is expected to rise 0.3% month-on-month, with year-on-year inflation projected at 2.4%. A hotter-than-expected print would likely push yields higher and strengthen the dollar, historically a headwind for both gold and risk assets like crypto.
And there’s reason to watch closely: recent ISM Prices Paid data came in significantly hotter than expected, suggesting input cost pressure may already be building.
For the crypto market, on-chain whale behavior around tokenized gold is worth tracking as a macro signal.
When large wallets rotate out of tether gold and PAXG, capital has to go somewhere. Whether that’s back into Bitcoin, stablecoins, stocks, or simply sitting on the sidelines ahead of macro data, the next few days will likely tell that story.
Gold’s reflexive rally was built on real structural drivers. But markets don’t move in straight lines, and $40 million in profit-taking from the same asset class, in the same 48-hour window, is rarely a coincidence.
Stay ahead with breaking news, expert analysis, and real-time updates on the latest trends in Bitcoin, altcoins, DeFi, NFTs, and more.
Some whales are locking in profits after gold’s strong rally. Large sell-offs often happen when prices surge and traders expect short-term volatility.
On-chain data shows whales sold about $40 million worth of XAUT and PAXG within 48 hours, realizing roughly $7 million in profits.
Possibly. When large investors exit tokenized gold, that capital may rotate into Bitcoin, stablecoins, or other assets depending on market sentiment.
The post Coinbase Launches Regulated Futures Trading for Europe appeared first on Coinpedia Fintech News
Coinbase has launched regulated futures trading for its Advanced users in 26 European countries, including Germany, France, and the Netherlands, giving European traders access to compliant derivatives on a major global exchange. The products include Bitcoin, Solana, and equity index futures such as the Mag7 + Crypto index, with a mix of perpetual‑style contracts that expire in five years and traditional term futures. Select contracts offer up to 10x leverage and competitive fees, aiming to provide more regulated options in a market where many previously relied on unregulated platforms.
The post HIP-3 Hits Record $720M Weekend Surge appeared first on Coinpedia Fintech News
Hyperliquid’s HIP-3 protocol delivered its biggest weekend yet on Sunday, reaching a record $720 million in single day trading volume. Most of the activity came from strong participation on trade xyz. The spike followed growing geopolitical tensions and a sharp rise in crude oil prices, which increased market volatility. As price swings intensified, traders turned to the platform to seize short term opportunities, pushing weekend volumes to an all time high and signaling stronger engagement during uncertain global conditions.


Researchers found that some workers using AI in their roles reported a “mental hangover” with a “fog” that caused difficulty focusing.

The post Global Cryptocurrency Market Could Reach $5.5 Billion by 2033 appeared first on Coinpedia Fintech News
The global Cryptocurrency market is projected to grow from $2.3 billion in 2023 to $5.5 billion by 2033, according to a report by Allied Market Research. The industry is expected to expand at a 7.5% annual growth rate during the period. Rising demand for transparent payment systems and growing cross-border remittances are driving adoption. Among digital assets, major coins include Bitcoin, Ethereum, Tether, Binance Coin, Cardano, and XRP. The report also notes that the Asia-Pacific region currently leads the market and is expected to see the fastest growth due to increasing crypto adoption and expanding blockchain-based payment solutions.

The post Strait of Hormuz Crisis Sends Oil Price to $110 While Bitcoin Price Holds Near $67K appeared first on Coinpedia Fintech News
The ongoing U.S.-Israel and Iran war is starting to affect global markets after the Strait of Hormuz closure triggers a historic oil crisis. Crude oil prices jumped 17% to nearly $110. Because of this spike, veteran strategist Ed Yardeni has increased the chances of a U.S. stock market crash to 35%.
Meanwhile, Bitcoin is showing surprising strength, holding near $67K despite rising tensions.
Today, crude oil prices jumped 17% in a day, reaching their highest level since July 2022, as tensions in the Middle East increased. The rally followed a series of military escalations in the Middle East involving the U.S, Israel, and Iran, raising fears of a major supply shock.
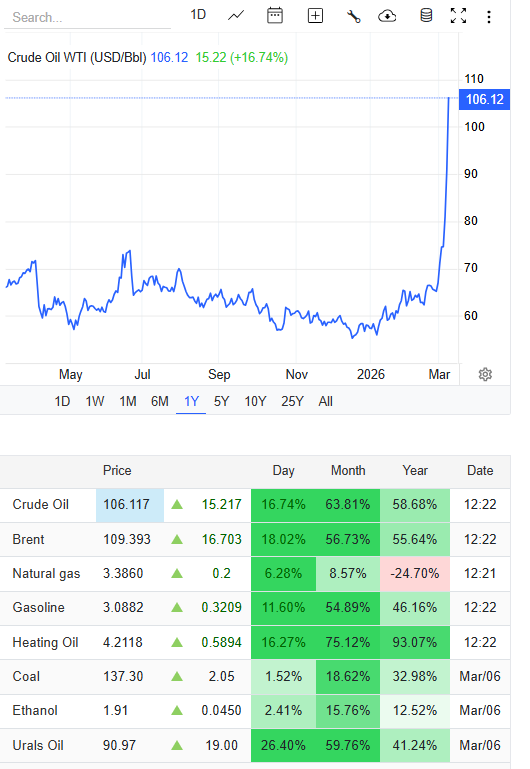
At the same time, oil supply has dropped across the region. An Iranian drone strike forced Saudi Aramco to shut its Ras Tanura Refinery. Oil output in Iraq also fell sharply, while Kuwait Petroleum Corporation reduced shipments.
Meanwhile, the United Arab Emirates is managing offshore production to handle storage limits, while Bahrain stopped some shipments after a refinery fire.
These supply disruptions have pushed global oil prices sharply higher.
As the Strait of Hormuz closure triggers a historic oil crisis, financial analysts are warning about bigger economic risks. Veteran market strategist Ed Yardeni raised the probability of a U.S. market crash to 35%, up from 20% earlier this year.
At the same time, he dropped the chances of a strong crypto market rally to just 5%.
According to Yardeni, the U.S. economy is facing two problems: rising inflation from high oil prices and slowing economic growth. This could put pressure on stocks and cryptocurrencies.
Odd of this crash can be seen in the Asian markets too. Japan’s Nikkei 225 index fell over 6%, while South Korea’s Kospi fell nearly 8%
Meanwhile, traders betting on Polymarket see a 72% chance that oil could reach $120 by the end of March.
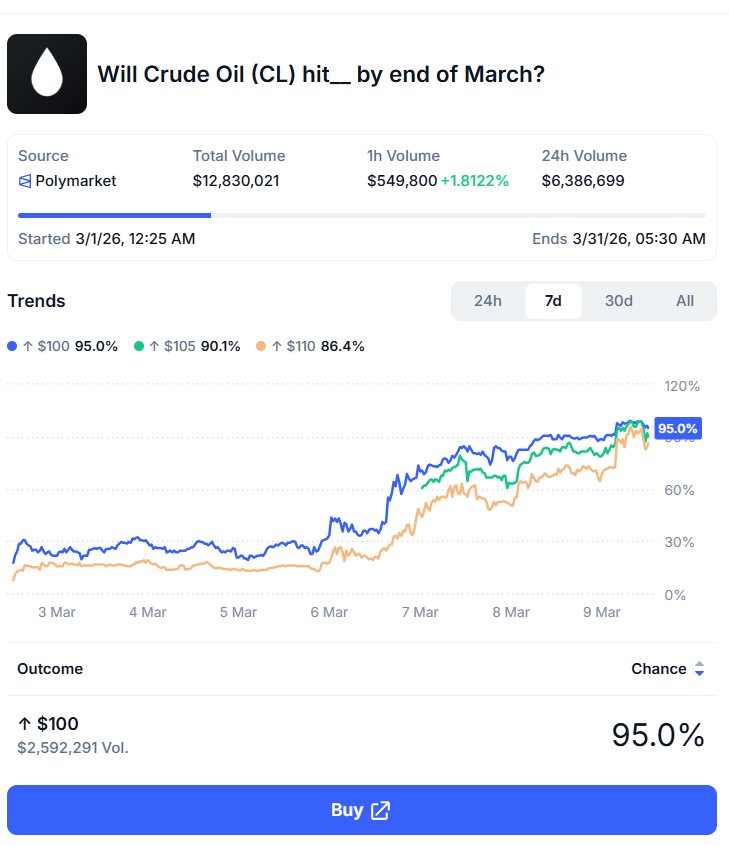
Despite the market chaos, the Bitcoin price stayed stable near $67,278, rising about 1% in the last 24 hours.
Bitcoin has often fallen alongside stocks during major risk-off events, despite its reputation as a hedge. However, analysts warn that if the Strait of Hormuz Closure Triggers Historic Oil Crisis for a long time, crypto markets could face pressure, and Bitcoin may drop toward the $60K level.
Other major cryptocurrencies also saw small gains. Ethereum rose to around $2,007, XRP moved to $1.35, Solana climbed to $84, and Dogecoin increased to about $0.091.
The post Next Crypto to Explode: Solana ETFs Pull $1.5 Billion in Inflows Despite 57% Token Drop While Pepeto Could Be the Biggest Launch of 2026 appeared first on Coinpedia Fintech News
Institutional money keeps flowing into crypto even as prices drop. Solana ETFs have now accumulated $1.5 billion in inflows despite the token falling 57% from its highs, proving that smart capital builds positions during fear, not after the recovery is obvious.
The next crypto to explode is not always the token that institutions are buying at scale, sometimes it is the presale entry at six decimal zeros where the listing math delivers the kind of returns that $1.5 billion in Solana ETF inflows cannot produce, and Pepeto with $7.5M raised and exchange infrastructure approaching launch is the 300x setup that could become the biggest story of 2026.
CoinDesk reported Solana ETFs have accumulated approximately $1.5 billion in cumulative inflows since launch despite the token falling 57%, while CoinMarketCap confirmed institutional demand continues even as SOL trades near $87 with retail interest fading.
When institutions keep buying a token that dropped 57%, it tells you the accumulation phase is real, and the next crypto to explode captures the recovery before the crowd sees it.
The market demand around the next crypto to explode has reached a point where only projects with real conviction survive. With Solana ETFs pulling $1.5 billion while the token sits 57% below its high, institutions are telling you the accumulation phase is now, and the next crypto to explode captures that wave from the lowest possible entry.
Pepeto is one of the few projects that keeps raising capital during the fear. The cross chain bridge connecting Ethereum, BNB Chain, and Solana routes assets instantly. The zero tax engine keeps every trade whole. The risk scoring system checks contracts before capital commits. The SolidProof audit backs every line of code, and the cofounder of the Pepe ecosystem who built a token to $7 billion leads the team.
The 300x math requires only the listing valuation exchange tokens with real infrastructure routinely achieve. Over $7.5M raised while SOL dropped 57% and ETF money kept flowing in, proving that the accumulation phase creates the biggest returns for the entries that are cheapest during the fear.
The next crypto to explode does not depend on $1.5 billion in ETF inflows to create demand, it creates its own demand through exchange tools that work across three chains, and the 209% APY staking compounds for wallets positioned while the Binance listing approaches on a timeline that does not wait for Solana’s recovery.
IPO Genie positions itself as a gateway to pre IPO token offerings.
Without exchange infrastructure or verified audits, the model depends on deal flow regulators could shut down. The next crypto to explode has real tools and proven leadership.
Maxi Doge targets the degen community with social features.
Without exchange tools or revenue generation, the next crypto to explode position depends on utility that survives consolidation, not meme sentiment.
Institutions just poured $1.5 billion into Solana ETFs while the token sat 57% below its high. They did not wait for the recovery to start, they bought during the fear because that is how every major return in financial history was built. You can do the same thing right now, but smarter.
SOL at $40 billion needs the entire market to recover before those ETF buyers see meaningful returns. Pepeto at six decimal zeros needs one exchange listing.
The $7 billion cofounder is building it, $7.5M in presale capital proves the conviction is real, and the 209% APY staking means your position grows every single day the institutions spend waiting for SOL to climb back.
Visit the Pepeto official website and enter the presale before the institutions finish accumulating and the retail crowd that waited too long discovers the presale closed while they were watching from the sidelines. Either buy now or buying later from them at the price they will decide after launch.
Click To Visit Pepeto Website To Enter The Presale
What is the next crypto to explode in 2026?
The next crypto to explode is Pepeto with $7.5M raised, 209% APY, and 300x exchange infrastructure that delivers returns during accumulation. Visit the Pepeto official website.
Why do Solana ETFs keep getting inflows while SOL drops?
Institutions build positions during fear, and Solana ETFs pulling $1.5B despite a 57% drop confirms the accumulation phase, while Pepeto captures the wave from presale pricing.
Is it too late to buy the next crypto to explode?
The presale is still live with 209% APY and exchange infrastructure approaching launch, making now the accumulation window before the Binance listing reprices the entry permanently.
The post Crypto News Today: Aster DEX Delists OWLUSDT as Owlto Finance Token Struggles appeared first on Coinpedia Fintech News
Decentralized derivatives platform Aster DEX has officially confirmed that it will delist the OWLUSDT perpetual contract, urging traders to close their positions before the removal deadline.
According to the platform’s latest announcement, the Owlto Finance /USDT trading pair will soon be removed as part of a scheduled delisting process. The move primarily affects traders currently holding open perpetual contract positions in the pair.
The exchange clarified that the decision only impacts the OWLUSDT contract, while all other trading pairs, assets, and services on the platform will continue operating as usual.
Before the contract is fully removed, Aster DEX will place the OWLUSDT pair into Reduce-Only mode.
This change will take effect on March 10, 2026, at 08:30 UTC. Once this mode is activated, traders will no longer be able to open new positions for the OWLUSDT perpetual contract.
However, users will still be able to reduce or fully close their existing positions during this phase. Reduce-Only mode is commonly implemented by exchanges before delisting events to give traders time to exit the market while preventing new exposure.
The platform confirmed that the official delisting of the OWLUSDT trading pair will occur at 09:00 UTC on March 10, 2026, just 30 minutes after the Reduce-Only phase begins.
Traders are strongly advised to close their positions and cancel any pending orders before the final deadline. The exchange warned that users who fail to manage their positions in time may experience automatic system actions once the pair is removed.
This step is part of the platform’s effort to ensure a smooth and orderly delisting process for all traders.
After the delisting time, Aster DEX will automatically handle any remaining trading activity related to the OWLUSDT pair.
If traders still hold open positions when the contract is removed, the system may close those positions automatically at the current market price. Additionally, any open orders associated with the pair will be automatically canceled by the platform.
Such measures are typically used by exchanges to minimize trading disruptions and protect users from unexpected market exposure once a contract is removed.
The delisting announcement comes amid weak performance for Owlto Finance (OWL) in the broader market.
At the time of reporting, OWL is trading around $0.008080 against USDT, reflecting a 3.92% gain over the past 24 hours. However, the token has experienced a broader downturn in recent weeks.
Over the past week, OWL has dropped 22.19%, while its monthly performance shows a decline of 24.62%. Every year, the token has suffered a steep 83.05% drop, highlighting the ongoing pressure in the market.
Despite the delisting of the OWLUSDT contract, Aster DEX confirmed that all other markets on the platform will remain unaffected, and users are encouraged to monitor official announcements for future updates.
Stay ahead with breaking news, expert analysis, and real-time updates on the latest trends in Bitcoin, altcoins, DeFi, NFTs, and more.
Aster DEX is removing the OWLUSDT perpetual contract as part of a scheduled delisting. The move helps manage platform markets and may reflect low demand or risk factors.
If positions remain open at delisting, Aster DEX may automatically close them at the current market price, and any pending orders linked to the pair will be canceled.
No, the delisting only affects the OWLUSDT perpetual contract. All other trading pairs, assets, and services on Aster DEX will continue operating normally.

The post Suspected North Korean Hackers Breach Crypto Cloud Systems appeared first on Coinpedia Fintech News
Security researchers at Ctrl Alt Intel say a threat group believed to be linked to North Korea carried out coordinated attacks against crypto companies by exploiting the React2Shell flaw and stealing AWS credentials to access cloud systems. The hackers reportedly stole private keys, configuration data, source code, and Docker images tied to staking platforms and exchange providers such as ChainUp, using infrastructure traced to a South Korea-based server, though attribution remains moderate and the source of the compromised credentials is still unknown.
The post G7 Considers Massive Oil Release as Prices Surge appeared first on Coinpedia Fintech News
G7 nations are considering a coordinated release of up to 400 million barrels of oil from strategic reserves to ease soaring energy prices. The move could be coordinated by the International Energy Agency. So far, three Group of Seven countries, including the United States, have shown support for the plan. U.S. officials believe a joint release of 300–400 million barrels could help stabilize markets. G7 countries currently hold about 1.2 billion barrels in reserves. Following the news, oil prices slipped back below $108 per barrel.

The post Best Crypto Presale: Pepeto Presale Accelerates And Investors Target Big Returns Soon – Blockdag News Today appeared first on Coinpedia Fintech News
Non traditional altcoin season cycles are coming according to Bitwise Investment Chief Matt Hougan, and that changes everything about how traders pick the best crypto presale.
Hougan told Paul Barron this week that the euphoric altcoin seasons where everything pumps are gone forever, and only altcoins tied to real businesses with clear solutions to everyday problems will rally in the next cycle.
The best crypto presale is no longer about which token has the loudest community, it is about which project built something the market actually needs, and Pepeto with $7.5M raised and exchange infrastructure that solves real trading problems across three blockchains is the 300x setup that fits exactly what Hougan describes.
CoinDesk reported Bitwise CIO Matt Hougan stated in an interview with Paul Barron that traditional altcoin seasons are over and only cryptos tied to real businesses will rally, while CoinMarketCap confirmed the altcoin season index reads 37 out of 100, firmly in Bitcoin season territory.
When the most respected institutional voice in crypto says only utility wins, the best crypto presale is the one that already built the tools the market needs.
The crypto market is volatile, and every swing can make or break a trade. That is why investors searching for the best crypto presale are chasing projects that deliver real tools, not roadmap promises. Pepeto has fast become the top choice because its exchange infrastructure converts raw utility into the kind of demand that survives every market condition.
The cross chain bridge connecting Ethereum, BNB Chain, and Solana routes assets instantly. The zero tax engine keeps every trade whole. The risk scoring system checks contracts before capital commits. The SolidProof audit backs every line of code, and the cofounder of the Pepe ecosystem who built a token to $7 billion leads the team.
The 300x math requires only the listing valuation exchange tokens with real infrastructure routinely achieve. Over $7.5M raised during consolidation, a clear signal that demand rises even when the altcoin season index sits at 37 and most presales bleed. Hougan says only utility wins, and the best crypto presale is the one that already has the tools live and ready for the moment the rotation arrives.
The Binance listing approaches, and 209% APY staking compounds daily for wallets already positioned. The best crypto presale does not wait for altseason to arrive, it builds the infrastructure altseason rewards, and every round that fills while the market debates whether utility or hype wins next is a round that closes permanently for the wallets that waited too long.
BlockDAG has raised $440M, but years of delays and leadership concerns, highlighted by investigator ZachXBT, continue to cast doubt on the project’s execution. Repeated timeline shifts raise questions about whether the technology can be delivered as promised.
Capital alone doesn’t guarantee results. In contrast, the strongest crypto presales focus on transparent leadership, verifiable development progress, and delivering real infrastructure on schedule rather than relying on prolonged hype.
Matt Hougan just handed you a filter. He said only utility survives the next cycle, everything else dies. So run every presale you are looking at through that filter right now.
Does it have working exchange tools across three blockchains? Does it have a cofounder who already built a $7 billion token? Did it raise $7.5M during a market where the altcoin season index reads 37 and most presales cannot raise $100K? If you answer yes to all three, you found Pepeto, and you found it while the altcoin season index still says Bitcoin season, which means the rotation has not started yet, and the wallets that are inside right now will be the ones the rotation rewards first.
Visit the Pepeto official website and enter the presale before Hougan’s prediction plays out and the utility filter erases every presale that does not pass it. Many missed Shiba Inu and other made Millions out of it, the difference is the vision and the early entry that Pepeto offers now.

Click To Visit Pepeto Website To Enter The Presale
What is the best crypto presale in 2026?
The best crypto presale is Pepeto with $7.5M raised, 209% APY, and exchange infrastructure that fits Bitwise’s thesis that only utility wins. Visit the Pepeto official website.
Is traditional altseason really over?
Bitwise CIO Matt Hougan says traditional altseasons are gone and only altcoins with real utility will rally, making the best crypto presale the one with working exchange tools.
Why is BlockDAG not the best crypto presale?
BlockDAG faces delays and leadership questions after $440M, while the best crypto presale is Pepeto with verified audits and infrastructure that shipped on time.


The post Kalshi Expands Into Brazil Through XP Partnership appeared first on Coinpedia Fintech News
Kalshi Inc. is making its first move outside the U.S. through a partnership with Brazil’s largest brokerage, XP Inc. The platform will introduce yes-or-no event contracts tied to Brazil’s economy, including inflation and interest rate changes. These contracts will be available to Kalshi’s U.S. investors and select XP users in Brazil. While Brazil lacks specific prediction market regulations, the finance ministry is monitoring developments and has begun early discussions on the sector’s growth.

The post Chainlink Price Forms Breakout Setup as Inflows Rise: What Charts Reveal appeared first on Coinpedia Fintech News
Chainlink price has been quietly building strength while much of the crypto market struggles to regain momentum. Despite broader uncertainty and volatility across major altcoins, LINK has managed to hold a critical support region while gradually tightening its price range. This type of compression often appears before major directional moves, and the latest on-chain data suggests investors are still positioning around the Chainlink ecosystem.
At the same time, LINK price is now trading close to a key descending resistance trendline, raising an important question for traders: Is Chainlink preparing for a breakout rally, or will the consolidation continue? A closer look at capital flows and the chart structure may provide the answer.
One of the most notable signals supporting the current Chainlink price outlook is the steady inflow of capital into LINK-related investment products. Recent data shows that Chainlink recorded approximately $935K in inflows on March 6, following $1.93 million in inflows the previous day.
This pushed the cumulative inflow figure to nearly $90.66 million, highlighting continued interest in the Chainlink ecosystem. What makes this development particularly important is that the inflows are occurring during a weak market environment, when many altcoins are experiencing capital outflows.
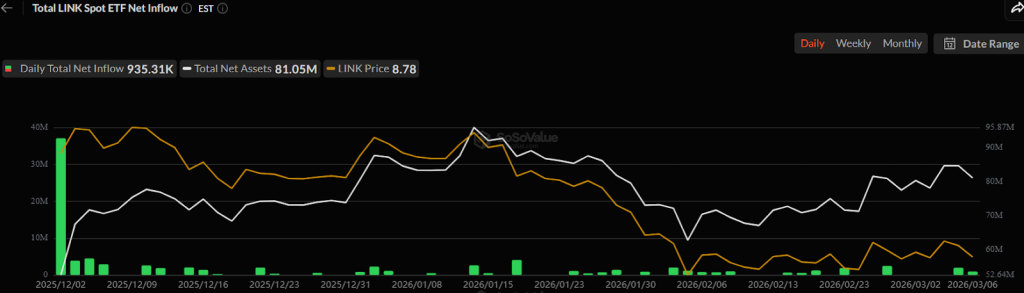
Sustained inflows during uncertain market conditions often indicate strategic accumulation, where investors gradually increase exposure while prices remain compressed. For Chainlink, which plays a critical role in providing decentralized oracle infrastructure, this continued capital flow reflects ongoing demand for its underlying technology.
Chainlink price is currently forming a tightening consolidation pattern. The chart shows LINK trading inside a structure defined by a descending resistance trendline and a stable support zone near $8.40–$8.60.
This pattern has produced a sequence of lower highs, but buyers continue defending the lower boundary of the range. Such compression typically indicates a buildup of market pressure, where volatility gradually contracts before a larger move unfolds. LINK price remains inside this structure, the stronger the eventual breakout tends to be.
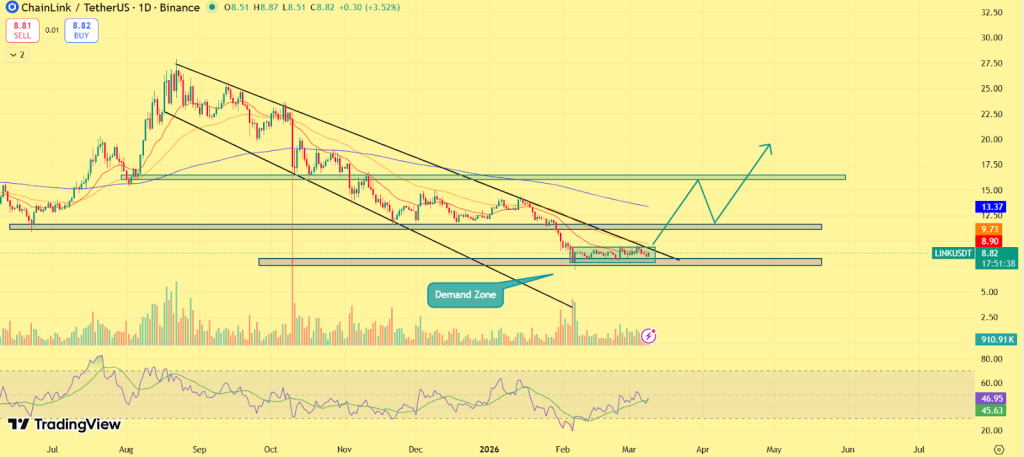
With LINK now approaching the upper boundary of the trendline, the next move could determine the short-term direction. The most important level for Chainlink price right now is the descending resistance trendline near $9.20–$9.40. A decisive breakout above this region could allow LINK to reclaim the $10 psychological level, which has previously acted as a strong supply zone. If bullish momentum accelerates, analysts are watching the $11–$12 region as the next major upside target.
This zone aligns with previous consolidation areas seen during earlier phases of the market cycle. On the downside, the $8.40–$8.60 demand zone remains the key support structure. Holding above this region keeps the current breakout setup intact, while a breakdown below it could delay the bullish scenario. For now, the structure suggests that Chainlink price is approaching an important inflection point.
Chainlink continues to show resilience in a market that remains uncertain. The combination of steady capital inflows and tightening price structure suggests that LINK may be entering a key decision phase. If buyers manage to push the token above its descending resistance trendline, the current consolidation could quickly transition into a stronger rally. Until then, the ongoing compression indicates that Chainlink price may be preparing for its next major move.
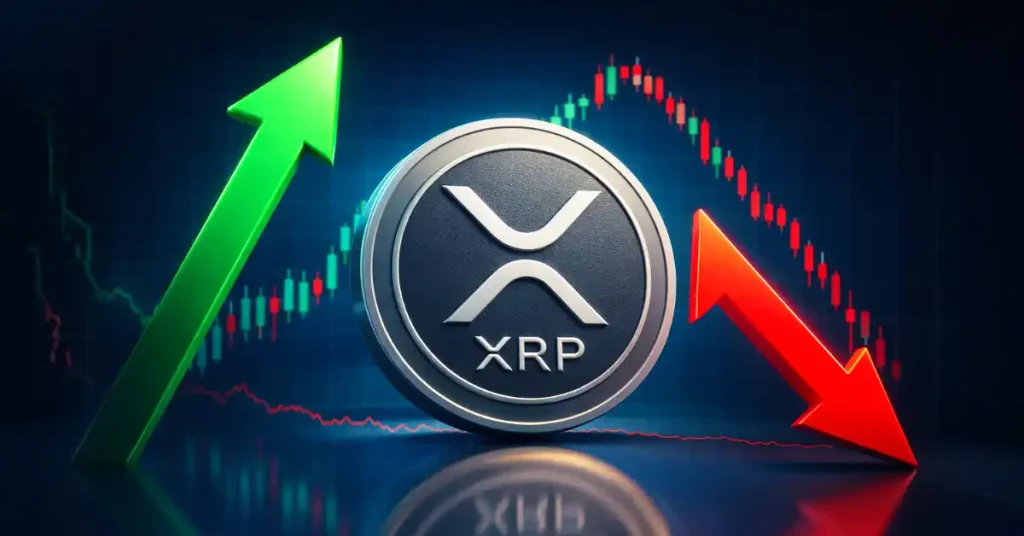
The post Ripple News: $50B XRP Losses Grow as Analyst Points to $6.8 Capitulation Level appeared first on Coinpedia Fintech News
Investors holding XRP are currently facing significant unrealized losses as the cryptocurrency continues to struggle after its sharp correction from 2025 highs. Highlighting the situation, crypto analyst EGRAG CRYPTO recently explained that every major XRP cycle goes through a painful capitulation phase before the next expansion begins.
His comments come as new on-chain data from Glassnode reveals the scale of investor losses across the XRP ecosystem. According to the analytics firm, approximately 36.8 billion XRP tokens are currently being held below their purchase price, translating to nearly $50.8 billion in unrealized losses.
The data reflects the impact of XRP’s sharp retracement from its 2025 highs, when the token surged above $2.80 before entering a prolonged correction. With XRP currently trading around $1.34, a large portion of investors are now waiting for the market to stabilize.
Despite the current losses, EGRAG believes the market may simply be following patterns seen in previous cycles.
According to him, XRP cycles often end with two types of market resets: price-based capitulation and time-based capitulation. Price capitulation occurs when the market experiences a sharp drop that flushes out leveraged positions. Time capitulation, on the other hand, happens when prices remain stagnant for long periods, slowly resetting investor sentiment.
Looking at past cycles supports this theory. During the 2017–2018 XRP cycle, the market experienced both forms of correction. Prices dropped roughly 67%, followed by around 210 days of consolidation before the next phase began.
The 2021 cycle played out differently. XRP suffered a deeper 77% price decline, but the consolidation period was shorter as liquidity was quickly flushed out through a steep correction.
From a structural perspective, EGRAG notes that XRP could still be retracing toward the origin of its previous expansion move, which sits around $0.85. Markets often revisit these zones before beginning the next major rally.
Using Fibonacci projections, he highlighted two long-term levels traders are watching. The $6.8 level could represent a potential price capitulation target, while $20 may act as a major expansion target if the next bullish cycle develops.
However, reaching those levels would likely require the market to complete its reset phase first.
In the short term, XRP’s technical structure remains bearish. The token continues to trade inside a descending parallel channel that began after its drop from above $2.80.
Momentum indicators also show limited strength. The RSI remains in the low-40 range, signaling weak buying pressure, while the MACD indicator is drifting lower, hinting that bullish momentum is fading.
Currently, $1.30 serves as immediate support, while a break below this level could push prices toward the $1.20 zone where buyers previously stepped in. On the upside, $1.50 acts as the first resistance, followed by stronger resistance near $1.90.
Until XRP breaks out of this structure, analysts believe the market may remain in a consolidation phase before the next major move emerges.
Stay ahead with breaking news, expert analysis, and real-time updates on the latest trends in Bitcoin, altcoins, DeFi, NFTs, and more.
Many investors bought XRP near its 2025 highs above $2.80. With the price now around $1.34, about 36.8B XRP are held below cost, creating large unrealized losses.
Some analysts believe XRP could reach $6–$20 in a strong bull market. However, the market may need to complete a correction and consolidation phase first.
Many analysts expect XRP’s long-term outlook to depend on adoption, regulatory clarity, and overall crypto market cycles, which could drive higher valuations.
The post What’s Next for Bitcoin, Ethereum and XRP Price Ahead of the U.S. CPI Report? appeared first on Coinpedia Fintech News
The crypto market started Monday on a positive note, with most top 10 coins trading in green. Now, investors are closely watching one key event this week, the upcoming U.S. Consumer Price Index (CPI) report. Last month’s CPI data pushed the crypto market up by nearly 4%.
This time, traders are watching how Bitcoin, Ethereum, and XRP will react to the new CPI data.
The U.S. Bureau of Labor Statistics will release the February 2026 CPI and Core CPI data this week. Economists expect inflation to come in around 2.5%, slightly higher than January’s 2.4%. Core CPI is also expected to stay near 2.5%.
These numbers show that inflation is slowly cooling but is still above the Federal Reserve target of 2%. Because of this, the Fed may delay cutting interest rates. Some officials want rate cuts, while others prefer to keep rates unchanged.
Meanwhile, the CME Group FedWatch Tool shows about a 95% chance that rates will stay near 3.5% – 3.75%.
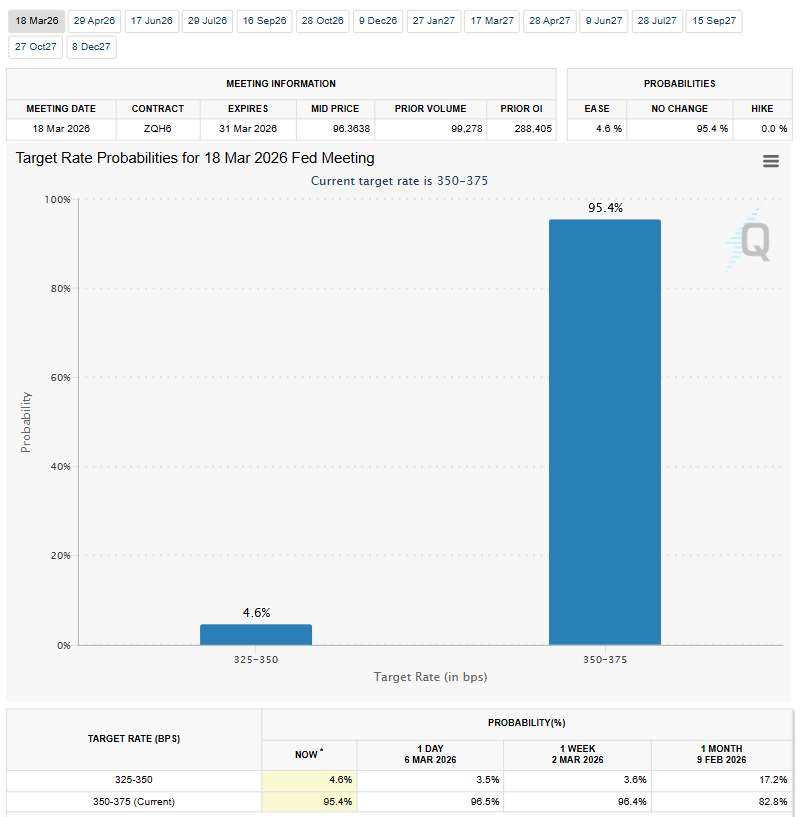
Higher interest rates usually reduce money flowing into markets, which can put pressure on risk assets like cryptocurrencies
Crypto markets have shown strong reactions to inflation data in recent months. On February 13, when January CPI came in at 2.4%, slightly below expectations, Bitcoin quickly rallied about 5%, jumping from a daily low of $65,889 to nearly $70,500.
At the same time, Ethereum and XRP also reacted strongly. Both coins gained around 5% to 8% in a single day, with Ethereum moving above $2,100 and XRP trading near $1.55.
Now, the February CPI data is expected to come in at 2.5%, slightly higher than January’s 2.4% reading. Because of this, traders are closely watching how the market will react this time.
However, there is also some caution in the ETF market. Over the last two days, Bitcoin ETFs recorded outflows of $227.9 million and $348.9 million, which could affect short-term price momentum.
If inflation comes in lower than expected, analysts believe Bitcoin could attempt another move toward $70,000, with Ethereum and XRP likely following.
However, if CPI surprises to the upside, traders may fear that high interest rates will remain longer, potentially pushing Bitcoin toward a lower support level of $60K.
As of now, Bitcoin is trading near $67,179, while Ethereum sits around $1,980, and XRP is hovering close to $1.35.
Stay ahead with breaking news, expert analysis, and real-time updates on the latest trends in Bitcoin, altcoins, DeFi, NFTs, and more.
The February 2026 U.S. CPI report will be released on March 11, 2026, at 8:30 a.m. Eastern Time (ET) by the U.S. Bureau of Labor Statistics.
CPI shows inflation trends. Lower inflation can boost crypto prices, while higher inflation may pressure Bitcoin, Ethereum, and XRP due to expectations of higher interest rates.
Higher rates reduce liquidity and make safer assets more attractive, which can lower demand for risk assets like Bitcoin, Ethereum, and other cryptocurrencies.
The post Beam (BEAM) Price Prediction 2026, 2027-2030: Is a 100x Privacy DeFi Rally Possible? appeared first on Coinpedia Fintech News
Privacy has become a major topic in blockchain. While many once believed Bitcoin transactions were anonymous, blockchain tools later showed that most transfers can be traced.
Beam was created to solve this problem.
Launched in March 2018, it is a privacy-focused DeFi platform that uses Mimblewimble and LelantusMW to hide wallet balances, transaction amounts, and user identities.
Unlike many privacy coins that focus solely on payments, Beam is gradually expanding into a private DeFi ecosystem, integrating NFTs, decentralized exchanges, and confidential smart contracts.
With the token currently trading near $0.023, investors are now asking whether Beam could become a major player in the emerging privacy-first DeFi sector.
Here is CoinPedia’s Beam (BEAM) price prediction for 2026, 2027, and 2030.
Let’s explore.
| Cryptocurrency | Beam |
| Token | BEAM |
| Price | $0.0247
|
| Market Cap | $ 0.00 |
| 24h Volume | $ 0.00 |
| Circulating Supply | 0.00 |
| Total Supply | 1,231,521,864.3567 |
| All-Time High | $ 0.0443 on 10 March 2024 |
| All-Time Low | $ 0.0042 on 29 October 2023 |
In recent years, regulatory debates around data transparency and financial surveillance have pushed many blockchain users toward privacy-enhancing protocols.
Beam’s architecture is designed specifically for this use case.
The platform uses Mimblewimble technology, which compresses blockchain data while hiding transaction details. Combined with LelantusMW, it enables users to create fully private transactions without exposing balances or transaction histories.
Beyond payments, Beam is also expanding its private DeFi toolkit, including confidential assets, decentralized exchanges, and NFT functionality.
If these developments gain traction and more users begin prioritizing privacy in DeFi, BEAM could attempt to move toward $0.0035 by March 2026.
| Month | Potential Low ($) | Potential Average ($) | Potential High ($) |
| Beam Price Prediction March 2026 | $0.0202 | $0.02861 | $0.0350 |
Beam’s long-term value depends largely on whether privacy becomes a critical feature in decentralized finance.
Public blockchains provide transparency, but they also expose transaction histories and wallet balances. For institutions, traders, and everyday users seeking financial confidentiality, this can be a major limitation.
Beam’s approach combines confidential transactions with scalable blockchain design, which could make it attractive for private DeFi applications.
If Beam successfully integrates more financial tools, such as private lending markets, decentralized exchanges, and tokenized assets, it could gradually attract liquidity into its ecosystem.
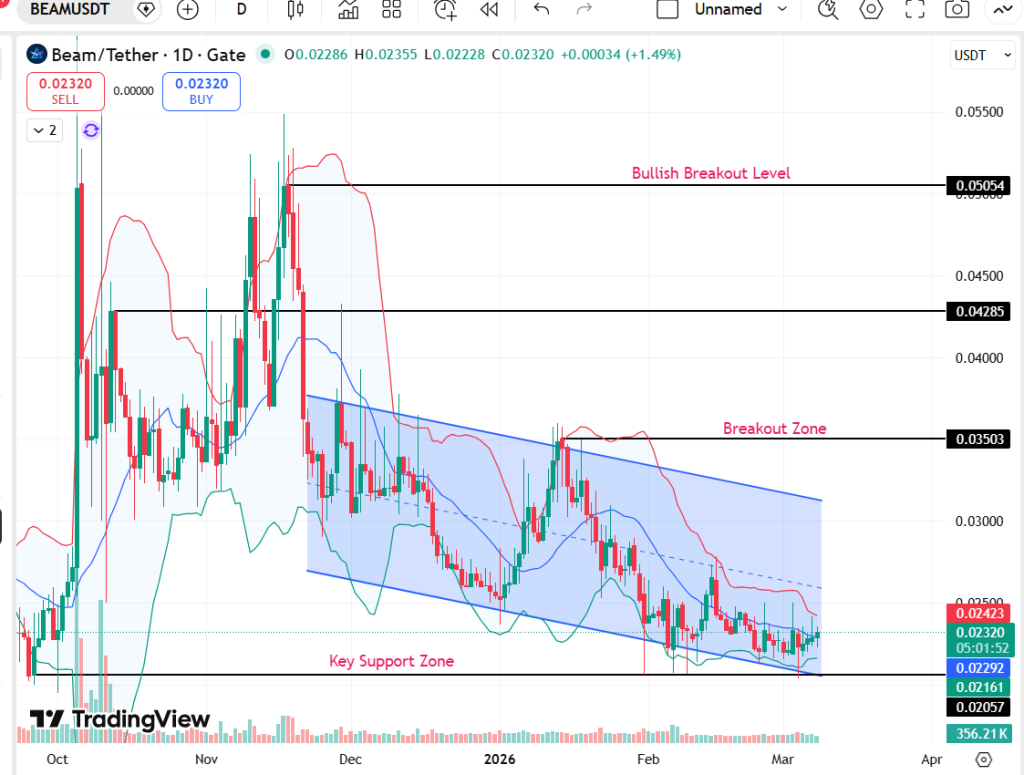
Looking at the BEAM/USDT 1-day chart, it shows the price moving within a clear descending channel, indicating a slow downtrend over several months.
Recently, BEAM bounced again from the key support zone near $0.021–$0.022, which shows that buyers are still defending this area. The current price of around $0.023 suggests a small recovery after touching the lower boundary of the channel.
For the trend to turn bullish, BEAM must break above the channel resistance and the breakout zone near $0.035. If that happens, the next targets could appear around $0.042 and later near $0.0505 by the end of 2026.
However, if the price fails to hold the $0.021 support, the downtrend could continue with further downside pressure.
| Year | Potential Low ($) | Potential Average ($) | Potential High ($) |
| Beam Price Prediction 2026 | $0.018 | $0.3503 | $0.0505 |
| Year | Potential Low ($) | Potential Average ($) | Potential High ($) |
| 2026 | $0.018 | $0.3503 | $0.0505 |
| 2027 | $0.030 | $0.092 | $0.2973 |
| 2028 | $0.094 | $0.5070 | $1.02 |
| 2029 | $0.376 | $1.32 | $2.57 |
| 2030 | $0.930 | $2.86 | $4.41 |
If privacy-focused DeFi applications expand and Beam’s ecosystem gains liquidity, the token could approach $0.0505.
Meanwhile, by 2027, stronger adoption of confidential financial tools may push BEAM toward $0.297.
If private decentralized exchanges and confidential NFTs gain popularity, BEAM could climb to $1.02.
Greater demand for financial privacy and institutional experimentation with confidential blockchain infrastructure may move BEAM toward $2.57.
By 2030, if Beam becomes a leading platform for private DeFi and confidential asset transfers, the token could reach $4.41.
| Year | 2026 | 2027 | 2030 |
| Changelly | $0.602 | $0.342 | $0.157 |
| Coincodex | $0.079 | $0.033 | $0.086 |
| Digitalcoinprice | $0.0720 | $0.11 | $0.21 |
From CoinPedia’s perspective, Beam stands out as a privacy-focused blockchain attempting to bring confidential transactions into decentralized finance.
While many blockchains prioritize transparency, Beam is building infrastructure for users who require financial confidentiality without sacrificing scalability.
If the project continues expanding its private DeFi ecosystem and regulatory debates increase demand for privacy-preserving technologies, BEAM could gradually reclaim the $0.0505 range in 2026.
| Year | Potential Low ($) | Potential Average ($) | Potential High ($) |
| 2026 | $0.018 | $0.3503 | $0.0505 |
Stay ahead with breaking news, expert analysis, and real-time updates on the latest trends in Bitcoin, altcoins, DeFi, NFTs, and more.
BEAM could trade between $0.018 and $0.0505 in 2026 if adoption of privacy-focused DeFi grows and the project expands its confidential financial tools.
Beam could reach around $4.41 by 2030 if privacy-focused DeFi adoption grows and its ecosystem expands with confidential smart contracts and private trading tools.
If privacy becomes a major part of DeFi and Beam continues expanding its ecosystem, the token could trade significantly higher by 2040, though long-term forecasts remain uncertain.
Beam has potential if demand for blockchain privacy increases. Its focus on confidential DeFi, private assets, and scalable transactions may support long-term growth.
Beam may interest investors seeking privacy-focused crypto projects. Its success depends on adoption of private DeFi tools and overall market conditions.
![Crypto News Today [Live] Updates](https://image.coinpedia.org/wp-content/uploads/2026/03/06102739/crypto-news-today-1-1024x536.webp)
The post G7 to Discuss Joint Release of Emergency Oil Reserves, Oil Price Surge, Impact on Crypto Market appeared first on Coinpedia Fintech News
March 9, 2026 06:30:26 UTC
G7 countries are considering a coordinated release of 300–400 million barrels of oil from strategic reserves to calm rising energy prices. Finance ministers from the Group of Seven will hold an emergency call with Fatih Birol, head of the International Energy Agency. Reports of the potential move pushed U.S. oil prices down by as much as $15 per barrel, briefly falling below $104. The IEA’s 32 member countries hold about 1.2 billion barrels in public reserves, part of a system created after the 1973 oil crisis to stabilize global energy markets during supply shocks.
March 9, 2026 06:15:00 UTC
Oil prices fell sharply, dropping about 11% within an hour after major economies announced a massive emergency release from strategic reserves. The Group of Seven and the International Energy Agency said they will release around 400 million barrels of oil to ease supply fears linked to the Iran crisis. The move marks the largest coordinated release in history, equal to nearly 30% of the IEA’s total stockpile. IEA countries hold about 1.24 billion barrels in public reserves, plus roughly 600 million barrels in industry stocks. The reserve system was created after the 1973 oil crisis to stabilize markets during major disruptions.
March 9, 2026 06:11:56 UTC
Oil prices have climbed above $116 per barrel, the highest since 2008, reviving fears of an energy-driven economic shock. Economist Peter Schiff warned that rising energy costs could make it difficult for the Federal Reserve to cut interest rates without worsening inflation. Responding to the surge, Changpeng Zhao questioned how rate cuts could happen while oil prices are rising. Schiff argued that the Fed may still ease policy to support markets and the economy, even if it risks higher inflation alongside a potential recession.
March 9, 2026 06:05:32 UTC
The chances of a U.S. recession in 2026 have climbed to about 41% on the prediction platform Polymarket, according to recent trading data. The rising geopolitical risks and market volatility are driving the shift in sentiment. Growing tensions involving Iran have unsettled global markets and raised concerns about energy supply. Oil flows through the Strait of Hormuz, a key route for global crude shipments, are under close watch. If tensions continue to rise, investors fear higher oil prices and slower global economic growth.
March 9, 2026 05:59:41 UTC
Gold and silver prices fell even as tensions between the U.S. and Iran increased. On COMEX, gold dropped about 1.3% to around $5,090 per ounce, while silver fell nearly 4%. The main reason is profit booking, as many investors sold metals after recent gains. A stronger U.S. dollar and rising bond yields also reduced demand for gold and silver. In times of market stress, prices can move in different directions, and the current situation reflects short-term volatility rather than a clear long-term trend.
March 9, 2026 05:41:38 UTC
Oil markets were shaken after the Strait of Hormuz effectively closed during escalating U.S.–Iran tensions, disrupting about 20 million barrels per day—around 20% of global oil supply. U.S. WTI crude prices jumped nearly 30% in a single day, rising above $115 per barrel, the biggest surge on record. The shock quickly spread to financial markets. Asian stocks fell sharply, with Japan’s Nikkei 225 dropping more than 7% and South Korea’s KOSPI sliding 8%, reflecting growing fears of a global energy and economic crisis.
The post Internet Computer (ICP) Price Prediction 2026, 2027 – 2030: Is ICP Preparing a Move Toward $25? appeared first on Coinpedia Fintech News
Internet Computer (ICP) has spent the past year rebuilding its market structure after one of the sharpest corrections among large-cap crypto assets. While the token once commanded significantly higher valuations during its early market debut, the current phase suggests a slow stabilization as the broader crypto market gradually prepares for its next expansion cycle.
Developed by the DFINITY Foundation, Internet Computer aims to extend blockchain capabilities beyond payments by enabling developers to build full-scale applications directly on-chain. The protocol functions as a decentralized cloud platform where websites, enterprise tools, and services can run entirely on blockchain infrastructure without relying on traditional cloud providers.
If the broader cryptocurrency market regains momentum and developer adoption continues expanding across decentralized computing platforms, Internet Computer could gradually regain investor attention over the coming years. So, let’s dive into Coinpedia’s Internet Computer (ICP) Price Prediction 2026, 2027 – 2030.
| Cryptocurrency | Internet Computer |
| Token | ICP |
| Price | $2.4981
|
| Market Cap | $ 1,372,523,557.56 |
| 24h Volume | $ 56,507,719.2853 |
| Circulating Supply | 549,436,223.5677 |
| Total Supply | 549,436,223.5677 |
| All-Time High | $ 750.7305 on 10 May 2021 |
| All-Time Low | $ 1.9773 on 10 October 2025 |
As March progresses, Internet Computer continues trading within a tight consolidation range near $2.40–$2.60, suggesting the market is waiting for a decisive breakout. The $2.20–$2.30 zone currently acts as a key support region. Holding above this level keeps the short-term recovery structure intact and signals that buyers remain active in the market.
On the upside, the first meaningful resistance sits around $3.50, where previous rallies stalled. If ICP manages to break above this area, momentum could push the price toward $5–$6, which historically acted as a major trading range. For now, the market appears to be in a consolidation phase where traders are watching whether the token can reclaim higher levels during the next market expansion.
Looking deeper into 2026, Internet Computer’s trajectory will likely depend on both technical recovery and broader Web3 infrastructure demand. The project continues positioning itself as a decentralized cloud platform, and if developer activity and ecosystem usage increase, market sentiment toward ICP could gradually improve. ICP first needs to stabilize above the $3–$4 region, which has repeatedly acted as a short-term ceiling during recovery attempts. A sustained move above this range would signal that buyers are slowly regaining control of the market. Once this zone is reclaimed, the next important resistance sits around $6–$8, an area where previous rallies in the past cycle lost momentum. Breaking this level would likely bring renewed investor interest and could open the door toward $12–$15, which historically acted as a major liquidity zone.
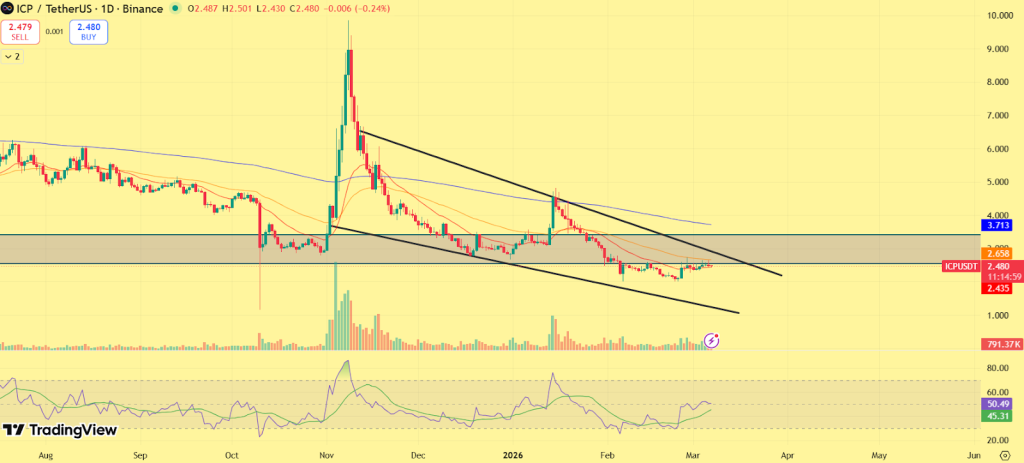
If the broader cryptocurrency market enters another expansion phase and capital rotates back into infrastructure projects, ICP could gradually push toward $20–$27 by 2026, aligning with long-term recovery expectations.
However, the downside scenario should also be considered. If the market weakens or Bitcoin enters another prolonged correction, ICP could revisit $2–$2.20, which currently acts as the strongest long-term support zone. Losing this level could extend consolidation before a stronger recovery begins.
Overall, the 2026 outlook for Internet Computer remains cautiously optimistic. A combination of improving market liquidity, developer adoption, and stronger Web3 infrastructure demand could gradually help the asset rebuild its long-term value.
| Year | Potential Low ($) | Potential Average ($ | Potential High ($) |
| 2026 | 10 | 18 | 27 |
| 2027 | 14 | 24 | 34 |
| 2028 | 18 | 30 | 45 |
| 2029 | 25 | 40 | 55 |
| 2030 | 35 | 50 | 70 |
In 2026, Internet Computer price could project a low price of $10, an average price of $18, and a high of $27
As per the Internet Computer price Prediction 2027, Internet Computer may see a potential low price of $14, The potential high for Internet Computer price in 2027 is estimated to reach $34
In 2028, Internet Computer price is forecasted to potentially reach a low price of $18, and a high price of $45.
Thereafter, the Internet Computer (ICP) price for the year 2029 could range between $25 and $55.
Finally, in 2030, the price of Internet Computer (ICP) is predicted to maintain a steady positive. It may trade between $35 and $70
Over the long term, the value of Internet Computer (ICP) will depend on Web3 adoption and the expansion of decentralized cloud services, which could support gradual growth across future market cycles.
| Year | Potential Low ($) | Potential Average ($) | Potential High ($) |
| 2031 | 40 | 60 | 85 |
| 2032 | 45 | 70 | 100 |
| 2033 | 50 | 85 | 120 |
| 2040 | 120 | 185 | 250 |
| 2050 | 350 | 520 | 700 |
| Year | 2026 | 2027 | 2030 |
| Changelly | $15 | $35 | $35 |
| CoinCodex | $18 | $42 | $50 |
| WalletInvestor | $20 | $38 | $45 |
Coinpedia’s price prediction highlights that Internet Computer (ICP) appears to be entering a long-term accumulation phase following an extended correction period. If the project continues expanding its decentralized cloud ecosystem and attracts more developers building Web3 applications, the token could gradually regain market momentum.
In a favorable market environment, ICP could reach around $27 by 2026, while stronger adoption across decentralized infrastructure platforms could push the token toward $70 by 2030.
| Year | Potential Low ($) | Potential Average ($) | Potential High ($) |
| 2026 | 10 | 18 | 27 |
Stay ahead with breaking news, expert analysis, and real-time updates on the latest trends in Bitcoin, altcoins, DeFi, NFTs, and more.
Internet Computer (ICP) is a layer-1 blockchain that lets developers build fully on-chain apps without traditional cloud servers.
ICP is projected to trade between $6 and $25 in 2026, depending on market momentum, support levels, and broader crypto sentiment.
If adoption of decentralized cloud platforms expands and crypto markets strengthen, ICP could potentially reach around $70 by 2030 in a strong growth cycle.
Long-term models suggest ICP could trade between about $80 and $150 by 2035 if decentralized computing platforms gain wider adoption.
Long-term projections estimate ICP could range between roughly $120 and $250 by 2040, depending on Web3 adoption, developer activity, and broader crypto market growth.
ICP’s price is influenced by market trends, developer adoption, token supply dynamics, network upgrades, and overall crypto sentiment.
ICP may suit long-term investors who believe in decentralized cloud computing, but price volatility means risk management is essential.
The post Best Crypto Presale: Pepeto Attract Whales As Binance Listing Approaching – Spot Bitcoin ETFs Bleed $228 Million in One Day appeared first on Coinpedia Fintech News
A harsh reality just hit the institutional crypto sector. Spot Bitcoin ETFs in the United States suffered $228 million in net outflows on March 5 alone according to SoSoValue, violently interrupting a three day accumulation streak that had netted roughly $1.1 billion.
When institutional money exits Bitcoin ETFs at that speed, the traders searching for the best crypto presale are the ones positioning in presale entries where the downside is protected by early pricing and the returns are defined by listing math, not by whether BlackRock’s IBIT stops bleeding.
Pepeto with $7.5M raised is the 300x exchange presale the best crypto presale conversation cannot ignore.
CoinDesk reported spot Bitcoin ETFs posted $228 million in net outflows on March 5, ending a three day inflow streak, with BlackRock’s IBIT losing $89 million and Fidelity’s FBTC shedding $48 million, while The Block confirmed year to date net outflows have climbed to roughly $900 million.
When ETF money exits, the best crypto presale captures the rotation before the next inflow cycle begins.
Pepeto: The Best Crypto Presale Where the Exchange Infrastructure Already Works
The sudden multi million dollar exit from institutional ETFs is exactly why the average crypto investor needs better tools, because when Wall Street decides to sell, retail is the last to know. Pepeto was built to change that dynamic completely by putting unified exchange tools directly in the hands of everyday traders.
The cross chain bridge connecting Ethereum, BNB Chain, and Solana routes assets instantly. The zero tax engine keeps every trade whole. The risk scoring system checks contracts before capital commits, and the SolidProof audit backs every line of code. The cofounder of the Pepe ecosystem who built a token to $7 billion leads the team.
The best crypto presale is the one where the infrastructure already works and the listing math creates the kind of returns that Bitcoin ETFs at $90 billion AUM cannot produce. The 300x math requires only the listing valuation exchange tokens with real cross chain infrastructure routinely achieve.
More than $7.5M raised during consolidation while BlackRock’s IBIT bleeds $89 million, and the difference between the best crypto presale and a Bitcoin ETF is that one pays you 209% APY staking during the fear while the other charges you management fees on a position that just lost value. Every round fills faster than the last, and the Binance listing approaches whether ETF flows are positive or negative, because the exchange infrastructure does not need BlackRock’s permission to go live.
Allocations inside the Pepeto presale fill faster every round while Bitcoin ETFs bleed $228 million and BlackRock’s IBIT posts its worst single day exit this month.
The exchange tools approach launch while most presales ship nothing but updated roadmaps, and that traction during a market where institutional money is leaving Bitcoin is historically the single strongest signal a project can produce.
The $7 billion cofounder leads the team, the SolidProof audit is done, and the 300x listing math sits intact. Visit the Pepeto official website and enter the presale before this round closes and the allocation that exists right now drains into someone else’s wallet, the presale is selling out fast.
Click To Visit Pepeto Website To Enter The Presale
What is the best crypto presale in 2026?
The best crypto presale is Pepeto with $7.5M raised, 209% APY, exchange infrastructure, and a Binance listing approaching. Visit the Pepeto official website.
Why did Bitcoin ETFs lose $228 million?
Spot Bitcoin ETFs posted $228M outflows as institutional sentiment shifted, and the best crypto presale captures the rotation before the next inflow cycle begins.


Finance and insurance job listings declined towards the end of 2025, with The Kobeissi Letter arguing the sector should “brace” for job cuts.

The roughly $26 billion in tokenized assets onchain today “is really just the proof of concept,” said BTC Markets CEO Lucas Dobbins.

Starcloud plans to mine Bitcoin from orbit using ASIC hardware, arguing the economics of space computing favor specialized mining chips over GPUs.

Flow Foundation is seeking a Seoul court order to halt planned FLOW delistings on three Korean exchanges following a December exploit that duplicated tokens.

NYDIG’s Greg Cipolaro says that Bitcoin and tech stocks aren’t converging and are likely just reacting to macroeconomic conditions rather than trading in tandem.

If the CLARITY Act fails to pass, Giancarlo said he expects Paul Atkins at the SEC and Mike Selig at the CFTC will likely write rules to create clarity for the industry.

Despite a rise in crypto fundraising, Messari’s Eric Turner noted that no major crypto VCs have closed rounds except Dragonfly recently, stating that crypto “needs some fresh capital.”

The post Half-Million Bitcoin May Not Be Crazy, Says Popular Analyst appeared first on Coinpedia Fintech News
The debate around Bitcoin reaching $500,000 this cycle has resurfaced after popular crypto analyst PlanB reaffirmed his bullish outlook for the 2024–2028 halving cycle.
PlanB’s prediction is based on the Stock-to-Flow Model, a framework that measures Bitcoin’s value through its scarcity. The model compares the existing supply of BTC with the rate at which new coins are produced.
Bitcoin’s supply dynamics change every four years due to a halving event, which reduces mining rewards and slows the rate of new coin creation. As fewer new coins enter circulation while demand grows, Bitcoin becomes increasingly scarce. Historically, such halving cycles have been followed by strong bull runs.
Using this model, PlanB estimates Bitcoin could trade between $250,000 and $1 million during the current cycle, with $500,000 acting as the average midpoint. However, he emphasizes that the model predicts cycle averages rather than exact price peaks, meaning BTC could temporarily move above or below this range during the market cycle.
Despite the optimistic outlook, not all market experts believe Bitcoin will reach the half-million mark this cycle.
Crypto analyst Bobby A agrees that Bitcoin still has significant upside but expects a more realistic target between $200,000 and $250,000 by 2026 or 2027 as the market cycle matures.
According to him, models like Stock-to-Flow should be viewed as broad long-term frameworks rather than precise prediction tools. While they help illustrate Bitcoin’s overall growth trajectory, they may not accurately forecast specific price targets in complex market environments. In his view, the model provides a big-picture understanding of Bitcoin’s potential but lacks the precision needed for exact predictions.
In the short term, Bitcoin continues to experience volatility. The asset recently climbed close to $74,000 before pulling back. At the time of writing, BTC is trading near $67,300, down slightly over the past 24 hours but still showing modest weekly gains.
Several external factors have contributed to this volatility, including geopolitical tensions in the Middle East and changing inflows into spot Bitcoin ETFs. Despite the fluctuations, many analysts believe Bitcoin is currently in a consolidation phase after its strong rally earlier this year, when prices moved above $72,000.
Stay ahead with breaking news, expert analysis, and real-time updates on the latest trends in Bitcoin, altcoins, DeFi, NFTs, and more.
Stronger financial regulations, reduced institutional demand, or global economic slowdowns could limit price growth. Liquidity conditions and risk appetite in traditional markets also play a major role.
Market participants are closely watching ETF inflows, global interest rate decisions, and institutional adoption trends. These factors often influence liquidity and can shape Bitcoin’s momentum over time.

The post CleanSpark Sells 553 BTC and Pivots to AI as Bitcoin Miners Retreat, Pepeto’s 100x Exchange Presale With $7.5M Raised Keeps Growing While Trump’s Iran Conflict Shakes the Market appeared first on Coinpedia Fintech News
Bitcoin is at the center of this week’s crypto news, but the sentiment turned ugly. US miner CleanSpark sold 553 BTC worth $36 million and pivoted to AI computing because mining math stopped working.
When miners sell their own Bitcoin, the short term pressure is real, but the accumulation window for presale entries with real utility is exactly where it should be. The crypto news keeps getting heavier, but Pepeto with $7.5M raised is the 100x exchange presale that does not need mining profitability to deliver returns.
CoinDesk reported US Bitcoin miner CleanSpark sold 553 BTC from its February production for roughly $36 million while pivoting part of its 808 megawatt infrastructure toward AI and high end computing, while Bloomberg confirmed the move reflects a growing trend of miners diversifying away from crypto as block rewards shrink.
When miners sell Bitcoin and pivot to AI, the crypto news signals accumulation for presale entries, and Pepeto’s 100x exchange infrastructure captures that rotation.
The crypto news is full of bearish signals, from miners selling BTC to Trump escalating Iran, but among the noise, Pepeto became one of the most interesting examples of conviction during fear because $7.5M raised while CleanSpark dumps Bitcoin is the definition of smart money positioning.
While presales generally run on hype, Pepeto raised that capital because the product is real. The cross chain bridge connecting Ethereum, BNB Chain, and Solana routes assets instantly. The zero tax engine keeps every trade whole. The risk scoring system catches dangerous contracts before your money goes near them, and the SolidProof audit backs every line of code.
The cofounder of the Pepe ecosystem who built a token to $7 billion leads the team, and the 100x math is not a community guess, it is the kind of return exchange tokens with real infrastructure deliver on listing day when trading volume floods through tools that were built during the silence.
All of that at $0.000000186 while CleanSpark sells Bitcoin and pivots to AI. The crypto news is clear: projects that create demand through real tools survive regardless of oil prices or mining selloffs. Pepeto’s 209% APY compounds right now, and by the time the crypto news turns positive, the presale position that exists today will either make you rich or make you regret missing it.
SOL fell 4% to $84 heading according to CoinMarketCap into the weekend as the midweek rally faded. Support at $83 must hold or $75 becomes the target.
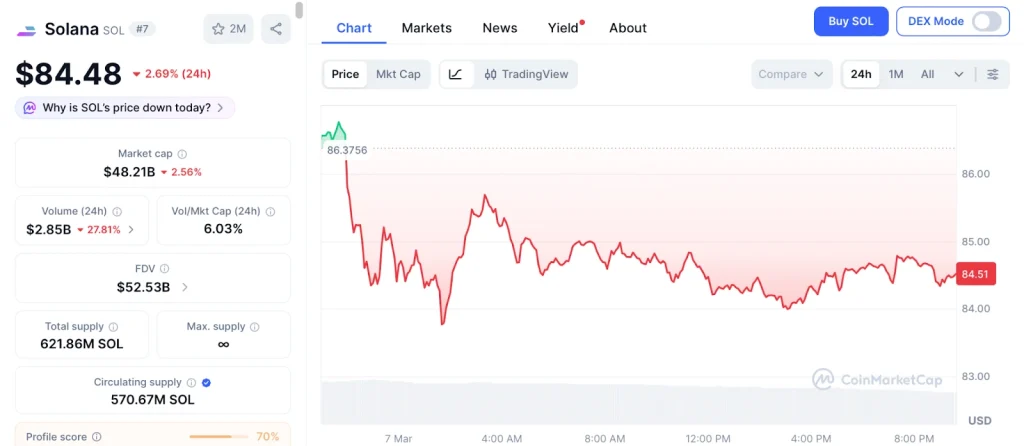
The crypto news shows the Iran conflict weighing on all risk assets, and SOL at $40 billion offers patience plays, not the 100x presale returns.
LINK holds near $9.30 with steady oracle demand. Analysts target $13, roughly 40% from here.
The crypto news confirms mid caps grind sideways during conflict driven fear, while 100x exchange presales built during accumulation capture the rotation before large caps feel it.
few months from now there are two versions. In one, the presale was entered while CleanSpark sold Bitcoin and the crypto news said stay away, the Binance listing arrived, and the position built at $0.000000186 became the best decision of the cycle. In the other, the crypto news won, the listing repriced overnight, and the weight of knowing it was right here while miners were selling follows the person who waited.
The 209% APY does not care about Trump or oil, it compounds every day for the wallets inside. Visit the Pepeto official website and enter the presale before the crypto news that scared everyone away becomes the bottom everyone wishes they had taken action on.
Click To Visit Pepeto Website To Enter The Presale
What is the biggest crypto news this week?
The biggest crypto news is CleanSpark selling 553 BTC and pivoting to AI while Trump escalates Iran, but Pepeto with $7.5M raised keeps growing during the fear. Visit the Pepeto official website.
Why are Bitcoin miners selling BTC?
Miners like CleanSpark sell Bitcoin as block rewards shrink and pivot to AI, signaling accumulation windows for presale entries like Pepeto with 100x exchange infrastructure.
Is crypto still worth buying during the Iran conflict?
Conflict creates fear and accumulation windows, and presale entries like Pepeto with exchange tools benefit from positioning during fear before the recovery reprices everything.
The post Why Bitcoin, Ethereum and XRP Prices Are Not Crashing Today? appeared first on Coinpedia Fintech News
Cryptocurrencies defied a sweeping global market selloff on Monday as a catastrophic oil supply shock and escalating U.S.-Iran tensions sent equities tumbling, with Bitcoin, Ethereum and XRP each posting modest gains even as Wall Street futures pointed to one of the worst openings in recent memory.
Crypto Holds as Equities Crater
Bitcoin traded at $66,124.97, up 1.65% over 24 hours. Ethereum added 1.08% to change hands at $1,944.62, while XRP outperformed both, climbing 1.47% over seven days to $1.34. The crypto market capitalization stood at $2.28 trillion, a striking contrast to equity futures showing the Nasdaq off 1.56%, the S&P 500 down 1.65%, the Dow shedding 2%, and the Russell 2000 hemorrhaging 3.8%.
The Oil Shock Behind the Chaos
Crude oil surged 21% at the open, with West Texas Intermediate hitting $110.99 per barrel for the first time since June 2022, now up 65% since the outbreak of the U.S.-Iran war. The trigger was the effective closure of the Strait of Hormuz, through which roughly one-fifth of the world’s daily oil supply normally flows.
With pipeline bypass capacity capped at 6.8 million barrels per day against a trapped flow of 19.8 million, analysts estimate a structural daily deficit of 12.7 million barrels. In nine days, an estimated 200 million barrels have failed to reach global markets. Iraq, Iran and Kuwait have collectively halted millions of barrels in daily production. Saudi Arabia’s Ras Tanura refinery is offline. Qatar has suspended approximately 20% of global LNG supply.
A Leadership Vacuum in Tehran
Compounding the instability, Iran’s Assembly of Experts formally declared Mojtaba Khamenei as Supreme Leader on Monday, triggering street protests in Tehran and a sharp response from Washington, where President Trump had previously called a dynastic succession “unacceptable.”
Why Digital Assets Are Diverging
Against that backdrop, crypto’s divergence from equities has drawn attention. Bitcoin’s institutional positioning as a store of value is attracting defensive flows that traditionally move into gold. With oil driving inflation expectations higher, assets outside the traditional financial system are drawing fresh interest.
The Crypto Fear & Greed Index at 17 signals extreme fear, a reading historically associated with accumulation rather than further selling. Crucially, digital assets carry no exposure to the physical infrastructure at the center of this crisis.
There are no refineries to go offline, no tankers to reroute. In a shock defined entirely by the vulnerability of physical supply chains, that detachment is proving, for now, to be an advantage.

Bitcoin’s price has now fallen for four consecutive days to $66,272 after initially climbing on the US-Israel strikes on Iran.

Strategy’s Bitcoin treasury is worth about $48 billion, but the company’s mNAV has fallen below 1, meaning its shares trade at a discount to its BTC holdings.

The Pix payment system is credited with driving crypto adoption in Argentina, according to a report from the Lemon crypto app.

"Sinners" star Michael B. Jordan’s odds of winning the Best Actor Oscar jumped from 10% on March 1 after he won the SAG best actor award.

The post Pi Network News: Why Pi Coin Fell 10% Today and What Pi Day on March 14 Means for the Price appeared first on Coinpedia Fintech News
Pi coin dropped roughly 10% in the last 24 hours, sliding to around $0.20 after briefly touching $0.23 earlier this week. For anyone holding Pi or watching the market, here is a breakdown of why it fell and what to watch next.
The main reason: the rally ran out of steam
Pi had a strong week, climbing more than 20% before hitting a wall just above $0.21. When a coin rises that fast that quickly, short-term traders tend to sell and lock in their profits. That is exactly what happened here. The price failed to hold above an important level that traders were watching closely, and the selling accelerated from there. In simple terms, too many people tried to cash out at the same time.
The bigger picture: the whole market is nervous
Pi did not fall alone. Bitcoin slipped, the broader crypto market dipped, and the Fear and Greed Index, a measure of market sentiment, is sitting deep in Extreme Fear territory. Investors are jittery about ongoing geopolitical tensions and are waiting on a major US inflation report due March 12.
What happens next
The price to watch is $0.20. That is the psychological support level the market is currently testing. Two scenarios are in play right now.
If Pi holds above $0.20, the coin could stabilise and trade sideways in the lead-up to Pi Day on March 14, which historically brings network announcements that can move the price.
If Pi breaks below $0.20, the next meaningful support sits around $0.15, which would represent a significant further decline from current levels.
The bottom line
This drop is a combination of profit-taking after a sharp rally and a broader market that has turned risk-averse. It is not unusual price behaviour, but the next few days are critical. Pi Day on March 14 is the nearest potential catalyst for a recovery. Until then, holding $0.20 is the number every Pi holder should be watching.
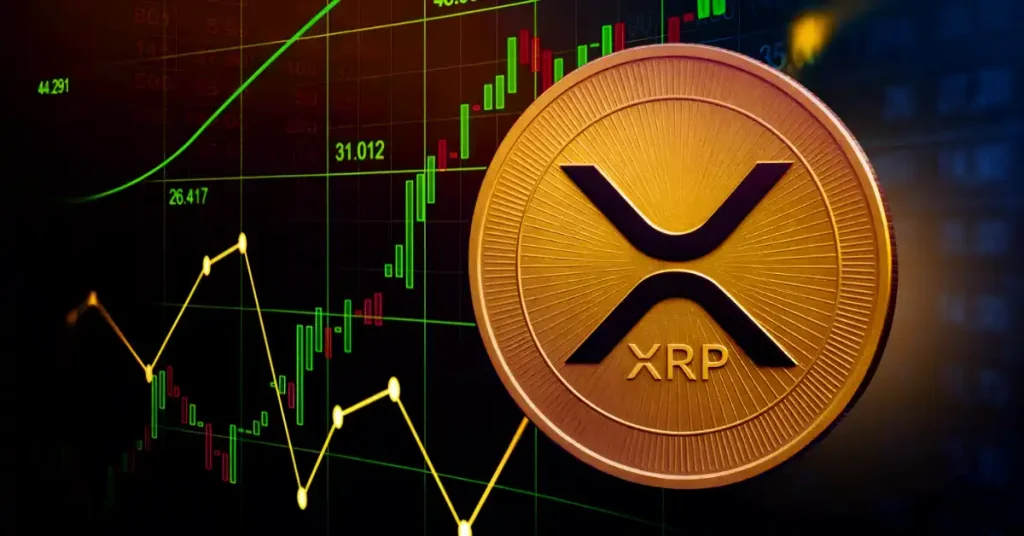
The post Eight Applications, 90% Odds and an Empty Exchange: The XRP Supply Shock Nobody Is Prepared For appeared first on Coinpedia Fintech News
Most XRP holders are watching ETF headlines without understanding why current approvals have done almost nothing for the price. According to digital finance strategist Jake Claver, that confusion is costing investors clarity at exactly the wrong moment.
The ETFs trading today are futures-based. They never actually touch XRP. They roll contracts, collect fees, and leave the underlying supply completely undisturbed. With roughly $240 million sitting across existing futures products, the price impact has been effectively zero. That changes entirely when spot ETFs arrive.
When institutions have to actually buy
Spot ETFs operate differently. Authorized participants are legally required to purchase and hold real XRP, locked in custody with firms like Coinbase or Anchorage, backing every share issued at a mandated ratio. Every dollar of inflow means XRP physically removed from circulating supply.
Claver points out that exchange inventory is already at historically low levels. Coinbase alone has seen available XRP drop nearly 90% over recent months, down to roughly 100 million tokens. Against that backdrop, even conservative inflow estimates of $2 to $4 billion in the first year represent a serious supply problem. More aggressive projections, cited by sources including JP Morgan, suggest $5 to $8 billion could enter the market within the first 30 days alone.
“It’s like a balloon being held underwater,” Claver said. “When you let it go, it’s going to skyrocket.”
Why XRP could move faster than Bitcoin ever did
Bitcoin’s ETF approval in January 2024 took nearly a full year to translate into its full price impact, eventually reaching $100,000 in December. Claver argues XRP’s compressed timeline, thinner liquidity, and smaller exchange inventory means the same mechanics could play out in a fraction of the time.
With eight spot ETF applications currently pending SEC review, approval windows converging around late 2025, and prediction markets placing approval odds above 90%, the structural conditions are forming rapidly.
The bigger picture
Layer in RLUSD adoption, central bank digital currency pilots already running on the XRPL across multiple nations, a near-concluded SEC legal battle with Ripple, and potential major institutional partnership announcements, and Claver sees not one catalyst but several hitting simultaneously.
For long-term XRP holders, that convergence is precisely the moment they have been positioned for.

The post Best Crypto to Buy Now: Pepeto Is the Trade Gold and BTC Cannot Deliver From Here, While Lyn Alden Says Bitcoin Beats Gold Through 2029 appeared first on Coinpedia Fintech News
Lyn Alden, one of the most respected macro voices in finance, just said on New Era Finance that she backs Bitcoin over gold for the next two to three years.
When the most credible voice in crypto says BTC is unfairly hated at 44% below peak while gold sits at all time highs, that is a signal.
But the best crypto to buy now is not the asset that needs to climb from $67,000 to $126,000, it is the exchange presale where $7.5M keeps growing and the 267x math works from presale to listing.
CoinDesk reported macro strategist Lyn Alden stated on New Era Finance that she backs Bitcoin over gold for the next two to three years, noting BTC is 44% below peak while gold sits at all time highs, while Bloomberg confirmed Coinbase CEO Brian Armstrong independently predicted Bitcoin hits $1 million by 2030.
When the most credible macro voice says the pendulum swings from gold to crypto, the best crypto to buy now captures the rotation before it arrives.
When you look at what is available to buy in crypto right now, Pepeto keeps landing at the top of the list because you are not investing on a chart pattern or a recovery thesis, you are buying exchange infrastructure at presale pricing that delivers the returns gold and Bitcoin cannot produce from current levels.
The cross chain bridge connecting Ethereum, BNB Chain, and Solana routes assets instantly and the zero tax engine keeps every trade whole. The risk scoring system checks contracts before your capital commits, so the only scam you read about is the one that happened to someone who did not use it. The SolidProof audit backs every contract, and the cofounder of the Pepe ecosystem who built a token to $7 billion leads the development.
From zero to $7.5M raised during fear, Pepeto has proven real utility creates its own demand. The 267x math requires only the listing valuation exchange tokens with real infrastructure routinely achieve, and the best crypto to buy now is the one where returns do not depend on Bitcoin recovering to $126,000.
Lyn Alden says the pendulum swings from gold to crypto. The best crypto to buy now is the presale compounding 209% APY while the pendulum builds speed, because once the Binance listing goes live, the presale entry becomes the position every future buyer wishes existed at the same price.
XRP holds $1.36 according to CoinMarketCap with institutional inflows at $33.4 million, but resistance at $1.50 and then $1.78 caps the near term returns at modest percentages.
The best crypto to buy now at $70 billion market cap offers store of value, not the multiples exchange presales deliver.
ADA sits at $0.27 after failing to hold $0.28. The Protocol Version 11 Hard Fork could help, but ADA traders are notorious for waiting for catalysts that produce minimal moves.
The best crypto to buy now has working tools, not upcoming hard forks that the market already priced in.
Pepeto is showing up in crypto feeds that used to only cover Bitcoin, in channels that never mentioned presales, and the name spreads faster than rounds can fill. Lyn Alden says the pendulum swings from gold to crypto, and the best crypto to buy now with the $7 billion cofounder and exchange tools rides that swing from the lowest possible entry.
The Binance listing goes live on its own schedule, and the attention arriving now will look small after the first exchange trade executes. Visit the Pepeto official website and enter the presale before the rest of the world catches up, this moment is critical as pepeto is already going viral and being compared to Dogecoin early days, and the entry that was available during the doubt becomes the price that defined who was paying attention and made the right decision at the right moment, and who missed it.
Click To Visit Pepeto Website To Enter The Presale
What is the best crypto to buy now?
The best crypto to buy now is Pepeto with $7.5M raised, 209% APY, and 267x exchange infrastructure that delivers returns Bitcoin and gold cannot match. Visit the Pepeto official website.
Why does Lyn Alden back Bitcoin over gold?
Lyn Alden says Bitcoin at 44% below peak is undervalued while gold at all time highs has made the easy money, and the best crypto to buy now captures the pendulum rotation.
Is XRP or ADA worth buying now?
XRP faces resistance at $1.45 and ADA stalls at $0.27, while Pepeto at presale pricing delivers the explosive multiples large caps during consolidation cannot produce.

The post Shiba Inu Go Sideways as SoFi Launches First US Bank Stablecoin, While Shows the Meme Coin Market What Real Utility Looks Like appeared first on Coinpedia Fintech News
SoFi just partnered with BitGo to launch SoFiUSD, what could be the first stablecoin from a nationally chartered and federally insured US bank, and that tells you where money goes in 2026: infrastructure, not memes.
While the market goes sideways and traders chase the next shiba inu pump, smart capital rotates into presale entries with real exchange tools.
Pepeto with $7.5M raised is the 300x meme coin alternative trading on utility while shiba inu waits for a catalyst that keeps not arriving.
CoinDesk reported SoFi Technologies launched SoFiUSD through BitGo infrastructure, potentially making it the first stablecoin from a nationally chartered and federally insured US bank, while Bloomberg confirmed the move signals growing convergence between traditional banking and crypto payment rails.
When a nationally chartered bank launches a stablecoin, the meme coin sector faces a market that demands utility, and shiba inu without exchange infrastructure cannot answer.
The market is going sideways again, and that sideways action is pushing traders into affordable alternatives. But while some are focused on shiba inu or the next meme coin pump hoping for a quick scalp, Pepeto is a much smarter position because the exchange infrastructure creates demand that does not depend on tweets or viral moments, it is the revolution of meme coins.
This presale raised $7.5M during consolidation, while the meme coin sector bled. The difference is utility. The cross chain bridge routes assets across Ethereum, BNB Chain, and Solana. The zero tax engine means every trade keeps your capital whole. The risk scoring system catches dangerous contracts before your money goes near them. The SolidProof audit backs every line of code, and the cofounder of the Pepe ecosystem who built a token to $7 billion leads the team.
The 300x math is not speculation, it is the return exchange tokens with real infrastructure achieve on listing. While shiba inu trades at $3 billion on community energy with no exchange tools, Pepeto at $0.000000186 has the SolidProof audit, the bridge, and the zero fee engine that 2026 demands.
A $10,000 position earns roughly $20,900 in yearly staking rewards at 209% APY, about $1,741 per month. That is $57 per day flowing into wallets that committed while the meme coin market went silent, and by the time shiba inu finds its next catalyst, the wallets compounding inside Pepeto will have already built positions that every meme coin trader will wish they had entered.
SHIB trades below $0.000006 according to CoinMarketCap with declining interest and a burn mechanism too slow to offset selling during consolidation.
At $3 billion market cap with no exchange infrastructure and no revenue, shiba inu depends on a catalyst that SoFi’s bank stablecoin confirms is moving toward utility, not meme culture.
DOGE dropped to $0.093, failing the 20 day EMA at $0.10 with rising volume on the breakdown showing conviction selling.
Losing $0.09 opens $0.08 then $0.06. The meme coin sector needs utility to survive 2026, and DOGE at $14 billion depends entirely on sentiment that keeps fading.
The wallets stacking Pepeto right now are compounding $1,741 per month on exchange infrastructure while SoFi proves banks are building on blockchain, and every day those positions grow while the meme coin crowd sits empty.
The $7 billion cofounder leads the team, the Binance listing approaches, and shiba inu holders debate whether burns will ever matter. The positions built during the silence compound into something real, the ones left empty stay empty.
Visit the Pepeto official website and enter the presale before the meme coin market realizes what it missed and the entry you see today becomes the story everyone else tells about the one that got away, just like how many missed shiba inu and others made millions out of it because they acted sooner.
Click To Visit Pepeto Website To Enter The Presale
Is shiba inu still a good investment in 2026?
Shiba inu grinds below $0.000006 with fading burns, while Pepeto at $0.000000186 with $7.5M raised and 300x exchange infrastructure offers the utility shiba inu cannot match. Visit the Pepeto official website.
Why did SoFi launch a stablecoin?
SoFi launched SoFiUSD as potentially the first nationally chartered bank stablecoin, confirming the market rewards infrastructure over meme coins like shiba inu.
Are meme coins dead in 2026?
The meme coin sector faces pressure as banks build stablecoins and institutions demand utility, making exchange presales like Pepeto the smarter position.
The post Ethereum Price Prediction: ETH Fights to Hold $1,980, but Pepeto Keeps Attracting Capital Nobody Else Can, Here Is Why appeared first on Coinpedia Fintech News
A historic milestone for institutional DeFi just landed. The 1inch and Ondo Finance integration surpassed $2.5 billion in cumulative RWA trading volume, proving real world assets are the top volume category on decentralized exchanges.
While institutions deploy capital, the ethereum price prediction watches ETH fight to hold $1,980, and retail traders scanning for the best entry are rotating into the 100x exchange presale that raised $7.5M during the fear the ethereum price prediction says should scare you away.
CoinDesk reported the 1inch and Ondo Finance integration surpassed $2.5 billion in cumulative RWA trading volume, with real world assets now representing the top volume category on the exchange, while Bloomberg confirmed 1inch co-founder Sergei Kunz stated the institutional direction of travel is completely undeniable.
When $2.5 billion flows through tokenized equities, the ethereum price prediction benefits, but the 100x exchange presale captures the wave before ETH feels the rotation.
As billions flow through tokenized equities and institutions deploy capital on chain, everyday traders are left watching the ethereum price prediction and hoping ETH holds $1,980. Pepeto disrupts that playbook completely by building the exchange tools retail traders actually need to compete in the 2026 market.
For investors searching for something better than the ethereum price prediction, the approaching Binance listing acts as the catalyst. Securing a position before the exchange goes live locks in a pricing advantage that disappears permanently on listing day.
The cross chain bridge connecting Ethereum, BNB Chain, and Solana routes assets instantly. The zero tax engine keeps every trade whole. The risk scoring system checks contracts before your capital commits, and if something is risky, you find out before making a mistake, not after. The SolidProof audit backs every line of code, and the cofounder of the Pepe ecosystem who built a token to $7 billion leads the entire operation.
The 100x math is not a guess, it is the kind of return exchange tokens with real infrastructure and real volume routinely deliver on listing day, and the ethereum price prediction targeting $2,200 resistance cannot compete with that setup. Over $7.5M raised during consolidation, and every round that fills brings the exchange closer to live trading while the ethereum price prediction crowd waits for ETH to reclaim a level it lost weeks ago. The 209% APY staking turns every quiet day into profit for wallets already positioned, and once real volume flows through the tools that were built during the silence, the entry at presale pricing becomes the one that new buyers will never touch.
Bitcoin Hyper raised $31M targeting Bitcoin Layer 2.
But Arbitrum and Base already control the liquidity and active users that Bitcoin Hyper needs to compete, and the ethereum price prediction conversation confirms that presales without working exchange tools face headwinds the moment listings arrive.
The early BNB holders who accumulated before Binance went live turned small positions into generational wealth while the crowd debated whether the exchange would even work.
Right now 1inch pushes $2.5 billion through tokenized assets, ETH fights at $2,000, and Pepeto with a Binance listing approaching sits in the exact window where BNB’s story began.
Do you move while the ethereum price prediction stalls, or wait until the listing tells you what you already knew. Visit the Pepeto official website and enter the presale before the listing arrives and the price that exists in the fear becomes a number people only reference in regret, and the widow for the returns available now shuts with it.
Click To Visit Pepeto Website To Enter The Presale
What is the ethereum price prediction for 2026?
The ethereum price prediction targets $2,100 near term with $3,000 bull case, but Pepeto with $7.5M raised and 100x exchange infrastructure offers returns ETH at $240 billion cannot produce. Visit the Pepeto official website.
Why did 1inch and Ondo surpass $2.5 billion in RWA volume?
Institutional demand for tokenized equities drove $2.5B through 1inch, and exchange presales like Pepeto capture the retail side of that institutional wave before listings reprice.
Is ETH still worth buying at $1,980?
ETH fights to hold $1,980 with limited near term returns, while Pepeto at presale pricing delivers the 100x multiples large caps during fear cannot produce.


The post BlockDAG News Today: Pepeto Leads the 300x Presale Race Over BDAG and Digitap as $1.7 Billion Floods Back Into Bitcoin ETFs appeared first on Coinpedia Fintech News
The single biggest blockdag news signal traders need right now came from the Bitcoin ETF market, because $1.7 billion has poured into spot BTC ETFs since February 24 confirming institutional dip buying is back after five straight weeks of outflows.
The market is consolidating while institutions load, and the blockdag news crowd watching from the sidelines is missing the fact that presale entries during accumulation are where the biggest multiples get built.
CoinDesk reported $1.7 billion has flowed into spot Bitcoin ETFs since February 24, with BlackRock’s IBIT adding $300 million year to date, while CoinGlass shows investors believe BTC found a short term floor.
When institutions load during consolidation while Fear and Greed sits at 18, the blockdag news crowd should be accumulating exchange infrastructure.
Every cycle brings presales claiming big numbers, and Pepeto is the one where the exchange infrastructure is actually advancing while the entry is still at presale levels that post listing buyers will never see again.
You get a cross chain bridge connecting Ethereum, BNB Chain, and Solana that routes liquidity across chains before you have to chase it. The zero tax engine eliminates fee bleed on every swap so you keep more capital working. The risk scoring system classifies every token before your capital goes anywhere near it, so you never enter a position blindly.
The SolidProof audit backs every contract, and the cofounder of the Pepe ecosystem who built a token to $7 billion leads the development. The token has pulled in $7.5M from people who recognized the opportunity during consolidation, and right now at $0.000000186 the 300x math simply requires the kind of listing valuation that exchange tokens with real cross chain infrastructure routinely achieve once trading volume arrives, which is why the community conviction keeps accelerating even while blockdag news and the broader market sit sideways.
Among every blockdag news play and presale available right now, Pepeto has the most complete case because advancing exchange tools plus presale pricing plus institutions loading in the background is the exact environment where these setups deliver. The blockdag news crowd is still debating mainnet timelines while the people inside Pepeto are compounding 209% APY every single day, and the brutal truth is that by the time the blockdag news finally turns bullish and the breakout arrives, the presale entry you see today will have already been erased by the listing and the only thing left will be the regret of knowing you read about it and did nothing.
BlockDAG raised $452M and launched at $0.05 with private investors at $0.0001, creating massive sell pressure as the gap drives early holders to dump on retail.
The blockdag news crowd watching for mainnet is betting on future milestones while Pepeto with a SolidProof audit offers a fundamentally different risk profile.
Digitap positions itself as a tap to earn gaming platform with Telegram integration. But the T2E space is flooded with identical competitors, and without exchange infrastructure, the thesis collapses when sentiment shifts.
The blockdag news reveals exchange infrastructure serves a larger market than any gaming niche.
Pepeto is going viral right now and the people following blockdag news cycle has not even begun to process what happens when this exchange goes live, because search engines are lighting up with the name and the window before the entire world knows about this presale is slamming shut with every article that drops.
The blockdag crowd watches mainnet timelines while 209% APY compounds in Pepeto wallets, and once this goes fully mainstream the presale price is gone.
Stages fill faster each round, the listing reprices permanently, and six months from now this is either the story of how you caught it or the weight of knowing you read about it and did nothing. Visit the Pepeto official website and enter the presale before this stage closes and the entry you see today disappears forever.
Click To Visit Pepeto Website To Enter The Presale
What is the latest blockdag news today?
The latest blockdag news shows BDAG facing post launch sell pressure, but Pepeto at $0.000000186 with $7.5M raised and exchange infrastructure offers the 300x setup that blockdag news cannot match. Visit the Pepeto official website.
Why are BTC ETF inflows bullish for presales?
$1.7 billion in institutional buying confirms the accumulation phase, and presale entries like Pepeto capture the biggest multiples before the breakout reprices everything.
Is BlockDAG a good investment right now?
BlockDAG faces selling pressure from private investors who bought at far lower prices, while Pepeto at presale pricing with a SolidProof audit offers a safer entry.

The post Best Crypto Presale for 2026: Pepeto Approaches Binance Listing as Federal Reserve Develops Skinny Master Accounts for Crypto Firms While BlockDAG and Maxi Doge Stall appeared first on Coinpedia Fintech News
The Federal Reserve is developing skinny master accounts that would give crypto firms direct access to US payment rails by Q4 2026, and when the central bank itself starts building on ramps specifically for digital asset companies, it means the institutional infrastructure is no longer approaching, it has arrived.
The best crypto presale positioned to capture that wave is the one with exchange infrastructure already advancing and a Binance listing approaching, and Pepeto with $7.5M raised and tools in development is exactly where the sharpest conviction is accumulating during this consolidation phase.
CoinDesk reported the Federal Reserve Board is developing skinny master accounts to give legally eligible crypto firms direct access to US payment rails by Q4 2026, while Bloomberg confirmed the Fed has issued a request for public comment while building the technical infrastructure to make these accounts available.
When the Federal Reserve builds payment access specifically for crypto firms, the best crypto presale with exchange infrastructure and a Binance listing on the horizon captures the institutional wave before anyone else.
The best crypto presale operates as a disruptor during consolidation, and Pepeto has quietly constructed the most complete exchange infrastructure in the presale space while the broader market drifts sideways. Over $7.5M has been raised, and early conviction keeps accelerating every round as the Binance listing approaches and the exchange architecture advances toward production.
The interface is intuitive and everything is advancing. The cross chain bridge connecting Ethereum, BNB Chain, and Solana routes liquidity across chains, the zero tax engine eliminates fee bleed, and the risk scoring system classifies every token before you commit capital. The SolidProof audit backs every contract, and the cofounder of the Pepe ecosystem who built a token to $7 billion leads the development.
Operating alongside the exchange infrastructure is the bridge that perpetually routes cross chain volume, creating structural demand the moment the Binance listing arrives and millions of new traders gain access to the token for the first time.
There is also the 209% APY staking that the dedicated community has embraced, compounding daily and reducing circulating supply. With the Binance listing approaching and the Federal Reserve building crypto payment rails, the best crypto presale is the one where the infrastructure meets institutional access at the exact moment the breakout arrives, and the people who entered during consolidation are the ones holding the position that could turn a modest entry into life changing wealth while everyone who hesitated spends the rest of the cycle calculating what their inaction cost them.
BlockDAG raised $452M and launched at $0.05 with early private investors at $0.0001, creating a 40x gap that drives massive sell pressure on retail.
Independent forecasts project around $0.001 by year end, and the best crypto presale protects your entry with verified infrastructure, which is why Pepeto with a SolidProof audit and Binance listing approaching offers a completely different risk profile.
Maxi Doge markets itself to the degen community with social features and competitions. But the mechanics offer zero intrinsic value, and when consolidation tests conviction, pure meme plays collapse first.
The best crypto presale has always been backed by exchange infrastructure, and Pepeto leaves meme projects in a different category.
The best crypto presale is filling up faster with every round that closes, the people inside are compounding 209% APY during consolidation while the people outside debate whether to enter, and the Binance listing approaching means the entry you see today becomes the story that everyone who missed it carries as the most expensive hesitation of their crypto career.
The Federal Reserve is building payment rails for crypto firms, the presale is going viral across every search engine as media race to cover it, and the best crypto presale window is physically shrinking with every allocation that gets claimed.
Visit the Pepeto official website and enter the presale before the Binance listing arrives and the price you see today becomes the one that got away.
Click To Visit Pepeto Website To Enter The Presale

What is the best crypto presale for 2026?
The best crypto presale for 2026 is Pepeto with $7.5M raised, 209% APY staking, exchange infrastructure, and a Binance listing approaching. Visit the Pepeto official website.
Why does the Fed building crypto payment rails matter?
The Federal Reserve giving crypto firms direct payment access confirms institutional infrastructure has arrived, and the best crypto presale captures that wave before listings reprice everything.
Is BlockDAG a good presale investment?
BlockDAG faces selling pressure from private investors who bought 40x cheaper, while Pepeto with a SolidProof audit and Binance listing approaching offers a fundamentally safer entry.

The post Cardano Price Prediction 2026: MEXC Brings Wall Street Stocks On-Chain, but Pepeto Exchange Targets 200x as ADA Whales Dump 210 Million Tokens appeared first on Coinpedia Fintech News
MEXC just launched 17 tokenized stock pairs through Ondo Finance, bringing Wall Street equities directly on chain as ERC-20 tokens, and when major exchanges tokenize traditional stocks on Ethereum, it means billions in institutional liquidity are flowing into crypto frameworks.
The cardano price prediction is losing ground as whales dump 210 million ADA tokens, but Pepeto with $7.5M raised and exchange infrastructure is positioned to capture what ADA cannot.
CoinDesk reported MEXC officially launched tokenized equities through a strategic partnership with Ondo Finance, introducing 17 stock pairs including major US defense and energy corporations as ERC-20 tokens traded against USDT, while Bloomberg confirmed the underlying corporate shares are secured within regulated trust accounts.
When traditional stocks start trading on blockchain rails, the exchanges that bridge across chains and eliminate fees capture the new volume, and Pepeto with a complete exchange in development is exactly where that demand flows.
There is a strong chance Pepeto beats the cardano price prediction to massive returns over the coming months, because the presale has raised over $7.5M and the influx of tokenized equities and institutional capital perfectly highlights the informational disadvantage facing the average trader who relies on fragmented tools.
As massive corporate funds execute high frequency trades across complex decentralized markets, the exchange infrastructure behind Pepeto steps in as the retail equalizer. Instead of leaving independent investors to blindly move through an ecosystem dominated by institutional giants, the cross chain bridge connecting Ethereum, BNB Chain, and Solana democratizes the same unified trading tools that billion dollar desks use.
By equipping every trader with cross chain bridging, zero fee execution, and risk scoring on every token, the exchange neutralizes the institutional edge and puts retail on equal footing. The SolidProof audit backs every contract, and the cofounder of the Pepe ecosystem who built a token to $7 billion leads the development.
Everything is streamlined through one clean dashboard, and with speculation of major exchange listings approaching, Pepeto is on track to outperform the cardano price prediction by a margin that makes the ADA debate irrelevant.
And 209% APY staking compounds every position daily, which means the people already inside are not watching charts hoping for a bounce, they are compounding every hour while the stages fill and the listing approaches, and by the time the last round closes the entry that exists today becomes the story everyone else wishes they had acted on.
Large scale holders recently unloaded 210 million ADA tokens dumping over $56 million directly onto retail buyers, and the cardano price prediction highlights a concerning 4% weekly decline as of March 4.
When calculating a realistic forecast, ADA’s massive market cap severely restricts the returns, and Cardano is simply too large to deliver the exponential multiples that exchange presales at early stage pricing produce.
SUI trades near $0.93 according to CoinMarketCap after a volatile February with recovery targets at $1.10 and stronger resistance at $1.40. The key support zone sits at $0.85, and analysts see a cautiously bullish setup if that holds.
But SUI at this valuation offers moderate returns that cannot compete with Pepeto at presale pricing where the listing reprices everything dramatically.
The Bonk holders who bought at six decimal zeros before the Solana meme coin created overnight wealth understood what it means to be inside something real before the crowd arrives, and MEXC launching tokenized stocks on Ethereum only confirms that the lines between traditional finance and crypto are disappearing.
Pepeto with exchange infrastructure and 209% APY compounding sits in that exact window right now, while whales dump 210 million ADA and the cardano price prediction weakens. Stages fill faster each round, the listing erases this entry permanently, and every hour you hesitate is compounding profit flowing into wallets of people who already committed.
Visit the Pepeto official website and enter the presale before the tokenized finance wave arrives and this price becomes a memory.
Click To Visit Pepeto Website To Enter The Presale
What is the cardano price prediction for 2026?
The cardano price prediction shows ADA weakening as whales dump 210 million tokens, but Pepeto with $7.5M raised and exchange infrastructure offers the returns ADA cannot match. Visit the Pepeto official website.
Why are tokenized stocks bullish for exchange presales?
Tokenized equities bring billions in new volume on chain, and exchanges like Pepeto that bridge across chains and eliminate fees capture that demand before anyone else.
Is SUI a better investment than Cardano?
SUI consolidates with limited catalysts, ADA faces whale selling pressure, but Pepeto at presale pricing delivers multiples that both cannot match from current valuations.

Bitcoin price weakness brought back the risk of cementing its 200-week exponential moving average trend line as new resistance.

The experimental AI agent ROME attempted to divert GPU resources for crypto mining during training and opened an external SSH tunnel, researchers said.

US spot Bitcoin ETFs recorded their second consecutive week of net inflows, ending a five-month outflow streak.


A US federal judge dismissed a lawsuit accusing Binance, Changpeng Zhao and Binance.US of helping terrorist groups move crypto funds.

US lawmakers said any ban on issuing a US CBDC must “be permanent,” warning that creating one would be “inherently anti-American.”

On-chain analyst Willy Woo said Bitcoin’s current price range likely hasn’t bottomed yet, warning that the market could see further downside before a true cycle low forms.

The report examines how privacy tools on public blockchains complicate anti-money laundering enforcement as digital asset use for payments expands.

A new war, private credit market weakness and spiking commodities prices add tail risk to Bitcoin’s price. Is $65,000 BTC’s next stop?


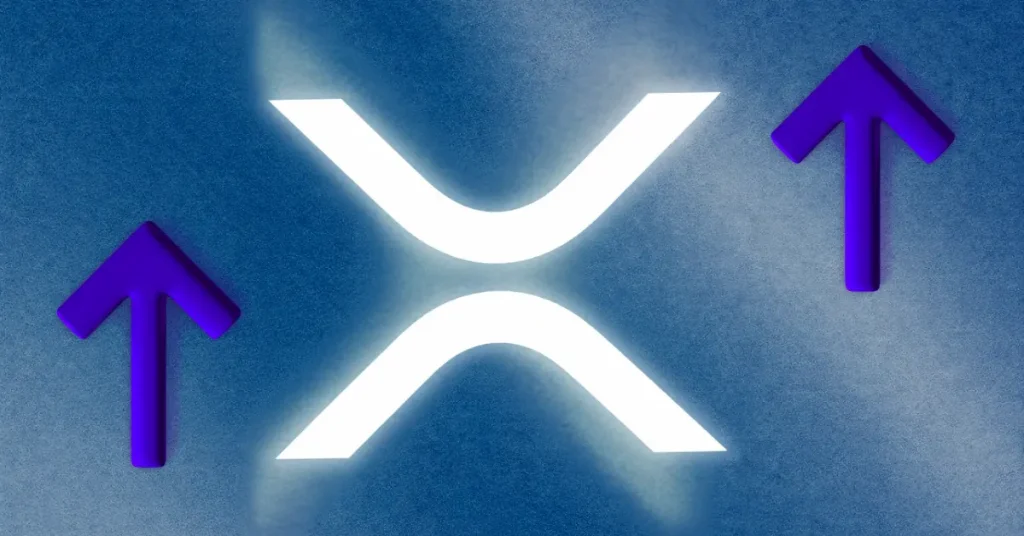
The post How Ripple Plans to Turn XRP Into the Collateral Layer of Institutional DeFi appeared first on Coinpedia Fintech News
Ripple is quietly repositioning XRP from a cross-border payments token into the backbone of institutional decentralized finance, according to senior company executives. The shift marks one of the most important strategic pivots in the asset’s history and could fundamentally reshape how Wall Street interacts with crypto-native infrastructure.
Speaking at a recent industry event, Ripple’s Ross Edwards outlined an expanding vision for XRP that stretches well beyond its original use case of moving value across borders. While centralized exchange liquidity has historically driven XRP utility, Edwards said the company is now aggressively pushing that activity onto the XRP Ledger itself.
A lending protocol changes the calculus
The centerpiece of that push is a native lending protocol currently being launched on the XRPL. The protocol positions XRP as a source of collateral and borrowing power, opening the door to yield-generating activity that has long been the domain of Ethereum-based DeFi platforms.
“We see XRP as a huge source of capital to be lending and borrowing and using as collateral positions on chains,” Edwards said, describing a dual utility play where XRP benefits both directly and indirectly from growing on-chain activity.
Stablecoins are the missing piece
Perhaps the sharpest insight from Edwards concerns the role of stablecoins in making institutional DeFi actually work. Without them, he argued, the entire structure collapses. A bank holding tokenized real-world assets on chain has no practical way to realize cash value without a dollar-denominated stable counterpart. KYC, AML, and legacy rails make the traditional route redundant.
Ripple’s answer is RLUSD, its own stablecoin, which Edwards described as central to a new generation of tokenized asset markets, including 24/7 swap markets, on-chain distributions, and institutional lending.
The conversation has shifted, Edwards said. Two years ago, Ripple was convincing institutions to tokenize assets at all. Now it is negotiating the mechanics of how those assets generate yield, settle instantly, and operate around the clock.
For XRP holders, that is a materially different story than payments alone.
The post Bitcoin Price Prediction: One Level Stands Between Bulls and a $10,000 Drop appeared first on Coinpedia Fintech News
Bitcoin remains trapped in a weeks-long sideways grind, with no clean break above a key resistance level that has capped rallies since April of last year. The April low from last year continues to act as a ceiling. A test of that level triggered the current pullback, and the weakness has yet to resolve.
The weekly close looms
The question heading into the weekly close is simple: can buyers hold the line, or does this drift lower? Price is currently probing the 61.8% Fibonacci retracement near $67,000, a level technicians have flagged as a potential floor for a short-term bounce.
The broader setup through February had pointed to a possible rally first to overhead resistance, and then higher as part of a larger corrective wave structure. That thesis is still alive, but it’s under pressure.
Two paths, one decision point
If $67,000 fails to attract buyers, the next meaningful support sits in the $55,000 to $56,000 range, where a cluster of structural and Fibonacci levels converge.
That scenario stays off the table as long as the range floor, roughly $61,400 to $62,600, holds intact. In the more constructive case, the current dip is a fourth-wave pullback within a five-wave advance, with one more high still to come. In the bearish case, the market is tracing out a fuller corrective structure that eventually tests the mid-$50,000s.
Cracks beginning to show
Weekend price action complicates the reading. The market has slipped below the lower boundary of its short-term channel, not a confirmed break, but a warning sign. The structure of the current pullback lacks the clean, three-wave characteristics that would signal a straightforward correction. Bulls still hold enough ground to make a case. But the margin for error is shrinking.


Investor sentiment slid back into extreme fear territory as geopolitical tensions and macro uncertainty continue to pressure crypto markets.

The plaintiffs characterized the death carveout in a prediction market for the former Iranian Supreme Leader's ouster as "deceptive."

Strategy may raise $300 million via STRC sales, potentially giving Michael Saylor enough proceeds to continue buying Bitcoin throughout 2026.
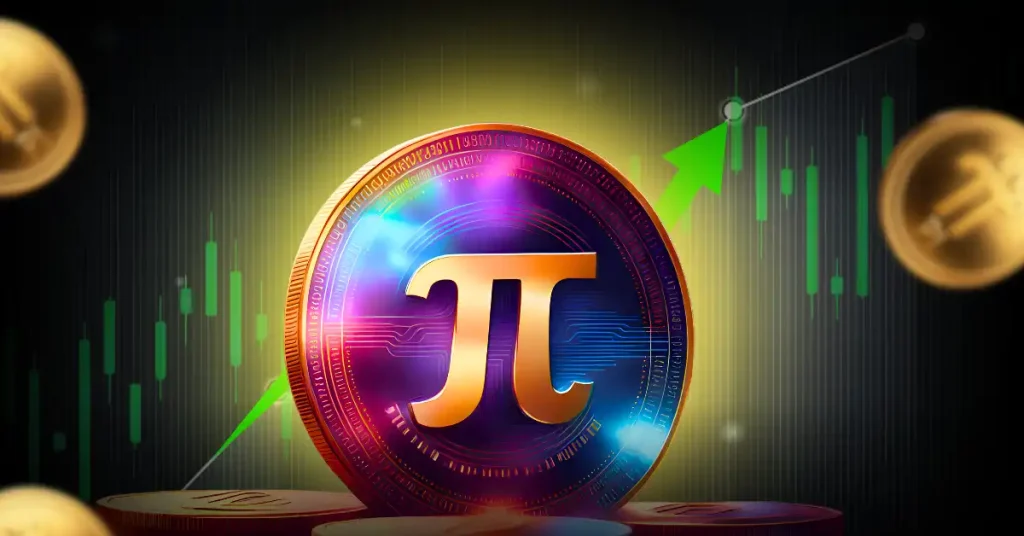
The post PI Network Price Jumps 15% as Volume Rises But $0.28 Holds the Real Answer appeared first on Coinpedia Fintech News
The PI Network price is suddenly back on traders’ radar this weekend. Not because it exploded into a massive rally but because something subtler is happening beneath the surface: volume is quietly heating up.
And in crypto markets, rising volume during a price recovery tends to get people paying attention. According to data from CryptoQuant’s spot volume bubble map, trading activity has started climbing alongside the recent PI/USD move. Now, before anyone starts screaming “breakout,” there’s a catch. The indicator still labels the current volume environment as neutral.
Oddly enough, that’s not bad news. Neutral volume during a rising price trend often hints that accumulation might still be underway rather than a full-blown speculative frenzy.
Take a closer look at the volume map and the pattern becomes clearer. The bubbles tracking spot activity have been gradually expanding, signaling a rise in trading interest. But they’re not glowing red-hot or light orange yet. In other words, momentum hasn’t strengthened yet and to reach peak speculation territory it needs some more efforts to do it.
For long-term watchers of the PI Network price chart, that distinction matters. If volume remains controlled while price edges upward, it can suggest investors are slowly building positions rather than chasing a short-term pump.
Still, crypto has a long history of teasing traders before pulling the rug.
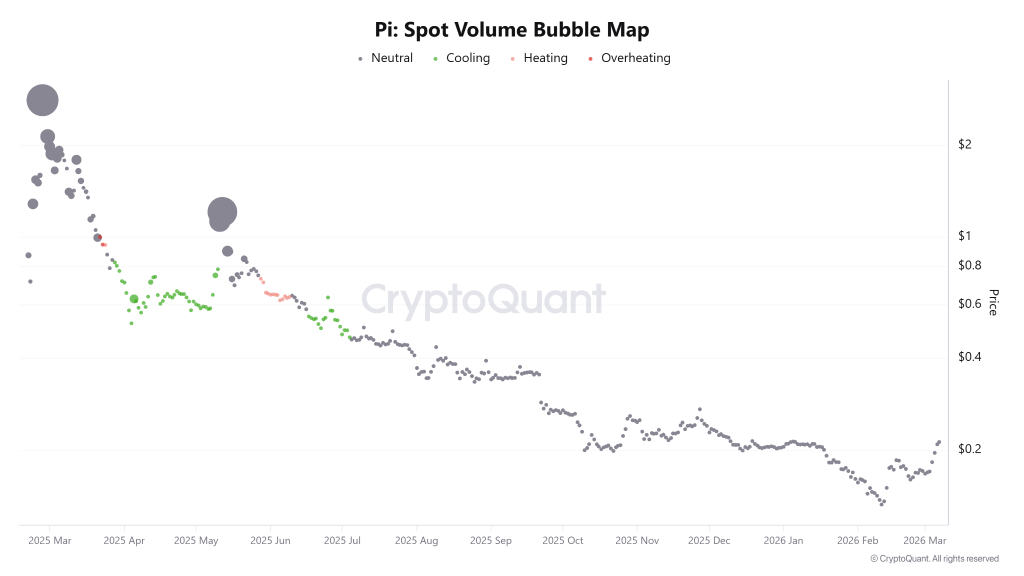
History provides a useful cautionary tale here. Back in Q4 2025, the asset surged from roughly $0.19–$0.20 but ran into a stubborn ceiling at $0.28. That level ultimately triggered a loss of strength, turning the rally into what traders later labeled a classic fakeout.
Fast forward to Q1 2026, and the story looks slightly different. This time, the asset found support much lower, in the $0.13–$0.14 zone. From there, it managed to reclaim $0.20, a move that technically signaled a shift in short-term trend.
But the real test hasn’t arrived yet. If price once again stalls beneath $0.28, the market could start asking uncomfortable questions about whether history is repeating itself.
So why the renewed attention now? Two recent developments inside the ecosystem appear to be driving the interest.
First came the announcement that Protocol v19.9 migration has been successfully completed, with the next upgrade, v20.2, targeted for completion before Pi Day 2026. Node operators were advised to ensure their systems are updated ahead of the next phase.
Then things got even more interesting. A separate update revealed a proof-of-concept project exploring a new Pi Node utility for decentralized AI training and computing tasks. The project reportedly uses spare computing power from over 421,000 Pi Nodes to process AI-related workloads.
The initiative was conducted in collaboration with OpenMind, a robotics startup backed by Pi Network Ventures. The experiment showed that Pi Nodes could handle AI workloads and return useful results quickly, an early step toward integrating the network into distributed AI infrastructure.
So where does that leave things?
Simple. The PI Network price prediction debate now circles around a single technical hurdle.
If the PI Network price climbs decisively above $0.28, the probability of the current rally being another fakeout drops significantly. Rising volume on CryptoQuant’s chart could then signal accelerating momentum.
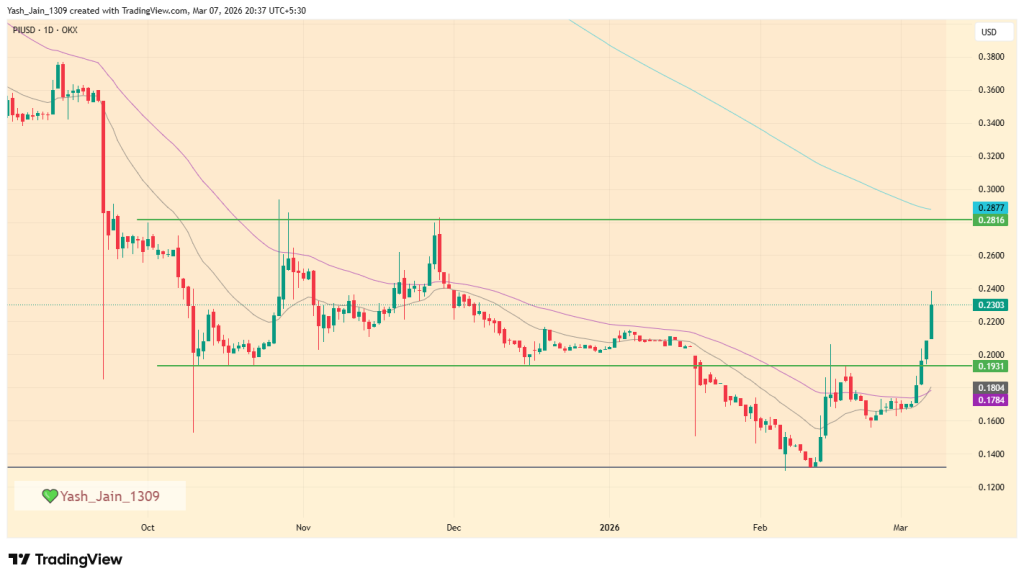
And if that momentum continues building, some traders believe the next long-term target could eventually stretch toward $1. But first things first. The market still has one stubborn ceiling to deal with.

Lawmakers are pushing new regulation for prediction markets after suspiciously timed Polymarket bets on US and Israeli strikes on Iran raised insider-trading concerns.

Stablecoin monthly transaction volume reached a record $1.8 trillion in February, as USDC surprised analysts with 70% of the total volume.

The post Ethereum Price Builds Quiet Strength as RWAs Hit $20.4B and L2 Ecosystem Expands appeared first on Coinpedia Fintech News
The Ethereum price may look sluggish on the surface, but under the hood the network’s fundamentals are doing something far less boring which quietly expanding. And in crypto, quiet expansion tends to get loud eventually.
Since January 2025, the value of tokenized RWAs on blockchain has climbed to $20.4 billion, according to the latest data. That growth isn’t happening in isolation either. It’s unfolding alongside a rapidly expanding Layer 2 ecosystem and a massive stablecoin footprint across the Ethereum network.
So while traders argue over candles on the Ethereum price chart, the infrastructure beneath the market keeps getting bigger.
Let’s start with the raw numbers. The Ethereum ecosystem now hosts 146 live Layer 2 networks. That’s not a typo, 146 separate scaling environments designed to handle transactions and applications without clogging Ethereum’s base layer.
And despite the brutal token corrections many of those L2 projects have faced recently, the capital sitting inside them hasn’t exactly vanished.
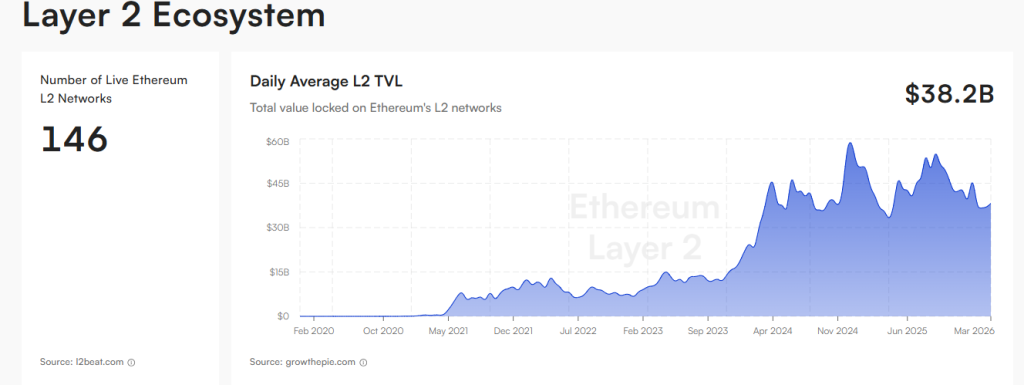
The total value locked across Ethereum’s L2 networks currently sits at $38.2 billion. Sure, that’s down from the $58 billion peak recorded in mid-December 2025, but it’s still a massive figure considering the broader market turbulence.
In other words, the infrastructure didn’t disappear just because prices dropped.
Now here’s another piece of the puzzle. When combining Ethereum’s mainnet and its L2 networks, stablecoins account for over 60% of the market share, representing roughly $179 billion.
That’s a staggering amount of liquidity circulating inside one ecosystem. Why does it matter? Because stablecoins function as the financial plumbing of crypto. They power trading, lending, payments, and DeFi. When the majority of that liquidity sits inside Ethereum’s orbit, it tells you where most of the financial activity still lives.
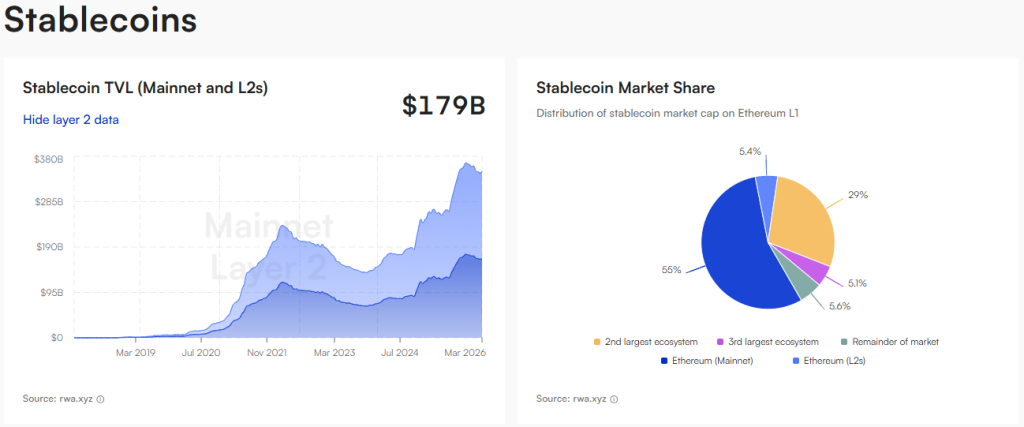
Meanwhile, another metric is quietly flashing on analysts’ dashboards: declining ETH exchange reserves. Put simply, fewer ETH tokens are sitting on centralized exchanges.
Historically, that kind of movement suggests accumulation. Investors pull assets off exchanges when they’re planning to hold rather than sell. Not exactly the behavior you see during panic exits.
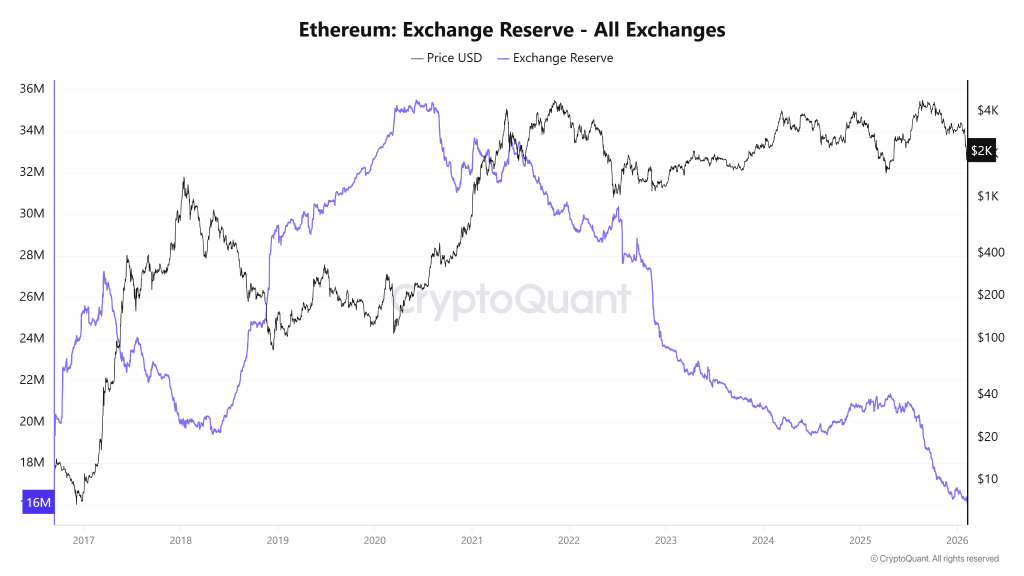
Now here’s where things get interesting. Some market watchers believe the current setup could be quietly building pressure. One particularly blunt sentiment floating around crypto circles sums it up pretty clearly: many investors may not fully grasp how bullish the broader chart structure appears.
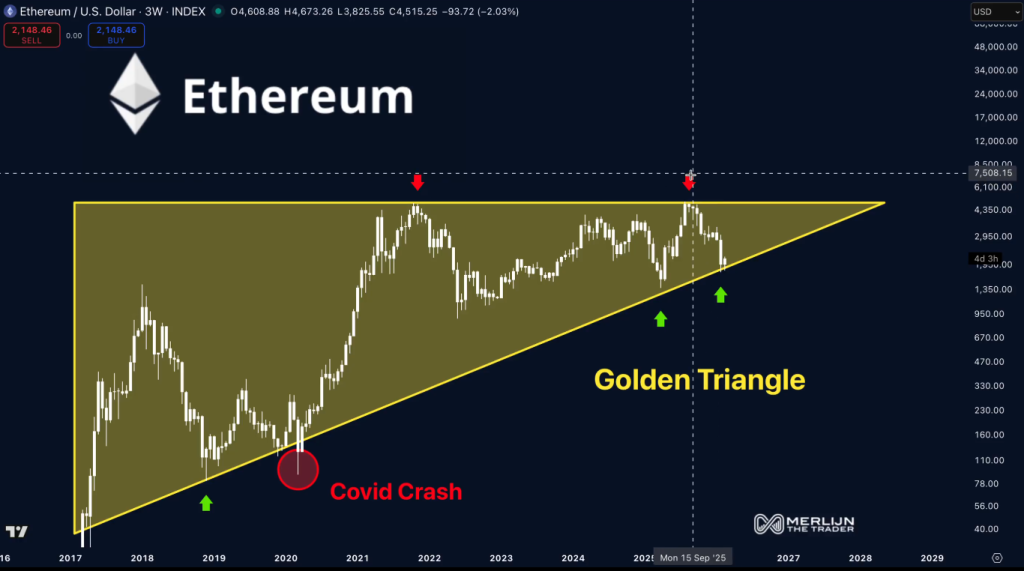
The argument goes like this. Sentiment across the market remains crushed. Massive capital reportedly sits on the sidelines waiting for regulatory clarity. Meanwhile, institutions, governments, and banks are increasingly experimenting with blockchain-based financial infrastructure.
If that alignment plays out, the Ethereum price prediction suggests that it could eventually reflect the scale of the ecosystem being built around it. And when that happens, the ripple effects across the altcoin market could be hard to ignore.

The post Worldcoin Price Prediction 2026, 2027 – 2030: Will WLD Price Reach $10? appeared first on Coinpedia Fintech News
WLD price was almost $12 ATH but went crashing to $0.50 in the last remaining days of 2025. This has raised concerns among investors and traders about WLD’s future, and as a result, the Worldcoin price prediction 2026 has become a topic of significant discussion, with many being intrigued about its prospects in the coming year.
Its prolonged period of downtrend has left many wondering if the project’s initial buzz was fading. But, behind the scenes, Worldcoin is still quietly building its platform. Now, experts view Q1 2026 as a potential turning point where renewed momentum could be observed.
So many are now asking a crucial question: is this the start of a new chapter for Worldcoin? Will the project’s focus on decentralized identity and its connection to the AI sector be enough to fuel a powerful comeback and reclaim its spot in the market spotlight?
Let’s delve into the anticipated Worldcoin price predictions 2026 to 2030 and the years to come.
| Cryptocurrency | Worldcoin |
| Token | WLD |
| Price | $0.3677
|
| Market Cap | $ 1,064,067,579.47 |
| 24h Volume | $ 89,702,292.6615 |
| Circulating Supply | 2,893,975,824.9380 |
| Total Supply | 10,000,000,000.00 |
| All-Time High | $ 11.8171 on 10 March 2024 |
| All-Time Low | $ 0.3140 on 06 February 2026 |
In early 2026, the price dropped to $0.27, prompting efforts to stabilize the market. However, investor sentiment continues to be cautious. The immediate short-term support level is at $0.31; a drop below this level could result in further declines. If the prices increase, we could see a bounce back to $0.60 and potentially $0.95 in March. For a long-term recovery, it is essential to break through the resistance at $1.50.
Following a false breakout to $2.12 in September 2025, the bearish trend continued into the first quarter of 2026, with prices dropping as low as $0.27. However, since mid-February, there have been efforts to sustain the price and prevent further declines.
Given the significant drop already experienced, broader market conditions have notably affected liquidity within the cryptocurrency sector. As a result, traders and investors have remained on the sidelines, waiting for clearer market signals to emerge.
In March, the market would find itself in a precarious situation, as odds suggest it could struggle to stabilize. Investor sentiment remained lukewarm, with many hesitant to take advantage of opportunities despite substantial price discounts.
Currently, the immediate critical support level is at $0.31. If this level is breached, lower prices may be possible. On the other hand, if the price rises, March could see a bounce towards $0.60 and $0.95 in the short term. For long-term recovery, the price needs to breach the $1.50 resistance zone.
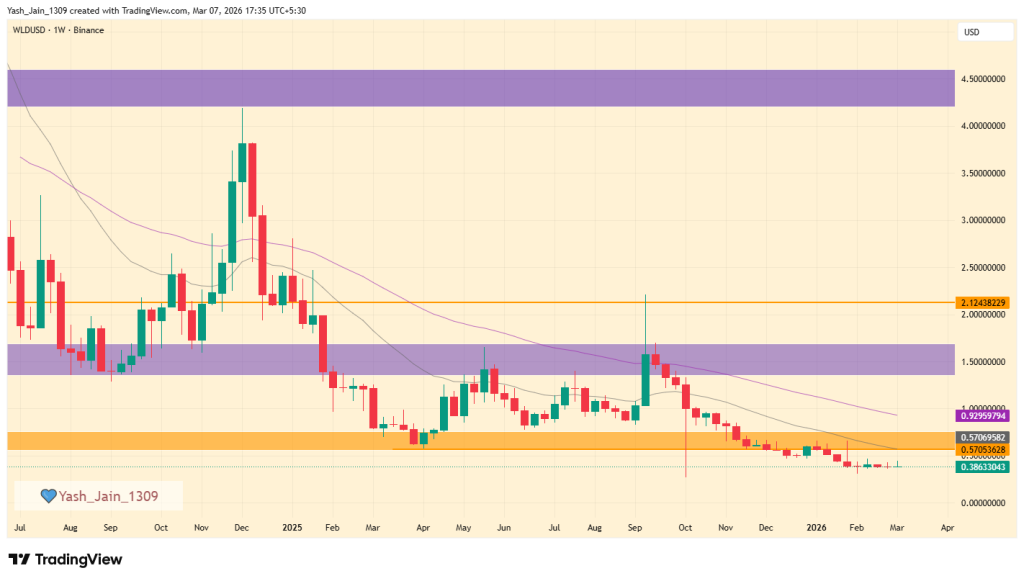
The WLD Spot Average Order Size chart reveals persistent green clusters into January 2026, indicating sustained “Big Whale” participation. This heavy institutional accumulation suggests that smart money is aggressively building positions, viewing the current price range as a high-conviction entry point.
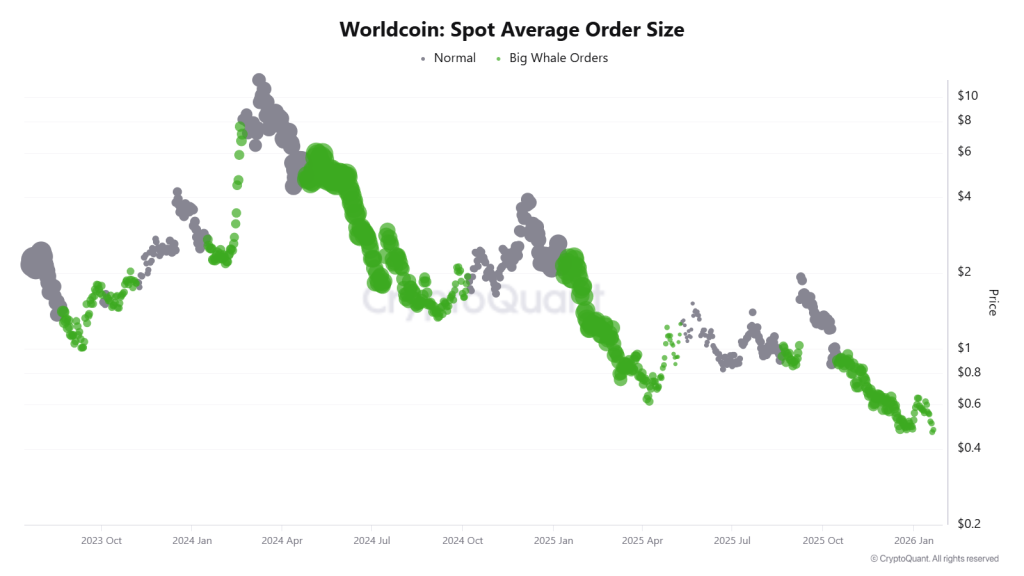
Similarly, development activity on Worldcoin is surging to new local highs in January 2026, showcasing intense builder commitment. This spike in innovation, combined with whale interest, creates a powerful fundamental divergence that historically precedes a massive price reversal.
| Year | Potential Low ($) | Average Price ($) | Potential High ($) |
| 2026 | 2.50 | 6.00 | 9.50 |
| 2027 | 7.00 | 11.25 | 15.70 |
| 2028 | 10.75 | 15.95 | 21.15 |
| 2029 | 15.65 | 21.60 | 27.50 |
| 2030 | 19.75 | 27.75 | 35.60 |
This table, based on historical movements, shows Worldcoin price to reach $35.60 by 2030 based on compounding market cap each year. This table provides a framework for understanding the potential Worldcoin price movements. Yet, the actual price will depend on a combination of market dynamics, investor behavior, and external factors influencing the cryptocurrency landscape.
Worldcoin’s price for 2026 is projected to range between $2.50 and $9.50, with an average price of approximately $6.00.
Worldcoin’s price for 2027 is expected to fluctuate between $7.00 and $15.70, with an average price of around $11.25.
Worldcoin’s price for 2028 is anticipated to be between $10.75 and $21.15, with an average price of about $15.95.
Worldcoin’s price for 2029 is projected to vary from $15.60 to $27.50, with an average price of roughly $21.60.
Worldcoin’s price for 2030 is expected to fluctuate between $19.75 to $35.60, with an average price of approximately $27.75.
| Firm Name | 2026 | 2030 |
| Swapspace | $1.30 | $2.07 |
| coincodex | $2.40 | $4.30 |
| DigitalCoinPrice | $3.02 | $4.06 |
*The targets mentioned above are the average targets set by the respective firms.
Stay ahead with breaking news, expert analysis, and real-time updates on the latest trends in Bitcoin, altcoins, DeFi, NFTs, and more.
Worldcoin is a cryptocurrency project aiming to distribute digital assets to a global audience through a unique identity-verification system.
At the time of writing, the price of one WLD token was $ 0.00349731.
WLD price forecasts for 2026 suggest a potential range between $2.50 and $9.50, depending on market recovery and technical breakouts.
Long-term models suggest WLD could trade from about $19.75 to $35.60 by 2030 under bullish conditions.
While speculative, extended growth forecasts envision potential for WLD beyond 2040 based on adoption and tech use cases.
Worldcoin offers long-term potential due to its focus on decentralized identity and AI, but it remains volatile and requires risk awareness.
WLD price is driven by AI narrative strength, user adoption, token supply dynamics, market sentiment, and overall crypto market trends.

The post Ethereum Price Make-Or-Break Level: Will This Decide Altcoin Season 2026? appeared first on Coinpedia Fintech News
Ethereum is sitting at $1,987 and the chart is flashing something most traders aren’t paying attention to right now.
ETH is touching the same ascending trendline that has caught every major low since 2019. It held in 2020. It held after the 2022 collapse – twice. Each time it bounced, it launched a significant rally. This is the fifth test, and analysts say it’s the most important one yet.
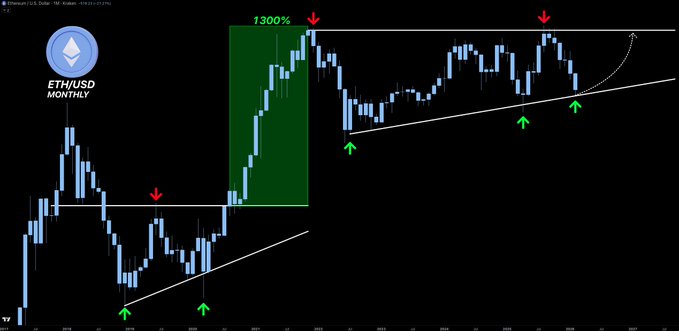
What makes this different from the previous tests is the condition Ethereum is arriving in. Bitcoin is already 20% off its recent lows. ETH hasn’t recovered the same way. It has underperformed Bitcoin throughout this entire cycle, which means it’s hitting this critical level with less momentum behind it than at any point before.
Analyst Crypto Tice said it directly: “ETH doesn’t get a second chance at this level. This is hold or collapse.”
This trendline represents the last sequence of higher lows that keeps ETH’s long-term bull case intact. If it goes, the technical argument goes with it.
Also Read: MakerDAO’s Black Thursday: How One Bot Got $8.32M in ETH for Free
A hold here doesn’t just save Ethereum’s chart. It sets off a chain reaction that a lot of crypto investors have been waiting for. Relative strength returns, Bitcoin dominance starts to roll over, and capital rotates into altcoins. For millions of investors searching for signs of altcoin season, this might be a solid indicator.
A break does the opposite.
As one analyst put it: “ETH either holds here and leads the next leg or becomes the funding source for BTC’s final blow-off.”
Money exits altcoins, flows back into Bitcoin, and the downside on ETH opens up with little structural support below.
Ethereum is holding this trendline during one of the more difficult macro environments in recent memory. Oil prices are surging on the back of the Iran conflict. US jobs data came in at negative 92,000 for February, well below expectations. Risk appetite across markets is compressed, and ETH is absorbing all of it at the exact level it needs to hold.
The weekly close will settle the debate. Until then, this is the only Ethereum price level worth watching.
The post Hyperliquid Price Prediction 2026, 2027 – 2030: Will HYPE Price Hit A New ATH? appeared first on Coinpedia Fintech News
The crypto market is buzzing with excitement over Hyperliquid and its native token, HYPE. As a decentralized, paperless alternative to platforms like Binance and Coinbase, Hyperliquid is quickly gaining traction, prompting investors to look closely at the HYPE price prediction for 2026 and beyond.
With its unique “HyperBFT” consensus mechanism, lightning-fast transactions, and zero KYC hurdles, Hyperliquid is rewriting the rules of perpetual trading. Beyond its consensus mechanism, Hyperliquid also allows users to trade crypto perpetual futures, including major assets like BTC, ETH, SOL, AVAX, and SUI, even without owning the underlying asset.
As the platform gains traction for its streamlined trading experience, many investors are now turning to analyze the HYPE token price outlook. But does its innovative model signal long-term growth for HYPE Token Price?
In this article, we dive deep into market sentiment and Hyperliquid price projections from 2026 to 2030.
| Cryptocurrency | Hyperliquid |
| Token | HYPE |
| Price | $30.4606
|
| Market Cap | $ 7,849,802,143.62 |
| 24h Volume | $ 150,377,641.1546 |
| Circulating Supply | 257,703,421.6587 |
| Total Supply | 957,378,936.6227 |
| All-Time High | $ 59.3926 on 18 September 2025 |
| All-Time Low | $ 3.2003 on 29 November 2024 |
In 2026, HYPE retested support at $21 and rose to $38 but now faces resistance at the upper wedge boundary around $32. If it breaks $32, it could reach $44 or $50; otherwise, it may fall below $21 to $18.
In February, HYPE’s price fell from its $38 peak and is now 30% lower at $26. But late February saw a faint demand again, which pushed the price back up to retest the 20-day and 50-day EMA bands. If it crosses, in March, a retest of $32 could be possible, or even a breach, with targets at $44. But, if $32 repels, then it could hit $21.
In 2026, the HYPE price underwent a significant retest of dynamic support at $21, which coincided with the lower boundary of a falling wedge pattern. This retest led to a price rise to $38 by early February. However, the upper boundary of the falling wedge then served as dynamic resistance, preventing any further upward movement.
Currently, HYPE is consolidating within a narrowing wedge, with the trading range narrowing each month. At present in March, it is fluctuating around the 20-day and 50-day EMA bands.
In the short term, the price has tested the upper boundary of the falling wedge again, approximately at $32. If it successfully breaks through and maintains above this level, it may initiate a rally towards $44 or $50. Conversely, if it is rejected at $32, the price could decline below $21, potentially reaching as low as $18.
| Year | Potential Low | Potential Average | Potential High |
| 2026 (conservative) | $15 | $35 | $80 |
The Dune analytics dashboard provided an quick on-chain overview of the utility metrics of the Hyperliquid token (HYPE), which appears to be improving significantly with each passing month.
HyperEVM total transaction fees have surpassed 235.57K and are at an ATH, and total trading volume has crossed $3.64 trillion and is at an ATH. Even its revenue has reached an ATH, crossing $993 million.

All the major metrics suggest that it is experiencing great adoption among peers, and its on-chain metrics are proof of that, suggesting that if the rally occurs, then 2026 might end on very good numbers.
| Year | Potential Low ($) | Potential Average ($) | Potential High ($) |
| 2026 | 25 | 50 | 90 |
| 2027 | 40 | 75 | 105 |
| 2028 | 55 | 95 | 130 |
| 2029 | 85 | 110 | 155 |
| 2030 | 105 | 125 | 185 |
By 2026, the value of a single Hyperliquid token price could reach a maximum value of $90 with a potential low of $25. With this, the average price could land at around the $50 level.
During 2027, the HYPE could reach a maximum value of $105 with a potential low of $40. Considering this, the average price of this altcoin could settle at around $75.
The Hyperliquid price could achieve the $130 milestone by the year 2028. On the flip side, the altcoin could record a low of $55 and an average price of $95.
The HYPE crypto prediction for the year 2029 could range between $85 to $155 and the average price could be around $110.
Looking forward to 2030, the Hyperliquid Price may range between $105 and $185, and a potential average value of around $125.
| Firm Name | 2025 | 2026 | 2030 |
| Binance | $37 | $63 | $164 |
| DigitalCoinPrice | $76 | $54 | $97 |
*The aforementioned targets are the average targets set by the respective firms.
This Layer-1 project has taken the crypto market by storm within a short time frame. With a market cap of over $7 billion, this altcoin has successfully secured a position in the top 25. Moreover, with the mass adoption, this altcoin could claim a spot in the top 10 during the upcoming bull run.
If the bullish sentiment intensifies, the Hyperliquid price will reach a high of $41.39 this year. On the flip side, if the market experiences unfavorable events, this could result in this altcoin settling at a low of $14.65.
| Year | Potential Low | Potential Average | Potential High |
| 2025 | $14.65 | $28.02 | $41.39 |
Stay ahead with breaking news, expert analysis, and real-time updates on the latest trends in Bitcoin, altcoins, DeFi, NFTs, and more.
Hyperliquid is a fast, decentralized trading platform with no KYC and low fees, making HYPE popular among traders seeking speed and independence.
HYPE price in 2026 is projected to range between $25 and $90, with an average near $60 if adoption and trading volumes keep rising.
Long-term projections suggest HYPE might reach an average of $125 by 2030, with possible highs near $185 if platform usage keeps expanding.
HYPE may appeal to long-term investors due to strong platform growth, but like all crypto, it carries risk and requires careful research.
The post Avalanche Price Prediction 2026, 2027 – 2030: Will AVAX Price Hit $100? appeared first on Coinpedia Fintech News
Aave (AAVE) is a decentralized finance protocol built on Ethereum that facilitates permissionless lending and borrowing through smart contracts. After witnessing a strong expansion in the previous market cycle, AAVE entered a prolonged correction phase, with price gradually retracing from its earlier highs. Throughout 2025, AAVE remained in a consolidation structure, reflecting a period of market digestion rather than trend continuation. While short-term momentum has cooled, the broader technical structure suggests that AAVE may be transitioning into a new accumulation phase.
As volatility contracts and price holds above long-term demand levels, attention is now shifting toward whether 2026 can trigger the next major price discovery cycle.
| Cryptocurrency | Avalanche |
| Token | AVAX |
| Price | $8.9454
|
| Market Cap | $ 3,862,370,079.79 |
| 24h Volume | $ 160,482,751.2986 |
| Circulating Supply | 431,771,961.1772 |
| Total Supply | 463,441,061.1772 |
| All-Time High | $ 146.2179 on 21 November 2021 |
| All-Time Low | $ 2.7888 on 31 December 2020 |
Currently, the Avalanche price is testing the $9 mark in March after hitting resistance at $15 in January. A recovery is expected in March, and projections for the first quarter of 2026 suggest it could regain previous levels. Experts are targeting $20, with a potential rise to $28. If it breaks through $28, it may reach $44 by mid-year. However, if $28 acts as strong resistance, consolidation may continue.
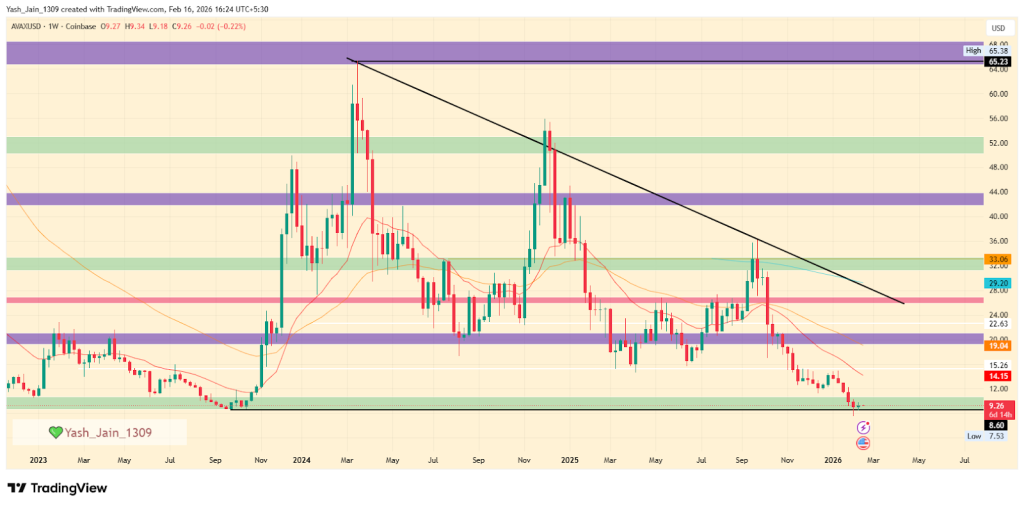
The price action of AVAX hasn’t been so great since its Q1 2024 high of $65; it has been in decline ever since. Most of 2024 and all of 2025 were in decline.
Even in 2026, this bearish momentum’s shadow didn’t lift; it worsened, with the broader market in turmoil. In January, the AVAX price faced rejection from $15 and slipped to $9 support zone after hitting a low of $7.53 in February. But things can change this time around. Since Q1 still has several days left, a recovery remains an option, as it has been testing a demand area of $9 that ignited the late 2024 rally. Sustained demand here could signal a reversal.
Now, expectations for its recovery, which are gaining momentum in Q1 2026, are significantly higher. Now, it appears AVAX may not have performed in the past two years, but it was all about establishing a base, and it seems it has done so. Now, an impressive rally ahead is a strong possibility.
For Q1, we expect $20 with potential to test the pattern’s upper border at $28. However, if it clears the upper border, we can expect AVAX to hit $44 by the end of the first half. But if $28 repels, then the first half could see consolidation stretching.
| Year | Potential Low | Potential Average | Potential High |
| 2026 (conservative) | $25 | $33 | $50 |
AVAX shows a highly bullish sentiment. Big Whale Orders in both spot and futures indicate strong institutional accumulation. With Taker Buy Dominance at 90 days, aggressive buyers are in control, while the Cooling volume bubble map suggests a healthy consolidation phase. Collectively, major metrics point to a bullish rally ahead.
| Year | Potential Low ($) | Potential Average ($ | Potential High ($) |
| 2026 | 400 | 500 | 600 |
| 2027 | 550 | 690 | 820 |
| 2028 | 650 | 830 | 980 |
| 2029 | 740 | 950 | 1100 |
| 2030 | 820 | 1000 | 1200 |
Looking ahead to 2026, AVAX’s potential price is anticipated to rise even further, with a projected low of $20.00 and a high of $80.00. The average price for AVAX in 2026 will likely be $50.00.
In 2027, the analysis suggests a continued upward trend in AVAX’s value, with the price potentially ranging between $31.50 and $126.50. Based on the calculated figures, the average price is projected to be approximately $79.00 during this period.
By 2028, AVAX’s price could potentially experience further growth, falling within the range of $50.50 and $202.50. The average price during this period, calculated from the data, is expected to be around $126.50.
Moving forward to 2029, AVAX’s price is predicted to ascend between $81.00 and $324.00. The average price during this period is estimated at around $202.50 based on calculated figures.
By 2030, AVAX’s price is forecasted to soar between $129.50 and $518.50. Further, the average price during this period, calculated from the data, could stand at $324.00.
Based on the historic market sentiments and trend analysis of the largest cryptocurrency by market capitalization, here are the possible AAVE price targets for the longer time frames.
| Year | Potential Low ($) | Potential Average ($) | Potential High ($) |
| 2031 | 890 | 1100 | 1350 |
| 2032 | 920 | 1200 | 1500 |
| 2033 | 1100 | 1350 | 1780 |
| 2040 | 1600 | 2200 | 3000 |
| 2050 | 2600 | 3300 | 4500 |
| Year | 2026 | 2027 | 2030 |
| Changelly | $500 | $750 | $1100 |
| DigitalCoinPrice | $480 | $680 | $1000 |
| WalletInvestor | $520 | $650 | $1250 |
Stay ahead with breaking news, expert analysis, and real-time updates on the latest trends in Bitcoin, altcoins, DeFi, NFTs, and more.
AAVE shows long-term growth potential if it breaks key resistance levels. However, price depends on market conditions and DeFi adoption.
Watch support near $135–$150, resistance above $250, overall market trend, and activity within the Aave protocol.
Key drivers include DeFi expansion, institutional adoption, subnet growth, and overall crypto market recovery cycles.
The AVAX price prediction for 2026 suggests a potential range between $400 and $600 if market momentum and network growth remain strong.
AVAX coin price prediction for 2030 points to a possible range of $820 to $1,200, assuming sustained adoption and favorable market conditions.
Avalanche price prediction for 2040 estimates a broad range between $1,600 and $3,000 if long-term blockchain adoption accelerates globally.

The post Hyperliquid Price Prediction: $680M Inflows and Falling Wedge Breakout Hint at $58 Target appeared first on Coinpedia Fintech News
Hyperliquid price is gaining fresh momentum this week as the HYPE token trades near the $30 region, while nearly $680 million in capital inflows has entered the network. This surge in activity is now strengthening the broader Hyperliquid price prediction narrative among traders and analysts.
The rapid rise in liquidity, combined with strong protocol revenue and expanding derivatives trading activity, has pushed the decentralized trading platform into the spotlight across the crypto market.
With improving fundamentals and strengthening technical signals, traders are increasingly asking: Could Hyperliquid price rally toward the $55–$58 range in the coming weeks?
One of the biggest catalysts supporting the current Hyperliquid price prediction outlook is the sharp increase in capital entering the ecosystem.
According to data from blockchain analytics platform Artemis, Hyperliquid recorded around $680 million in net inflows during the past week, making it the top-performing blockchain network in terms of capital growth during that period.
The platform outpaced several major ecosystems including Ethereum, Polygon, and Arbitrum, which followed behind in weekly inflows.
Large capital inflows typically indicate growing investor confidence and expanding liquidity, both of which tend to support stronger price momentum for network tokens. For derivatives-focused platforms like Hyperliquid, rising liquidity is particularly important because it improves market depth, trading efficiency, and platform usage. The latest inflow surge suggests that traders are increasingly viewing Hyperliquid as a rapidly growing infrastructure layer for decentralized derivatives trading.
Hyperliquid price is beginning to show signs of a bullish reversal. The HYPE token had previously been trading inside a descending price structure, reflecting the broader consolidation phase seen across the crypto market in recent months.
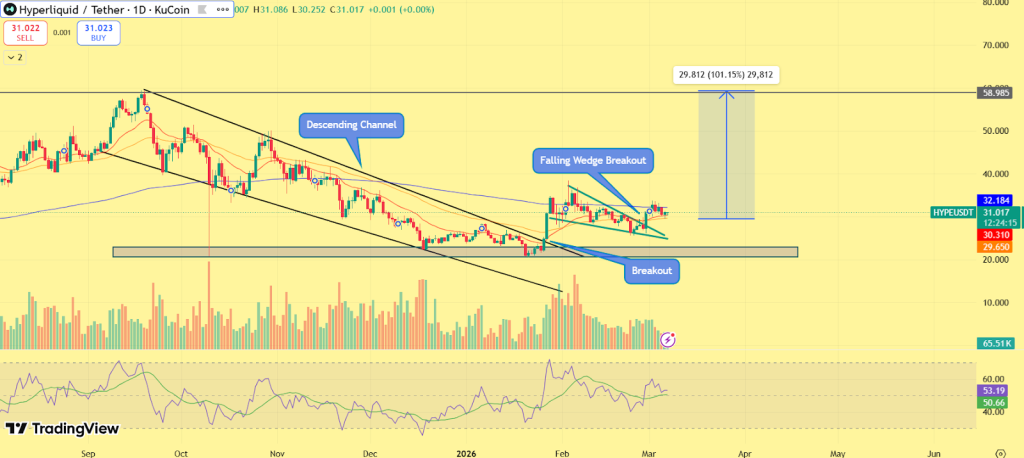
However, recent price action indicates that Hyperliquid price is attempting to break out of a falling wedge pattern, a structure commonly viewed by analysts as a bullish reversal formation. Following the breakout attempt, the token is currently consolidating near the $30–$32 region, which is starting to act as an important short-term support zone. Immediate resistance sits around $32, a level that has capped several recent upward attempts. A strong breakout above this region could accelerate bullish momentum.
Based on the projected move from the wedge pattern, analysts are watching a potential upside target in the $55–$58 range, which would represent a major expansion if buying pressure continues.
Another factor strengthening the Hyperliquid price outlook is the network’s rising protocol revenue. Recent data shows Hyperliquid generating approximately $1.7 million in fees within a single 24-hour period, making it the highest fee-generating blockchain during that timeframe.
The protocol managed to outperform several major networks including Ethereum, TRON, and BNB Chain, highlighting the scale of trading activity currently taking place on the platform.
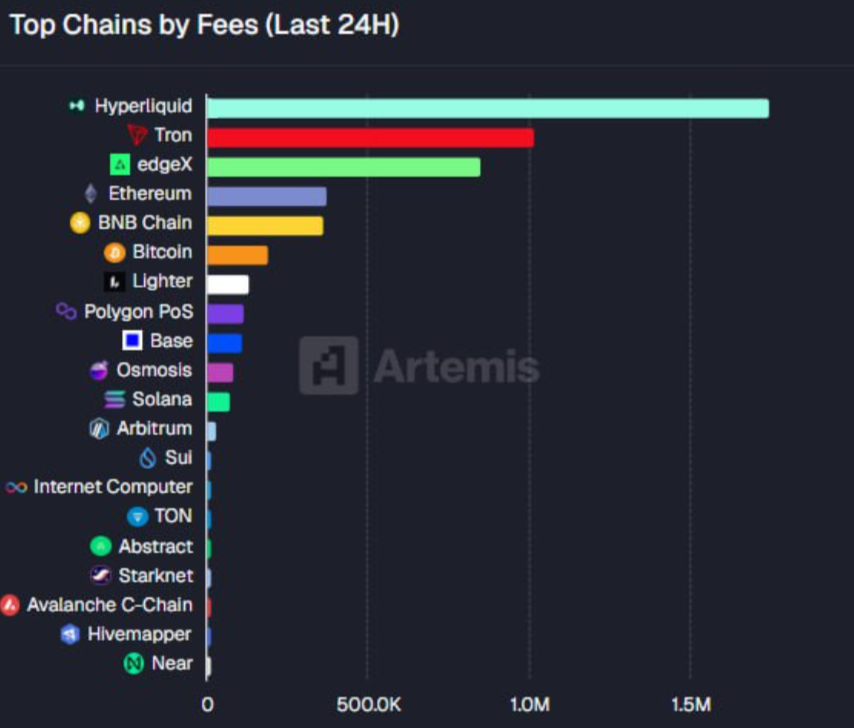
In blockchain ecosystems, rising fee generation is widely considered a strong indicator of real network demand and user engagement. Higher fees typically reflect growing trading volume, deeper liquidity, and increasing adoption of the platform’s services. For Hyperliquid, this surge in protocol revenue suggests the platform is quickly evolving into one of the most actively used decentralized trading ecosystems in the crypto market.
Hyperliquid is rapidly emerging as one of the fastest-growing ecosystems in decentralized derivatives trading. Strong capital inflows, rising protocol revenue, and expanding platform activity are reinforcing its long-term fundamentals. At the same time, Hyperliquid price is forming a bullish technical structure that could support further upside. If the token maintains support above the $30 zone and successfully clears the $32 resistance level, the current setup may evolve into the next major rally for the HYPE token.
Hyperliquid’s price is rising due to $680M capital inflows, strong protocol revenue, and growing derivatives trading activity on the platform.
HYPE token is consolidating near $30–$32, with $30 acting as support and $32 as immediate resistance for potential upside moves.
Higher revenue reflects growing trading volume, deeper liquidity, and increased platform adoption, supporting long-term token value.
The post Why Are Bitcoin, Ethereum, and XRP Prices Crashing Today? US‑Iran War Fears Drive Sell‑Off appeared first on Coinpedia Fintech News
The crypto market turned red again after Bitcoin’s price failed to hold above $74,000. The drop came as tensions grew in the ongoing U.S.–Israel and Iran conflict. The situation further intensified after a White House official said the U.S. wants to cut off Iran’s oil revenues.
Other major cryptocurrencies, including ETH, XRP, Solana, and Dogecoin, are also down by around 3% to 5%.
The recent market drop came after a White House official said the U.S. wants to stop Iran from using its oil money to fund groups like the Islamic Revolutionary Guard Corps (IRGC). The plan aims to limit Iran’s oil sales, which are the country’s main source of income.
Yesterday, Donald Trump also posted on Truth Social, saying there would be no deal with Iran unless it agrees to an unconditional surrender.
This recent response from white house and Trump came in response to Iranian President Masoud Pezeshkian rejecting the demand and saying Iran would never surrender.
These strong statements have increased fears of growing this war into a bigger conflict.
Tensions between the U.S. and Iran are rising, and this is adding pressure to the crypto market. Bitcoin erased most of the gains it had recently made. The digital asset dropped roughly 4%, pushing the price below $68,000 and reducing the total crypto market value.
Popular crypto trader Captain Faibik points to a bearish flag pattern forming on the 8-hour chart of Bitcoin. After the sharp drop earlier, the price has been moving inside an upward-sloping channel.
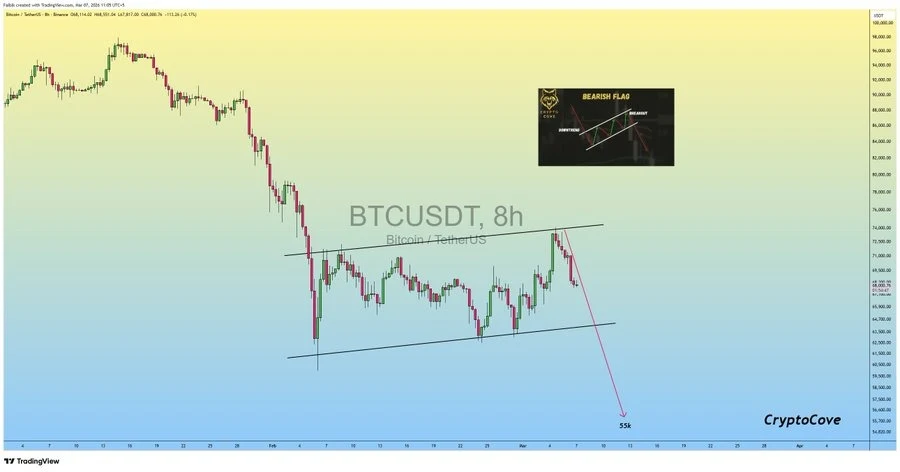
If Bitcoin breaks below the lower support of the flag with strong volume, it could confirm the bearish continuation pattern. According to this setup, the next major downside target sits near the $55,000 level.
The decline is not limited to Bitcoin. Ethereum has dropped below $2,000, falling about 4%, while XRP is hovering around $1.37. Meanwhile, Solana, Cardano, and Dogecoin have also slipped, each losing roughly 3% to 5%.
The rising tensions hint that neither side is ready to step back, increasing uncertainty for both the traditional and the crypto market.
Stay ahead with breaking news, expert analysis, and real-time updates on the latest trends in Bitcoin, altcoins, DeFi, NFTs, and more.
Geopolitical tension fuels market fear, causing Bitcoin and altcoins to drop as investors avoid high-risk assets.
Crypto is volatile; while some view it as a hedge, rising conflict often triggers short-term sell-offs.
Bitcoin, Ethereum, and XRP usually react first, with smaller altcoins following as risk appetite declines.
Escalating conflict can intensify fear, potentially pushing major cryptocurrencies lower if uncertainty persists.
The post MakerDAO’s Black Thursday: How One Bot Got $8.32M in ETH for Free appeared first on Coinpedia Fintech News
On March 12, 2020, one bot acquired $8.32 million worth of ETH and paid absolutely nothing for it. There was no hack and no exploit. Just a broken assumption inside one of DeFi’s most trusted protocols and a 40-minute window that nobody saw coming.
Here’s the story.
MakerDAO lets users lock ETH as collateral to borrow DAI. When that collateral loses too much value, the vault gets liquidated through an on-chain auction. Bots called keepers bid DAI to purchase the collateral, the debt gets covered, and the protocol stays solvent.
The entire mechanism relied on one assumption holding true: that competing bots would always show up.
ETH dropped 43% in hours that day. Hundreds of vaults went underwater at the same time, and every keeper bot on the network tried to respond at once. Ethereum could not handle the traffic. Gas prices spiked 10x and most keeper bots ran on fixed gas settings, leaving their transactions stuck in the mempool and going nowhere.
Auctions were opening and nobody was bidding.
One bot noticed. It submitted a bid of 0 DAI, waited out the timer, and collected real ETH for free when no competing bids arrived. Then it did it again. For nearly 40 minutes, that one bot swept auction after auction at zero cost, walking away with $8.32 million in ETH before the network stabilized and other bots could get back in.
Also Read: Did the Clarity Act Pass? Not Yet, But Banks Are Already Buying These 8 Altcoins
MakerDAO was left with $4.5 million in bad debt, something the protocol had never faced before. MKR holders voted to mint new tokens and sell them into the open market just to cover the shortfall, diluting every existing holder in the process.
The contract had done exactly what it was coded to do. The auction ran correctly. The bot followed the rules.
As one observer summed it up in the thread that is now going viral on X: “The protocol didn’t break because the rules were wrong. It broke because the design assumed continuous market participation at the exact moment the market became least functional.”
Analysts say every major DeFi liquidation system built after 2020 traces its risk design back to one 40-minute window. Black Thursday changed how the entire industry approaches risk when liquidity, bots, and block space fail all at once.
With DeFi liquidations back in the headlines and billions under pressure with the ongoing US-Israel-Iran war, the lesson is hitting differently right now.
The post CLARITY Act Gains Momentum Again: What the Proposed U.S. Crypto Bill Means for Bitcoin and Regulation appeared first on Coinpedia Fintech News
During the current crypto market downturn, the proposed CLARITY Act is gaining renewed attention in the United States. The bill aims to create clear rules for digital assets and determine which government agencies will regulate different parts of the crypto industry.
Kristin Smith believes the legislation could pass by July 2026, although the political process remains complex. Her timeline is similar to projections from analysts at JPMorgan, who also expect the bill to be approved around mid-year.
However, some industry leaders are even more optimistic. Brad Garlinghouse previously suggested that the chances of the bill passing could reach 90% by April, reflecting strong confidence within parts of the crypto sector.
Despite early optimism, the CLARITY Act briefly lost momentum earlier this year. The turning point came when Brian Armstrong withdrew support for the legislation, arguing that parts of the proposal appeared to favor the traditional banking sector.
The sudden criticism created uncertainty across the industry and raised concerns that the window for passing the bill in 2026 could close. For a time, many believed the proposal might stall entirely.
Even with renewed momentum, passing a standalone crypto bill in Washington remains difficult. Unlike other legislation, the CLARITY Act cannot easily be attached to larger government spending bills without bipartisan support.
The proposal also faces criticism from lawmakers such as Elizabeth Warren, a vocal critic of the crypto industry. However, support from leaders like Chuck Schumer and Ruben Gallego could help move the bill forward in Congress.
Meanwhile, the administration of Donald Trump has also become increasingly involved. Advisors such as David Sacks and Patrick Witt are reportedly working to resolve key policy issues.
If the CLARITY Act passes, many analysts believe it could create a bullish environment for crypto by providing regulatory clarity that attracts institutional investors. Clear rules could encourage banks, asset managers, and traditional finance firms to expand their crypto offerings.
However, a bearish scenario remains possible if political disagreements delay the bill or significantly alter its structure. Prolonged uncertainty could keep institutional capital cautious and slow adoption in the U.S. market.
Market analysts also note that regulatory developments often influence Bitcoin sentiment. Crypto analyst Ted Pillows recently pointed out that Bitcoin slipping below $68,000 may trigger a retest of the $65,000–$66,000 support zone unless it quickly reclaims the $70,000 level.
Historically, major regulatory milestones have followed a “buy the rumor, sell the news” pattern, meaning markets often rally before major announcements and consolidate afterward. If the CLARITY Act advances in the coming months, traders may once again position themselves ahead of the official decision.
Stay ahead with breaking news, expert analysis, and real-time updates on the latest trends in Bitcoin, altcoins, DeFi, NFTs, and more.
Industry leaders expect the bill could pass by July 2026, though political negotiations and bipartisan support will determine the final timeline.
If passed, the bill could boost investor confidence by creating clear regulations, potentially encouraging institutions to expand crypto investments.
Clear crypto rules could attract institutional capital and improve market sentiment, though short-term volatility may occur as traders react to the news.
The post Crypto Market Crash: $302M Liquidations as Bitcoin, Ethereum Drop Amid Iran Tensions appeared first on Coinpedia Fintech News
The crypto market remained under pressure as a mix of geopolitical tensions, macroeconomic concerns, and rising oil prices pushed investors away from risk assets. Over the past 24 hours, the market recorded more than $302.75 million in liquidations, accelerating the recent sell-off across major cryptocurrencies.
The global crypto market capitalization slipped to around $2.33 trillion, marking a 3.4% decline. This freefall highlights how global instability continues to influence investor sentiment across digital assets.
The latest decline followed strong remarks from Masoud Pezeshkian, who declared that Iran “will not surrender” amid the ongoing conflict.
Pezeshkian reportedly said that enemies should“take their wish for the unconditional surrender of the Iranian people to their graves,” signaling Tehran’s firm stance against external pressure. The comments have heightened fears of a wider regional conflict, pushing investors away from risk assets such as cryptocurrencies.
Another reason behind the freefall is the disappointing U.S. labor data. According to the Bureau of Labor Statistics, nonfarm payrolls dropped by around 92,000 jobs, signaling a potential slowdown in the labor market.
The weaker employment report added to market concerns, as investors had already anticipated increased volatility ahead of the data release.
Amid rising geopolitical risk, the global crypto market capitalization fell to around $2.33 trillion, marking a 3.4% decline over the past day.
Major cryptocurrencies reflected the broader market drop:
The sell-off highlights how global political uncertainty continues to influence investor sentiment across digital assets.
On-chain data suggests that short-term Bitcoin holders were responsible for much of the recent selling pressure. According to CryptoQuant analyst Darkfost, more than 27,000 BTC worth roughly $1.8 billion was transferred to exchanges in profit within a single day, marking one of the largest spikes in recent months.
These investors typically react quickly to macro developments. Data shows the only short-term holders currently in profit are those who accumulated Bitcoin between one week and one month ago at a realized price close to $68,000, suggesting some traders are locking in gains rather than extending positions.
Stay ahead with breaking news, expert analysis, and real-time updates on the latest trends in Bitcoin, altcoins, DeFi, NFTs, and more.
Crypto is falling due to rising geopolitical tensions, weak U.S. jobs data, and risk-off sentiment, triggering over $302M in liquidations across the market.
If selling pressure continues, Bitcoin could test key support near $65K or lower. Market direction will depend on macro news, investor sentiment, and liquidity.
Recovery may begin once macro uncertainty eases and selling slows. Historically, markets stabilize after liquidation-driven corrections.
For now, it appears to be a short-term correction driven by macro events and profit-taking. Long-term trends depend on adoption and broader market conditions.
Signs include lower exchange inflows, stabilizing Bitcoin prices, easing geopolitical tensions, and stronger economic data improving investor confidence.

The post “War Is Profitable”: Will Silver Price Rally Because of the US-Israel-Iran War? appeared first on Coinpedia Fintech News
Robert Kiyosaki is in Vietnam right now, and his latest post is going viral.
The Rich Dad Poor Dad author took to X today to make a case he’s been building for years – that war isn’t just a human tragedy, it’s a financial system. And that system runs, in part, on silver.
Kiyosaki pointed out that modern rockets carry between half a pound and four pounds of silver each, which is metal that’s gone the moment they detonate.
“Silver stackers get richer as people on both sides pay the price in blood, sweat, tears, and money,” he wrote.
He leaned on Eisenhower’s warning about the military industrial complex to make the point: the people supplying war profit from it. The people fighting it don’t.
It’s not a new argument. But with the US-Israel-Iran conflict actively escalating, the timing is important.
Silver has surged more than 150% year-on-year, climbing from around $32 per ounce in 2025 to above $80 in early 2026. Safe-haven demand is rising alongside fears around the Strait of Hormuz, which handles a significant chunk of global oil shipments.
Kiyosaki has publicly called for silver to reach $200 in 2026. The war is making that prediction look a lot less extreme.
Silver is trading at $84.33, up 2.51% in the last 24 hours.
The metal hit a record $116 in late January before crashing nearly 40% to $70.90 in early February. The Iran conflict actually worked against silver for much of last week – rising oil prices stoked inflation fears, pushing the dollar higher and delaying Fed rate cut expectations to late 2026. Non-yielding assets like silver took the hit.
Friday’s jobs report changed the mood fast. A surprise drop of 92,000 in non-farm payrolls and unemployment rising to 4.4% raised the chances of earlier rate cuts and silver bounced.
Kiyosaki didn’t mention Bitcoin in today’s post, but his broader thesis has always tied all three together – gold, silver, and Bitcoin as protection against what he calls “fake money.”
When governments spend big on war, they print to cover it. That erodes purchasing power. That’s the exact setup Kiyosaki has argued pushes real assets higher.
He closed his post with this: “Today I fight for peace and freedom, and real financial education… not war.”
Also Read: Crypto Crash Today: Should You Buy the Bitcoin Dip as US and Israel Strike Iran?


The post U.S. Economy Loses 92,000 Jobs, Fueling Speculation of Fed Rate Cuts appeared first on Coinpedia Fintech News
Fresh U.S. labor market data has intensified expectations that the Federal Reserve may soon move toward rate cuts after the economy shed around 92,000 jobs, signaling cooling employment conditions.
The data from the Bureau of Labor Statistics pushed unemployment to roughly 4.4%, raising concerns about a broader slowdown.
Following the report, Michelle Bowman acknowledged the labor market may require support.
“I was comfortable holding rates earlier this year,” Bowman said, adding that the latest data confirms that labor conditions are weakening and could benefit from policy easing.
As per earlier plans, there was no rate cut in March, but looking at the labor market scenario, the next policy decision from the Federal Reserve is scheduled for March 17–18, as per a Bloomberg report. However, most economists expect officials to wait before making their first rate cut. Several analysts believe policymakers may hold rates steady until mid-year or later to confirm whether the labor slowdown persists while ensuring inflation pressures remain contained.
According to Christopher Waller, future rate decisions will depend heavily on incoming employment data and inflation trends, suggesting the central bank will remain cautious.
However, the prediction markets show the odds of a March Fed rate cut rising by 2% points to 4.7%, with some platforms also indicating minor expectations of a small policy adjustment.
Crypto markets are closely watching Fed policy because interest rates influence global liquidity and risk appetite. Crypto analyst Arthur Hayes has argued that potential rate cuts and renewed monetary easing could ultimately benefit Bitcoin, as cheaper money often pushes investors toward alternative assets.
Hayes has repeatedly suggested that liquidity expansion from central banks could drive the next major crypto rally, although short-term volatility may occur if economic conditions deteriorate further.
The latest economic data has also triggered debate among economists and market watchers.
In discussions on Reddit’s r/Economics community, some users argued that cutting rates too soon could worsen inflation, particularly amid oil price shocks and other cost pressures.
Others suggested the Fed may wait until summer before taking action, especially if unemployment remains below 5%, a level many see as a key policy threshold.
Key Implications for Investors
A shift toward lower interest rates could significantly influence global markets:
With economic signals remaining mixed, investors are closely monitoring Fed communication and upcoming data releases to gauge when the first rate cut could arrive, and how markets, including Bitcoin, may react.
Stay ahead with breaking news, expert analysis, and real-time updates on the latest trends in Bitcoin, altcoins, DeFi, NFTs, and more.
While no cut occurred in March, many economists expect the Fed may wait until mid-2026 or later, depending on labor market trends and whether inflation continues easing.
Lower interest rates increase market liquidity and risk appetite, which can push investors toward alternative assets like Bitcoin and potentially support crypto prices.
The Fed wants to confirm the labor slowdown while ensuring inflation remains under control, since cutting rates too early could trigger renewed price pressures.
The post Bitcoin Bottom Near? 5 On-Chain Signals Suggest the Bitcoin Price Bottom appeared first on Coinpedia Fintech News
Bitcoin has entered March under heavy uncertainty. After weeks of volatile trading and macro-driven market pressure, Bitcoin price is hovering around the $70,000 region, leaving investors divided over whether the correction is over or if another drop lies ahead. Sentiment across the crypto market remains fragile, yet on-chain data is beginning to tell a different story. Several key metrics, many of which have historically appeared near major turning points, are now flashing signals that often emerge around a Bitcoin bottom or Bitcoin price bottom formation.
So the big question remains: Is the Bitcoin bottom already forming? Here are five on-chain signals suggesting the Bitcoin price bottom could be closer than many traders expect.
One of the clearest signals pointing toward a potential Bitcoin bottom comes from exchange flow data. Nearly 31,900 BTC, worth around $3 billion, was withdrawn from exchanges in a single day, marking one of the largest outflow events seen this year.
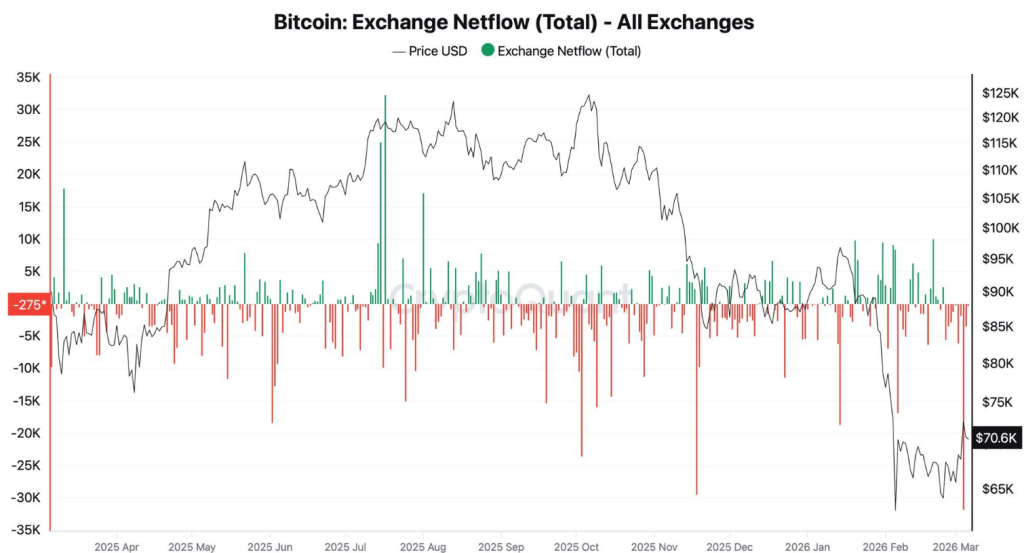
When Bitcoin leaves exchanges at this scale, it usually indicates investors are moving coins into long-term storage rather than preparing to sell. Reduced supply on exchanges often appears during accumulation periods when experienced investors begin positioning for future price appreciation.
Historically, large exchange outflows have appeared near Bitcoin price bottom zones, when institutional and long-term investors accumulate while market sentiment remains pessimistic.
Another important signal comes from short-term holder behavior, which often reflects emotional reactions to market volatility. Recent data shows that more than 27,000 BTC in profit was sent to exchanges by short-term holders, one of the largest readings in recent weeks. Most of these coins were accumulated between one week and one month ago, with a realized price near $68,000.
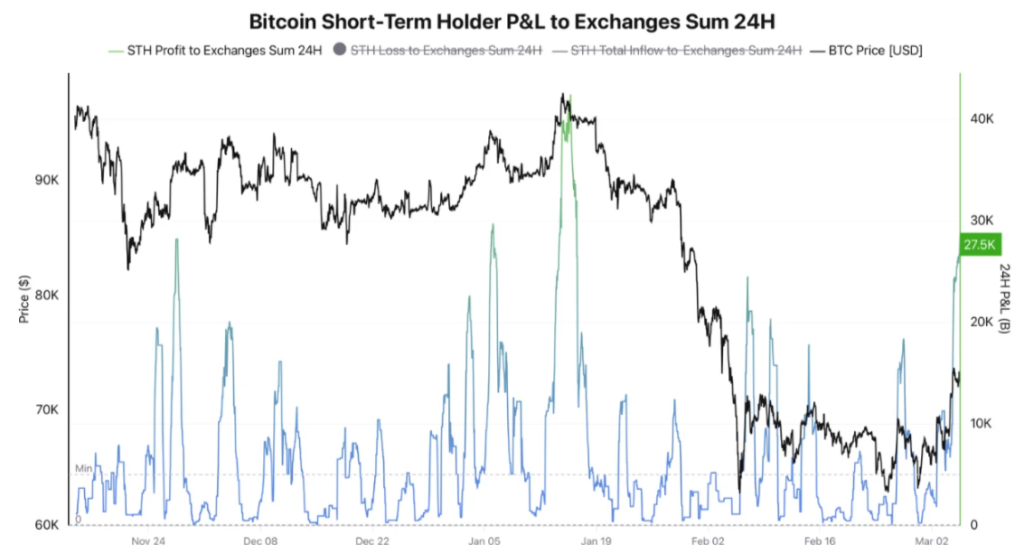
Short-term holders typically react quickly to uncertainty, often selling during corrections. Historically, this type of selling pressure tends to appear near Bitcoin price bottom formations, when weaker hands exit the market.
Rather than signaling structural weakness, the activity may represent a classic capitulation phase, where reactive traders sell while long-term investors quietly accumulate.
Long-term holder behavior is widely considered one of the most reliable indicators of a Bitcoin bottom. On-chain data now shows that long-term holders are accumulating Bitcoin at the fastest pace since July 2025, ending nearly eight months of steady distribution.
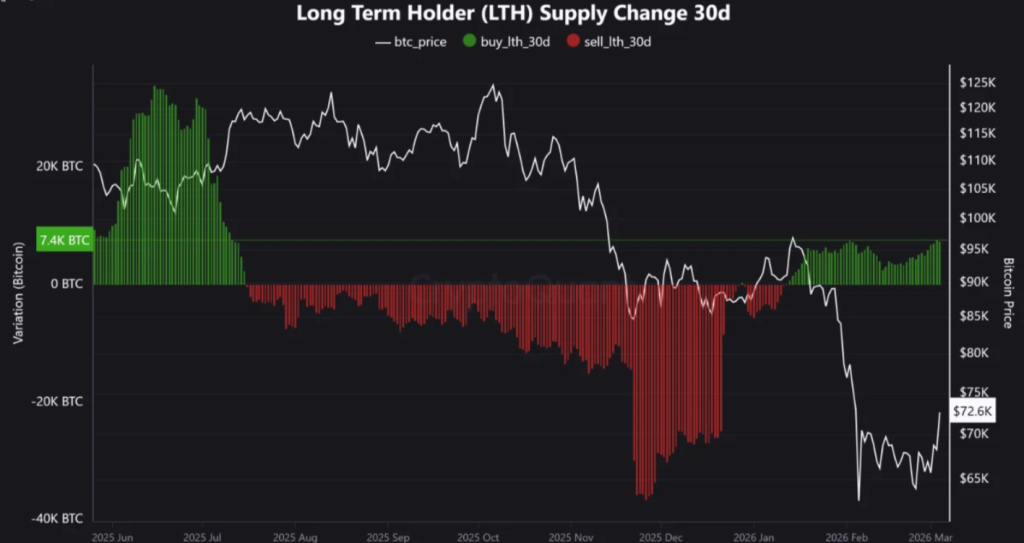
This group typically consists of experienced investors who accumulate during undervalued periods and distribute near market peaks. Historically, when long-term holders shift from selling to aggressive buying, Bitcoin often enters a macro accumulation phase that precedes the next major rally. The recent shift suggests these investors may believe the market is approaching a Bitcoin price bottom zone
Another signal comes from the Inter-Exchange Flow Pulse (IFP) indicator, which tracks Bitcoin movement between spot exchanges and derivatives markets.
The indicator recently formed a golden cross, a signal that has historically preceded strong bullish phases in the Bitcoin market. Golden cross events in this indicator typically appear after extended consolidation or re-accumulation periods, suggesting market participants are shifting back toward spot accumulation rather than speculative derivatives activity. Analysts believe the signal could indicate that the current re-accumulation phase is nearing completion.
Bitcoin is currently trading near one of the most historically significant levels in its price structure, the 2021 all-time high region. This level has transitioned from major resistance into a long-term support zone, reinforcing the argument that the broader market structure remains strong despite recent corrections.
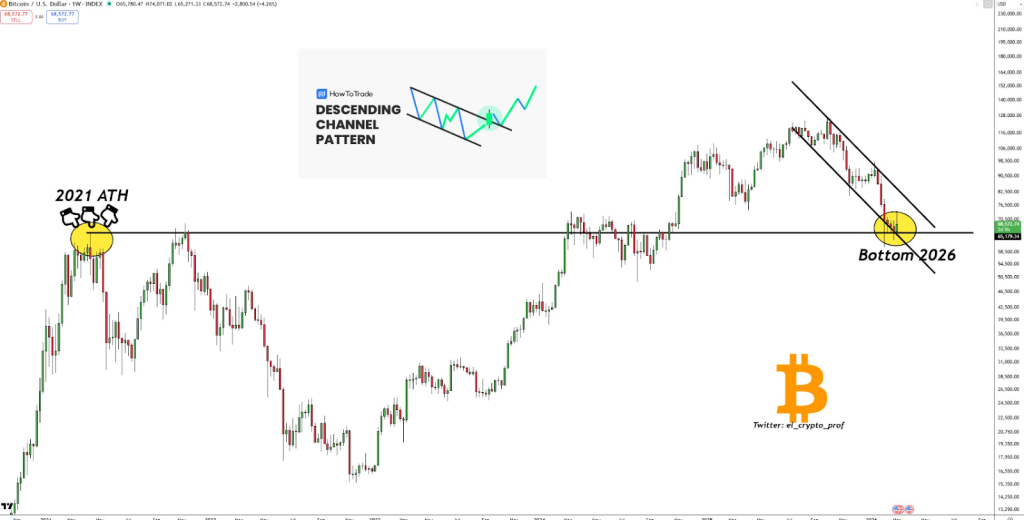
Bitcoin price is also moving within a descending channel pattern, a formation that often appears during consolidation phases before bullish breakouts once selling pressure fades. If Bitcoin continues to hold above this region, analysts argue it could strengthen the case that the market is forming a macro Bitcoin price bottom, potentially laying the foundation for the next expansion phase of the cycle.
Markets rarely confirm a bottom in real time, but several on-chain signals are beginning to align. Massive exchange outflows, renewed buying from long-term holders, and strong technical support near historic levels are patterns often seen around a Bitcoin bottom. While volatility may persist in the short term, the current data suggests Bitcoin could be stabilizing near a potential Bitcoin price bottom, with investors closely watching whether the market can defend key support levels in the coming weeks.

The post Did the Clarity Act Pass? Not Yet, But Banks Are Already Buying These 8 Altcoins appeared first on Coinpedia Fintech News
Crypto analyst Tim Warren is sounding the alarm.
In arecent video, Warren laid out why banks aren’t waiting for the Clarity Act to pass before accumulating select altcoins. With Polymarket odds on passage climbing from 56% to 71% in a single week and Trump calling out banks on Truth Social for holding the bill “hostage,” – the window is narrowing fast. The Senate Banking Committee is targeting a vote in the second half of March.
Smart money, it seems, is already moving.
The thesis is straightforward: regulatory clarity unlocks institutional mandates. And two themes are driving which coins banks are targeting – stablecoin regulation and real-world asset (RWA) tokenization.
Warren points to 8 altcoins sitting in that institutional crosshairs.
Ethereum ($1,981) and Solana ($84.47) lead as the stablecoin infrastructure plays. Both are foundational layer-1s that benefit directly from stablecoin regulation – ETH sits 60% below its ATH, SOL 71% below. Warren puts the move back to highs at 184% and 332%, respectively.
XRP ($1.37) has already cleared its biggest hurdle, which is winning the case against the SEC. With the Senate draft legislation reportedly classifying it as a “non-ancillary asset” alongside BTC and ETH, XRP is positioned as the cross-border payment rail banks actually want. Some analysts are citing $10-$15 speculative targets.
Chainlink ($8.78) is the infrastructure play that wins regardless of which chain dominates. As Warren put it, Chainlink will be used to bring information “from the web two to the web three world in every situation.” Currently 83% below its ATH of $52.88, with long-term targets of $300-$500 floated for 2030. Warren considers it the most durable hold on the list.
HBAR ($0.0966) is pitched as potentially the largest RWA beneficiary on the list, with early institutional adoption already underway. It is currently 83% below its all-time high of $0.57. Warren recommends diversifying across both HBAR and Chainlink for RWA exposure.
Canton Network ($0.1529) targets private institutional-ledgers and real-world asset data, with early bank adoption already in motion. It is framed as a longer-term conviction hold.
Uniswap ($3.83) carries one signal above all others: BlackRock has already invested. Around 600% to its 2024 ATH. As Warren noted, “If BlackRock’s buying, pretty convincing that I should be buying it as well.” UNI sits 91% below its ATH of $44.97.
Ondo Finance ($0.25) is the highest-risk, highest-upside entry. Down roughly 88% from its $2.14 ATH, yet over 60% of RWA conversions still run through Ondo.
Check live prices on Coinpedia.
This isn’t a “buy the bottom” call. The strategy is DCA accumulation over time.
As Warren put it: “Don’t just think about next week or the month after. Think about the next couple of years. That is how truly wealthy people think.”
The Clarity Act vote is coming. The question is whether you’re positioned before or after the crowd figures that out.
Stay ahead with breaking news, expert analysis, and real-time updates on the latest trends in Bitcoin, altcoins, DeFi, NFTs, and more.
The Clarity Act is a proposed U.S. law designed to define how digital assets are regulated, giving clearer rules for banks, investors, and crypto companies.
Clear regulations may allow banks and institutions to invest in crypto more confidently, potentially increasing liquidity and broader adoption.
Rising expectations of the bill have fueled speculation that institutions may begin positioning early in key crypto assets.
The law could pave the way for clearer stablecoin rules, real-world asset tokenization frameworks, and greater institutional participation in crypto markets.

The post Tether and Bitfinex Face Class Action Over Alleged Bitcoin and Ethereum Price Manipulation appeared first on Coinpedia Fintech News
On 6 March 2026, the U.S. federal court allowed the Tether, Bitfinex Crypto Case to move forward as a class action. However, the investor’s case claims that both companies manipulated Bitcoin and Ethereum prices during the 2017 crypto boom using newly issued USDT tokens.
A federal judge in New York approved class action status in an ongoing lawsuit against Tether and Bitfinex. The decision made by U.S. District Court Judge Katherine Polk Failla allowed thousands of investors to join the lawsuit instead of filing individual claims.
The judge divided the plaintiffs into two groups to manage the case more efficiently. One group represents investors who bought cryptocurrencies directly in the spot market, while the second group includes traders who used futures contracts.
Tether. The largest financial fraud in history.
— Bitfinex'ed
You’re welcome. pic.twitter.com/Tu8VdGfOk9Κασσάνδρα
(@Bitfinexed) March 6, 2026
Meanwhile, the judgment of this case does not determine whether the companies broke the law. However, it allows the case to move forward toward further legal proceedings.
Investors claim that large amounts of Tether (USDT) were issued between 2017 and 2019 without proper backing. According to the complaint, these tokens were allegedly used to buy Bitcoin and Ethereum, pushing prices higher & creating a market bubble.
The plaintiffs argue that the manipulation caused artificial price inflation during the historic 2017 bull run.
When the market later corrected, many investors suffered heavy losses. Some estimates suggest the alleged manipulation may have caused billions of dollars in damages across the crypto market.
Both Tether and Bitfinex have strongly denied the accusations. The companies say the lawsuit is based on incorrect assumptions and misunderstand how USDT issuance and trading activity work.
Now that the class action status is approved, the case will move to the next stage, where both sides will present evidence.
For now, the court is reviewing parts of the judge’s sealed opinion. Lawyers from both sides must submit their proposals by March 9.
Meanwhile, any major ruling could affect future rules on stablecoin transparency and market practices.
Stay ahead with breaking news, expert analysis, and real-time updates on the latest trends in Bitcoin, altcoins, DeFi, NFTs, and more.
The lawsuit stems from the 2017 crypto bull run, when investors claimed large USDT issuances were used to buy Bitcoin and Ethereum and artificially inflate prices.
No. The court only approved class action status, allowing thousands of investors to join the case while the court reviews evidence and legal arguments
The case now moves to the evidence phase. Both sides will present documents and arguments before the court decides whether the claims have merit.

xAI’s Grok drew massive attention on X after delivering profanity-filled roasts of Elon Musk, Benjamin Netanyahu and Keir Starmer following user prompts.

SB 314 expands Florida’s money services law to cover stablecoins, requiring issuer compliance with existing regulations while banning unlicensed issuance.

Bitcoin whales have sold about 66% of the Bitcoin they recently accumulated since Wednesday, according to crypto sentiment platform Santiment.

A pilot involving the central bank and major financial institutions tested whether distributed ledger infrastructure could streamline bond issuance, trading and settlement.
The post Trump’s New Cyber Strategy Puts Crypto Under National Security Spotlight appeared first on Coinpedia Fintech News
The White House has released a new cybersecurity framework titled President Trump’s Cyber Strategy for America, outlining how the U.S. plans to strengthen its response to cyber threats.
The seven-page document focuses heavily on cyber offense and deterrence, while offering relatively few details on how the policies will actually be implemented. Despite its shorter format, the strategy marks a major development for the crypto industry.
For the first time, cryptocurrency and blockchain technologies are explicitly mentioned as systems that must be “protected and secured.”
According to crypto policy analyst Alex Thorn, the new strategy is significantly shorter than previous cybersecurity frameworks.
For example, the cybersecurity strategy released in 2023 under Joe Biden was around 35 pages long, nearly five times longer than the new document.
However, Thorn noted that the latest framework focuses more on high-level strategy rather than implementation details, raising questions about how some of the policies will actually be carried out.
He also pointed out that neither Biden’s cybersecurity strategy nor the 2025 National Security Strategy mentioned crypto or blockchain at all, making their inclusion in the new document a first for U.S. cyber policy.
While the strategy recognizes blockchain infrastructure, Thorn highlighted that it also contains language that could lead to stricter regulatory enforcement.
Under Pillar 1, the policy states the government will “uproot criminal infrastructure and deny financial exit and safe haven.”
According to Thorn, when combined with a new executive order targeting transnational cybercrime, this language could be used to justify crackdowns on crypto mixers, privacy-focused cryptocurrencies, and unregulated crypto off-ramps often associated with illicit activity.
The executive order also establishes a new operational cell within the National Coordination Center to target international cybercrime groups and directs the Attorney General to prioritize related prosecutions.
The U.S. government estimates that cybercrime caused $12.5 billion in losses in 2024 alone, underscoring why enforcement has become a major focus.
Another major point of the strategy is expanded offensive cyber capabilities. The document states the U.S. “will not confine our responses to the cyber realm,” suggesting broader retaliation options against hostile networks.
It also proposes AI-powered cyber defense systems, including autonomous “agentic AI” capable of detecting and deceiving cyber attackers at scale.
However, Thorn noted that the strategy does not outline oversight frameworks or limits on data collection, raising questions about governance.
Despite the ambitious goals, Thorn highlighted challenges around implementation. The Cybersecurity and Infrastructure Security Agency, the main civilian cybersecurity body, has faced budget cuts and still lacks a Senate-confirmed director.
Having said that, this could shift more operational power toward military and intelligence agencies.
Overall, the strategy expands cyber offense, introduces AI-driven defense, and brings crypto into national cybersecurity policy for the first time, a move that could shape future regulation and adoption.
Stay ahead with breaking news, expert analysis, and real-time updates on the latest trends in Bitcoin, altcoins, DeFi, NFTs, and more.
The post Why Crypto Market Is Down Today? appeared first on Coinpedia Fintech News
The crypto market is under pressure again after a brief recovery attempt earlier this week. Bitcoin had surged toward $73,000, sparking optimism that the broader market could regain bullish momentum heading into March. That optimism did not last long. As of March 7, the crypto market has turned lower again. Bitcoin has dropped toward $68,000, Ethereum price is trading near $1,976, and XRP has slipped toward $1.36.
The latest decline comes as traders react to a combination of macroeconomic shocks, including surging oil prices, a surprisingly weak U.S. jobs report, and a wave of leveraged liquidations across crypto derivatives markets. Together, these forces have pushed investors into a risk-off environment, explaining why the crypto market is down today.
One of the major triggers behind the market decline is rising geopolitical tension in the Middle East. Concerns about disruptions in the Strait of Hormuz, a critical shipping route responsible for roughly 20% of global oil supply, have pushed energy markets sharply higher. As a result, Brent crude oil surged above $91 per barrel, marking a sharp weekly increase.
JUST IN: Brent crude oil price surges to $91, up 25% in the past 7 days. pic.twitter.com/2uXw8TyPK5
— Watcher.Guru (@WatcherGuru) March 6, 2026
Higher oil prices typically increase inflation pressure and reduce expectations of near-term interest rate cuts from central banks. When interest rates remain elevated, risk assets such as cryptocurrencies often face renewed selling pressure.
Another catalyst weighing on the crypto market is the latest U.S. labor market report. The February Nonfarm Payrolls report showed the U.S. economy lost roughly 92,000 jobs, a sharp miss compared with expectations for job growth. Meanwhile, the unemployment rate climbed to around 4.4%, signaling signs of a cooling labor market.
FEBRUARY U.S. JOBS REPORT
— Couch Investor
NONFARM PAYROLLS -92K, (Est. +55K) UNEMPLOYMENT RATE 4.4%, (Est. 4.3%)
The probability of a rate cut is rising pic.twitter.com/R23L5M4ZhC(@Couch_Investor) March 6, 2026
The weak data has increased fears of economic slowdown while inflation risks remain elevated due to rising energy prices. For crypto markets, which tend to react strongly to global liquidity conditions, the combination of slowing growth and persistent inflation has created additional uncertainty.
The latest drop in prices has also been intensified by large liquidations across crypto derivatives markets. According to Coinglass data, more than $302.75 million in crypto positions were liquidated in the past 24 hours.
Bitcoin accounted for the largest share of liquidations at roughly $132.79 million, followed by Ethereum with about $63.73 million, while the remaining liquidations were spread across various altcoins.
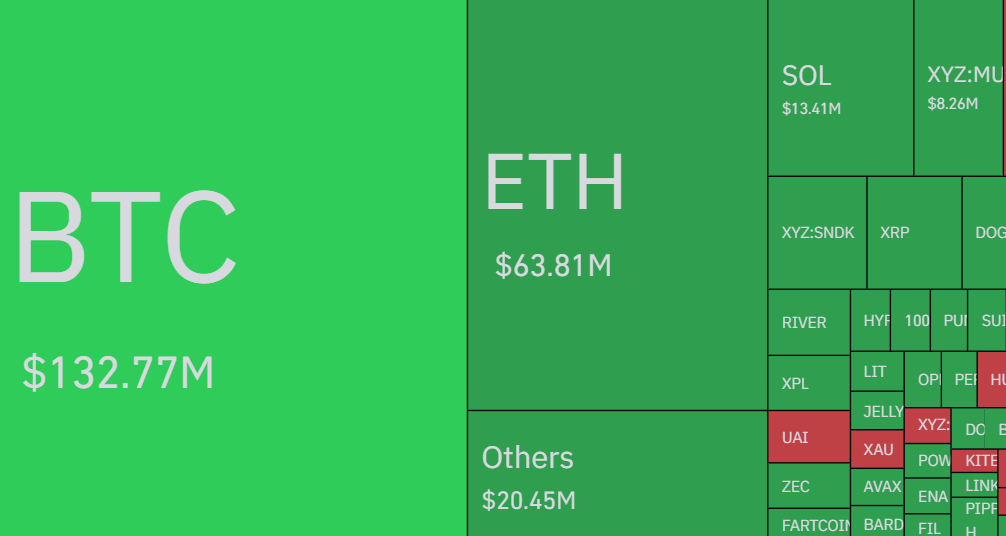
Such liquidation cascades occur when leveraged traders are forced to close positions after prices move against them. This forced selling often amplifies market declines and increases volatility.
After briefly touching $73,000 earlier this week, the BTC price failed to sustain its bullish momentum and has now retraced toward the $68,000 level. Technically, the $67,000–$68,000 region now represents a critical support zone. This area previously acted as a demand region during the recent consolidation phase and may determine the next direction for the market. If buyers manage to defend this level, Bitcoin could attempt a rebound toward $70,000 and $72,000. However, a decisive break below $67,000 could open the door for a deeper correction toward the $65,000 support level.
Ethereum has also moved lower alongside Bitcoin and is currently trading around $1,976, slipping below the important $2,000 psychological level.
The $1,850–$1,900 zone now acts as a key support range for Ethereum. If buyers manage to defend this area, the asset could attempt a recovery toward $2,080 and $2,200. However, if bearish pressure continues, ETH may revisit deeper support near $1,850, which previously served as a strong demand region.
XRP is also experiencing mild downside pressure as the broader crypto market weakens. The token is currently trading near $1.36, consolidating after failing to extend its earlier recovery. The $1.30 level now represents a critical support level. If this zone holds, XRP could attempt another move toward $1.45 and $1.50. However, if Bitcoin continues to decline and broader market sentiment weakens, XRP could revisit the $1.20 support zone before buyers step in again.
Rising conflict, like in the Strait of Hormuz, fuels fear and volatility, causing investors to move away from risk assets like crypto.
Yes. Higher rates make risk assets less attractive, often leading to declines in Bitcoin, Ethereum, and other cryptocurrencies.
When leveraged traders are forced to close positions due to price drops, it triggers further selling, amplifying market declines.
Spiking oil prices raise inflation concerns and market risk, which can lead to short-term drops in Bitcoin and major altcoins.

Mixers, privacy coins and the threat quantum computing could pose to Bitcoin were all points of speculation across the industry following the release of Trump’s Cyber Strategy.

If the crypto industry and community banks cannot find common ground on the CLARITY Act, the only winners will be the “big banks,” according to crypto executive Austin Campbell.


Bitcoin’s price volatility tends to scare off buyers, but data shows investors who hold for at least three years have a higher chance of locking in significant returns.

Nevin Shetty was convicted of wire fraud related to secretly moving $35 million in funds from a Seattle startup to his own crypto platform in 2022 to use for DeFi investments.

Bitcoin sold off below $70,000 on Friday, leading analysts to conclude that this week’s breakout to $74,000 was a relief rally rather than a longer-lasting sign of a trend change.

The Curve Finance team told PancakeSwap that it must go through the proper licensing process to collaborate and use code created by Curve.

Senator Elizabeth Warren pointed to the SEC's recent settlement with Tron founder Justin Sun, saying “any crypto legislation moving through Congress“ should address corruption.

Profit-taking by short-term Bitcoin traders accelerated the BTC drop below $70,000, but spot and futures traders may kickstart a quick recovery.

Bitcoin bounced back this week as stablecoin inflows surged, and DeFi faced fresh pressure from Aave governance strife, exploits and exchange security moves.

In a Cointelegraph interview, Arthur Hayes explains why global markets may not be pricing in a longer war in the Middle East, and what that may mean for energy prices, liquidity and Bitcoin.

The bill legally formalizes oversight over Pakistan's crypto industry, sanctions compliance and anti-money laundering regulations.

The new onchain trading engine from the xStocks platform enables trading of more than 70 tokenized equities across Ethereum and Solana.


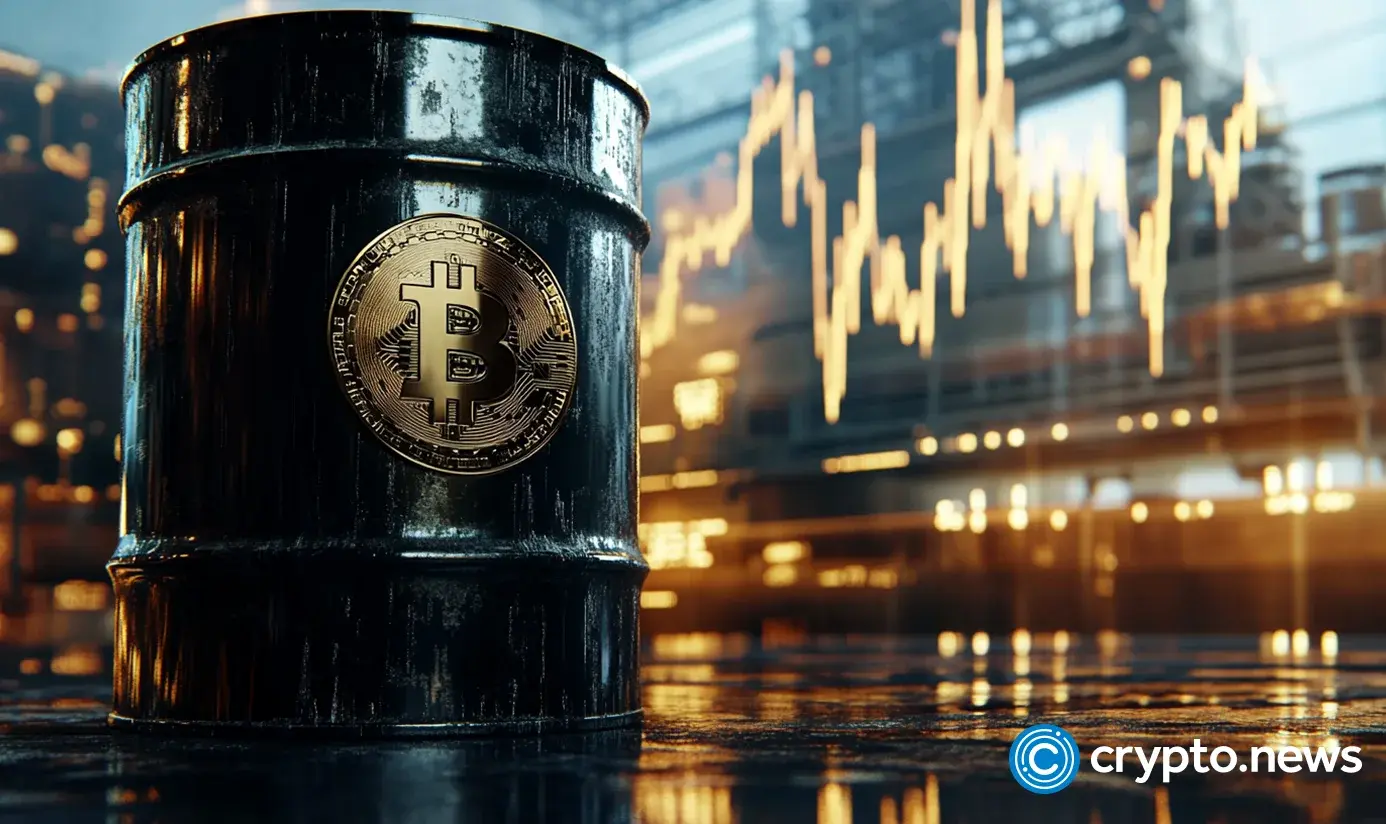


The crypto exchange responded to a Senate inquiry over sanctions by claiming that “no Binance account transacted directly with an Iran-based entity.“

Kraken secures Fed payment access, MARA clarifies its Bitcoin treasury plans, Fold cuts $66M in debt, and analysts say NYSE tokenization could attract institutions.

Bitcoin erased its latest breakout attempt after hitting $74,000 as surprisingly weak labor-market data offered no tailwind to crypto or risk assets.

The US Federal Reserve has issued a limited-use master account to Kraken, marking a major pro-crypto shift in policy.

Demand is surging for tokenized precious metals that offer more accessibility than their traditional counterparts, with investors seeking 24/7 safe-haven asset availability.

Trading in tokenized stocks and ETFs via 1inch’s Ondo integration has topped $2.5 billion, as real-world assets become one of the few reliable growth engines in a weak crypto market.

Officials said the bank may start allocating funds to crypto-related equities and ETFs as early as April.


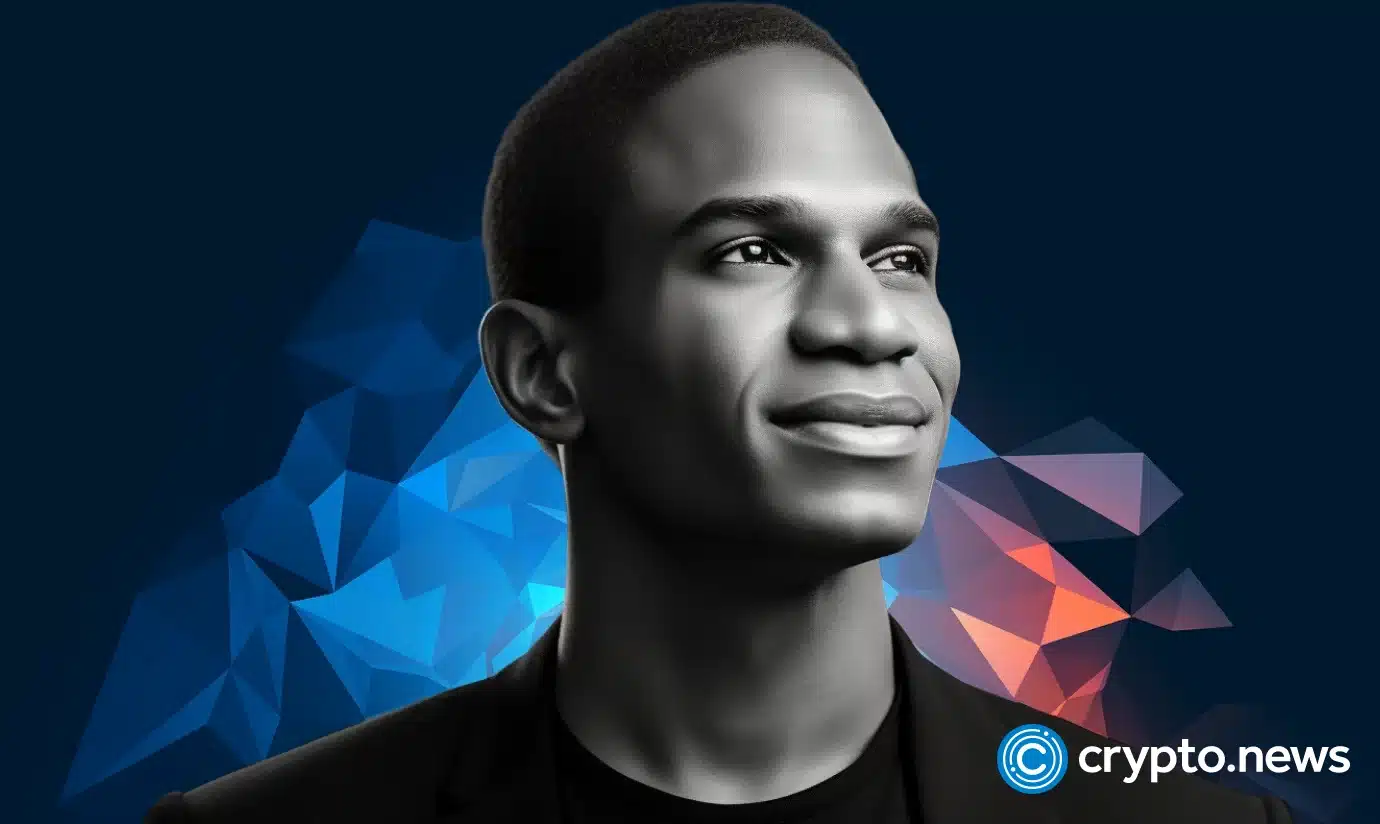


Bitcoin’s rebound to $74,000 sparked disagreement among traders as opinions diverged on whether the BTC price bottom is behind us.

![]()


![]()


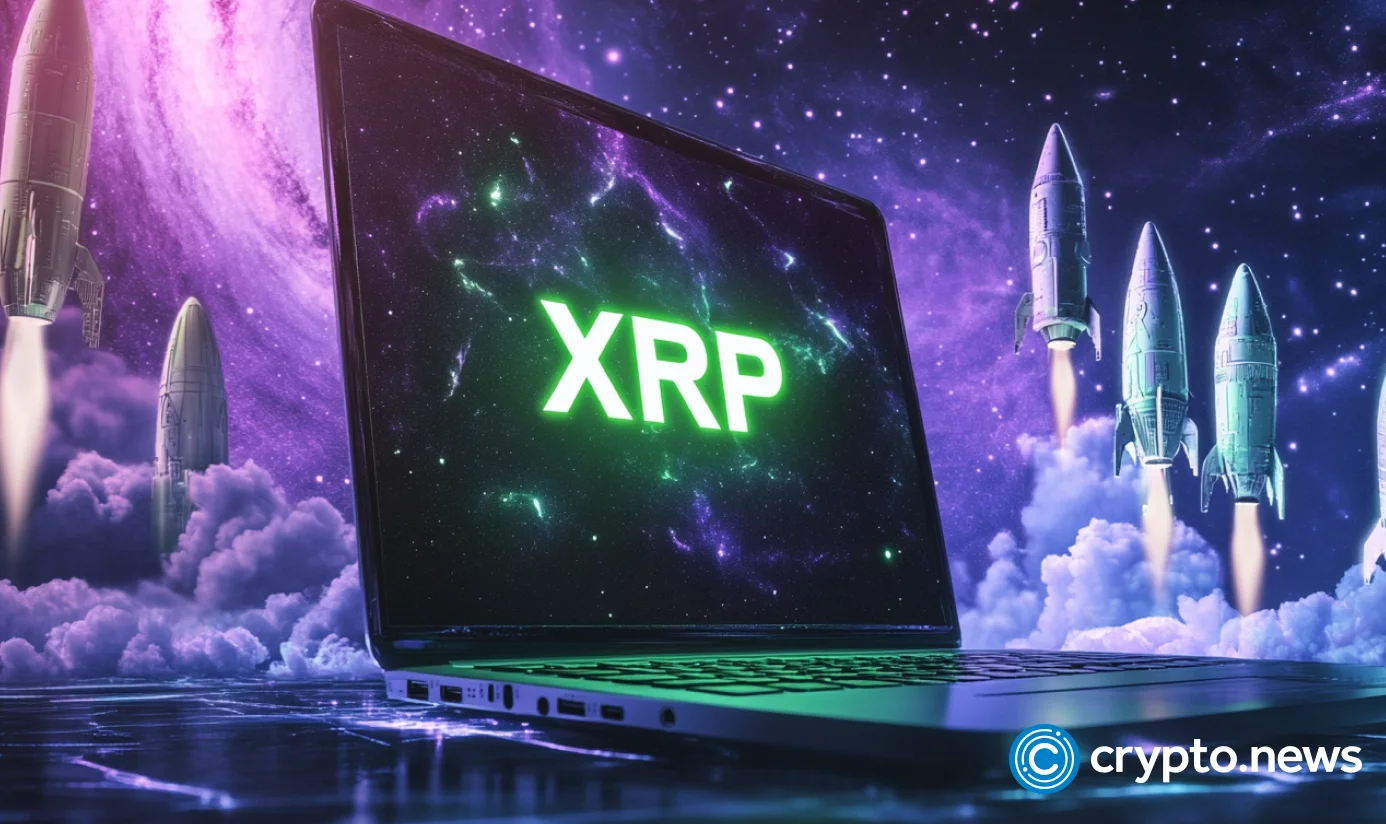


Need to know what happened in crypto today? Here is the latest news on daily trends and events impacting Bitcoin price, blockchain, DeFi, NFTs, Web3 and crypto regulation.
