Senate bill to target sports betting ban on prediction markets: WSJ

A bipartisan Senate bill would reportedly ban sports betting and casino-style contracts on prediction markets.
A bipartisan Senate bill would reportedly ban sports betting and casino-style contracts on prediction markets.

Spain’s Civil Guard detained a suspect wanted by France over the 2025 kidnapping of Ledger co-founder David Balland, in a case tied to a wider wave of crypto-targeted abductions.

Weekly crypto ETP inflows reached $230 million despite $405 million in post-FOMC outflows, as Bitcoin led gains and Ether ended a three-week inflow streak, CoinShares reported.

Bitcoin moved back above $71,000 after US President Donald Trump postponed Iran strike for five days, sending oil price crashing below $100.

A simple “wrong number” message led to a $3.4 million crypto scam, exposing social engineering tactics, fake investments and fund laundering methods.

Arkham data shows a wallet cluster holding 644 million SIREN, about 88% of the 728 million circulating supply, raising manipulation concerns.

Strategy bought 1,031 Bitcoin for $76.6 million, lifting holdings to 762,099 BTC, as the company relied on common stock sales to fund the purchase.

Airdrops trained extraction over loyalty. Token sales return with privacy-preserving identity to reward conviction and build real, automation-resistant communities.

Stablecoins could benefit from the rise of AI-driven payments over time, even as early adoption remains limited and contested, according to a new report.

The post Gold Price Prediction 2026: Peter Schiff Says $11,400 Is Coming After The Worst Losing Streak In Years appeared first on Coinpedia Fintech News
Gold is having one of its worst months in decades. Nine straight losing sessions. A 13% drop in a single month. A 27% collapse from its January all-time high. And yet one of the world’s most prominent gold bulls is not selling. He is buying more and saying the biggest surge in gold’s history is just getting started.
Here is everything you need to know about why gold is falling right now, what comes next and why Peter Schiff thinks this selloff ends at $11,400.
Why Is Gold Falling Today
Gold is trading around $4,350 per ounce on Monday, down 3% on the session and 13.18% lower than one month ago. The metal hit an all-time high of $5,608 in January 2026 and has been falling ever since.
The reason is not complicated. The Iran war pushed oil above $112 a barrel. Expensive oil fires up inflation. Inflation forces the Federal Reserve to keep interest rates high. High interest rates make U.S. Treasury bonds more attractive than gold, which pays no interest at all. Investors sold gold to buy bonds. Simple as that.
Markets are now pricing in a Federal Reserve rate hike by year-end, a development that would put even more upward pressure on yields and downward pressure on gold in the short term.
The Iran Pause That Did Not Help
President Trump announced Monday that he was postponing strikes on Iran for five days following what he described as productive conversations with Tehran. The news briefly lifted gold before Iran’s state-run Fars News Agency denied any talks had taken place at all, attributing Trump’s retreat to Iran’s threat to target power plants across the entire region.
The mixed signals left markets confused rather than relieved. Gold trimmed some losses but held its downward trajectory, extending the losing streak to nine sessions, the longest run since 2023.
Trading Economics projects gold ending this quarter near $4,499 before recovering toward $4,879 over the next twelve months. That is the consensus. Schiff thinks the consensus is wildly wrong.
Peter Schiff Gold Price Prediction: Why He Sees $11,400
Peter Schiff, one of the most followed voices in precious metals investing, published a historical comparison this week that is getting significant attention across financial markets.
“In the early months of the 2008 financial crisis, gold crashed 32%, about 40% of its prior bull market gain,” Schiff wrote. “After gold bottomed, it surged 178% over the next three years. Gold nearly hit $4,100 today, down 27%, about 40% of its gain since $2,000. A 178% surge from that low puts gold at $11,400.”
The numbers line up almost exactly. Gold’s current drawdown from its January peak mirrors the percentage decline seen at the very start of the 2008 crash, right before the metal began one of the greatest bull runs in its history.
Schiff also pushed back on the narrative that a peace deal between the U.S. and Iran would be bad news for gold.
“If the war ends soon, that is negative for gold. But not enough to offset all that is positive,” he wrote. “The government will still pay to replenish the weapons used and rebuild what it destroyed. So there will be larger deficits and more inflation than if the war had never been fought.”
His argument is that the war has permanently worsened the fiscal backdrop regardless of outcome. Bigger deficits, higher inflation, weaker growth and a dollar under structural pressure all point in the same direction for gold over the medium and long term.
“If you were bullish on gold before the war, you should be more bullish now,” Schiff said.
Gold Price Forecast: What the Data Says
Here is where gold stands today against the key benchmarks investors are watching.
Gold is currently trading at $4,462 per ounce. Its all-time high was $5,608 in January 2026. It is down 27% from that peak. It is still up 48.27% compared to one year ago. Trading Economics consensus puts it at $4,499 by the end of the quarter and $4,879 in twelve months. Peter Schiff’s target from the $4,100 low is $11,400.
The post Why are Bitcoin, Ethereum and XRP Prices Rallying Today? appeared first on Coinpedia Fintech News
Bitcoin surged past $71,000, Ethereum climbed 5% and XRP jumped 3.4% on Sunday as news that the United States and Iran had held direct talks toward a full resolution of Middle East hostilities sent shockwaves through global markets and triggered one of crypto’s strongest single-day rallies in months.
The total crypto market cap jumped 3.64% to $2.45 trillion, adding roughly $85 billion in value within hours of President Trump confirming the talks had taken place.
“A deal with Iran could happen within five days or sooner,” Trump said, adding that direct negotiations had been held over the past two days. Iranian state media denied any direct communication with Washington, a claim Trump dismissed outright.
What Flipped the Market
For weeks, the Iran conflict had been the single biggest weight on risk assets globally. Oil above $112, surging Treasury yields, a strengthening dollar and inflation fears had been crushing crypto, gold and equities simultaneously. Sunday’s news reversed every single one of those pressures in minutes.
Oil crashed 14% in under ten minutes after reports that Trump had halted planned strikes on Iran’s energy infrastructure for five days to allow negotiations to proceed. Gold, which had already fallen 25% from its all-time high wiping out $10.3 trillion in market cap, extended its decline as the safe-haven trade unwound sharply.
Crypto, which had been moving in near-perfect correlation with equities throughout the conflict, surged alongside stocks as risk appetite returned across the board.
Every Major Coin Moved
The rally was broad and decisive. Bitcoin rose 4.11% to $71,579. Ethereum gained 5% to $2,182, its strongest session in weeks. Solana climbed 4.78% to $91.35. XRP added 3.41% to $1.44. Dogecoin rose 3.28% to $0.094. BNB gained 2.84% to $647.
The average crypto RSI jumped to 51.09, moving out of oversold territory for the first time since the conflict began.
Institutions Were Already Moving
The rally did not come out of nowhere. On-chain data showed BlackRock transferred $87.7 million worth of Bitcoin and Ethereum to Coinbase in the hours before the rally. Michael Saylor’s Strategy firm added 1,031 Bitcoin to its treasury.
The SEC and CFTC’s formal classification of major tokens including Bitcoin and Ethereum as digital commodities, confirmed earlier this week, also contributed to the positive mood by removing a layer of regulatory uncertainty that had been overhanging the market for years.
For now, the mood has shifted. The war trade is unwinding. The institutional buyers are active. And for the first time in weeks, crypto investors have a reason to feel something other than fear.

The post Ethereum Price Prediction: Why ETH Crashed 52% From Its Peak and How Pepeto Offers What ETH Once Did appeared first on Coinpedia Fintech News
Ethereum dropped 52% from its October 2025 peak of $4,831 to $2,079 on March 23. The Iran conflict, oil above $110, and the Fed holding rates at 3.5% drained risk appetite and sent $144 million in ETH long positions into forced selling.
Even with the selloff, foundations are stronger underneath. BlackRock’s staked ETH fund pulled in $254 million in its first week, and spot ETH ETFs hold over $13 billion. While the Ethereum price prediction shows a path toward $2,500, Pepeto is drawing attention with 100x potential built on real exchange utility.
The presale has raised more than $8 million with a Binance listing approaching. With a live platform already protecting capital, the wallets entering now are eyeing returns that ETH, at a $250 billion market cap cannot match.
ETH dropped from $4,831 in October 2025 to a cycle low of $1,473 in February 2026 before bouncing to $2,079, according to Phemex.
BlackRock’s iShares Staked Ethereum Trust launched on March 12 and reached $254 million in assets within one week, staking 70% to 95% of holdings and paying a monthly yield, according to CoinDesk.
Spot ETH ETFs now hold over $13 billion across all providers. The Ethereum price prediction has institutional support, but the crash proves large caps cannot escape war headlines and rate decisions.
Even though the Ethereum price prediction has unsettled traders this year, the deeper story is that blockchain infrastructure keeps getting stronger. Tokenized assets on Ethereum crossed $1.8 billion. BlackRock, Goldman Sachs, and JP Morgan are all building on the network. Fresh capital from institutional ETFs is setting the stage for a recovery.
That is exactly why projects like Pepeto are pulling attention from experienced wallets. The exchange runs five tools feeding a real time dashboard that gives you a complete picture before you commit a dollar.
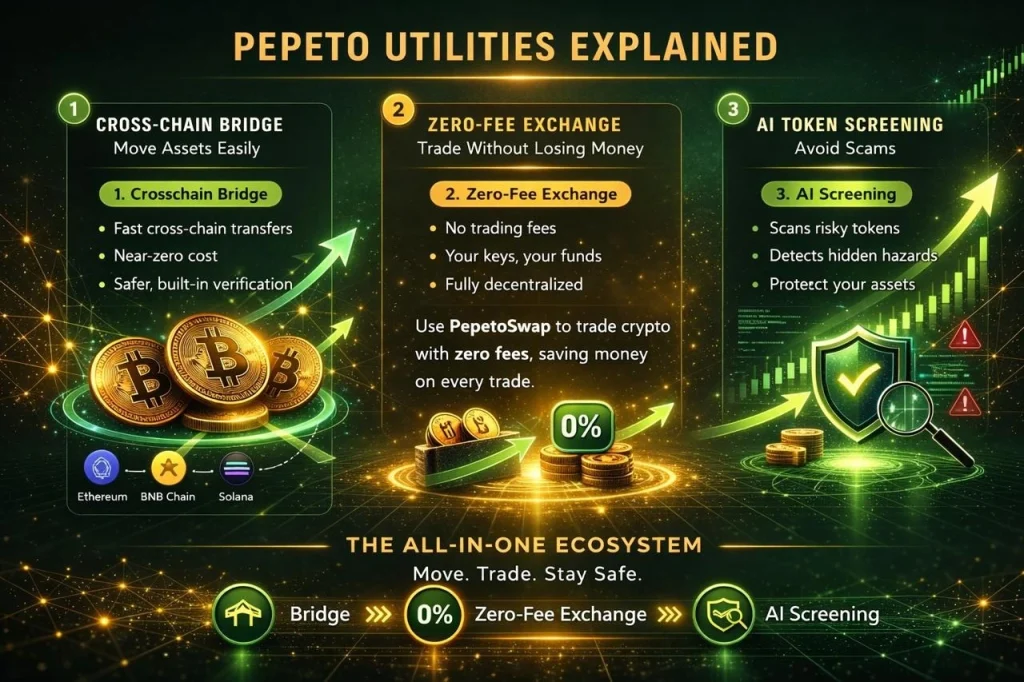
PepetoSwap runs zero fee trades so your capital works for you instead of paying fees that bleed returns every day. The cross chain bridge moves tokens between networks at zero cost, so what you send is exactly what arrives on the other side.
The cofounder who built the original Pepe coin to $11 billion with the same 420 trillion supply and zero products is now building an exchange with a SolidProof audit completed before the presale opened. A former Binance expert is on the dev team, 195% APY staking adds to positions that grow while you hold, and the Binance listing is approaching.
The presale has raised more than $8 million, and at $0.000000186 the math speaks for itself. Pepe reached $11 billion with nothing. Matching that from the current entry is over 100x, and Pepeto has the exchange infrastructure Pepe never had. The Ethereum price prediction can still turn heads, but with a $250 billion market cap, the days of 100x returns from ETH are finished. That kind of return now lives in a presale where the listing compresses the distance into the moment trading begins.
ETH trades near $2,079 as of March 23, holding above $2,100 support, according to CoinMarketCap. Resistance sits at $2,235, then $2,380. A clean break above both opens the path to $2,500, according to Bankless Times.
Losing $2,000 could trigger a pullback toward $1,800. The bullish case points to $3,000 if the Fed pivots and Iran cools. Tom Lee noted ETH outperformed the S&P 500 by 24.5% during the conflict, suggesting recovery is already priced in.
But from $2,079, even $3,000 is a 43% return over months. The Ethereum price prediction is real, but the 100x from presale to Binance listing is a return that ETH cannot produce from here.
History shows people who watched Shiba Inu’s presale, waited for one more signal, and then the exchange listing arrived without warning. That same pattern is forming around Pepeto right now, and the Pepeto official website is still accepting entries for those who already learned what waiting costs. The ethereum price prediction keeps climbing once the fear clears. The window keeps shrinking. And the wallets inside are not waiting for anyone.
ETH needs to recover from $2,079 to $4,831 just to break even. Pepeto targets 100x from presale. Visit Pepeto and choose which entry fits your cycle.
Click To Visit Pepeto Website To Enter The Presale

FAQs
How reliable is the current Ethereum price prediction?
The Ethereum price prediction shows limited short-term gains from $2,079, with $2,500 as the first target. Pepeto at presale pricing targets over 100x to the market cap the same cofounder already built.
What does the ETH long term outlook look like compared to early presales?
ETH remains solid but capped by its $250 billion market cap. The Pepeto official website offers a presale where matching Pepe’s $11 billion is over 100x, a return that ETH cannot produce from here.
Which Ethereum price prediction trends matter most for investors now?
Institutional tokenization and the BlackRock staked ETF are the key catalysts. But those trends support a 43% move at best, while Pepeto’s Binance listing compresses 100x into the moment trading opens.

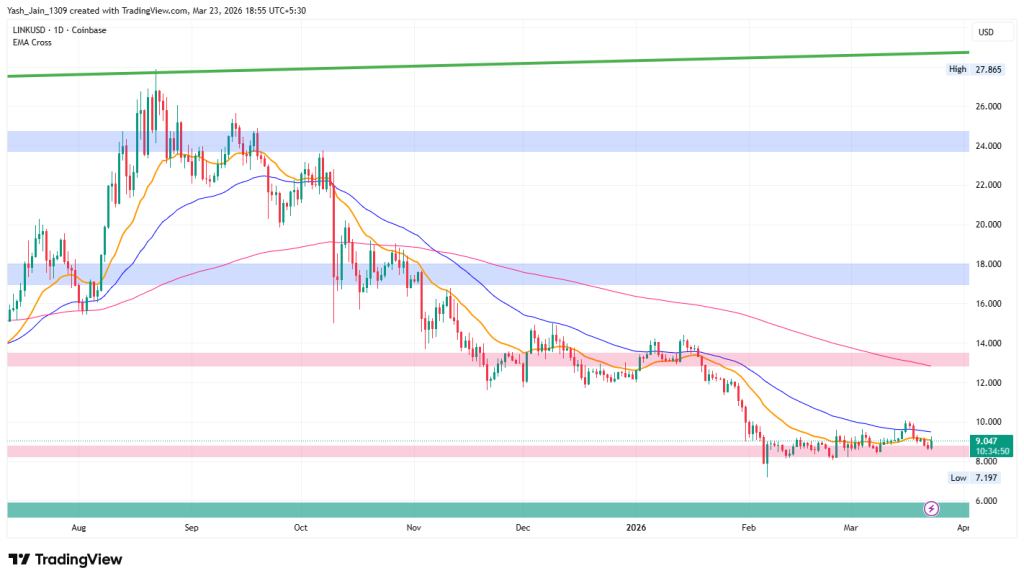
The post Chainlink Price Holds $8 As Reserves Drop, Accumulation Signals Build appeared first on Coinpedia Fintech News
Chainlink price is doing that frustrating thing again looking weak on the surface while quietly flashing signals that something bigger might be brewing underneath. This is the current stage what many don’t like because this phase tests patience and rewards it later. Right now, the LINK Price is clearly stuck, sentiment is mixed, but the data? It’s telling a very different story. And honestly, it’s getting harder to ignore.
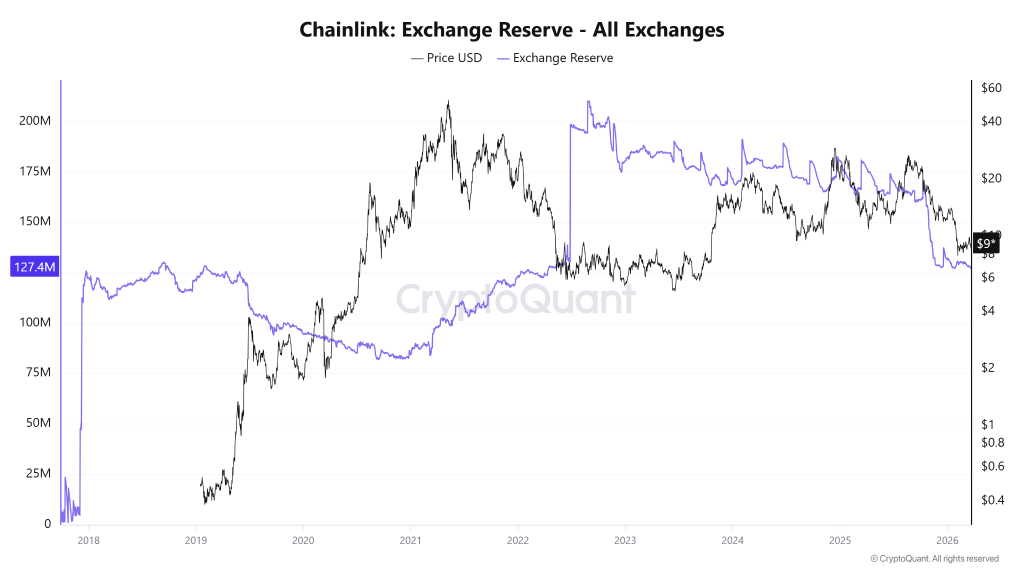
Let’s start with the obvious contradiction. While Chainlink price struggles to reclaim momentum, exchange reserves are still collapsing.
From a peak of roughly 210 million LINK in 2022, reserves have now dropped to around 127.4 million. That’s not a small dip it’s a total structural shift, leaving nearly 50% of exchange reserves means something. Yes, and what we can extract from this chart is clearly that the tokens are leaving exchanges, and historically, that doesn’t happen unless holders are playing the long game.
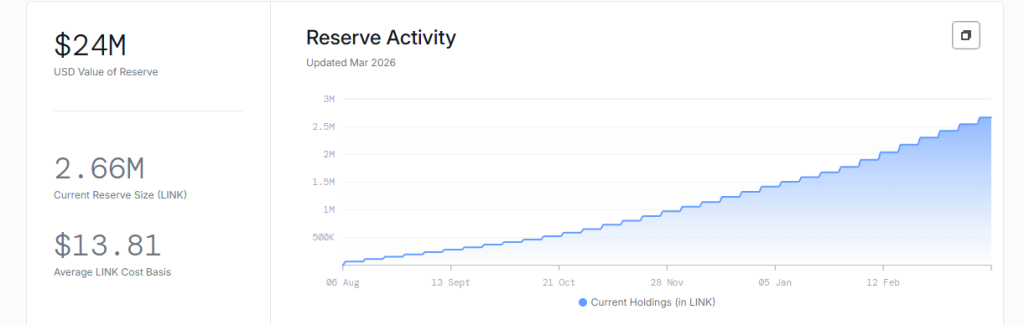
Now layer in the 2,663,585 LINK accumulated by the Chainlink Reserve, with latest inflow recorded on March 19th. This isn’t retail speculation, it’s a system designed to funnel both offchain enterprise revenue and onchain service usage back into the ecosystem, this rise tells not just the inflow rising but also means usage is still high of Chainlink’s ecosystem.
Well, supply is shrinking while adoption is expanding. That imbalance doesn’t stay quiet forever.
But let’s be real, LINK price doesn’t move on tokenomics alone. It needs a narrative, and Chainlink’s got one.
Today, the network announced that it is now tied into a $58B+ annual corporate actions problem, working alongside Euroclear, which reportedly holds €40.7 trillion in assets under custody. That’s not crypto-native hype that’s traditional finance scale.
Euroclear has €40.7 trillion ($46+ trillion) in assets under custody.
— Chainlink (@chainlink) March 23, 2026
Together with Chainlink, Euroclear is solving the yearly $58B+ corporate actions problem.
EuroclearChainlink pic.twitter.com/mzyPedfH6z
And it doesn’t stop there. LINK has been classified as a digital commodity by both the SEC and CFTC, while integrations stretch across major institutional players like Amundi and tokenized fund initiatives. Add partnerships targeting private credit markets across multiple global regions, and suddenly the “oracle provider” label starts to feel outdated.
It’s positioning itself as infrastructure. Whether the market is ready to price that in? Different question.
Now zoom back into reality, yes now we talk the chart. Chainlink price is currently holding above the $8 support, but it’s boxed in under the 20-day and 50-day EMA bands. That’s not bullish territory. Not yet.
If bulls manage to break through and reclaim $10, things could accelerate quickly toward $14. That’s the upside scenario traders are eyeing.
But flip the script and this matters because at this point one thing comes straight is that if $8 gives way, the downside opens up toward $6. Clean, simple, and brutal.
So, what’s next? The fundamentals are stacking, the supply is tightening, and the narrative is expanding. But until price confirms, it’s just potential.
And in crypto, potential doesn’t pay until it suddenly does. Chainlink price sits right in that tension zone.
The post After $SIREN’s $1.2B Surge, Pi Community Asks: Is Pi Next to Explode on Binance? appeared first on Coinpedia Fintech News
The Pi Network rumour mill never really stops. But this week it is spinning faster than usual, and there is an actual reason for it.
A token called SIREN just blew past a $1.2 billion market cap almost immediately after getting listed on Binance-linked platforms, according to CoinGecko data. That one data point was all it took. Within hours, Pi community accounts were doing what they always do: connecting dots, making comparisons, and asking the same question they have been asking for two years now.
It is a fair question. PiNews360, one of the more followed accounts in the Pi community, put it plainly this week. Pi has tens of millions of users spread across nearly every country on earth. Its ecosystem is growing. Its migration numbers are climbing. At some point, the argument goes, Pi simply becomes too large and too liquid for the world’s biggest crypto exchange to keep looking the other way.
What has changed in recent months is that Pi is no longer sitting on the sidelines of the broader market. It is already trading on OKX, Bitget, MEXC, Gate.io, Bybit and HTX. Most recently, Kraken quietly rolled out PI perpetual futures.
The current excitement is rooted in past developments. Nearly a year ago, Pi secured around 86% support in a Binance community poll, signaling strong retail demand for a listing.
Despite this overwhelming backing, Binance has yet to take the next step. The delay continues to keep the community in a wait-and-watch mode, with expectations building over time rather than fading.
While discussions around listings are heating up, Pi’s price action remains under pressure. The token is currently trading near the $0.19 mark, stabilizing after a period of volatility and a steep decline from its earlier highs close to $3.
With a market cap of around $1.84 billion and a circulating supply of 9.81 billion tokens, Pi has struggled to maintain upward momentum. Daily trading volumes remain modest, and recent price movements suggest consolidation rather than a breakout.
The debate within the community remains divided. Some users believe a Binance listing could act as a major catalyst, potentially driving a strong price surge and wider adoption. Others take a different stance, arguing that Pi’s value will come from its internal ecosystem rather than reliance on centralized exchanges.
Stay ahead with breaking news, expert analysis, and real-time updates on the latest trends in Bitcoin, altcoins, DeFi, NFTs, and more.
Binance hasn’t confirmed a listing as Pi may still be completing compliance, liquidity, and ecosystem readiness requirements before approval.
Yes, Pi is available on exchanges like OKX, Bybit, MEXC, and others, showing growing market access even without a Binance listing.
A Binance listing could boost demand and visibility, but price growth also depends on trading volume, liquidity, and overall market conditions.
Not necessarily. While Binance can accelerate adoption, long-term success depends on Pi’s ecosystem growth, real-world use, and user activity.
The post Bitmine Expands Ethereum Holdings to 4.66 Million appeared first on Coinpedia Fintech News
Bitmine Immersion Technologies has continued its aggressive Ethereum accumulation strategy, now holding about 4.66 million ETH, roughly 3.86% of total supply, after adding another 65,341 tokens recently. Its combined crypto, cash, and other investments total approximately $11 billion, with over 3 million ETH staked, earning around $180 million in annualized rewards through staking operations. Bitmine is pushing toward its long‑term goal of controlling up to 5% of all Ethereum and expanding yield through its upcoming MAVAN staking platform.
The post Binance Announces Upcoming AI Pro Tool appeared first on Coinpedia Fintech News
Binance, the world’s largest crypto exchange, teased its upcoming AI Pro tool on March 23, 2026, following recent AI features for trading and wallet analysis. The announcement sparked excitement and speculation, with the community guessing it could offer advanced analytics or automated trading bots. Memes and low-cap coins referencing “BAE” also appeared. Binance urged caution, reminding traders to verify official information before making decisions, emphasizing that hype should not replace careful evaluation.


The post Solana Strikes $90: Will This Rebound Lead SOL Price to $100 or Face Resistance at $95? appeared first on Coinpedia Fintech News
Solana price has staged a modest recovery after a sharp pullback, but the price continues to struggle below a key resistance zone, keeping the broader structure range-bound. While market conditions have slightly improved, SOL remains capped under the $92 level, preventing a confirmed bullish breakout.
The current setup suggests that the recent bounce may not be enough to shift momentum. Instead, the price appears to be consolidating within a defined range, raising the possibility of another move toward lower support levels before any sustained recovery begins.
With the $80 zone emerging as a crucial demand area, the next move could determine whether Solana sets the stage for a stronger rebound toward $100 or continues to trade within the existing range.
Solana continues to trade within a well-defined range, with the price repeatedly facing rejection near the $92 resistance zone. Despite recent recovery attempts, bulls have failed to secure a breakout, keeping the price action capped within the range. The chart highlights a prolonged consolidation phase, where SOL has been forming a base between $92 and $68, indicating a balance between buyers and sellers.
However, the recent rejection near the upper boundary suggests weakening bullish momentum.
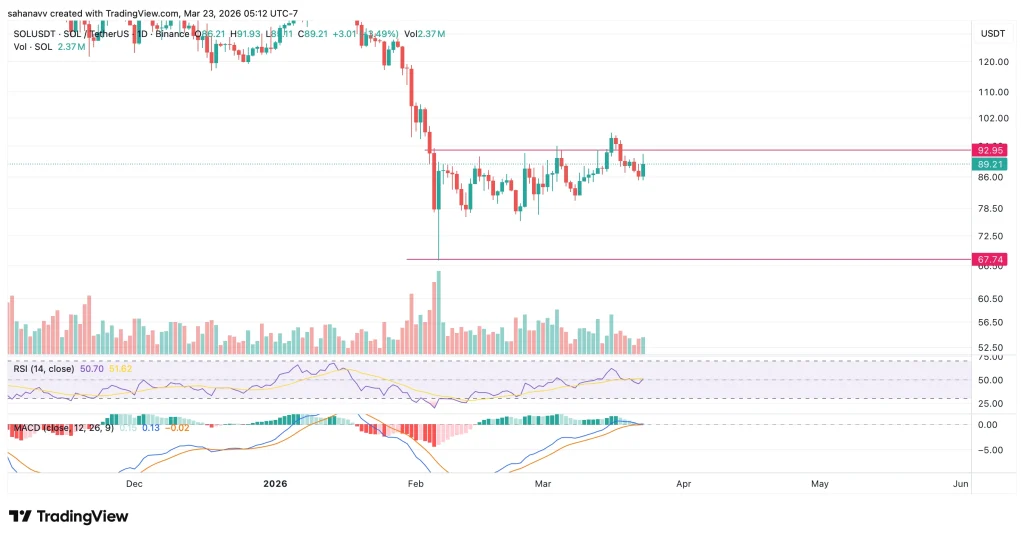
The RSI is incremental, while the MACD is still bearish, which suggests the buying pressure has not mounted yet. With this, the possibility of a rejection may remain higher with the price heading back to the support.
Structure & Key Zones
The highlighted zone around $80 emerges as a critical area, aligning with your thesis of a potential liquidity sweep. A move toward this level could act as a reset, allowing stronger hands to accumulate before a possible rebound.
If Solana price fails to reclaim $92, the probability of a pullback toward the $80 support zone increases. This level is likely to attract buying interest and could act as a trigger point for a relief rally.
However, if $80 fails to hold, the downside could extend toward the $68 range low, which remains the key structural support. On the upside, only a decisive breakout above $92 would invalidate the current range-bound structure and open the path toward $100 and higher levels.

The post Stablecoin Reward Ban Debate Intensifies as Clarity Act Stalls appeared first on Coinpedia Fintech News
The debate over banning passive rewards on stablecoins is gaining urgency as U.S. lawmakers work toward finalizing crypto regulations before the upcoming congressional deadline.
The discussion intensified in late March 2026, with banks pushing to restrict yield-bearing stablecoins while crypto firms warn it could slow adoption.
The Senate’s market structure bill, known as the CLARITY Act, has stalled after negotiations broke down over whether stablecoin providers should offer yield. The legislation, backed by the president, aims to create comprehensive rules for the U.S. crypto market, including clearer classifications for digital assets.
Banking groups are lobbying lawmakers to prohibit stablecoin rewards that resemble deposit interest. Traditional savings accounts currently offer around 0.01% to 0.50% annually, while some crypto platforms provide roughly 3.5% to 4% on stablecoin deposits such as USDC. Banks argue that this gap could trigger deposit outflows from the traditional financial system.
The dispute centers on whether dollar-pegged stablecoins should only be used for payments and settlement or allowed to compete directly with bank accounts and money market funds by offering yield.
If passive rewards are banned, retail participation could decline. Many users place their funds in stablecoins to earn passive returns while waiting for trading opportunities. Removing yields could reduce on-chain dollar demand and lower liquidity across crypto platforms.
Crypto exchanges may also feel the impact. Platforms like Coinbase, Kraken, and Gemini currently benefit from stablecoin balances through interest-sharing and treasury strategies. A reduction in stablecoin deposits could affect platform revenue and overall activity.
Stablecoin adoption could slow as well. Yield-bearing stablecoins have become popular during volatile periods, allowing investors to hold stable assets while earning returns
Despite concerns, the impact may not be entirely negative. Crypto firms have previously adjusted to similar restrictions by restructuring reward programs. Instead of direct interest, platforms may shift toward activity-based incentives such as trading rewards, payments, or liquidity participation.
There is also a possibility that yield programs move outside the United States if regulatory pressure increases. This would allow global platforms to continue offering incentives while complying with local rules.
Ultimately, many in the industry believe the broader regulatory clarity matters more. The Clarity Act aims to define digital commodities and securities, potentially reducing enforcement risks.
Even if passive rewards are restricted, clearer rules could support long-term growth and innovation in the crypto market.
Stay ahead with breaking news, expert analysis, and real-time updates on the latest trends in Bitcoin, altcoins, DeFi, NFTs, and more.
The CLARITY Act is a U.S. bill aiming to define crypto assets, clarify rules, and reduce enforcement risks for digital currencies and stablecoins.
Banks worry yield-bearing stablecoins could draw deposits away, threatening traditional savings accounts and the broader financial system.
Platforms like Coinbase, Kraken, and Gemini provide yield on stablecoins, letting users earn returns while holding digital dollars.
Yield-bearing stablecoins attract users, boost liquidity, and increase exchange revenue, making them vital for trading and adoption.

The post Trump Trigger Sparks Crypto Market Rally: Bitcoin Hits $71K, XRP & ETH Spikes appeared first on Coinpedia Fintech News
A sudden crypto market rally has sent shockwaves across digital assets, with prices surging within hours after Donald J. Trump signaled a potential easing of geopolitical tensions. Bitcoin price surged more than 4% to reclaim $71,000, marking a sharp breakout from recent consolidation. Ethereum price followed with a similar move to $2,150, while XRP price climbed to $1.41, confirming a broad-based surge across the market.
The sudden rally comes after Trump hinted at de-escalation in U.S.–Iran tensions, easing fears of immediate conflict. Crypto markets reacted instantly. As geopolitical risk declined, capital rotated rapidly into risk assets, with crypto leading the move due to its high sensitivity to sentiment shifts. At the same time, the speed of the move suggests a short squeeze and breakout from compressed structures, where traders positioned for downside were forced to exit, accelerating the upside move.
BREAKING PRESIDENT TRUMP:
— Donald J Trump Posts TruthSocial (@TruthTrumpPost) March 23, 2026We had very good and productive conversations regarding a complete and total resolution of hostilities in the Middle East.
Military strikes postponed for 5 days. pic.twitter.com/wiZh9F1H5p
This combination, macro trigger and technical compression, is often seen at the start of impulsive moves.
Bitcoin price is now trading around $71,000 after breaking out of a short-term descending structure visible on lower timeframes. The sudden spike suggests aggressive buying and short liquidations, pushing price back above a key psychological level.
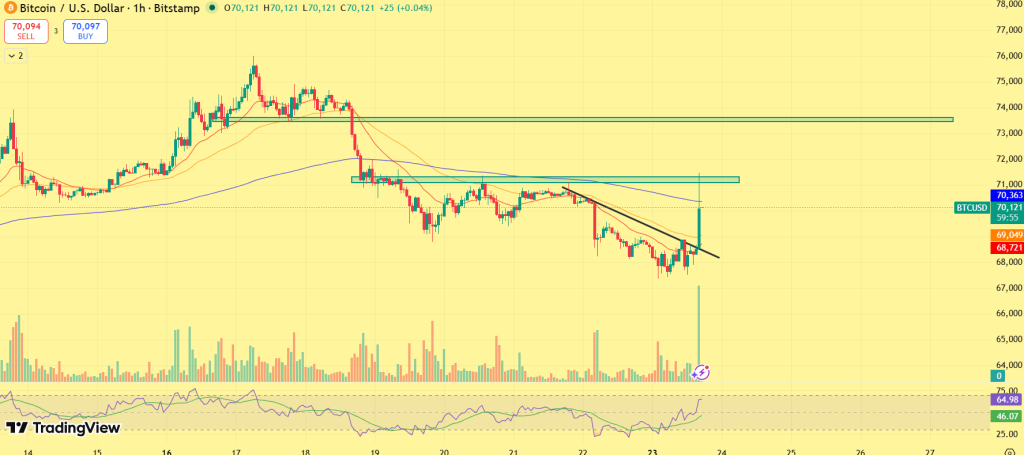
Holding above $70,000 is critical, as it confirms this move as a valid breakout rather than a fake spike. On the upside, Bitcoin now faces resistance at $73,500–$75,000, which aligns with previous supply zones. A clean break above this region could accelerate momentum toward a broader rally phase. On the downside, $68,000–$69,000 remains the key support zone. A drop below this range would indicate the breakout is weakening and could lead to consolidation.
Ethereum price is trading near $2,150, following a sharp bounce from recent lows and breaking above a descending trendline structure. The sudden spike here reflects renewed demand and participation, especially as Ethereum often follows Bitcoin’s momentum with slightly higher beta.
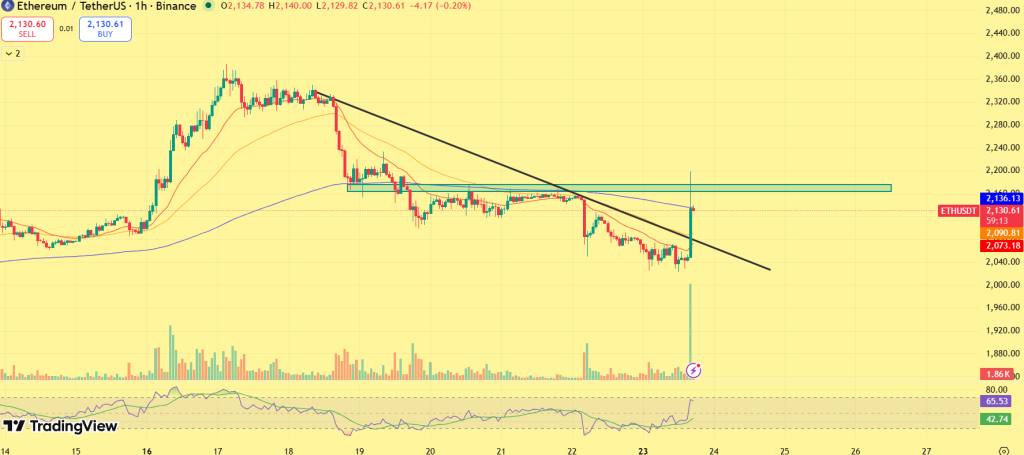
Immediate resistance lies at $2,250–$2,300, a zone where price previously struggled. A breakout above this could open the path toward $2,500, marking a stronger trend reversal. Support is now seen at $2,050, which must hold to maintain bullish momentum. A breakdown below $1,950 would weaken the structure and signal a potential pullback.
XRP price is trading around $1.41, bouncing sharply from the lower boundary of a descending channel. The sudden spike suggests early accumulation and short-term breakout pressure, but XRP is still trading within a broader range compared to Bitcoin and Ethereum.
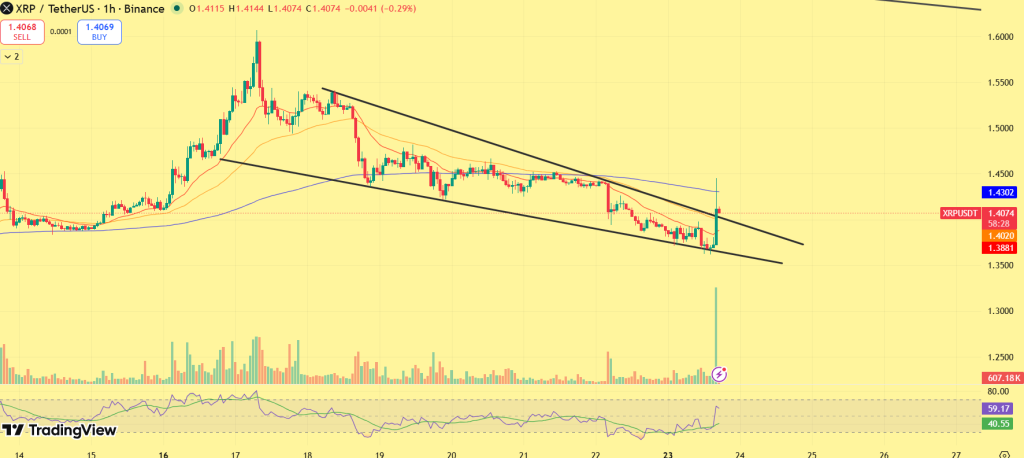
Immediate resistance is located at $1.50–$1.55, where selling pressure has previously emerged. A breakout above $1.60 would confirm a stronger trend shift and likely attract momentum buyers.
On the downside, $1.30–$1.32 remains a critical support zone. Holding this level keeps the structure intact, while a breakdown could invalidate the current bullish momentum.
This crypto market rally shows clear signs of a momentum shift driven by macro catalysts and technical breakouts. If Bitcoin sustains above $70K and resistance levels begin to break, this move could evolve into a broader rally. However, failure to hold key supports may turn this into a short-term spike followed by consolidation. For now, the market has transitioned sharply into risk-on mode, with momentum building rapidly.
The rally followed Trump hinting at easing U.S.–Iran tensions, sparking a surge in Bitcoin, Ethereum, and XRP prices.
Bitcoin jumped over 4%, reclaiming $71,000, breaking key short-term resistance and triggering short-covering momentum.
If key supports hold and resistance breaks, the rally could expand. Failing supports may lead to short-term consolidation instead.

The post Strategy Purchases 1,031 BTC appeared first on Coinpedia Fintech News
Michael Saylor’s firm, Strategy, has boosted its Bitcoin holdings by 1,031 BTC, spending roughly $76.6 million at an average price of $74,326 per coin. This move continues the company’s long-term accumulation strategy. As of March 22, 2026, Strategy now holds 762,099 BTC, purchased for around $57.7 billion at an average cost of $75,694 each. The firm remains one of the largest corporate Bitcoin holders, signaling continued confidence in the cryptocurrency’s long-term value.
The post Can XRP Price Hit $27? appeared first on Coinpedia Fintech News
XRP price has slipped into the green zone and is now trading above $1.40 after gaining more than 2% in the last 24 hours.
However, on the flip side, XRP’s open interest has declined from a peak of $2.6 billion to around $900 million–$1 billion in early 2026, reflecting a clear unwind of leveraged positions.
Amid the volatile price activity, an analyst still maintains a long-term target of $27 for XRP. Here’s why:
Crypto analyst ChartNerd has outlined a scenario that includes the possibility of a sharper correction. According to the analyst, XRP could revisit the $0.80–$0.70 range if current resistance continues to hold.
Rather than viewing this as a bearish breakdown, the analyst sees it as part of a larger setup. A deeper pullback, particularly toward key technical zones like the Gaussian Channel, could act as a reset before a stronger upward move.
Despite short-term weakness, ChartNerd maintains a bullish long-term outlook. The analyst reiterated earlier projections, with macro targets set at $8, $13, and even $27.
The argument is that while price movement may deviate from earlier expectations, the broader structure remains unchanged. According to this view, only a loss of the 2020 cycle low would invalidate the long-term bullish thesis.
For now, XRP is seen as still in its early phase, with the major breakout yet to begin.
On a similar note, another analyst, EGRAG CRYPTO, maintains that XRP is still following a multi-year ascending structure, with the recent pullback acting as a normal retest after a breakout. As long as this trend holds, he projects macro targets at $8, $17, and $27, viewing them as structured long-term levels rather than short-term price moves.
Stay ahead with breaking news, expert analysis, and real-time updates on the latest trends in Bitcoin, altcoins, DeFi, NFTs, and more.
Analysts project XRP could reach $8 to $27 by 2026 if bullish trends hold, though actual gains depend on market conditions and adoption.
Many analysts remain bullish, stating XRP’s structure is intact, with higher targets possible as long as key long-term support levels hold.
XRP’s next move depends on market sentiment, technical support levels, adoption, and whether it maintains its multi-year upward trend.
The post Mt. Gox Moves $500 of BTC After 4 Months appeared first on Coinpedia Fintech News
After four months of inactivity, Mt. Gox, the defunct Tokyo based Bitcoin exchange that collapsed in 2014, moved just 500 dollars worth of Bitcoin. This small transaction highlights the ongoing civil rehabilitation process, under which approximately 34,500 BTC worth billions are still being returned to verified creditors. Most major payouts have already been completed, and the final deadline for all repayments is October 31, 2026.

The post Sui Crypto (SUI) Price Prediction 2026, 2027-2030: Is This the Best Time to Buy SUI? appeared first on Coinpedia Fintech News
As a next-generation Layer 1 blockchain, Sui is redefining the architecture of the decentralized web by introducing an object-centric model where assets, data, and permissions are natively ownable and programmable. Built to handle the demands of modern commerce, the Sui Stack provides a modular toolkit that allows developers to scale on resilient infrastructure while delivering high-performance experiences without typical blockchain trade-offs.
From powering institutional capital markets and DeFi to even revolutionizing the gaming sector, the network has already secured a significant foothold with a Total Value Locked (TVL) of $583 million, per the official website.
By prioritizing verifiable security and composable scaling, Sui ensures that value created within its ecosystem is shared rather than extracted. In this comprehensive SUI price prediction 2026–2030, we analyze how this business-ready infrastructure and growing industry adoption will impact SUI’s token and market valuation in the years to come.
| Cryptocurrency | Sui |
| Token | SUI |
| Price | $0.9419
|
| Market Cap | $ 3,673,370,810.01 |
| 24h Volume | $ 485,410,056.9099 |
| Circulating Supply | 3,899,984,688.4154 |
| Total Supply | 10,000,000,000.00 |
| All-Time High | $ 5.3519 on 06 January 2025 |
| All-Time Low | $ 0.3643 on 19 October 2023 |
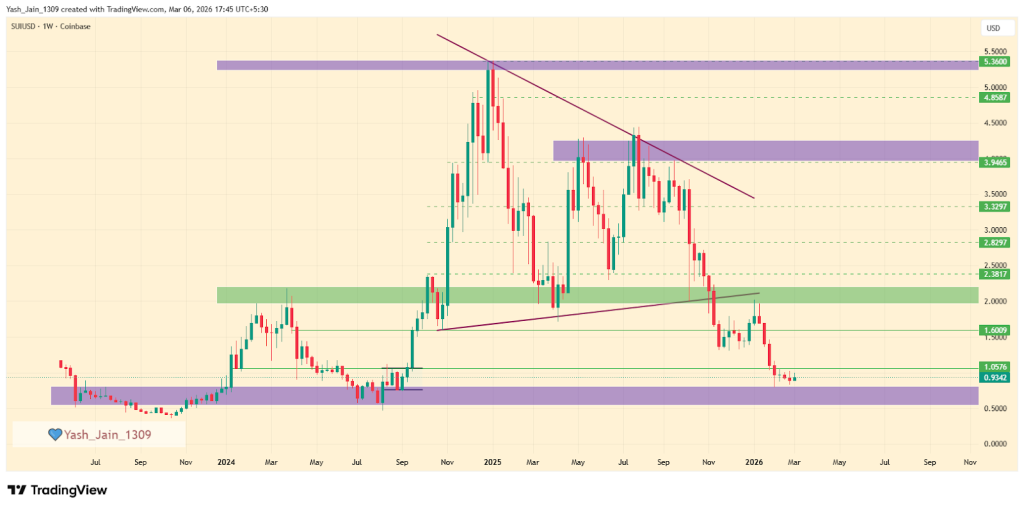
SUI token price is currently in a corrective phase after reaching a peak of $5.36 in late 2024. It is currently testing the support level at $0.80, with a potential decline to the critical $0.50 level. If SUI/USD stabilizes at $0.50, this could indicate a possible reversal.
Key resistance levels to monitor are $1.05, $1.60, and $2.00. A breakout above $3.50 would confirm a trend reversal. In the meantime, it is a “buy the dip” phase for long-term investors.
In early 2026, the SUI price tested the $2.00 level but encountered strong selling pressure, resulting in a decline to a low of $0.80 in February. Since then, the price has been consolidating just below the $1.00 mark.
As March progresses, SUI/USD finds itself at a critical juncture, as the price struggles to break through the $1 resistance level. If this struggle continues, the price may move to lower levels. Specifically, if the $0.80 support fails, the price could drop further, seeking support in the $0.50 to $0.60 range.
Conversely, if the price manages to break above $1.05, it could signal a local bottom and initiate a rally towards $1.60, with the potential for a re-test of $2.00 by the end of the month.
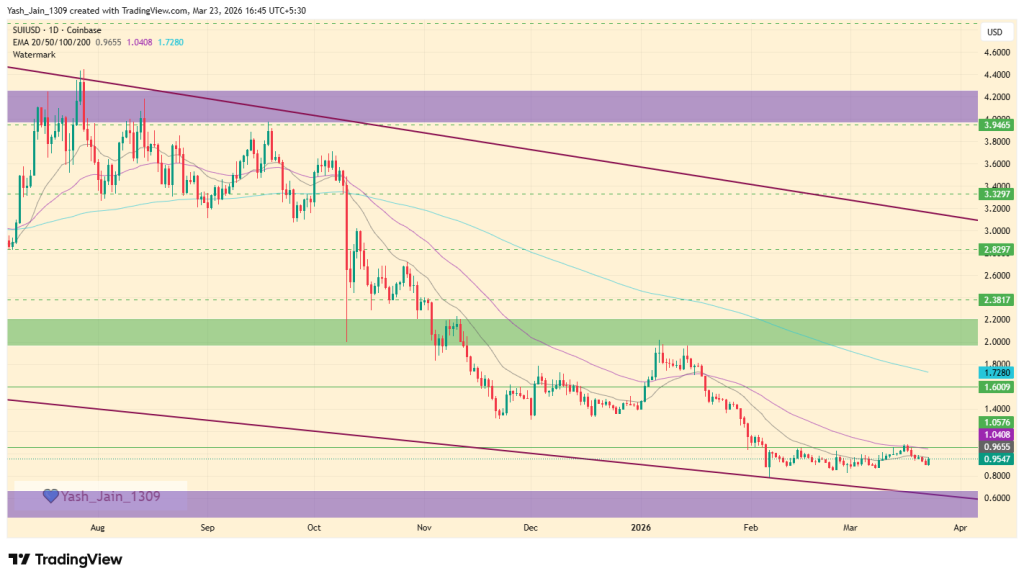
The weekly price action for SUI/USD reveals a market in a major corrective phase after its late-2024 peak, currently in Q1 2026, searching for a definitive long-term bottom.
What we witnessed is that after the 2024’s explosive rally that topped out near $5.36, the asset entered a persistent downtrend, characterized by a series of “lower highs” capped by a prominent descending resistance line. This primary trendline has remained unbroken throughout 2025, consistently forcing the price toward deeper support levels as the initial hype cycle cooled.
Currently, the SUI price is testing $0.80 support after losing $1.05 support in Q1 2026. The odds suggest a chance of reaching the $0.50 support zone if it fails to hold $0.80, because the $0.50 area is of immense technical importance, as it represents the original “genesis” accumulation level from early 2024.
The price has dipped a lot, and now it’s showing signs of stabilization as sellers are about to reach exhaustion once it hits $0.50. Real consolidation could begin, and a true reversal to fruit has better odds. This area serves as the “line in the sand” for bulls; maintaining this floor is essential to prevent a complete technical breakdown and to begin building a new base for the next market cycle.
Looking ahead, the chart identifies several key resistance levels that SUI must reclaim to shift its bearish structure. The immediate hurdle lies at the $1.05, $1.60, and $2.00 horizontal zones. A successful bounce from the current demand floor would likely target these levels first.
However, a true trend reversal will only be confirmed if SUI breaks and closes above the long-term descending trendline, currently near $3.50. Until that breakout occurs, the asset remains in a “buy the dip” accumulation phase for long-term investors.
| Year | Potential Low ($) | Potential Average ($) | Potential High ($) |
| 2027 | $4 | $6 | $8 |
| 2028 | $8 | $10 | $12 |
| 2029 | $10 | $13 | $16 |
| 2030 | $12 | $15 | $18 |
Subsequently, the SUI price range can be between $4 to $8 during the year 2027.
Beyond the previous ATH,SUI bullish momentum may gain pace and will see another bullish spark in 2028. Specifically, as per our SUI Price Prediction, the potential SUI price range in 2028 is $8 to $12.
Thereafter, the SUI price for the year 2029 could range between $10 and $16
Finally, in 2030, the price of SUI is predicted to maintain a steady and positive. It can trade between $12 and $18.
Based on the historic market sentiments and trend analysis of the largest cryptocurrency by market capitalization, here are the possible SUI price targets for the longer time frames.
| Year | Potential Low ($) | Potential Average ($) | Potential High ($) |
| 2031 | $8 | $10 | $15 |
| 2032 | $10 | $13 | $18 |
| 2033 | $12 | $15 | $22 |
| 2040 | $20 | $32 | $40 |
| 2050 | $30 | $70 | $150+ |
Stay ahead with breaking news, expert analysis, and real-time updates on the latest trends in Bitcoin, altcoins, DeFi, NFTs, and more.
SUI could trade between $0.50 and $5 in 2026. If it breaks key resistance near $3.50, momentum may push the token toward the $3–$5 range.
If adoption continues and the ecosystem expands, SUI could reach $12–$18 by 2030, driven by DeFi growth and network demand.
Long-term projections suggest SUI may trade between $20 and $40 by 2040, assuming strong blockchain adoption and sustained ecosystem growth.
By 2050, SUI could potentially reach $30–$150+ if the network becomes widely used across finance, gaming, and Web3 infrastructure.
You can buy SUI on major crypto exchanges like Binance, Coinbase, KuCoin, and OKX. Simply create an account, deposit funds, and trade for SUI.
Yes, if SUI breaks above key resistance near $3 and market conditions stay favorable, a retest of its $5.35 ATH is possible.
SUI shows long-term potential due to its scalable Layer-1 design, growing DeFi adoption, and increasing developer and institutional interest.
Key drivers include rising TVL above $1B, strong on-chain activity, ecosystem expansion, and SUI’s reputation as a fast, scalable network.

The post $265M in Crypto Shorts Liquidated After Trump Hints at End of Iran War appeared first on Coinpedia Fintech News
After President Donald Trump suggested progress in talks with Iran to ease tensions, the cryptocurrency market reacted quickly, triggering about $265 million in short position liquidations within 15 minutes. Traders betting on falling prices were forced to exit as sentiment shifted, showing how sensitive crypto derivatives are to geopolitical news. The sudden movement highlights the risks of high leverage and how rapidly global events can influence market behavior and trading positions.
The post Monero (XMR) Price Prediction 2026, 2027-2030: Will Privacy Coins Lead the Next Bull Run? appeared first on Coinpedia Fintech News
Envision the capability to conduct online payments without a digital footprint; that’s payment privacy. Numerous cryptocurrency assets possess a distinct selling proposition (USP), some safeguard transaction details concerning the parties or institutions involved, but some do not.
But, this transparency enables larger investors and institutional capital to be easily traced. While unshielded transactions are valued by researchers for the accessible information they provide regarding investments, individuals whose data is subject to scrutiny often experience frustration, as they perceive a loss of privacy over their own financial assets.
This is where Monero (XMR) comes in. Since its inception in 2014, Monero has offered robust privacy features. It has become the top choice for users seeking to maintain a high standard of anonymity in blockchain transactions. The impact of Monero’s privacy capabilities was particularly evident in the fourth quarter of 2025.
Despite the government’s tightening of the rules around digital assets, Monero has ranked 21st globally. Driven by rising interest, XMR stands out as a privacy-focused coin. So, what’s coming next for Monero in 2026 and the years to come? In this Monero price prediction 2026-2030 article, we look at the potential price targets.
| Cryptocurrency | Monero |
| Token | XMR |
| Price | $359.6851
|
| Market Cap | $ 6,635,019,307.53 |
| 24h Volume | $ 98,808,477.3479 |
| Circulating Supply | 18,446,744.0737 |
| Total Supply | 18,446,744.0737 |
| All-Time High | $ 798.9149 on 14 January 2026 |
| All-Time Low | $ 0.2130 on 14 January 2015 |
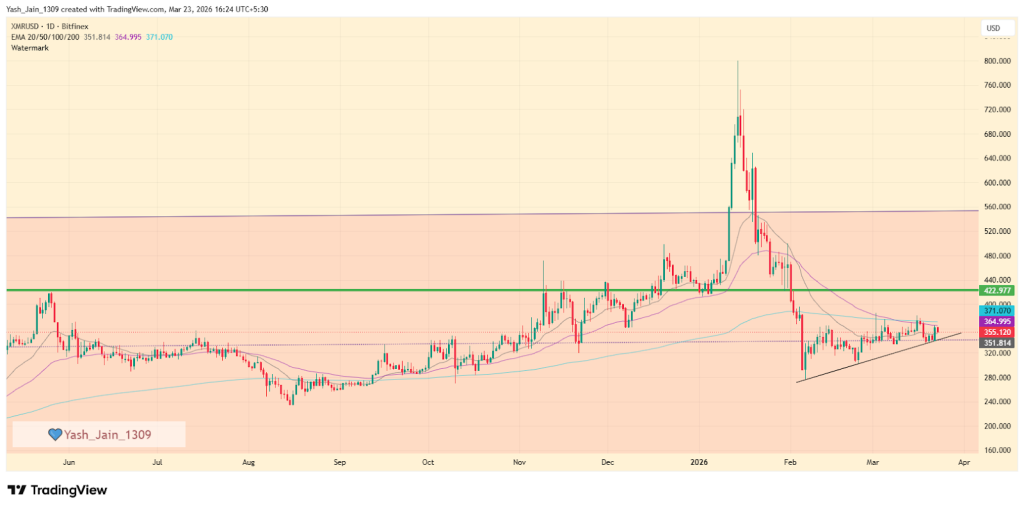
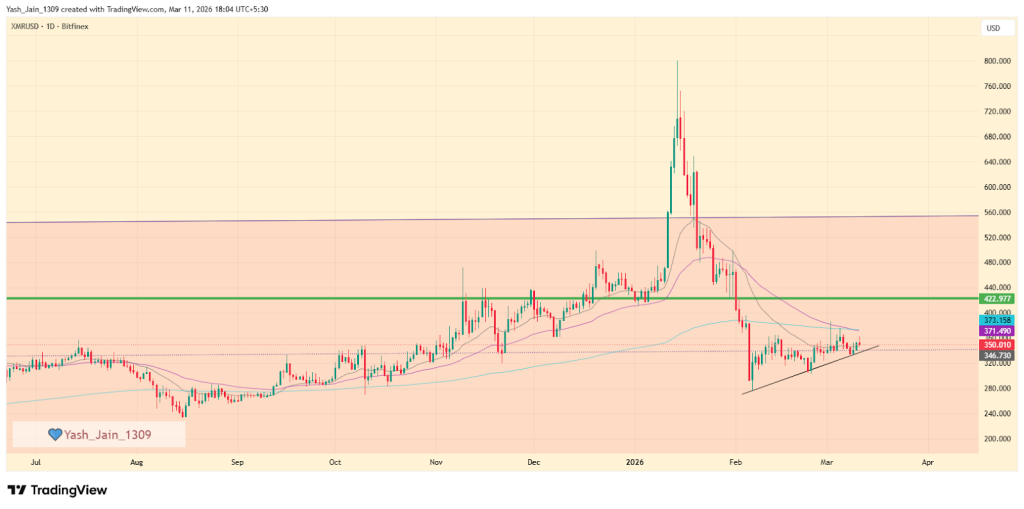
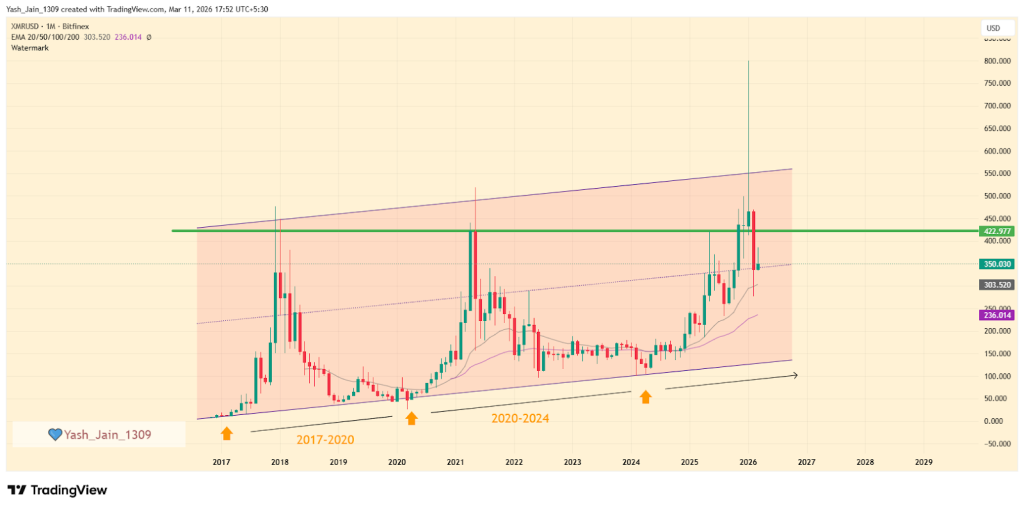
Monero (XMR) surged in Q4 2025, reaching $800 in 2026 before dropping to around $285, indicating bearish dominance. If demand increases, it could revisit $422, but failure to break this level may lead to a decline toward $200 or even $130 by year-end. Currently, XMR is retreating from the upper boundary of its ascending channel and has reached mid-way already, suggesting a correction may be imminent if more ground is lost.
The daily price chart for Monero (XMR) presents a downward trend in the market, accompanied by notable price fluctuations. After experiencing challenges in maintaining stability above $422 in January, XMR crypto saw a significant decline, falling below $370 in February. Nonetheless, there was a brief recovery during the same month, indicating resilience, even as the price encounters resistance near the 200-day EMA and around the $370 threshold.
As we continue progressing in March, the XMR/USD pair has worked to establish a short-term support trendline. Should this level be breached, it may lead to a rapid decline, potentially dropping below $300. Conversely, if this support holds, there remains a hopeful possibility for a retest of the $422 mark by the end of March.
Per the late February 2026 post from ProbeLab, they show that findings confirm the Monero network’s resilience against surveillance. Analysis reveals that 46% of community nodes have proactively adopted a “ban list,” effectively neutralizing nearly all identified spy nodes. This grassroots defense highlights a robust, decentralized commitment to privacy, strengthening the network’s topology against potential deanonymization attempts.
The price action of Monero (XMR) showed remarkable bullish momentum, particularly in Q4 2025, driven by a broader trend in privacy coins, which resulted in a significant price surge during that period.
In 2026, Monero followed the same privacy narrative, continuing the rally and pushing the price to new all-time highs (ATH) of $800. However, this increase was short-lived, as the price dropped to around $285 in February, losing more than 60% from its peak. Additionally, the mid-trendline of an ascending channel was breached, confirming a bearish dominance in the market at that time.
But, the remaining days of Q1 2026 showed some improvements that pushed it back above mid-trendline support, and now we see consolidation going on.
Now, if demand for XMR price increases, it could potentially revisit the $422 mark. It’s important to note that a recovery to this level might not inspire much excitement, as it could form a significant trap for investors. To regain a bullish setup, a weekly close above $422 would be crucial for attracting investor interest.
Conversely, if the price fails to break through $422 or even collapses below mid-trendline support again, then the first half of 2026 could see a drop towards $200 area, which could accelerate to $130 by year’s end to touch the lower border of the ascending channels as a support, like in the past.
Furthermore, it’s essential to recognize that the price has reached the upper boundary of its ascending parallel channel. As with previous patterns, a correction appears to be imminent. When it pierced the upper boundary, it had two choices: break away from the earlier pattern and establish new price action, but it briefly exceeded the channel before falling back within it, echoing historical trends. Ultimately, it returned to the pattern, continuing its legacy from the past.
| Year | Potential Low ($) | Potential Average ($) | Potential High ($) |
| 2027 | $910.00 | $1000.00 | $1200.00 |
| 2028 | $863.46 | $1,726.90 | $2,590.35 |
| 2029 | $1,295.19 | $2,590.35 | $3,885.53 |
| 2030 | $1,942.76 | $3,885.53 | $5,828.30 |
Looking forward to 2027, XMR’s price is expected to reach a low of $910, with a high of $1,200 and an average forecast price of $1,000.
In 2028, the price of a single Monero is anticipated to reach a minimum of $863.46, with a maximum of $2,590.35 and an average price of $1,726.90.
By 2029, XMR’s price is predicted to reach a minimum of $1,295.19, with the potential to hit a maximum of $3,885.53 and an average of $2,590.35.
In 2030, Monero is predicted to touch its lowest price at $1,942.76, hitting a high of $5,828.30 and an average price of $3,885.53.
The long-term projection assumes Monero sustains relevance in enterprise blockchain use cases, with growth moderating over time as the asset matures.
| Year | Potential Low ($) | Potential Average ($) | Potential High ($) |
| 2031 | 3800 | 5200 | 6800 |
| 2032 | 5500 | 7500 | 9500 |
| 2033 | 7700 | 10000 | 11500 |
| 2040 | 15000 | 22000 | 42000 |
| 2050 | 30000 | 40000 | 60000 |
| Year | 2026 | 2027 | 2030 |
| Changelly | $720 | $900 | $1900 |
| CoinCodex | $680 | $880 | $1800 |
| WalletInvestor | $740 | $870 | $2000 |
Stay ahead with breaking news, expert analysis, and real-time updates on the latest trends in Bitcoin, altcoins, DeFi, NFTs, and more.
Monero could revisit the $422 level if buying demand strengthens. However, if bearish pressure continues, the price may fall toward $200 or even $130 during 2026.
Projections indicate Monero could trade between about $1,942 and $5,828 by 2030, with an estimated average price around $3,885 if adoption continues growing.
Long-term projections vary widely, but some estimates place Monero between $2,000 and $5,000 by 2040, depending on adoption and regulation.
Monero’s price is driven by privacy demand, regulatory developments, network adoption, market sentiment, and overall crypto market trends.
Monero serves a different role than Bitcoin. Bitcoin focuses on transparency, while Monero prioritizes privacy, making it a niche but valuable crypto asset.

The post Trump Pauses Iran Strikes for 5 Days – Bitcoin Jumps Above $71,400 appeared first on Coinpedia Fintech News
At 4:35 PM on March 23, Donald Trump posted on Truth Social that the United States and Iran had held productive diplomatic conversations, and instructed the military to pause strikes on Iranian energy infrastructure for five days.
Bitcoin surged to $71,401.85 within just 10 minutes of his post.
Trump’s statement described “very good and productive conversations regarding a complete and total resolution of our hostilities in the Middle East” over the preceding two days, characterising the exchanges as “in depth, detailed, and constructive.” He confirmed the talks would continue throughout the week.
The operational consequence was direct: “I have instructed the Department of War to postpone any and all military strikes against Iranian power plants and energy infrastructure for a five day period, subject to the success of the ongoing meetings and discussions.”
The pause is conditional, tied explicitly to progress in diplomatic talks. It applies specifically to energy infrastructure – the facilities most directly connected to oil supply disruption and the inflation pressures that have kept central banks in a hawkish posture for weeks.
Also Read: Tokenization Hearing Confirmed, CLARITY Act Stablecoin Deal Done “In Principle”: Big Week for Crypto
Bitcoin surged to a 24-hour high of $71,401, recovering sharply from $67,588 where it had been trading earlier in the day. Ethereum climbed to $2,190, up 6.30% in the same window. Solana rose 5.70% to $91.01, while XRP gained 4.15% to $1.43.
The speed of the reaction reflected the scale of the overhang the Iran conflict had placed on digital asset markets since late February. Crude oil had surged more than 51% in a month, pushing electricity costs higher for Bitcoin miners and sustaining the kind of inflation environment that keeps risk assets under pressure.
Every escalation in the conflict had sent prices lower. Today’s post reversed that dynamic in minutes.
The diplomatic window Trump has opened is narrow and conditional. If the talks that continue through the week produce meaningful progress, the macro pressure that has suppressed crypto markets for nearly a month could ease. If they break down, markets return to the position they held this morning.
Markets are treating the announcement as a de-escalation, with searches for Iran ceasefire surging globally within minutes of Trump’s post.
Trump described the conversations as a foundation, not a resolution. The difference between those two things will determine whether today’s rally holds.


The post Bitcoin Miners Are Losing $20,000 Per Coin, So Why Have They Stopped Selling? appeared first on Coinpedia Fintech News
Bitcoin is trading at $68,247 at the time of writing, roughly $20,000 below what it costs to mine a single coin. Crude oil has surged 51% in a month to nearly $100 a barrel, pushing electricity costs – miners’ largest operational expense – higher at exactly the wrong time. The numbers are difficult, and they are getting worse.
Yet on-chain data tells a different story about what miners are actually doing with the coins they produce.
According to Jeremy, founder of Glyde, Bitcoin miners are currently losing approximately $19,400 on every coin they mine, based on an average production cost of $88,000 against a market price of $68,600 at the time of his analysis. Network difficulty has dropped 7.76%, the second largest negative adjustment of 2026.
The hashrate has retreated to 920 EH/s from a record 1 zetahash reached last year. Block times have stretched to 12 minutes and 36 seconds against a 10-minute target, a visible sign that mining machines are being switched off as operators exit unprofitable positions.
Crude oil is currently trading at $99.207, up 51.15% over the past month, with Brent crude at $113.647 – up 60.57% in the same period. For an industry where electricity represents the majority of operating costs, rising energy prices are compressing margins from the other direction simultaneously.
Miners are not just dealing with a falling Bitcoin price. Their costs are rising while their revenue falls.
Also Read: Altcoin Season 2026: Top Altcoin Setups and Exact Bitcoin Dominance Signal to Watch
Despite the pressure, Cryptoquant author and analyst Darkfost has flagged a development that runs counter to what the pain would suggest. Monthly average Bitcoin inflows from miners to Binance have dropped to approximately 4,316 BTC, the lowest level since June 5, 2023.
Across all exchanges, the figure reaches 4,381 BTC. Miners are not selling, even as they operate at a loss, and they still hold an estimated 1.8 million BTC in reserve. Darkfost described the current decline in inflows as a constructive signal, noting that structural selling pressure from the miner cohort appears to be temporarily easing.
Jeremy pointed to a pattern worth noting. In both 2019 and 2022, every time Bitcoin traded this far below its average production cost, it marked a cycle low.
His conclusion was direct: “The last two times this happened, the bottom was already in.”
History does not guarantee repetition. But the combination of collapsing miner selling and deeply underwater production economics has, in prior cycles, preceded recoveries rather than further declines.
The post Ethereum (ETH) Price Holds Bullish Range Despite Pullback, Eyes $3,500—Here’s What’s Next appeared first on Coinpedia Fintech News
Ethereum price is facing renewed selling pressure as market sentiment shifts in favor of the bears amid rising geopolitical tensions and rate hike concerns. The broader crypto market has dropped to around $2.35 trillion, with ETH trading near $2,053, down 1.2% over the past 24 hours.
The pullback has been largely driven by a wave of long liquidations, with over $103 million wiped out, adding to the immediate downside pressure. However, despite the short-term weakness, whale activity suggests continued accumulation, indicating that the current correction may be nearing a potential stabilization phase.
This divergence places Ethereum at a critical juncture, where the price could either extend its decline or regain strength and attempt a move toward higher targets.
On-chain data tracking Ethereum whale behavior shows that the unrealized profit ratio has dropped to historically low levels, a zone that has previously aligned with market bottoms. The chart indicates that large holders are currently sitting on minimal unrealized profits, reducing the incentive to sell at current levels. In past cycles, similar conditions have often preceded periods of accumulation and trend reversals.
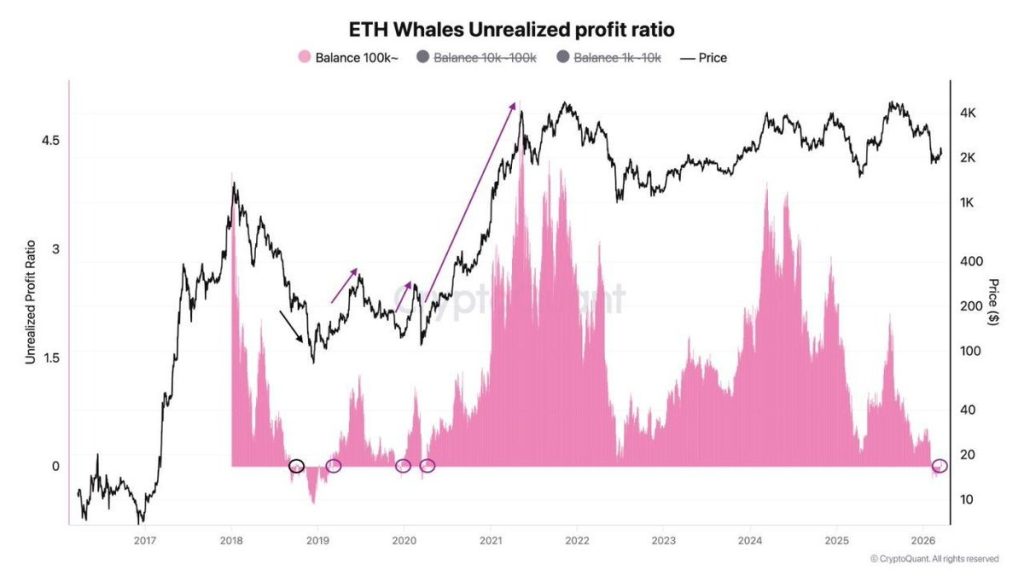
This suggests that while ETH faces short-term pressure, downside momentum could be limited as whales tend to step in during such phases. The current setup reflects a shift from profit-taking to potential accumulation, reinforcing the possibility of a stabilization phase. However, this does not confirm an immediate reversal. Instead, it highlights that Ethereum may be approaching a key accumulation zone, where the risk-reward begins to favor long-term buyers.
A broader look at Ethereum’s historical price action suggests the asset may be approaching a critical inflection point. The lower panel indicator, which has consistently marked previous cycle bottoms, is once again hovering in the same oversold region.
In past instances—highlighted across 2019, 2020, and 2022—similar dips into this zone were followed by strong upward moves, often marking the beginning of a new bullish phase. The current reading shows the indicator revisiting those levels, signaling that ETH may be entering a historically favorable accumulation range.
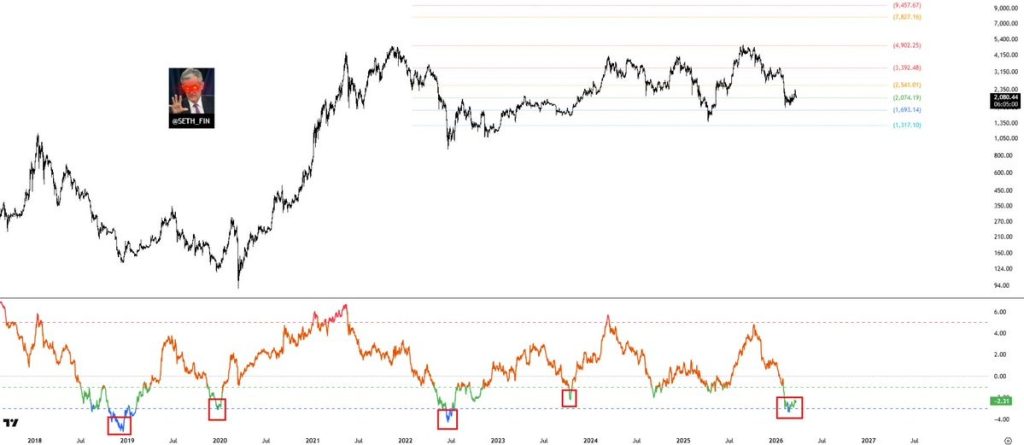
At the same time, price action remains relatively stable above key support levels, suggesting that selling pressure is not accelerating despite recent weakness. This combination of historical oversold signals and steady price structure strengthens the case for a potential trend reversal. However, as with all lagging indicators, this does not guarantee an immediate breakout. Instead, it highlights that Ethereum is trading in a zone where downside risk may be limited while upside potential begins to improve.
The combined data suggests Ethereum may be approaching a key accumulation phase. Falling unrealized profits reduce selling pressure, while the historical indicator signals conditions similar to past market bottoms. However, a bullish reversal is not yet confirmed. As long as ETH holds key support, the chances of a recovery toward higher targets, including $3,500, remain intact.
A breakdown, on the other hand, could extend the consolidation despite improving on-chain signals. For now, the Ethereum price sits at a critical decision point, with price action set to determine the next move.

The post Scammers Are Using the Iran War to Steal From Crypto Users: ZachXBT’s Full Exposé appeared first on Coinpedia Fintech News
On-chain investigator ZachXBT has exposed a coordinated network of 11 X accounts manufacturing fake geopolitical panic about the Iran conflict to funnel followers into crypto pump and dump schemes that have already generated six-figure profits on-chain.
The operation is methodical. According to ZachXBT, the network purchases accounts with existing followers, floods timelines with doom posts about war and politics multiple times a day, cross-reposts across accounts to manufacture virality, then uses the audience to promote fake giveaways and crypto scams before changing usernames to avoid detection.
One of the lead accounts, @wanglaurentceo, operating under the name “Wang Laurent,” accumulated 79.9K followers and cycled through 17 username changes, from “usdtt11” to “xrpinsol” to “edtrumpofficial.”
ZachXBT described it as an AI-generated fake Asian version of Mario Nawfal, created by running Nawfal’s profile photo through an image generation tool to build a credible-looking persona from scratch.
Also Read: Tokenization Hearing Confirmed, CLARITY Act Stablecoin Deal Done “In Principle”: Big Week for Crypto
The content the network produces is designed for fear-driven engagement. Posts claiming Iran threatened to cut undersea cables carrying 95 to 99% of global internet traffic accumulated 26,000 retweets, 50,000 likes, and 1.8 million views, even after X’s Community Notes flagged the claim as factually incorrect.
Large legitimate accounts unknowingly amplified the posts by engaging with them, extending the reach of content they had no reason to doubt.
On February 22, 2026, all ten accounts in the network simultaneously promoted $ORAMAMA, a meme coin on Solana via PumpSwap. They posted about it once and never mentioned it again.
On-chain evidence, according to ZachXBT, confirms the scheme generated six-figure profits.
After ZachXBT published his thread, all 11 accounts blocked him simultaneously. His response was pointed: “almost as if they’re operated by one person.”
ZachXBT also raised a broader concern beyond the scam itself: “It’s scary to think about the implications of it if a nation state actor operated the same scheme rather than a meme coin scammer given how easy it is to operate.”
He called for platform bans and legal consequences for manipulation of this kind, and recommended that users review account history and recent posts before engaging with any content on social media, describing it as a personal standard given how widespread engagement farming and AI-generated spam has become.
ZachXBT confirmed that Nikita Bier, X’s head of product, is also aware of these accounts.
Not trying to blow up his notifications
— ZachXBT (@zachxbt) March 23, 2026
He’s aware pic.twitter.com/f5cNBmygpu

The post Trump 48 Hours Deadline Countdown Puts Markets on Edge as Bitcoin Faces Sell-Off appeared first on Coinpedia Fintech News
U.S. President Donald Trump’s 48-hour ultimatum on the Strait of Hormuz is about to expire, keeping global markets on high alert. Following this, gold and silver together lost nearly $2 trillion in value.
The crypto market also took a hit, dropping $412 million in the last 24 hours, with Bitcoin alone seeing $121 million in liquidations.
However, Financial experts have outlined two possible scenarios for what could happen next.
On 22nd March, President Trump posted on Truth Social that the U.S. could strike Iran’s power plants if the Strait of Hormuz is not fully reopened. This has raised geopolitical tensions.
The Strait of Hormuz is a key oil route, handling about 30% of the world’s oil supply. Any disruption could push oil prices higher. Oil is currently near $110 per barrel, down from its peak of $154. The price drop happened after the G7 and IEA announced a release of 400 million barrels from their reserves to ease shortages.
Meanwhile responded strongly to Trump’s threat, Iran warned that any attack would lead to retaliation against energy and oil infrastructure in the region. Officials said this could keep oil prices high for a long time.
These tensions are worrying financial markets, including crypto, as rising oil prices can increase inflation. Thus, traders are now preparing for two possible scenarios.
In the first case, a resolution or partial reopening of the Strait could bring short-term relief. That outcome may trigger a temporary bounce in Bitcoin and equities, especially if vessels resume movement and ceasefire discussions emerge.
Perhaps analysts believe that any rally may be limited due to upcoming inflation data.
In the second scenario, if tensions continue or escalate, Bitcoin’s price could hit the $66,000–$67,000 range. A drop below this could trigger deeper losses, especially if oil prices surge and liquidity tightens.
Risk assets often struggle when geopolitical stress combines with rising inflation expectations.
Since the start of the U.S.-Israel and Iran conflict, the crypto market has struggled and moved mostly sideways. Last week, Bitcoin jumped to $76K due to strong ETF inflows from institutional investors. However, it has now lost those gains and is trading below $68K.
Traders are also closely watching upcoming inflation data. High inflation usually puts pressure on risk assets like crypto, so any short-term rally could fade if the data comes in strong.
Tonight’s market moves are being seen as a preview of what’s coming next.


Bitcoin traders kept sub-$50,000 BTC price targets in play as gold entered a bear market over Iran and oil-supply instability.

ZachXBT said the network of fake X accounts used AI to impersonate influencers and post sensational content, generating millions of views and six-figure profits from crypto scams.

H100 signed a letter of intent to acquire two Bitcoin treasury companies and their BTC holdings, which could make it the second-largest Bitcoin treasury company in Europe.
The post How Capital-Backed Custom Plans Are Reshaping Prop Trading appeared first on Coinpedia Fintech News
The prop trading industry has a growth story worth paying attention to. In just four years, it has exploded from a niche corner of financial markets into a $20 billion global sector with over 2,000 active firms and counting.
But here is what the headline numbers do not tell you: most of those firms are building on the same outdated blueprint, and the cracks are showing.
Global interest in prop firms has surged drastically, by around 600%, in recent years. That is an extraordinary wave of demand. The firms riding it well are not the ones with the flashiest marketing. They are the ones who understood early on that cookie-cutter funding models cannot sustain a serious business. Fixed challenge tiers, rigid drawdown rules, one-size-fits-all capital allocations: this template worked when the market was thin, and traders had few choices. Today, it is a slow leak.
A new model is taking over, and prop firm providers like PropAccount.com are making it accessible to prop firms at every stage of growth. That model is capital-backed custom plans, and it is reshaping how firms launch, compete, and scale.
Let’s be honest about how the standard prop firm model works. Traders pay an evaluation fee, grind through a challenge, and unlock a funded account. The firm collects fees and takes a cut of profits. Clean. Scalable. Repeatable.
Except that traders have caught on. They are sharper now, and they shop carefully. Before committing to any firm, they compare conditions across dozens of competitors. They are not looking for the average option. They want a plan that fits how they actually trade.
A methodical swing trader working on weekly timeframes has almost nothing in common with an aggressive scalper firing entries on five-minute charts. Yet most prop firms hand them the same 10% drawdown ceiling and the same 30-day challenge window. That is not a product. That is a form letter.
Attracting traders is only half the problem. Keeping them is the real test, and keeping them requires flexibility. Firms that cannot offer it are quietly losing ground to those that can.
The phrase sounds technical, so here is the plain version: capital-backed custom plans are funding structures where a prop firm builds its challenge parameters, account settings, and scaling paths around real allocated capital, tailored to specific trader profiles rather than a generic standard.
Instead of funneling everyone through the same evaluation gauntlet, firms using this model can configure meaningfully different plans. Different profit targets. Different drawdown thresholds. Different time windows and scaling milestones. And because real capital sits behind these plans, the firm’s credibility goes up and its risk management becomes sharper and more intentional.
This is exactly what modern providers were built for. The platforms give firms the prop firm technology to design and deploy custom plan structures that genuinely reflect their risk appetite and the traders they are trying to serve.
They absorb the operational weight of plan management, account tracking, and capital deployment. Firm operators get to focus on the work that actually grows a business: building trader trust and strengthening their brand. The backend complexity is handled. The operator gets to lead.
The prop trading landscape is consolidating fast. Firms that leaned entirely on evaluation fee revenue, without investing in technology, risk infrastructure, or retention, have largely exited. What is left standing are operations that treat capital deployment as a real business discipline rather than a passive income stream.
Custom plans are a direct product of that pressure. When a firm can look a trader in the eye and say “we designed this plan for your strategy,” it communicates something that no bonus offer or marketing copy can replicate: genuine understanding. That kind of credibility converts. It turns a one-time challenge buyer into a long-term account holder who refers others.
Operators sometimes push back on custom plans for an understandable reason: more configurations sound like more headaches. Managing fifteen different plan structures feels exponentially harder than managing three.
Some prop firm providers are built to make that concern irrelevant. Their backend infrastructure is designed from the ground up to handle plan diversity at scale, without demanding a proportional increase in operational effort.
Firms can launch new plans, adjust parameters, or retire underperforming options based on live trader demand. Risk settings can be applied across the board or dialled in at the individual plan level. Capital allocation is tracked in real time. The firm stays in control without drowning in complexity.
Prop trading is growing, and the firms that define its next chapter will be the ones that treat their offering as a real financial product: something designed with intention, backed by real capital, and built around the traders who use it.
Capital-backed custom plans are not a passing trend. They are the natural next step for any firm serious about longevity. For founders preparing to launch and established operators ready to scale, this shift is not something to track from a distance. It is the difference between building something durable and running a model that the next market cycle quietly sweeps aside. PropAccount.com is already there. The question is whether your firm will be too.

The post Ethereum OG Moves 15,000 ETH to Coinbase After 10 Years: Is a Major Sell-Off Coming? appeared first on Coinpedia Fintech News
An early Ethereum investor has moved 15,002 ETH worth about $31 million to Coinbase after years of inactivity. The transfer comes as Ethereum trades near $2,000, down 3.5% in 24 hours, sparking concerns that a long-term holder may be preparing to take profits.
Meanwhile, well-known chart analyst Ali Chart predicts the Ethereum price to retest $1800 this week.
According to Arkham Intelligence, an early Ethereum wallet labeled 0xa2F6 transferred 15,002 ETH to Coinbase, worth about $30.97 million at current prices. The address had been inactive for nearly a year, and such exchange deposits are often seen as a sign of possible selling, which can create short-term market pressure.
The wallet dates back to Ethereum’s early days. The holder accumulated around 172,700 ETH in 2016, when prices were close to $12, giving the stash a value of roughly $2.2 million at the time.
At today’s prices, those holdings would be worth about $356 million. If the recently moved 15,000 ETH is sold, the investor could realize nearly $30.79 million in profit, marking an estimated return of around 17,680% over the past decade.
As of now, Ethereum is trading near $2,000, marking a 3.5% drop in the past 24 hours. The decline follows a sharp fall in gold prices, which dropped to around $4,340, recording the biggest weekly decline in over 40 years.
This move comes despite ongoing geopolitical tensions as the conflict between the US, Israel, and Iran enters its fifth week.
Looking at the Ethereum weekly chart, Ali Martinez noted that Ethereum (ETH) is forming a long-term rising triangle on the weekly chart. The lower line of the triangle, called the trendline, is slowly going up and gives strong support. ETH recently touched around $2,156, bouncing from this trendline, showing buyers are defending it.
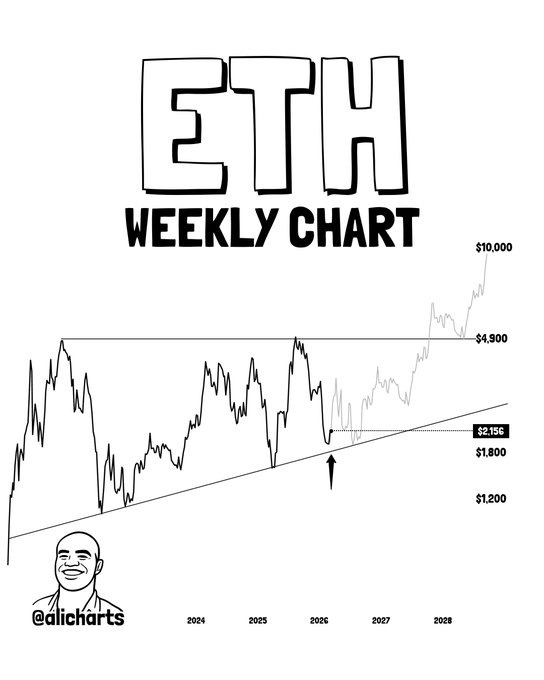
The top of the triangle, near $4,900, acts as strong resistance. If ETH breaks above $4,900 and holds, it could rise toward $10,000 in the next few years.
If ETH falls below the trendline, around $2,100–$1,800, it could drop further to $1,200, which is the long-term support.
Right now, ETH is near the bottom of the triangle, making it a good risk/reward point for buyers. The overall trend is still bullish, as long as ETH stays above the rising trendline.
The post Bittensor (TAO) Price Prediction 2026, 2027 – 2030: Is TAO the Next AI Crypto to Explode? appeared first on Coinpedia Fintech News
Bittensor is an open-source protocol that establishes a decentralized, blockchain-based marketplace for machine intelligence. It operates through a network of specialized “subnets,” where participants collaborate to train, share, and evaluate AI models in a peer-to-peer environment. Unlike centralized AI providers, Bittensor employs a unique consensus mechanism known as Yuma Consensus, which rewards the most valuable contributions.
The native token, TAO, is essential to this ecosystem; it is used for staking to secure the network, granting access to AI services, and rewarding miners who provide computational power. By incentivizing the production of high-quality intelligence rather than merely relying on hardware uptime, Bittensor transforms AI into a tradable digital commodity. As the demand for permissionless, scalable AI infrastructure increases, investors remain intrigued by TAO’s Bitcoin-like scarcity and its potential to democratize the future of machine learning.
Now, investors and traders are curious about what the future holds for TAO. To learn more, read this Bittensor (TAO) price prediction 2026-2030.
| Cryptocurrency | Bittensor |
| Token | TAO |
| Price | $267.9864
|
| Market Cap | $ 2,885,091,995.86 |
| 24h Volume | $ 321,794,836.1797 |
| Circulating Supply | 10,765,815.0727 |
| Total Supply | 21,000,000.00 |
| All-Time High | $ 767.6797 on 11 April 2024 |
| All-Time Low | $ 30.4010 on 14 May 2023 |
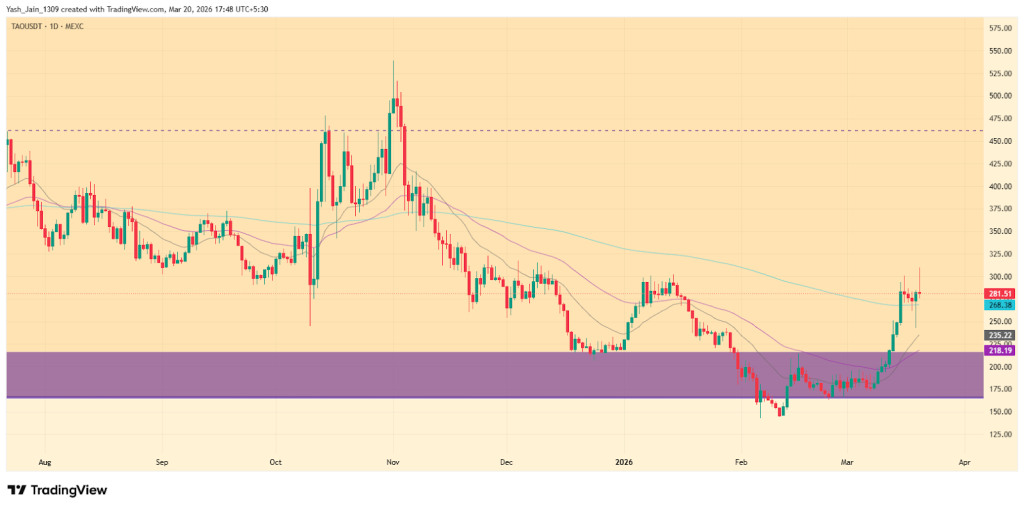
The weekly chart for Bittensor (TAO/USDT) indicates a trading range with support at $160–$200 and resistance around $720–$760. After reaching an all-time high of $760 in early 2024, prices have fluctuated, with 2025 showing weakness under $500. By early 2026, the price held the $160–$200 support, indicating institutional interest returning now. A recent bullish move suggests that if momentum continues, it could lead to a retest of the $500 level by the end of the first half of 2026, which would signal the end of the corrective phase.
The Bittensor (TAO) price is currently sustaining above the 200-day EMA band, as March followed a price spike after February, which took liquidity by briefly dipping below $150.Now, if momentum continues in the remaining days of March, a spike towards $360 could be extended, but if consolidation continues, reaching $360 may be postponed to April.
On March 16th, Grayscale posted about its Bittensor Trust for private placement, offering eligible accredited investors direct exposure to the TAO ecosystem. This move underscores growing institutional interest in decentralized AI, as Grayscale highlights the protocol’s role in leveraging economic incentives for open-source development.
The weekly chart for Bittensor (TAO/USDT) reveals a well-defined long-term range that has governed price action since the network’s explosive growth in 2024. This structural parallel channel is anchored by a significant accumulation floor near $160–$200 and a formidable overhead supply ceiling around $720–$760.
In Early 2024, TAO reached its All-Time High (ATH) of approximately $760. Despite a volatile year, the price repeatedly cycled between the channel’s borders, demonstrating high demand at the lower bounds and aggressive profit-taking at the upper extremes.
But throughout 2025, market momentum shifted into a lower-intensity regime. The price largely remained capped under the $500 psychological barrier. A brief Q4 2025 rally attempted to reclaim the upper range but was rejected at $535, leading to a sharp retracement back to the primary demand zone by early 2026.
As of March 2026, the price has successfully defended the $160–$200 support zone for the third time in two years. This “triple-bottom” characteristic suggests strong institutional interest at these valuations.
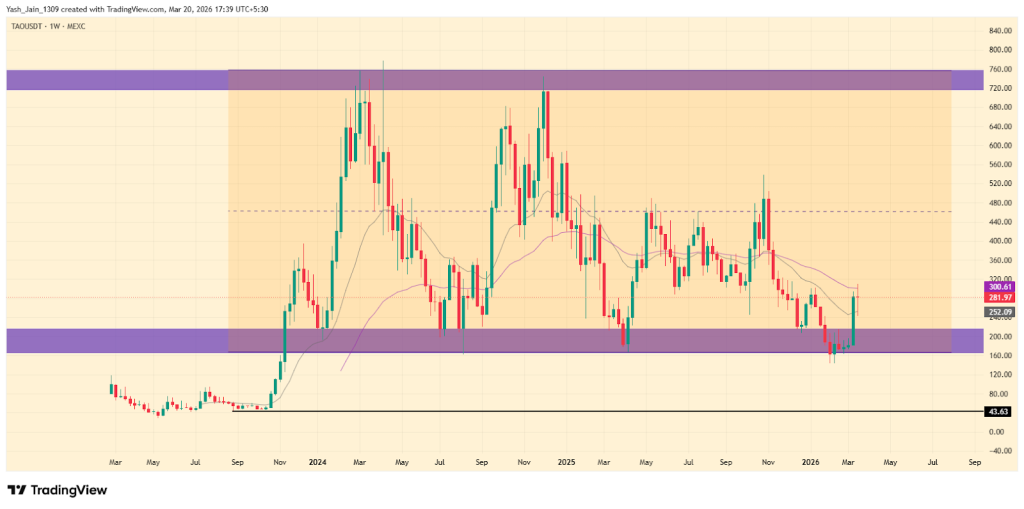
The current weekly candle shows a significant bullish impulse. If the TAO price can maintain this momentum and breach local resistance levels during the first half of 2026, the technical path clears for a retest of the $500 supply area. A sustained close above the mid-range would signal that the corrective phase of 2025 is over, potentially shifting the narrative back toward the upper triple-digit regions.
| Year | Potential Low ($) | Potential Average ($ | Potential High ($) |
| 2027 | 400 | 720 | 1000 |
| 2028 | 600 | 820 | 1200 |
| 2029 | 800 | 1150 | 2000 |
| 2030 | 1000 | 1800 | 3000 |
As per the Bittensor Price Prediction 2027, Bittensor may see a potential low price of $400. The potential high for Bittensor price in 2027 is estimated to reach $1000.
In 2028, Bittensor price is forecasted to potentially reach a low price of $600 and a high price of $1200.
Thereafter, the Bittensor (Bittensor) price for the year 2029 could range between $800 and $2000.
Finally, in 2030, the price of Bittensor is predicted to remain steadily positive. It may trade between $1000 and $3000.
The long-term projection assumes Bittensor sustains relevance in enterprise blockchain use cases, with growth moderating over time as the asset matures.
| Year | Potential Low ($) | Potential Average ($) | Potential High ($) |
| 2031 | 1200 | 1800 | 3000 |
| 2032 | 1600 | 2300 | 3300 |
| 2033 | 1900 | 3400 | 4000 |
| 2040 | 3200 | 5800 | 7800 |
| 2050 | 6500 | 8500 | 10000 |
| Year | 2026 | 2027 | 2030 |
| Changelly | $620.00 | $850 | $1200 |
| CoinCodex | $540.00 | $900 | $1400 |
| WalletInvestor | $760.00 | $950 | $1550 |
Stay ahead with breaking news, expert analysis, and real-time updates on the latest trends in Bitcoin, altcoins, DeFi, NFTs, and more.
Bittensor is a decentralized AI network where users share and train models. TAO tokens reward valuable contributions and enable access to AI services.
TAO is expected to trade between $160 and $500 in 2026, with a potential retest of higher resistance if bullish momentum continues.
By 2030, TAO could trade between $1000 and $3000, supported by growing demand for decentralized AI and sustained ecosystem expansion.
TAO may reach between $3200 and $7800 by 2040 if adoption of decentralized AI accelerates and the network maintains long-term relevance.
By 2050, TAO could climb as high as $10,000, assuming strong global AI demand, continued innovation, and consistent network growth.
TAO shows long-term potential due to its AI focus and token utility, but investors should consider market risks and evolving competition.
Key drivers include AI adoption, subnet expansion, institutional interest, and increased demand for decentralized computing resources.
The post Solana Price Prediction: Why SOL Crashed 70% From Its Peak and Why Pepeto Is Where the Smart Money Landed appeared first on Coinpedia Fintech News
A whale unlocked 1.82 million SOL worth $163 million on March 21, adding sell pressure to a token already down 70% from its cycle high of $293. The Solana price prediction still draws attention as SOL tests $87.23 with the Fear Index at 11.
While recovery could take quarters, the wallets tracking large addresses have already rotated into Pepeto. Raising more than $8 million ahead of its Binance listing, the Pepeto community is confident in the project’s 100x to 300x potential from presale to exchange.
A whale unlocked 1.82 million SOL worth $163 million on March 21, adding sell pressure while the token sits 70% below its January 2025 high of $293, according to CoinMarketCap.
The SEC classified SOL as a digital commodity on March 18, but DEX volume collapsed 62% since early February as memecoin activity faded, according to BeInCrypto.
The Solana price prediction has the Alpenglow upgrade and ETF filings as catalysts, but from $87.23 the recovery is measured in patience, not speed.
Even though the Solana price prediction is showing early signs of a floor, Pepeto is pulling in capital because it brings both protection and potential gains at the same time, solving problems traders face during fear-driven markets.
The presale has raised more than $8 million, and the Binance listing is approaching. But the real story is what the exchange already does before a single trade opens publicly.
The risk scorer checks every contract for hidden traps and scam code before your wallet touches anything, turning hours of research into a clear answer in seconds. PepetoSwap runs zero fee trades so your money stops bleeding through costs that add up every day.
The cofounder who built Pepe to $11 billion with the same 420 trillion supply and zero products is now building an exchange with a SolidProof audit completed before the presale opened. A former Binance expert is on the dev team, 195% APY staking adds to positions growing while others wait, and the listing closes the presale window permanently.
The room to enter shrinks faster each round, and the wallets calling for 100x to 300x from presale to listing are basing that on what Pepe reached with nothing. Pepeto at $0.000000186 has the exchange infrastructure Pepe never had, and from $87.23 the solana price prediction would need SOL above $13,500 to match that return, a number that does not exist in any forecast.
SOL trades near $87.23 as of March 23, holding above $80 support, according to CoinMarketCap. The SEC classified SOL as a commodity on March 18, and ETF filings from VanEck and Franklin are pending.
The risk scorer checks every contract for hidden traps and scam code before your wallet touches anything, turning hours of research into a clear answer in seconds. PepetoSwap runs zero fee trades so your money stops bleeding through costs that add up every day.
The cofounder who built Pepe to $11 billion with the same 420 trillion supply and zero products is now building an exchange with a SolidProof audit completed before the presale opened. A former Binance expert is on the dev team, 195% APY staking adds to positions growing while others wait, and the listing closes the presale window permanently.
The room to enter shrinks faster each round, and the wallets calling for 100x to 300x from presale to listing are basing that on what Pepe reached with nothing. Pepeto at $0.000000186 has the exchange infrastructure Pepe never had, and from $87.23 the Solana price prediction would need SOL above $13,500 to match that return, a number that does not exist in any forecast.
SOL trades near $87.23 as of March 23, holding above $80 support, according to CoinMarketCap. The SEC classified SOL as a commodity on March 18, and ETF filings from VanEck and Franklin are pending.
A close above $95 targets $117 first, then $147 on a pullback hold, according to Changelly. But SOL peaked near $293 in January 2025 and has lost 70% since.
The Alpenglow upgrade targeting 150 millisecond finality is the biggest catalyst ahead, but bullish forecasts place year end targets between $110 and $133. From $87.23, that is 22% to 48% over nine months, real but nowhere near 100x to 300x.
The Solana price prediction has catalysts with the Alpenglow upgrade and commodity classification. But the crash from $293 to $87.23 shows why large caps cannot deliver the returns that change lives in one cycle. Every person who entered Shiba Inu before its exchange listing and turned a few hundred dollars into millions says they wish they had put in more.
That door closed. But the market is presenting a similar window with Pepeto, and this time there is a working exchange, a SolidProof audit, and a cofounder who already proved what 420 trillion tokens can build.
The investors who missed Shiba Inu did not miss it by months. They missed it by hours, waiting for one more signal before the listing arrived and the presale price disappeared. The Pepeto official website is where the investors who learned from that mistake are positioning right now.
SOL needs to recover from $87.23 to $293 just to break even. Pepeto targets 100x to 300x. Visit Pepeto and choose which math fits your cycle.
Click To Visit Pepeto Website To Enter The Presale
FAQs
What is the Solana price prediction, and what levels matter most right now?
SOL faces $95 resistance. A clean break above targets $117 first, then $147 if $95 holds on a pullback. Pepeto targets 100x to 300x from presale to the market cap, the same cofounder already built.
What does the SOL whale unlock mean, and why does it matter for the Solana price prediction?
A whale unlocked 1.82 million SOL worth $163 million on March 21, adding sell pressure while the token sits 70% below its peak. Pepeto’s presale entry stays fixed regardless of whale moves.
Why is Pepeto grabbing attention right now?
The Pepeto official website shows a presale with a Binance listing approaching, a working exchange with zero fee trading and contract scanning, and traders anticipating 100x to 300x from presale to listing.
The post Binance Coin (BNB) Price Prediction 2026, 2027 – 2030: Will BNB Price Hit $2000? appeared first on Coinpedia Fintech News
Binance Coin (BNB) suggests a fundamental shift in how the asset responds to broader market dynamics. In 2026, the token’s performance increasingly reflects on-chain utility and ecosystem liquidity rather than mere speculative volatility. This transition from reactive price swings to a more structured price action indicates a maturing market environment.
As the ecosystem stabilizes, the technical narrative centers on long-term accumulation and the absorption of supply within established demand zones. Sustained network activity across the Binance Smart Chain provides a foundational backdrop for this consolidation, potentially setting the stage for a period of extended price discovery. By focusing on fundamental network health and institutional integration, the outlook for the next several years leans toward organic growth and structural resilience within the global digital asset landscape.
So, what’s next for the BNB price in the rest of 2026 and beyond? What can be the future price movements? Let’s get into the Binance Coin (BNB) Price Prediction 2026–2030.
| Cryptocurrency | BNB |
| Token | BNB |
| Price | $626.0588
|
| Market Cap | $ 85,367,840,774.45 |
| 24h Volume | $ 1,625,109,042.3895 |
| Circulating Supply | 136,357,540.41 |
| Total Supply | 136,357,540.41 |
| All-Time High | $ 1,370.5460 on 13 October 2025 |
| All-Time Low | $ 0.0961 on 01 August 2017 |
The BNB/USD chart reveals a long-term ascending channel that is currently testing a crucial support level at $600 in Q1 2026, suggesting a potential accumulation phase. For 2026, a recovery towards $1,000 is anticipated, with the price possibly reaching the median of the channel by Q3. However, if the price remains below $600, the risk of a more significant drop to $200 increases.
In Q3 2025, we saw a 125% rally from the $600 support level to $1,375. However, by Q4 2025 and Q1 2026, the price returned to the $600 demand area, completely wiping out those gains. Since February, there has been visible accumulation on the daily chart around this $600 demand area, indicating that it could serve as a strong support level where bullish momentum might resume.
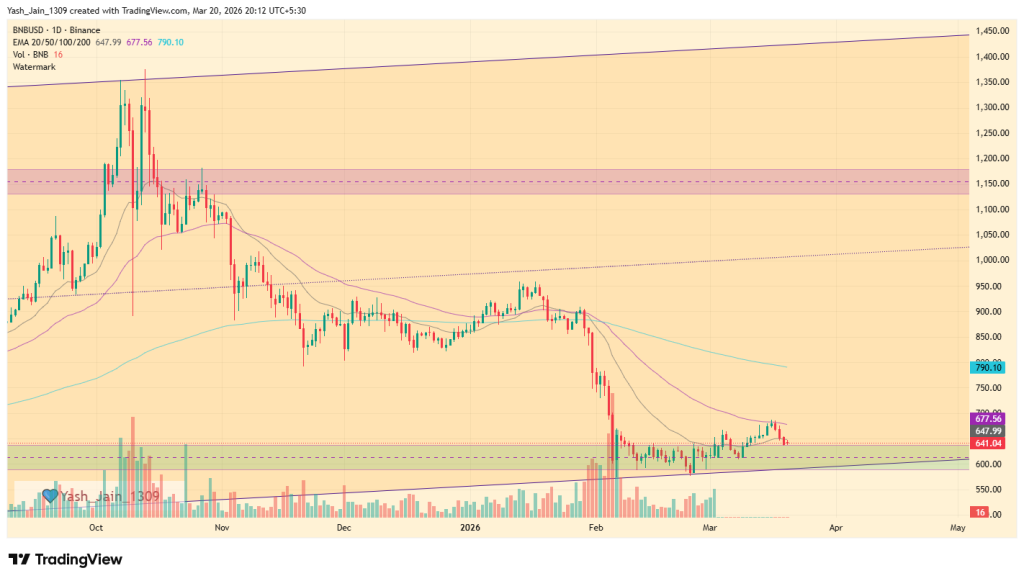
Despite the broader market pessimism, the consolidation continued throughout March, demonstrating resilience as the price remained above the $600 mark without further declines. In March of Q1 2026, long-term accumulation may persist, and short-term reactions could turn bullish, as early March indicators already suggest. If bullish pressure increases, we could see BNB price retest the $750 level by the end of March, but if short-term reactions stay muted, then further consolidation could continue throughout March.
A recent ruling news on March 7th came from the US federal court that it has positively dismissed all anti-terrorism claims against Binance, alleviating a significant legal burden. In the Southern District of New York, a judge concluded that the plaintiffs, comprising 535 individuals citing 64 attacks from 2017 to 2024, did not establish sufficient evidence to demonstrate that Binance had assisted or conspired with terrorist organizations. This decision marks a commendable step forward for Binance, affirming its commitment to compliance and integrity.
Based on the technical structure of the BNB/USD weekly chart, the price action reflects a long-term ascending channel (or wedge) that has defined the asset’s trajectory since the massive demand surge from the $40 level in early 2021. This multi-year uptrend culminated in a new all-time high of approximately $1,375 in late 2025, validating the token’s utility and its position within the Binance ecosystem. Currently, the market is witnessing a convergence of horizontal price levels with channel’s dynamic trendline support, which reinforces the technical significance of the current price zone.
As of Q1 2026, BNB price is testing a critical turning support zone around the $600 horizontal support, which aligns precisely with the lower boundary of the primary ascending channel. This area is currently serving as a consolidation floor, suggesting a period of institutional accumulation. Historical precedent highlights the importance of this trendline; a similar touchpoint in late 2023 at the $200 range served as the launchpad for a massive rally, though it took roughly 238 days to reach the channel’s median line.
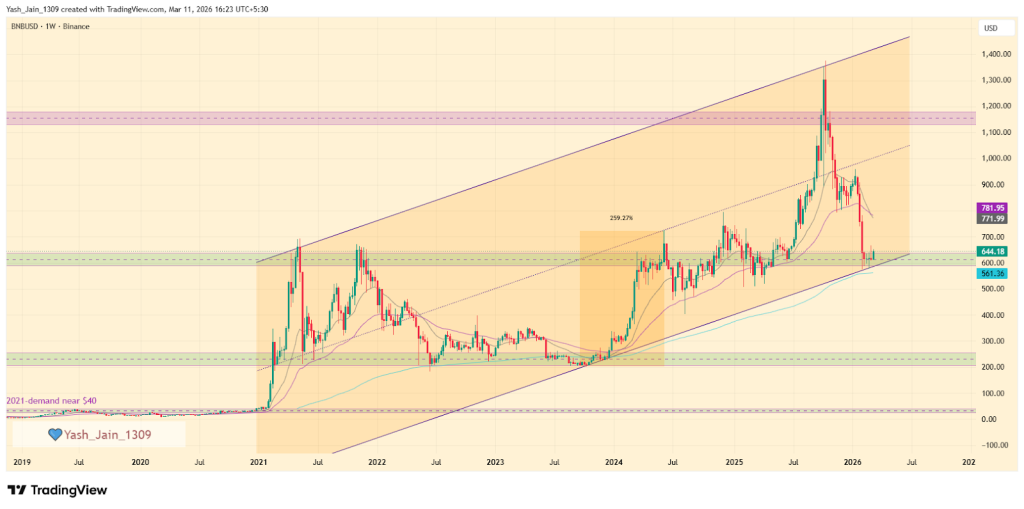
Looking ahead through 2026, the primary bullish thesis anticipates a recovery toward the $1,000 psychological level. If the recovery pace mirrors previous cycles, BNB/USD could reach the channel’s middle band by Q3 2026. However, if consolidation extends further into the year, the recovery might be more gradual, stretching toward the year-end.
Conversely, a decisive break below the $600 footing would invalidate the current setup, significantly increasing the probability of a deeper correction toward the major $200 demand zone.
Recent on-chain data highlights the network’s resilience, with daily transactions stabilizing at 15 million in Q1 2026 despite market fluctuations. This sustained utility, paired with total unique addresses nearing the 800 million mark, signals a consistent rise in global adoption. These fundamental metrics suggest a robust foundation for long-term ecosystem growth and structural asset valuation.
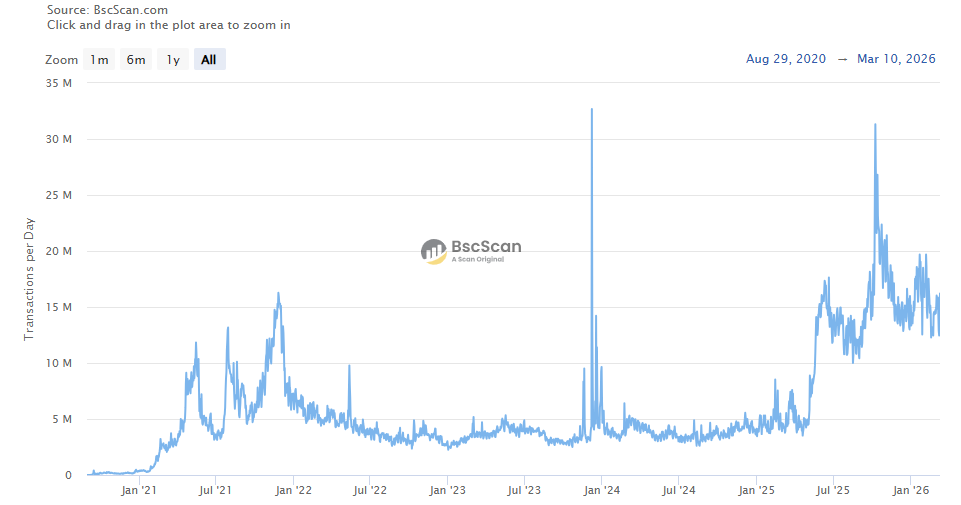
| Year | Potential Low ($) | Potential Average ($ | Potential High ($) |
| 2027 | 1200 | 1420 | 1800 |
| 2028 | 1600 | 1950 | 2300 |
| 2029 | 2100 | 3250 | 3900 |
| 2030 | 2500 | 3800 | 4500 |
As per the Binance Coin Price Prediction 2027, Binance Coin may see a potential low price of $1200. The potential high for Binance Coin price in 2027 is estimated to reach $1800.
In 2028, Binance Coin price is forecasted to potentially reach a low price of $1600 and a high price of $2300.
Thereafter, the Binance Coin (Binance Coin) price for the year 2029 could range between $2100 and $3900.
Finally, in 2030, the price of Binance Coin is predicted to remain steadily positive. It may trade between $2500 and $4500.
The long-term projection assumes Binance Coin sustains relevance in enterprise blockchain use cases, with growth moderating over time as the asset matures.
| Year | Potential Low ($) | Potential Average ($) | Potential High ($) |
| 2031 | 6000 | 9800 | 12000 |
| 2032 | 8000 | 10300 | 15000 |
| 2033 | 10900 | 12400 | 18000 |
| 2040 | 13200 | 25800 | 38800 |
| 2050 | 22000 | 35000 | 50000 |
| Year | 2026 | 2027 | 2030 |
| Changelly | $1600.00 | $2200 | $5200 |
| CoinCodex | $1800.00 | $2900 | $6400 |
| WalletInvestor | $2260.00 | $2500 | $5550 |
Stay ahead with breaking news, expert analysis, and real-time updates on the latest trends in Bitcoin, altcoins, DeFi, NFTs, and more.
BNB could recover toward $1,000 in 2026 if the $600 support holds and Binance ecosystem demand grows, supported by rising network usage and liquidity.
BNB could trade between $2,500 and $4,500 by 2030 if blockchain adoption grows and the Binance ecosystem maintains strong network activity.
Long-term projections suggest BNB could reach $13,000–$38,000 by 2040 if the network expands globally and maintains strong adoption across DeFi and Web3.
Price depends on exchange network usage, liquidity, adoption trends, historical support/resistance zones, and institutional participation.
BNB is often viewed as a strong long-term asset due to exchange utility, token burns, and ecosystem growth, though crypto investments always carry risk.
The post Dogecoin Price Near Key Support as Whales Accumulate: Breakout Ahead? appeared first on Coinpedia Fintech News
Dogecoin is back at a level where past cycles have flipped from decline to explosive rallies, but will this time be different? As DOGE drifts toward a critical support zone, whales are quietly accumulating hundreds of millions of tokens, creating a rare divergence between price weakness and smart money positioning. The setup is tightening, and the market may be closer to a breakout than it appears.
Dogecoin’s broader structure continues to revolve around a well-defined multi-year range, with the lower boundary near $0.053–$0.055 acting as a recurring demand zone. According to DOGE chart analysis shared by analyst Ali Martinez, this level has consistently marked areas where downside momentum begins to fade and accumulation phases take shape.
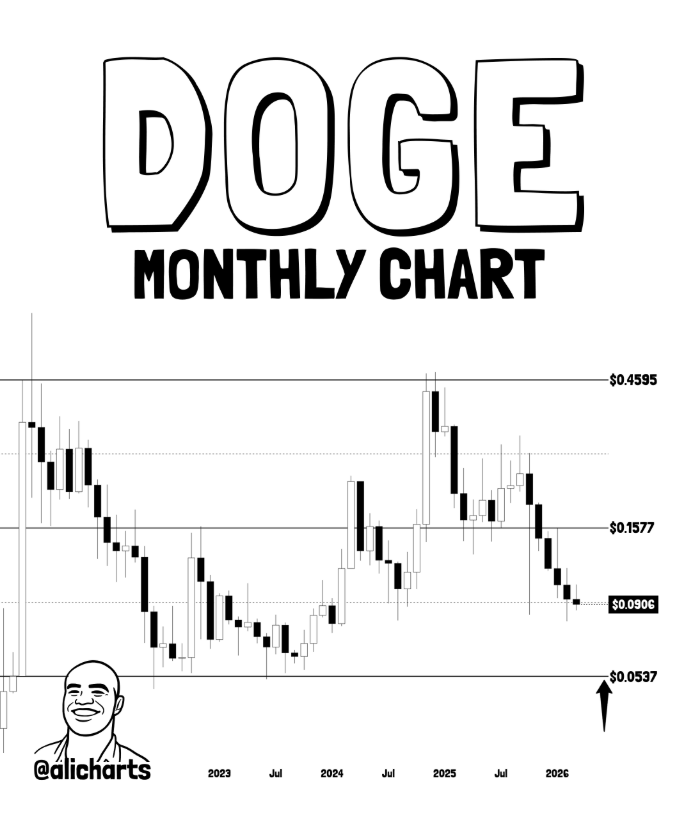
Each prior interaction with this zone has led to stabilization followed by expansion, reinforcing its importance as a high-liquidity support region. Rather than acting as a breakdown trigger, this level has historically functioned as a cycle floor, where long-term participants re-enter the market. With price now approaching this area again, the market is watching closely for signs of reaction.
On-chain activity suggests that larger players are already moving. Recent data shows that whales accumulated over 470 million DOGE within a 72-hour period, even as price continued to weaken. This type of accumulation during downside movement typically reflects forward positioning, where high-capital participants absorb supply before volatility returns.
— BSCN (@BSCNews) March 21, 2026
BREAKING: DOGECOIN WHALES ACCUMULATE 470 MILLION $DOGE IN 72 HOURS
Major wallet holders bought 470M $DOGE tokens over three days, fueling speculation about a potential rally to the $0.15 price target.
Whale accumulation often signals institutional confidence ahead of price… pic.twitter.com/cXtuDWx1WF
As supply shifts into stronger hands, available liquidity on exchanges tightens, reducing immediate selling pressure. Historically, such divergence between price action and accumulation has often preceded strong upside expansions, particularly when aligned with key support levels.
In this case, the signal is clear: price may be stalled, but confidence beneath the surface is building.
Dogecoin price chart is forming a descending triangle on the higher timeframe, characterized by a series of lower highs compressing against a relatively stable support base. This pattern reflects a market in contraction. Volatility continues to decline, price movement tightens, and liquidity builds near key levels. Such conditions rarely last long and often resolve with a decisive directional move.
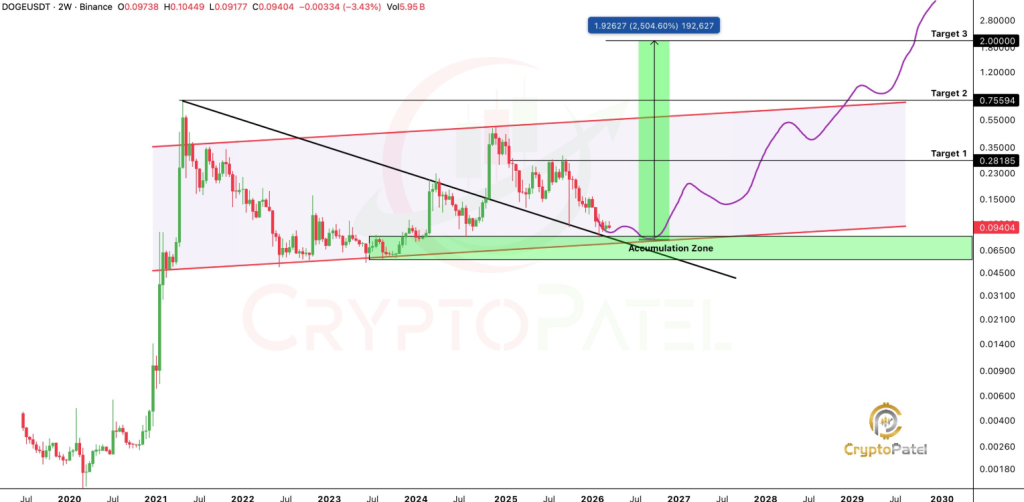
With price nearing a critical zone, the next move will be defined by how DOGE reacts around key levels. The support area between $0.053 and $0.055 remains central to the structure. Holding this level keeps the accumulation thesis intact, while a breakdown would weaken the broader setup.
On the upside, reclaiming $0.10 would signal early strength and shift market sentiment. A move above $0.15 would carry greater significance, confirming a structural breakout and opening the path toward further upside. Until these levels are reclaimed, DOGE remains in a pre-breakout phase, where positioning continues to build.
The post Aptos (APT) Price Prediction 2026, 2027 – 2030: Will APT Price Hit $30 by 2026? appeared first on Coinpedia Fintech News
Aptos (APT) is a layer-one blockchain network developed to support high-throughput decentralized applications, focusing on scalability, security, and developer efficiency. Since its launch, Aptos has gained attention for its advanced architecture and Move-based smart contract environment. However, despite strong technological foundations, APT’s market performance has remained largely subdued following its initial speculative phase.
Throughout 2024 and 2025, APT experienced persistent price compression, with the token gradually stabilizing near multi-year support levels. While broader market sentiment remained cautious, recent technical structure suggests that APT may now be entering a prolonged accumulation phase. If historical cycle behavior repeats, 2026 could serve as the inflection point where long-term consolidation transitions into a renewed growth phase.
| Cryptocurrency | Aptos |
| Token | APT |
| Price | $0.9171
|
| Market Cap | $ 727,896,968.30 |
| 24h Volume | $ 77,223,807.4375 |
| Circulating Supply | 793,725,526.3092 |
| Total Supply | 1,200,024,423.3257 |
| All-Time High | $ 19.9032 on 30 January 2023 |
| All-Time Low | $ 0.7926 on 23 February 2026 |
Coinpedia’s price outlook for Aptos depends on its ability to sustain higher highs and establish acceptance above historical resistance zones. If the current consolidation resolves to the upside, APT could gradually transition into a new macro growth regime, with $30 acting as the first major structural milestone and $70 emerging as the next long-term valuation target.
| Year | Potential Low ($) | Potential Average ($) | Potential High ($) |
| 2026 | 10 | 18 | 30 |
APT is currently consolidating around the $0.95–$1.05 range, indicating short-term equilibrium between buyers and sellers. The $0.90–$0.95 zone is acting as immediate support, where repeated buying interest is visible. Holding this level keeps the short-term structure stable.
On the upside, APT faces resistance near $1.10–$1.20. A breakout above this range could trigger a move toward $1.40–$1.60, marking the first bullish expansion phase.
If momentum strengthens further, APT may attempt a push toward $2.00, which acts as a psychological and structural resistance. However, a breakdown below $0.90 could expose the token to $0.75–$0.80, delaying recovery. Overall, March is shaping up as a base formation phase, with breakout confirmation required for trend reversal.
As 2026 progresses, Aptos is not in a momentum phase yet, it is in a rebuilding phase, where the market is slowly trying to shift from weakness into stability. After months of decline, APT is now holding near the $0.90–$1.00 region, which is acting as a base. This zone matters because it is where selling pressure has started to fade, and buyers are quietly absorbing supply. These phases usually don’t look exciting, but they often set the foundation for the next big move.
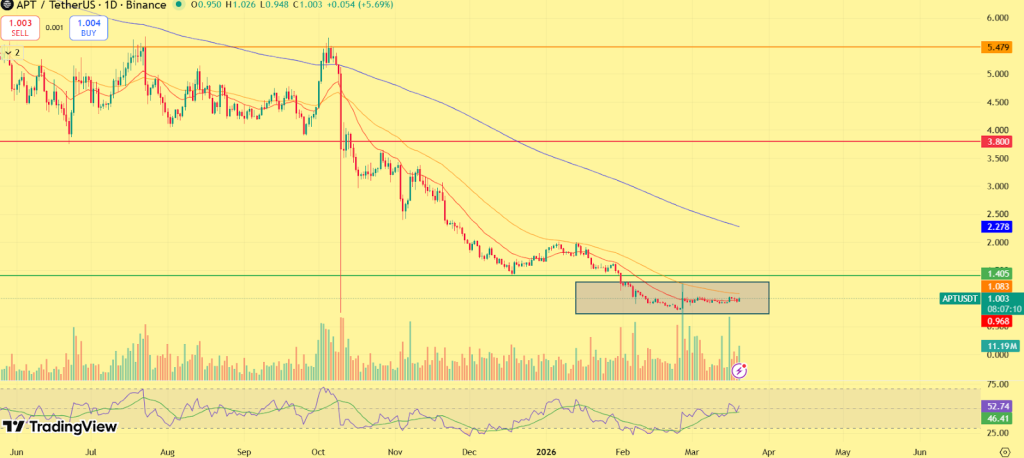
For the structure to improve, the first real signal would be a move back above $1.30–$1.50. That’s the area where the last breakdown happened, so reclaiming it would indicate that the market is no longer in a purely bearish phase. If that happens, the next stretch comes around $2.20–$2.80, where price previously struggled to hold. This zone will likely act as the first real test, whether the move is just a bounce or the start of something bigger.
A stronger shift only comes into play if APT starts holding above $3–$5. That’s where the structure begins to look healthier, with higher lows forming and confidence returning gradually. Once this phase is established, the market typically moves faster, as sidelined buyers start stepping back in. In a broader bullish setup, especially if the overall crypto market supports risk assets, Aptos could extend its recovery toward the $10–$18 range by late 2026. This wouldn’t be a straight move, but rather a step-by-step reclaim of lost levels. On the flip side, if APT fails to hold the $0.90 zone, the recovery narrative weakens. In that case, the price could slip back toward $0.70–$0.80, delaying the entire rebuilding process.
Overall, 2026 for Aptos looks less like a breakout year and more like a year of structure repair, and how well it reclaims key levels will decide how far it can actually go.
| Year | Potential Low ($) | Potential Average ($ | Potential High ($) |
| 2026 | 10.00 | 18.00 | 30.00 |
| 2027 | 13.00 | 25.00 | 40.00 |
| 2028 | 20.00 | 35.00 | 50.00 |
| 2029 | 24.00 | 40.00 | 58.00 |
| 2030 | 36.00 | 50.00 | 60.00 |
The Aptos price range in 2026 is expected to be between $10.00 and $30.00.
Aptos could trade between $13.00 and $40.00 in 2027
In 2028, Aptos is forecasted to potentially reach a low price of $20.00. and a high price of $50.00.
Thereafter, the Aptos price for the year 2029 could range between $24.00 and $58.00.
Finally, in 2030, the price of Aptos is predicted to maintain a steady positive. It may trade between $36.00 and $60.00.
Based on the historic data and trend analysis of the cryptocurrency along with the market sentiments, here are the possible Aptos price targets for the longer time frames.
| Year | Potential Low ($) | Potential Average ($) | Potential High ($) |
| 2031 | 40.00 | 60.00 | 80.00 |
| 2032 | 45.00 | 78.00 | 97.00 |
| 2033 | 52.00 | 88.00 | 120.00 |
| 2040 | 80.00 | 120.00 | 200.00 |
| 2050 | 150.00 | 250.00 | 400.00 |
| Year | 2026 | 2027 | 2030 |
| Changelly | $26.80 | $44.00 | $55.00 |
| DigitalCoinPrice | $33.00 | $56.00 | $68.00 |
| WalletInvestor | $30.00 | $45.00 | $50.00 |
Stay ahead with breaking news, expert analysis, and real-time updates on the latest trends in Bitcoin, altcoins, DeFi, NFTs, and more.
Aptos is a Layer-1 blockchain built for speed and security, using the Move language to support scalable, low-latency decentralized applications.
APT price forecasts for 2026 range between $10 and $30, depending on market conditions, adoption growth, and overall crypto cycle momentum.
APT could approach $70 by 2030 if network usage grows steadily, developers continue building, and broader crypto markets remain supportive.
Aptos shows long-term potential due to strong technology and scalability, but like all crypto assets, it carries risk and requires careful evaluation.
APT faced price pressure from early speculation cooling, token unlocks, and weak market sentiment, leading to prolonged consolidation phases.
The post Algorand CTO Steps Down as Foundation Relocates to the US and Cuts Workforce by 25% appeared first on Coinpedia Fintech News
Algorand is moving through a crucial phase, with internal changes, strategy shifts, and weak market performance happening at the same time. While recent steps hint at a new direction, uncertainty still surrounds how things will play out.
As per the community update, the Algo Foundation has moved its base from Singapore to the United States. A new board is now in place, led by Bill Barr.
Alongside this, a $15 million deal with Algorand Technologies aims to bring key parts of the ecosystem under one structure, including intellectual property and protocol development. The move is meant to improve coordination, although details around roles are still not fully clear.
The changes continue internally. The Chief Technology Officer has stepped down after a short tenure, and there is no confirmation yet on a replacement.
To manage expenses, the foundation has reduced its workforce by about 25%. Despite these shifts, Staci Warden remains CEO and is overseeing this phase of change.
ALGO is currently trading near $0.086, with daily volume around $21 million. The token has fallen nearly 97% from its all-time high of $3.28 and recently touched a low close to $0.081.
Though price action shows a slight bounce, overall sentiment remains weak due to the lack of a strong driver. Some analysts note that ALGO is holding within a falling wedge pattern, which may support a move higher if buying interest increases. If a confirmed bounce occurs, the possible targets range from $0.11 up to $0.49 in the coming phases.
ALGO being viewed as a commodity by the SEC carries weight from a legal standpoint. It removes certain restrictions, especially around staking, which could support more activity in DeFi on the network over time.
Within the community, there is a push toward clearer structures. One update explained that creator fees were only part of an early bonding phase and have now been removed. All trades now happen through standard DEX systems, with no extra or hidden charges.
Algorand is clearly in a rebuilding phase. Structural changes may help long-term, but for now, the market is waiting for stronger signals. Stability, clearer direction, and renewed confidence will be key to turning things around.
Stay ahead with breaking news, expert analysis, and real-time updates on the latest trends in Bitcoin, altcoins, DeFi, NFTs, and more.
The post Bitcoin Extends 4 Week Streak With $95M Inflows appeared first on Coinpedia Fintech News
From March 16 to March 20, Bitcoin spot ETFs continued to attract investor money, reporting $95.18 million in net inflows and extending their positive run to four straight weeks. Ethereum spot ETFs, however, experienced 59.94 million dollars in net outflows, signaling reduced investor appetite for ETH exposure. At the same time, SOL spot ETFs posted 21.10 million dollars in inflows, while XRP spot ETFs recorded $0.64M, pointing to selective interest across alternative crypto investment products.

The post Hedera (HBAR) Price Prediction 2026, 2027 – 2030: Will HBAR Price Hit $0.5? appeared first on Coinpedia Fintech News
Hedera has been making waves in the cryptocurrency space, with a fast and secure blockchain that offers a distinct approach to transaction processing compared to Ethereum and other smart contract chains. It’s permission-only, meaning the blockchain is managed by private companies. Limiting what types of decentralised applications are allowed is what makes Hedera stand out from the rest.
Having entered the top 20 digital assets by market cap in 2024, it is now eyeing a potential leap into the top 10 by the end of 2025. Hedera has also recently ramped up its development activities for its ecosystem. Its ecosystem is strengthening, despite its capped price action. With increasing real-world use cases, institutional interest, and strategic partnerships, many are closely tracking HBAR price chart 2025 to gauge how high the token can rise.
With major companies like Google, IBM, and Chainlink Labs backing the project, and discussions about SEC approved HBAR ETF would flood string liquidity. Many are intrigued that: Will the HBAR Price Reach $1? Let’s discuss this in our Hedera price prediction 2025 article.
| Cryptocurrency | Hedera |
| Token | HBAR |
| Price | $0.0896
|
| Market Cap | $ 3,880,436,000.35 |
| 24h Volume | $ 80,114,727.5453 |
| Circulating Supply | 43,303,446,052.1368 |
| Total Supply | 50,000,000,000.00 |
| All-Time High | $ 0.5701 on 16 September 2021 |
| All-Time Low | $ 0.0100 on 02 January 2020 |
HBAR fell below $0.100 by early 2026 and recently tested key dynamic support in February, suggesting potential demand. To maintain a bullish outlook for March, it needs to reclaim the $0.120 level; otherwise, it may pull back to $0.0800. In the long run, holding above $0.0800 is crucial to avoid a drop to $0.0453.
| Year | Potential Low ($) | Potential Average ($) | Potential High ($) |
| 2026 | 0.15 | 0.40 | 1.05 |
HBAR is currently trading within a narrow range near $0.09–$0.10, indicating that the market is consolidating after recent volatility. The $0.088–$0.09 region has become an important support zone, where buyers have consistently defended the price. Holding this level keeps the short-term structure intact and allows for gradual recovery attempts.
On the upside, the first resistance sits near $0.105–$0.11, which aligns with previous rejection levels. A breakout above this zone could open the path toward $0.13–$0.15, where stronger liquidity is present. If momentum continues to build, HBAR could extend toward $0.18–$0.20, signaling a shift in short-term structure. However, if the price fails to hold the $0.088 support, the token could slip toward the $0.075–$0.08 demand zone, delaying recovery.
Overall, March appears to be a range-building phase, with the market watching closely for a breakout to confirm the next move.
Heading deeper into 2026, Hedera is likely to move through a recovery cycle rather than an immediate breakout phase. The current structure suggests that the market is gradually shifting from accumulation toward early expansion.
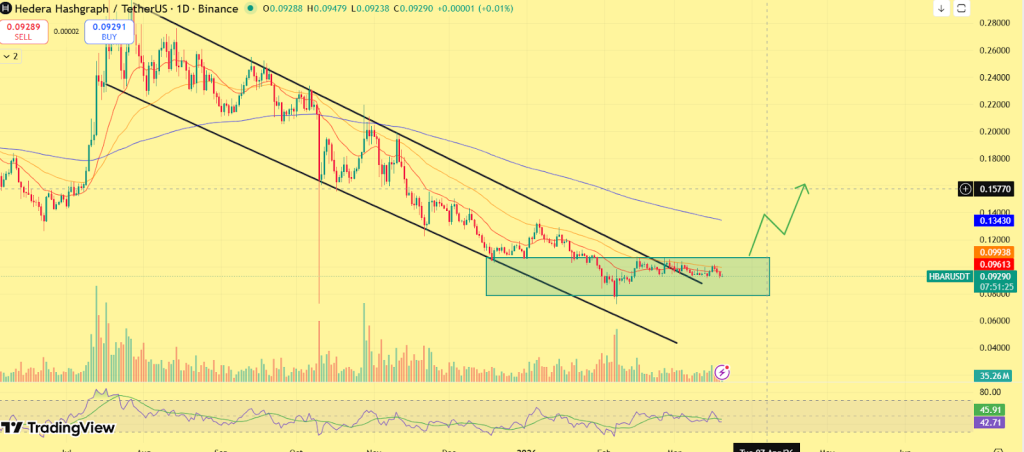
The first important level to watch is the $0.20–$0.25 range, which previously acted as a major resistance zone. Reclaiming this level would signal that HBAR has moved beyond its base formation and entered a recovery phase. Once this level is secured, the price could move toward $0.40–$0.50, where stronger selling pressure may appear. This zone will act as a key test of whether the recovery has enough strength to continue.
If the broader market enters a bullish phase and enterprise adoption within the Hedera ecosystem continues to expand, HBAR could gradually build momentum.
In a favorable scenario, HBAR could reach around $0.65 by 2026, reflecting a structured recovery rather than a sharp rally.
The long-term projection assumes Hedera sustains relevance in enterprise blockchain use cases, with growth moderating over time as the asset matures.
| Year | Potential Low ($) | Potential Average ($ | Potential High ($) |
| 2026 | 0.45 | 0.80 | 1.05 |
| 2027 | 0.65 | 1.00 | 1.20 |
| 2028 | 0.80 | 1.10 | 1.60 |
| 2029 | 0.90 | 1.60 | 2.20 |
| 2030 | 1.40 | 2.20 | 3.00 |
Moving forward to 2026, forecast prices and technical analysis project that Hedera’s price is expected to reach a minimum of $0.45. The price could escalate to $1.05 on the higher end, with an average trading price hovering around $0.80.
Looking ahead to 2027, the optimism around Hedera will lead to steady growth. Hence, the HBAR price is forecasted to reach a low of $0.65, with a potential high touching $1.20 and an average forecast price of $1.00.
As we advance to 2028, with moderate gains, the HBAR predictions indicate that the price of a single HBAR could reach a minimum of $0.80, with the ceiling potentially rising to $1.60. Within the range, the average price will be $1.10.
By the time 2029 rolls around, it’s predicted that Hedera’s price will maintain its upward trajectory, reaching a minimum of $0.90, with the maximum price possibly reaching $2.20 and an average of $1.60, reflecting cautious optimism.
By the end of this decade, HBAR is predicted to touch its lowest price at $1.40, aiming for a high of $3.00 and an average price of $2.20. Hence, the prediction suggests stable long-term growth for Hedera’s market value.
The long-term projection assumes Hedera sustains relevance in enterprise blockchain use cases, with growth moderating over time as the asset matures.
| Year | Potential Low ($) | Potential Average ($) | Potential High ($) |
| 2031 | 1.50 | 2.50 | 3.50 |
| 2032 | 2.00 | 3.20 | 4.50 |
| 2033 | 3.00 | 5.00 | 6.20 |
| 2040 | 8.20 | 12.00 | 15.00 |
| 2050 | 15.00 | 22.00 | 30.00 |
| Year | 2026 | 2027 | 2030 |
| Changelly | $0.68 | $1.10 | $2.40 |
| CoinCodex | $0.90 | $1.50 | $2.20 |
| WalletInvestor | $0.86 | $1.40 | $2.80 |
Stay ahead with breaking news, expert analysis, and real-time updates on the latest trends in Bitcoin, altcoins, DeFi, NFTs, and more.
HBAR could trade between $0.45 and $1.05 in 2026, depending on market conditions, with steady recovery expected rather than a rapid breakout.
By 2030, HBAR could trade between $1.40 and $3.00, supported by steady adoption, enterprise use cases, and long-term market growth.
Reaching $1 by 2040 is realistic if growth continues, as long-term projections suggest HBAR could exceed that level with sustained adoption.
By 2050, HBAR could range between $15 and $30 if the network maintains relevance and adoption in enterprise blockchain use cases.


Bithumb was reportedly given a six-month partial suspension by South Korea’s Financial Intelligence Unit for alleged anti-money laundering failures.

Bitchat saw a spike in downloads during protests in Madagascar, Nepal, Indonesia and Iran over the last year, and global unrest could see more cases like it.

Boyaa Interactive International is the 23rd-largest Bitcoin treasury and the third-largest in Asia, behind Japan’s Metaplanet and China’s Next Technology Holding.

The Meta co-founder is reportedly working on a personal AI agent to bypass management layers as Meta pushes employees to adopt agentic tools.

Bitcoin and Asian markets dropped on Monday as Iran escalated threats to strike critical infrastructure in the Gulf.

“The internet is civilization’s town square, and the economic contract is now obsolete,” wrote Sam Ragsdale on an a16z Crypto blog on Sunday.

The post Shiba Inu (SHIB) Price Prediction 2026, 2027 – 2030: Will SHIB Price Reach $0.000330? appeared first on Coinpedia Fintech News
Shiba Inu (SHIB) is a decentralized cryptocurrency operating within the Ethereum ecosystem and remains one of the most actively traded meme-based digital assets in the market. After experiencing extended price corrections over the past cycle, SHIB entered 2025 under sustained consolidation, with volatility gradually compressing near long-term support levels.
While recent price action has remained range-bound, technical structure suggests that SHIB may be approaching a multi-year inflection point. As compression continues and market participation rebuilds, attention now shifts to whether 2026 can initiate a new macro expansion phase for SHIB.
| Cryptocurrency | Shiba Inu |
| Token | SHIB |
| Price | $0.0000
|
| Market Cap | $ 3,423,750,379.59 |
| 24h Volume | $ 103,590,712.0326 |
| Circulating Supply | 589,243,635,632,184.7500 |
| Total Supply | 589,500,184,835,394.5000 |
| All-Time High | $ 0.0001 on 28 October 2021 |
| All-Time Low | $ 0.0000 on 27 August 2020 |
Shiba Inu (SHIB/USD) is entering a key demand zone as of Q1 2026, a signal that long-term holders may be positioning for the next market cycle.
Two potential outcomes are possible for 2026: a quick parabolic breakout to higher levels or a gradual recovery towards the $0.00001600 to $0.00001800 range. Maintaining the demand floor will be crucial for SHIB’s price action in the first half of 2026.
On the daily chart, the SHIB price is currently trapped within a consolidation box, built inside a multi year long-term accumulation range. Throughout most of the first quarter, the SHIB price fell to the lower end of this range at $0.0000050.
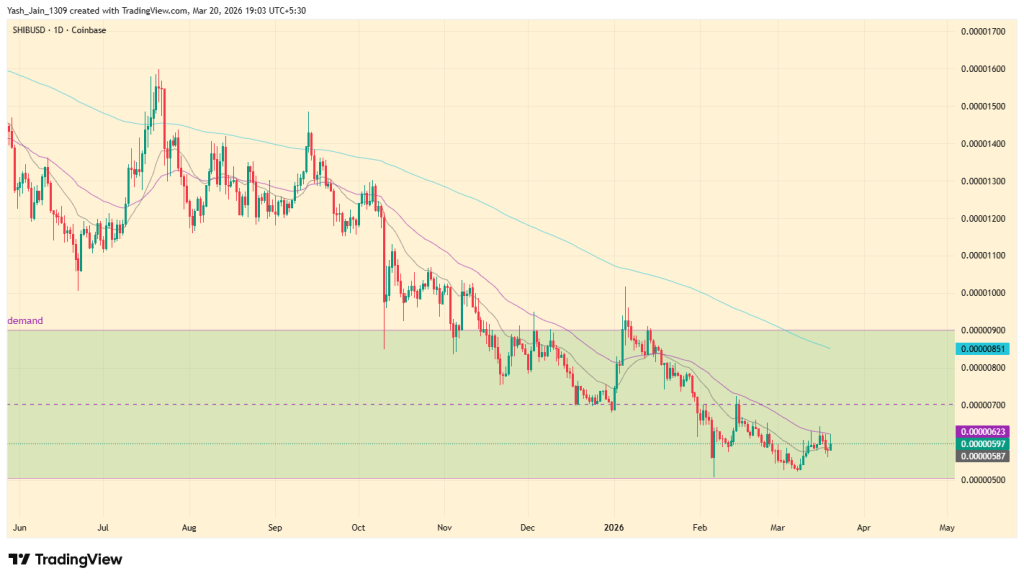
However, since mid-March, there has been a noticeable increase in bullish demand, suggesting that the middle of this accumulation range could be retested by the end of March at $0.0000070. If this bullish momentum does not continue, it could lead to a return to the support level of $0.0000050 within this range.
Biconomy has announced a significant update for Shiba Inu enthusiasts, offering up to 380% APR in rewards through their $SHIB Earn Products. This promotion, launched on February 10, invites users to subscribe and maximize their holdings via these high-yield decentralized finance incentives.
The weekly chart for Shiba Inu (SHIB/USD) shows the price descending into a historically significant and “spectacular” demand zone as of Q1 2026. This green-shaded accumulation area has acted as a powerful springboard in the past, most notably fueling the parabolic rallies of late 2021 and the aggressive surge in early 2024. The current price action suggests that SHIB is once again entering a phase of high-interest absorption, where long-term holders typically begin positioning for the next major market cycle.
While the symptoms of a potential 2026 breakout are building, history indicates two possible paths forward. A high-volatility spike could see SHIB rapidly reclaim higher resistance levels, mirroring its previous explosive moves. However, if a massive breakout does not materialize immediately, the asset is likely to follow a more measured, “gradual” recovery path. In this conservative scenario, the initial recovery targets would focus on reclaiming the 200-day EMA and establishing a foothold in the $0.00001600 to $0.00001800 range.
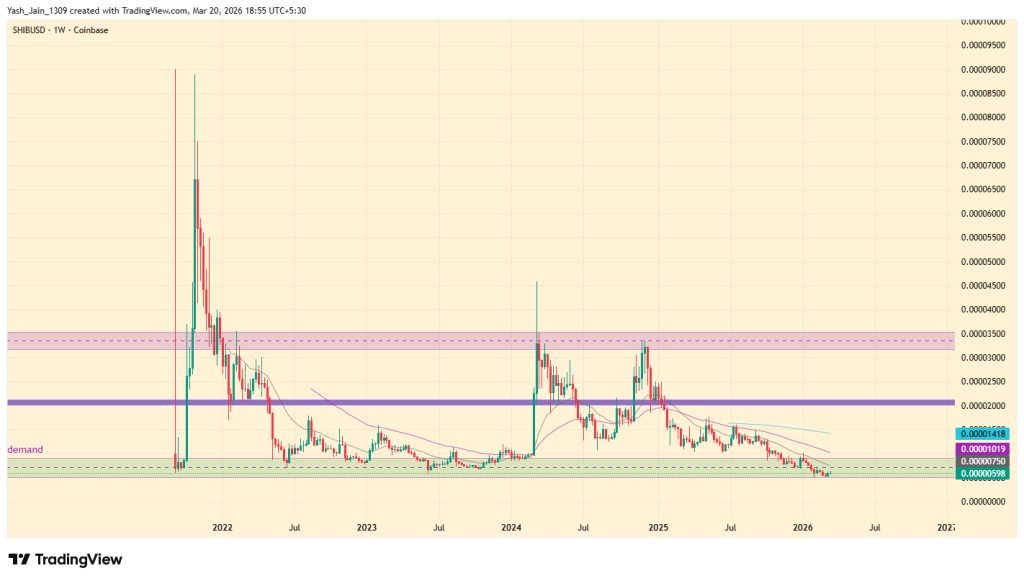
Regardless of the speed of the move, the primary narrative remains the defense of this multi-year demand floor. The ability of the bulls to hold this level throughout the first half of 2026 will be the deciding factor in whether SHIB undergoes a rapid repricing or a steady, trend-following climb toward its mid-term resistance clusters.
| Year | Estimated Low Price | Estimated High Price | Estimated Average Price |
| 2027 | $0.0000200 | $0.0000300 | $0.0000150 |
| 2028 | $0.0000250 | $0.0000500 | $0.0000350 |
| 2029 | $0.0000340 | $0.0000790 | $0.0000650 |
| 2030 | $0.0000580 | $0.0001300 | $0.0000950 |
Shiba Inu (SHIB) price range can be between $0.0000200 to $0.0000300 during the year 2027.
In 2028, Shiba Inu is forecasted to potentially reach a low price of $0.0000250, and a high price of $0.0000500.
Thereafter, the SHIB price for the year 2029 could range between $0.0000340 and $0.0000790.
Finally, in 2030, the price of SHIB is predicted to maintain a steady and positive. It may trade between $0.0000580 and $0.0001300.
Based on the historic market sentiments and trend analysis of the largest cryptocurrency by market capitalization, here are the possible SHIB price targets for the longer time frames.
| Year | Potential Low ($) | Potential Average ($) | Potential High ($) |
| 2031 | 0.000220 | 0.000340 | 0.000480 |
| 2032 | 0.000260 | 0.000400 | 0.000580 |
| 2033 | 0.000310 | 0.000500 | 0.000700 |
| 2040 | 0.000550 | 0.000850 | 0.001300 |
| 2050 | 0.000900 | 0.001500 | 0.002300 |
| Year | 2026 | 2027 | 2030 |
| Changelly | $0.000085 | $0.000140 | $0.000320 |
| DigitalCoinPrice | $0.0000920 | $0.000150 | $0.000350 |
| WalletInvestor | $0.0000340 | $0.0000520 | $0.0000980 |
Stay ahead with breaking news, expert analysis, and real-time updates on the latest trends in Bitcoin, altcoins, DeFi, NFTs, and more.
SHIB price predictions for 2026 range between $0.0000200 and $0.000099, depending on whether the token confirms a long-term breakout.
Growth could come from adoption, token burns, DeFi expansion, and a stronger crypto market pushing demand higher over time.
Reaching $1 is highly unlikely due to SHIB’s large supply, requiring massive market cap growth far beyond realistic projections.
By 2050, SHIB could reach between $0.000900 and $0.002300 depending on long-term adoption, burns, and crypto market expansion.
SHIB’s price is driven by market sentiment, token burns, ecosystem development, overall crypto cycles, and broader risk appetite.
SHIB may have long-term potential with ecosystem growth, but it remains volatile, so investors should carefully manage risk.

The post CZ: Bitcoin Is a True Hard Asset appeared first on Coinpedia Fintech News
Binance founder Changpeng Zhao stated that Bitcoin’s limited supply of 21 million coins gives it qualities similar to gold and real estate, particularly during periods of inflation. He contrasted this with fiat currencies, which central banks can expand during economic uncertainty. His remarks came as the US Federal Reserve kept interest rates unchanged amid inflation concerns tied to tensions in Iran. At the time, Bitcoin traded near $68,700 while gold futures declined more than 5%.
The post Bitcoin Leads Crypto Market Drop, Ethereum and XRP Price Follow appeared first on Coinpedia Fintech News
The crypto market moved lower in the short term, led by Bitcoin, after it broke below a key support level. This decline follows geopolitical tensions linked to U.S. President Donald Trump and Iran.
Reports suggested a warning of possible military action within 48 hours, which created uncertainty across global markets. Within minutes of the news, heavy liquidations in futures trading pushed prices down sharply.
Bitcoin fell from around $71,000 to nearly $68,000, breaking below the $69,000–$69,500 range. This level is now expected to act as resistance.
The earlier rejection near $71,000–$72,000 played a key role in the move, as the price dropped toward the $68,000 area where selling pressure had been building. With that zone now cleared, one immediate downside trigger has eased. The next support lies around $65,500–$66,000, while broader resistance remains between $72,000 and $76,000.
Despite the drop, there are early signs that price could steady in the next 12 to 24 hours, with a chance of a small bounce or sideways movement, though upside remains limited.
Ethereum followed Bitcoin’s move and showed similar weakness. It dropped after failing to hold above the $2,150–$2,200 range, which has now turned into resistance again. The major resistance for Ethereum remains between $2,200 and $2,400. While it is nearing levels where a short-term bounce is possible, overall momentum remains weak.
XRP price also moved lower after repeated rejections near $1.45–$1.47. It has now fallen back toward $1.37, where it recently found short-term support. If prices fall further, the next support range is between $1.30 and $1.35, while resistance remains around $1.42–$1.43. Like Bitcoin and Ethereum, XRP is also nearing levels that could bring a brief pause in selling.
There are early signs that the market may slow down, as selling pressure is easing slightly, even though prices are still falling. This could lead to a short bounce or prices moving sideways for a while.
However, the broader trend remains weak. Even though conditions are similar to past moments that led to temporary recoveries, there is no clear sign of a full reversal yet. The next move may also depend on how traditional markets react. If stocks and forex markets continue to fall, crypto could face more pressure.
Stay ahead with breaking news, expert analysis, and real-time updates on the latest trends in Bitcoin, altcoins, DeFi, NFTs, and more.
Crypto is crashing due to global uncertainty, rising liquidations, and Bitcoin breaking key support, which is pulling the entire market lower.
A short-term bounce is possible, but the overall trend remains weak, and recovery depends on market stability and global financial conditions.
Yes, geopolitical tensions increase uncertainty, trigger risk-off sentiment, and lead to liquidations, which can push crypto prices lower in the short term.

The post Bitcoin Drops to $68,000 as Gold Posts Worst Week in 40 Years appeared first on Coinpedia Fintech News
Gold prices have fallen sharply to about $4,340, making this the largest weekly drop in over 40 years. This comes even as the conflict between the US, Israel, and Iran enters its fifth week,
At the same time, the crypto market is also down by 1.6%. Meanwhile, flagship cryptocurrency Bitcoin has slipped from $76,000 to around $68,000, raising concern in markets around the world
According to recent market data, gold prices dropped below $4,340, marking one of the biggest declines this year. Gold had earlier reached nearly $4,600 in March, but suddenly fell nearly 5% in a single day.
The main reason behind this drop is rising U.S. 10-year Treasury yields, which have climbed to around 4.40%, increasing nearly 45 basis points in just three weeks. A stronger dollar usually pushes gold prices lower.
Another major reason is forced liquidation. In just a few hours, gold and silver together erased nearly $2 trillion in market value. Silver alone fell below $65, dropping more than 4%, and wiping out around $150 billion in market cap.
Also, rising oil prices near $112 are increasing inflation concerns. This makes markets expect the Federal Reserve to keep interest rates high until at least 2027. Polymarket traders see a 75% chance of no rate cuts in 2026.
Recently, Donald Trump issued a two-day ultimatum to Iran to reopen the Strait of Hormuz or face potential strikes on power plants. In response, Iran warned it could shut the crucial waterway and target energy and infrastructure facilities if attacked. This increased geopolitical tension, but gold still fell instead of rising.
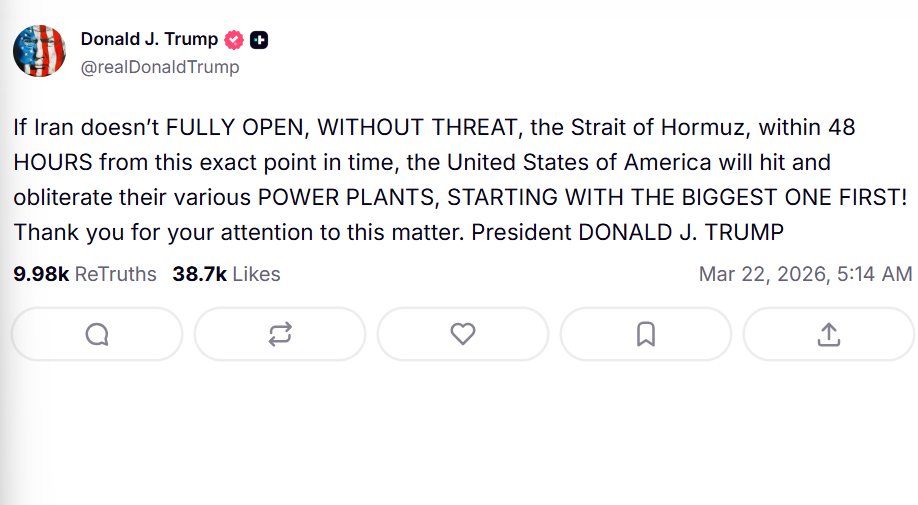
The crypto market is also feeling the pressure. The total crypto market cap has dropped around 1.6% to $2.34 trillion. Meanwhile, Bitcoin has fallen to near $68,000 after recently touching $76,000.
Other major cryptocurrencies like Ethereum, Solana, XRP, and Dogecoin have also fallen around 3%.
Currently, Bitcoin is not acting like gold. Instead, it behaves more like a liquidity asset, moving with interest rates and money supply. When rates rise and liquidity tightens, both stocks and crypto usually fall.
However, one important long-term trend is that Spot Bitcoin ETFs have attracted $56 billion in less than 2 years, almost matching gold ETF inflows built over 15 years, making Bitcoin ETFs one of the fastest capital accumulation stories in ETF history.
Crypto trader Blade shared the BTC/Gold chart, showing a repeating historical pattern. According to the chart, Bitcoin usually consolidates against gold for around 14 months, and then enters a strong expansion phase.
The same structure appears to be forming again in 2026, which could mean Bitcoin may soon start outperforming gold in the next phase of the cycle.
If this happen bitcoin will soon retest its all-time-high price of $126K.
Stay ahead with breaking news, expert analysis, and real-time updates on the latest trends in Bitcoin, altcoins, DeFi, NFTs, and more.
Gold is falling due to rising US bond yields, a stronger dollar, and forced liquidation, which are reducing demand despite ongoing geopolitical tensions.
Although tensions usually boost gold, strong yields, tight liquidity, and forced selling are currently outweighing its safe-haven demand.
Gold’s drop signals tighter liquidity, which is also pressuring crypto markets, causing Bitcoin and altcoins to fall alongside risk assets.
Bitcoin may outperform gold if historical patterns repeat, especially as ETF inflows grow and liquidity conditions improve over time.
The post XRP Price Prediction Points to $5, but 150x Pepeto Presale Math Is Pulling Whale Wallets Away From Ripple Before the Binance Listing Closes appeared first on Coinpedia Fintech News
The XRP price prediction for 2026 keeps climbing, with Standard Chartered targeting $2.80 and analysts calling for $5 to $10 if the CLARITY Act passes before April. Ripple just launched its complete payments stack across Brazil, and spot XRP ETFs have pulled in more than $1.24 billion since November.
That institutional interest confirms the bull case is real. But the wallets building the largest positions this cycle are not sitting inside a token that needs to triple from $1.43.
They are rotating capital into the presale, where the distance between entry and listing is where the real returns live, and this article breaks down what the XRP price prediction data says versus where the smart money is actually going.
Ripple officially launched its full financial stack in Brazil this week, combining payments, custody, and stablecoin services into one market, according to 24/7 Wall Street.
A new Ripple survey of more than 1,000 global finance leaders found that digital assets are now a strategic necessity rather than an experiment, according to CoinDesk.
With Goldman Sachs among the largest XRP ETF holders, the XRP price prediction keeps getting stronger. But the smartest capital is already looking beyond large caps for where the real multiples come from.
Pepeto: The Presale That Whale Wallets Choose Over Large Cap Recovery
The XRP price prediction is real and the Brazil expansion adds serious weight, but the wallets that turned crypto into generational wealth did not do it by watching a large cap slowly climb from $1.43 to $5 over the years. They found the moment where a proven founder, working on products, and presale pricing all existed at the same time, and they committed before the listing changed everything. Pepeto is that moment right now.
Regardless of whether the market is correcting or recovering, Pepeto holders already have access to a complete exchange on the Ethereum blockchain that protects their capital. The platform includes a zero fee trading engine that stops your money from bleeding through costs on every position, and a contract screening system that catches dangerous tokens before your capital goes anywhere near them.
The person who built the original Pepe coin to $11 billion with the same 420 trillion supply and zero products is now building an exchange with infrastructure that Pepe never had. The SolidProof audit was completed before the presale opened, a former Binance expert is driving the exchange toward launch, and more than $8 million in committed capital proves that the biggest wallets are treating this as the entry of the cycle.
Staking at 195% APY is already compounding for the positions that entered while you are still reading about XRP forecasts. At $0.000000186, matching what Pepe reached with nothing is 150x, and the listing approaching fast compresses that return window into days, while every round that fills without you is one more whale locking in the entry you are still thinking about.
XRP is trading at $1.43, down roughly 60% from its July 2025 all-time high of $3.65, according to CoinMarketCap.
Standard Chartered targets $2.80 for 2026, while broader forecasts range from $5 to $10 if the CLARITY Act passes before April. At $5, XRP’s market cap would reach $306 billion. Spot XRP ETFs have absorbed over $1.24 billion since November 2025, with Goldman Sachs among the largest holders.
The CLARITY Act passed the House but remains stalled in the Senate with a 56% chance of passing in 2026. Without it, consensus drops to $1.50 to $2.50. Even the bull case at $5 is only 3.5x from current levels, the kind of return that rewards patience but never changes a life the way a presale to listing window does.
To capture the biggest returns from this shift, a portfolio needs an early stage entry that produces multiples that a large cap at $1.43 cannot deliver. Pepeto makes that decision simple. The presale crossed more than $8 million with a Binance executive guiding the exchange toward launch and SolidProof verifying every contract.
The XRP price prediction requires years of regulatory cooperation to reach $5. Pepeto’s listing compresses that window into days, and the wallets entering today are building positions the rest of the market will spend this cycle wishing they had secured. The Pepeto official website is where investors who recognize how rare this setup is are locking in entries right now.
Take the entry before the Binance listing replaces this price permanently
Click To Visit Pepeto Website To Enter The Presale
How does the Ripple Brazil expansion affect the xrp price prediction?
Ripple’s full financial stack launch in Brazil adds institutional weight to XRP’s bull case, but the biggest returns this cycle are coming from presale entries like Pepeto before the Binance listing.
What is the xrp price prediction for 2026?
Analysts target $2.80 to $5 for XRP depending on the CLARITY Act, but Pepeto at presale pricing targets 150x to the price Pepe reached with zero products and the same 420 trillion supply.
Is Pepeto a good investment right now?
More than $8 million committed with SolidProof verified contracts and a Binance listing approaching makes Pepeto the entry that whale wallets are choosing. Visit the Pepeto official website before the presale window closes.

The post Gold Price Today: Why Is Gold Falling and How Low Can It Go This Week appeared first on Coinpedia Fintech News
Gold prices took a sharp hit, slipping below $4,350 and wiping out over $1 trillion in just a few hours. Even more surprising, gold and silver together lost nearly $2 trillion in that short time, leaving investors across global markets shaken.
So, why is gold crashing right now despite ongoing geopolitical tensions?
Normally, gold rises during crises. But this time, the opposite is happening. Even with the Iran conflict escalating, gold is under pressure.
One major reason is rising bond yields. The US 10-year yield has surged to around 4.40%, climbing sharply in recent weeks. Higher yields make interest-bearing assets more attractive, reducing demand for gold.
At the same time, expectations of rate cuts from the Federal Reserve are fading. With inflation risks still present due to rising energy prices, markets now expect tighter monetary policy for longer.
Another factor behind the crash is liquidity pressure. As oil prices surged earlier, traders needed more capital to maintain positions. This forced many to sell gold quickly to raise cash.
Market observers describe this as “mechanical selling” rather than panic. Gold, being highly liquid, is often the first asset sold during such stress.
Adding to this, stop-loss triggers and technical breakdowns accelerated the fall, pushing prices lower in a short time.
According to The Kobeissi Letter, something unusual is happening. Despite oil losing gains and stock futures turning positive, gold continued to fall.
This is unusual because such conditions typically support gold prices. The divergence suggests that a large player may be getting liquidated, creating sudden and sharp price swings.
They also point to “pockets of illiquidity” in the market, meaning there are fewer buyers at certain levels, which increases volatility and causes rapid price gaps.
Gold has already dropped over 14% in the past month, with intraday lows near $4,350. If pressure continues, further downside is possible in the short term.
An analyst said $4,304 is an important support level that has held strongly before. If gold manages to stay above it, there’s a chance prices could move higher with some upward momentum.
However, if it breaks below $4,304, the next downside targets are seen in the $4,270 to $4,200 range.
The outlook remains mixed. While long-term projections from major institutions and banks like JP Morgan still point toward $6,000+ levels, short-term conditions remain fragile due to high yields and tight liquidity.
Adding another perspective, Peter Schiff argues the sell-off is irrational. He believes rising inflation should support gold, as falling real interest rates are typically bullish for the metal. He also said that rate cuts matter more for stocks, making their relatively mild decline surprising.
For now, markets remain on edge. Whether gold stabilizes or drops further will depend on how inflation, interest rates, and liquidity conditions evolve in the coming days.
Stay ahead with breaking news, expert analysis, and real-time updates on the latest trends in Bitcoin, altcoins, DeFi, NFTs, and more.
Gold is down today due to higher US bond yields, reduced rate cut expectations, and forced selling from liquidity pressure in global markets.
Geopolitical tensions usually support gold, but rising yields and liquidity stress are currently overpowering demand, keeping prices under pressure.
Gold may recover if inflation rises or rate cuts return, but short-term direction depends on bond yields, liquidity, and overall market conditions.

The post Shiba Inu Price Prediction Fades While the Next Shiba Inu With a Binance Listing Gives Investors the Same Window That Made SHIB Holders Rich appeared first on Coinpedia Fintech News
The shiba inu price prediction for 2026 is not what keeps investors awake at night. The regret does. One investor put $7,850 into SHIB on August 19, 2020, the day it launched, and that position grew to over $168 million according to CoinTelegraph.
Just $3 of Shiba Inu purchased on December 31, 2020 was worth $1.3 million by year end according to The Motley Fool.
The one event that changed everything was the Binance listing in 2021. Before Binance, SHIB was a joke. After Binance, it created hundreds of millionaires overnight. The next shiba inu is the token approaching a Binance listing right now with a proven founder, more than $8 million committed, and the same early window that made every SHIB millionaire story possible.
Before getting into today’s Shiba Inu price prediction, a look back is a must. A truck driver invested $8,000 in SHIB before the listing and watched it grow to $5.7 million according to StreetInsider. His coworker heard about SHIB the same day, waited a few hours, and the entry had already moved past him.
The difference between SHIB millionaires and everyone else was never intelligence. It was timing. Pepeto is approaching the same Binance listing now, with a former Binance expert on the team and presale stages filling faster every round.
The next shiba inu is the presale with a confirmed listing and a window that closes permanently when trading opens.
Pepeto: The Exchange Presale With Real Tools Before the Listing Changes Everything
The crypto market is not short on tokens. It is short on projects where a verified team, live products, and presale pricing all exist before a confirmed exchange listing. Pepeto is exactly that combination, built on the Ethereum blockchain with working tools that thousands of holders are already using.
The platform runs a zero fee swap engine that keeps your capital intact on every trade instead of bleeding it through costs. The cross chain bridge transfers your tokens between networks without losing a single unit to fees, so what you send is exactly what arrives.
The person who created the original Pepe coin and took it to $11 billion with the same 420 trillion supply and zero infrastructure is now building a complete exchange with products that Pepe never had and Shiba Inu never built. The SolidProof audit was finalized before any capital was accepted. A former Binance executive is on the dev team guiding the exchange toward launch. More than $8 million from wallets linked to addresses that held major positions through multiple cycles proves that the biggest players recognize what this listing delivers.
Staking at 195% APY is compounding right now for positions that entered early. At $0.000000186, the presale entry is still available, and each round that fills brings the listing closer. The chance to secure this entry is disappearing with every stage, and only those who commit before the Binance listing arrives will carry the positions that the rest of the market spends this cycle wishing they had taken. The Shiba Inu price prediction next proves the point.
Shiba Inu Price Prediction: Targets, Levels, and Why the Returns Have a Structural Ceiling
Shiba Inu is trading at $0.0000059, down more than 93% from its October 2021 all time high of $0.00008845 according to CoinMarketCap.
Alibaba AI forecasts a potential breakout above $0.000025 to $0.00003 resistance that could lift SHIB to $0.000059 by year end, roughly 850% gains according to Cryptonews.
The Motley Fool calculates that matching SHIB’s all time high is only about 14x, and reaching Ethereum’s market cap would turn $1,000 into just $60,800. These are respectable returns but a fraction of the 150x that Pepeto targets from presale to the level Pepe reached with nothing. SHIB’s millionaire window closed in 2021. The next shiba inu millionaire window is open right now and closes the moment the Binance listing goes live.
A strong portfolio needs an early stage entry that delivers multiples no large cap or fading meme coin can produce. Pepeto makes that choice clear. This presale sits open with a former Binance expert on the team, more than $8 million raised, and a listing approaching fast. The investors who entered SHIB before the Binance listing in 2021 made millions, and every one of them says they wish they had committed more.
Pepeto is that second chance with better infrastructure, the same cofounder who built an $11 billion token, and a presale filling faster every week. The Pepeto official website is where investors who understand how rare this window is are securing positions right now.
Secure your entry before the Binance listing closes this presale window permanently
Click To Visit Pepeto Website To Enter The Presale

How did Shiba Inu investors become millionaires before the Binance listing?
SHIB created hundreds of millionaires when $7,850 turned into over $168 million and $3 became $1.3 million. The Binance listing in 2021 was the single event that changed everything, and Pepeto is approaching the same listing now.
What is the shiba inu price prediction for 2026?
Analysts forecast SHIB could reach $0.000059 in a bull case, roughly 850% gains. Pepeto at presale pricing targets 150x to the level Pepe reached, making it the next shiba inu for investors seeking early entry returns.
Is Pepeto the next Shiba Inu to buy before the listing?
More than $8 million committed, SolidProof audited, same Pepe cofounder, and a Binance listing approaching. Visit the Pepeto official website before this presale window closes permanently.

Michael Saylor’s Bitcoin-holding company Strategy has already purchased more than $2.9 billion worth of the cryptocurrency this month.

Part of the approved rule changes allows institutions to trade the crypto ETFs as FLEX options, which offer customizable terms like non-standard strike prices and expiration dates.

UK Finance said that tokenized deposits could play a “vital role” in a future multi-money system alongside other digital assets.

21Shares’ macro chief says Bitcoin and gold are diverging as central bank demand drives gold, while retail adoption shapes BTC’s market behavior.
The post Remittix or IPO Genie Hype? This Platform Actually Earns You Real BTC in 2026 appeared first on Coinpedia Fintech News
Two of the most discussed presale names in early 2026 have built their narratives around access and utility rather than direct yield. Remittix pitches itself as a PayFi platform enabling crypto-to-fiat transfers directly into bank accounts — a live product that currently functions as a standard multi-chain wallet, without the fiat conversion or bank transfer functionality the project markets as its core value proposition. Its tokenomics compound the concern: approximately 81% of the total supply could hit the market simultaneously at TGE with no vesting on the presale allocation. IPO Genie has built its narrative around AI-assisted pre-IPO access — with rewards explicitly described as variable and not guaranteed.
Bitcoin Everlight operates on a different model entirely — one where the reward source is documented, the verification record is public, and the earning mechanism begins from the moment of shard activation.

Bitcoin Everlight runs a Transaction Validation Node network where nodes handle routing, verification, and quorum confirmation for every transaction that moves through the infrastructure. The micro-fees generated by that process are distributed to participants based on measurable contribution data — routing volume, uptime, delivery latency, and successful transaction completion rates. As the network processes more transactions, the fee pool available for distribution grows proportionally.
Everlight Shards connect participants to that fee pool without requiring them to operate any node infrastructure. Each shard represents an activation tier within the node network, and once active, it draws from the fee pool automatically through the Everlight dashboard — accessible via MetaMask or WalletConnect on desktop and mobile, with live reward accrual and tier tracking updating in real time.
During the presale phase, activated shards earn fixed BTCL rewards from the moment of activation. At mainnet launch, the same shard transitions automatically to performance-based BTC distribution from live routing fee activity — no migration required, no additional steps, no product release the participant needs to wait for before earnings begin.
The project completed dual smart contract audits through Spywolf and Solidproof, alongside dual KYC verifications through Spywolf and Vital Block — all publicly linked and all completed before the presale opened. Remittix’s team verification came ten months after its presale launched and does not disclose the identities or professional backgrounds of the individuals involved. IPO Genie’s verification is handled through CertiK for the smart contract, though the team’s identity verification record is less prominently documented than its security audit.

Phase 2 of the Bitcoin Everlight presale is now active with BTCL priced at $0.0010 per token. Entry begins at $50, accepted across more than nine cryptocurrencies. The Azure Shard activates at a $500 cumulative commitment and earns up to 12% APY in BTCL through the presale period, transitioning to BTC rewards from real routing activity at mainnet launch. The Violet Shard activates at $1,500 with up to 20% APY — the most commonly activated tier on the platform. The Radiant Shard activates at $3,000 with up to 28% APY, carrying the highest participation weight into the mainnet reward phase.
Participants holding tokens below any threshold maintain a dormant shard position that upgrades automatically once their cumulative commitment crosses the next tier. Shard positions are not permanently locked — participants who choose to stop validating within the ecosystem can unstake their BTCL at any point.
The token supply is fixed at 21 billion BTCL with no inflation mechanism. 45% goes directly to presale participants, 20% funds node rewards and network incentives, and the remaining 35% covers exchange liquidity, team vesting under a structured schedule, and ecosystem development.

Remittix buyers are waiting for a fiat transfer product that hasn’t shipped. IPO Genie buyers are waiting for a private deal pipeline to generate variable, unguaranteed rewards from opportunities that may or may not materialize on schedule. In both cases, the earning mechanism depends on something external to the protocol functioning as described — a licensed payments product clearing regulatory hurdles, or an AI deal-scoring system producing verified winners with enough frequency to justify the reward model.
Bitcoin Everlight’s post-mainnet distribution is drawn from what the network generates from transaction routing fees. The fee pool exists because the infrastructure is processing transactions, and it distributes to whoever holds an active shard at the time. For participants comparing presale options in Q1 2026 on the basis of where the yield actually comes from, that distinction defines the comparison.
Everything about how Everlight Shards work and what the BTC reward distribution looks like after mainnet launch can be explored here:

Proponents of Bitcoin's four-year cycle theory say the price of BTC typically rises for three of the four years and declines in the final year.

Bitcoin fell over the weekend to set up another visit to "unreliable" support, but analysis flagged a new BTC price golden cross.

Fidelity called for updated reporting rules and clearer guidance on how decentralized platforms and alternative trading systems should operate under US law.
The post Bitcoin and Ethereum Declared Non-Securities as SEC Chair Atkins Backs Clarity Act: ‘I Trust It Will Reach Trump’s Desk’ appeared first on Coinpedia Fintech News
Securities and Exchange Commission Chair Paul Atkins made one of the most significant announcements in the history of American crypto regulation on Tuesday, declaring that Bitcoin, Ethereum and a broad range of digital assets are formally exempt from securities laws, a ruling that draws a clear legal line under more than ten years of industry confusion and enforcement-by-ambiguity.
Speaking at the DC Blockchain Summit 2026, Atkins unveiled a new token taxonomy and investment contract interpretation framework that the SEC is implementing immediately.
“The SEC’s persistent failure to provide clarity on this question is over,” Atkins told attendees.
What the Framework Actually Says
The new framework establishes four categories of crypto assets that are explicitly not securities under U.S. law. Digital commodities, which include Bitcoin and Ethereum, sit at the top of the list. Digital collectibles, digital tools, and payment stablecoins issued under the GENIUS Act round out the remaining three categories.
SEC Chair: BTC and ETH Have Been Clearly Defined as Non-Securities
— Wu Blockchain (@WuBlockchain) March 22, 2026
On March 18 at the DC Blockchain Summit 2026, SEC Chair Paul Atkins announced a new token taxonomy and investment contract interpretation framework, ending long-standing regulatory uncertainty.
The framework… pic.twitter.com/009JGB2Nvl
Under the new interpretation, only one class of crypto asset remains subject to SEC oversight: digital securities, defined narrowly as traditional financial securities that have been tokenised and moved onto a blockchain. Everything else falls outside the SEC’s jurisdiction.
Atkins was blunt about what this means for the agency’s identity.
“We are not the Securities and Everything Commission anymore,” he said.
Safe Harbors for Startups and Fundraising
Beyond the taxonomy, Atkins previewed two new capital-raising pathways designed to bring crypto innovation back to U.S. soil.
The first is a startup exemption, a time-limited registration exemption lasting up to four years that would allow early-stage crypto projects to raise up to $5 million while operating under a regulatory runway rather than full securities compliance.
The second is a fundraising exemption that would allow more established projects to raise up to $75 million in any 12-month period, provided they file a disclosure document with the SEC covering the project’s financial condition and audited financial statements.
Both exemptions would sit alongside existing capital-raising mechanisms, not replace them.
Congress Still Holds the Final Card
Despite the sweeping nature of Tuesday’s announcement, Atkins was clear that regulatory frameworks issued by the SEC alone are not a permanent solution. Only Congress, he said, can future-proof crypto regulation through comprehensive market structure legislation.
He expressed strong support for the bipartisan Clarity Act currently moving through Capitol Hill, describing Regulation Crypto Assets as a head start on implementing the bill ahead of its expected passage.
“I trust it will soon reach President Trump’s desk,” Atkins said.
For an industry that has spent a decade navigating enforcement actions, legal threats and regulatory ambiguity, Tuesday’s announcement marks the clearest signal yet that Washington is finally ready to let crypto grow up.
The post Why are Bitcoin, Ethereum and XRP Prices Crashing Today: Iran, Trump and the Strait of Hormuz Explained appeared first on Coinpedia Fintech News
Bitcoin, Ethereum and XRP tumbled sharply on Sunday after Iran responded to President Trump’s 48-hour ultimatum not with concessions but with an escalation, vowing to fully close the Strait of Hormuz and strike energy, technology and water infrastructure across the Middle East. With 33 hours remaining on Trump’s deadline, markets are pricing in the very real possibility of direct military confrontation.
The total crypto market cap fell 2.31% to $2.36 trillion, wiping roughly $55 billion in value as investors moved swiftly out of risk assets.
What Iran Said
Iran’s response, relayed through senior military commanders, was unambiguous. The country would completely seal the Strait of Hormuz, the narrow waterway through which roughly 20% of the world’s oil supply passes daily.
Strikes on vital regional infrastructure, including energy facilities, IT systems and water desalination plants, were explicitly threatened. Officials added that Iran had stockpiled enough essential goods to withstand up to one year of sanctions pressure, signalling the country has no intention of backing down quickly.
Iran’s military leadership also announced a formal shift in strategy from defensive to offensive operations, a significant change in posture that immediately rattled financial markets worldwide.
The Numbers
Every major cryptocurrency fell in lockstep with equities as the headlines broke.
Bitcoin dropped 2.58% to $68,820, dragging its market capitalisation below $1.38 trillion. Ethereum fell harder, losing 3.36% to $2,082, its steepest single-session drop in weeks. XRP declined 3.04% to $1.39. Solana shed 2.72% to $87.33, and Dogecoin fell 2.82% to $0.091.
The CoinMarketCap Fear and Greed Index hit 27, deep in fear territory. The average crypto RSI across the market fell to 39.59, approaching oversold levels not seen since the early weeks of the Iran conflict.
Why Crypto Falls When Wars Escalate
The moves reflect a market that has fundamentally repositioned crypto as a risk asset rather than a safe haven. When geopolitical fear spikes, institutional investors reduce exposure across equities, commodities and digital assets simultaneously, rotating into cash and government bonds instead.
Adding to the pressure, interest rate hike expectations are quietly creeping back into market pricing.
What Happens Next
The next 33 hours are the most consequential for markets in weeks. If Trump extends or softens his deadline, a relief rally across risk assets is likely. If Iran takes any military action before the clock runs out, expect Bitcoin to test the $65,000 level and broader crypto market cap to approach $2.29 trillion, the 78.6% Fibonacci retracement level analysts have identified as critical support.
Macro events this week will add further volatility. S&P Global Services PMI data arrives Tuesday, U.S. crude oil inventory data on Wednesday, initial jobless claims on Thursday, and Michigan Consumer Sentiment on Friday.


USR issuer Resolv Labs says its collateral pool remains intact after an exploit on Sunday that minted 80 million unbacked tokens and drove the US dollar stablecoin as low as $0.14.

Bitcoin’s 20-week rolling correlation with the S&P 500 has turned positive, a signal that has historically preceded major BTC price declines.

The post Pepe Coin Price Prediction and 150x Pepeto Math: Same Cofounder, Same Supply, Full Exchange and Binance Listing Approaching appeared first on Coinpedia Fintech News
The Pepe coin price prediction keeps analysts talking, but the biggest story in the Pepe ecosystem is not the chart. It is the cofounder. The person who built Pepe from nothing to $11 billion with 420 trillion tokens and zero products is now building Pepeto with the same supply, the same viral energy, and a complete exchange that Pepe never had.
Early Pepe holders who bought during the first weeks in April 2023 watched $1,000 positions grow into hundreds of thousands as the token exploded over 7,000% in its first month. Those returns came from a meme with no utility and no audit.
Pepeto has both, plus a Binance listing approaching directly after launch and growing attention from communities that pushed Pepe viral. The Pepe coin price outlook matters for context, but the next Pepe coin is the one where the presale window is still open, and the math from entry to listing creates the same millionaire outcomes.
The original Pepe coin proved that a meme token with zero utility can reach $11 billion on viral energy alone. Every wallet that was bought early and held through the listing made life changing money. But Pepe had no exchange, no bridge, no audit, and no plan for what happens after hype fades.
That is why Pepe’s price prediction is down over 95% from its all time high today. Pepeto fixes every weakness. The same cofounder is building an exchange with zero fee trading, a cross chain bridge, a risk scorer, and a SolidProof audit.
The Binance listing will be announced directly before launch, and the viral energy building around Pepeto mirrors the pattern that sent the original Pepe parabolic. With possible Elon Musk engagement growing, Pepeto is the next Pepe coin with a floor the original never had.
Pepeto: The Most Complete Exchange Presale From the Founder Who Already Built an $11 Billion Token
Pepeto is not just the most talked about presale in the market. It is the presale with the most advanced product development from a founder who already proved what happens when viral energy meets the right moment.
The project has built a full exchange on the Ethereum blockchain where tools protect your capital instead of extracting it. The risk scoring system catches dangerous contracts before your money goes anywhere near them, flagging hidden ownership traps and liquidity locks that most traders never see until it is too late.
Compared to the original Pepe, which reached $11 billion on hype alone, Pepeto has real exchange infrastructure, a SolidProof audit, and a former Binance expert guiding it toward listing. More than $8 million raised with wallets entering every stage at larger sizes proves this is the entry of the cycle.
Staking at 195% APY is already compounding for positions inside, growing balances while the rest of the market watches the Pepe coin price prediction. At $0.000000186 with the same 420 trillion supply, matching what Pepe reached with nothing is 150x, and the exchange makes that ATH the floor. But this window closes permanently when the Binance listing arrives, and the stages fill faster every round.
Pepe is trading at $0.0000034, down over 95% from its December 2024 all time high with a market cap near $1.4 billion according to CoinMarketCap. The 50 day EMA sits at $0.0000040, roughly 18% above the current price according to FXStreet.
A return to the all time high of $0.00002803 is roughly 8x. For a token that proved what meme virality can do, 8x does not change a portfolio. The same founder building Pepeto at 150x from presale to that same ATH tells you where the real math lives.
That combination of meme virality and working exchange utility on the Ethereum blockchain is why the wallets entering every stage are linked to addresses that held major positions through multiple cycles. These are holders who built wealth by recognizing infrastructure early.
They enter with size, verify everything, and only commit when they see something the broader market has not caught up to. The pepe coin Price prediction offers recovery, but the next Pepe coin is the one where the same founder is building with better tools and a presale window that closes the moment the listing arrives. The Pepeto official website is where those entries are being made right now.
Take the presale entry that the same founder’s track record says will be the one everyone wishes they took
Click To Visit Pepeto Website To Enter The Presale

FAQs
Is the Pepeto founder the same person who built the original Pepe coin?
Yes, the cofounder who took Pepe to $11 billion with 420 trillion tokens and zero products is now building Pepeto with a full exchange, SolidProof audit, and a Binance listing approaching.
What is the pepe coin price prediction for 2026?
PEPE at $0.0000034 targets recovery toward $0.0000040 near term. Even returning to its ATH is only 8x. Pepeto at presale pricing targets 150x to the same level with stronger infrastructure.
Why are investors calling Pepeto the next Pepe coin?
Same cofounder, same 420 trillion supply, but with a working exchange, zero fee trading, and a Binance listing confirmed. Visit the Pepeto official website before the presale window closes permanently.
The post Pi Network News: Pi Price Faces Six-Month Headwind as Token Unlocks and Development Delays Compound appeared first on Coinpedia Fintech News
Pi Network’s token is under serious pressure, falling 5.16% to $0.190 in 24 hours. For a coin that once traded at $2.98 over a year ago, the decline represents a 93% collapse from its all-time high, and analysts warn the bottom may still be months away.
Three Forces Pushing Pi Lower
The immediate trigger was macro. President Trump’s threat to strike Iranian power infrastructure sent risk assets into a tailspin on Saturday, and Pi, as one of the market’s more speculative tokens, felt the pain disproportionately. A 16 million Pi token unlock on March 21 added fresh selling pressure on top of an already fragile price structure, flooding the market with new supply at precisely the wrong moment.
Pi’s 24-hour range told the story clearly: a high of $0.201 gave way to a low of $0.1878, with buyers unable to mount any meaningful defence.
The Deeper Problem: Development Is Too Slow
Beyond the short-term noise, a growing number of community voices are raising structural concerns about Pi’s roadmap. Dr. Pi, one of the network’s most followed commentators, published an assessment this week that is circulating widely across crypto forums.
“Pi will keep falling,” they wrote. “The current user base is driven by overly optimistic expectations about announcements from the Pi Core Team, creating only a short-lived boom.”
The core argument is damaging: that Pi Launchpad, which recently went live on testnet, will generate no real token demand because it is entirely sentiment-driven rather than backed by genuine utility. Based on the core team’s historical pace, he estimates the full launch is at least six months away. PiDex, the network’s decentralised exchange, is even further out.
“Their intention is clear,” they wrote. “They do not want to enable speculative trading.”
Even smart contracts, when they eventually arrive, will be rolled out in a tightly controlled, limited manner, only for hand-picked projects the team specifically endorses. For a community that has been mining and waiting for years, the timeline is testing patience to its limits.
A Community Running Out of Steam
Perhaps the most sobering observation concerns the human cost of the long wait. Dr. Pi said that while Pi’s community remains enormous on paper, active participation is steadily declining as pioneers exhaust their enthusiasm. Early miners and third-party developers, he argued, have already been worn down by years of delays.
Where the Price Goes Next
Technically, the immediate line in the sand is $0.176. A hold above that level could allow Pi to consolidate and stabilise. A break below opens the door to $0.15, a level that would represent a fresh all-time low and likely trigger another wave of capitulation selling.
For bulls, the target to watch on the upside is $0.21. A reclaim of that level would signal that selling pressure is easing and that sentiment may be turning.
The post XRP Price Could Hit Double-Digits by End of Trump Term as Clarity Act Clears Final Hurdle, Experts Say appeared first on Coinpedia Fintech News
A last-minute compromise between the White House, U.S. banks, and crypto firms over stablecoin yield rules has dramatically improved the odds of the Clarity Act becoming law this year, a development that analysts say could be the most consequential regulatory moment in digital asset history.
Prediction market Polymarket now prices the bill’s passage at 72%, up from 63% just one week ago, after negotiators resolved a months-long standoff over whether stablecoin holders should be allowed to earn interest on their holdings.
The Stablecoin Standoff, Solved
Banks had fiercely resisted provisions that would allow retail customers to earn 4% to 5% annual yields on stablecoins, fearing it would drain deposits from the traditional banking system. Under the tentative deal, crypto firms will be prohibited from using terms such as “interest” or “yield” for stablecoin rewards, limiting but not eliminating the returns available to holders.
Patrick Witt, executive director of the White House Crypto Council, called it “a major milestone,” crediting Senators Tom Tillis and Tim Scott for bridging the partisan divide. Ripple CEO Brad Garlinghouse had previously put the odds of passage by end of April at 90%.
“Watch April very closely,” one Washington policy analyst wrote this week. “The path just opened.”
What It Means for XRP
Senator Cynthia Lumis, one of the bill’s most vocal champions, framed the Clarity Act as central to Trump’s stated ambition of making the United States the global capital of digital assets.
For XRP specifically, the stakes are substantial. The CFTC and SEC this week jointly indicated that XRP, Chainlink, and similar tokens would be classified as digital commodities rather than securities, a designation that removes a significant legal barrier to institutional adoption.
Evernorth, the company building what it describes as the largest XRP treasury in the world ahead of a planned Nasdaq listing, noted this week that institutional use of XRP as a cross-border liquidity bridge is growing, even if retail price action has not yet reflected it.
“The version of XRP that could drive sustained utility demand is when banks and businesses leverage it as working capital,” the firm’s chief executive said.
The $600 Trillion Comparison
Supporters of the bill are drawing parallels to the Commodity Futures Modernization Act of 2000, which gave legal clarity to derivatives markets and helped expand that asset class from roughly $100 trillion to over $600 trillion within a decade, before the same instruments became central to the 2008 financial crisis.
If crypto follows a similar trajectory after the Clarity Act is signed, analysts argue that trillions of dollars currently sitting on the sidelines at firms like BlackRock, JPMorgan, and Goldman Sachs could move into digital asset markets. Hence experts say XRP could hit double-digits.
The Senate Banking Committee is expected to be the next critical checkpoint, with April seen as the make-or-break window for the bill’s passage before attention shifts to midterm election season.


The post Bitcoin Price Prediction Targets $150,000 as the 2026 Bull Run Builds, but the Wallets That Built Wealth in Every Previous Cycle Are Already Inside Pepeto appeared first on Coinpedia Fintech News
Every Bitcoin price prediction worth reading points up. Standard Chartered targets $150,000. CoinShares expects $120,000 to $170,000. Bit Mining projects $225,000. The 2024 halving cycle is repeating the pattern that followed every halving before it.
But the people who built generational wealth during bull runs never did it by holding Bitcoin from $70,000 to $150,000. They found the entry before the rest of the market woke up. A $1,000 investment in Bitcoin in 2013 at $100 was worth over $690,000 at the 2021 peak.
The 2026 bull run is forming, and the entry that delivers the biggest multiples this cycle is the presale where the math from entry to listing produces returns no large cap can match.
Every crypto bull run followed the same script. Bitcoin led, altcoins followed, and the wallets that entered early turned small positions into life changing wealth. In 2017, Ethereum buyers at $8 watched it reach $1,400. In 2021, Solana buyers at $1.50 saw it hit $260.
Shiba Inu turned $100 into $2.35 million in a single year. Every story had the same ingredients: an early entry, a catalyst, and a market not paying attention. The bitcoin price prediction confirms the bull run is forming.
More than $8 million committed to Pepeto’s presale during a correction that sent retail investors running is the conviction signal that appeared before every parabolic move in previous cycles.
The bull run rewards early movers and punishes everyone who waits for confirmation. The wallets that built the biggest fortunes during previous cycles found the moment where timing, team, and price all pointed to one entry, and they committed while the broader market was still afraid. Pepeto is exactly that entry right now.
The crypto market has shown that protecting capital while it grows requires infrastructure, not just charts. Pepeto’s exchange on the Ethereum blockchain does exactly that. The zero fee swap engine keeps every dollar working for you instead of bleeding through trading costs. The contract risk scorer catches dangerous tokens and flags hidden traps before your money goes anywhere near them.
The builder behind Pepeto already proved what happens when meme virality meets the right timing. The original Pepe coin reached $11 billion with the same 420 trillion supply and zero products. Pepeto has a complete exchange, a SolidProof audit verified before the first dollar was accepted, and a former Binance expert driving the platform toward listing. More than $8 million raised during peak fear proves the biggest wallets see this as the entry of the cycle.
Staking at 195% APY is compounding for positions inside while the bitcoin price prediction debates play out in headlines. At $0.000000186, matching what Pepe achieved with nothing is 150x, and the exchange makes that number the floor. The bull run approaching compresses the distance between presale pricing and listing into the kind of return window that Bitcoin at $70,500 cannot deliver.
Bitcoin is trading at $70,361, down 44% from its October 2025 all time high of $126,173 according to CoinMarketCap. The consensus bitcoin price prediction clusters between $120,000 and $175,000. Standard Chartered targets $150,000. Bit Mining projects $225,000 in the bull case.
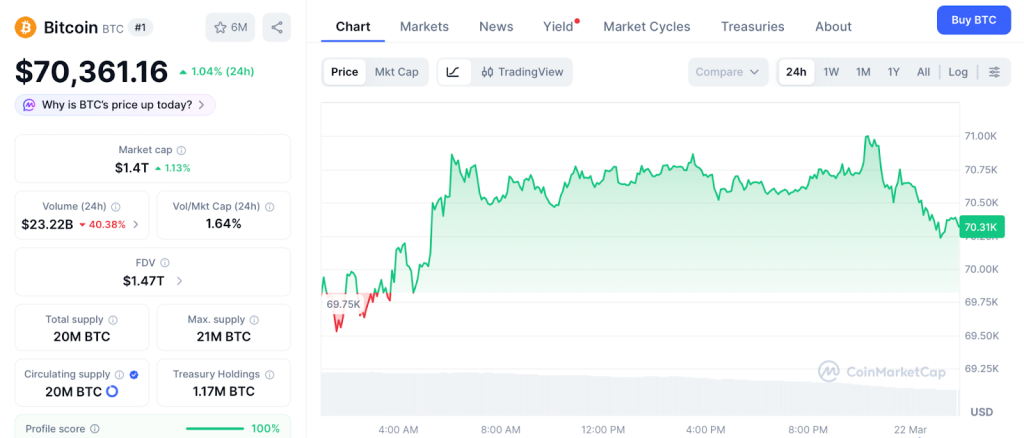
The Fear and Greed Index reads 11, Extreme Fear, conditions that preceded every major bottom in Bitcoin’s history. Corporate treasuries hold over 1.09 million BTC worth $110 billion, according to FXEmpire. Even at $150,000, that is roughly 2x from current levels. Those returns reward patience but do not create the wealth that a presale to listing window delivers.
The whale wallets entering Pepeto at presale pricing are building positions expecting returns that the bitcoin price prediction takes years to match. The crypto headlines will cover this moment after the Binance listing, and the only question is whether you secure your position on the Pepeto official website today or buy from those whales later at a price that turns this entry into regret.
Every bull run created a new group of millionaires and a much larger group who saw it, waited, and carried that decision into the next cycle. The Bitcoin price prediction says $150,000 is coming. The presale says the entry is still open, but the timing is getting critical to catch this opportunity ahead of listing.
Enter the presale that the 2026 bull run will make everyone wish they had found earlier
Click To Visit Pepeto Website To Enter The Presale
FAQs
How does the bitcoin price prediction support the case for a 2026 bull run?
Analysts target $120,000 to $225,000 for BTC in 2026. The halving cycle, ETF inflows, and institutional adoption all point to a bull run forming, and Pepeto’s presale is the early entry that every cycle rewards.
What is the bitcoin price prediction for 2026?
Standard Chartered targets $150,000, CoinShares expects $120,000 to $170,000, and bull case estimates reach $225,000. Pepeto at presale pricing offers 150x to the level Pepe reached, multiples that BTC at $70,361cannot deliver.
Why are investors choosing Pepeto over Bitcoin during the bull run buildup?
BTC targets 2x to $150,000. Pepeto targets 150x from presale to listing with the same cofounder who built Pepe to $11 billion. Visit the Pepeto official website before the presale closes.
The post Pepe Losing Momentum? Everlight Shards Let Frustrated Holders Earn Real BTC Passively Instead appeared first on Coinpedia Fintech News
As we move further into 2026, the crypto market is showing signs of a major transition. For a long time, meme coins like PEPE dominated the conversation with massive price swings and viral community growth. However, recent data shows that the PEPE price is beginning to stall as holders look for more sustainable ways to grow their wealth. While meme coins offer excitement, many investors are starting to feel the pressure of high volatility and the lack of real world utility.
This shift in sentiment is leading frustrated holders to search for assets that offer long term stability and professional infrastructure. Some early crypto participants are beginning to notice a new validation platform called Bitcoin Everlight. This discovery is attracting a lot of attention because it allows users to participate in the Bitcoin network directly. Instead of waiting for a meme to trend on social media, these participants are earning real Bitcoin by supporting a scaling layer. It is a unique moment where the focus is moving from speculative fun to serious network utility.
Bitcoin Everlight is a decentralized validation network designed to allow users to participate in securing blockchain infrastructure while earning Bitcoin rewards. Even though Bitcoin is the strongest asset in the world, it needs extra support to handle the massive volume of global payments expected in the coming years. This project provides that critical execution layer by introducing Everlight Shards. These shards represent validation units within the network that help verify and route transactions with extreme precision. This matters because it allows Bitcoin to be used as a fast and efficient tool for daily commerce.

The project is gaining massive attention from top experts and crypto enthusiasts who see the potential of this scaling layer. Respected voices like Crypto Vlog,Token Empire, and Crypto Nitro have recently discussed the platform. They highlighted how it simplifies the path to Bitcoin rewards for everyday users. This level of interest from the community shows that the platform is quickly becoming a trusted name for those moving away from meme coins. For the average participant, this is a professional way to build a Bitcoin balance without needing to understand the deep technical details of mining.
The process of joining this validation network has been made very simple to ensure that anyone can participate. It follows a clear 4 step model that handles all technical complexities in the background so you do not need deep technical skill. Simplicity is a core focus because it allows the network to grow its capacity quickly as more people join the movement.
This 4 step path ensures clarity at every stage. No hidden steps or downloads. Everything is managed through the network layer so you focus on rewards while infrastructure handles technical work. Streamlined for efficiency and ease.

Understanding the Shard Activation Tiers
The validation system uses a shard activation model with 3 main tiers of participation. Each tier represents a different validation power. This structure scales with community growth and rewards those providing the most support to Bitcoin’s scaling layer.
You can begin your journey with as little as $50 to build up your tokens over time. If your balance is below the $500 activation mark, you maintain a dormant shard position. This position stays in the system and tracks your holdings until you reach the threshold for full activation. Once you hit that 500-dollar mark, your shard moves from being dormant into an active state.

Bitcoin Everlight follows a bank grade security plan to ensure participant protection. This level of safety is a core requirement for any system handling Bitcoin scaling and global payments. The project has undergone multiple external reviews to ensure that all user data and smart contract operations are protected by the highest international standards.
To provide total transparency for the community, the platform has reached several major safety milestones and completed independent code audits.
We are currently in phase 1 of the Bitcoin Everlight presale, which is an amazing opportunity for early participants to join. This stage is the foundation of the entire project and offers a unique window to secure a position at the lowest possible price point. By participating now, you are ensuring that you get the most validation power for your contribution. This is a special moment because the network is still in its early discovery phase, and urgency is very high as the first price jump approaches.
The clock is moving toward the end of this initial phase, and you must act quickly to secure the best rate.
As Bitcoin Everlight continues expanding its validation infrastructure, early participants are beginning to explore the platform’s shard activation model. This is a unique chance to join a professional network that helps scale the world’s most important digital asset. By activating your shards during this early phase, you are securing a place in the future of Bitcoin payments. This focus on real infrastructure and native rewards is why the platform is quickly becoming a favourite for those who want actual utility and a strong community. Users interested in learning more about how to activate Everlight Shards and start earning native BTC can explore the platform here:


Indian crypto exchange CoinDCX says the fraud complaint is part of a wider impersonation scam, citing more than 1,200 fake sites using its brand.

Welch said the fallout from the HAWK memecoin left her wary of crypto, adding she still does not fully understand the sector more than a year later.


The post CoinDCX Founders Arrested in $85,000 Crypto Fraud Linked to Impersonator Network appeared first on Coinpedia Fintech News
The co-founders of CoinDCX, one of India’s largest cryptocurrency exchanges, were arrested and questioned by police this week in connection with an alleged fraud totalling roughly 71 lakh rupees ($85,000) — a case the company says was carried out entirely by scammers impersonating them, not by the founders themselves.
Sumit Gupta and Neeraj Khandelwal were detained after a First Information Report named them in connection with the scheme. CoinDCX said the complaint was filed against the wrong people, calling it “a conspiracy against CoinDCX by impersonators posing as founders.”
Fake Sites, Real Victims
The exchange says criminals built a network of fraudulent websites mimicking its brand to steal money from ordinary investors. Between April 2024 and January 2026, CoinDCX says it identified and reported over 1,212 fake websites designed to look like its official platform. Victims were allegedly told to transfer funds in cash to third-party accounts that had no connection to the real exchange.
“We have taken cognizance of the fact and published a notice to public at large on our website that CoinDCX is being targeted by fraudsters. The entire conspiracy falsely claims that funds were transferred to accounts which have no relation to CoinDCX,” the company said in a public statement,” they said.
Exchange Cooperating, Founders Cleared of Blame
CoinDCX said both co-founders are fully cooperating with law enforcement and maintained they had no involvement in the fraud. The company has published a public warning on its website urging users to verify they are using the official platform before making any transactions.
Brand impersonation scams have become an escalating problem across India’s fast-growing digital finance sector, with fraudsters increasingly targeting well-known crypto platforms to exploit retail investors.
Authorities have not yet commented publicly on the status of the investigation.
The post Why is Bitcoin Price Going Down Today? appeared first on Coinpedia Fintech News
Trump’s Iran ultimatum triggers $232M liquidation cascade; crypto market sheds $45B in 30 minutes
Bitcoin dropped nearly $2,000 in under 30 minutes on Sunday after President Donald Trump threatened to strike Iran’s power infrastructure unless Tehran reopened the Strait of Hormuz within 48 hours, sending shockwaves through global risk assets and triggering one of the largest single-session liquidation events in crypto derivatives markets this year.
The world’s largest cryptocurrency slid to $69,141, down 2.26% on the day, as the threat, a sharp reversal from Trump’s comments just 24 hours earlier that he was considering “winding down” the conflict, caught leveraged traders badly offside.
Crypto Moves in Lockstep With Stocks
The broader crypto market fell 1.95% to a $2.38T market capitalisation, moving in near-perfect correlation with equities. Crypto’s 88% correlation with the S&P 500 and 92% correlation with gold, evidence that digital assets are being traded as macro risk instruments rather than independent stores of value.
Ethereum dropped 1.96% to $2,110, Solana shed 2.06% to $88.25, and Dogecoin fell 2.92% to $0.092. The CoinMarketCap Fear & Greed Index sat at 28, deep in fear territory.
Leverage Was the Accelerant
Bitcoin liquidations surged 86% in 24 hours, with long positions accounting for over 90% of the total, a sign the market had been positioned for a continued recovery before the geopolitical shock arrived. The average crypto RSI fell to 40.1, approaching oversold territory.
What Comes Next
Analysts are watching the $2.34T total market cap level as immediate support. A breach could expose the $2.29T level, the 78.6% Fibonacci retracement from the recent swing high. Recovery, most agree, hinges entirely on the next 48 hours of diplomatic headlines from Washington and Tehran.

An attacker has exploited the Resolv USR stablecoin to mint 80 million tokens and has reportedly been able to cash out at least $25 million.

A Nevada state judge has sided with local authorities to ban Kalshi’s sports, election and entertainment event contracts in the state for 14 days.

The Commodity Futures Trading Commission staff has provided answers to frequently asked questions about the agency’s expectations around a crypto collateral pilot.

Brazil is delaying plans to review crypto taxes until after the October 2026 election, as officials avoid pushing divisive reforms during the campaign period.

The SEC’s digital asset taxonomy introduces new classifications for tokens, signaling a shift in regulatory approach and offering greater clarity for the crypto industry.
Bitcoin ETF outflows are too small to signal a bearish pivot from traders, but worsening US macroeconomic conditions and high oil prices keep BTC traders on the hedge.

ETH could approach $2,750 by June and $3,200 by September if a historical whale-profit signal repeats, though past cycles show mixed outcomes.
A 66-year-old Hong Kong retiree lost $840,000 in three related scams over six months, as fraudsters posed as crypto experts promising profits and fund recovery.

Bitcoin’s mining difficulty just logged its second sizeable cut of 2026, easing conditions for remaining miners as competition from artificial intelligence data centers rises.
The post Tokenization Hearing Confirmed, CLARITY Act Stablecoin Deal Done “In Principle”: Big Week for Crypto appeared first on Coinpedia Fintech News
Two things happened in Washington this week that the crypto industry has been waiting years for and they arrived at the same time.
The House Financial Services Committee has scheduled a hearing titled “Tokenization and the Future of Securities: Modernizing Our Capital Markets” for Wednesday, March 25, 2026 at 10AM EST. Blockchain Association CEO Summer Mersinger is among the confirmed witnesses.
The hearing, first reported by Fox Business journalist Eleanor Terrett on X, will bring together lawmakers and industry voices to formally examine how tokenization fits into the future of US financial markets.
It is one of the most significant Congressional hearings on tokenization to date and it lands in the same week the CLARITY Act’s most stubborn obstacle was removed.
Senators Thom Tillis and Angela Alsobrooks announced they have reached an “agreement in principle” on stablecoin yield, the provision that had blocked the Digital Asset Market Clarity Act from advancing for months. Banks had argued that allowing stablecoin platforms to offer rewards on token holdings would draw deposits away from traditional banking. That argument is now, at least in principle, resolved.
Senator Alsobrooks told Politico: “We’ve come a long way. And I think what it will do is to allow us to protect innovation, but also gives us the opportunity to prevent widespread deposit flight.”
Senator Tillis, while cautious, said he feels “like we’re in a good place,” adding that he still plans to review the details with industry stakeholders before moving forward.
Also Read: The Worst Week for Gold in 43 Years Just Made the Strongest Case for Bitcoin
With the stablecoin yield compromise in place, the Senate Banking Committee markup is now targeted for the second half of April – likely the weeks beginning April 13 or April 20 following the Easter recess.
Senator Bernie Moreno has been direct about the stakes: if the bill does not pass by May, digital asset legislation may not move again for the foreseeable future. Senate floor time is under pressure from unrelated priorities, including the Republican voter-ID bill and ongoing developments around the Iran conflict.
Issues around DeFi treatment, ethics provisions, and a potential attachment of community bank deregulation to the bill still require resolution before a broad bipartisan vote becomes possible.
This development follows the SEC and CFTC’s landmark joint classification of 16 crypto assets as digital commodities earlier this week, the most significant US crypto regulatory action in a decade, reinforcing a pattern of accelerating policy momentum in Washington.
The tokenization hearing on March 25 and the CLARITY Act’s path toward an April markup represent back-to-back milestones. Whether the legislative window holds is the only question left.
The post XRP Price Weakens as ETF Flows Turn Negative appeared first on Coinpedia Fintech News
XRP Price is showing signs of weakness in the short term. The altcoin has slipped below its rising support line and is now trading under $1.450, which suggests buyers may be losing control.
The crypto market is also back inside its previous range. Unless XRP reclaims the $1.452–$1.465 zone, upside could remain limited, and any bounce into that area may face selling pressure. If the price falls below $1.4236, the next level to watch is around $1.387.
XRP reserves on Binance have dropped sharply from about $10 billion in July 2025 to roughly $3.9 billion in March 2026, a decline of around 61%.
This drop could be due to investors moving funds into private wallets, institutional accumulation, transfers to other platforms, or usage in DeFi and on-chain activity.
At the same time, order book data shows stronger buy-side depth than sell-side pressure. This suggests there is solid support at lower levels, and it may take less capital to push prices up than to push them down.
Institutional signals are mixed. A fund from Bitwise Asset Management reported a net loss of $25.937 million, entirely due to unrealized losses on its XRP holdings. The fund holds 131.2 million XRP, reported no investment income, and recorded a loss of $2.31 per share. It was launched on November 19, 2025, with trading starting the next day, and it only sells XRP when needed to cover expenses.
More broadly, XRP ETFs in the U.S. have seen only four days of inflows in March, compared to six days of outflows. Total assets under management currently stand at about $1.02 billion.
— Santiment (@santimentfeed) March 21, 2026
XRP Ledger is continuing to see its network grow. Based on wallet size, here are the amount of addresses under each tier:
Less Than 100 XRP: 5.66M Wallets
100 to 100K XRP: 2.01M Wallets
More Than 100K XRP: 32,054 Wallets pic.twitter.com/QN1AWIhYBJ
According to data from Santiment, the XRP Ledger continues to grow despite recent price pressure. There are now about 5.66 million wallets holding less than 100 XRP, around 2.01 million wallets holding between 100 and 100,000 XRP, and 32,054 wallets holding more than 100,000 XRP.
This steady increase across small, mid-sized, and large holders suggests that user participation remains strong even as overall market sentiment stays cautious.
Short-term momentum looks weak unless key levels are reclaimed, but falling exchange supply and steady network growth show that the interest in XRP has not disappeared.

The post Pi Network Releases Token Launchpad on Testnet appeared first on Coinpedia Fintech News
Pi Network has rolled out the first version of its Token Launchpad on the testnet, giving users and developers a chance to explore token creation in a safe, risk-free environment. The update, announced on Pi Day 2026, went live on March 20th.
The Token Launchpad is a new feature that allows developers to create and test their own tokens within the Pi ecosystem. It is open to both developers and everyday users, known as Pioneers. While developers can build and experiment with tokens, users can explore new apps, support projects, and take part in early-stage activities.
Since the feature is currently on the testnet, it does not involve real money. Users interact with test tokens, making it a safe space to learn and experiment without financial risk. The launchpad can be accessed through the Pi Browser.
The launchpad focuses on practical use rather than just trading. Projects are expected to build a working app before launching a token, ensuring that each token has a clear purpose.
When users exchange Pi for tokens, the Pi is placed into a shared pool instead of going directly to developers. This helps keep prices stable and reduces the chances of misuse. Users can also support projects by staking their Pi and may receive early access to tokens or better rates for their participation.
The system is also connected to Pi’s decentralized exchange (DEX), which allows tokens to be traded after launch. However, only projects with real use are expected to make it that far.
The launchpad is currently in a testing phase, meaning no real money is involved. Pi Network aims to gather user feedback, refine features, and ensure system stability before rolling it out on the mainnet.
Right now, users can access the launchpad through the Pi Browser and experiment with its features using test tokens. The Core Team has indicated that the final version will be launched on the mainnet only after thorough testing and community feedback.
The post “Gambling With a Timer”: James Wynn Returns to Hyperliquid With a 40x Bitcoin Short appeared first on Coinpedia Fintech News
James Wynn is back on Hyperliquid. The trader who turned $4 million into $87 million, then lost nearly all of it, has returned to the platform that made him infamous, this time with $3,911 scraped together from referral rewards and a 40x short on Bitcoin sitting $415 away from liquidation.
Bitcoin is currently trading at $70,697. His liquidation price is $71,112.
For those unfamiliar with Wynn, the backstory matters. By May 2025, he had built one of the largest publicly visible leveraged positions in crypto history – a $1.25 billion long on Bitcoin using 40x leverage on Hyperliquid. The position unraveled as prices dropped, resulting in losses exceeding $100 million. He ended the month with $23 in his account.
Before deactivating his X account, he changed his bio to a single word: “broke.”
He has since returned to Hyperliquid multiple times, depositing fresh capital and repeating the same pattern of high-leverage trades, each ending in liquidation.
Also Read: Ethereum News: Crypto Whale Loses $74M Longing ETH, Left With Just $8.5K on Hyperliquid
On-chain analytics platform LookOnChain flagged the latest move on X. Wynn’s wallet – tracked publicly at 0x5078C2fBeA2b2aD61bc840Bc023E35Fce56BeDb6 on Hypurrscan – shows he claimed a referral reward of $1,654 USDC, deposited $3,911 USDC into Hyperliquid, and opened a 40x short on 2.69 BTC worth approximately $190,000. His liquidation price stands at $71,112.48
Gordon, founder of Crypto Crib, responded bluntly: “James Wynn is back after managing to claim $1,654 in referral rewards. Awful trader, no wonder he is BROKE.”
The reaction from the broader community was similarly unsympathetic.
Trader Joe, known as SelfSuccessSaga on X, wrote: “This is exactly how overleverage wrecks people every cycle. 40x short isn’t trading, that’s straight up gambling with a timer. One squeeze and that whole position gets wiped in seconds flat.”
With Bitcoin at $70,697 at the time of writing and his liquidation price at $71,112, Wynn’s position requires Bitcoin to fall meaningfully to generate any profit. A move of just $415 to the upside wipes out his entire deposit.
The crypto community has watched this pattern play out before. The only question is whether this time ends differently or whether Hyperliquid’s on-chain data logs another liquidation under the wallet address the community has been tracking since May 2025.
Also Read: The Worst Week for Gold in 43 Years Just Made the Strongest Case for Bitcoin
The post XRP Adoption Surges Among Retail Investors appeared first on Coinpedia Fintech News
According to Santiment, the XRP Ledger is seeing steady growth, with millions of wallets joining the network. Most holders, about 5.66 million, own less than 100 XRP, showing strong participation from small investors. Around 2.01 million wallets hold between 100 and 100,000 XRP, while a smaller group of 32,054 wallets holds over 100,000 XRP. This mix highlights a healthy balance between everyday users and large holders, signaling rising interest and broader adoption of XRP across different types of investors worldwide.

The post The Worst Week for Gold in 43 Years Just Made the Strongest Case for Bitcoin appeared first on Coinpedia Fintech News
Gold is trading at $4,491 this week, down 10.52% – its worst weekly performance since 1982 -despite a backdrop that would historically have driven the precious metal sharply higher. A war is ongoing in the Middle East, oil refineries are under attack, three US warships are deployed, and inflation is rising.
In every prior cycle where these conditions converged, gold has served as the primary safe haven. This time, it has not.
According to the analysis page Bull Theory, three simultaneous mechanical forces drove the selloff rather than any change in gold’s underlying fundamentals. The US dollar surged on safe haven flows, making gold more expensive for buyers outside the United States. Commodity funds sold gold positions to cover losses from oil margin calls generated by the volatile energy market. And the CME raised gold margin requirements, forcing leveraged positions into liquidation.
The result was a paper market flush that had little to do with gold’s actual value proposition and everything to do with the infrastructure that surrounds it.
Bull Theory drew a direct historical parallel: the last time gold posted a comparable weekly loss was 1982, when the Federal Reserve was hiking rates to 20% to crush inflation – conditions that were fundamentally bearish for gold.
Within 12 months of that 1982 crash, gold had rallied 50%.
While gold suffered its worst week in over four decades, Bitcoin closed the same period down just 0.14%, currently trading at $70,563.
Coinbureau CEO Nic highlighted the contrast on X, noting that Bitcoin has outperformed gold for three consecutive weeks, that the asset is sitting at a bullish MACD crossover that has preceded multiple significant rallies historically, and that the RSI has recovered from oversold levels, signalling a return of upside momentum.
Also Read: World Gold Council’s “Gold as a Service” Plan: What It Means for Tether Gold (XAUT) & PAXG
Michael Saylor added his view on Friday: “Bitcoin’s a solution to everyone’s problem. Go buy the Bitcoin and wait because hundreds of trillions of dollars of capital from all around the world are going to flow into cyberspace to the Bitcoin network.”
MICHAEL SAYLOR: “Bitcoin’s a solution to everyone’s problem.”
— Simply Bitcoin (@SimplyBitcoin) March 20, 2026
“Go buy the Bitcoin and wait because hundreds of trillions of dollars of capital from all around the world are going to flow into cyberspace to the Bitcoin network.” pic.twitter.com/qJ77ROGkid
Crypto analyst SightBringer expanded on that argument, writing that Bitcoin represents the destination for capital that is trying to escape institutions compromised by “politics, dilution, leverage, seizure risk, or counterparty fragility” – the very forces that drove this week’s gold liquidation.
The week’s events did not disprove gold’s long-term case. What they demonstrated, however, is that gold’s digital infrastructure remains exposed to the same systemic pressures it is supposed to hedge against, while Bitcoin’s position outside that infrastructure continues to look structurally different.


Ethereum whale thomasg.eth has accumulated $19.5 million in ETH this week, as Bitmine’s Tom Lee argues the market may be nearing the end of “crypto winter.”


Bitcoin price remains rocky, and BTC and equities ETF outflows soar as the US and Israel-Iran war enters a fourth week.

Gold is also being impacted by rising anticipation that the US Federal Reserve won’t cut interest rates this year, while Fed chair Jerome Powell said inflation would rise.

Unlike Bitwise, Grayscale doesn’t plan to incorporate staking for its Hyperliquid ETF but hasn’t ruled out integrating it in the future.

The deal reportedly focuses on stablecoin yield and interest-bearing stable tokens, a major pain point for the banking industry.

Bitcoin searches for equilibrium at $70,000 while rising crude oil prices and tanking stock markets have investors worried over the future of inflation in the US.

Ghostblade is one of six malware tools in the "DarkSword" suite of malicious software designed to steal crypto private keys and user data.

Nearly three-quarters of institutional investors plan to increase their digital asset allocations this year, with Bitcoin, Ether, stablecoins and tokenized assets seeing the most interest.

Ledger names John Andrews as chief financial officer and opens a New York office to expand its US operations and institutional business.


The post Ethereum Staking Yields Dropping in 2026? Why Holders Are Switching to Bitcoin Everlight Shards for Real BTC Rewards appeared first on Coinpedia Fintech News
The math behind Ethereum staking has changed considerably since the early post-Merge period. When only 15 million ETH was staked in early 2023, annual yields sat above 6%. With approximately 37 million ETH now committed to validators — nearly 30% of the entire circulating supply — those yields have compressed to around 3.3% on average. Staking rewards have compressed toward 3% as total staked ETH grew faster than issuance and fee income, and the structural dynamic driving that compression isn’t reversing — every market dip pushes more ETH into staking as holders seek yield while waiting for price recovery, which pushes yields lower still.
For participants reassessing what their ETH yield position is delivering in 2026, Bitcoin Everlight is emerging as a structurally different alternative.

Bitcoin Everlight is a decentralized validation network where participants earn Bitcoin rewards by contributing to blockchain infrastructure security. The platform runs on a Transaction Validation Node framework — the technical backbone handling validation, routing, and reward distribution — with Everlight Shards as the participation layer connecting users to the BTC-denominated fee pool the infrastructure generates.
The reward logic is fundamentally different from Ethereum’s staking model. Ethereum’s fixed reward pool divides among more participants as staking participation grows, reducing per-token yields across the board. Bitcoin Everlight’s post-mainnet distribution scales in the opposite direction — the reward pool grows with network transaction volume and fee activity, meaning increased adoption expands what’s available for distribution. Shard holders aren’t competing for a fixed issuance budget that gets diluted as more people join.
During the presale phase, activated shards earn fixed BTCL rewards at rates that sit considerably higher than anything Ethereum staking currently offers. After mainnet, those fixed incentives transition to performance-based BTC distribution drawn from real transaction routing fee activity — paid in Bitcoin, independent of BTCL’s own price trajectory. Before the presale opened, the project completed dual smart contract audits through Spywolf and Solidproof, alongside dual KYC verifications through Spywolf and Vital Block — all publicly linked and completed before a single token was sold.

Entry into Bitcoin Everlight begins with acquiring BTCL tokens — priced at $0.0008, with a minimum purchase of $50. Once a participant’s cumulative USD commitment crosses a tier threshold, the shard activates automatically based on the value at the time of purchase, with BTCL rewards beginning to distribute immediately. Tokens remain locked during the presale period and commitments are final — a design that keeps participants aligned with the network’s long-term economics.
When mainnet launches, the fixed presale APY gives way to performance-based BTC distribution. The reward pool scales with what the infrastructure generates from actual transaction activity, with no fixed post-mainnet ceiling capping the upside as network usage grows.
The Azure Shard activates at a $500 commitment and earns up to 12% APY in BTCL during the presale period, transitioning to BTC rewards at mainnet. The Violet Shard activates at $1,500 with up to 20% APY during presale, and the Radiant Shard activates at $3,000 with up to 28% APY — both carrying the same BTC reward transition when the network goes live.
In 2026, nominal staking APYs across the broader crypto market range from 3% to 19%, but real yields after network inflation drop to 0–10%. Bitcoin Everlight’s presale tiers sit at the upper end of that nominal range during the presale period, with the added distinction that post-mainnet rewards are denominated in BTC from actual network fee activity — not in an inflationary token whose real yield depends on whether the protocol’s own price holds up.
Participants holding tokens below any threshold maintain a dormant shard position that upgrades automatically once the balance reaches the next tier. After mainnet, tiers are sustained through ongoing USD-equivalent BTCL balance, adjusting up or down as holdings change relative to the thresholds. Any governance-driven adjustments to those thresholds would follow a transparent, proposal-based process.

Bitcoin Everlight is currently in Phase 1 of its presale — a phase that runs for 6 days, with 472,500,000 tokens available at $0.0008 per token. For ETH stakers watching their yields compress toward 2–3% while their principal sits well below its 2025 highs, the timing of this presale window relative to where Ethereum staking currently stands makes for a direct comparison worth examining carefully.
The full details on how Everlight Shards work and what the BTC reward distribution looks like after mainnet launch can be found here:

The post Quadruple Witching 2026: Bitcoin’s Most Dangerous Trading Day of the Quarter Has Arrived appeared first on Coinpedia Fintech News
One of the most turbulent days in the financial calendar has arrived. Quadruple witching, a quarterly event where trillions of dollars in derivatives expire simultaneously, is happening today, and crypto markets are already feeling the pressure.
Four times a year, on the third Friday of March, June, September, and December, four major types of derivatives expire on the same day: stock index futures, stock index options, single stock options, and single stock futures. Traders must close, roll over, or settle all positions at once, causing a sharp surge in trading activity and often violent price swings across financial markets.
Today’s expiration is not just big. According to Goldman Sachs, it is the largest ever recorded.
More than $7.1 trillion in notional options exposure is set to expire today, including roughly $5 trillion tied to the S&P 500 index alone and $880 billion linked to single stocks. December options expirations are typically the biggest of the year, but Goldman says this one eclipses all prior records.
To put the scale into context, the options expiring today represent notional exposure equal to approximately 10.2% of the total market capitalisation of the Russell 3000. That is not a quarterly routine. That is a historic event.
Crypto does not operate in isolation from traditional finance anymore. Bitcoin increasingly moves alongside broader risk assets, meaning sharp equity swings have a habit of spilling directly into digital markets.
Historical data from 2025 paints a consistent picture. Bitcoin tended to show muted or flat performance on quadruple witching days themselves, followed by weakness in the days and weeks after. In September last year, a sharp post-witching decline took Bitcoin from $177,000 all the way down to $108,000. In June, it drifted to a local bottom just two days after the event.
At the time of writing, Bitcoin is holding around $69,800, with Ethereum at $2,134, XRP at $1.43, and Solana at $88.93. The broader market Fear and Greed Index sits at just 30, firmly in fear territory.
Even after today passes, the market is not in the clear. A separate $13.5 billion in crypto derivatives are set to expire on Deribit on March 27, just one week away. Positioning data shows traders are leaning toward volatility strategies rather than strong directional bets, signalling the market is bracing for continued turbulence rather than a clean recovery.


A strong buy signal not seen since 2022 just flashed on Ether, but the altcoin needs to hold above a key price level to avoid invalidating the pattern.

The disruption to the oil market and critical energy effects may have long-term economic effects that investors are not pricing in.

The legislative recommendations highlight six policy areas, including copyright, energy and workforce development, while signaling a lighter regulatory stance.

In the latest Cointelegraph interview, professional trader Alessio Rastani warns that Bitcoin could fall below $60,000 before a meaningful bottom forms.

A 70% oil spike could nearly double US inflation, slash rate-cut hopes, and deepen downside risks for Bitcoin prices in the coming months.
The post Is Japan About to Trigger the Biggest XRP Move Ever? Here’s What the Charts Are Saying appeared first on Coinpedia Fintech News
The crypto market is entering a transition phase where macro forces are beginning to take control of price action. However, the market could see a short-term drop before a stronger move higher, pointing to a dip-before-rise scenario rather than a full breakdown.
Basically, the main idea is that this is not just about price. A much larger setup is forming in the background, driven by global liquidity shifts and timing that may soon align.
A major part of the theory comes from a cryptic post by David Schwartz. Members of the XRP community noticed that the visuals in his post closely match patterns seen on Japanese yen notes, especially the circular designs and wave-like elements used as security features.
Japan is 100% the trigger. And this is what it seems like the red alerts are waiting for.
This has led to growing speculation that Japan could act as a major trigger for the market, and may be what current signals are pointing toward.
The idea goes further. Since similar features appear across many global currencies, some believe the message points to a more connected financial system. In this setup, XRP could serve as a bridge asset, helping move value between different currencies rather than replacing them.
The link between Japan, wave patterns, and Ripple also adds weight to the view that Japan could play an important role in the next phase of financial change.
Beyond symbolism, the analysis highlights a real macro risk tied to Japan’s financial system. For years, investors have borrowed low-interest yen and invested it in higher-yielding assets globally.
The Bank of Japan has kept rates steady near 0.75 percent, helping maintain stability. However, even a small rate hike could trigger a chain reaction. Borrowing costs would rise, forcing investors to unwind positions and repay loans.
This could lead to widespread selling across stocks, crypto, and real estate, creating a liquidity crunch. According to the analysis, this unwind is not just a theory. It may already be in its early stages.
Adding weight to the theory, charts of the Japanese yen against the US dollar are showing strong bullish divergences across multiple higher timeframes. This is rare and has not been seen at this scale in recent years.
The analyst said that similar setups in 2024 and 2025 were weaker. Now, multiple timeframes are aligning, suggesting that momentum is building beneath the surface. A sharp yen move in the coming months could accelerate the carry trade unwind and increase global market pressure.
In this scenario, XRP is being positioned as a potential beneficiary. The goal is not that it replaces the US dollar, but that it becomes a liquidity bridge used by banks for cross-border transfers.
Moreover, if institutions begin holding XRP at scale, demand could rise quickly. A major liquidity event could push financial systems toward faster and more efficient solutions, where XRP fits naturally.
Stay ahead with breaking news, expert analysis, and real-time updates on the latest trends in Bitcoin, altcoins, DeFi, NFTs, and more.
Global macro factors like interest rates, liquidity shifts, and geopolitical risks are driving uncertainty, not just crypto-specific events.
It’s borrowing cheap yen to invest in higher-yield assets. If rates rise, investors may exit positions, impacting crypto liquidity and prices.
XRP could benefit as a bridge asset for cross-border payments if institutions seek faster, efficient liquidity solutions during market shifts.
A short-term dip is possible, but improving liquidity conditions and institutional demand could support a stronger recovery phase afterward.
The post Top Analyst Reveals What’s Next For Bitcoin, Ethereum and XRP Prices appeared first on Coinpedia Fintech News
Gareth Soloway, Chief Market Strategist at VerifiedInvesting.com, is doubling down on his bullish crypto calls, and so far, the charts are proving him right.
About a month ago, when Bitcoin had just flushed to $60,000 and retail sentiment was bearish, Soloway turned bullish. Most people thought he was wrong.
“When I see eight out of ten comments calling me a clown, I put more money into the trade,” he explained. For Soloway, extreme retail fear is not a warning, it is an invitation.
Bitcoin is now trading above $74,000, marking eight consecutive days of gains. Soloway says the level to keep an eye on is a daily close above $74,000. If that holds, the next targets are $80,000 to $85,000.
The resistance at this level is not random. Soloway traced it back to a long-term trend line connecting multiple major price pivots, a classic technical setup where old support becomes new resistance. A clean break above it, he says, opens the door to the next significant leg higher.
Ethereum has broken out of what Soloway describes as a textbook inside bar pattern, a structure where price compresses after a strong reversal before launching higher. ETH is now trading above $3,300 and confirming the breakout.
His price targets: $2,600 to $2,800 — which from the recent consolidation low would represent a 45% move.
Soloway is also long Solana, currently up around 15% on the trade, with targets of $115 to $118 after clearing the $100 resistance zone.
For the XRP community, Soloway revealed he picked up XRP over the weekend after spotting the same breakout pattern forming across the chart. He is already up 10% on the position and says the setup looks nearly identical to the other trades that have worked.
Despite the short-term bullishness, Soloway is clear-eyed about the macro backdrop. The larger trend, he says, still points downward.


Bitcoin miner BitFuFu decreased its revenue from self-hosted mining operations by 60% in 2025 in a push to cloud mining.

The crypto industry has seen a number of regulatory changes over the past year, with the Canadian government taking a risk-management, rules-first approach.

Bitcoin’s RSI is nearing a key level, with analysts saying a higher low is needed to support a potential continuation in BTC price.

A Bitcoin wallet inactive since 2012 has moved $56 worth of BTC, spotlighting a stash now valued at roughly $147 million after more than 13 years dormant.

Leading crypto and fintech companies are competing to capture growing revenue from stablecoin payments by launching their own settlement infrastructure.

The proposed spot Bitcoin ETF outlines seed capital, listing plans and trading partners in its latest filing as it moves closer to a potential market debut.

Coinbase has launched stock perpetual futures for non-US traders, expanding its push to offer round-the-clock access to multiple asset classes.

Stablecoins and custody lead adoption priorities, with firms focusing on how to build or source digital asset infrastructure.


South Korea’s tax agency is seeking a private custodian for seized crypto after a wallet seed phrase leak exposed government-held assets.

Technical indicators hint at a possible reversal in BTC’s relative performance, as traders watch whether key support levels can hold.


Galaxy Digital’s Will Owens says most crypto wallets aren’t exposed to quantum risks, with vulnerabilities limited to cases where public keys are revealed.

US authorities say they have charged and arrested Supermicro co-founder Yih-Shyan “Wally” Liaw for allegedly funnelling $2.5 billion in AI servers to China through shell companies.

Crypto exchange Gemini is facing a proposed class-action lawsuit over what a complaint alleges is an “abrupt corporate pivot to a prediction-market-centric business model” after its IPO.

US gaming lawyer Daniel Wallach says a Nevada state court-issued restraining order against Kalshi appears imminent, preventing it from offering sports-related contracts.

The World Gold Council says it will develop a platform to connect physical gold to the systems used to issue and manage tokenized gold products.

Gemini reported its fourth quarter revenues were $60.3 million, which co-founders Cameron and Tyler Winklevoss say is its highest quarterly revenue in three years.

Scammers impersonating the FBI via a token are telling Tron users they are under investigation and must complete a check to avoid having their assets frozen.

Weakening onchain activity and bearish derivatives data suggest that a SOL price recovery will take longer than most investors anticipate.

Coinbase Asset Management’s Anthony Bassili says the Bitcoin Yield Fund’s tokenized share class checks “identity and eligibility at the token level” for compliance.

Crypto’s hidden trading costs demand the adoption of transaction cost analysis. Slippage, fees and fragmentation erode trust as crypto matures into institutional markets.


Bitcoin slipped below $70K as futures selling rose and spot demand cooled, but a recurring setup on lower time frames points to a potential rebound.

The SEC chair signaled that the agency would defer to a market structure bill if passed by Congress, but needed a “bridge” to clarify crypto regulation.

Provisions in the state legislation violate the core ethos and value proposition of Bitcoin as an asset that can be held in self-custody, the trade group said.
The company is leveraging its crypto treasury to fund a share buyback, reducing outstanding shares and potentially boosting per-share value following a six-month slide.

EtherFi will integrate Plume’s Nest vaults, beginning with exposure to a Superstate-backed fund and expanding to a dedicated RWA vault within its platform.

The crypto exchange is offering a yield product tied to Tether Gold (XAUT), signaling a shift toward turning traditionally passive assets like gold into income-generating instruments.

The Web3 company will provide capital, advisory support and business development to help Avalanche projects scale, with a focus on real-world assets and digital identity.


Bitcoin markets have started to turn bullish again, but data shows that a key “bull market threshold” has not been established yet.

The carpool and ride-sharing platform, which already accepts Bitcoin for customer payment, moves to crypto treasury despite challenges of price declines.

Bitcoin brought its latest correction from local highs to near 10% as skepticism over long-term BTC price support grew louder.

The platform is designed to enable lending, borrowing and yield on native Bitcoin through onchain financial services.

The memorandum of understanding with CFTC Chair Michael Selig comes as many US state authorities are cracking down on sports event contracts on prediction markets.

The Norwegian browser company plans to swap quarterly US dollar payments for tokens pending community approval, deepening ties to Celo as MiniPay adoption grows.

Korean traders are pulling XRP off exchanges at a rapid pace, while whale flows signal accumulation seen ahead of past rallies.

Bitcoin bull market optimism has suffered since the October crash, as chances of an extended BTC price drop below $55,000 increase.


Researchers raised alarms over a Coinbase-linked Commerce page that prompted wallet recovery phrase entry, which Coinbase said was part of a legacy product now being retired.

OP_NET has launched a “SlowFi” DeFi stack that runs smart contracts directly in standard Bitcoin transactions with BTC as the only gas asset, avoiding bridges and wrapped BTC.

Beyond immediate losses, attacks often lead to prolonged downtime, liquidity shocks and confidence erosion, as interconnected DeFi systems amplify the impact across markets.


The fourth round of reimbursements to creditors and former clients of the failed crypto exchange since February 2025 brings the total paid to about $10 billion.


Need to know what happened in crypto today? Here is the latest news on daily trends and events impacting Bitcoin price, blockchain, DeFi, NFTs, Web3 and crypto regulation.


