Iran expected to submit revised peace proposal, compressing war premium in oil markets and lifting BTC and ETH—but crypto remains hostage to headline volatility. According to CNN, sources say Iran is expected to submit a revised peace proposal soon, following…
Perle jumps 63.9% as BlockchainFX nears $15 million softcap with strong presale momentum building. AI data tokens are having a moment, and Perle (PRL) just pumped 63.9% in 24 hours to prove it. But while traders chase green candles on…
CertiK’s 2026 report argues that the age of arguing whether a token is or isn’t a security is no longer the core battlefield; the real threat now is AML. CertiK’s 2026 report argues that the age of arguing whether a…
Visa partners with WeFi to enable direct stablecoin spending from self-custody wallets on Visa’s network, bypassing exchanges and pressuring banks’ FX roles. Visa’s new partnership with WeFi is designed to make stablecoin balances in self‑custody wallets spendable anywhere Visa is…
Startale Group is integrating Sunnyside Labs’ Privacy Boost directly into its Sony-backed Soneium super app, giving users fast, self-custodial shielding and zk-powered private payments without sacrificing auditability or everyday UX. Startale Group has named Privacy Boost as the official privacy…
Pi Network price rallied over 15% in the past week, outperforming a largely flat crypto market as a wave of network upgrades and event-driven catalysts boosted demand for the token. According to data from crypto.news, Pi Network (PI) climbed from…
Polymarket’s CLOB v2 upgrade ships new exchange contracts, pUSD collateral, and $1M in liquidity rewards to deepen books and court professional market makers. Polymarket’s CLOB v2 upgrade went live on April 28 at around 11:00 UTC, after a brief maintenance…
Tether’s open-source MDK unifies Bitcoin mining control in a JS and React stack, aiming for AI-ready, vendor-agnostic automation from home rigs to gigawatt farms. MDK turns mining stack into programmable software layer Tether has released its Mining Development Kit as…
The CFTC is turning to artificial intelligence and a new Innovation Task Force to police explosive crypto and prediction markets as its workforce shrinks and jurisdictional battles over event contracts intensify. Galaxy Digital (Nasdaq: GLXY) swung to a Q1 2026…
CFTC turns to AI tools and a new Innovation Task Force to police booming crypto and prediction markets as staff shrinks and CLARITY Act hangs over federal turf wars. The U.S. Commodity Futures Trading Commission is turning to artificial intelligence…
XRP gains institutional attention as ETF inflows and market demand reshape crypto investment strategies. Amidst Wall Street’s continued increase in crypto asset allocation, Bitcoin ETF inflows have surpassed $21 billion, signifying an unprecedented influx of mainstream capital into this market. …
Tether is upgrading its Bitcoin mining infrastructure with a modular, high-density design aimed at improving efficiency, scalability, and cost control across large-scale operations. In partnership with Canaan and ACME Swisstech, it replaces traditional fixed mining rigs with independent hash board modules integrated into custom control, thermal, and software systems. The architecture separates compute, power, and cooling, enabling easier upgrades and better optimization. With immersion cooling and real-time system control, it enhances performance, reduces energy waste, and improves industrial mining flexibility.
Grayscale and Bitmine staked nearly $500 million in Ethereum on April 25, locking 214,440 ETH into contracts and pushing total staked supply past 39 million tokens per CryptoBriefing. When two of the largest corporate stakers commit half a billion in one session, the top crypto coins of 2026 conversation shifts toward tokens with real backing.
Wallets loading Pepeto now sit in the position that produced the biggest gains every prior cycle, and early buyers of every major token share one regret: they should have loaded heavier. ETH holds $2,288, XRP trades at $1.39, and Pepeto pulled $9.56 million with a working exchange and a Binance listing on the way where analyst models point to 100x.
Grayscale deposited 102,400 ETH worth $237 million through Coinbase Prime while Bitmine staked 112,040 ETH valued at $259.6 million per Blockonomi. These moves landed alongside the Glamsterdam upgrade, which targets 10,000 TPS and a 78% fee reduction by mid-2026.
XRP spot ETFs have not posted a single outflow day since April 9, pulling $71.31 million this month and setting April as the strongest inflow month of 2026 per Yahoo Finance. GraniteShares added 3x leveraged XRP products to Nasdaq.
The winners will separate on which projects ship working products and carry teams strong enough to execute through volatility, not tokens living off old momentum.
How This Cycle’s Top Crypto Coins of 2026 Line Up, and Why the Presale Sits Ahead
Pepeto: Why Early Wallets Among the Top Crypto Coins of 2026 Will Wish They Loaded More
Institutional staking headlines remind the market that infrastructure decides which tokens survive, and Pepeto pulled $9.56 million during fear because the product was finished and the listing timeline was set. Pepeto, considered the top crypto coin of 2025, channeled that capital into positions aimed at 100x from one Binance event, running on a trading layer where every swap settles with zero fees attached.
The cross-chain bridge delivers full amounts between networks at zero gas cost and zero slippage. The 177% APY staking layer compounds daily while locking tokens from the circulating supply, so when listing day arrives the float is far smaller than total issuance, and Binance demand hits that reduced float head on.
This is why Pepeto earns a place at the front of the cycle. Every major launch created wallets that wished they went bigger, and that same pattern is building now under the builder who grew Pepe to $11 billion, this time with a live exchange and a full SolidProof review behind it.
Today’s $0.0000001867 is a presale number the exchange listing replaces with a price set by live volume. Early Pepe holders turned small positions into life-changing returns, and every one carries the same thought: the regret was never the entry but not loading more at the floor.
Ethereum (ETH) Price at $2,288 as $500M Institutional Stake Locks Supply
Ethereum (ETH) trades at $2,288 after Grayscale and Bitmine staked $500 million in a single session per CoinMarketCap. The Glamsterdam upgrade targets 10,000 TPS and a 78% gas fee reduction by mid-2026, giving ETH its clearest scaling path since the Merge.
Analysts target $2,800 as a mid-year level, roughly 20% from the current price. Ethereum remains central to decentralized infrastructure, but 20% spread across months cannot compete with the distance a single listing day opens from presale pricing.
XRP Price at $1.39 as Spot ETFs Post the Strongest Inflow Month of 2026
XRP holds $1.39 with spot ETFs logging $71.31 million in April and zero outflow days since April 9 per Yahoo Finance. Ripple’s quantum-resistant XRPL roadmap targets post-quantum security by 2028.
Analysts target $2.40 by late 2026, roughly 68% from here. XRP earns its ranking on institutional utility, but the path from $1.39 to $2.40 stretches across months while Pepeto’s presale-to-listing gap closes in a single session.
Conclusion
A $500 million institutional staking day and record ETF flows tested every token in April, and among the top crypto coins of 2026, Pepeto is the only one that pairs a finished exchange with a presale floor ETH, and XRP simply cannot offer.
Every cycle produces wallets that wish they went bigger, and Pepe’s $11 billion builder is constructing that same chance at Pepeto official website.
The only variable left is whether the position gets filled before the listing goes live or whether 2026 becomes the year a wallet watched the move happen from the outside.
What is the XRP price target for 2026 as spot ETFs post record April inflows of $71 million?
XRP targets $2.40 by late 2026 as spot ETFs pull $71.31 million in April with zero outflow days since April 9. Pepeto at $0.0000001867 carries 100x from a single Binance listing, compressing months of XRP upside into one event.
What is Pepeto, and why does it rank among the top crypto coins of 2026?
Pepeto is a meme coin exchange built by the original Pepe creator with zero-fee swaps, a cross-chain bridge, and a SolidProof-verified contract scanner running live today. The presale raised $9.56 million with 177% APY staking compounding daily and analysts are targeting 100x ahead of the approaching Binance listing.
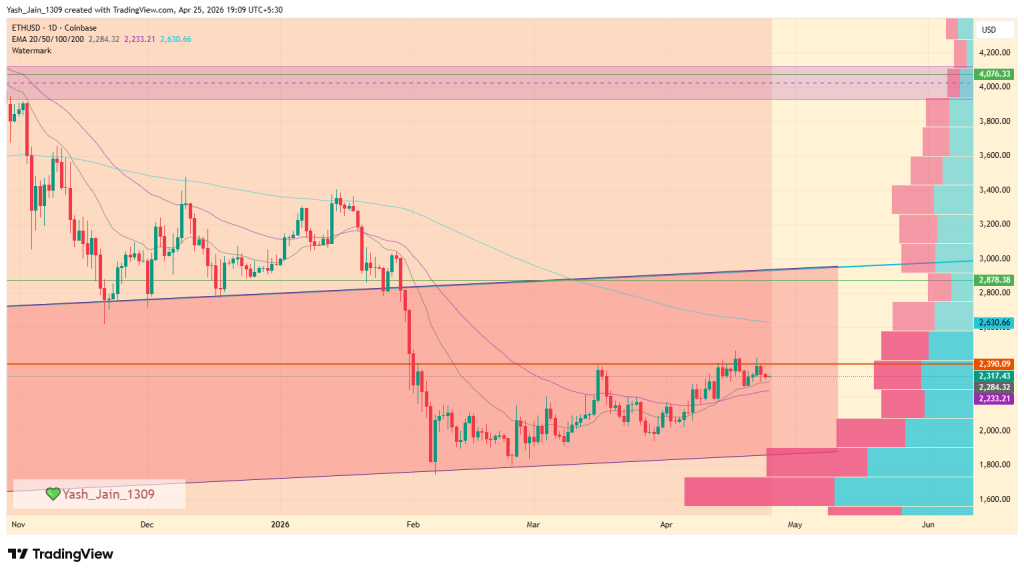
Ethereum is back near a price level many investors remember well. On April 28, 2026, the Ethereum Price USD trades around $2,290, almost the same level seen in April 2021, near $2,328. After five years of rallies, crashes, upgrades, and market hype, ETH has nearly returned to where it started.
That has created frustration among long-term holders, asking, “Should I sell my ethereum” or is this just a pause before the next move?
Ethereum Price Returns to Old Levels
Crypto trader Ash highlighted the weekly ETH/USD chart on Coinbase, which surprised many traders. From 2021 to 2026, Ethereum saw huge moves. It climbed near $4,950 in 2025, then fell to around $880 in 2022 before recovering again.
Now, in April 2026, ETH has returned close to where it started. A white horizontal line on the chart marks the $2,300 level from five years ago, and the current price is sitting almost at the same point.
Ash summed it up on X by saying, “Successfully wasted 5 years holding ETH.”
The frustration is easy to understand. Ethereum’s price is back near the same level after five years, while inflation has reduced the real value of that $2,300 by around 20% to 25% during the same time.
Meanwhile, Bitcoin is up around 13.2% over the five years, while ETH is down about 41.9%.
Ethereum Network Growth Sees Strong Fundamentals
While the price has gone nowhere, the actual Ethereum network has improved dramatically over the same five years. The Merge transitioned Ethereum from energy-intensive proof-of-work to proof-of-stake. The Dencun upgrade slashed transaction costs.
Even Ethereum gas fees have dropped 90% to just $0.01, making the network cheaper and more efficient.
Recent data shows that Ethereum now processes around 1.3 million daily transactions, with about 32% of supply staked and nearly $55 billion locked in DeFi.
But this creates a gap between the Ethereum price in USD and real usage, often seen as a sign of undervaluation.
Whales Are Still Buying ETH
Even whale activity has picked up sharply. On-chain data from Arkham Intelligence shows wallet 0xE5eB withdrew 4,383 ETH worth $10 million from Kraken after three months of complete inactivity.
Almost simultaneously, a newly created wallet 0xA605 pulled 2,000 ETH worth $4.58 million from Binance within a single hour.
Also recently, Tom Lee’s Bitmine just staked 101,901 ETH worth approximately $214 million. Bitmine now holds a total of $8.45 billion in staked ETH, representing 9.5% of all staked ETH on the entire Ethereum network and approximately 4.21% of Ethereum’s total circulating supply.
How Low Can ETH Price Go In 2026?
Looking at past trends, traders are now asking how low the ETH price could go in 2026.
Crypto analyst Borovik noted that ETH found a bottom near $1,750 in 2026. If market weakness returns, some traders believe it could fall back to the $1,368 level, which was an important support in the past.
But history also shows strong recoveries. After a similar low in 2025, ETH surged 3.5x within months. If that happens again, the next Ethereum price prediction could take ETH above $6,000.
Ethereum Price Prediction: Buy or Sell?
As of now, Ethereum’s short-term direction depends on market sentiment, Bitcoin’s strength, and ETF flows. Recently, U.S. Ethereum spot ETFs recorded a net outflow of $50.48 million, showing some caution from investors.
Still, Ethereum remains a leader in DeFi, staking, and smart contracts.
For investors asking whether it is better to buy Bitcoin or Ethereum, Bitcoin is often seen as the safer choice, while Ethereum may offer higher growth potential but with more risk.
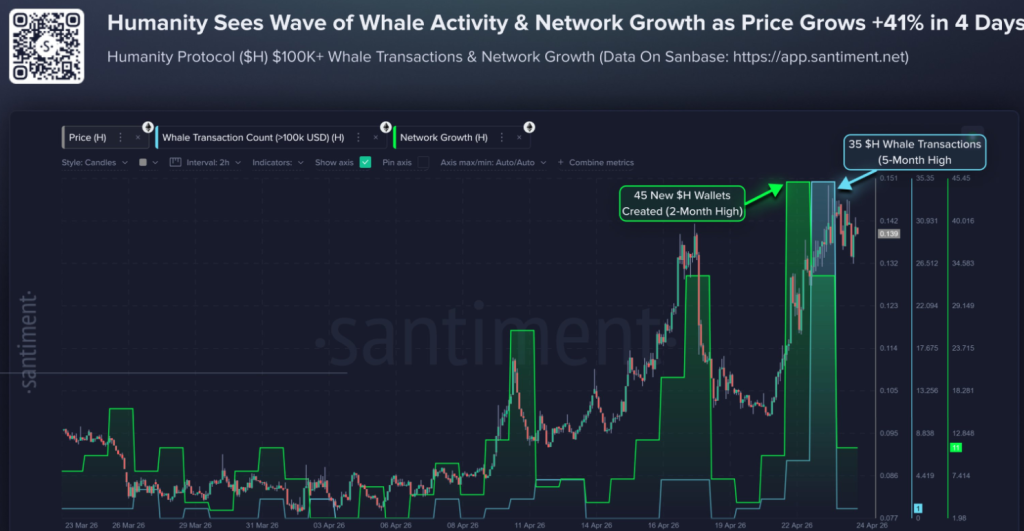
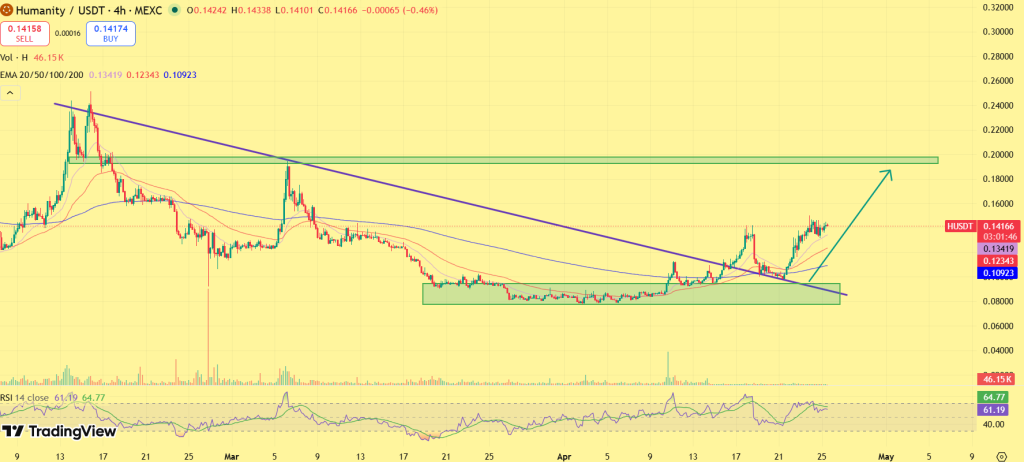
The Humanity Protocol price this week showed remarkable rise and broke the weeks of bearish trend that was dragging through consolidation, H token price suddenly woke up, printing nearly 20% intraday gains and stacking over 65% since 21st April. That’s not random noise. That’s capital coming with intent. And yes, there’s a narrative doing the heavy lifting here.
Demand Zone Bounce Flips Market Structure Fast
It all started at the $0.100 level. Clean, respected, and more importantly defended area. The Humanity Protocol price bounced sharply from that horizontal demand zone and followed it up with a higher low around April 21.
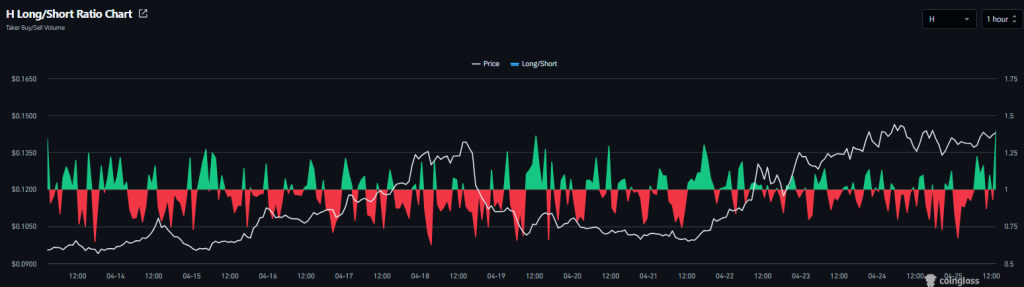
But here’s where it gets interesting. This wasn’t just spot-driven enthusiasm. Open Interest jumped 18.23% to $98.43M, which means derivatives traders showed up too. Fresh money, not recycled hype.
Volume didn’t stay quiet either which is also up 60.95% to $80.41M. So yeah, this isn’t a sleepy move.
AI Execution Narrative Gives Bulls New Ammunition
Now, let’s talk about the elephant in the room thats “AI”. The latest push isn’t coming from vague “AI integration” buzzwords. It’s sharper than that. The idea? AI isn’t just influencing anymore but it’s executing. Autonomous actions, no clear human behind them. That’s a problem. A big one.
And that’s exactly where Humanity Protocol (H) is trying to wedge itself in as a verifiable identity layer. Anti-fraud infrastructure for an internet that’s starting to lose track of who’s actually responsible.
When AI executes the attack, there's no attacker to trace.@Terencekwok on why verifiable identity has to come before autonomous crime scales beyond attribution pic.twitter.com/nY9D7YBFBV
It’s a compelling pitch and Traders seem to agree on it and this weeks momentum clearly represents that..
Humanity Protocol Price Resistance at $0.200 Now Becomes Battleground
But let’s not get carried away just yet. The Humanity Protocol price is now pushing into a heavy resistance zone between $0.180 and $0.200. This isn’t some minor hurdle but it’s a multi-month ceiling. Breaking it cleanly would flip the entire structure bullish and potentially open a run toward $0.300. That’s the optimistic case.
But, The cautious one? The market is leaning long. Hard. The Long/Short ratio sits at 1.3312, which means a lot of traders are already positioned for upside. That’s confidence but at the same time it’s also risk. If this level rejects, things could unwind quickly.
Long squeeze risk quietly building underneath rally
If the Humanity Protocol price fails to hold above $0.180, a retracement toward $0.117–$0.124 becomes likely. That’s where the market would need to reset, absorb selling, and decide if it actually believes this rally.
Because right now, it’s still proving itself. Momentum is strong. Narrative is stronger. But sustainability? That depends on one thing whether buyers can turn $0.200 from resistance into support. Until then, this rally is impressive… but not untouchable.
The Ethereum price prediction for 2026 just hit a turning point that most traders have not processed yet. The Motley Fool reported on April 23 that Anthropic’s new Mythos AI model can find and chain together software weaknesses across DeFi protocols faster than any human audit team, and $606 million was already drained from decentralized platforms in the first 18 days of April alone across 12 separate exploits.
CoinDesk followed on April 25 with a deeper analysis showing that Mythos is forcing the entire crypto industry to rethink security from the ground up. ETH holds at $2,285 with $45.8 billion locked in DeFi, and every dollar of that sits inside contracts that new AI tools can scan for flaws at near-zero cost. Pepeto already built the contract scanner that solves this exact problem, and the presale keeps filling while the market debates what security should look like.
Ethereum Price Prediction Under Pressure as Mythos AI Reveals DeFi Security Gaps
Anthropic announced Mythos on April 7 under Project Glasswing, limiting access to roughly 40 organizations including Apple, Google, and Amazon Web Services for defensive cybersecurity work. The model found zero-day flaws in TLS, AES-GCM, and SSH libraries that protect the infrastructure running DeFi protocols per CoinDesk.
The $606 million drained in April did not even require AI. Hackers used social engineering, bridge flaws, and contract interactions that existing audits missed. The Ethereum price prediction now carries a risk factor that did not exist three weeks ago, because AI tools are about to compress the time between finding a flaw and building a working attack from months to minutes. Projects without real-time contract scanning are the most exposed.
Ethereum Price Prediction Compared: Ethereum (ETH) Security Risk and the Presale That Already Fixed It
Pepeto: The Contract Scanner That Does What Ethereum’s DeFi Cannot
Ethereum’s $45.8 billion in DeFi TVL sits inside contracts that Mythos-grade AI can now probe at machine speed, and Pepeto already built the defense that every protocol needs.
The contract screening tool checks every token’s code before a trade goes through, flagging hidden risks and warning wallets before capital touches anything dangerous. This is not a future feature on a roadmap. It runs today on the live platform.
The fee-free trading engine covers Ethereum, BNB Chain, and Solana, and the bridge moves tokens between all three networks without charging anything. Over $9.56 million entered the presale at $0.0000001867 during weeks of fear, and every contract passed SolidProof testing before the first dollar arrived. Staking at 177% APY grows holdings while the Binance listing draws closer.
The architect of the original Pepe token leads the project alongside a former Binance executive who designed the exchange layer. Analysts project over 100x once the listing opens because the token powers every swap, scan, and bridge on the platform. The listing will set a permanent floor, and the presale price becomes a number that only the earliest wallets will ever hold.
Ethereum (ETH) Price at $2,285 as AI Threats Reshape the Outlook
Ethereum (ETH) trades at $2,285 per CoinMarketCap, sitting 53% below its all-time high of $4,953 from August 24 2025. The Ethereum price prediction from Standard Chartered still targets $7,500 by year end, and Arthur Hayes projects $10,000 to $20,000 before this cycle closes.
Support holds at $2,200 with resistance near $2,400, and a break above $2,400 opens the path toward $2,600. The $104 million in net derivatives buying from earlier this month showed real demand, but the Mythos revelation adds a new risk layer that the market has not fully priced in. Even the bullish $7,500 target only delivers 3.2x from current levels, a return that takes quarters to reach. The presale carrying its own listing closes that distance from one event.
Conclusion:
The Ethereum price prediction still shows upside to $7,500 and beyond, but Anthropic’s Mythos AI just exposed a security gap that puts $45.8 billion in DeFi TVL at higher risk than any point in Ethereum’s history. Projects that built real-time contract scanning before this threat arrived are the ones that will attract the capital rotating out of unprotected protocols.
Pepeto built that scanner before the presale opened, and $9.56 million in capital arrived while the market sat in fear. The Binance listing gets closer, 177% APY staking builds holdings every day, and the gap between $0.0000001867 and the first listing price is where the return sits. ETH needs quarters to reach $7,500.
Pepeto gets there from one listing event. Visit the Pepeto official website now and take the position that solves what Ethereum’s DeFi still cannot, before the listing closes this entry for good.
How does the Ethereum price prediction change after Anthropic’s Mythos AI threat?
The Ethereum price prediction targets $7,500 to $20,000 by cycle end per Standard Chartered and Arthur Hayes, but Mythos AI exposing DeFi flaws adds risk to $45.8 billion in locked value. ETH trades at $2,285, sitting 53% below its $4,953 all-time high.
What makes Pepeto the best crypto presale to buy for DeFi security?
Pepeto is a SolidProof-audited platform with a live contract scanner that checks every token before a trade goes through, protecting wallets from the exploits that drained $606 million in April. Over $9.56 million raised at $0.0000001867 with 177% APY staking and an approaching Binance listing.
LayerZero price is on the edge as bears tighten control, pushing ZRO toward a critical support breakdown. The latest 6% drop comes amid weakening recovery attempts and rising sell-side signals, with price now hovering near the $1.35 zone. As on-chain activity hints at potential distribution and market structure continues to deteriorate, this level is shaping up as the last line of defense before a possible acceleration in downside momentum.
Whale Activity Adds Pressure Near Key Support
Recent on-chain data has intensified bearish concerns. A wallet linked to the LayerZero ecosystem deposited 1 million ZRO (worth ~$1.43 million) into Binance, a move typically associated with potential selling intent.
A wallet linked to the LayerZero team deposited 1M $ZRO worth $1.43M into #Binance.
The wallet still holds 29M $ZRO worth $41.34M and is likely to deposit further.
More importantly, the same entity still holds around 29 million ZRO (~$41M). The presence of such large remaining holdings introduces the risk of continued inflows, especially if the market weakens further. Such inflows occurring near a key support level often act as a catalyst for breakdown, as they dampen buyer confidence and reinforce a supply-heavy environment.
LayerZero remains in a clear downtrend, with rejection near the $1.60–$1.65 supply zone triggering the latest leg lower. The recent session adds to this weakness, with a strong bearish candle and a 6% decline, pushing ZRO directly into the $1.35 support area.
However, structure continues to deteriorate and lower highs remain intact, with recovery attempts capped near $1.48–$1.50, confirming sellers are stepping in earlier on each bounce. ZRO price is also trading below key short-term averages, with a bearish crossover between the 20-day and 50-day MA, reinforcing downside momentum.
The latest move stands out. Instead of consolidation, the coin printed a decisive bearish candle with strong follow-through, indicating active selling rather than passive drift. This kind of price action typically signals continuation, especially when it occurs near a key support level.
With this being another direct test of $1.35, the level is now under pressure. Repeated tests combined with strong downside candles increase the probability of a breakdown, as demand gets absorbed more aggressively. If $1.35 fails to hold, the structure opens toward the next downside zone near $1.10–$1.00. On the upside, any relief bounce would first need to reclaim $1.48–$1.50, followed by a stronger move above $1.60–$1.65 to shift momentum. Until then, the trend remains firmly bearish.
Liquidation Data Shows Long Imbalance
Liquidation data confirms a fragile market setup. Recent data shows ~$480.29K in long liquidations compared to just ~$6.13K in shorts, highlighting a heavily one-sided market. A significant portion of this came from Hyperliquid (~$463K in long liquidations), with additional contributions from Binance and other exchanges.
Meanwhile, short liquidations remain minimal, indicating bears are not under pressure. This imbalance is critical, if price breaks below $1.35, the market could see a long squeeze, where forced liquidations accelerate downside volatility and push prices lower at a faster pace.
Final Take
LayerZero is at a make-or-break level. With persistent downtrend pressure, rising exchange inflows, and a long-heavy market structure, the risk remains tilted to the downside. A clean break below $1.35 could open the door for a sharper correction in the sessions ahead.
Block Inc. has disclosed 28,355 Bitcoin worth about $2.2 billion in its Q1 2026 proof-of-reserves report. The holdings are split between $1.5 billion for Cash App users and $689 million in the company’s treasury. Verified through audits and cryptographic proofs, Block ranks as the 14th largest public Bitcoin holder globally. Led by Jack Dorsey’s long-term Bitcoin vision since 2020, the company continues expanding its exposure as public firms collectively hold over 1.1 million BTC worldwide.
BlackRock is expanding deeper into crypto markets by bringing its $2.5 billion tokenized money market fund, BUIDL, to crypto exchange OKX. Under the partnership, Standard Chartered will securely custody the underlying assets, while traders on OKX can use BUIDL as collateral for trading.
In a recent post, OKX confirmed that users can now use BlackRock’s BUIDL fund on the exchange while continuing to earn interest on their holdings instead of leaving funds idle. The integration gives traders access to institutional-grade collateral backed by one of the world’s largest asset managers.
Your collateral shouldn’t sit idle.
BlackRock’s BUIDL is now live as yield-bearing collateral on OKX — safeguarded in Tier 1 custody with Standard Chartered.
Together, the world’s largest asset manager, a G-SIB, and global digital market infrastructure set a new blueprint for… pic.twitter.com/DK45pFALVs
According to OKX, users now have two ways to use BUIDL on the exchange:
Keep assets with Standard Chartered while using the same value as collateral on OKX.
Hold BUIDL directly on OKX and use it for trading collateral while continuing to earn interest.
In simple terms, traders can now use a BlackRock-backed digital money market fund like cash on a crypto exchange without leaving funds idle.
“This product was designed to minimize risk rather than add layers of risk. It becomes more efficient and productive collateral.” — Rifad Mahasneh, Senior Executive at OKX
The partnership highlights growing ties between Wall Street firms and crypto exchanges as more traditional financial products move onto blockchain networks. It also signals increasing adoption of tokenized real-world assets in digital asset markets.
The live price of the Polkadot crypto token is $ 1.22328900.
Price predictions for 2026 range from $2.50 to $5.00.
Structural adoption and interoperability narratives could push DOT toward $60 by 2030.
Polkadot (DOT) remains one of the few Layer-0 blockchain networks focused on interoperability. Its architecture allows multiple blockchains to operate together while sharing security.
Recent changes to tokenomics and infrastructure, including Agile Coretime and a supply cap update in March 2026, have altered the network’s economic model. These developments shape expectations for DOT’s price outlook through 2030.
What Is Polkadot?
Polkadot is designed as a multi-chain network. It uses a central Relay Chain to connect independent blockchains called parachains.
This structure allows:
Cross-chain communication
Shared security across networks
Parallel transaction processing
The introduction of Agile Coretime enables more flexible allocation of network resources. This replaces earlier slot-based systems with an on-demand model.
Polkadot Price Today
Cryptocurrency
Polkadot
Token
DOT
Price
$1.2233 -0.92%
Market Cap
$ 2,056,770,089.14
24h Volume
$ 127,038,573.6086
Circulating Supply
1,681,344,379.2843
Total Supply
1,681,344,379.2843
All-Time High
$ 55.0050 on 04 November 2021
All-Time Low
$ 1.1303 on 06 February 2026
Polkadot Price Prediction May 2026
In late 2025, the price of Polkadot (DOT) faced significant selling pressure, causing it to decline into a long-term demand zone between $1.20 and $3.65.
Unfortunately, this downward trend resulted in a breach of the crucial $2.50 middle-band support in the first quarter. The bearish momentum continued into early 2026, pushing the price toward the $1.20 range floor in February, where it ultimately established a stable base. This led to a consolidation phase in March, resulting in a muted first quarter.
However, this muted behavior didn’t end in the first quarter; April in the second quarter displayed similar patterns, and May is just around the corner. If this lack of price movement persists, there is a risk of dropping below the $1.20 mark, which would break the rectangle box formed by the long-term trading range.
Conversely, if demand returns in May, the price could potentially rise toward the 200-day EMA band at $2.00 and possibly aim for the $2.50 level.
Recent news/opinion
On March 9th, DOT announced that the first Polkadot U.S. ETF, trading as TDOT via 21Shares, has officially launched on the Nasdaq exchange. This milestone provides a regulated investment vehicle for the asset, though investors are encouraged to conduct thorough independent research, as this announcement does not constitute financial advice.
Polkadot (DOT) Price Prediction 2026
The long-term trajectory of Polkadot price (DOT) reveals a classic “boom and bust” market cycle of massive proportions. Between late 2020 and late 2021, the asset underwent an extraordinary bullish expansion, surging from a low of $1.50 to an all-time high of approximately $56.
This move represented a rally of over 3,500%, establishing a dominant bullish structure on the weekly timeframe. However, the peak in late 2021 marked the beginning of a structural shift, as the market transitioned into a prolonged corrective phase.
The chart shows that the bearish reversal intensified throughout 2022, characterized by the loss of critical psychological and technical support levels at $32 and $24. While a mid-2022 drop to $6.30 was initially perceived by many as a potential market bottom, it wasn’t, and the decline proved more persistent. The downward momentum eventually dragged the price to a low of $3.57 by late 2023.
Despite two notable recovery attempts in early and late 2024, the bulls were unable to reclaim the $12 supply zone, which acted as a heavy ceiling and confirmed the continuation of the macro-downtrend into 2025.
Now in 2026, all these past occurrences make sense, as by the first quarter of 2026, the correction reached a significant milestone as DOT touched a new multi-year low of $1.20. Paradoxically, this price action has brought the asset back close to the “Demand Zone” that ignited the original 2020 bull run.
Currently, DO/USD appears to be entering a phase of deep accumulation, confined within a weekly range of $1.20 to $3.57. This historical symmetry suggests that if the price can successfully consolidate and eventually break above the $3.57 resistance, it may pave the way for a new cyclical uptrend. However, given the depth of the current range, this recovery process is likely to be time-intensive, requiring significant patience before a definitive trend reversal emerges.
Polkadot Onchain Analysis
Recent on-chain data from Token Terminal reveals a significant shift in Polkadot’s financial trajectory. After years of deeply negative earnings, the network has successfully curtailed its aggressive spending to stabilize its balance sheet.
While the earnings graph is showing a clear recovery from previous lows, net figures remain slightly below the $0 threshold as the ecosystem balances its disinflationary tokenomics with ongoing operational costs.
Despite this fiscal recovery, the network faces a challenge in user retention, as active addresses have continued a general downward trend. This decline in unique users suggests that Polkadot is currently struggling to regain retail momentum, leaving it susceptible to market volatility despite its improved fundamentals.
However, there is a glimmer of optimism in the latest usage metrics: transaction counts have begun to see a notable uptick in Q1 2026, indicating that while the user base may be smaller, the remaining participants are engaging more deeply with the ecosystem’s growing list of parachains.
Polkadot Crypto Price Prediction 2026 – 2030
Year
Potential Low ($)
Potential Average ($
Potential High ($)
2027
4.00
7.20
10.00
2028
6.50
8.00
15.00
2029
10.00
14.00
25.00
2030
25.00
50.00
60.00
Polkadot Crypto Price Prediction 2027
Polkadot (DOT) price range can be between $4.00 to $10.00 during the year 2027.
Polkadot Prediction 2028
In 2028, Polkadot is forecasted to potentially reach a low price of $6.50 and a high price of $15.00.
Polkadot Coin Price Prediction 2029
Thereafter, the DOT price for the year 2029 could range between $10.00 and $25.00.
Polkadot (DOT) Price Prediction 2030
Finally, in 2030, the price of Polkadot is predicted to maintain a steady and positive. It may trade between $25.00 and $60.00.
Based on the historic market sentiments and trend analysis of the largest cryptocurrency by market capitalization, here are the possible DOT price targets for the longer time frames.
Year
Potential Low ($)
Potential Average ($)
Potential High ($)
2031
50.00
60.00
80.00
2032
70.00
90.00
110.00
2033
100.00
130.00
150.00
2040
180.00
200.00
270.00
2050
250.00
320.00
400.00
DOT Price Prediction: Market Analysis
Year
2026
2027
2030
Changelly
$2.50
$3.00
$7.00
CoinCodex
$3.00
$3.50
$6.00
Digital Coin Price
$5.00
$7.00
$10.00
Never Miss a Beat in the Crypto World!
Stay ahead with breaking news, expert analysis, and real-time updates on the latest trends in Bitcoin, altcoins, DeFi, NFTs, and more.
FAQs
What is Polkadot (DOT) and why is it called a Layer-0 blockchain?
Polkadot is a Layer-0 network that connects multiple blockchains, allowing them to share security and data through parachains.
What is the Polkadot (DOT) price prediction for 2026?
Polkadot could trade between $2.50 and $5.00 in 2026, depending on market recovery, ecosystem growth, and adoption of its Polkadot 2.0 upgrades.
How much will 1 Polkadot be worth in 2030?
Price forecasts indicate 1 DOT could trade between $25 and $60 by 2030, depending on adoption of Polkadot 2.0 upgrades and broader crypto market growth.
What will Polkadot be worth in 2040?
Long-term projections suggest Polkadot could reach $180 to $270 by 2040 if the ecosystem grows steadily and blockchain interoperability becomes widely adopted.
What could Polkadot be worth in 10 years?
Over the next decade, Polkadot could trade between $60 and $150+ if cross-chain adoption expands and its interoperability model becomes a core part of Web3 infrastructure.
Is Polkadot a good long-term investment?
Polkadot is seen as a long-term infrastructure project focused on interoperability, though price performance depends on adoption, ecosystem activity, and market trends.
What factors could influence Polkadot’s price in the future?
Key factors include Polkadot 2.0 upgrades, parachain growth, tokenomics changes, institutional adoption, and overall crypto market sentiment.
Ethereum is trading near $2,290 in 2026, almost identical to its 2021 levels, even after extreme volatility that saw a peak near $4,950 in 2025 and a crash to $880 in 2022. Despite flat price action, the network has expanded strongly with1.2M-1.3M daily transactions, rising staking participation above 30%, and billions locked in DeFi, showing sustained real usage. However, inflation pressures and lower fee burns after scaling upgrades have limited ETH’s deflationary strength, keeping price performance muted compared to earlier cycles. Overall, Ethereum shows a clear divergence: strong adoption and activity, but price is still stuck in a long consolidation range. Read more: https://coinpedia.org/news/ethereum-price-hit-2021-levels-after-five-years-is-it-time-to-sell-eth/
Private companies are gradually moving past the early stages of experimenting with artificial intelligence, with many larger firms now beginning to report measurable returns from their investments. According to a new survey by Deloitte, nearly two-thirds (64%) of private companies…
Solana price has been consolidating within the $75-$100 range since early February this year. Now, a confirmed breakout from a descending parallel channel puts the asset in a position to challenge higher resistance levels after months of sideways movement. After…
Google has entered into an agreement with the U.S. Department of Defense to provide its artificial intelligence models for use on classified systems. According to The Information, citing a person familiar with the matter, the Pentagon can deploy Google’s AI…
Tokenized stock holders can now participate in corporate governance, closing a long-standing gap between onchain securities and their traditional counterparts.
XRP price fell 5% from last week’s high, driven down by declining network activity and cooling retail interest. It has now formed a bearish pennant pattern that positions the token for more pain in the coming sessions. According to data…
BTC cloud mining gains momentum in 2026 as AJC Mining expands access to remote mining contracts. As the cryptocurrency market continues to develop in 2026, institutionalization, compliance, and diversification of trading tools are driving increased industry attention. Leading platforms such…
The crypto market fell 1.3% to $2.64 trillion on Tuesday as concerns over stalled U.S.-Iran peace negotiations and rising oil prices eroded investor appetite for risk assets. Bitcoin (BTC) price crashed 2.2% from Monday’s high of $78,225 to $76,480 earlier…
Chiliz is scaling its Fan Token ecosystem by integrating with LayerZero to make tokens available across multiple blockchains like Solana and Base, unlocking wider liquidity and global access. This move allows fans to engage more deeply through voting, rewards, and experiences on the Socios platform, while tapping into faster networks and DeFi markets. With over 70 teams already onboard and more than $700 million generated, the expansion aims to bring millions of new users into crypto ahead of the 2026 FIFA World Cup.
Worldcoin is down over 97% from its highs, yet it has failed to trigger even a basic relief rally. Bearish pressure has intensified since September 2025, with the price dropping nearly 85% from local highs around $2.20, signaling sustained weakness and a lack of demand.
The absence of a meaningful bounce is the bigger signal. WLD price remains pinned below key levels, with every recovery attempt fading into persistent sell pressure. This raises a critical question: can Worldcoin initiate a rebound, or does the current structure point to a prolonged downtrend?
Worldcoin Price Maintains a Strong Downtrend
Worldcoin (WLD) continues to trade within a well-defined descending channel on the higher timeframe, reinforcing a sustained bearish structure. Price has consistently respected the channel boundaries, with each rally failing to break above the upper trendline, confirming continued seller control.
The formation of lower highs and lower lows remains intact, with recent price action drifting toward the lower boundary of the channel near $0.20–$0.25. This area is acting as immediate support, but the lack of a strong reaction suggests weak accumulation and limited buying interest.
Momentum indicators further support the bearish bias. The RSI remains below the neutral 50 level, hovering near oversold territory without showing a strong reversal signal. Meanwhile, the Chaikin Money Flow (CMF) stays in negative territory, indicating persistent capital outflows and reinforcing the lack of sustained demand.
Unless WLD breaks above the descending channel resistance—currently near the $0.80–$1 range—the broader trend remains firmly bearish. A breakdown below the $0.20 support zone could accelerate downside pressure, confirming continuation rather than reversal.
Top Reasons Why WLD Price May Not Trigger a ‘Relief Rally’
WLD’s inability to rebound is not just technical—it is structurally driven by persistent supply pressure and weak holding demand. Here are the key reasons why a meaningful recovery remains unlikely in the near term:
Core structure remains flawed: WLD launched with a very low circulating supply and an extremely high fully diluted valuation (FDV), while emissions are tied to user growth. As a result, early price discovery occurred on a thin float rather than real supply.
Token distribution adds long-term pressure: Around 75% of the supply is allocated to the community for gradual distribution, while the remaining 25% is reserved for the team and investors, unlocking over time.
Supply expansion continues to weigh on price: WLD launched with a total supply of 10B but only ~100M–143M in circulation, which has now expanded to over 3.3B. Each new user introduces a fresh supply, and with weak holding incentives, much of it is quickly sold, adding constant selling pressure.
Unlock overhang limits upside: Ongoing token unlocks create a psychological supply overhang. Even without visible dumping, expectations of future supply suppress price, while OTC deals may indirectly add to circulation.
Float illusion distorts valuation: The gap between circulating and total supply makes market cap appear smaller than the actual economic value being priced. This is why WLD can rally sharply on low float but tends to fade gradually.
This structural imbalance explains why WLD continues to form lower highs within its descending trend, keeping price pinned below resistance and preventing any sustained rebound.
WLD Price Outlook: Key Scenarios Ahead
Worldcoin price remains structurally bearish, with the next move dependent on key levels. As long as the price stays below $0.80–$1, the downtrend is likely to persist. Continued rejection could keep WLD near the $0.20–$0.25 support, with a breakdown opening further downside.
If $0.20–$0.25 holds, the price may range. However, without strong demand, this is likely a pause within the downtrend, not a reversal. Besides, a decisive reclaim of $1, supported by strong momentum, could weaken the bearish structure. Confirmation would require higher highs on higher timeframes.
WLD’s structure continues to favor downside. Until demand absorbs supply and key resistance is reclaimed, any bounce is likely to remain corrective rather than a sustained recovery.
Injective (INJ) price is showing early signs of stabilization after a prolonged downtrend, with selling pressure beginning to ease near key support levels. While the broader structure remains cautious, recent price action suggests the market is attempting to build a base rather than extend losses.
This comes as Injective moves closer to a scheduled mainnet upgrade, a catalyst that could influence both network performance and token demand. With price compressing near resistance and sentiment gradually improving, INJ is now approaching a decisive phase.
Injective’s approved mainnet upgrade, expected around April 28, brings both technical improvements and a shift in token economics.
The upgrade focuses on improving execution efficiency and optimizing on-chain modules, making the network more reliable for DeFi and trading use cases. Alongside this, the introduction of INJ token buybacks creates a direct demand mechanism tied to protocol activity. This adds a structural support layer for the token, but price action indicates the market is still waiting for confirmation rather than pricing it aggressively.
INJ price has moved out of a clear downtrend into a base formation, holding steady in the $3.20–$3.40 demand zone where selling pressure has faded.
Since then, INJ price has been consolidating within a tightening range, forming higher lows while approaching resistance near $3.80–$4.00. This reflects a compression structure, where momentum builds before a potential directional move.
Analyst commentary aligns with this setup, pointing toward a possible breakout as the descending trend weakens. However, confirmation remains key. Currently trading around $3.5–$3.6, INJ is testing this resistance with improving momentum. RSI is pushing toward 60, and volume is gradually expanding, both early signs of strengthening buyer interest.
A sustained move above $4.00 would confirm a breakout and open upside toward $5.20–$5.70. On the downside, $3.20 remains the critical support that holds the current structure intact.
Final Words
INJ remains in a transition phase, with structure improving but confirmation still pending. A sustained move above $4 would shift momentum decisively in favor of buyers, while failure to break could extend the current range. For now, the setup leans constructive, but the breakout is what validates it.
ZetaChain has paused cross-chain transactions after an attack targeted its GatewayEVM contract, a core component used for cross-chain transfers. The exploit only affected internal team wallets, with no user funds compromised, as the team quickly identified and blocked the attack vector. As a precaution, all cross-chain activity remains halted while investigations continue, with no further losses expected. ZetaChain has confirmed it will release a detailed post-mortem, highlighting the cause of the attack and steps taken to strengthen security going forward.
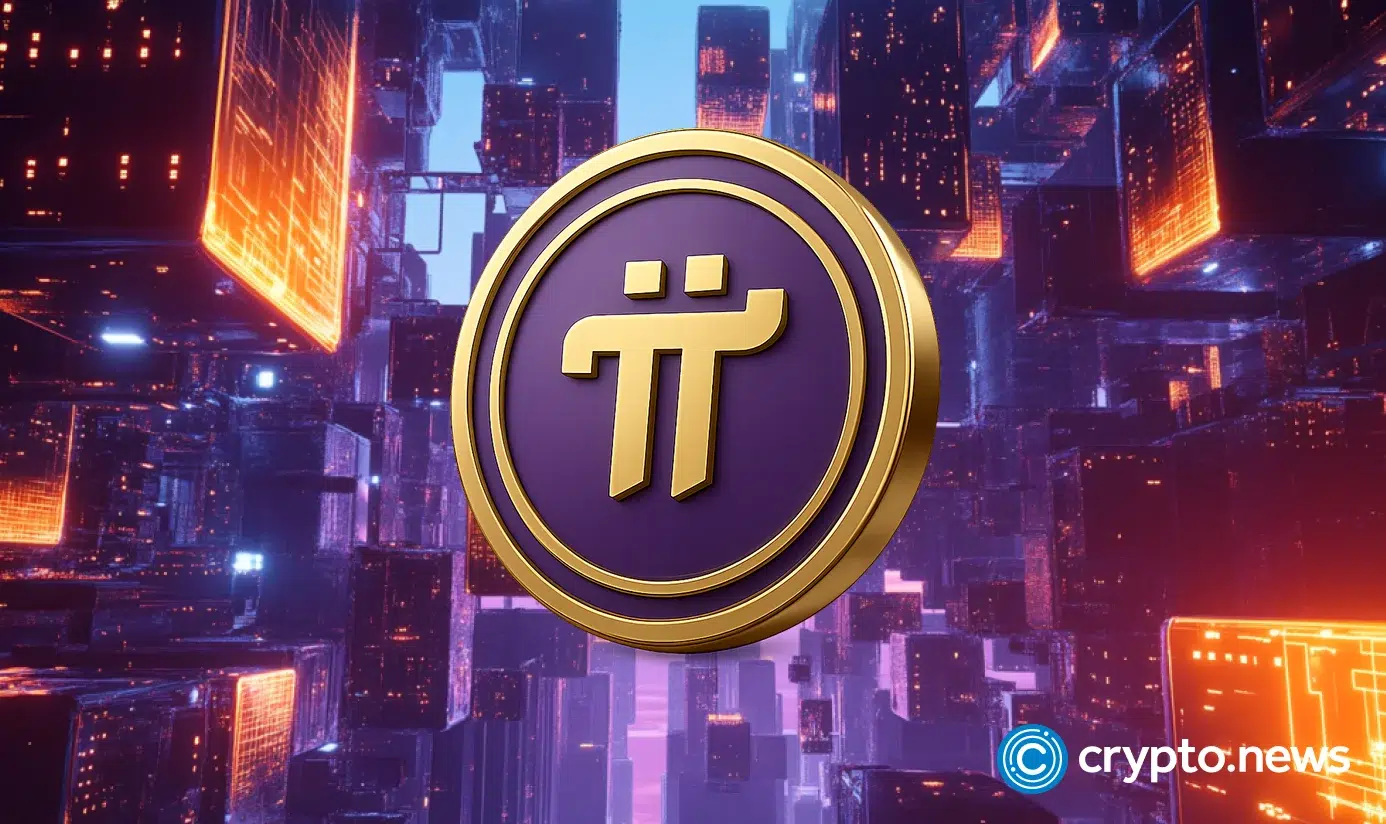
Pi Network is starting to turn heads again, and this time, the setup looks more convincing. With over 10.2 billion tokens in circulation with a market cap of $1.91B, Pi sits among the top 50 cryptocurrencies globally.
After months of slow movement, Pi has finally broken an important resistance level, just as attention builds ahead of Consensus 2026 in Miami, where the founders are set to speak.
Breakout Finally Kicks In
Crypto analyst Javon Marks recently said that Pi has broken and retested a resistance trend that held for over a year. Based on this structure, he sees a potential 1,400% move toward $2.80, suggesting Pi could be entering an early-stage rally.
“Pi has showed a clear breakout and retest of a resisting trend that took over one year and prices, in response, could be in the early stages of a massive uphill run! Prices can run over 1,400% to ~$2.80 and this may only be the beginning stages of the process,” he wrote on X.
With Pi Network heading into Consensus 2026, analysts are looking at which direction theprice will head next.
Big Claims?
While excitement is rising, not everything being said holds up.
Users pointed out that many claims floating around, like political backing, “new world currency” status, or confirmed regulatory ties, have no official backing. While Pi’s ecosystem and adoption narrative are evolving, these larger claims remain unverified.
Right now, Pi’s breakout has improved sentiment, and upcoming catalysts could keep the momentum going. Pi Network is trading around $0.1819. Pi is still trading well below its all-time high of $2.98, reached in February 2025, while staying comfortably above its recent low of $0.1312 from early 2026.
The BNB price prediction for 2026 just gained a new catalyst after Teucrium launched the first 2x leveraged BNB ETF on U.S. exchanges, trading under the ticker XBNB starting April 27 per Bloomberg. That product gives institutional and retail traders regulated access to double the daily performance of BNB futures, and it adds buying pressure to a token already backed by quarterly burns and 4.5 million daily active users on BNB Chain.
The BNB price prediction for the long term now carries targets as high as $2,000 according to CryptoRank. But wallets that caught BNB at $0.15 during its 2017 ICO turned small positions into generational wealth, and Pepeto is sitting at that same type of ground floor entry with an approaching Binance listing and over $9.56 million raised.
First U.S. Leveraged BNB ETF Goes Live as BNB Price Prediction Models Adjust
Teucrium announced XBNB on April 25, and Binance co-founder Changpeng Zhao posted about the launch the same day. The fund uses futures contracts to target 200% of BNB’s daily price movement, and it rebalances every session to hold that ratio. VanEck and Grayscale also have spot BNB ETF applications under SEC review, adding another demand layer ahead.
BNB Chain ran 4.5 million daily active users in Q1 2026 per CoinMarketCap, the highest of any Layer 1 network. The 35th quarterly burn on April 15 removed 2.14 million tokens worth $1.32 billion, pushing the circulating supply closer to the 100 million final target. These numbers support the BNB price prediction, but the real question is how much room a token at $623 and an $85 billion market cap has left to run.
BNB Price Prediction Compared: Binance Coin (BNB) and the Presale Opportunity Pepeto
Pepeto: The Ground Floor Position That a $623 Token Cannot Offer
Teucrium building a leveraged product around BNB proves that Wall Street treats the token as a core holding. But the returns that turned wallets into fortunes came from entering BNB at $0.15, not from buying it at $623.
Pepeto is offering that same early position right now, a fully operational trading platform designed by someone who previously led exchange development at Binance, with every contract cleared by SolidProof before a single wallet connected.
The zero-fee swap engine handles trades across Ethereum, BNB Chain, and Solana without taking anything from the position. A contract scanner reviews every token before capital touches it and flags hidden risks that drain unprepared wallets.
Over $9.56 million flowed into the presale at $0.0000001867 while the Fear and Greed Index sat below 35 for weeks. Staking pays 177% APY that builds every day while the Binance listing approaches. The architect who built the original Pepe token to a $7 billion valuation is leading this project, and a senior Binance veteran designed the exchange layer.
Analysts project at least 200x from this entry once the listing sets the first public price, and the presale counter moves faster every week. The gap between presale pricing and that first exchange candle is where real wealth gets built, and that gap closes permanently the moment trading begins.
Binance Coin (BNB) Price at $623 as Leveraged ETF Adds Institutional Demand
Binance Coin (BNB) trades at $623 per CoinMarketCap, down 1.28% over 24 hours as the XBNB launch draws attention. BNB hit its all-time high of $1,369.99 in October 2025, which means the token sits 54% below that peak.
Cryptopolitan projects BNB reaching $2,000 by mid-2028, and CryptoRank models see the $2,000 level as realistic if BNB Chain adoption keeps growing and quarterly burns continue. Support holds at $615 with resistance near $650, and a break above $650 opens the path toward $700.
The Osaka hard fork on April 28 targets higher throughput, adding another near-term catalyst. But even the $2,000 target represents roughly a 3x return from current levels, a strong move for a large cap but a small fraction of what a presale entry delivers from a single listing event.
Conclusion:
The BNB price prediction heading into 2026 tells a clear story of strong demand, quarterly burns, and now regulated ETF products backing the token. BNB at $623 with a $2,000 target gives holders a solid 3x over two years.
But the wallets that built fortunes from exchange tokens did not buy BNB at $623. They bought it at $0.15 when nobody was watching. Pepeto sits at that same stage right now, with $9.56 million raised, 177% APY staking rewards growing daily, and a Binance listing that will set the first public price.
The same $1,000 that buys 1.6 BNB today buys over 5.3 billion Pepeto tokens positioned directly below the listing price, and at the 200x analysts project, that $1,000 turns into $200,000. That math only works while the presale remains open. Visit the Pepeto official website and take the position before the listing removes this entry permanently.
What is the BNB price prediction for 2026 after the Teucrium ETF launch?
The BNB price prediction targets a range between $671 and $2,000 by 2028 as quarterly burns, 4.5 million daily users, and the new XBNB leveraged ETF add institutional demand. BNB trades at $623 with support at $615 and resistance at $650.
Why is Pepeto considered a stronger entry than BNB at current prices?
Pepeto offers presale pricing at $0.0000001867 with exchange tools already running, a SolidProof audit on every contract, and an approaching Binance listing that analysts project at 200x. BNB at $623 targets 3x to $2,000 while Pepeto targets that return from a single listing event.
The Solana Foundation published a blog post on April 27, 2026, confirming that its core developer teams have already agreed on a future quantum security plan. The network confirmed that both teams selected Falcon, a new digital signature system, and early working versions have already been built.
Solana Foundation said quantum threats may still be years away, but preparing early is the better move.
Two Core Developer Teams Agree on One Solution
What makes this update more important is that two major Solana developer teams, Anza and Firedancer, studied the problem separately and reached the same result.
Both teams selected a post-quantum signature system called Falcon.
That matters because these teams build critical infrastructure for Solana validators. If both groups independently support the same model, it adds confidence that the plan is practical and technically strong.
What Is Falcon, And Why Did Both Teams Pick It
Falcon is a new digital signature system made to protect against future quantum computer attacks. It is stronger than Solana’s current system, Ed25519, if quantum machines become powerful enough one day.
Both teams picked Falcon because it offers strong security while staying fast and lightweight.
This is important because Solana handles many transactions, so it cannot use a system that slows the network down too much.
TLDR: Quantum is still years away, and if and when it materializes, the work to migrate Solana is well-researched, understood, and ready to deploy as described below. pic.twitter.com/eNYgJeV2mx
Falcon is also trusted by experts. It was chosen by the U.S. National Institute of Standards and Technology (NIST) as one of the approved post-quantum security systems.
No Immediate Changes Needed
For now, users do not need to do anything. Solana says today’s systems remain safe, and no urgent upgrade is required. But the roadmap is already forming.
Solana Foundation says that,
“Quantum is still years away,” adding that migration plans are “well-researched, understood, and ready to deploy.”
New wallets would adopt Falcon first if quantum risks escalate. Existing wallets would migrate in a later phase.
Beyond the main network, other projects in the Solana ecosystem are also working on quantum-resistant tools. One example is Blueshift’s Winternitz Vault, which has been active for over two years.
This shows that Solana is not just planning for the future but already testing solutions in real conditions.
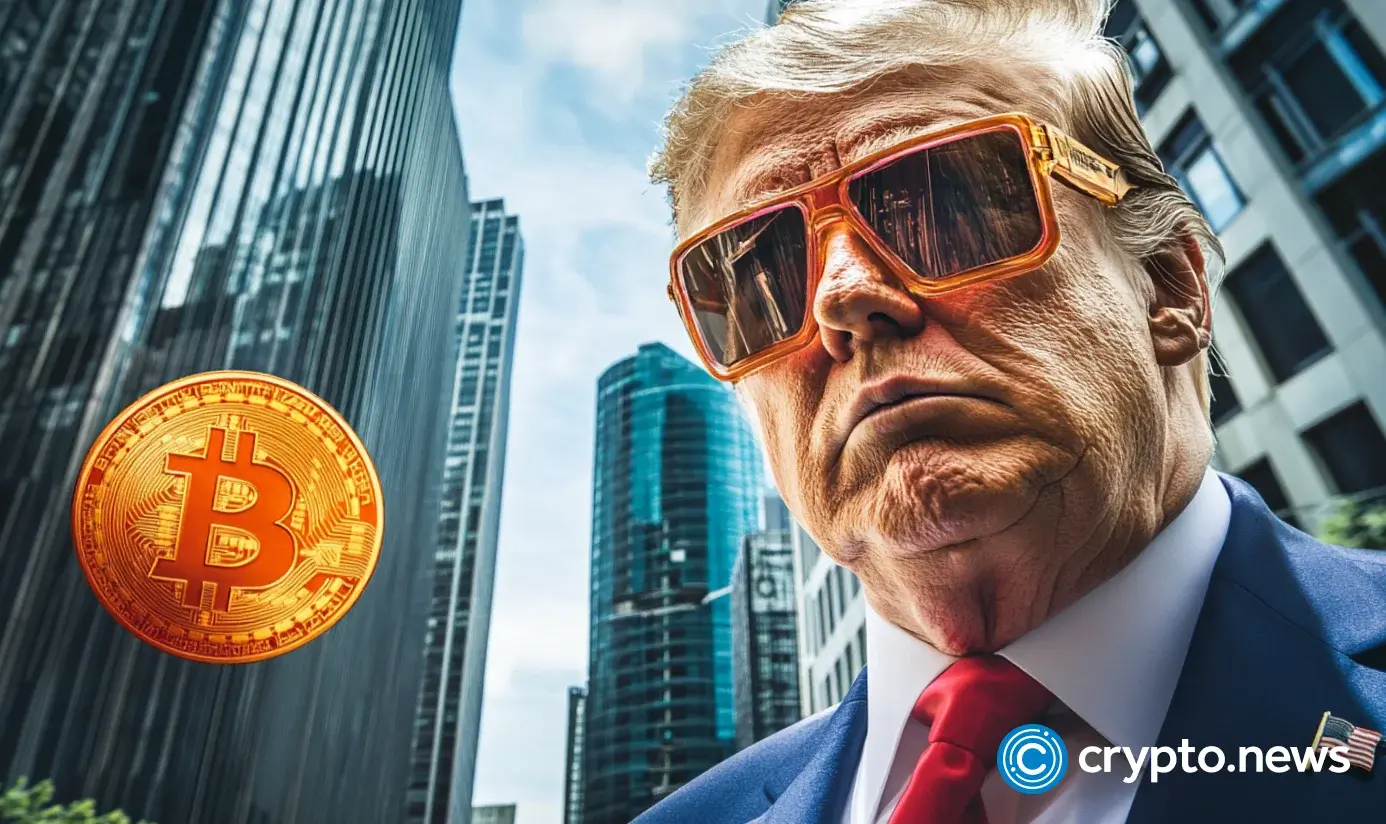
The Trump administration is preparing to unveil its Strategic Bitcoin Reserve plan within the next two months, according to recent reports. The proposal aims to use around 200,000 BTC seized by the government as a national reserve asset. Officials say a major announcement could come in the coming weeks, with legal and policy work already in progress. Final details will depend on the upcoming official documents and approvals.
Millions of Colombian workers are about to get access to Bitcoin through their retirement savings. Porvenir, Colombia’s largest pension fund manager, just launched a Bitcoin-linked investment product that any saver can access for as little as $25.
Instead of direct buying, the fund offers exposure through BlackRock’s IBIT ETF, which manages over $50 billion, marking a shift toward safer and structured access to digital assets.
Colombia’s Porvenir Launches Bitcoin Portfolio
In April 2026, at the Asofondos Annual Congress in Cartagena, Porvenir, the pension arm of Grupo Aval and Colombia’s largest pension fund administrator, officially announced the launch of its Crypto Portfolio.
The product allows Porvenir’s affiliates to gain exposure to Bitcoin’s price through regulated mechanisms, functioning as an investment fund that channels resources into BlackRock’s IBIT ETF.
This is not a small or experimental move.
According to World Bank data, Colombia’s pension system covers approximately 60% of the working population, with Porvenir managing about 25% of the country’s pension assets. This means the product could slowly influence how millions of Colombians invest for retirement for many years.
How the Fund Works?
The new “Crypto Porvenir Portfolio” is designed for voluntary pension accounts. Investors can start with just COP 100,000 (around $25), making it accessible to a wide range of users.
Meanwhile, it is designed for young Colombian workers aged 18 to 45 who want to diversify their savings but have never had a simple, regulated way to access crypto.
Instead of managing wallets, investors gain exposure through iShares Bitcoin Trust (IBIT), which tracks Bitcoin’s price. This removes risks like hacking or lost passwords, as users do not need to acquire Bitcoin directly or manage digital wallets.
One important warning that Porvenir has been transparent about is that while the fund protects users from hacking risks and lost passwords, it does not protect them from Bitcoin’s price volatility.
If Bitcoin drops, the portfolio drops with it.
Part of a Growing Institutional Trend
Porvenir joins other pension managers like Protección and Skandia, which have already launched similar crypto-linked products.
However, access is not automatic. Investors must complete a risk assessment to ensure they understand the risks involved.
Protección president Juan David Correa has been certain that
“Access to Bitcoin should be part of a long-term diversification strategy and not a pursuit of speculative profits, and for that reason, these products are kept exclusively within the voluntary pension plan rather than mandatory retirement savings.”
The White House has signaled that a new step toward operationalizing the U.S. strategic Bitcoin reserve has been prepared, with an announcement expected within weeks. Speaking at the Bitcoin 2026 conference in Las Vegas, Patrick Witt said officials have been…
Is Bitcoin safe from quantum computers? We break down the real threat timeline, BIP-360 defenses, and how Ethereum, XRP, and other blockchains are preparing for Q-Day.
U.S. President Donald Trump has softened his stance on prediction markets days after voicing concern over their rapid rise. Speaking to reporters in Florida on Saturday, Trump acknowledged that some experienced participants support these platforms, even as he maintained a…
U.S. crypto lobbying group Blockchain Association has urged the Federal Reserve to formalise the removal of “reputation risk” from bank supervision rules, warning that the concept has been used to restrict access to financial services. In a comment letter submitted…
Block has introduced an on-chain proof-of-reserves system covering its corporate Bitcoin holdings and key consumer products, expanding its push for transparency in digital asset custody. According to Block, users can independently verify its Bitcoin reserves through cryptographic signatures published on-chain,…
US President Donald Trump says the US can’t be “left out in the cold” on prediction markets just days after he said he was “not happy” with the fast-growing platforms.
The Office of the Comptroller of the Currency and the Federal Deposit Insurance Corp. finalized a similar rule removing reputation risk earlier this month.
Bitcoin’s ascending channel setup and rising stablecoin inflows suggest improving liquidity conditions could support a push toward higher price levels.
Acting US Attorney General Todd Blanche said developers will no longer be investigated or charged unless they knowingly help third parties commit crimes.
Jump Crypto, the team behind Firedancer, said Falcon has the smallest signature among NIST standards, which could help preserve Solana’s high-throughput capabilities.
Visiting the fake login website alone isn’t enough for hackers to gain entry to accounts. However, entering sensitive information such as passwords could grant them access.
Democrats seeking to crack down on the Trump family’s crypto empire have found an ally in Republican Thom Tillis, who supports ethics provisions in a key crypto bill.
Senator Thom Tillis has threatened to oppose the Senate’s crypto market structure bill unless ethics restrictions on White House crypto activity are added. According to Politico, Tillis said he would withdraw support for the legislation if it leaves the Senate…
Canada has advanced a bill to block cryptocurrency donations in federal elections, pushing tighter controls on how political funding is handled. According to Canada’s House of Commons, Bill C-25, known as the Strong and Free Elections Act, cleared its second…
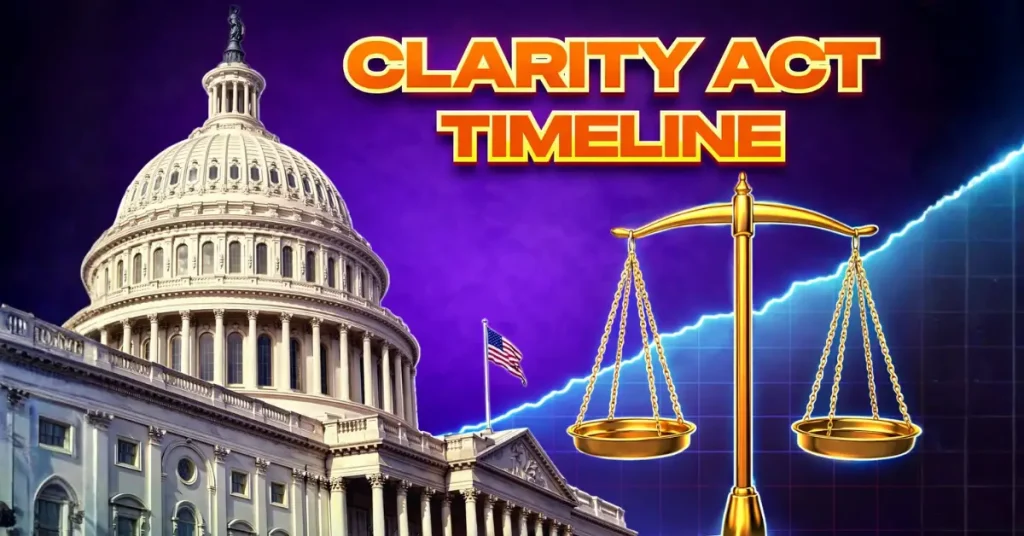
The United States may be weeks away from a major Bitcoin policy announcement. Fresh signals out of the Bitcoin 2026 Conference are hinting that the Strategic Bitcoin Reserve is moving closer to becoming reality, while Senator Cynthia Lummis confirmed the Clarity Act is heading toward a May markup and could be on the president’s desk shortly after.
“Big Move Coming” on Bitcoin Reserve
At the event, Patrick Witt revealed that a major announcement on the Strategic Bitcoin Reserve is expected within weeks, hinting at progress behind the scenes.
“The president signed the strategic bitcoin reserve executive order… and we’ve been working on the legal and operational framework to get that right,” Witt said. He added, “We believe we’re going to be able to take a big step forward from the executive branch side.”
The reserve, initiated under Donald Trump, is currently backed by Bitcoin already held by the government through seizures. However, the bigger push now is toward legislation.
Lawmakers are working to formalize the plan through an updated bill, now evolving into the American Reserves Modernization Act (ARMA), which includes a proposal to accumulate up to 1 million BTC over five years using budget-neutral strategies.
Meanwhile… Institutions Are Already Moving
While policy builds in the background, market structure is also changing rapidly. Crypto analyst Jeff Park points to a shift in derivatives.
For the first time, IBIT options have overtaken Deribit in open interest, marking a transition from crypto-native trading to institutional dominance.
“DeVault is flawed… it only uses Deribit options,” Park explained, noting that traditional models no longer capture the full picture of today’s market.
A standout signal is the volatility spread. IBIT’s implied volatility is about five points higher than offshore exchanges, suggesting strong demand for long-term upside exposure, especially from investors positioning early.
Park’s view is clear: “We’re going to see a big Bitcoin move up… led by IBIT options.”
Two Forces, Same Direction
What’s unfolding is a rare alignment. On one side, governments are building long-term Bitcoin positions. On the other hand, institutions are reshaping how the market trades.
As Park noted, “Watching IBIT take market share… shows we’re heading in the right direction.”
With both policy clarity and institutional demand building at the same time, Bitcoin’s next move may already be taking shape beneath the surface.
Price predictions for 2026 range from $5.00 to $10.00.
Long term forecasts suggest FIL price may hit $50.00 by the end of 2030.
Filecoin (FIL) is a decentralized storage network that enables users to store and retrieve data securely without relying on centralized cloud providers. FIL has been trading close to its long-term support zones after prolonged corrective phases. Throughout 2025, the token remained largely range-bound, signaling seller exhaustion at lower levels.
This extended consolidation has helped FIL to rebound from the support zone of $1.20. Connecting fundamentals with price action, Filecoin’s steady utility-driven narrative combined with a base-forming chart structure positions the asset for a potential trend transition.
As FIL moves into 2026, the key question remains whether improving on-chain usage and network relevance can translate into sustained upside momentum, shaping the broader price prediction outlook ahead.
As April comes to a close, Filecoin is showing early signs of stabilization after a prolonged downtrend, with the price now holding near the $0.85–$1.00 range. Selling pressure has eased, and buyers are gradually stepping in on dips, suggesting the market is shifting from decline to base formation rather than continuing weakness.
At the same time, price remains capped below the $1.10–$1.20 resistance zone, which continues to act as the key barrier for any recovery. The current structure reflects compression, where volatility is tightening and price is building pressure just below resistance, often a precursor to a directional move. A confirmed breakout above $1.20 would signal a structural shift, opening the path toward the $1.50–$2.00 range, with further upside possible if momentum strengthens. However, until that breakout occurs, FIL may continue trading within its current range, with $0.75–$0.80 acting as immediate support.
For April–May 2026, FIL remains in a buildup phase, with the next move likely to be defined by a decisive break above $1.20.
Coinpedia’s Filecoin (FIL) Price Prediction 2026
Filecoin’s broader trajectory in 2026 points toward a rebuilding phase, where price is attempting to transition from prolonged weakness into a more constructive structure.
Following its earlier highs, FIL experienced an extended period of decline, driven by fading momentum and consistent supply pressure. This phase pushed the asset into lower valuation zones, where it is now attempting to establish a base. The current structure suggests that the market is stabilizing, but a sustained uptrend will depend on reclaiming higher resistance levels. The first meaningful threshold remains at $1.20, followed by more significant barriers near $2.00 and $2.50.
A move through these levels would indicate strengthening demand and a shift in market positioning, allowing price to gradually expand into higher ranges. Filecoin continues to build its narrative around decentralized storage and data infrastructure. Growth in data demand, network utilization, or enterprise-level integrations could act as key drivers for renewed interest.
If these developments align with improving market conditions, FIL could reprice toward the $3 to $10 range over the course of 2026. However, this outcome would require sustained momentum and progressive confirmation across resistance levels. Until then, Filecoin remains in a recovery phase, with the $0.70 level acting as a critical support base.
Recent Catalysts / News for Filecoin
Rising real usage focus: Filecoin is shifting toward demand-driven growth, with increasing emphasis on paid storage adoption rather than just network capacity.
AI storage narrative strengthening: Growing need for decentralized data storage, especially from AI-related use cases, is positioning FIL as a long-term infrastructure play.
Ecosystem integrations expanding: More blockchain and developer ecosystems are beginning to utilize Filecoin’s storage layer, supporting real utility beyond speculation.
FIL Price On-chain Outlook
Filecoin’s on-chain metrics continue to show steady structural improvement. One of the most talked-about developments is the launch and expansion of Filecoin OnChain Cloud (FOC), a major network upgrade designed to enhance on-chain storage usage and accessibility.
FOC’s deployment marks a shift towards more practical decentralized storage use cases, which could stimulate real demand.
Additionally, whale accumulation activity which surged late in 2025 alongside the rising token holding by large investors may fuel confidence ahead.
FIL Crypto Price Prediction 2026 – 2030
Year
Potential Low ($)
Potential Average ($
Potential High ($)
2026
3.00
6.00
10.00
2027
5.20
8.80
13.50
2028
9.00
12.50
18.00
2029
11.00
17.00
30.00
2030
16.00
25.00
50.00
Filecoin Crypto Price Prediction 2026
The FIL price range in 2026 is expected to be between $3.00 and $10.00.
Filecoin Price Prediction 2027
Filecoin (FIL) price range can be between $5.20 to $13.50 during the year 2027.
FIL Price Prediction 2028
The FIL Network price for 2028 is anticipated to lie within the range of $9.00 to $18.00.
FIL Coin Price Prediction 2029
Thereafter, the FIL price for the year 2029 could range between $11 and $30.00.
Filecoin Price Prediction 2030
Finally, in 2030, the price of FIL is predicted to maintain a steady positive. It may trade between $16.00 and $50.00.
FIL Price Prediction 2031, 2032, 2033, 2040, 2050
Based on the historic market sentiments and trend analysis of the largest cryptocurrency by market capitalization, here are the possible FIL price targets for the longer time frames.
Year
Potential Low ($)
Potential Average ($)
Potential High ($)
2031
55.00
62.00
72.00
2032
62.0
74.00
90.00
2033
70.00
88.00
110.00
2040
140.00
200.00
300.00
2050
320.00
350.00
400.00
FIL Price Prediction: Market Analysis?
Year
2026
2027
2030
Changelly
$15.80
$24.50
$52.10
CoinCodex
$11.90
$17.85
$29.45
Binance
$13.40
$21.10
$44.85
Never Miss a Beat in the Crypto World!
Stay ahead with breaking news, expert analysis, and real-time updates on the latest trends in Bitcoin, altcoins, DeFi, NFTs, and more.
FAQs
What is Filecoin (FIL) and what does it do?
Filecoin is a decentralized storage network where users rent out unused space and store data securely without relying on centralized cloud providers.
What is the Filecoin price prediction for 2026?
Analysts expect Filecoin to trade between $5 and $10 in 2026, supported by network adoption, improving sentiment, and a long base near key support.
Can Filecoin reach $50 by 2030?
Long-term forecasts suggest FIL could approach $50 by 2030 if decentralized storage demand grows and Filecoin strengthens real-world usage.
Is Filecoin a good long-term investment?
Filecoin’s value depends on adoption of decentralized storage. Strong fundamentals and steady utility make it a project to watch long term.
DOGE price prediction for 2026 suggests potential highs of $1.25
Long term forecasts indicate DOGE could reach $3.00 by 2030.
Dogecoin continues to hold its position as one of the most widely recognized meme-driven assets in the market, supported by strong community backing, increasing integration in payment use cases, and periodic attention from high-profile endorsements. While it does not rely on deep protocol-level fundamentals like traditional Layer-1 networks, its strength lies in liquidity, accessibility, and its ability to capture retail-driven momentum during favorable market cycles.
At the same time, its 2026 price structure reflects a shift from prolonged decline toward early stabilization. After trending lower through 2025, DOGE has started forming a base near key demand zones, with price compressing within a defined range rather than continuing downward. This change in behavior suggests that selling pressure is easing, while accumulation is gradually building beneath resistance.
This sets up a familiar pattern. When Dogecoin transitions from low-volatility consolidation into expansion, the move tends to be sharp and sentiment-driven rather than gradual. The current structure indicates that the market is approaching that decision point.
In this Dogecoin price prediction 2026–2030, we will break down how this evolving structure, combined with market momentum and adoption trends, could shape DOGE’s long-term trajectory. Keep reading for more clarity.
Dogecoin (DOGE) Price Prediction for April-May 2026
As April comes to a close, Dogecoin continues to trade near the $0.095–$0.10 range, maintaining a steady consolidation phase after its extended downtrend. The highlighted accumulation zone on the chart has remained intact throughout the month, with buyers consistently stepping in on dips, reinforcing this region as a reliable base. This repeated defense suggests that selling pressure has largely been absorbed, shifting the structure from decline to stabilization.
Rather than breaking lower, DOGE is now holding structure with a slight upward bias, indicating that the market is gradually transitioning into an accumulation phase. As long as this base continues to hold into early May, the probability of a breakout attempt increases.
On the upside, the immediate hurdle remains in the $0.105–$0.11 zone, which has capped recent recovery attempts. A sustained move above this level would confirm short-term strength, opening the path toward the $0.13–$0.15 range, where prior supply has historically emerged.
If momentum builds beyond that, the next level to watch sits near $0.18, although such a move would likely require broader market participation and improved sentiment across altcoins. However, the structure still needs confirmation. If DOGE fails to break resistance and slips below the $0.095 support, the price could revisit the $0.085 region, signaling that the consolidation phase needs more time before any meaningful expansion.
As May approaches, the focus shifts from holding support to breaking resistance, because once DOGE clears the $0.11 barrier, the move is likely to accelerate rather than unfold gradually.
Coinpedia’s Dogecoin (DOGE) Price Prediction 2026
Moving into the broader 2026 outlook, Dogecoin’s direction will likely be shaped by how the overall crypto cycle develops. Historically, DOGE has not required strong fundamentals to rally, it tends to respond quickly once liquidity and attention return to the market.
A move above $0.15–$0.18 would be the first sign that sentiment is shifting. From there, the next important zone lies around $0.30–$0.35, which could act as a mid-cycle barrier. If DOGE manages to maintain strength above this region, the structure begins to look more constructive, opening the door for a move toward $0.45–$0.50. Such a move would likely depend on broader market participation and renewed interest in meme-driven assets.
At the same time, if Dogecoin price struggles to hold above $0.08, the recovery timeline could extend, keeping DOGE in a longer consolidation phase. Overall, 2026 may not be about explosive moves initially, but rather about gradual rebuilding, with upside accelerating only if market conditions align.
Recent News/Catalysts for Dogecoin (DOGE)
Retail-driven momentum building again: Social sentiment around meme coins is picking up into May, with Dogecoin seeing renewed retail attention after months of muted activity, often an early signal before volatility expansion.
Whale accumulation near base: Large wallet activity has been gradually increasing around the $0.09–$0.10 zone, indicating accumulation rather than distribution, reinforcing the current support structure.
Altcoin rotation narrative strengthening: As Bitcoin stabilizes near higher levels, capital rotation toward high-beta assets like DOGE is starting to re-emerge, positioning it as a potential beneficiary if momentum expands in May.
Dogecoin Price Prediction 2026 – 2030
Year
Potential Low ($)
Potential Average ($)
Potential High ($)
2026
0.75
1.00
1.25
2027
1.15
1.35
1.50
2028
1.25
1.75
2.00
2029
1.50
2.15
2.65
2030
2.50
2.75
3.00
This table, based on historical movements, shows DOGE price to reach $3 by 2030 based on compounding market cap each year. This table provides a framework for understanding the potential DOGE price movements. Yet, the actual price will depend on a combination of market dynamics, investor behavior, and external factors influencing the cryptocurrency landscape.
Dogecoin (DOGE) Price Prediction 2026
As per Dogecoin’s Price forecast for 2026, the high price could be $1.25, the low may reach $0.75. This makes the average around $1.00.
Dogecoin Price Prediction 2027
Moving to 2027, the DOGE Price projects that it might hit a high price of $1.50 potentially. With a $1.15 low and an average of $1.35
DOGE Coin Price Prediction 2028
Moving to 2028, the Dogecoin Price Forecast predicts a high price of $2.00. On the flip side, the low may fall to $1.25, and the average is projected to be around $1.75.
DOGE Price Prediction 2029
As per Dogecoin Price Forecast 2029, DOGE’s high price is predicted to be $2.65, with a low of $1.50 and an average of $2.15.
Dogecoin (DOGE) Price Prediction 2030
Finally, as per the Dogecoin Price Forecast 2030, DOGE’s price can reach a high price of $3.00. With a low of $2.50 and an average of $2.75.
The XRP price prediction just gained a chart signal that traders have only seen twice before, and both times it led to massive rallies. XRP is approaching the same Ichimoku cloud breakout that launched it from $0.50 to $3.65 between November 2024 and July 2025, according to 24/7 Wall Street.
Pepeto stands as the top presale right now, backed by a live exchange processing real volume daily. Bitcoin (BTC) needs to push from $76,800 back toward six figures, and Dogecoin (DOGE) grinds below $0.10 without a trigger. Pepeto raised $9.56 million, and with the listing drawing closer, early wallets are set for the 100x this cycle is building toward.
XRP trades at $1.39 as of April 27 according to CoinMarketCap, holding steady while the Ichimoku cloud pattern forms on the weekly chart. A confirmed weekly close above $1.67 would trigger the breakout, and spot XRP ETF flows have topped $75 million across April, the strongest month since launch.
24/7 Wall Street reports the CLARITY Act cleared the House and gained backing from Coinbase, the Treasury, and the SEC, with 120 firms pushing the Senate to schedule a markup on April 23.
Big institutional bets keep stacking around XRP (XRP), but from an $85 billion cap even a 4x takes sustained buying over entire quarters. That ceiling is the exact reason capital rotates into presale entries where one listing event produces the full return.
Where the XRP Price Prediction Overflow Goes and How Presale Capital Multiplies
Pepeto: The Live Exchange That Leads While the XRP Price Prediction Plays Out
Capital keeps flowing into Pepeto as the XRP cloud breakout proves serious money is re-entering crypto, pushing overflow capital into verified presales where gains multiply faster.
The reason Pepeto pulls capital from launched tokens is straightforward: the exchange processes real trades every day, right now. Traders need fast, secure, live tools, and Pepeto delivers through a platform running since before the presale began filling.
Zero-fee trading keeps full position sizes working on every entry, the cross-chain bridge moves tokens between networks without taking a cut, and the token scanner checks every project before capital commits. SolidProof audited the full contract, and the Pepe creator who took a meme coin from nothing to a $7 billion peak built this exchange alongside a former Binance development lead.
The xrp price prediction target of $3.65 would deliver 2.5x for XRP holders over months, solid for large portfolios. But wallets entering presales now aim for 100x from a single listing event. Pepeto has pulled in $9.56 million at $0.0000001867 with 177% APY staking compounding every position while the final stages fill.
Bitcoin (BTC) Price at $76,800 as Best Monthly Close in a Year Takes Shape
Bitcoin (BTC) trades at $76,800 per CoinMarketCap, up 13% in April and on pace for its strongest monthly close in a year as the Bitcoin 2026 Conference opens in Las Vegas with over 40,000 attendees.
Bernstein holds a $200,000 target, roughly a 2.6x from current levels, a solid outlook for the largest asset in crypto. But Pepeto at presale pricing delivers the 100x that trillion-dollar market caps can no longer produce.
Dogecoin (DOGE) Price at $0.095 as Meme Sector Holds Below Key Resistance
Dogecoin (DOGE) trades at $0.095 per CoinGecko, holding support while the meme sector consolidates below $0.10, the level blocking every Dogecoin rally this month. DOGE whales accumulated over 500 million tokens since mid-April, but resistance still holds.
A clean break opens a 30% move to $0.12, but presale entries targeting 100x from one listing deliver what Dogecoin at a multi-billion cap cannot.
Conclusion
Every major gain in crypto came from wallets that moved before a project went mainstream. XRP at $0.003 turned $1,000 into over half a million dollars, and the cloud breakout forming now says that kind of early setup is back.
The market is turning bullish, volume is accelerating, and the entries made today determine who finishes this cycle with real returns. Pepeto carries the strongest presale setup of 2026, but the listing gets closer every day. The Pepeto official website is where that entry still lives, and it will not survive the first trade on the open market.
What does the xrp price prediction cloud breakout mean for XRP and Pepeto presale entries?
The XRP price prediction cloud breakout signals XRP could rally toward $3.65 if it posts a weekly close above $1.67, repeating the pattern from late 2024 that produced a 7x rally. Pepeto targets 100x from a single listing event at $0.0000001867, with $9.56 million already raised and 177% APY staking live.
What is Pepeto, and why is it gaining attention during the XRP rally?
Pepeto is a verified exchange platform with zero-fee trading, a cross-chain bridge, and a SolidProof-audited contract built by the original Pepe coin creator alongside a former Binance development lead. The presale raised $9.56 million at $0.0000001867 with 177% APY staking as the listing approaches.
Senator Cynthia Lummis walked off the Bitcoin conference 2026 stage on Sunday, having delivered the clearest public commitment yet on the Clarity Act’s timeline.
“We are going to mark up the Clarity Act in May,” Lummis told the crowd. “We are going to get it to the finish line. We are going to have the market structure that allows us to innovate, you innovate, America to lead the world on this freedom asset.”
For the unversed, a May markup would set the Clarity Act on a path toward a Senate floor vote in June, which aligns with the timeline Galaxy Digital CEO Mike Novogratz outlined last week when he predicted President Trump could sign the bill into law before summer.
From Early Doubt to Strong Conviction
Lummis shared that her journey with Bitcoin began in 2013, when she first bought 3 BTC at around $300 each. She admitted the idea initially felt unusual, saying owning a digital asset on a blockchain “sounded a little strange.” But over time, deeper exposure to the ecosystem completely changed her perspective.
“As I learned more, I realized this is a unique asset, freedom money,” she said.
Fighting Early Policy Battles
Once in the Senate, Lummis found herself at the center of early crypto regulation debates. One major issue was the IRS attempting to classify developers and miners as brokers.
She called the move “absurd and ridiculous,” explaining that it misunderstood how decentralized systems work.
What changed the tide was industry response. According to Lummis, the crypto community stepped in forcefully, helping lawmakers understand the difference between infrastructure builders and financial intermediaries.
At that moment, she said, it marked a turning point in shaping more informed crypto policy in Washington.
Bitcoin as “Freedom Money”
Lummis repeatedly described Bitcoin as more than just an investment. She framed it as a tool for financial independence.
“It’s an asset you can carry anywhere, transfer cheaply, and hold yourself,” she explained.
She pointed to real-world use cases, from people sending funds across war zones to individuals leaving difficult situations with their wealth intact, as proof of Bitcoin’s real utility.
With a fixed supply of 21 million coins, she also highlighted its built-in scarcity as a long-term value driver.
For the first time in history, a sitting SEC Chairman addressed a Bitcoin conference. Paul Atkins used the moment to speak about regulatory limits, political risk, and why the Clarity Act is not just important but essential to protecting everything the current administration has built for crypto.
The SEC Cannot Do This Alone
He said that the SEC operates under authority that is, in his own words, “basically a 1930s type of thing.” It can be nimble. It can coordinate with the CFTC. But it cannot create lasting certainty without Congress.
“Nothing futureproofs things like a statute,” Atkins said, “and then good opinions from courts to chisel what the statute says into stone.”
Without new legislation, he explained, everything the current SEC has built rests on guidance and goodwill rather than law. That matters enormously when political winds shift.
The Next Administration Is the Real Threat
Atkins acknowledged directly what the industry fears most. A future administration hostile to crypto, backed by a statute that defaults new projects to securities classification, would have tools the Biden-era SEC never had.
“Elections have consequences and can be huge,” he said. “Who would have thought ten years ago that we would have this complete 180-degree pivot pretty much by the US government?”
The flip side of that pivot is obvious. What one administration builds, the next can dismantle. Without a statute locking the framework in place, the progress of the past two years has no permanent foundation.
The SEC, Atkins said, is “focused on trying to streamline things, trying to make things more efficient, trying to help innovators innovate so that they can do so with certainty and then not get picked off by folks who are jealously guarding their turf from existing ways of doing things.”
The Timeline and What Needs to Happen
Movement in the Senate is expected in May. A vote could follow in June. From there the bill would need to pass the House and reach the president’s desk.
“A lot of things have to happen. A lot of things have to line up in order for all that to happen, which of course we’re hoping happens, but that is not guaranteed,” he said.
For those who have watched previous legislative cycles come close and stall, the caution is familiar. But the stakes, Atkins made clear, have never been higher.
Tokenised Equities: The Next Frontier
Atkins pointed to tokenised equities as a major near-term opportunity where the SEC sits at a critical position to enable or obstruct innovation. Traditional equity settlement passes through multiple intermediaries, each collecting fees between a trade’s execution and its final settlement. Blockchain could eliminate much of that friction.
“The commission sits at a really important position to enable this innovation to take place,” he said, while acknowledging the challenge of navigating stakeholders whose business models depend on the current structure.
Gold advocate and longtime Bitcoin critic Peter Schiff has taken direct aim at Michael Saylor’s most famous prediction, and the math he is using is simple enough to make Bitcoin bulls uncomfortable.
In 2025, Saylor predicted Bitcoin would hit $1 million per coin if Strategy accumulated 5% of the total supply. Strategy currently owns 3.9%, having just added another 3,273 Bitcoin last week at an average price of $77,906 per coin. The company now holds 818,334 BTC acquired for approximately $61.8 billion in total.
If buying the last 231,666 Bitcoin had a certain impact on price, buying the next 231,666 to reach the 5% threshold should have a comparable effect. Based on that logic, Schiff concludes Bitcoin will be trading below $60,000 by the time Strategy reaches its target, not $1 million.
“Bitcoin will be below $60,000 when MSTR finally hits 5%,” Schiff wrote on X, where the post drew more than 56,000 views within hours.
The Exchange That Followed
When one user suggested Saylor should face regulatory scrutiny for making what they called wild financial claims, Schiff added that regulators had been bought and paid for with crypto money, a charge that drew both support and fierce pushback.
When a Bitcoin supporter told Schiff that Bitcoin would inevitably surpass gold and that he would get it at the price he deserves, Schiff responded that he would be able to buy it close to zero if he wanted to.
What Strategy Is Actually Doing
Despite the criticism, Strategy continues to accumulate without hesitation. Last week’s purchase of 3,273 Bitcoin for $255 million between April 20 and 26 was disclosed in an 8-K filing with the Securities and Exchange Commission on Monday, pushing the company’s average cost basis to $75,537 per coin.
The company remains the world’s largest publicly listed Bitcoin holder by a significant margin, and Saylor has shown no sign of slowing the buying programme regardless of where the price sits.
Whether Schiff’s prediction or Saylor’s holds up will ultimately depend on whether institutional demand continues to absorb supply faster than Strategy can accumulate it, a question that sits at the heart of the most consequential bet in financial markets right now
At Paris Blockchain Week, Anodos CEO Panos Mekras shared a strong view on how the XRP Ledger is evolving beyond institutions and moving toward everyday users. The discussion focused on the idea that the next phase of crypto adoption is not just about banks, but individuals taking control of financial services directly.
From Banking Crisis to Blockchain Mission
Mekras explained that his motivation came from the 2008 financial crisis in Greece, where capital controls blocked people from accessing their savings and shut down businesses, including his family’s. That experience led him to Bitcoin and later XRP, where he saw faster and cheaper transactions as a foundation for a new financial system without traditional intermediaries.
Moving on, he shared that his crypto journey started from a very personal place. Referring to Greece’s financial crisis, he explained how capital controls in 2015 locked people out of their own money and even shut down family businesses.
He noted that this experience pushed him toward Bitcoin and later XRP. “You don’t need banks or middlemen anymore. You can already be your own bank and access financial services directly,” he said
Why XRP Ledger Was Chosen
Mekras pointed to XRP Ledger’s speed, low fees, and stability as top reasons for building on it. He added that compared to congestion issues seen in other networks, XRPL’s ability to settle transactions in seconds makes it suitable for mass adoption and real-time finance.
“Stick to the XRP Ledger and try to build something for consumers and like for retail”, he said.
Anodos is also preparing a crowdfunding round via Republic, allowing users to invest and gain equity exposure to the company. Mekras stated that the project avoids token-based fundraising and instead focuses on shared ownership through equity participation.
What This Signals for XRPL
The broader takeaway from the discussion is that XRPL is moving beyond institutional pilots into consumer-facing applications. With rising developer activity and new retail-focused platforms, the ecosystem is gradually expanding into everyday financial use cases.
According to the analysis, this shift reflects a wider trend: XRP Ledger infrastructure is no longer just about cross-border settlement, but about building full financial systems that individuals can directly use.
Bitcoin pulled back to retest $76,500 as support, but the long-to-short delta indicates bulls have a significant advantage if the range highs are reclaimed.
Bitcoin failed to overcome $79,000, but a potential bear trap formed as $1.4 billion in short positions face liquidation at $80,000. Will spot market demand be the trigger?
Bitcoin is pressing the upper boundary of a two-month ascending channel near $77,500, with the 4H MACD histogram turning negative at the trendline and the FOMC meeting on April 28 and 29 serving as the next major catalyst. This article…
US Representative Nick Begich has announced plans to rebrand the Bitcoin Act as the American Reserves Modernization Act (ARMA) in the next few weeks.
Speaking at the 2026 Bitcoin conference in Las Vegas, the Congressman said the move is intended to draw additional support from lawmakers for a Strategic Bitcoin Reserve similar to that of gold.
Begich seeks to rename the US Bitcoin Act to ARMA
Last year, Begich and Senator Cynthia Lummis introduced the Bitcoin Act, also known as the Boosting Innovation, Technology, and Competitiveness through Optimized Investment and Nationwide Bitcoin Act.
Aside from the naming and political strategy, ARMA differs from the Bitcoin Act in no other way.
Objectives include adding to the national Bitcoin reserve by purchasing 200,000 BTC annually for five years. These coins would be non-disposable for two decades, unless the sale is meant to reduce federal debt.
WHITE HOUSE ADVISOR SAYS A "BIG ANNOUNCEMENT" IS COMING FOR TRUMP'S STRATEGIC BITCOIN RESERVE
— The Bitcoin Conference (@TheBitcoinConf) April 27, 2026
Additionally, the Act mandates that the government make Bitcoin purchases using the Fed’s discretionary surplus fund or profits accrued from gold accumulation. Previously, much of the nation’s BTC reserves came from criminals’ seized assets or fines paid in cryptocurrency.
More details
Per the Act, all coins would be stored in secure cold storage facilities across the country to protect them from cyber threats.
Finally, the bill would uphold individuals’ custody of their crypto wallets to keep government interference at bay. This is strikingly different from South Africa’s draft regulations, which permit enforcement officers to compel individuals to hand over the private keys to their crypto assets.
Presently, the soon-to-be ARMA bill is in the Senate Banking Committee, awaiting a markup in May. If passed, the Treasury is estimated to begin its first official purchase of Bitcoin in Q4 2026. Beyond financial dominance, this “digital gold” would also provide an inflationary hedge for the nation.
Currently, the US government holds about 328,372 BTC valued at about $25.4 billion at the current BTC price of $77,357. This makes it the largest sovereign holder of Bitcoin globally, followed by China (about 190,000 BTC) and the UK (about 61,000 BTC).
Bitcoin (BTC) approached the $80,000 psychological barrier today but only reached a high of $79,420. What followed was a downward trend, with the price currently at $76,757 (-3.35%).
While no major news triggered this drop, sell pressure heightened following massive derivative liquidations in an over-leveraged market.
Bitcoin retracement from near $80K
Within an hour, crypto exchanges received a combined total of $1.35 billion in sell orders, with Binance accounting for the majority at $1.2 billion. For Bitcoin, the liquidations wiped out $112.66 million from long buyers in the past 24 hours.
It didn’t help the market that a fragile US-Iran ceasefire is still looming, coupled with failed peace talks. Infrastructural damage and closure of the Strait of Hormuz have created an economic crisis, with WTI crude oil price rising to $96.73/barrel.
That said, many analysts are convinced that Bitcoin’s price drop is typical of a bottom or near-bottom event, and that we should expect a strong rebound in the long-term.
The flip side
According to Michaël van de Poppe, historical patterns show rallies of up to 1300% in the two years following the Mayer Multiple Z-score falling below -1.5 standard deviations. This suggests that Bitcoin is significantly undervalued and historically “oversold” relative to its long-term average.
Having hit that same point in this cycle, the analyst is convinced of an upcoming bullish reversal, with $200K as the bear market bottom.
#Bitcoin has hit the ultimate accumulation trigger in this cycle.
It doesn't hit this trigger that often, but when it does, it gives a generational opportunity.
In previous cycles, these levels were hit at the actual bear market bottoms.
Bitcoin’s relative strength index (RSI) now reads 53.40, while the MACD (Moving Average Convergence Divergence) remains positive and rising. Both indicators point to a shift into the valued region and a resultant rise in buying pressure.
Additionally, Bitcoin investment products saw heightened demand last week with $933 million in inflows. BlakRock’s IBIT recorded a 9-day inflow streak of $983 million, marking its most dominant week in 6 months.
Even more, Congressman Nick Begich III has announced the revival of a Bitcoin strategic reserve as the US strives to position itself as a Bitcoin hub.
Lawmakers look to push election reform that would block crypto campaign donations, even as Canada expands oversight of stablecoins and digital asset markets.
Bitcoin accumulation by whales and institutional investors is reducing the available supply of BTC and potentially setting the stage for a rally above $80,000.
Crypto ATM operators and businesses hosting the machines have until July 1 to be in compliance with the new law or risk potential fines and prison time.
Ryan Lee, Chief Analyst at Bitget Research, says Bitcoin and Ethereum are supported by steady institutional ETF demand and lower leverage, with BTC expected to break $80,000 to $85,000 short term and ETH targeting $2,800 to $3,000. Bitget Research Chief…
dLocal (NASDAQ: DLO) has launched Stablecoin Full, a stablecoin payments solution that enables merchants to collect, convert, and pay out funds in stablecoins across more than 44 emerging markets through a single API. dLocal stablecoin payments went live on April…
Stablecoins have “quietly become core financial plumbing” and pushed on‑chain finance past a “point of no return,” according to a new a16z crypto framework that recasts programmable dollars as the base layer for a multi‑chain, banking‑as‑a‑service stack and a coming…
April 27 is the hard deadline for all Pi Network Mainnet node operators to upgrade to Protocol 22.1, with nodes still running v21.2 after today’s cutoff automatically disconnected from the Mainnet, and Protocol 23 now moved one week earlier to…
Pudgy Penguins has surged back above the $0.01 mark, regaining momentum as interest in Solana-based memecoins picks up. The volume increased by 240%, reaching over $520 million, pushing the market cap over $630 million. The move comes amid rising trading activity and renewed retail participation, pushing the PENGU price into focus as one of the standout performers in the current altcoin cycle.
But the key question now is, can this rally sustain, or is it another short-lived memecoin spike? With volatility increasing and momentum largely driven by sentiment rather than fundamentals, PENGU’s next move will likely depend on whether buying pressure continues or fades as quickly as it appeared.
The chart shows Pudgy Penguins forming a rounded bottom (cup pattern) after months of decline, indicating a gradual shift from selling pressure to accumulation. Price has now broken above short-term moving averages and is approaching a key resistance zone near $0.013–$0.014, which previously acted as a rejection area. The MA ribbon still shows longer-term resistance overhead, suggesting the broader trend has not fully flipped bullish yet.
Momentum indicators support the recovery. The RSI has climbed above 70, signalling strong buying pressure but also hinting at potential short-term overbought conditions. Volume has expanded significantly during the recent rally, confirming participation behind the move. If PENGU price breaks above the $0.014 resistance, it could complete the cup structure and open the path toward higher levels.
However, failure at this zone may lead to a pullback toward the $0.008–$0.009 support range, keeping the rally in a consolidation phase rather than a confirmed breakout. Pudgy Penguins is showing strong recovery signs after reclaiming $0.01, but the rally now faces a critical test near the $0.013–$0.014 resistance zone. A breakout above this level could confirm a trend reversal and open further upside, supported by rising volume and strong momentum.
The crypto treasury company continues to buy Ether and earn staking rewards, even as price swings leave billions in unrealized losses on its balance sheet.
The European Commission made its move in response to Russia's increasing reliance on crypto transactions to circumvent sanctions amid the country's war on Ukraine.
As Bitcoin miner IREN shifts toward AI cloud infrastructure, leveraging a Microsoft deal and GPU expansion, analysts expect mining revenue to decline over time.
The CFTC filed a lawsuit against New York on April 24 in the Southern District of New York, seeking a permanent injunction to stop the state from enforcing its gambling laws against federally registered prediction market exchanges. CFTC New York…
Ethereum has slipped back below $2,300, leaving traders to decide whether a fragile band between roughly $2,100 support and $2,350–$2,400 resistance is a simple shakeout or the prelude to a deeper retrace before any long‑promised run toward $4,000. Ethereum (ETH)…
The US Senate Banking Committee allowed April to close without scheduling a CLARITY Act markup, confirming the bill has missed its target window and pushing the legislative path entirely into May with fewer than four working weeks before the Memorial…
Florida Attorney General James Uthmeier announced a criminal investigation into OpenAI on April 21, alleging that ChatGPT advised the accused Florida State University shooter on what gun to use, what ammunition to load, and what time to arrive on campus…
More than 120 crypto organizations including Coinbase, Ripple, Kraken, and Andreessen Horowitz sent a joint letter to the Senate Banking Committee on April 23 demanding an immediate CLARITY Act markup, as the bill’s end-of-May deadline tightens and prediction market odds…
Senator Thom Tillis lifted his blockade of Kevin Warsh’s Federal Reserve nomination on April 27 after the Department of Justice dropped its criminal investigation into current Fed Chair Jerome Powell, clearing the path for a Senate Banking Committee vote on…
Bitmine crossed 5 million Ethereum tokens on April 27 after buying 101,901 ETH for approximately $236 million, making it the first company in history to hold more than 5 million ETH and the world’s largest corporate Ethereum treasury by a…
Strive Asset Management has raced from zero to 14,557 BTC in months, becoming the 9th‑largest public Bitcoin treasury and turning its balance sheet into a levered bet on BTC. Strive Asset Management has added another 789 BTC to its balance…
Jury selection opened on April 27 in federal court in Oakland, California, in the civil trial pitting Elon Musk against OpenAI and CEO Sam Altman over the company’s transformation from a nonprofit research lab into a for-profit enterprise worth approximately…
South Korea’s KBank signed a strategic partnership with Ripple on April 27 to test blockchain-based cross-border remittances, marking Ripple’s second Korean institutional deal this month and its first with a major Korean digital bank. Ripple KBank partnership was confirmed on…
Strategy acquired 3,273 Bitcoin for approximately $255 million on April 27, its fourth purchase in April 2026, lifting total holdings to 818,334 BTC worth roughly $63.7 billion. Strategy acquired 3,273 Bitcoin for approximately $255 million on April 27, according to…
Bitcoin has climbed roughly 25% from its lows, touching $79,500, but analyst Gareth Soloway says the easy money from this move has already been made.
The near-term target zone sits between $80,000 and $85,000. A push to $80,000 would represent just 3.5% upside from current levels. Even a stretch to $85,000 is only 8%. That limited reward has shifted Soloway’s stance from bullish to neutral.
The macro pattern on Bitcoin’s chart remains bearish, with a structure that historically resolves to the downside. If the current rally fails to break convincingly above $85,000 and hold there, Soloway warns the next significant target below is $50,000, a level where he expects meaningful support to emerge.
Above $85,000 sustained, the bearish pattern breaks and a genuine recovery toward all-time highs becomes possible. Below current support, the $50,000 scenario moves from tail risk to base case.
Ethereum: One More Move Before the Drop
Ethereum is tracing a three-touch trend line pattern that Soloway reads as having at least one more push higher before a more significant decline develops. The pattern has registered two confirmed touches. A third would complete the structure and likely mark a local top.
That potential upside in Ethereum is one reason Soloway keeps the door open for Bitcoin reaching $85,000. The two assets have been moving in loose correlation, and ETH showing continued strength would support the case for one more leg higher across the broader market before sellers take control.
XRP: Two Levels Define the Trade
XRP is the most direct setup of the three right now according to the analysis. The token has been trending higher and still has room to move, but faces a wall of resistance around $1.55, a level where multiple prior pivot highs converge with the upper boundary of a key price channel.
If XRP breaks through $1.55 cleanly, $1.80 becomes the next target quickly. That level carries importance as former support that flipped to resistance, making it the natural ceiling for any extended move.
Soloway holds a small XRP position with $1.80 as his exit target. A failure at $1.55 would likely trigger a pullback before any further attempt higher.
Cardano’s Charles Hoskinson has a message for the XRP community celebrating the Clarity Act as a victory for the industry: you are wrong, and the bill you are cheering for would have classified your token as a security if Ripple were founded today.
Speaking in an interview, Hoskinson said the Clarity Act in its current form, he argued, is not the regulatory clarity the industry needs. It is a piece of legislation that protects established incumbents while quietly making it impossible for the next generation of crypto projects to exist in America.
The Security Trap
Under the mature blockchain standard written into the current version of the Clarity Act, a new project has no viable path to escaping security classification. To pass the test, a project needs community growth, liquidity, and broad ownership distribution. But to achieve those things, it needs exchange listings and investment. And it cannot get either if it is classified as a security from day one.
“XRP won its court case under the ambiguous laws,” Hoskinson said. “Under this law, if Ripple was founded today, XRP would be a security. Ethereum would be a security. ADA would be a security. And a Gary Gensler-style SEC would have the law on their side.”
The very tokens whose communities are most loudly supporting the Clarity Act would not exist under the framework they are endorsing. The old ambiguity that everyone complained about was, in practice, what allowed those projects to grow before regulators could pin them down. This bill removes that ambiguity and replaces it with a default classification that benefits no one launching something new.
A Bill for the Incumbents
Hoskinson was explicit about who the Clarity Act actually serves. Cardano, XRP, and Ethereum would likely receive commodity status under the mature blockchain standard because they already satisfy the requirements. They are large enough, decentralised enough, and established enough to pass the test as it stands today. That is good for them. It is not good for the industry.
“It’s a bill for the incumbents,” he said plainly. “Cardano will get a pass. XRP will get a pass. Ethereum will get a pass. We’re already commodities under the mature blockchain standard. So it’s good for me. It’s horrible for the industry.”
The Democrats Will Weaponise It
The longer-term risk Hoskinson identified is political. The bill will not be permanent as written. At some point, a future administration with different priorities will have the ability to apply the same framework with maximum hostility toward new projects.
“When the Democrats weaponise it, they can structure it in a way that every new project will always be a security,” he warned. “And if being a security is not a problem, then why is Brian Armstrong fighting so hard for his stablecoin not to be?”
When $48 million in ETH gets unstaked, people notice. Not because the amount is huge relative to Ethereum’s total staked supply, but because large unstaking events raise questions that don’t have immediate answers. Is someone taking profit? Repositioning ahead of a catalyst? Preparing for a sell-off?
Nobody outside the wallets involved knows for certain, and that uncertainty is what makes traders start looking around.
The timing overlaps with reports of the Ethereum Foundation actively managing its ETH exposure, which adds another layer of “what’s going on” to an already watchful market. None of this means Ethereum is in trouble.
But it does create the kind of short-term hesitation where capital starts exploring alternatives, and presale crypto tokens consistently pick up attention during these windows.
What The Unstaking Actually Signals
Large unstaking events are usually about liquidity management rather than bearish conviction. Staked ETH is locked capital. Moving it out increases flexibility, whether that’s for rebalancing, covering obligations, or simply having dry powder available during uncertain conditions.
The market tends to read these moves as more dramatic than they are. But perception drives behavior, and when enough traders see big ETH movements and feel uneasy, some portion of capital rotates into positions that aren’t exposed to the same short-term uncertainty. That’s not panic. It’s portfolio management.
The best crypto presales in 2026 benefit from this dynamic not because Ethereum is weak, but because consolidation phases in large-cap assets naturally redirect attention toward earlier-stage opportunities.
Traders aren’t leaving ETH permanently. They’re putting a slice of capital somewhere with a different timeline while the ETH chart sorts itself out.
Leverage, Presale Structure, And Current Numbers
Leverage up to 1001x is available for traders who understand margin mechanics and liquidation math. That ceiling is extreme and should be treated as a tool for experienced traders, not a feature to experiment with using capital you can’t afford to lose.
TVX is priced at $0.015 in stage one, moving to $0.02 next round. Over $180,000 raised and more than 12 million tokens distributed so far. The participation pattern shows steady, distributed buying rather than one large wallet inflating the numbers, which is the healthier signal when evaluating presale crypto tokens.
The 34% presale allocation gives early participants a meaningful share of supply. Team tokens are vested, which structurally prevents the immediate post-listing dump that has destroyed value for early buyers in too many previous projects.
These details are easy to overlook when a presale headline catches your eye, but they’re the difference between tokenomics designed to protect participants and tokenomics designed to extract from them.
Wrapping Up
Ethereum isn’t going anywhere. A $48 million unstaking event is a footnote in the context of ETH’s total market, and the fundamentals supporting the ecosystem haven’t changed. But short-term uncertainty creates short-term behavior shifts, and those shifts are when presale crypto tokens get their most serious evaluation from traders who are actively thinking about portfolio construction.
TradeView’s presale fits that moment well. The platform is building real trading infrastructure, the tokenomics are structured thoughtfully, and the entry price reflects how early everything still is.
For traders watching ETH liquidity movements and wondering where to park a portion of capital during the uncertainty, it’s the kind of position worth evaluating on its own merits rather than dismissing because the headlines are focused elsewhere.
The new cryptocurrency debate shifted on April 24 when Michael Saylor declared the Bitcoin winter over, and market analyst Mati Greenspan agreed, calling the drop a pullback inside a broader bull market per CoinDesk. Bitcoin held $77,387 while Ethereum sat at $2,320, and both gained over the week as the indefinite ceasefire steadied risk appetite.
That confidence tells the new cryptocurrency market where large-cap attention sits, locked on coins already trading at recovery prices everyone expects. Bitcoin and Ethereum remain core holdings, yet capital is flowing toward early-stage entries with working products, and Pepeto has crossed $9.53 million during market fear with a Binance listing near.
Saylor Declares Bitcoin Winter Over as Institutions Keep Adding
Michael Saylor’s statement came the same week Bitcoin posted its best monthly performance in a year, with $5 billion in new USDT supply fueling the rebound per CoinDesk. Strategy confirmed a $1.3 billion April buying round, and BlackRock added another $292 million in BTC during the same window.
The pattern runs every cycle: institutional treasuries buy during fear, the price recovers, and the public enters after the move already happened. BTC dominance sits at 60%, meaning Bitcoin still controls the direction for every other asset.
Top Tokens and Presale Entries Competing for the Same Wallets: Bitcoin, Ethereum, and Pepeto
When the largest corporate buyers call the pullback finished and start buying at $78,000, the signal is clear: wallets that commit during downturns take the gains when the recovery arrives. Pepeto is built for holders who demand audited safety before they place money in any new cryptocurrency token. PepetoSwap runs as a zero-cost trading platform where every swap clears without fees.
The screener checks every contract before the buyer clicks confirm, rating each token with a clear safe or warning output that flags buried fees and fake project markers. Holders earn 178% APY staking while the listing date approaches.
These tools turn every new cryptocurrency buy into an audited process rather than a guess, and that is exactly why over $9.53 million came in while the rest of the market fell.
Every cycle rewards the wallets that committed early and stayed. The original Pepe (PEPE) creator matched the 420 trillion token supply with every contract audited by SolidProof, and analysts project Pepeto at $0.0000001866 could hit 100x if the expected Binance listing goes live.
Bitcoin (BTC) Price at $77,387 as Saylor Declares Winter Over
Bitcoin (BTC) trades at $77,387 after recovering from $65,000 lows during the Iran crisis, a 20% rebound that still leaves BTC 38% below the October 2025 all-time high of $126,198 per CoinMarketCap.
Resistance holds at $80,000 after BTC failed at $79,388 on April 23. Even reaching the ATH delivers 61% upside, a return that takes months on a $1.33 trillion asset.
Ethereum (ETH) Price at $2,320 as Bitmine Treasury Hits $11.5 Billion
Ethereum (ETH) sits at $2,320 after Bitmine Immersion Technologies reported a 4.98 million ETH treasury worth $11.5 billion, including 101,627 ETH bought in one week per CoinDesk.
Standard Chartered carries a $7,500 target for 2026. Reaching the August 2025 ATH of $4,953 from here delivers 113% upside, a strong return for a $233 billion asset, but the timeline stretches across months while a presale entry closes that gap in a single listing event.
Conclusion:
Every cycle delivers winners who spotted the right new cryptocurrency entry during fear and cashed in when the market turned. Saylor declared the winter finished, Strategy loaded a multi-billion dollar BTC position, and Bitmine added $11.5 billion in ETH, all while fear controlled the headlines.
The Pepeto official website shows a presale one listing away from closing this entry forever, with the original Pepe creator building again alongside a working trading platform, a SolidProof-cleared contract, and 178% APY staking that grows every day. Entering now means catching the setup that history confirms: meme coins and early presales have beaten every other asset class in crypto. The presale is in its final stage, and what follows next is the expected Binance listing.
What new cryptocurrency has the best potential compared to Bitcoin (BTC) and Ethereum (ETH)?
Pepeto offers presale distance to 100x through an approaching Binance listing, while Bitcoin and Ethereum target 61% and 113% upside to their all-time highs from current levels. Over $9.53 million raised shows strong early commitment at $0.0000001866.
Why did Michael Saylor say the Bitcoin winter is over and what does it mean for the Pepeto presale?
Saylor’s April 24 statement backed a $1.3 billion Strategy buying round and coincided with Bitcoin’s best month in a year per CoinDesk. Pepeto at $0.0000001866 with 178% APY staking sits in the same recovery window but offers new cryptocurrency return math that large caps at trillion-dollar levels cannot deliver.
Elon Musk and Dogecoin are permanently linked in crypto’s cultural memory, and probably always will be. Every few months the question resurfaces: is he still backing DOGE? The honest answer is that it doesn’t matter as much as it used to.
Musk’s tweets still move the chart for a few hours, but the reflexive 30% pumps of 2021 have shrunk to modest blips that fade by the next news cycle.
That fading influence isn’t a DOGE problem specifically. It’s the market growing up. Traders who once allocated based on what a billionaire posted are increasingly splitting their attention between meme assets they understand culturally and presale crypto tokens they can evaluate structurally.
DOGE projections for 2026 land in a wide band depending on who you ask. Conservative estimates sit between $0.12 and $0.20. More optimistic forecasts push toward $0.25 on the average, with bullish scenarios suggesting a run at $1 if external catalysts align, particularly the 21Shares Dogecoin ETF filing that’s generated considerable speculation.
The $1 target is technically possible but requires a combination of events that nobody can predict with confidence: ETF approval, renewed retail mania, sustained Musk engagement, and a broadly supportive macro environment all arriving in the same window. Betting a portfolio on that alignment is hope dressed as strategy.
What’s more useful is acknowledging that DOGE’s growth path depends almost entirely on factors outside the project’s control. Sentiment, influencer activity, ETF decisions.
TradeView’s Record Presale Numbers
While DOGE traders wait for the next catalyst, TradeView’s presale has been quietly building momentum toward record participation. The numbers aren’t massive by crypto standards, but steady accumulation from distributed buyers signals organic interest rather than manufactured hype.
$TVX is priced at $0.015 in stage one, stepping to $0.02 next round. Over $180,000 raised and more than 12 million tokens distributed. The best crypto presale list in 2026 includes projects showing exactly this pattern: consistent participation, reasonable raise targets, and tokenomics that don’t collapse under scrutiny.
The 34% presale allocation is meaningfully larger than what most projects offer early participants. Team tokens are vested. Zero transaction tax. These are structural decisions that protect buyers, and they’re the first things experienced presale evaluators check before looking at anything else.
Features That Define TradeView
The platform bundles capabilities that most DEXs either don’t offer or spread across multiple disconnected tools:
Up to 1001x leverage tiered by risk tolerance, for traders who understand what that means for their liquidation math
AI-powered bots analyzing price patterns, volume, and cross-exchange signals around the clock
Social trading where users follow experienced traders and watch positioning happen live rather than hearing about it after the fact
One-click execution that cuts the delay between decision and action during volatile moments
Non-custodial architecture keeping assets in the user’s wallet throughout
On-chain settlement making every trade verifiable and transparent
Each feature individually exists somewhere in the DEX landscape. Having all of them in a single mobile-first interface is what makes the product thesis coherent rather than just a feature checklist assembled for the presale page.
Wrapping Up
Elon Musk may or may not be backing Dogecoin in 2026. The honest answer is that his involvement has become less decisive for DOGE’s price action than it was three years ago, and the market’s reduced sensitivity to celebrity influence is probably a sign of maturation rather than weakness.
DOGE will continue doing what DOGE does: moving on sentiment, rewarding good timing, and punishing late entries. TradeView’s presale offers a structurally different position, one where the investment case rests on product adoption and trading infrastructure rather than waiting for someone famous to tweet.
Both belong in a diversified crypto portfolio. The traders who recognize that meme exposure and infrastructure exposure serve different purposes, and size each position accordingly, are the ones building portfolios designed to perform across multiple scenarios rather than just one.
The UMXM price is sprinting today. In a market that usually needs weeks to build momentum, Manadia managed to compress that into days, pushing from roughly $1.15 to the doorstep of $2.00. That’s not organic drift. That’s aggressive demand kicking the door open.
And yeah, there’s a story behind it because there’s always a story when price moves this fast.
AI narrative meets liquidity, market bites fast
Manadia isn’t pitching itself as another forgettable Web3 token. It’s going after something bigger which is an AI infrastructure. Specifically, a data settlement and coordination layer that lets AI agents interact with both on-chain and off-chain systems through verifiable execution.
Sounds ambitious. The market seems to think it’s investable. The timing didn’t hurt either. A listing this week on Kraken on April 23, 2026 injected the kind of liquidity these moves usually need. Then came Bitget, where UMXM casually grabbed the 1st spot top gainer. That’s retail attention, plain and simple.
Throw in the “paywithmana” integration which is tying autonomous AI coordination with verifiable data settlement and suddenly the narrative has teeth. Not proven, but compelling enough for traders to pile in.
UMXM price hits psychological resistance at $2 level
Now here’s where things get interesting. The UMXM price has slammed straight into the $2.00 psychological barrier. It briefly tapped near that level before easing back to around $1.9468. That tiny red candle? That’s not weakness but it’s hesitation. Profit-taking. Reality checking hype.
But let’s not sugarcoat it. Big round numbers like $2.00 tend to act like magnets and walls at the same time. Breaking them cleanly usually requires sustained demand, not just a burst of enthusiasm. So far, the market’s knocking. Hard.
Parabolic rally leaves EMA far below price
Here’s the part bulls don’t like hearing. The rally has gone vertical, and the EMA which is sitting around $1.5346 is still lagging way behind. That gap? It’s a classic sign of overextension. Price moved too far, too fast.
Now, that doesn’t mean it crashes tomorrow. But it does mean the market is stretched.
In these setups, one of two things usually happens. Either price consolidates sideways to let the EMA catch up, or it snaps back down toward that mean. There’s no polite way markets handle imbalance.
Momentum strong, but sustainability still uncertain
So, what now? If demand keeps flowing probably fueled by the AI + Web3 narrative then the odds suggests that the UMXM price could break above $2.00 and enter a clean price discovery phase. That’s where things tend to get irrational, fast.
But let’s be real. Moves like this rarely go straight up forever. A pullback toward the $1.50 zone wouldn’t be surprising in fact it would be healthy.
Right now, the trend is bullish. No debate there. But sustainability? That’s still being negotiated in real time.
The XCN and LUNC price action are today in focus as they snapped today. Two completely different catalysts, one common outcome that’s bullish price action one saw freedom from long-dead bearish trends getting steamrolled in a matter of hours that’s XCN for you.
On the other token, you’ve got a courtroom narrative breathing life this week into Terra Classic. So, there are different stories, but same chaos. And markets love chaos when it pays.
Legal drama ignites LUNC price breakout momentum
Let’s start with LUNC, because this one’s less about charts and more about unfinished business.
The trigger? A lawsuit filed by the Terraform Labs Plan Administrator against Jane Street, alleging market manipulation tied to the infamous 2022 de-pegging event. That single move flipped sentiment from passive despair to something closer to cautious optimism that’s boosting its price this week.
Call it a “justice rally,” call it hope either way, it worked. And results are constructed on chart.
Price didn’t hesitate. LUNC price blasted through a descending trendline that had been weighing it down since late 2025. No slow grind, no hesitation just a breakout slicing through every major EMA in sight mostly got power post mid-april.
Now trading around $0.00006048, the token has done something technically significant: it turned the 200-day EMA at $0.00004728 from resistance into support. That’s not noise. That’s a shift.
Sure, the move looks overheated in the short term. It usually does after vertical candles like that. But if this legal narrative sticks around, the market’s already eyeing that $0.00008000 zone from late 2025.
Upbit listing sends XCN price into frenzy
Now flip the script. While LUNC leans on courtroom drama, XCN went full throttle on liquidity. The Upbit listing, one of the most famous listing news that has brought results on most crypto’s that it listed in past couple of months, for instance today’s listing of XCN in KRW and USDT pairs waked up.
And when it woke up, it ran. From $0.0048 to $0.0085, the move was sharp, fast, and honestly, predictable if you’ve seen enough “Upbit pumps.” These listings don’t gently nudge price as they reset entire structures.
The XCN price reaction followed the textbook playbook: sudden breakout, heavy volume, and a complete shift in short-term sentiment.
Short squeeze chaos confirms XCN structural shift
But here’s where it gets interesting. Derivatives data shows volume exploding by over 11,000%. That’s not organic growth but clearly that’s a flood. Open positions piled in, and then came the squeeze.
Roughly $172.92K in short liquidations got wiped out as price surged past the 20 and 50-day EMAs. Traders betting against the move didn’t just lose they got forced out.
Now XCN/USD is staring down its 200-day EMA around $0.0065, a level that tends to separate hype from actual trend reversal.
XCN and LUNC price shifts rewrite near-term outlook
So, what’s the takeaway? Well, not a clean one. The XCN and LUNC price moves aren’t driven by the same fundamentals, but they’re telling a similar story and that is localized catalysts are overpowering broader market direction.the
LUNC has a narrative. XCN has liquidity. Both now have momentum. Whether that momentum sticks? That’s where things usually get messy.
Canada’s new C$25B Canada Strong Fund aims to back “nation‑building” projects, but crypto circles instantly seized on one question: will Ottawa ever buy Bitcoin? Canada’s new government is launching the Canada Strong Fund, a national sovereign wealth fund seeded with…
Cloud mining grows in 2026 as investors seek low-cost access to Bitcoin, Dogecoin, and Litecoin mining. As we enter 2026, cloud mining remains a highly prominent method of participation within the cryptocurrency market — particularly appealing to users who wish…
Coinbase says stablecoins settled $33T in 2025, eclipsing Visa’s $16.7T and turning on‑chain dollars into the internet’s real‑time, low‑fee payment backbone. Coinbase’s official account ignited a fresh round of payments‑wars discourse on X with a comparison thread claiming that “$33T…
Solana lends USDT to Aave and onboards AAVE after the KelpDAO exploit, as SOL chops in the mid‑$80s and markets ask if “DeFi United” can reignite the trend. Over the last 3–12 hours, SOL has traded roughly in the mid‑80s,…
Circle Ventures snaps up AAVE days after a $293M KelpDAO exploit, shoring up Aave’s bad‑debt shock while Washington weighs a landmark US stablecoin bill. Aave governance is bracing for another high‑stakes vote as a proposal to pause $AAVE buybacks until…
Circle Ventures snaps up AAVE days after a $293M KelpDAO exploit, shoring up Aave’s bad‑debt shock while Washington weighs a landmark US stablecoin bill. Circle Ventures’ decision to accumulate $AAVE tokens sparked immediate debate on Crypto X after CoinDesk described…
Trump’s second Mar‑a‑Lago TRUMP memecoin gala goes ahead as the token crashes, turning “exclusive” on‑chain access into a cut‑rate lesson in political token risk. The second annual Trump memecoin conference at Mar-a-Lago proceeded on April 25 even as the president’s…
Tether has launched an open-source Mining Development Kit that collapses Bitcoin mining’s fragmented hardware dashboards into a single JavaScript and React-based stack. Tether pushes deeper into mining software stack Stablecoin issuer Tether has launched a new open-source Mining Development Kit…
A new Blockchain for Europe report says MiCA has made euro stablecoins safer but less competitive, and urges targeted reforms to reserves and remuneration.
The Block taps ex‑Azuki COO Steve Chung as CEO and takes another $10M from Foresight Ventures, doubling down on an institutional data, research, and AI‑driven media pivot. The Block’s decision to install former Azuki COO Steve Chung as CEO, backed…
Onchain IP turns static, illiquid rights into transparent, tradable assets, letting games like My Pet Hooligan convert fans from passive consumers into real economic stakeholders The entertainment industry has long treated intellectual property like the paranoid owner of a rare…
Pi Network price rallied over 6% in the past week as anticipation for its upcoming mainnet upgrades spurred demand for the token. According to data from crypto.news, Pi Network (PI) price rallied from a weekly low of $0.166 to $0.186…
Consensys and Joseph Lubin pledge up to 30K ETH to DeFi United’s rsETH rescue stack, shoring up Aave and DeFi after Kelp DAO’s $293M exploit left deep collateral holes. Ethereum infrastructure firm Consensys and its founder Joseph Lubin have joined…
WhiteBIT and FC Barcelona sign five-year deal to advance fan engagement and digital finance innovation. WhiteBIT, the largest European cryptocurrency exchange by traffic, and FC Barcelona have entered a landmark five-year agreement through 2030, bringing together two global leaders to…
Whale pulls 72K HYPE off Gate.io, expanding a $168M stash as spot buyers face off against crowded leveraged shorts around the key $40 support zone. A crypto whale controlling the address 0xEe0A18B394ecE1D7bE81Be15d6cEc3Ac7707b71C has withdrawn 72,264 HYPE from centralized exchange Gate.io,…
SwapSpace’s CBDO, Vasily Shilov, highlights market trends and industry direction following EthCC and Paris Blockchain Week insights. In April, the SwapSpace team attended two major crypto events: EthCC and Paris Blockchain Week. The company’s CBDO, Vasily Shilov, shared some insights…
AAVE price is stabilizing after a recent selloff, with downside pressure fading as buyers defend the $90–$95 support zone. The drop followed short-term negative sentiment, but the move failed to extend, and price has since begun to recover.
At the same time, fresh developments are shifting the narrative. AAVE’s expansion onto Solana and a $20 million liquidity push are reinforcing confidence, bringing renewed participation into the market. With AAVE price now holding above its base and tightening below resistance, the structure is transitioning from weakness into a setup phase where the next move becomes critical.
AAVE Expands to Solana Ecosystem
AAVE’s deployment on Solana via Sunrise extends its accessibility across a high-activity DeFi environment. This integration enables native interaction across wallets, decentralized exchanges, and aggregators, allowing liquidity to move more efficiently across chains.
By tapping into Solana’s user base, AAVE expands its demand surface beyond its existing ecosystem. Such cross-chain expansion typically strengthens long-term participation, as it diversifies liquidity sources and reduces reliance on a single network.
$20M Liquidity Boost Supports Market Stability
AAVE’s ecosystem has also received a $20 million liquidity injection tied to Justin Sun and associated participants. This capital improves market depth and helps absorb volatility, particularly during recovery phases. Increased liquidity reduces downside fragility and allows price to stabilize more effectively after sharp moves.
Together with ecosystem expansion, this strengthens the broader positioning of AAVE as the market transitions out of its recent weakness.
AAVE Price Faces Key Breakout Test Near $110 After Stabilization
Following the selloff, AAVE price dropped into the $90–$95 demand zone, where selling pressure began to weaken and buyers stepped in. Since then, AAVE price has stabilized between $95 and $100, forming higher lows while compressing beneath a descending resistance trendline from the $140–$150 region. This creates a tightening structure, where price is building pressure below resistance.
The immediate resistance lies at $110–$115. A sustained move above this zone would confirm a structural shift, opening the path toward $130 and potentially $140–$145 if momentum strengthens. Momentum indicators support this recovery phase. RSI has moved back toward neutral levels around 47–50, indicating that bearish pressure has cooled without entering overbought conditions. Volume has also shown early signs of expansion during recovery attempts, reflecting improving participation.
On the downside, the $90 level remains critical. A breakdown below this zone would invalidate the recovery structure and shift AAVE price back into a broader consolidation range.
AAVE Price Eyes Recovery Continuation if $90 Support Holds
With selling pressure absorbed and structure stabilizing, AAVE price is now positioned for a potential continuation of its recovery. Holding above $90 keeps the setup intact, while a breakout above $110 would confirm a move into higher resistance zones. With improving participation and supportive developments, the bias remains tilted toward gradual upside as long as key support holds.
The crypto market is entering a new phase where altcoins may soon follow Bitcoin’s recent rally. While Bitcoin has already broken key resistance levels, many altcoins are still lagging.
Well-known crypto analyst Michael van de Poppe has pointed out several top altcoins that could be ready for a strong move.
Here are the altcoins he believes are worth watching now.
Arbitrum (ARB) Looks Undervalued
Arbitrum (ARB) emerges as one of the most-watched altcoins. Van de Poppe pointed to improving on-chain activity while the token price remains weak. Key metrics like total value locked (TVL), stablecoin liquidity, transaction activity, and trading volume are still holding up well. This shows that real usage on the network has not slowed down.
At the same time, Arbitrum’s revenue and fees are continuing to grow. Some analysts believe it could generate around $100 million to $200 million annually if the market improves.
From a technical view, the chart is also turning positive. ARB was around $0.26 in April 2025, but now trades near $0.126.
That gap between usage and price suggests the token may be undervalued. He believes if momentum continues, ARB could recover toward the $0.25 level.
Bittensor (TAO) and the AI Narrative
Another token on his radar is Bittensor (TAO), which is linked to the growing AI sector. Bittensor runs as a marketplace for artificial intelligence work, giving it a unique role in crypto.
TAO recently faced pressure after internal network issues affected sentiment. The price dropped from around $350 to nearly now trading at $249.
However, Van de Poppe said these types of corrections can create opportunities if the project continues improving. With AI still a major global trend, TAO remains one to watch if confidence returns.
NEAR Could Be Close to Breakout
He also highlighted NEAR Protocol. NEAR is showing good short-term strength and is trading around $1.37.
Recent updates include “Confidential Intents” for private cross-chain transfers, support for Tether Gold (XAUT), and progress in AI tools through “IronClaw.”
According to him, NEAR has tested an important resistance level many times, which can mean a breakout is getting close. If that happens, he believes NEAR could rise toward the $2.20 to $2.50 range.
The overall trend suggests that Bitcoin is leading the market, and altcoins may follow soon. If Bitcoin continues to hold strong, capital could rotate into altcoins, triggering the next phase of the rally.
Banking Circle has rolled out institutional stablecoin settlement services after securing regulatory approval in Luxembourg. According to a Monday announcement from the Luxembourg-based bank, the expansion follows its April 15 registration as a Crypto Asset Service Provider with the country’s…
Hyperliquid rose over 10% this week, reclaiming the $40 support level amid a surge in commodities futures trading on the platform. According to data from crypto.news, Hyperliquid (HYPE) price rose from a $39 low on Wednesday last week to an…
AI cloud mining gains traction in 2026 as SHRMiner expands access to low-cost Bitcoin earning for beginners. Exploring passive income through cryptocurrency mining without investment has become one of the fastest ways to grow your assets in 2026. As Bitcoin…
China has blocked Meta’s $2 billion acquisition of AI startup Manus, forcing the U.S. tech company to abandon a deal that had already been completed months earlier. According to China’s National Development and Reform Commission, the cancellation order was issued…
Kbank partnered with Ripple to test blockchain-based overseas remittances as South Korean companies prepare for new stablecoin and digital asset rules.
Banking Circle's stablecoin settlement launch follows its CASP approval, entering a crowded market with SocGen, Sygnum and a 12-bank euro stablecoin consortium.
The XRP price has been stuck in a range between $1.41 and $1.44 for the past few days. The volume is on the rise while the volatility has decreased to a large extent, which creates a significant mismatch, suggesting big players are still active, absorbing the liquidity. Currently, XRP is holding steady as the broader crypto market shows mixed momentum, but unlike other altcoins, it has yet to make a decisive move. Price action remains compressed within a tight range, signaling a phase of consolidation rather than clear trend direction.
This raises a key question: is XRP building pressure for a breakout or simply lacking the catalyst needed to move? With volatility declining and participation still limited, XRP appears to be in a waiting phase, where the next major trigger could define its direction.
XRP Price Analysis: Compression Builds Near Key Levels
XRP is currently consolidating around the $1.36–$1.41 range, holding just above an ascending trendline that has been acting as dynamic support since April. This suggests buyers are gradually stepping in at higher levels, preventing deeper downside despite broader market uncertainty. At the same time, price continues to struggle at the 0.236 Fibonacci level at $1.426, which has made this range a pivotal barrier to break.
The MACD shows a drop in the buying pressure while the levels are heading towards a bearish crossover, hinting towards more downfall. However, the 50-day MA is offering a strong base that could prevent extended bearish action. The current move remains weak and lacks strong follow-through, while the volume remains relatively muted. This indicates that the XRP price is still in a waiting phase rather than a confirmed trend. Currently, the price is building pressure between the resistance and support zones, which often sets up a breakout, but the direction may depend on the next catalyst.
What’s Holding XRP Back Right Now?
Despite holding structure, XRP is not attracting strong follow-through demand, and the reasons are more structural than technical. First, there’s no fresh catalyst. Unlike other altcoins benefiting from ecosystem growth or news-driven momentum, XRP is still tied to its broader narrative around regulation and institutional use. Without a new development, the price remains stuck in a waiting phase.
Second, capital rotation is favoring other altcoins. Tokens with active narratives—whether infrastructure plays like LINK or ecosystem-driven coins—are currently drawing more attention, leaving XRP relatively underallocated in the short term. Third, volume and participation remain muted. The recent price action shows low conviction from both buyers and sellers, which explains the tight consolidation. Until volume expands, XRP is likely to remain range-bound.
In short, XRP isn’t weak—it’s just lacking a trigger, and that’s what’s keeping the price compressed despite a stable structure.
What Could Trigger the XRP Price Rally?
XRP price remains in a consolidation phase, holding above $1.36 support while facing resistance near $1.42–$1.50, with no decisive breakout yet. The structure suggests pressure is building, but the next move depends on a clear catalyst. A breakout above $1.50 with strong volume could push XRP toward higher levels, while failure to hold $1.36 may trigger a move back toward $1.10–$1.20 support.
At the same time, XRP’s muted momentum reflects a lack of immediate drivers. A surge in volume, broader altcoin strength, or any regulatory or institutional development could act as the trigger needed to break this range. Until then, XRP remains in a waiting phase, where direction will be defined by whichever side gains control first.
Strategy purchased 3,273 Bitcoin worth about $255 million at an average price of $77,906 per coin. The company now holds 818,334 BTC bought for around $61.8 billion in total. Its average purchase price stands at $75,537 per Bitcoin. The company also reported a 9.6% Bitcoin yield so far in 2026. The latest purchase shows Strategy is continuing its aggressive Bitcoin accumulation strategy despite market volatility, reinforcing confidence in Bitcoin as a long-term treasury asset.
An emergency fund is a reserve of capital designed to cover unexpected expenses. Its defining feature is immediate availability. Returns are secondary. In crypto, this requirement introduces a constraint: many yield products restrict access through lock-ups or withdrawal conditions. A liquid structure is possible when assets, access conditions, and platform design are aligned.
Clapp, a regulated crypto investment platform that combines wallet, savings, and fiat access in one system, provides a framework where emergency funds can remain accessible while generating yield.
What Makes an Emergency Fund Usable
A functional emergency fund meets four criteria:
Immediate access: funds can be withdrawn at any time
Capital stability: value does not fluctuate materially in the short term
No withdrawal penalties: access does not reduce principal or yield
Operational simplicity: funds are available without additional steps
If any of these conditions are not met, the fund may fail at the moment it is needed.
Why Many Crypto Savings Products Fall Short
A large share of crypto yield products prioritizes returns over usability. Common limitations include:
fixed-term lock-ups
staking periods with delayed withdrawals
tiered rates tied to token holdings
withdrawal limits or access windows
These structures are designed for long-term allocation. They do not support emergency use cases.
Market behaviour in 2026 shows a shift toward liquidity-focused products, where access is treated as a primary requirement rather than a trade-off for yield.
Structuring a Liquid Emergency Fund With Clapp
A liquid setup depends on asset selection and access conditions.
Stable Assets
Emergency reserves require price stability. Stablecoins such as USDC and USDT, along with fiat balances like EUR, reduce exposure to market volatility. This ensures predictable value.
No Lock-Up Conditions
Funds must remain fully accessible. Fixed-term products, even when offering higher rates, do not meet emergency fund requirements.
Instant Withdrawals
Access should be continuous. Funds must be available 24/7 without delays or approval processes.
Yield Without Restrictions
Flexible savings allow funds to earn interest while remaining accessible. Interest is calculated daily and compounds automatically.
Clapp Flexible Savings follows this model. Funds remain liquid, interest is credited daily, and withdrawals are available at any time without lock-up constraints.
Practical Setup Using Clapp
A structured allocation improves reliability.
Example: 10,000 USDT emergency fund
8,000 USDT allocated to Clapp Flexible Savings
2,000 held USDT as an immediately available balance within the Clapp wallet
This allocation reflects typical usage patterns. Most emergency funds are not deployed at once. They are accessed incrementally.
Under normal conditions, the 8,000 USDT generates yield continuously. Clapp offers a 5.2% APY for stablecoins, so:
Clapp imposes no restrictions on withdrawals, and interest compounds automatically.
*These figures are illustrative and based on assumed rates for explanatory purposes. Actual returns may vary depending on market conditions, asset selection, and platform-specific rate adjustments. Interest rates are not guaranteed and can change over time.
Real-World Scenarios
Unexpected Expense
A €2,500 expense arises. Funds are withdrawn instantly from the Clapp balance. No asset sales are required. No delays occur.
Income Disruption
A freelancer experiences a temporary drop in income. The emergency fund covers living expenses. The remaining balance continues to generate yield within flexible savings.
Market Volatility
Crypto markets decline. The emergency fund remains stable due to its allocation in stable assets. No forced liquidation occurs.
Crypto vs Traditional Emergency Funds
Factor
Bank Savings
Clapp-Based Emergency Fund
Access
Immediate
Immediate
Yield
Low
Higher (variable)
Flexibility
High
High
Operational flow
Separate systems
Unified
A Clapp-based structure integrates savings, liquidity, and access within one system, reducing the need for transfers between institutions.
How Clapp Supports Emergency Fund Requirements
Clapp integrates the key components required for a liquid reserve:
support for stablecoin and fiat balances
flexible savings with daily interest and no lock-up requirements
instant withdrawals at any time
low minimum deposit thresholds
Funds remain within one environment, which reduces operational friction and ensures consistent access.
Risks and Considerations
Emergency funds require a conservative approach.
Stablecoin risk: depends on issuer stability and reserves
Platform risk: funds are held within a service provider
Regulatory environment: varies by jurisdiction
Diversification across assets and liquidity sources can reduce exposure to these risks.
Final Assessment
A crypto-based emergency fund is viable when structured around liquidity. Stable assets, unrestricted access, and flexible yield mechanisms form the foundation.
Clapp supports this structure by combining daily yield with immediate access, allowing funds to remain both functional and productive. The defining variable remains unchanged: the certainty that capital is available when required.
Well-known crypto analyst Michael van de Poppe believes Bitcoin could be preparing for new all-time highs later in 2026. After recently hitting a 12-week high, Bitcoin saw a small pullback but is now trying to reclaim the $80,000 level.
The sharp recovery has caught many traders by surprise, and now van de Poppe believes BTC will hit around $150k to $160K.
Here’s how high he believes Bitcoin could go in the coming months.
Is the Bitcoin Bottom Already In?
In a recent YouTube video, Michael van de Poppe believes Bitcoin is entering a key phase where long-term growth could follow. After dropping near $60,000 earlier in February, the price has bounced back strongly, surprising many traders.
This kind of recovery is not unusual. Markets often move against public sentiment.
One key signal he pointed to is the Sharpe ratio, a tool used to measure risk compared to return. Current levels look similar to past bear market bottoms seen in 2015, 2018, and 2022.
These readings often suggest Bitcoin is undervalued and may offer a better risk-reward setup for investors. While short-term pullbacks can still happen, the overall structure points toward long-term strength.
Bitcoin vs Gold Rotation
Another factor Poppe highlighted is the relationship between Bitcoin and gold. He believes money often rotates between both assets as investors look for stores of value.
When gold rises sharply, Bitcoin can lag for some time. But once gold peaks, Bitcoin has often started outperforming later. He also noted Bitcoin’s valuation against gold has reached one of its lowest levels ever, something previously seen near past market bottoms.
Bitcoin To hit New ATH: $150K–$160K
Based on past cycles, he said Bitcoin could rise 30% to 50% within three months after a confirmed low. According to the poppe analysis, $79,000 is a crucial resistance level.
If Bitcoin breaks above it, the next target range could be between $86,000 and $95,000. A further breakout may push prices toward $110,000 over the next six months.
Looking further ahead, Bitcoin could reach between $150,000 and $160,000, setting new all-time highs by late 2026 if the trend continues.
On the downside, $73,500 is an important support level. If this level holds, the uptrend remains intact. If it breaks, Bitcoin could retest lower levels before moving higher again.
Onyxcoin price has moved into a new range after surging over 50%, with the Upbit listing bringing fresh liquidity into XCN price action. Instead of reacting with a short-lived spike, the move held above resistance, indicating that buyers are stepping in at higher levels. This shift reflects a transition in market behavior, where demand is no longer waiting at lower zones. With XCN price maintaining strength after the breakout, attention now turns to whether this structure can carry forward into the next phase.
Upbit Listing Sparks Liquidity Shift for XCN Token
The Upbit listing introduced a new layer of demand, and the impact is visible in how the XCN price now reacts to market pressure. As access expanded, buying activity shifted from passive accumulation to active participation, lifting the Onyxcoin price directly through resistance levels.
ONYXCOIN SURGES 50% AFTER UPBIT LISTING
Onyxcoin $XCN has rallied sharply following confirmation of its Upbit listing. The token jumped about 50% in the last 24 hours.
At peak, gains extended beyond 64% after the announcement.
This change in order flow allowed price to establish itself in a higher range instead of rotating back into previous zones. Such transitions typically mark the beginning of price discovery, where liquidity moves with the trend rather than waiting below it.
How the Breakout Resets Onyxcoin Price Trend
Before the listing-driven move, the Onyxcoin price remained confined within a defined consolidation range, with repeated rejection limiting upside. That structure has now changed. The breakout pushed the XCN price above this range and, more importantly, held it there. The absence of a return to prior levels indicates that the market has accepted a new value zone.
Pullbacks are now being absorbed within this higher range, showing that demand is adjusting upward rather than retreating. This is how a market transitions from accumulation into expansion. With the structure reset, the focus shifts to how the XCN price behaves around its new base. The $0.0060–$0.0065 zone now acts as immediate support. Holding above this level keeps the breakout intact and maintains the current structure.
On the upside, the recent high near $0.0085 becomes the next area of interest. A sustained move above this zone would extend the range, opening the path toward the $0.010–$0.012 region. A move back below support would weaken momentum, but as long as the Onyxcoin price holds above the breakout zone, the structure remains aligned with continuation.
Derivatives Activity Signals Rising Participation
The shift in the Onyxcoin price is supported by broader market participation. As the XCN price advanced, derivatives activity expanded alongside it, with volume surged 10882% and open interest around 430% to $8.60M. This reflects new positions entering the market rather than reactive short covering.
At the same time, positioning remains balanced, allowing the move to develop without immediate signs of excess. This type of participation typically supports continuation, provided liquidity remains consistent.
XCN Price Outlook: Can the Breakout Sustain?
With the breakout holding, the Onyxcoin price remains supported above the $0.006 zone, keeping the current structure intact. A move above $0.0085 would confirm continuation toward the $0.010–$0.012 range, while a drop below support would shift the XCN price back into consolidation. For now, the trend remains aligned higher as long as the base holds.
Chainlink is gaining renewed attention as its ecosystem expands beyond crypto-native use cases into mainstream financial infrastructure. Recent integrations with platforms like Amazon Web Services (AWS) and Coinbase are positioning Chainlink as a critical layer for delivering real-world data to blockchains.
But while adoption is accelerating across institutional and enterprise platforms, LINK’s price action has remained relatively muted. This raises a key question: is the market underpricing Chainlink’s growing role in the future of tokenized assets and on-chain finance?
Institutional Adoption is Exploding
Chainlink’s latest integrations highlight its push into real-world infrastructure, moving beyond traditional oracle use cases.
AWS Marketplace integration: Chainlink services are now accessible through AWS, allowing developers and enterprises to easily integrate blockchain data feeds into applications. With AWS controlling a significant share of global cloud infrastructure, this opens the door for broader enterprise adoption.
Coinbase DataLink integration: Coinbase is leveraging Chainlink to bring real-time trading data on-chain, improving transparency and enabling more reliable decentralized applications.
These developments signal a shift: Chainlink is no longer just a crypto tool; it is becoming foundational infrastructure connecting traditional finance, cloud services, and blockchain networks.
Chainlink Price Analysis: Building Pressure for a Breakout?
Chainlink is currently consolidating within a symmetrical triangle pattern, with price compressing between higher lows near $8.10–$8.30 and resistance around $9.40–$9.50. This tightening range typically signals a volatility expansion ahead, as buyers and sellers approach a decision point.
Momentum indicators show gradual strength building. The RSI is trending upward near 54, indicating improving buying pressure, while the MACD has flipped bullish but is on the verge of undergoing a bearish crossover. However, price still sits below the key $10.10 resistance zone, which previously acted as a rejection area.
A breakout above $9.50 could push LINK toward $10.10, with further upside toward $11.00 if momentum sustains. Besides, a failure to break higher and a drop below $8.10 support could invalidate the structure, leading to a move back toward the $7.50–$7.80 range.
Overall, LINK is not trending yet — it is coiling for its next major move, with direction likely determined by the upcoming breakout.
Chainlink Price Outlook: Breakout or Breakdown Ahead?
Chainlink is approaching a critical point as price compresses between $8.10 support and $9.50 resistance, signaling an imminent breakout. The current structure suggests a buildup in momentum, but confirmation is still pending. A sustained move above $9.50 could drive LINK toward the $10.10–$11.00 range, aligning with broader market strength. However, failure to break higher and a drop below $8.10 may trigger renewed selling pressure, pushing the price back toward $7.50–$7.80.
The live price of the TAO crypto is $ 250.14492008.
Bittensor Price could show a reversal to $500 be H1 2026.
TAO’s long-term outlook targets $1,000–$3,000 by 2030
Bittensor (TAO) has gained attention as a decentralized protocol focused on artificial intelligence. The network enables participants to build, share, and evaluate machine learning models through a blockchain-based system.
The project combines AI infrastructure with token incentives. This model positions TAO crypto within a growing segment of crypto tied to AI development. TAO price outlook depends on both technical patterns and network activity.
The daily chart for TAO/USDT shows that April saw a decline after March’s recovery. Currently, TAO is positioned below a “death cross” formed between the 20-day and 50-day EMA bands. The price is hovering below $260 and struggling to find the liquidity needed to trigger a reversal.
Without a significant influx of fresh demand to reclaim the 200-day EMA and subsequently challenge the psychological $300 level, the bearish grip on the market is expected to strengthen as we move into May.
Looking ahead in May, the outlook depends on whether TAO price can maintain its current local floor around $240. If it fails to spark a relief rally toward the $300 resistance zone, we may see the downtrend continue toward the primary demand block between $160 and $210.
Therefore, Investors should monitor a decisive daily close above the immediate EMA cluster, as this could signal a trend shift. Otherwise, the market appears set to test levels below $200 before a meaningful bottom is established.
On April 10th, Covenant AI a major project on TAO announced they are leaving bittensor and reportedly sold 37,000 $TAO worth over $10 million.
On March 16th, Grayscale posted about its Bittensor Trust for private placement, offering eligible accredited investors direct exposure to the TAO ecosystem. This move underscores growing institutional interest in decentralized AI, as Grayscale highlights the protocol’s role in leveraging economic incentives for open-source development.
Coinpedia’s Bittensor (TAO) Price Prediction 2026
The weekly chart for Bittensor (TAO/USDT) reveals a well-defined long-term range that has governed price action since the network’s explosive growth in 2024. This structural parallel channel is anchored by a significant accumulation floor near $160–$200 and a formidable overhead supply ceiling around $720–$760.
In Early 2024 saw TAO price reached its All-Time High (ATH) of approximately $760. Despite a volatile year, the price repeatedly cycled between the channel’s borders, demonstrating high demand at the lower bounds and aggressive profit-taking at the upper extremes.
But throughout 2025, market momentum shifted into a lower-intensity regime. The price largely remained capped under the $500 psychological barrier. A brief Q4 2025 rally attempted to reclaim the upper range but was rejected at $535, leading to a sharp retracement back to the primary demand zone by early 2026.
By Q1 2026, the price has successfully defended the $160–$200 support zone for the third time in two years. This “triple-bottom” characteristic suggests strong institutional interest at these valuations, and the rally to $352 was proof of that.
But, it has faced resistance in Q2’s April and has slipped below the $300 demand area. Now, it did fall on the news, but from a price-action perspective, it looks like a short red candle after 3 months of a rally. So the chances are that it’s a healthy dip for its bullish structure to be maintained for months ahead. But if it’s a healthy dip, it needs to jump back above $ 300; if it doesn’t, it might crash lower, revisit $160-$200 support, and spend the entire Q2 there consolidating, or could seek even deeper levels.
If the TAO price can maintain above $300, then $352 and $396 during this period would be revisited before the first half of 2026 concludes, clearing the technical path for a retest of the $500 supply area. A sustained close above the mid-range would then signal long-term extension in the rally, possibly to the upper border of this parallel channel by year’s end.
Data from Taostats, the primary ecosystem tracker for Bittensor, highlights a period of aggressive expansion in the network’s infrastructure. From March 2023 through June 2025, the number of active subnets experienced a parabolic climb, ultimately reaching a peak of 129. This growth underscores the rapid scaling of Bittensor’s decentralized AI architecture and its ability to attract diverse, specialized compute layers.
Over the last 365 days especially, the chart reveals a shift from rapid expansion to a phase of high-level stability. While the total number of subnets has plateaued at its upper limit, the network has maintained a consistent and active presence throughout the year.
This steady horizontal trend is significant, as it demonstrates a matured ecosystem where the network size remains robust and functional, providing a reliable foundation for the protocol’s ongoing operations.
Bittensor Crypto Price Prediction 2026 – 2030
Year
Potential Low ($)
Potential Average ($
Potential High ($)
2027
400
720
1000
2028
600
820
1200
2029
800
1150
2000
2030
1000
1800
3000
Bittensor (TAO) Price Prediction 2027
As per the Bittensor Price Prediction 2027, Bittensor may see a potential low price of $400. The potential high for Bittensor price in 2027 is estimated to reach $1000.
TAO Crypto Price Prediction 2028
In 2028, Bittensor price is forecasted to potentially reach a low price of $600 and a high price of $1200.
Bittensor Price Forecast 2029
Thereafter, the Bittensor (Bittensor) price for the year 2029 could range between $800 and $2000.
Bittensor (TAO) Price Prediction 2030
Finally, in 2030, the price of Bittensor is predicted to remain steadily positive. It may trade between $1000 and $3000.
The long-term projection assumes Bittensor sustains relevance in enterprise blockchain use cases, with growth moderating over time as the asset matures.
Year
Potential Low ($)
Potential Average ($)
Potential High ($)
2031
1200
1800
3000
2032
1600
2300
3300
2033
1900
3400
4000
2040
3200
5800
7800
2050
6500
8500
10000
Bittensor Crypto Price Market Analysis
Year
2026
2027
2030
Changelly
$620.00
$850
$1200
CoinCodex
$540.00
$900
$1400
WalletInvestor
$760.00
$950
$1550
Never Miss a Beat in the Crypto World!
Stay ahead with breaking news, expert analysis, and real-time updates on the latest trends in Bitcoin, altcoins, DeFi, NFTs, and more.
What Is Bittensor?
Bittensor operates as a decentralized marketplace for machine intelligence. It uses a system of subnets where contributors train and validate AI models.
The protocol runs on a mechanism known as Yuma Consensus. This system distributes rewards based on the usefulness of contributions rather than computing uptime alone.
The TAO token serves several functions:
Secures the network through staking
Provides access to AI services
Rewards contributors
The total supply is capped at 21 million tokens, similar to Bitcoin.
FAQs
What is Bittensor (TAO) and how does it work?
Bittensor is a decentralized AI network where users share and train models. TAO tokens reward valuable contributions and enable access to AI services.
What is the price prediction for Bittensor (TAO) in 2026?
TAO is expected to trade between $160 and $500 in 2026, with a potential retest of higher resistance if bullish momentum continues.
How much will Bittensor (TAO) be worth in 2030?
By 2030, TAO could trade between $1000 and $3000, supported by growing demand for decentralized AI and sustained ecosystem expansion.
What is the price prediction for TAO in 2040?
TAO may reach between $3200 and $7800 by 2040 if adoption of decentralized AI accelerates and the network maintains long-term relevance.
How high can TAO price go by 2050?
By 2050, TAO could climb as high as $10,000, assuming strong global AI demand, continued innovation, and consistent network growth.
Is Bittensor (TAO) a good long-term investment?
TAO shows long-term potential due to its AI focus and token utility, but investors should consider market risks and evolving competition.
What could drive Bittensor (TAO) price growth?
Key drivers include AI adoption, subnet expansion, institutional interest, and increased demand for decentralized computing resources.
South Korea’s K Bank, the country’s largest internet-only bank, has teamed up with Ripple to pilot blockchain-based cross-border payments across two corridors: the United Arab Emirates and Thailand.
K Bank operates entirely online with no physical branches, making it one of South Korea’s fastest-growing financial institutions and a natural fit for blockchain-based payment rails that bypass traditional correspondent banking infrastructure.
Additionally, previously, France launched a regulated euro stablecoin on the XRP Ledger and Japan made XRP spendable for millions.
Instead, she explains that this is a pattern showing where the real global wealth transfer is happening, quietly through financial infrastructure, not price action.
Institutional Moves, Not Retail Hype
According to Stevenson, these developments are not driven by speculation but by deep institutional adoption.
In France, Société Générale deployed a MiCA-compliant euro stablecoin on the XRP Ledger after passing strict compliance, legal, and risk checks. This shows XRP is being used for regulated financial products, not just trading.
In South Korea, Kyobo Life Insurance used Ripple Custody to pilot real-time settlement of tokenized government bonds. These are among the safest assets in finance, meaning this shift is structural, not experimental.
In Japan, XRP was integrated into payments, making it usable for 44 million consumers across 5 million merchants, proving real-world usability at scale.
Stevenson says these moves reflect institutions building on XRP infrastructure, not testing it.
Three Layers of Finance Converging
The pattern becomes clearer when all three developments are viewed together.
France represents the stablecoin and digital currency layer. South Korea brings in real-world assets through tokenized bonds. Japan covers the payments layer with everyday transactions.
Three different parts of the financial system are moving onto the same infrastructure at the same time.
Stevenson notes that patterns like this do not come from isolated decisions. They emerge when regulation, technology, and institutional confidence align after years of development.
Where the Real Wealth Transfer Is Happening
Stevenson says most investors are focused on XRP’s price, waiting for a breakout. But the real shift is happening underneath.
Banks, insurers, and payment systems are integrating XRP into core financial processes. Every stablecoin transaction on XRP Ledger uses XRP for fees, and real-time settlement systems reduce inefficiencies in traditional finance.
This is where the global wealth transfer is taking place, through infrastructure being built and adopted at scale.
The price may follow later, but the foundation is already being laid.
Sei (SEI) remains in a bearish trend in 2026, with price approaching the $0.020 demand zone. A strong rebound could push SEI back toward $0.10–$0.20 by year-end.
Long-term projections remain bullish for Sei, with analysts forecasting steady growth that could push SEI toward the $1.26–$1.45 range by 2032.
Originally recognized as the first sector-specific Layer 1 blockchain, Sei has evolved into a powerhouse of parallelized execution. While its initial mission focused on optimizing decentralized exchanges (DEXs), the 2024-2025 “V2” upgrade transformed Sei into the Parallelized EVM. This pivot allowed the network to combine the vast developer ecosystem of Ethereum with the blazing-fast performance typically reserved for non-EVM chains like Solana.
As we move through 2026, the network is undergoing its most ambitious technical overhaul yet: the Sei Giga upgrade. By implementing the “Autobahn” consensus and asynchronous execution, Sei aims to support over 200,000 transactions per second with sub-400ms finality. From institutional real-world asset (RWA) tokenization to high-frequency gaming and AI-agent economies.
Planning on investing in this crypto project but concerned about its prospects? Fear not and scroll down, as in this article, we have uncovered the market trends of SEI price prediction from 2026 up until 2032.
As the first quarter closed on a bearish note, investors are now looking for opportunities in the second quarter.
The first quarter has extended the downturn from 2025 into 2026, with the January-to-March period presenting ongoing challenges. Notably, the SEI price fell below the $0.100 threshold, indicating a continued bearish trend, and by March, it even reached a low of $0.050.
However, in April, signs of gradual bullish strength are emerging. If the SEI price experiences further bullish development, it could rise in May to retest the upper edge of the existing falling wedge pattern.
On the other hand, this sustained downward movement could lead to additional declines if market conditions remain unchanged, raising concerns about approaching the lower boundary of a falling wedge pattern in May.
Recent News/Updates
Coinbase has officially integrated the Sei EVM, transitioning all SEI network transactions to the new standard for enhanced compatibility and performance. This significant update, which enables native EVM support for all sends and receives on the platform, was publicly announced by the Sei Network team on April 14.
Sumvin, Inc. officially launched on February 26, 2026, utilizing Sei’s sub-second finality for AI-powered financial execution.
Coinbase Markets announced on February 27th that Sei will transition from Cosmos-based transactions to an EVM-only architecture. They will be facilitating this migration to the Sei EVM, which will take place from April 6-8, 2026.
Coinpedia Sei (SEI) Price Prediction 2026
The technical outlook for Sei (SEI) in 2026 reflects a challenging macroeconomic trend defined by a persistent descending structure. Looking back at the weekly chart, 2024 was marked by two significant but ultimately capped rallies: an explosive surge to the $1.00 mark in the early months, followed by a secondary peak near $0.70 late in the year 2024. Both movements highlighted intense bearish pressure, as sellers consistently utilized these rallies to exit positions, effectively constraining the price within a tightening range.
This market structure deteriorated further in 2025 when the SEI price failed to hold the critical $0.30 demand zone. The breakdown confirmed that the SEI asset had abandoned traditional horizontal support levels and is favoring a massive falling wedge pattern.
This technical formation has been dictated by three clear resistance touches, the most recent occurring in September 2025. While analysts initially hoped the early 2023 demand floor would exhaust the selling pressure, the first quarter of 2026 saw a continuation of the slide, with the price slipping beneath the psychological $0.10 support area.
Current price action suggests that the SEI price is now gravitating toward the lower boundary of the falling wedge. This decline is expected to persist through mid-2026 until the price meets the primary demand area situated around the $0.020 mark. This level represents a deep value zone where selling exhaustion is highly probable.
If buyers successfully defend this floor, the resulting spike in demand could ignite a trend reversal, potentially driving the SEI token price back toward the $0.10 and $0.20 levels. Under a highly bullish recovery scenario, a retest of the $0.30 breakdown point remains a possibility before the year concludes.
Sei (SEI) Long-Term Price Projections: 2027 – 2032
Year
Minimum Price ($)
Maximum Price ($)
Average Price ($)
2027
0.2450
0.2940
0.2500
2028
0.3550
0.4260
0.3650
2029
0.5240
0.6190
0.5350
2030
0.7850
0.9050
0.8060
2031
0.8900
1.1000
0.9950
2032
1.2600
1.4500
1.3210
Sei (SEI) Price Prediction 2027
The SEI price forecast maintains an upward climb throughout 2027. Market analysts project the SEI token will fluctuate between $0.2450 and $0.2940, centering on an annual average SEI/USD price of $0.2500.
Sei Crypto Price Prediction 2028
Growth is expected to accelerate in 2028 as ecosystem maturity attracts deeper liquidity. SEI crypto price is projected to trade within a bullish corridor of $0.3550 to $0.4260, maintaining a robust year-round average of $0.3650.
SEI Token Price Prediction 2029
By 2029, SEI token’s price movements are anticipated to reach a significant peak of $0.6190. On the lower end, strong support is expected at $0.5240, leading to a projected average trading cost of $0.5350.
SEI Price Prediction 2030
Entering the new decade, SEI Crypto’s valuation is expected to be driven by global market recognition. Projections suggest a price range of $0.7850 to $0.9050, with an expected average price of $0.8060.
SEI/USD Prediction 2031
The bullish momentum continues into 2031, with the high target set at $1.1000. While retracements may dip toward $0.8900, the overall market equilibrium is expected to sit near $0.9950.
Sei (SEI) Price Prediction 2032
Based on current expert modeling, 2032 represents a major milestone for the token. SEI is estimated to range between $1.2600 and $1.4500, with an average valuation of $1.3210.
Never Miss a Beat in the Crypto World!
Stay ahead with breaking news, expert analysis, and real-time updates on the latest trends in Bitcoin, altcoins, DeFi, NFTs, and more.
FAQs
What is the Sei (SEI) price prediction for 2026?
SEI may drop toward $0.020 before recovering. If demand returns, it could rebound to $0.10–$0.20, with a bullish case targeting $0.30 by year-end.
How high can Sei (SEI) price go by 2030?
By 2030, SEI could reach between $0.7850 and $0.9050, with further upside possible if ecosystem growth and adoption accelerate
What is the Sei Crypto price prediction for 2040?
By 2040, SEI could exceed $2–$3 if long-term adoption, scalability, and real-world use cases expand, though such projections remain speculative.
Is Sei (SEI) a good long-term investment?
SEI shows long-term potential due to its high-speed infrastructure and upgrades, but it remains a high-risk asset dependent on adoption and market trends.
LILPEPE nears presale completion after raising over $28 million as investor interest continues to grow. The LILPEPE coin is close to wrapping up its presale with a total amount of funds collected surpassing the mark of $28 million. Although the…
Bitcoin Cash holds steady as BlockchainFX gains investor attention heading into the final week of April 2026. Ten thousand dollars is sitting in a wallet right now, and the clock is ticking on where it should go. Bitcoin Cash is…
Google DeepMind has entered into a partnership with South Korea to provide the technical backbone for the country’s K-Moonshot initiative, an ambitious national programme designed to solve the most complex scientific challenges of the century using AI. According to recent…
XRP price outlook stays in focus as BlockchainFX gains attention in the multi-asset crypto investment market. Can XRP (XRP) price prediction news still matter when crypto market data changes by the hour? Today, the total crypto market cap sits near…
Ripple’s former CTO David Schwartz has warned that a targeted phishing campaign has begun exploiting Robinhood users through seemingly legitimate emails ahead of the firm’s earnings report. According to Schwartz, the attack involves emails that appear to originate from Robinhood’s…
The crypto market news today turned on April 23 when Anchorage Digital activated institutional Solana staking through Marinade per Cointelegraph, and SoFi Bank flipped on XRP deposits for its 13.7 million customers per Yahoo Finance. When custodians and consumer banks open the floodgates in one week, sidelined capital hunts for entries that can outpace blue chips.
Pepeto pulled past $9.45 million as the Binance listing draws near, with a verified exchange already running, the original Pepe Coin founder behind the build, and a presale floor that makes it the cleanest 100x setup into the next leg.
Anchorage and SoFi Mark a Turning Point and the Crypto Market News Today Shifts
Anchorage Digital said institutional clients can now stake SOL through Marinade while keeping full custody, picking between compliant validator sets or yield-optimizing strategies per Anchorage Digital. The same week SoFi added XRP deposits beside Bitcoin, Ethereum, and Solana for its 13.7 million members, putting Ripple’s token inside a major U.S. digital bank.
A Goldman Sachs survey shows 71% of institutional managers plan to add crypto exposure this year while only 7% are already in. Fresh institutional rails unlock the next pool of capital, and the presale launches into the friendliest entry window the asset class has ever offered.
Pepeto, Solana (SOL), and XRP: The Entry That Launches Into the Strongest Institutional Window in Crypto History
Pepeto
When Anchorage opens institutional SOL staking and SoFi flips on XRP deposits in one week, the next wave of capital is no longer if but when. Pepeto is launching into that wave with the Binance listing closing in, $9.45 million committed during peak Fear, and analyst projections pointing toward 100x because the product layer backs the call.
The crypto market news today is exactly why a contract scanner reading every smart contract before a wallet connects matters now. PepetoSwap clears each trade at zero cost, and the cross-chain bridge ferries tokens between Ethereum, BNB, and Solana with no fees attached.
Over $9,450,000 has rolled in at $0.0000001866 with 178% APY staking. SolidProof finished a complete audit, and the founder who scaled the original Pepe Coin into an $11 billion market cap on 420 trillion tokens engineered this exchange beside a senior Binance developer leading the build.
Anchorage and SoFi just confirmed the door is opening. The largest crypto fortunes have all started with the same first step: entering before the crowd noticed. Pepeto at presale pricing is that step, and the Binance listing is when the rest of the market shows up.
Solana (SOL) Price at $86.06 as Anchorage Staking Brings Institutional Yield Online
Solana (SOL) trades at $86.06 per CoinMarketCap, up 1.8% after Anchorage opened institutional SOL staking through Marinade. Solana topped the dApp revenue table for five weeks running and handled 41% of total DEX volume in Q1 2026.
Support holds at $80 with resistance at $95 and $105. At a $46 billion market cap, a push to $95 means roughly 10% over weeks, not the multiple that flips a portfolio overnight. Institutional staking is a long-term story for SOL, while presale entries deliver a steeper return inside one event.
XRP prints $1.42 per CoinMarketCap, with cumulative spot ETF flows past $1.28 billion and SoFi flipping on deposits for 13.7 million customers. Whale wallets absorbed the recent dips while spot ETF products logged zero outflows since April 9.
Support sits at $1.35 with resistance at $1.50 and $1.65. XRP still trades around 58% under its $3.40 record from 2018, with a full reclaim unlikely before late 2027. From $1.42 to $1.50 is roughly 5% over weeks, not the listing multiplier presale entries carry.
Conclusion
The crypto market news today is plain. Anchorage, SoFi, and Morgan Stanley are all moving toward the rails that pipe institutional money into crypto. SOL and XRP still offer steady setups. But the verified exchange opens a wider return window with the Binance listing closing in and 100x to 300x building as the presale fills.
Your search led you to the right answer: Pepeto. The wallets that flipped small money into real wealth in crypto all did one thing: they bought before the crowd recognized what they were buying. The Pepeto official website is where that entry sits today, and the Binance listing turns this presale price into the kind of returns late buyers will spend 2026 wishing they had taken.
What drove the crypto market news today to shift toward institutional adoption in April 2026?
Anchorage Digital opened institutional Solana staking through Marinade on April 23, while SoFi Bank turned on XRP deposits for 13.7 million customers the same week. Goldman reports that 71% of institutional managers plan to add crypto exposure this year.
Is Solana (SOL) a strong buy at $86.06 after the Anchorage staking launch?
Solana (SOL) trades at $86.06 with a $46 billion market cap and targets $95 for roughly 10% upside over weeks. Pepeto through the Pepeto official website opens presale entry at $0.0000001866 and 100x listing returns that SOL at this size cannot deliver.
Pi Network holds approximately $1.85 billion in market capitalisation, accounting for nearly 95% of the $1.94 billion mobile mining sector, according to market data.
The figures put Pi Network in a position of near-total dominance within its category, with no other project coming close in terms of market value. The mobile mining segment, which was largely overlooked in earlier crypto cycles, has grown into a tracked and traded market, with Pi Network as its central asset.
Whether that attention translates into longer-term utility and adoption remains an open question, with the network still working through its mainnet development and ecosystem build-out.
Pi Price Analysis
Pi is currently trading around $0.1797, up 4.32% over the past 24 hours, with trading volume near $34 million. Short-term action shows a slight 0.85% dip in the last hour, hinting at a brief cooldown after the recent push.
Pi is sitting in a make-or-break zone right now, around $0.17–$0.18. If buying continues and hype builds into events like Consensus 2026, there are chances it pushes higher toward $0.25 and possibly even $0.40 as some analysts expect.
Over 10.29 billion PI is already in circulation out of a 100 billion max supply. Meanwhile, exchange outflows are exceeding inflows by about 310,000 tokens, meaning more supply is moving off exchanges. Token unlock pressure is also easing, reducing immediate selling risk.
Upcoming Catalysts
The Protocol 22 upgrade has reached its deadline, introducing smart contracts and expanding what the network can actually do beyond mining.
Founders Chengdiao Fan and Nicolas Kokkalis are set to appear at Consensus 2026 in Miami. That kind of exposure usually brings fresh attention right when interest is already growing.
The network also reports over 18 million KYC-verified users, giving it one of the largest active user bases in crypto.
Why This Phase Feels Important
This isn’t just about a short-term price move. The market is starting to position itself for what comes next. If utility begins to kick in after the upgrade, Pi starts moving beyond just a mining narrative into something more functional.
One X user points out that it’s still early. Mining continues, rewards are still available, and there’s no reason to stop while billions of tokens remain unmined. He argues the real value will come from demand and usage, not just supply mechanics.
YoungHoon Kim, the world’s Highest IQ 276 holder, was recognized by the World Memory Championships and claims a cryptocurrency “supercycle” could begin within the next 30 days.
With Bitcoin currently grinding near $78,000 and market momentum building, the timing of the call has made it impossible to ignore.
Few Words. Maximum Impact.
In a recent X post, YoungHoon Kim stated that a full cryptocurrency supercycle will arrive within the next 30 days
While there was no chart attached. No data. No long thread breaking down the reasoning. Just this:
“I THINK WE WILL SEE THE SUPERCYCLE IN 30 DAYS. 100%”
The idea of a crypto supercycle refers to a long and powerful rally where prices rise much higher than usual market cycles. According to the prediction, Bitcoin and altcoins could enter a strong upward phase soon.
The claim quickly gained attention, especially as Bitcoin is already trading below $80K levels, and institutional demand remains steady
The Community Fires Back
The post quickly gained attention, crypto X. One user says, “Your track record of predictions is seriously lacking.”
Another X users comment that, “I am starting to doubt that you are the highest IQ person, Younghoon Kim.”
That reply got attention because it was not completely wrong.
On March 16, 2026, yhbryankimiq posted “XRP supercycle confirmed,” but that move never happened as strongly as claimed.
Then on March 29, 2026, he said, “Crypto is about to explode,” but the market mostly stayed quiet in the following weeks.
That makes three big predictions in just over a month. Each was shared with full confidence.
On the other hand, veteran crypto analysts like Michael van de Poppe are openly targeting $86,000 to $88,000 for Bitcoin over the next one to two weeks.
30 Days on the Clock
The prediction is now live. The clock is running. By late May 2026, the market will have given its verdict.
If Bitcoin breaks $100,000, altcoins go parabolic, and institutional money floods in at a scale nobody has seen before, YoungHoon Kim will have called one of the most important moments in crypto history with pinpoint timing.
If it does not happen, it joins the XRP supercycle, and the crypto explosion calls in a growing list of confident predictions that the market quietly ignored.
BNB bulls defended the $600 support on Monday as investors booked profits following its rebound to $640. Now, with a major hard fork set to be implemented tomorrow, will the token reclaim its local highs or fall victim to a…
Litecoin price forecasts remain in focus as BlockchainFX gains momentum in the 2026 crypto presale market. Can Litecoin (LTC) price prediction news still turn heads in 2026 when newer utility tokens are stealing the spotlight? Litecoin (LTC) remains one of…
XRP nears $2 as BlockchainFX presale surpasses $14.37 million amid rising investor interest.. Spot buyers are stacking XRP like nothing is wrong, shorts are piling in like something is very wrong, and somewhere between that tug of war, a presale…
OpenAI has reportedly partnered with chipmakers and a manufacturing firm to develop an AI-focused smartphone, with mass production targeted for 2028. According to a recent post from analyst Ming-Chi Kuo, the company is working with MediaTek and Qualcomm to co-develop…
Crypto has opened the door to a different way of handling money, but it also comes with its own set of risks. Stories about lost access, hacked wallets, or fake platforms are not rare anymore. The good part is that most of these situations can be avoided with some awareness and a few practical habits.
According to Influere Investigations, a leading name in crypto security, people often underestimate how small mistakes can lead to bigger problems over time. Below are some grounded, realistic ways to better protect your crypto without overcomplicating things.
Start with the basics: wallet safety
The first layer of protection is your wallet. Whether you use a mobile app, desktop software, or a hardware wallet, how you manage access matters more than the type itself.
A strong password is a given, but it’s not enough on its own. Two-factor authentication adds an extra step that makes a big difference. It may feel like a hassle at first, but it blocks most simple intrusion attempts.
Another thing people overlook is where they store their security phrase. Writing it down and keeping it offline is still one of the safest approaches. Saving it in cloud storage or sending it to yourself by email creates unnecessary exposure.
Experts from Influere Investigations often point out that many incidents don’t involve advanced attacks. They come from poor storage habits or shortcuts taken during setup.
Be careful with links and messages
A common way people lose access to their crypto is through fake websites or phishing messages. These can look very convincing. A platform login page might seem identical to the real one, but a small difference in the URL can make all the difference.
If you receive a message asking you to “verify” or “secure” your account, take a step back. Avoid clicking links directly. Instead, go to the official website manually.
It’s also worth mentioning that no legitimate service will ask for your private keys or security phrase. If something like that appears, it’s a clear red flag. Analysts highlight that slowing down for a few seconds before acting can prevent most of these situations. Quick reactions are often what attackers rely on.
Use trusted platforms, but stay alert
Choosing where you store or trade your crypto matters. Well-known platforms usually have stronger security practices, but that doesn’t mean users can switch off completely.
Always double-check URLs, especially if you’re logging in from a new device. Bookmarking official pages can help avoid confusion later. Also, avoid sharing too much about your holdings online. Even casual posts can attract unwanted attention. It’s not about being secretive, just cautious.
From what Influere Investigations analysts have observed, many issues happen when people assume that a platform alone will handle all aspects of safety. In reality, personal habits still play a big role.
Keep your devices clean and updated
Security doesn’t stop at the wallet or platform level. The device you use matters just as much. Make sure your operating system and apps are updated regularly. Updates often fix vulnerabilities that could otherwise be used to gain access. Avoid installing random extensions or software, especially from unknown sources. Even something that looks harmless can carry hidden risks.
Using antivirus tools and scanning your system from time to time is a simple step that many skip. It doesn’t guarantee full protection, but it adds another layer. Influere Investigations often reviews cases where compromised devices were part of the problem, even if the user didn’t notice anything unusual at first.
Separate long-term storage from daily use
Not all crypto needs to be treated the same way. If you hold assets for the long term, consider keeping them in a more secure environment that you don’t access daily. For smaller amounts used for trading or regular activity, a more accessible wallet might make sense. The idea is to limit exposure. If one part is affected, the rest remains untouched.
This approach might seem a bit extra, but it’s a common practice among experienced users. It reduces the impact of potential issues. As noted by security experts, spreading risk instead of concentrating everything in one place is a simple but effective strategy.
Get an outside perspective when unsure
Sometimes, it’s not clear whether a situation is safe or not. Maybe something feels off, but you can’t quite tell why. This is where getting a second opinion can help. influereinvestigations.com focuses on reviewing situations and pointing out potential risks people might miss. They don’t step in or act on behalf of users, but they can help clarify what’s going on and what steps might make sense next.
Final thoughts
Keeping your crypto safe doesn’t require complex tools or deep technical knowledge. Most of it comes down to awareness, consistency, and avoiding rushed decisions.
Small habits, like checking links, storing your security phrase properly, and keeping your devices clean, go a long way. According to Influere Investigations, people who take these basics seriously are far less likely to run into serious problems.
Solana is closing in on a decisive test near $86, with the price holding firm at a level that has yet to reject the move. While the market remains pinned below resistance, the structure behind it has already taken shape. A higher timeframe cup-and-handle formation is nearing completion, and network growth continues to expand alongside rising liquidity, both aligning with the current price strength. With pressure building at this level and no rejection so far, the next move from here carries more weight, either confirming the breakout or keeping the market within its current range, a setup that has been widely discussed across recent Solana News.
Network Growth Builds, but Momentum Remains Uneven
Solana’s underlying network strength continues to expand, even as speculative activity remains soft. Upgrades like Firedancer and Alpenglow are improving scalability and execution speed, positioning the network for sustained demand. At the same time, stablecoin supply has climbed to around $17.4 billion, with growing activity in real-world assets and consistent on-chain usage.
SOLANA ECOSYSTEM WATCH: WHAT'S MOVING ON-CHAIN THIS WEEK$SOL is trading near $86 with the network now sitting at the intersection of major upgrades and a sluggish memecoin recovery. Firedancer is running over 1M TPS, Alpenglow is delivering sub-150ms finality, and the SEC-CFTC… pic.twitter.com/hDdGZMbJZI
However, momentum from high-risk segments has yet to recover, with memecoin-driven activity and network revenue still below prior peaks. This leaves Solana in a position where the foundation is strengthening, but broader momentum is yet to fully align with it.
Solana’s price structure aligns with a developing cup-and-handle formation, where the broader rounding base has already formed and price is now consolidating within the handle phase. While, support continues to hold during this consolidation, with pullbacks getting absorbed early and failing to extend lower. This reflects controlled positioning rather than distribution, keeping the structure intact beneath resistance.
The handle is compressing price just below key levels, with repeated tests failing to trigger downside continuation. This behavior indicates that selling pressure is not expanding despite resistance holding. If this structure confirms with a breakout, the pattern extends beyond short-term targets.
Based on classical technical projections, a completed higher timeframe cup-and-handle opens the possibility of a broader expansion phase, with some long-cycle projections placing Solana price toward the $500 region. That scenario, however, remains conditional on sustained structure, liquidity continuation, and macro alignment.
Key Levels in Focus as SOL Price Tests Resistance
The $86 zone remains the immediate level in play, with price continuing to press against it without meaningful rejection. A sustained move above this region would confirm a breakout from the current compression and open the path toward the $95–$100 range, where the next supply cluster is likely to emerge.
On the downside, the $80–$82 region acts as the first layer of support, where recent pullbacks have been absorbed. Holding above this zone keeps the current structure intact and maintains breakout pressure. A deeper shift below this range would weaken the setup, exposing the $74–$76 area as the next demand zone and signaling a return to broader consolidation rather than continuation.
Outlook
Holding near $86 keeps the structure intact, with the market positioned just below a key resistance zone. If pressure continues to build without rejection, the setup remains aligned for a breakout into a higher range. Failure to hold this structure would keep SOL within consolidation, delaying the move. For now, SOL remains at a decision point, with the next move likely to define short-term direction.
The Sui price is facing renewed pressure after a series of exploit-related incidents shook confidence across its DeFi ecosystem. Reports of multi-million-dollar losses linked to protocols such as Volo and Scallop triggered immediate selling, with traders reacting to heightened security concerns.
Despite the negative headlines, SUI’s price reaction has remained relatively controlled compared to typical post-exploit crashes, suggesting the market is not fully capitulating. This puts SUI in a critical spot, balancing fear-driven selling and potential dip-buying interest as the broader crypto market attempts to hold on to its recent gains.
SUI Exploit: What Happened and Why It Matters
The recent selling pressure on Sui follows a series of exploit-related incidents that impacted its DeFi ecosystem and raised fresh security concerns. Volo Protocol reportedly lost around $3.5 million after an admin key compromise, while Scallop faced losses due to a vulnerability in a deprecated contract. These back-to-back incidents triggered a decline in confidence, prompting traders to reassess risk exposure across SUI-based protocols.
Such exploits tend to have a broader impact beyond the affected platforms, as they highlight potential weaknesses in ecosystem security and increase the likelihood of liquidity outflows. In the short term, this has led to cautious sentiment and selling pressure on SUI, with market participants closely watching whether the token can stabilize or face deeper downside as trust rebuilds.
SUI Price Analysis: Holding Structure or Losing Momentum?
Sui is currently showing signs of short-term stabilization after its sharp February decline, with price consolidating in the $0.90–$1.00 range. The chart indicates a gradual higher-low formation, dropping below the ascending trendline, suggesting buyers are attempting to build a base. However, price continues to struggle near the $0.95–$1.00 resistance zone, indicating a lack of strong breakout momentum despite recovery attempts.
The RSI has maintained a significant upward trajectory, but the latest drop in the price has caused the levels to break the ascending trend line or support. On the other hand, the CMF has been constantly forming lower lows and highs, hinting towards a constant outflow of liquidity. With the momentum fading, the SUI price is now believed to drop below $0.9 and hit the local base, followed by which a rebound may be expected.
What’s Next for SUI Price?
Sui price is holding above the $0.90 support zone despite exploit-driven sentiment damage, but continues to face resistance near $0.95–$1.00, keeping the market in a fragile balance.
Holding above $0.90 and reclaiming $1.00 could open a move toward $1.10–$1.15 as confidence returns. While a breakdown below $0.90, especially toward $0.81 support, could trigger further downside and extend the correction.
For now, SUI’s next move hinges on one question: will buyers defend $0.90 and push back above $1.00, or will fading confidence trigger another leg lower?
Binance received nearly $6 billion in stablecoin deposits during March and April, including $3.5 billion in April alone. This happened even as global tensions and inflation fears created uncertainty in financial markets. The inflow shows that many traders are moving money back to the exchange, likely preparing to buy crypto assets again. Earlier months had seen heavy withdrawals, so this marks a reversal in trend. If stablecoin deposits continue rising, it could support stronger crypto market activity and improve short-term investor confidence.
XRP price has been consolidating over the past week, holding the $1.40 support despite market volatility. But now a potential bearish MACD crossover threatens a breakdown below the major support level. According to data from crypto.news, XRP (XRP) price rallied…
South Korea’s internet-only lender KBank has entered into a strategic partnership with Ripple to test blockchain-based cross-border remittances. According to multiple local media reports, the collaboration focuses on a proof-of-concept designed to measure improvements in transaction speed, cost efficiency, and…
French law enforcement agencies have been investigating wrench attacks and found that some of the alleged offenders were involved in multiple incidents
About 3.5% of informed traders, including market makers and skilled takers, capture over 30% of profits on prediction platforms, while about 67% of users absorb the entirety of losses.
Western Union CEO Devin McGranahan said the company will focus on expanding adoption and embedding digital assets into its core money movement platform going forward.
The latest Ethereum price analysis on April 25 reads sharper after SharpLink CEO Joseph Chalom told Bloomberg the firm now stakes the entire 868,000 ETH it holds, set a 5% supply target, and called Ether the core layer of the coming AI agent economy per Bloomberg. The remarks landed alongside an Ethereum Foundation sale to BitMine on April 24 that funds protocol R&D and ecosystem grants per The Block.
That stack of corporate buyers loading up on Ether sits next to a presale where the math runs faster. Pepeto trades at $0.0000001866 with $9.45 million raised and an approaching Binance listing, and the Ethereum price analysis points to multiples a $278 billion market cap simply cannot match in the same window.
Ethereum Price Analysis Tightens as SharpLink Stakes 868,000 ETH and BitMine Buys Direct From the Foundation
Chalom architected BlackRock’s spot Bitcoin and Ether ETFs before joining SharpLink. His April 23 remarks anchor the bull side of the tape: asset managers running on smartphones will plug straight into Ether once AI agents take over portfolio decisions per CoinDesk.
The Ethereum Foundation followed on April 24 with a sale to BitMine that funds protocol R&D and community grants per Decrypt. BitMine now holds 4.12% of total ETH supply and added another 24,266 coins last week.
A 200% target by year end is a real number for ETH, yet returns still measure in single digits across quarters, not the 150x a presale compresses into one listing event.
Ethereum Price Outlook and the Presale That Beats It
Pepeto: The Sharpest Crypto Entry of 2026
I keep landing on one pattern in this market. Most traders meet a token after it already prints a 10x or 100x. Pepeto inverts that, because the wallet locks the position before the listing wave hits, not after the chart has already moved.
The platform pulls every tool a trader needs into a single venue. PepetoSwap clears trades at zero fees, so the entry size never bleeds out to gas or platform cuts. The contract scanner reads each token before any wallet connects and flags risk inside a few seconds, putting retail wallets behind the same protection a desk pays a premium to access. A built-in bridge slides assets across Ethereum, BNB Chain, and Solana with no fee, so capital never sits trapped while a listing window closes.
The presale crossed $9.45 million during the April fear stretch. The same builder who turned Pepe into an $11 billion print on 420 trillion tokens shaped this exchange, with a Binance listing veteran heading the launch desk and SolidProof signing off on every contract. Staking compounds at 178% APY, the next presale tier prices higher than this one, and the listing window is closing fast.
Pepe ran to $11 billion with no real engine under the hood. Pepeto runs the same supply blueprint with a working exchange wired in, and the leap from $0.0000001866 to that mark prints past 150x. The wallets stacking entries this week are loading up on what the Ethereum price analysis needs years to deliver, even with treasuries piling on.
Ethereum (ETH) Price at $2,309 as Treasury Demand Holds the Floor
Ethereum (ETH) trades at $2,309 on April 25 after defending $2,300 through the week per CoinMarketCap. The Coinbase Premium flipped bullish, spot ETF flows ran positive nine sessions in a row, and resistance sits at $2,400 with $2,500 the next test.
Standard Chartered targets $7,500 by late 2026. Tom Lee maps $10,000 inside the cycle. Arthur Hayes pencils $10,000 to $20,000 by the next U.S. election window. Even the aggressive call lands at roughly 4x across many months.
The Ethereum price analysis carries weight, yet a 4x spread across quarters does not match what a presale entry delivers when a Binance listing flips the price discovery switch on day one.
Conclusion
The bullish Ethereum price analysis case stands. SharpLink stakes 868,000 ETH, BitMine bought direct from the Foundation on April 24, and corporate treasuries control more than 8% of the supply between them.
The heaviest gains in 2026 will not land on a $278 billion market cap. They will land on wallets that opened a Pepeto position at $0.0000001866 before the Binance listing erased presale pricing for good. 2026 is the year that changes lives, and the early Pepeto wallet is the move that does it.
What does the Ethereum price analysis show after SharpLink and BitMine kept buying through April 24?
SharpLink stakes 100% of 868,000 ETH and targets 5% of the total Ether supply per Bloomberg. BitMine bought direct from the Ethereum Foundation on April 24 to fund protocol R&D, lifting its holding to 4.12% of all ETH per The Block.
Why is Pepeto rated stronger than Ethereum (ETH) for asymmetric returns this cycle?
Pepeto opens a presale-to-Binance-listing path where 150x is still on the table at $0.0000001866. The Pepe cofounder, a SolidProof audit, and a live zero-fee exchange place it ahead of large caps that need full cycles to print modest multiples.
The crypto market starts the week with strength and renewed bullish momentum, led by the Bitcoin price hitting $79,000. Besides, the Ethereum price is also pushing higher, heading to $2,400. The total market cap climbed to $2.64 trillion and has settled around $2.60 trillion. However, the crypto market volume has increased from $96 billion to close to $120 billion, hinting towards a rise in the trader’s participation. The weekend activity remained elevated, which is a key sign of the move backed by enough liquidity.
The top gainers for the day are Zebec Network with over a 12.14% jump, followed by Pudgy Penguins with 11.91% and Jupiter by over 5.92%. On the other hand, siren price plunges by 9%, followed by Humanity Protocol by 8.36% and Chiliz by 3.41%. However, traders remain vigilant over Pi, Solana & Terra Classic, along with Bitcoin, Ethereum & XRP. The current trade setup hints towards a broad participation, but not an isolated pump.
Why Is the Crypto Market Pulling Back Today?
The latest pullback in the crypto market comes after a strong rally that pushed Bitcoin close to the $80,000 mark and lifted Ethereum alongside it. While the broader trend remains constructive, several short-term factors are driving the current dip.
Strong Resistance Near $79K–$80K: Bitcoin faced heavy selling pressure near the $79,000–$80,000 zone, a key resistance level that previously triggered a market decline. The failure to break above this range has led to a temporary rejection, causing prices to pull back.
Profit-Taking After a Sharp Rally: After gaining significantly in recent sessions, traders are locking in profits. Such pullbacks are common after rapid price increases and often help the market stabilize before the next move.
Liquidation-Driven Volatility: The recent rally was partly fueled by short liquidations, which accelerated upward momentum. As this effect fades, the market is experiencing a cooldown, leading to increased volatility and short-term declines.
Weak Follow-Through Buying: Despite the initial breakout attempt, buying pressure failed to sustain above key levels. This lack of strong follow-through demand has contributed to the pullback.
Ongoing Market Consolidation: The crypto market remains range-bound, with Bitcoin trading between key support and resistance levels. Until a decisive breakout occurs, price action is likely to remain choppy.
The current pullback appears to be a short-term correction rather than a full trend reversal. As long as Bitcoin holds above key support levels, the broader bullish structure remains intact. However, a sustained move above $80,000 is needed to confirm continued upside momentum.
Key News Impacting the Crypto Market Today
SUI ecosystem exploits shake confidence: Volo Protocol lost ~$3.5M after an admin key compromise. Scallop exploit drained additional funds from a deprecated contract
Strong Bitcoin ETF inflows continue: Consistent institutional inflows into spot BTC ETFs are providing underlying support and stabilizing market sentiment. Nearly $2 billion in the past week continues to act as a price support driver.
Heavy short liquidations earlier in the rally: Overleveraged shorts got wiped out during the move to $79K. Current pullback is partly due to the post-liquidation cooldown
Geopolitical easing boosted the recent rally: Ceasefire developments improved global risk sentiment, which helped push crypto higher, but now momentum is cooling
What’s Next for the Crypto Market?
The market is at a decision point, not a confirmed trend. Bitcoin is holding near a key resistance zone around $78K–$80K, while Ethereum is attempting to sustain its recent strength. The next move depends on whether buyers can maintain control after the recent rejection and pullback.
Bullish scenario: If Bitcoin holds above the $75K–$78K range and reclaims $80K with strong volume, the market could see a continuation higher, with Ethereum and altcoins following through.
Bearish scenario: If Bitcoin fails to hold support and drops below ~$73K–$75K, the current move risks turning into a bull trap, potentially leading to a deeper correction.
The crypto market entered the week under pressure as investors prepared for several major U.S. economic events that could influence Bitcoin, altcoins, and broader risk sentiment.
Total crypto market capitalization fell 0.5% to $2.59 trillion on Monday, while Bitcoin traded near $77,800. At the same time, the Crypto Fear & Greed Index remained near the fear zone, showing traders are still cautious despite recent market gains.
What Are the Key U.S. Economic Events This Week?
The most important U.S. economic events this week for crypto investors include:
April Consumer Confidence data on April 28
Federal Reserve interest-rate decision on April 29
Jerome Powell’s press conference on April 29
Initial Jobless Claims and PCE inflation data on April 30
ISM Manufacturing PMI on May 1
Markets are watching these reports closely because they could affect expectations for future Federal Reserve rate cuts.
April 28 – Consumer Confidence Data
The week begins with April’s Consumer Confidence report, a monthly reading of how optimistic or pessimistic everyday Americans are feeling about the economy.
March confidence data came at 91.8, up from 91.0 previously. The next release is due this week and is expected to drop further to 89.4.
For crypto, if the number comes below 89.4, it would show people are feeling weaker about the economy. If the number disappoints, Bitcoin could see short-term pressure as investors move defensively.
April 29 – Fed Rate Decision and Powell Speech
The biggest event of the week will likely be the Federal Reserve interest-rate decision. CME Fed watch tool shows that FOMC will keep interest rates unchanged at the current target range of 3.50% to 3.75%, for a second straight meeting.
Further, we have Jerome Powell’s final press conference before his term as Fed Chair expires on May 15, 2026
The same day, earnings from Microsoft, Amazon, Meta, and Google could also impact broader market sentiment. Strong tech earnings often help risk markets, including crypto.
April 30 – Jobless Claims and PCE Inflation
Another key day arrives with Initial Jobless Claims and PCE inflation data. Initial jobless claims rose by 6,000 last week to 214,000. This week, a small drop is expected.
If the number goes above 220,000, it may show the job market is weakening. That could increase hopes for rate cuts and help crypto prices rise.
A weaker labor market may increase hopes for future rate cuts.
Meanwhile, PCE inflation is expected to be near 2.8%. Since this is the Fed’s preferred inflation gauge, a hotter reading may pressure crypto, while a cooler number could spark gains.
May 1 – ISM Manufacturing PMI
The week closes with April’s ISM Manufacturing PMI. March came in at 52.7, the third consecutive month of expansion above the critical 50 level.
If April reaches the expected 53.2, it may signal economic strength.
What This Week Really Means for Crypto
Last week, the crypto market rose over 6%, with Bitcoin nearing $80K and major coins gaining 4% to 5%. Spot Bitcoin ETFs also saw strong demand, recording 8 straight days of inflows worth $2.43 billion in April, almost double March’s $1.32 billion. This shows big investors are still buying even while retail sentiment remains in fear at 31.
Now, this week brings a new volatility test. If economic data increases hopes for lower rates, crypto could rally again. If not, traders should expect sharp market swings.
The latest bnb news shifted gears this week after Binance unveiled a keyless Agentic Wallet that lets AI bots trade and transfer tokens for 250 million users per CryptoNews. The release lined up alongside fresh data showing BNB Chain hosts more than 150,000 onchain AI agents as of April 20 per BNB Chain.
While this bnb news pulls institutional eyes toward agentic finance, Pepeto draws capital from buyers who treat presale timing as the cleanest setup ahead of any listing reprice.
Binance Wires AI Agents Into BNB Chain as Token Holders Cross 329 Million
The BNB news pipeline confirmed on April 23 that the Agentic Wallet runs as an isolated account inside the main Binance Wallet and lets autonomous bots route trades without touching the user’s primary keys per Yellow.
The launch lands as BNB Chain crossed 329.5 million token holders, a print that beats Ethereum’s 308.2 million per BNB Chain. AI agents on the chain grew from under 400 in January to more than 150,000 by April 20, a 43,750% climb that BAP-578 and ERC-8004 standards keep accelerating.
This bnb news lifts the floor for BNB, yet even the aggressive month-end target leaves the token deep below the $1,200 all-time high zone.
BNB News Points Forward, but Presale Entries Open the Window Large Caps Cannot
Pepeto
The fog that froze new launches across 2025 keeps lifting, and that is not the only reason Pepeto keeps drawing capital ahead of an approaching Binance listing. The wider real-world adoption push, from Binance’s AI wallet rollout to the spot ETF chase, is putting fresh eyes on a presale where the products already work, and the listing date is on the calendar.
Three exchange tools share one ecosystem. The zero-fee swap engine moves tokens between chains without paying a routing fee, and the cross-chain bridge ferries assets between Ethereum, BNB Chain, and Solana so no wallet stays stuck on a single network.
Most of that infrastructure is live before listing day, which is why my read keeps tilting toward Pepeto. A Binance listing veteran sits on the build team, and the architect who cofounded the original Pepe coin engineered Pepeto from concept stage forward, with SolidProof confirming every contract through a clean audit. Above $9.45 million flowed in despite the broader market sitting in fear, and that capital arriving while traders sat still tells you exactly where the smart money landed.
A $10,000 stake compounding at 178% APY pays back roughly $17,800 across a year, with the listing window tightening on every fresh entry. The current price tier closes quickly, and the approaching Binance debut puts this round among the few open windows left this cycle.
BNB Price at $627 With Osaka Hard Fork Days Away
BNB trades at $627 on April 25, 2026 after holding the $620 floor since the Osaka hard fork was scheduled for April 28 per CoinMarketCap. Resistance stacks at $660 with $700 next, and network throughput climbs toward 20,000 TPS on the upgrade.
The 35th quarterly burn removed 1.57 million BNB worth roughly $1.02 billion in mid-April, yet BNB still trades 21% under the cycle high. A 1.6x grind toward $1,000 needs every catalyst to cooperate, and that pales next to the listing-day window a presale produces.
Avalanche (AVAX) Price at $9,30 With Subnet Activity Climbing
Avalanche (AVAX) trades at $9,30 on April 25 after recovering from $18 support, with subnet deployments lifting the institutional pipeline per CoinMarketCap.
AVAX still sits 86% below its 2021 record above $146, and a path back to $20 prints roughly 50% across weeks. That is meaningful for a $7 billion cap, far short of what presale pricing pays once a Binance listing fills the order book.
Conclusion
Binance wiring AI agents into 250 million wallets and BNB Chain crossing 329 million token holders are the kind of signals that arrive before a bull run repaints every portfolio, and right now is when the right entry shows up, because Pepeto runs an open presale with whale entries stacking and three products closing in on launch.
BONK holders who collected free airdrop tokens in late 2022 watched a 10,000% climb inside a year, while late buyers paid prices early wallets would never accept. Pepeto still trades at presale pricing, but this raise can close on short notice. The bnb news cycle is loud, but the cleanest 2026 setup sits on this presale, and the early Pepeto position is the move that opens the door.
What is the most important bnb news today and how does it affect 2026 returns?
Binance launched an Agentic AI Wallet on April 23 that lets AI bots run trades for 250 million users, and BNB Chain crossed 329.5 million token holders to lead every Layer 1. The upgrades reduce friction, but Pepeto’s approaching Binance debut is where the bigger 2026 returns set up.
Why is Pepeto pulling smart money during this bnb news cycle?
Pepeto opens presale pricing at $0.0000001866 with three working tools, a SolidProof audit, and an approaching Binance listing, so the entry today disappears the moment new buyers compete for 420 trillion tokens.
The meme coin rankings just got a shake up, and the race for the next Pepe coin has never been this clear.
MemeCore overtook both PEPE and SHIB to become the second-largest meme coin this month, and the official PEPE account posted a grim reaper image targeting SHIB as the next flip.
While established meme coins fight over existing market cap, a presale backed by a former Binance expert has stacked more than $8 million from buyers who tested the live exchange tools before entering.
PEPE and SHIB Rivalry Reignites as MemeCore Takes the Number Two Spot
The battle for meme coin dominance heated up after PEPE’s official account shared a post showing its mascot as a grim reaper walking past doors labelled with rival tokens, placing SHIB as the next target. SHIB fired back with a mocking response, but the numbers tell a bigger story.
MemeCore climbed from $1.57 to over $4.66 this year, a 197% gain that pushed it past both rivals into the number two meme coin spot according to The Crypto Basic. That kind of disruption proves the next Pepe coin will not come from fighting over old positions.
Where the Next Meme Coin Wealth Gets Built
Pepeto
While PEPE and SHIB trade social media jabs over existing rankings, the next pepe coin is building exchange infrastructure that neither of them ever had. Pepeto is a network that turns meme coin energy into a working exchange where every trade, bridge, and contract check happens on one platform without hidden costs.
A former Binance expert on the development team brings the kind of exchange building experience that most meme coins never have access to, and that skill shows in tools that run live today.
PepetoSwap processes zero fee trades so meme coin rotations keep the full position intact instead of bleeding value to platform charges with every swap. The risk scorer flags contract issues before a single token gets purchased, which means wallets stay protected from the rug pulls that wipe out meme coin traders during the exact moments when speed matters most.
SolidProof verified every contract on the network, and the architect of the original Pepe token set the 420 trillion supply to echo the structure that hit billions despite having no exchange tools at all. Staking at 178% APY adds yield while the expected Binance listing draws closer.
The presale sits at $0.000000186, and more than $8 million has been stacked from wallets that ran every tool before buying in. The 100x projection from one expected Binance debut holds weight because presale to exchange is the exact window that turned early PEPE buyers into the holders everyone else envies now. Visit Pepeto to see the exchange running live.
PEPE
PEPE trades near $0.0000038 according to CoinMarketCap, down 1.88% on the day as the Canary spot PEPE ETF moves through SEC review.
The token needs a 6.8x to reclaim the $0.00002803 level from its peak run, and the rivalry with SHIB keeps attention on the next pepe coin debate.
But from this market cap, the returns that early 2023 buyers captured are no longer available to new entries.
DOGE
DOGE sits near $0.097 per CoinMarketCap, holding above key support but stuck below the $0.10 level that has acted as a ceiling for weeks.
The original meme coin carries deep liquidity and cultural weight, but the distance from $0.097 to even $0.50 is a 5x that requires broad market rotation, and presale entries with listing events ahead carry multiples that large cap meme coins cannot match.
Conclusion
Will meme coins keep climbing? The signals point to higher levels as the sector draws fresh capital and ETF interest builds. But Pepeto carries a different signal entirely, the kind of outcome that early PEPE holders built and now wish they grabbed more of.
Those wallets turned small entries into generational returns, and the same setup is forming around a presale with a working exchange and an expected Binance listing ahead.
The Pepeto official website is where the next round of early wallets are entering, and the listing will decide who collected and who watched from the outside wishing they had moved while the presale was still open.
Pepeto carries the same cofounder, the same 420 trillion supply, and a working exchange that PEPE never had, making it the strongest candidate.
Why did MemeCore overtake PEPE and SHIB?
MemeCore gained 197% this year on fresh demand, proving that meme coin rankings shift toward projects that deliver new value.
How does the Pepeto presale compare to holding PEPE?
PEPE needs 6.8x to reclaim old highs, but the Pepeto official website presents a presale where 100x from one expected Binance debut is the floor projection that vanishes once trading goes live.
175-Year-Old Money Transfer Giant Western Union is now preparing for a major move into crypto. The payments giant says it will launch its own stablecoin, called USDPT, next month on the Solana blockchain.
The update signals that traditional finance firms are no longer watching from the sidelines. If successful, this could reshape how millions of users move money worldwide.
Western Union Bets on Solana-Based Stablecoins
Western Union is entering the stablecoin space with USDPT, a U.S. dollar-backed digital token built on the Solana network.
CEO Devin McGranahan confirmed that USDPT is in the final stage of readiness and expected to go live next month. The token will be backed by the U.S. dollar, meaning its value is designed to remain stable.
“At the foundation of our strategy is USDPT, our US dollar-backed stablecoin. USDPT is now in its final stages of readiness and is expected to go live next month.”
Western Union plans to first use USDPT as a new settlement tool for agents and partners in selected countries. This could give the company an alternative to older systems like SWIFT, which has traditionally been used for international settlements.
NEWS: During its Q1 earnings call, @WesternUnion said its @Solana-based U.S. dollar stablecoin $USDPT is in final-stage preparation and expected to launch next month as an alternate to SWIFT for cross-border settlements. pic.twitter.com/vR9VgTUtuV
Western Union did not pick Solana by accident. Solana processed $650 billion in adjusted stablecoin volume in a single month earlier this year, making it the fastest-growing stablecoin settlement network by global transaction volume.
For a company that handles millions of transactions across 200 countries every single day, choosing a blockchain that settles in seconds at fractions of a cent per transaction is the only decision that makes practical sense.
That makes it attractive for a company focused on cross-border transfers, where speed and cost matter the most.
PayPal, Fiserv, and now Western Union have all chosen Solana as the chain for their stablecoins.
USDPT is not arriving alone. Western Union is launching an entire ecosystem around it, three connected products that together form the company’s complete blockchain strategy.
It is also launching the Digital Asset Network (DAN), which will connect crypto wallets to Western Union’s retail and agent network. With over 600,000 agents in more than 200 countries, users may be able to send tokens from a wallet and collect cash locally without needing a bank account.
Another product is the USD Stable Card, a prepaid card backed by stablecoins, which is expected later this year.
Built with Rain and Visa, the card is aimed at high-inflation countries like Argentina, where people look for safer ways to protect their money.
What Happens Next?
USDPT is expected to launch as early as May 2026, starting with selected markets before expanding globally.
Interestingly, despite this major update, Solana’s price has remained mostly stable, trading around $86 after recently touching $91.
Cross-border B2B stablecoin payments have been projected to reach $5 trillion by 2035, according to a new report from Juniper Research. The report published on April 27 has estimated that the total cross-border B2B stablecoin transaction value will climb from…
Coachella has partnered with Google DeepMind to test new AI tools that reshape how live music performances are created and experienced. According to a recent report, the festival used its 2026 edition to build and trial three experimental systems powered…
Republican Senator Thom Tillis has lifted his opposition to Kevin Warsh’s nomination as Federal Reserve chair after a federal investigation into Jerome Powell concluded. According to a statement shared by Tillis on X, the U.S. Department of Justice has wrapped…
Bitcoin price is currently trading around $79,126, up 2% in the last 24 hours and roughly 6% in the last week. BTC is slightly outperforming the broader crypto market as the level of $80,000 comes back into focus.
Analyst Michaël van de Poppe says Bitcoin value today is gaining strength again, but it’s now entering a phase where the next move could define the trend. Price action looks solid, but everything now depends on how BTC reacts around resistance.
Right now, the setup is either a breakout toward new highs or a pause before the next move.
The first level to watch is $79,000. A clean breakout here could push Bitcoin toward the $86,000–$89,000 range. That would confirm continuation and keep the rally going.
According to van de Poppe, a breakout above $84K–$87K would confirm a new higher high and likely signal that the bear market is over.
That kind of move would flip the structure fully bullish. Resistance turns into support, and the market starts building higher lows.
Historically, after drops like the move to $60K, Bitcoin usually recovers and hits new highs within a year, except for rare events like the FTX collapse. Add to that stronger macro conditions and new highs in traditional markets, and the backdrop looks more supportive this time.
What If It Fails?
If Bitcoin can’t break $79K, expect some sideways movement. A consolidation phase before another attempt is likely.
“In that case, there’s a level that I prefer to see hold: $73.5k+,” he said
Here, $73,500 becomes the level to hold. If that breaks, the structure weakens, and a deeper pullback toward lower levels could follow.
BlackRock has driven about $2.1B into spot ETFs, while Strategy bought over 34K BTC in a week, far more than what’s mined, tightening supply and pushing prices higher. On the macro side, Kevin Warsh’s calling crypto part of the financial system adds confidence.
More than $21 million in contributions has been made to the "DeFi United" relief effort so far, with another $215 million to be potentially allocated if certain governance proposals succeed.
A market structure analysis circulating on X this week put forward an interesting claim about XRP: retail investors are not pushing the price up, but they are likely the main reason it has not fallen further.
The data behind the argument draws on April 2026 on-chain estimates. Around 50 to 55% of all XRP sits in self-custody or on exchange wallets. Institutions and ETFs hold just 1 to 2% of total supply. Market makers account for 60 to 70% of actual price movement on any given day.
The conclusion the analysis draws from those numbers is that XRP’s price floor is being held up not by active buying but by millions of holders simply refusing to sell. With seven to eight million activated wallets and growing numbers of multi-year holders, a large chunk of supply has effectively been taken off the market through inaction rather than demand.
At current prices, the analysis estimates retail conviction accounts for roughly 40 to 60% of XRP’s effective price floor.
Morgan Is Not Buying It
Bill Morgan read the analysis and explained that Ripple is still the largest single seller of XRP in the market, offloading hundreds of millions of tokens every month. If supply dynamics were truly driving prices, those sales would show up as consistent downward pressure. They do not. That alone, Morgan argued, undermines the retail supply thesis.
More importantly, he pointed to something the analysis does not adequately address: XRP’s price largely tracks Bitcoin. When Bitcoin rises, XRP rises. When Bitcoin falls, XRP falls. That pattern holds regardless of how much Ripple sells or how tightly retail holders grip their tokens.
“The predominant explanatory factor remains Bitcoin price movement,” Morgan wrote.
Where That Leaves Things
XRP is sitting in a phase where retail holders dominate ownership but institutions dominate price movement. The gap between those two realities is where most of the debate lives.
Whether belief and holding behavior are genuinely supporting the floor or whether Bitcoin is simply doing all the heavy lifting is a question the data alone cannot fully settle. But Morgan’s challenge is the one the retail conviction argument needs to answer before it can claim the stronger case.
Momentum around the U.S. CLARITY Act remains uncertain, but Galaxy Digital CEO Mike Novogratz says the long-delayed bill could move forward in May and potentially become law by June.
Speaking with Anthony Scaramucci,Novogratz maintained a positive tone despite recent setbacks. “So this is going to get done. It will probably get done in May,” he said, adding that the legislation is “wildly important” for both political parties and the broader crypto market.
Delays Raise Doubts, Timeline Tightens
The update follows a slow week in Washington, where the Senate Banking Committee failed to schedule a key markup hearing. Expectations that the bill would move in April have now shifted to May.
Even within Galaxy Digital, uncertainty remains. Head of research Alex Thorn puts the odds of passage in 2026 at around 50%. He warned, “If markup slips past mid-May, odds will drop sharply.”
Senator Cynthia Lummis also pointed to a narrowing window, stating, “This is our last chance to pass the Clarity Act until at least 2030.”
Why the Bill Matters
The CLARITY Act aims to create a clear regulatory framework for digital assets in the U.S., something the industry has long pushed for.
“There are eight and a half billion people… probably five and a half billion don’t have access to our financial products,” Novogratz said, adding that crypto could connect global users to the U.S. economy through mobile wallets.
He also pointed to tokenization, suggesting firms like Google and SpaceX could eventually be offered as digital assets to investors worldwide.
Market Forces Add Urgency
Novogratz also noted the tightening of the Bitcoin supply. Michael Saylor-backed Strategy recently bought over 34,000 BTC in a single week, far exceeding the roughly 6,300 BTC mined weekly.
This imbalance, combined with long-term holders holding their positions, is increasing pressure on supply and driving institutional interest.
Despite bipartisan backing, disagreements, especially around stablecoin yields, continue to slow progress. For now, May remains the key window. If lawmakers fail to act soon, the CLARITY Act could face further delays.
Bitcoin was “rejected” from the $80,000 price level, which is its next resistance zone on the way to reclaiming the $100,000 psychological price level.
Bitcoin Cash price trades near $466, holding a critical demand zone around $440-$470.
If the market regains strength, BCH could expand toward the $1200 region by the end of 2026.
In a stronger long-term cycle, Bitcoin Cash may price closer to $3,000 by 2030.
Bitcoin Cash (BCH), one of the most established peer-to-peer payment-focused cryptocurrencies, has entered 2026 with renewed momentum as price structure begins to strengthen after a prolonged consolidation phase.
Following months of range-bound movement, BCH has started to show signs of expansion, with buyers gradually stepping in and pushing price toward higher levels. This shift suggests that the coin may be transitioning from accumulation into a potential breakout phase. If momentum continues to build, BCH could be setting up for a move toward $600 in the near term and potentially $1200 over the broader cycle.
The key question now is whether this emerging strength can sustain. Can Bitcoin Cash maintain its momentum and reclaim higher levels in 2026? Here’s a detailed breakdown of 2026-2030-year trajectory.
Bitcoin Cash (BCH) Price Prediction for April 2026
Bitcoin Cash is sitting at a critical point near $455, and the market is no longer drifting, it’s deciding. After weeks of tight movement, price is pressing repeatedly against the $460–$480 resistance zone, while every dip toward $430–$440 continues to get absorbed quickly.
A sustained move above $480 changes the structure. It shifts BCH from consolidation into expansion, opening a move toward $500–$520, where the next major supply sits. If momentum follows through, the upside can extend quickly, especially if the broader market supports altcoin strength.
But until that breakout happens, caution remains. If BCH continues to get rejected near resistance, the market is likely to stay range-bound, with price rotating back toward the $420–$430 support zone. That level has held multiple times, and losing it would delay any bullish continuation.
For April–May 2026, BCH is expected to trade between $480 and $560, with a breakout above $480 acting as the trigger that defines the next move.
Looking ahead, BCH’s broader outlook suggests a market that is moving out of consolidation and into a potential expansion phase. BCH coin has spent considerable time building a base, absorbing supply and stabilizing after previous volatility. This phase often precedes stronger directional moves, particularly when supported by improving structure.
The recovery path depends on reclaiming key levels. The first confirmation lies above $500, followed by a stronger expansion zone near $700–$800. These levels act as checkpoints for sustained momentum. Once these zones are cleared, price behavior typically accelerates, allowing the asset to transition into a higher trading range.
In this scenario, BCH could advance toward the $600–$1200 range in 2026, reflecting a full expansion cycle driven by structural breakout. However, if momentum weakens and key supports fail, the market may revert to a range-bound phase before attempting another move higher.
Recent News/Catalysts For Bitcoin Cash (BCH)
Renewed interest in payment-focused cryptocurrencies, supporting BCH’s core use case.
A protocol upgrade focused on improving network capabilities is approaching, bringing renewed attention to BCH’s utility narrative.
The asset is regaining traction as a low-cost payment alternative, aligning with a market increasingly focused on real-world use cases.
Market rotation toward established altcoins, bringing attention back to legacy assets like BCH.
Bitcoin Cash Price Targets 2026 – 2030
Year
Potential Low ($)
Potential Average ($
Potential High ($)
2026
600.00
850.00
1200.00
2027
820.00
1200.00
1600.00
2028
1100.00
1800.00
2100.00
2029
1500.00
2200.00
2500.00
2030
2000.00
2500.00
3000.00
BCH Price Prediction 2026
In 2026, Bitcoin Cash price could project a low price of $600.00, an average price of $850.00, and a high of $1200.00.
Bitcoin Cash Price Prediction 2027
As per the Bitcoin Cash price Prediction 2027, Bitcoin Cash may see a potential low price of $820.00, The potential high for Bitcoin Cash price in 2027 is estimated to reach $1600.00
BCH Price Analysis 2028
In 2028, Bitcoin Cash price is forecasted to potentially reach a low price of $1100.00, and a high price of $2100.00
Bitcoin Cash Price Prediction 2029
Thereafter, the Bitcoin Cash (BCH) price for the year 2029 could range between $1500.00, and $2500.00
Bitcoin Cash Price Forecast 2030
Finally, in 2030, the price of Bitcoin Cash is predicted to maintain a steady and positive. It may trade between $2000.00 and $3000.00
The long-term projection assumes Bitcoin Cash (BCH) sustains relevance in overall cryptocurrency adoption and the continued development of blockchain payment solutions, with growth moderating over time as the asset matures.
Stay ahead with breaking news, expert analysis, and real-time updates on the latest trends in Bitcoin, altcoins, DeFi, NFTs, and more.
FAQs
What is the prediction for Bitcoin Cash in 2026?
Bitcoin Cash could trade between $600 and $1,200 in 2026, with an average around $850 if the market regains momentum and BCH breaks the key $650–$700 resistance zone.
How much will Bitcoin Cash be worth in 2030?
Bitcoin Cash could trade between $2,000 and $3,000 by 2030, depending on global crypto adoption, market cycles, and BCH’s role in digital payments.
What is the Bitcoin Cash price prediction for 2040?
Long-term projections suggest BCH could reach $8,200 to $12,000 by 2040 if blockchain payments grow and the network maintains strong adoption and relevance.
Can Bitcoin Cash grow beyond its current use case?
Yes, BCH could grow through wider merchant adoption, faster payments, and improved on-chain utility in real-world transactions.
Is Bitcoin Cash a good long-term investment?
BCH has long-term potential due to low fees, fast transactions, and growing merchant adoption, but price depends on broader crypto market trends.
Can Bitcoin Cash reach its all-time high again?
Revisiting previous highs is possible if BCH sees sustained adoption and a confirmed long-term trend reversal, though it’s not guaranteed.
XRP holds a strong demand zone at $1.30–$1.40. If support remains intact, the token could shift from consolidation to recovery as broader crypto market momentum builds..
Long-term forecasts suggest XRP could reach $5–$6 by 2026 and potentially $18 by 2030, driven by institutional adoption, Ripple partnerships, and global payment integration
Ripple (XRP) Ripple’s XRP remains one of the most closely watched assets in the crypto market, largely due to its strong positioning in the cross-border payments sector and the continued expansion of Ripple’s financial infrastructure. Over the years, Ripple has focused on building partnerships with banks and payment providers to streamline international settlements through blockchain technology. XRP’s long-term outlook continues to revolve around global payment integration, institutional partnerships, and the adoption of RippleNet and On-Demand Liquidity solutions. These developments could gradually strengthen XRP’s role as a bridge asset for international payments.
XRP price structure around $1.30–$1.40 has emerged as an important demand zone where buyers have shown consistent interest. If this area continues to hold, the market could gradually shift from consolidation to recovery. With the broader crypto market entering another potential expansion phase, XRP remains positioned as one of the major altcoins that could benefit from renewed institutional and retail participation. Now, making this the most ideal time for XRP price prediction 2026-2030 to be in more focus. Read this to know in depth what’s coming next in XRP.
As April draws to a close, XRP’s price action reflects a market that is gradually transitioning out of a prolonged corrective phase, with structure stabilizing above the $1.30–$1.40 demand zone. After months of consistent lower highs within a descending channel, the recent compression near support suggests that selling pressure has eased while buyers are starting to step in more actively.
XRP is now trading just below a key resistance trendline, with price tightening into a narrow range as participation begins to improve. This combination of compression and rising activity typically precedes a directional move, placing the asset at a critical breakout stage heading into May.
The immediate focus now shifts toward the $1.50–$1.70 region. A sustained move above this zone would confirm a breakout from the descending structure, opening the path toward the $1.90–$2.20 level, followed by a potential extension into the $2.20–$2.50 supply zone if momentum continues to build. This aligns with the broader structure where reclaiming lost resistance levels becomes key to shifting sentiment.
However, the structure still requires confirmation. If XRP fails to break above resistance and faces rejection, the price may continue consolidating within the current range. A breakdown below the $1.30 support could weaken the setup, potentially pushing the asset back toward lower levels and delaying the recovery phase.
In this context, XRP in May may reach the $1.90–$2.50 range if the breakout sustains, while failure to confirm strength could keep the price range-bound near current levels as the market continues to build momentum.
CoinPedia’s XRP Price Prediction 2026
The broader price structure for XRP in 2026 suggests a market transitioning out of a corrective phase, but still awaiting confirmation of a sustained trend reversal. Following its rally in previous cycles, XRP peaked near the $3.50 region before entering a prolonged downtrend, defined by a descending resistance structure and consistent lower highs throughout 2025. This trend has carried into early 2026, with price recently stabilizing near the $1.20–$1.30 demand zone as selling pressure begins to ease.
At this stage, the focus shifts toward whether XRP can reclaim key resistance levels and attract renewed demand. The immediate barrier remains at $1.70, followed by stronger resistance at $2.50 and the major supply zone between $2.60–$2.80. Beyond technical structure, regulatory and institutional catalysts are likely to play a decisive role in XRP’s trajectory through 2026.
Developments around U.S. crypto legislation, particularly frameworks such as the CLARITY Act, aimed at defining digital asset classifications, could provide long-awaited regulatory certainty. For XRP, which has been heavily influenced by legal outcomes, clearer classification could significantly improve institutional confidence and unlock broader participation.
At the same time, ongoing expansion of Ripple’s enterprise payment solutions and XRP Ledger (XRPL) integrations in cross-border settlement continues to strengthen its real-world use case. Any acceleration in adoption among financial institutions or payment corridors could act as a direct demand driver. Additionally, increasing discussion around spot crypto ETF expansion beyond Bitcoin and Ethereum introduces a longer-term narrative tailwind. While speculative at this stage, any progress toward broader altcoin ETF inclusion could materially shift liquidity flows toward assets like XRP.
If these catalysts align with a breakout above key resistance levels, XRP could transition into a recovery phase. A sustained move above $2.50 would signal structural improvement, with a breakout above $3.80 opening the path toward the $6.00–$9.50 range over time. However, until both regulatory clarity and technical confirmation materialize, XRP remains in a transitional phase. Failure to hold the $1.20 support could extend consolidation and delay upside momentum.
Recent News/Catalysts for XRP
Progress around U.S. crypto regulation, especially frameworks like the CLARITY Act, is improving sentiment around XRP’s long-standing legal overhang.
Expansion of XRP utility across payment corridors and enterprise integrations continues to strengthen its real-world demand narrative.
Ongoing XRP Ledger upgrades and ecosystem developments are enhancing network efficiency and institutional readiness.
Improving macro sentiment and broader market recovery are supporting renewed capital rotation into large-cap altcoins like XRP.
XRP On-Chain Outlook
XRP’s on-chain data is currently pointing toward a cooling market environment, where activity has slowed but structural conditions are quietly improving. Spot trading volume across exchanges has dropped to its lowest level since 2024, reflecting reduced participation and weaker short-term momentum. This decline indicates that the market is no longer driven by aggressive trading, but is instead moving through a low-liquidity consolidation phase. At the same time, liquidity remains concentrated on major platforms like Binance, Upbit, and Coinbase, suggesting that while overall activity has declined, core market interest is still intact.
On the derivatives side, a more significant shift is unfolding. XRP’s leverage and open interest in Binance have dropped sharply, signaling a major reset in speculative positioning. The estimated leverage ratio has fallen substantially from previous highs, while open interest has cooled to much lower levels. This indicates that leveraged traders have largely exited or reduced exposure, removing excess risk from the market.
This combination of declining spot activity and reduced leverage suggests that XRP is transitioning from a highly speculative phase into a cleaner, more stable structure. With the market now less crowded and less prone to liquidation-driven volatility, the current setup reflects a reset phase, where pressure is building more gradually.
Overall, XRP’s on-chain signals point toward a market that is not weakening, but resetting after excess, creating conditions that often precede a more sustainable and directional move once momentum returns.
Ripple (XRP) Price Prediction 2026 – 2030
Year
Potential Low ($)
Potential Average ($
Potential High ($)
2026
3.40
6.50
9.50
2027
7.50
10.00
12.00
2028
8.80
11.50
16.00
2029
14.20
19.00
22.00
2030
18.80
23.00
30.00
Ripple (XRP) Price Prediction 2026
The XRP price range in 2026 is expected to be between $3.40 and $9.50
XRP Price Prediction 2027
Ripple (XRP) price range can be between $7.50 to $12.00 during the year 2027.
XRP Price Forecast 2028
In 2028, Ripple is forecasted to potentially reach a low price of $8.80, an average price of $11.50, and a high price of $16.00.
XRP Price Targets 2029
Thereafter, the XRP price for the year 2029 could range between $14.20 and $22.00.
Ripple (XRP) Price Prediction 2030
Finally, in 2030, the price of XRP is predicted to remain steady and positive. It may trade between $18.80 and $23.00.
Based on historical market sentiment and trend analysis, the following are the possible XRP price targets for longer-term time frames.
Year
Potential Low ($)
Potential Average ($)
Potential High ($)
2031
25.00
29.50
35.25
2032
31.50
36.75
41.25
2033
35.75
42.25
47.75
2040
97.50
135.50
179.00
2050
219.25
331.50
526.00
Market Analysis
Year
2026
2027
2030
Changelly
$3.00
$6.50
$17.76
DigitalCoinPrice
$4.20
$7.50
$18.00
WalletInvestor
$4.80
$7.90
$20.00
Never Miss a Beat in the Crypto World!
Stay ahead with breaking news, expert analysis, and real-time updates on the latest trends in Bitcoin, altcoins, DeFi, NFTs, and more.
FAQs
What is the XRP price prediction for 2026?
XRP could trade between $3 and $6 in 2026 if crypto market momentum strengthens and Ripple expands partnerships with banks using RippleNet and ODL.
How high will XRP go in 2030?
XRP could potentially reach $18–$30 by 2030 if the crypto market enters a strong bull cycle and Ripple expands global payment partnerships.
What is the price prediction for XRP in 2031?
Market projections suggest XRP could trade around $25–$35 in 2031, depending on global crypto adoption and Ripple’s continued growth in payment infrastructure.
How much will 1 XRP be worth in 2040?
If adoption of blockchain payments grows and Ripple strengthens its financial network, XRP could trade between $97 and $179 by 2040.
How much will 1 XRP be worth in 2050?
Long-term projections indicate XRP could reach $219–$526 by 2050 if blockchain payment networks become widely used across global financial systems.
What could drive XRP’s price growth long term?
XRP’s long-term growth may depend on global payment adoption, institutional partnerships, and wider use of Ripple’s blockchain infrastructure.
Is XRP a good investment?
XRP may be a promising investment due to its role in cross-border payments and growing institutional adoption, but price volatility and regulation risks remain.
Geopolitics moves crypto faster than any technical indicator ever will. A ceasefire announcement involving the Strait of Hormuz wouldn’t just ease oil prices. It would flip the risk appetite switch across every market that’s been trading defensively for months, and crypto would feel it within hours.
When global tension drops, money that’s been sitting on the sidelines starts looking for places to go. Established assets catch the first wave. Meme coins catch the second. And earlier-stage presale crypto tokens catch the attention of traders who suddenly have the mental bandwidth to look beyond their existing positions.
All three happen in sequence, and all three matter for different reasons.
Dogecoin: First To Move, First To Fade
DOGE is a pure sentiment thermometer. When risk appetite returns, retail floods back into the assets they know and feel comfortable with, and Dogecoin is the most recognizable name in meme crypto. A ceasefire announcement would likely trigger a quick spike as social media lights up and retail capital rushes in.
The problem with DOGE in these scenarios is that the spike tends to be sharp and short. There’s no structural demand underneath the sentiment move, so the price runs up on excitement and drifts back down once the initial energy fades. Traders who catch the first few hours do well. Traders who arrive a day late often buy the top.
That pattern is exactly why experienced DOGE traders keep one eye on presale crypto tokens during macro shifts. The meme trade gives you the quick hit. The presale position gives you something with a longer runway if you pick the right project.
Ethereum: Slower But More Durable
Ethereum responds to geopolitical stability differently than meme coins. The move is slower, driven by institutional repositioning rather than retail excitement. When global risk decreases, institutional money flows back into assets with fundamental utility, and ETH is the first crypto asset most institutions consider after Bitcoin.
ETF inflows, renewed DeFi activity, and Layer 2 ecosystem growth all accelerate when the macro environment stabilizes. Ethereum’s price reaction to a ceasefire wouldn’t be an overnight spike. It would be a steady grind upward over weeks as capital rotates back into risk assets with real infrastructure behind them.
For portfolio construction, ETH is the position that benefits most from sustained stability rather than a single headline.
TradeView: Where Active Traders & Whales Are Repositioning
A ceasefire doesn’t just move prices. It changes trading behavior. When uncertainty drops, traders shift from defensive positioning to active strategy. They start looking for platforms with better tools, more flexibility, and trading infrastructure that lets them capitalize on renewed market momentum.
TradeView is built for exactly that shift. AI-driven analysis processing price patterns and cross-exchange signals, social trading with real-time visibility into experienced traders’ decisions, live streaming that turns isolated execution into a shared experience, and leverage up to 1001x for traders who understand what they’re doing with it.
The presale sits at $0.015 per token, stepping to $0.02 next stage, with over $180,000 raised. The 34% presale allocation and vested team tokens provide structural protections that matter when evaluating presale crypto tokens against the flood of projects that launch during bullish macro shifts and disappear six months later.
Tokenomics Built For Long-Term Stability
$TVX distributes supply across community incentives, ecosystem development, liquidity, and governance participation. The structure avoids the concentration problem that kills most presale projects, where founders hold enough tokens to crash the price the moment selling unlocks.
Governance runs through a DAO, giving token holders voting power over protocol upgrades, fee structures, and supported assets. That decentralized control structure becomes more valuable during macro transitions because the platform can adapt to changing conditions through community consensus rather than waiting for a single team to make decisions.
What’s Ahead
A complete Strait of Hormuz ceasefire would move all three of these assets, but in completely different ways and on completely different timelines. DOGE spikes fast on retail sentiment and fades just as quickly.
Ethereum builds gradually as institutional capital rotates back into fundamentals. TradeView captures attention from active traders looking for better infrastructure during the behavioral shift that follows macro stabilization.
The 2026 World Cup is shaping up differently. Forty-eight teams instead of thirty-two, three host countries, and a qualifying cycle that brought in a few unexpected names — Cape Verde, Indonesia, Haiti, Curaçao. For fans, that means more matches and more angles to follow. For those looking to bet on the FIFA World Cup with crypto, it also raises a practical question: whether to stick with traditional sportsbooks — or try something built around Web3.
Conventional bookmakers aren’t going anywhere. They still offer deep liquidity, familiar interfaces, and a level of regulatory clarity many users prefer. But if you’ve ever dealt with delayed withdrawals or sudden verification requests, it’s not hard to see why some bettors are looking at alternatives.
That’s where Web3 sportsbooks come in. They’re not perfect, but they do change how betting works in a few important ways.
What “Web3 Betting” Actually Means
At a basic level, you’re not opening an account in the usual sense. You connect a wallet — something like MetaMask or any WalletConnect-compatible option — and that becomes your identity on the platform.
Funds don’t sit in a central account. Each bet is signed from your wallet and recorded on-chain. No login, no password reset, no stored personal data.
Dexsport.io: a Web3 platform with no-KYC registration, instant deposits and withdrawals
What to Look For (Beyond the Buzzwords)
Not every “Web3 sportsbook” actually works the way it claims. Some borrow the language but keep a fairly traditional backend. A few things are worth checking before you put real money in.
Custody model
If you’re asked to deposit funds into an internal balance, it’s not truly non-custodial. A genuine setup lets you sign transactions directly from your wallet every time.
Licensing and basic oversight
You’ll often see jurisdictions like Curaçao or Anjouan. They’re not top-tier, but they’re still better than nothing. More important, in practice, is whether the platform has been around long enough to build a track record — and whether users actually get paid.
Networks and fees
This gets overlooked. If a platform only supports Ethereum mainnet, transaction costs can eat into smaller bets. Many users prefer BNB Chain or Polygon for faster and cheaper execution. It’s worth checking what you’ll actually be using day to day.
Withdrawals (test this early)
Before doing anything serious, try a small cycle: deposit, place a minimal bet, withdraw. On a fast network, it should take minutes, not hours. If it doesn’t, that’s already a signal.
Market depth
For the World Cup, this matters more than usual. The difference between a basic book and a strong one isn’t just odds — it’s the range of markets. Corners, cards, player props, time-based bets. The more options there are, the more flexibility you have during live matches.
A Practical Example
One platform that comes up often in this space is Dexsport. It’s not the only option, but it’s a useful reference point because it gets some of the fundamentals right.
It runs on a non-custodial model, so bets are signed from the user’s wallet rather than held in an internal balance. The platform has been around since 2022, holds an Anjouan license, and has passed third-party smart contract audits. In terms of networks, it supports a fairly wide range — including lower-fee chains like BNB Chain and Polygon — which makes small and mid-sized bets more practical.
Coverage is also solid. Major football competitions are well represented, and on high-profile matches the number of available markets is noticeably higher than what you see on more minimal platforms. Live World Cup betting is available, and cash-out functionality has been added relatively recently — something that wasn’t always standard in Web3 environments.
For new users, Dexsport offers a sports welcome bonus: free bets totalling 60% of the first three deposits. More useful for a month-long tournament is the weekly cashback — up to 15% on net losses with no wagering requirements.
Welcome bonuses of up to 60% on Dexsport.io
That said, it’s not without trade-offs. There’s no dedicated mobile app, and while the browser version works, it’s not as smooth as what you’d get from a top-tier traditional bookmaker. Access is also restricted in certain countries. And like with any non-custodial setup, user error isn’t something support can fix.
In other words, it does a lot right — but it’s still worth testing for yourself rather than taking any single review at face value.
Practical Tips Before the Tournament Starts
A few simple habits make a difference, especially if you’re new to this setup.
Use a separate wallet
Keep your betting funds isolated. It’s a small step, but it reduces risk if something goes wrong — whether that’s a contract issue or a phishing attempt.
Start small
Even if a platform looks solid, there’s no reason to go heavy on day one. A couple of test bets tell you more than any feature list.
Be careful with workarounds
Trying to bypass regional restrictions (for example, via VPNs) often creates more problems than it solves. Accounts can get flagged, and withdrawals can become complicated.
Focus on execution, not just odds
Fast settlement and reliable payouts matter just as much as pricing — especially during a tournament with constant live action.
Final Thoughts
Crypto betting isn’t a replacement for traditional sportsbooks — at least not yet. But it’s clearly carving out a niche among users who value speed, control, and fewer barriers around withdrawals.
For the 2026 World Cup, it’s a viable option — provided you approach it with the same caution you would any other platform. Test first. Keep expectations realistic. And once everything checks out, treat it as part of the experience, not the whole point of it.
Southeast Asian regulators have quietly become crypto’s most unpredictable gatekeepers. The Philippines joins Singapore and Thailand in enforcement against platforms operating without local licenses.
This week, the Philippine SEC waved a red flag against dYdX for reaching Filipino users. Traders holding Shiba Inu positions on dYdX suddenly faced accessibility questions. Many moved toward TradeView’s 1001x leverage platform.
Best crypto presales backing platforms prepared for regulatory fragmentation attract capital during such moments. Top presale crypto projects offer infrastructure handling jurisdictional complexity.
How the Philippine SEC Waved a Red Flag Against dYdX
The Philippine SEC issued a public advisory warning citizens about dYdX operating without proper registration. The regulatory body highlighted that Filipino traders using the platform may lack legal recourse if disputes arise. This follows a pattern across ASEAN countries where governments clarify that international DEXs need local licenses.
The advisory doesn’t technically block access. But it creates reputational risk and possible future enforcement.
Traders notice these signals and reposition accordingly. Centralized platforms face this pressure repeatedly across emerging markets. Decentralized alternatives designed for permissionless access handle these situations without disruption because they have no local entity.
TVX Presale Data Explained for Traders Watching Regulatory Shifts
Presale participation during regulatory transitions requires understanding both token mechanics and platform fundamentals. Not every presale survives jurisdictional complications.
$TVX is priced at $0.015 per token right now. The next stage increases that price to $0.02. These price points matter because presale tokens crypto move through stages where early buyers get better rates. USDT raised so far totals $180,173, showing solid interest. $TVX sold indicates 12,011,533 tokens have moved during this presale phase.
Best crypto presales in 2026 tied to jurisdictionally neutral platforms tend to weather regulatory storms better than those depending on specific market approvals.
Why Shiba Inu Traders Shifted Positions to TradeView’s 1001x DEX
Shiba Inu holders get underestimated. A lot of them learned hard lessons during the 2022 exchange collapses about how much platform choice matters. When the Philippine SEC flagged dYdX, traders holding positions there, memecoin traders included, had to think fast about where to move.
TradeView’s 1001x leverage DEX offered a clean solution. Self-custody means no local entity can be pressured. Extreme leverage appeals to memecoin traders who typically size positions small and want maximum notional exposure. Presale crypto tokens backing platforms designed this way attract capital during such events.
What Southeast Asian Regulation Means for Decentralized Platforms
The core tension is straightforward: countries want jurisdiction over platforms their citizens use, and most DEXs can’t cleanly give them that. Traders on flagged platforms face real uncertainty about whether they’ll keep access or wake up to a blocked interface.
Fully permissionless infrastructure sidesteps that problem by design, though it creates others, no customer support, no recourse if a smart contract fails, no one to call.
TVX is positioned as infrastructure for that fragmented regulatory world. Whether that positioning holds value depends on how many more jurisdictions start issuing warnings like the Philippines did. Based on the trend so far, probably more rather than fewer.
Mobile cloud mining grows in 2026 as users seek easier Bitcoin mining access through Android and iOS apps. The mobile cloud mining market is still growing, as more people want to try Bitcoin mining without buying hardware or setting up…
Uncertainty hit the XRP market recently after a huge$119 million transfer was sent to Coinbase. Moves like this often leave investors guessing what happens next. Subsequently, the XRP price prediction is underwhelming, and its price of $1.41 at the time of press is not expected to rise much.
This is why some investors are now looking at fixed income options that offer more stability. Varntix is a digital wealth platform that takes it further, offering structured returns and compounded growth. Having millions coming in after it opened its 24% income pool, it is clear that investors prefer smart money over relying on price swings.
XRP Price Prediction Shows Limited 4% Upside
Following the news of the whale transfer, XRP has registered a minimal jump of around 0.68% in the past week.
the XRP price prediction is not as significant either, as tools likeChangelly forecast that XRP will rise around 4% by Q3 2026, FROM $1.41 TO $1.47.
With such a modest XRP price prediction, Varntix emerges as a platform that could help many investors change their strategy. Instead of waiting for slow price gains, the digital asset treasury offers a smarter path, using compounded returns to generate steady growth without relying on XRP market swings.
The XRP Trade Is Slowing Down While Varntix APYs Scale Up Investor Compounded Returns
As the XRP price prediction is only inching up, Varntix flips the game with fixed income and real compounded returns. Its fixed plans range from about 24% APY with a minimum $500 investment and commitment periods ranging from 6 to 24 months.
Meanwhile, flexible accounts sit around 3%-6% APY with a $50 minimum investment and allow for more flexibility in terms of access.
Put $1,000 into a fixed 24% APY plan and reinvest payouts. After a year, you’re not just at $1,240; you’re compounding each payout cycle, pushing returns higher over time. Compare that to XRP moving from $1.41 to $1.47, roughly 4%, and the difference becomes obvious.
That’s the shift. Instead of waiting on XRP price predictions, Varntix uses fixed income structures with defined terms and scheduled payouts, meaning returns are planned, not guessed.
So, whether you choose fixed for higher APY or flexible for liquidity, the real edge is compounded returns quietly building wealth while the market stalls.
Why You Should Add Varntix to Your Core Portfolio Strategy
The XRP price trajectory affirms that holding tokens the traditional way only exposes investors to volatility, and many are looking for a way out.
Varntix boasts on-chain transparency, which makes any capital and return generation visible and easy to track. Rather than chasing erratic price swings, it focuses on fixed income models that pay out in stablecoins like USDT and USDC, keeping earnings stable and less exposed to volatility.
This predictability not only makes cash flow easier to plan but also to manage. Add in compounded returns, and each payout isn’t just profit; it becomes fuel for the next round of growth, steadily building capital over time without relying on market hype.
The result is a portfolio layer that complements XRP exposure while reducing dependence on unpredictable market cycles.
Varntix is a digital asset platform that offers fixed income and flexible earning options with returns paid in stablecoins.
How are returns generated on Varntix?
Returns come from structured fixed income strategies, where earnings are distributed regularly and can be reinvested to benefit from compounded growth.
Why are stablecoin payouts important?
Stablecoin payouts help reduce volatility risk, making it easier to track profits and maintain consistent value regardless of market swings like XRP price prediction changes.
Elon Musk’s latest warning about the U.S. dollar and America’s debt burden has dropped straight into a market already waking up again. Bitcoin has regained ground and is trading around its highest point since early February, around $79,000, and there are new ETF inflows and positive risk appetite, putting the Bitcoin price prediction back on the spotlights.
When headlines turn this loud, holding Bitcoin can feel exciting, but excitement is not a strategy. That is exactly why Varntix stands out under these conditions. Instead of leaving returns at the mercy of sentiment, Varntix gives users a more structured path through fixed yields, clear terms, and income that is easier to understand, track, and plan around.
Why Bitcoin price prediction is getting louder again
The current Bitcoin price prediction narrative is being driven by two forces at once. First, Musk’s renewed debt and dollar warning has strengthened the long-running idea that hard assets and alternative stores of value could benefit if trust in fiat weakens.
Second, institutional demand has gone back to the market. Bitcoin has just shot to a post-February high, and U.S. spot Bitcoin ETFs reported robust April flows, which have put the bulls back on track following a lackluster March.
That does not promise a straight-line rally but it is the reason why traders are again taking a closer look.
Bitcoin Builds Hype, Varntix Builds Predicted Income
Bitcoin can still deliver upside, but for most investors, the real problem is simple: it does not produce predictable income on its own. You either wait for price appreciation or sit through volatility and hope the macro story plays out in your favor.
Varntix is a digital wealth platform built to help users earn fixed yields on their crypto through structured, crypto savings accounts. That makes it easier to treat crypto like part of a financial plan instead of a chart you keep refreshing every twenty minutes.
What makes Varntix stand out is predictability. Varntix offers fixed-term plans across 6, 12, and 24 months, with rates on its fixed savings page reaching up to 24% on USDT and USDC. Instead of depending on whether Bitcoin jumps next week, users can lock in a known return and follow a defined payout structure. That changes the conversation from “maybe” to “here is what this can generate.”
Then there is the structure. Varntix aligns itself with digital wealth, fixed savings, and tokenized bonds instead of pure speculation. It also emphasizes audited smart-contract infrastructure, on-chain transparency, proof-of-reserves reporting, account support, and flexible options to users who desire liquidity over a long lockup.
Why Leave $2,500 Waiting on Bitcoin When It Could Be Paying You Instead?
Here is a practical example: you have invested $2,500 into Bitcoin, and your result depends entirely on price movement. If Bitcoin stays flat, your cash yield is effectively $0. But the same $2,500 into a Varntix fixed plan at up to 24% APY, and the projected annual return is about $600, bringing the total to roughly $3,100. Even using a lower 12% return, that is still about $300 in projected earnings. Bitcoin offers possibilities. Varntix offers a clearer income case.
Conclusion
The latest headlines may keep getting louder as macro fears, ETF flows, and dollar anxiety collide. But noise is still noise. For investors who want crypto to do more than swing with the news, Varntix presents a far more structured alternative. Bitcoin may remain the headline asset, but Varntix is easier to frame as the income-focused move when predictability matters most.
Why is Elon Musk being linked to Bitcoin price prediction right now? Because his latest warnings around U.S. debt and pressure on the dollar have revived the argument that Bitcoin could benefit when confidence in fiat weakens.
Does Bitcoin generate fixed income like Varntix? No. Bitcoin’s return depends mainly on price appreciation, while Varntix promotes structured savings and fixed-yield opportunities.
What makes Varntix different from simply holding BTC? Varntix focuses on fixed returns, stablecoin-based income options, flexible plans, and more visibility around payouts, while BTC remains a volatility-driven asset.
Donal trump meme token TRUMP token fell nearly 20% to around $2.50 ahead of Donald Trump’s exclusive Mar-a-Lago crypto conference, wiping out about $161 million in market value. The token is now down around 96.5% from its all-time high.
Adding to the uncertainty, just hours later, Trump was evacuated from the White House Correspondents’ Dinner after a gunman opened fire outside the venue.
Trump Token Dropped by 20%
The TRUMP token dropped from $3 to suddenly below $2.50, a sharp 20% fall, just hours before Donald Trump’s exclusive Mar-a-Lago crypto conference. The event was promoted as a high-level gathering, limited to the top 297 holders, with the top 29 getting direct access to Trump.
A key reason behind the drop is the classic “sell the news” pattern. As the event approached, many investors chose to sell early and secure profits instead of holding through uncertainty.
After the fall, trading activity jumped sharply. Volume rose 111% to $618 million in 24 hours, showing that the move was driven by strong selling, not random price changes. This kind of high volume with a sharp drop usually points to large-scale selling.
Trump Escapes 3rd Assassination Attempt
Amid the recent market volatility, a serious security incident also happened. Donald Trump was safely evacuated after a reported third assassination attempt during the White House Correspondents’ Dinner at the Washington Hilton.
WATCH: The moment President Trump was escorted out of the White House Correspondents’ Dinner after loud noises were heard. pic.twitter.com/dMt46TGhlo
— Donald J Trump Posts TruthSocial (@TruthTrumpPost) April 26, 2026
According to reports, a gunman tried to breach a security checkpoint while carrying multiple weapons. Security forces quickly responded and moved Trump to safety.
Along with him, JD Vance, Kash Patel, Robert F. Kennedy Jr., and Melania Trump were also evacuated without harm.
The incident added to overall uncertainty, which may have further affected sentiment around the TRUMP token.
Trump Token Down 96% from its Peak
The token has now fallen 96.5% from its all-time high of $75.35 reached in January 2025, wiping out approximately $18.1 billion in total market value since it launched around Trump’s second inauguration.
The technical damage was severe. The token broke cleanly below the key $2.85 support level on high volume, a breakdown that technically opens the door toward $2.48 as the next meaningful support, and $2.10, if that level fails.
A recovery back above $2.80 on real buying volume would be needed just to neutralize the current downtrend, let alone target a retest of $3.00.
South Africa’s National Treasury has released a draft regulation that could force crypto holders to surrender their digital assets. The new draft allows officials to check phones for crypto apps and impose heavy penalties.
Violators could face a 1 million rand ($60,480) fine and up to five years in prison, raising serious concerns across the industry.
South Africa’s Draft Crypto Regulation 2026
The South African government’s Draft Capital Flow Management Regulations 2026 came into public view this week, and the reaction from the country’s financial and crypto industries has been immediate, sharp, and deeply alarmed.
The draft serves as the first wholesale replacement of South Africa’s exchange control framework in more than 60 years.
However, critics say the approach is outdated and not suitable for modern digital assets.
Farzam Ehsani, CEO of South Africa’s largest cryptocurrency exchange VALR, called the proposal “alarming” and warned it could push crypto businesses and investors out of the country. He believes the rules treat crypto as a threat instead of an opportunity.
SA's Treasury releases draft regs that:
→ Force declaration of crypto holdings → Ban P2P trades above a threshold → Let officers demand keys at borders → 5 yrs jail for refusing
Financial expert Steven Sidley also criticized the plan, saying it uses old methods designed for a different economic system.
What the New Crypto Draft Proposes
One of the biggest concerns is the idea of “compulsory surrender.” This means the government could force people to sell their crypto assets and convert them into local currency.
This is not just a tax, it is forced selling. Meanwhile, people may have to give up their crypto and accept local money at a rate set by the same authority.
Under Regulation 4, the draft also gives authorities strong powers to search and seize assets. Ehsani said that this would “presumably include searching your phone for crypto-related apps at all airports and points of exit.”
Breaking these rules could lead to a fine of around 1 million rand, approximately $60,480, and up to five years of imprisonment.
Lack of Clarity Raises More Concerns
Another issue is the lack of clear limits. The draft does not clearly explain what level of crypto holdings would trigger these rules. Instead, it leaves the decision to government officials.
This uncertainty has made industry leaders uneasy, as users may not know when they are breaking the law.
Experts warn that these strict rules could harm innovation and push investors to other countries with better regulations. It may also affect tourism, especially for tech entrepreneurs and digital workers.
Hyperlane price has surged over 60% in a single session, breaking out of a prolonged downtrend and pushing toward $0.15–$0.16 levels. The token is up 73%, marking highs at $0.21 from lows around $0.098, with a mammoth 4100% rise in volume, signaling aggressive participation and a clear shift from compression to expansion. With this, the token has become one of the top performers in the crypto markets.
The price moved fast, but the underlying money flow hasn’t caught up. That creates a disconnect. And that usually matters more than the breakout itself. Now the real test is whether this is the start of a new trend or just a liquidity-driven spike that fades.
What’s Driving the Hyperlane Rally?
Hyperlane’s rally isn’t random—it’s a stack of catalysts + structure + liquidity, all hitting at once.
First, the move is backed by real expansion. The recent TRON integration connects Hyperlane to a network with 370M+ accounts and ~10M+ daily transactions, significantly expanding its potential use cases. That’s not just narrative—it’s a step-change in addressable demand, and markets are pricing that in early.
Second, the price reaction is being amplified by liquidity conditions. HYPER is still a low-cap, thin-order-book asset, which means relatively small capital inflows can create outsized moves. That’s exactly what we’re seeing. Volume jumped to around $10M–$15M+ in a single session, while price surged ~60% intraday, a classic sign of aggressive expansion rather than gradual accumulation.
Third, the rally is technical—but fast. Price broke out of a multi-week descending channel and reclaimed the key $0.10 resistance, which had capped upside for weeks. Once that level flipped, momentum kicked in quickly, pushing HYPER toward $0.15–$0.16 within hours, a 50%+ move from the breakout zone alone.
Hyperlane Price Breakout — Structure Shifts but Momentum Shows Divergence
Hyperlane has delivered a clean breakout from a multi-week descending channel, confirming a shift from a prolonged downtrend to a short-term expansion. Price surged from below $0.10 to $0.15+, marking a ~60% intraday move, with volume rising above $11M, the highest in recent sessions. The reclaim of the $0.10 level is significant, as it had capped price action for weeks, flipping the structure from compression to momentum-driven expansion.
Despite the breakout, the Accumulation/Distribution (A/D) line continues to trend lower near -10.44M, while CMF remains slightly negative around -0.05, indicating weak and inconsistent capital inflows. This creates a mismatch where price is rising, but buy-side conviction is not fully supporting the move. As a result, the $0.15–$0.16 zone becomes critical—acceptance above this range could sustain the breakout, but failure may lead to a sharp pullback, especially given the lack of strong accumulation behind the rally.
What’s Next for the Hyperlane Price?
Hyperlane price has confirmed a structural breakout above $0.10, and the sharp move toward $0.15–$0.16 shows clear momentum expansion. But the way price moved—fast, vertical, and with weak underlying accumulation—suggests this is still a reaction phase, not a fully established trend.
In the near term, the most realistic scenario is volatility before direction. If HYPER can hold above $0.12–$0.13 on pullbacks, the breakout remains valid, and the price can attempt another leg higher toward $0.18–$0.20, driven by continued momentum and narrative strength. However, if price fails to sustain above the breakout zone and slips back below $0.12, the move risks turning into a bull trap, with a likely pullback toward $0.10 or lower, where the original breakout started.
The CFTC has filed suit to block New York from enforcing gambling laws on prediction platforms, arguing federal regulators have sole authority over event-based contracts.
The ORCA price detonated today with a 40% intraday surge sending the token flying from a quiet base near $0.93 to a sharp peak around $1.30 before coming to $1.22, this surged wiped out March month’s boredom in a single, aggressive move. One candle. Clean break. No hesitation and this move didn’t came random but came with a reason.
ORCA was stuck. Trapped under a descending trendline, capped since mid-February, grinding sideways with no real conviction. Then came the move today a full-bodied breakout candle that sliced through resistance like it wasn’t even there.
The so-called “god candle” didn’t just clear horizontal resistance; it invalidated the broader downtrend structure entirely. Price is now trading well above the 200-day EMA near $1.2282, which, in technical terms, flips the narrative from neutral-to-bearish into something far more… optimistic.
But let’s not pretend this was purely technical. Because it wasn’t.
Interestingly, Orca price didn’t just ride market momentum but it helped create it. The project joined over 120 organizations pushing for U.S. Senate action on market structure legislation, aligning itself with groups like the Blockchain Association and Crypto Council for Innovation.
Sounds boring? But, it’s not. Basically, per observation this is the kind of move that signals a pivot from just another decentralized exchange to something aiming for institutional relevance. The message is simple: clear rules enable serious capital. And markets, as always, react fast when “institutional-grade” gets thrown into the mix.
Well, this isn’t about hype cycles. It’s about positioning ahead of regulatory clarity. That’s a different game entirely.
Market structure legislation is foundational to how onchain capital markets develop.
Orca joined 120+ organizations urging the Senate to advance this work because clear rules enable serious infrastructure to be built with confidence.
Indicators flash strength but warn of cooling ahead
Now, technically speaking, everything is screaming bullish… and slightly overheated.
The RSI is sitting at 75.01, deep in overbought territory. That’s not subtle. It reflects aggressive buying pressure, sure but also hints that a cooldown or retest might be around the corner.
MACD? Bullish crossover, expanding green histogram. Momentum is clearly accelerating. The Awesome Oscillator flipped hard into positive territory, reinforcing that shift. And the CMF at 0.08 confirms something important this isn’t just a low-volume spike. There’s actual capital flowing in.
Still, after a 40% move, expecting straight-line continuation is… optimistic at best.
New support forms as ORCA price resets structure
So, the clear focus is on the $1.17–$1.20 range, which is near the 200-day EMA band. This level has previously rejected prices but has now been reclaimed, indicating a significant structural shift. The question remains: can this level hold and sustain above the 200-day EMA band?
In the short term, consolidation seems likely if the price intends to continue moving upward. Markets don’t sprint forever. However, if we take a broader view, the situation begins to look different because a clean breakout, strong inflows, and a narrative centered on regulatory infrastructure rather than mere speculation.
This is the aspect that people might be underestimating. If this shift holds, the ORCA price is not just responding to market conditions; it is undergoing a repricing and if its not then it will be simply collapse as simple as that.
The BSB price didn’t just move but it snapped this week and recent 60% intraday surge is another impressive run. What we observed is an staggering 300% climb in just 14 days of April, from $0.156 to $0.621, this is the kind of move that forces even the most jaded market watchers to pay attention. And no, this wasn’t random. There’s a narrative brewing here and for once, it’s not just hype.
RWA Shift Becomes Structural, Not Speculative
At the Hong Kong RWI Summit, the tone wasn’t your usual buzzword bingo. It was sharper. More technical. Almost… serious. The core message? The first wave of real-world asset (RWA) adoption won’t touch obscure, illiquid junk. It’ll focus on financial assets clean, tradable, and liquid.
Tokenized equities are leading that charge which makes sense. They already have demand. They even trade frequently. But here’s the catch the liquidity is scattered across chains, issuers, and platforms. Fragmented, messy, inefficient.
That’s where the narrative pivots. Instead of issuing more assets into an already cluttered ecosystem, the focus is shifting toward controlling how those assets actually move. Distribution over creation. Execution over existence. It’s less about minting tokens and more about making them usable.
Staking Mechanics Add Fuel To BSB Rally
Now layer in staking, because of course there’s staking. Block Street rolled out its staking model with a twist since participation matters more than passive holding. Users stake BSB into a global lock, with voting power scaling up over time, reaching 4x after a year. Governance participation drives rewards, not just balance size.
And importantly, rewards aren’t inflation-driven. They come from pre-defined ecosystem allocations. No guarantees. No fixed payouts. No dividend promises. Just structured incentives tied to engagement.
Well, this kind of design subtly shifts user behavior. It nudges holders to stay, participate, and commit. And markets love commitment… at least in the short term.
BSB Price Momentum Signals Market Repricing Phase
So, what’s actually driving the BSB price? It’s not just the summit talk. It’s not just staking. It’s the combination.
A narrative shift toward execution-layer dominance in RWAs. A staking model that rewards long-term alignment. And a market that’s clearly willing to reprice fast when those two collide.
But let’s be real parabolic moves come with baggage. The recent rally shows strength, sure, but also raises the usual question: how much of this is sustainable versus reflexive momentum?
Still, one thing’s clear. The BSB price isn’t moving in isolation anymore. It’s riding a broader structural shift, one where tokenized assets stop being experiments and start behaving like actual markets.
Chainlink is quietly attracting steady capital, with ETF inflows now crossing $111 million while price continues to hold firm near the $9.40 region.
Rather than a sharp breakout, the move is developing through consistent accumulation, with inflows building across multiple sessions. This type of steady demand tends to support structure over time rather than trigger short-lived spikes. With capital continuing to enter while LINK price stabilizes near highs, the current setup reflects underlying strength rather than exhaustion.
ETF Inflows Signal Sustained Institutional Demand
Recent data shows a clear trend in capital allocation toward Chainlink. Daily inflows have remained consistently positive, with $3.81M recorded on April 23 and $1.88M on April 24, pushing cumulative inflows to approximately $111.56M.
At the same time, total net assets have expanded beyond $108M, reflecting continued capital retention within the product. Instead of isolated inflow spikes, the data shows repeated accumulation over consecutive sessions. That suggests ongoing positioning rather than opportunistic entry. As inflows continue to build without sharp reversals, it reflects confidence in holding exposure rather than rotating out quickly. This type of behavior typically supports gradual price stability and longer-term structure development.
Whale Accumulation Builds as Supply Continues to Be Absorbed
Alongside ETF flows, accumulation from larger players continues to build beneath the surface. A long-term investor wallet has accumulated nearly 2.8 million LINK (≈$2.59M) over the past six days, with entries concentrated around the $9.25 region. The activity remains ongoing, indicating that positioning is still in progress rather than completed.
At the same time, the Chainlink Reserve has added over 123,000 LINK (~$1.1M), taking total holdings beyond 3.3 million LINK. This introduces protocol-level demand alongside external capital inflows. However, upside remains measured. The 19 million LINK unlock from early April continues to act as an overhead supply layer, with the market still working through that liquidity.
Chainlink Price Analysis: Structure Builds as LINK Holds Above Key Zone
After an extended period of consolidation, the structure around the $9.00 region has continued to hold without breakdown, establishing it as a stable base. From there, upside attempts have started to expand, with price pushing toward the $9.40 region while maintaining higher lows within the current range. Pullbacks have remained controlled, failing to break back into lower zones, which indicates that buyers are defending levels rather than reacting late.
Meanwhile, the range is tightening just below local highs, suggesting that the market is stabilizing rather than rejecting the current levels. There is no aggressive expansion or exhaustion behavior, keeping the move orderly. As long as the structure continues to hold above the $9.00–$9.20 region, the current flow remains intact. This keeps the path open toward the next resistance band near $10.20–$10.50, where the market is likely to test supply. A shift below this base would change the structure back into consolidation, but current behavior continues to favor stability with gradual upside pressure.
Final Outlook
With ETF inflows continuing to build and structure holding above key support, Chainlink remains positioned for gradual upside as long as current levels are maintained. While immediate expansion may remain measured, sustained inflows and stable positioning keep the path open toward higher resistance zones, with continuation dependent on holding the established base.
The asset could reach a high of $6100 by the end of 2026.
The price of Ethereum could reach a high of $15,575 by 2030.
Since its launch in 2015, Ethereum has evolved from a pioneering smart-contract platform into the primary settlement layer for the global digital economy. What began as a space for experimental decentralized applications (dApps) has now transformed into a robust ecosystem attracting significant institutional interest. This shift is largely driven by Ethereum’s “Business Ready” infrastructure, which is designed to support high-assurance financial applications and large-scale tokenization initiatives.
The successful rollout of the Pectra and Fusaka upgrades has significantly improved Ethereum’s scalability and fee efficiency. These upgrades addressed long-standing network bottlenecks, making the platform more practical and cost-effective for enterprise adoption and high-volume blockchain activity.
As the ecosystem progresses through 2026, the narrative surrounding Ethereum has shifted from simple utility to institutional-grade resilience and infrastructure. With a well-defined roadmap emphasizing censorship resistance, modular scalability, and long-term sustainability, Ethereum is increasingly positioned to support the next generation of decentralized finance (DeFi) and global capital markets.
In this Ethereum price prediction for 2026–2030, we examine whether these structural improvements, combined with evolving macroeconomic conditions, could push ETH toward new valuation milestones over the coming years.
In the first quarter of the year, Ethereum’s price faced significant challenges, dropping from the $2,800 support level to a low of $1,750 in early February. But in February, there were some stabilization efforts, and by March, the price rose to $2,370. However, by late March, ETH dipped below $2,000.
Even in April, ETH attempted to retest the $2,390 level, reaching $2,460 in mid-April. Despite this increase, it failed to surpass $2,390 and fell back below it.
Currently, the ETH price is experiencing bearish pressure after taking liquidity above $2,390. It is holding at the 50-day EMA band; if it falls below this level, a return to $2,000 is likely. However, if the 50-day EMA holds, there could be a strong upward breakout above $2,390 in May.
Ethereum Price Prediction 2026
The Ethereum price currently exhibits a compelling long-term technical structure on the monthly timeframe, anchored by a multi-year 45-degree ascending trendline that has guided price action since 2020.
Historically, this trendline has served as a critical pivot point, with the market oscillating between periods of aggressive upward expansion above the line and phases of strategic consolidation below it.
Notably, when ETH trades beneath this trendline, it often forms a secondary short-term ascending channel lasting a few months. These channels act as accumulation zones, where price fluctuates until sufficient demand builds, eventually leading to a high-momentum breakout once bullish conditions are met.
In the current 2026 market environment, Ethereum appears to be following a familiar structural pattern, albeit with increased volatility and a broader trading range. The ongoing ascending channel, which began in 2025, aligns with the multi-year trendline but is significantly wider compared to previous cycles. While the price action indicates recovery potential, the market has not yet reached the specific demand threshold required to trigger a definitive vertical surge.
Overall, Ethereum’s multi-year trendline combined with the current ascending channel suggests a measured accumulation phase, setting the stage for a potential strong bullish breakout in the months ahead.
From a volume perspective, the anchored volume profile suggests that Ethereum (ETH) is finding significant support around key high-volume zones. These areas, particularly the ranges between $1,700–$1,900 and $1,200–$1,400, have historically attracted institutional interest, creating a solid floor that bears are unlikely to easily break.
If buyer demand strengthens at these levels, ETH could follow a recovery trajectory with an initial target near $2,878. A successful breach of this level would then pave the way for a retest of the $4,076 psychological resistance, signaling renewed bullish momentum.
However, a cautious approach remains warranted. If the market fails to generate sufficient demand at these support zones, the current consolidation phase below the multi-year trendline is likely to continue. In this bearish scenario, ETH would remain trading within its 2025 ascending channel, extending the accumulation period before a decisive trend emerges.
The interplay between this short-term ascending channel and the long-term trendline will ultimately determine whether Ethereum’s next move is a bullish continuation or a prolonged sideways consolidation.
ETH On-Chain Analysis
Ethereum’s price is currently stabilizing and 30-days On-chain data shows major whale transaction counts beyond $1 million has been rising in past 30-days. This is signaling “smart money” accumulation near the $2,000 support.
Moreover, the fundamentals of the network are growing. Since January 2025, the value of tokenized real-world assets (RWAs) on the blockchain has reached $20.4 billion. The Ethereum ecosystem now has 146 active Layer 2 networks, with a total value of $38.2 billion locked in these networks. Together, Ethereum’s mainnet and Layer 2 networks show that stablecoins account for over 60% of the market share, totaling about $179 billion.
This indicates a significant amount of liquidity in the ecosystem. Additionally, the number of ETH tokens on centralized exchanges is falling, meaning fewer ETH tokens are less available on CEX platforms meaning bullish pressure increasing.
Ethereum Price Prediction 2027-2030
Year
Potential Low ($)
Potential Average ($)
Potential High ($)
2027
7,071.08
14,142.16
21,213.24
2028
10,606.62
21,213.24
31,819.86
2029
15,909.93
31,819.86
47,729.79
2030
23,864.90
47,729.79
71,594.69
Ethereum (ETH) Price Prediction 2027
The Ethereum 2027 forecast expects the ETH coin price to make a new all-time high at $21,213.24. However, a correction based on market shortcomings may drive the ETH crypto to $7,071.08, with an average of $14,142.16.
ETH Price Prediction 2028
In 2028, the chances of Ethereum dominating the crypto market rise as the ETH price potentially makes a new high at $31,819.86. On the other hand, the altcoin might fall to $10,606.62, making an average of $21,213.24.
Ethereum Price Forecast 2029
Approaching its all-time high of $47,729.79 in 2029, the Ethereum price is expected to surpass the psychological barrier of $40,000. In case of a correction, $ETH may reach a low of $15,909.93, with an average price of $31,819.86.
Ethereum Price Prediction 2030
As per our Ethereum Price Prediction 2030, the ETH crypto price is projected to reach a new all-time high of $71,594.69 in 2030, with a potential low of $23,864.90 and an average price of $47,729.79.
Ethereum (ETH) Price Prediction: Market Analysis?
Year
2026
2027
2030
Changelly
$5,800
$7,500
$25,000
CoinCodex
$6,300
$7,850
$28,200
WalletInvestor
$5,940
$7,450
$21,500
Never Miss a Beat in the Crypto World!
Stay ahead with breaking news, expert analysis, and real-time updates on the latest trends in Bitcoin, altcoins, DeFi, NFTs, and more.
FAQs
What is the Ethereum price prediction for 2026?
Ethereum could reach $6,200 in 2026 if accumulation strengthens and demand at key support levels increases.
What will be the price of Ethereum in 2027?
ETH may hit around $21,200 in 2027, with potential lows near $7,071 depending on market conditions.
How much will 1 Ethereum be worth in 2030?
By 2030, 1 ETH could reach a new all-time high of $71,500 under strong adoption and network growth.
Could Ethereum reach $100,000 by 2040?
If adoption and blockchain integration continue rising, Ethereum could theoretically approach $100,000 by 2040.
How high will Ethereum go in 2050?
Long‑term, Ethereum could exceed $150,000–$200,000 by 2050 with widespread global adoption, DeFi and tokenization.
Is Ethereum a good investment?
Ethereum remains a strong long-term investment due to growing DeFi use, Layer 2 adoption, and rising institutional interest.
Expanding exchange-ecosystem demand could lift BNB price toward $2000 by the end of this year.
Long-term network usage growth may extend BNB price toward $10,000.
Binance Coin (BNB) suggests a fundamental shift in how the asset responds to broader market dynamics. In 2026, the token’s performance increasingly reflects on-chain utility and ecosystem liquidity rather than mere speculative volatility. This transition from reactive price swings to a more structured price action indicates a maturing market environment.
As the ecosystem stabilizes, the technical narrative centers on long-term accumulation and the absorption of supply within established demand zones. Sustained network activity across the Binance Smart Chain provides a foundational backdrop for this consolidation, potentially setting the stage for a period of extended price discovery. By focusing on fundamental network health and institutional integration, the outlook for the next several years leans toward organic growth and structural resilience within the global digital asset landscape.
So, what’s next for the BNB price in the rest of 2026 and beyond? What can be the future price movements? Let’s get into the Binance Coin (BNB) Price Prediction 2026–2030.
In the third quarter of 2025, we witnessed an impressive rally, soaring 125% from the $600 support level to an exhilarating $1,375. However, by the fourth quarter of 2025 and into the first quarter of 2026, the BNB price retreated back to the $600 demand zone, erasing those remarkable gains.
Since February, we have observed a steady accumulation around this vital $600 level, a trend that has continued into March, so Q1 was tough. But, as Q2 began with April and still consolidating, implied that this level appears to have solidified as a robust support point, suggesting that bullish momentum could very well resume in May month.
Despite prevailing market challenges, the BNB price has demonstrated remarkable resilience, remaining above $600 throughout Most of April. Should bullish pressure intensify in May, then we may see a potential retest of $750; otherwise, further consolidation may continue throughout the month.
Recent News/ Opinions
On April 1, 2026, Binance Earn launched new Yield Arena offers, providing limited-time opportunities to earn up to 35% APR. This weekly update spans across multiple products, including Simple Earn, ETH and SOL Staking, and Dual Investment.
On March 27, 2026, binance shared that equity and commodity perpetual futures on Binance surpassed $150 billion in cumulative trading volume. This milestone was supported by an immense processing of over 110 billion trades in one quarter, highlighting the growing crossover between traditional finance and digital markets.
A recent ruling news on March 7th came from the US federal court that it has positively dismissed all anti-terrorism claims against Binance, alleviating a significant legal burden. In the Southern District of New York, a judge concluded that the plaintiffs, comprising 535 individuals citing 64 attacks from 2017 to 2024, did not establish sufficient evidence to demonstrate that Binance had assisted or conspired with terrorist organizations. This decision marks a commendable step forward for Binance, affirming its commitment to compliance and integrity.
Binance Coin (BNB) Price Prediction 2026
Based on the technical structure of the BNB/USD weekly chart, the price action reflects a long-term ascending channel (or wedge) that has defined the asset’s trajectory since the massive demand surge from the $40 level in early 2021. This multi-year uptrend culminated in a new all-time high of approximately $1,375 in late 2025, validating the token’s utility and its position within the Binance ecosystem. Currently, the market is witnessing a convergence of horizontal price levels with channel’s dynamic trendline support, which reinforces the technical significance of the current price zone.
As of Q1 2026, BNB price is testing a critical turning support zone around the $600 horizontal support, which aligns precisely with the lower boundary of the primary ascending channel. This area is currently serving as a consolidation floor, suggesting a period of institutional accumulation. Historical precedent highlights the importance of this trendline; a similar touchpoint in late 2023 at the $200 range served as the launchpad for a massive rally, though it took roughly 238 days to reach the channel’s median line.
Looking ahead through 2026, the primary bullish thesis anticipates a recovery toward the $1,000 psychological level. If the recovery pace mirrors previous cycles, BNB/USD could reach the channel’s middle band by Q3 2026. However, if consolidation extends further into the year, the recovery might be more gradual, stretching toward the year-end.
Conversely, a decisive break below the $600 footing would invalidate the current setup, significantly increasing the probability of a deeper correction toward the major $200 demand zone.
BNB On-Chain Analysis
Recent on-chain data highlights the network’s resilience, with daily transactions stabilizing at 15 million in Q1 2026 despite market fluctuations. This sustained utility, paired with total unique addresses nearing the 800 million mark, signals a consistent rise in global adoption. These fundamental metrics suggest a robust foundation for long-term ecosystem growth and structural asset valuation.
Binance Coin Crypto Price Prediction 2027 – 2030
Year
Potential Low ($)
Potential Average ($
Potential High ($)
2027
1200
1420
1800
2028
1600
1950
2300
2029
2100
3250
3900
2030
2500
3800
4500
Binance Coin Price Prediction 2027
As per the Binance Coin Price Prediction 2027, Binance Coin may see a potential low price of $1200. The potential high for Binance Coin price in 2027 is estimated to reach $1800.
BNB Price Prediction 2028
In 2028, Binance Coin price is forecasted to potentially reach a low price of $1600 and a high price of $2300.
Binance Coin Price Forecast 2029
Thereafter, the Binance Coin (Binance Coin) price for the year 2029 could range between $2100 and $3900.
Binance (BNB) Coin Price Prediction 2030
Finally, in 2030, the price of Binance Coin is predicted to remain steadily positive. It may trade between $2500 and $4500.
The long-term projection assumes Binance Coin sustains relevance in enterprise blockchain use cases, with growth moderating over time as the asset matures.
Stay ahead with breaking news, expert analysis, and real-time updates on the latest trends in Bitcoin, altcoins, DeFi, NFTs, and more.
FAQs
What is the BNB price prediction for 2026?
BNB could recover toward $1,000 in 2026 if the $600 support holds and Binance ecosystem demand grows, supported by rising network usage and liquidity.
What will be the BNB price in 2030?
BNB could trade between $2,500 and $4,500 by 2030 if blockchain adoption grows and the Binance ecosystem maintains strong network activity.
How high can BNB price go by 2040?
Long-term projections suggest BNB could reach $13,000–$38,000 by 2040 if the network expands globally and maintains strong adoption across DeFi and Web3.
What factors influence Binance Coin’s price?
Price depends on exchange network usage, liquidity, adoption trends, historical support/resistance zones, and institutional participation.
Is Binance Coin (BNB) a good long-term investment?
BNB is often viewed as a strong long-term asset due to exchange utility, token burns, and ecosystem growth, though crypto investments always carry risk.
The TRUMP coin is heading into a high-stakes event window tonight, and the price is already reacting. After consolidating in recent weeks, the token is now trading near key levels as anticipation builds around Donald Trump’s crypto gala. This isn’t the first time. A similar setup earlier this year saw TRUMP surge into the event, only to drop sharply right after.
The OFFICIAL TRUMP price has already moved. Positioning is crowded. And with hundreds of top holders attending tonight’s event, the next move may not be about buying but about who exits first. Will TRUMP see one final push higher, or is this setting up for a classic sell-the-news drop?
The TRUMP token appears to be following a repeatable event-driven pattern, where price rallies ahead of a major catalyst and weakens once the event concludes.
In April–May 2025, the TRUMP price surged nearly 50–60% before a gala event, only to drop around 16% the following day. A similar structure is now forming in 2026, with the token climbing from approximately $2.7 to $4.4 ahead of tonight’s high-profile gathering involving 297 holders and 29 VIP participants. This pre-event rally suggests that much of the bullish momentum may already be priced in, increasing the risk of a post-event pullback if fresh demand fails to enter.
However, the current setup includes an important wildcard. Any pro-crypto commentary or regulatory hints related to the GENIUS Act or CLARITY Act could trigger a short-term price spike, extending gains before a potential reversal. This creates a likely two-phase price structure, where an initial headline-driven pump is followed by sell-the-news distribution. Adding to the complexity, unresolved geopolitical tensions, particularly around Iran, introduce macro downside risk that could amplify any post-event correction.
As a result, the period following 9:30 PM IST becomes a critical window for traders watching whether TRUMP sustains momentum or begins to unwind.
TRUMP Price Analysis: Key Support Holds as Breakout Pressure Builds
TRUMP price is currently consolidating within a tight range between $2.60 and $3.10, following a sharp correction from recent highs near $4.00+. The chart shows a clear range-bound structure, with strong support forming around the $2.60–$2.70 zone, where buyers have consistently stepped in. At the same time, resistance near $3.10–$3.55 continues to cap upside attempts, creating a compression phase. Bollinger Bands are beginning to tighten, indicating declining volatility and a potential breakout setup, while RSI is trending gradually higher, suggesting building momentum without overbought conditions.
This structure points to an imminent expansion move. A decisive breakout above $3.10 could trigger a push toward $3.55 and $4.00, especially if supported by event-driven momentum. However, failure to hold the $2.60 support zone would weaken the structure and expose TRUMP to further downside, potentially invalidating the pre-event buildup. With price coiling near resistance and momentum slowly rising, the next move is likely to be sharp and directional, making this a critical level to watch in the hours ahead.
TRUMP at a Decision Point—Event to Decide the Move
TRUMP is not trending right now; it’s preparing. Price is compressing below $3.10, but the chart alone won’t decide what happens next. The trigger is the event. If tonight delivers even a mildly bullish headline, TRUMP can break higher fast, pushing toward $3.50–$4.00 on momentum and late positioning.
This rally already happened before the event. That shifts the risk. If there’s no strong catalyst, or even after a short spike, this can quickly turn into a sell-the-news move, with the OFFICIAL TRUMP price sliding back toward $2.60 or lower as early buyers exit.
Momentum around the U.S. CLARITY Act markup has slowed further after the Senate Banking Committee failed to signal any markup schedule before the end of the week, pushing expectations into May and raising doubts over the bill’s near-term progress.
Eleanor Terrett reported that no update came from Senator Tim Scott or Senate Banking Committee Republicans regarding a markup for next week. Friday was viewed as the informal cutoff to announce proceedings before the Senate enters recess, and the absence of any notice has effectively removed the April window.
April Window Closes as Senate Schedule Tightens
While hearings can technically be scheduled on short notice, the lack of formal communication makes an April markup increasingly unlikely. The Senate is set to enter a weeklong recess on Thursday, further narrowing the remaining timeframe.
Attention is now shifting toward early May, with multiple industry and Senate sources indicating the markup is more likely in the second week of the month.
Competing Priorities Inside the Senate
Committee leadership may also be focused on a confirmation vote for Federal Reserve Chair nominee Kevin Warsh before turning to crypto legislation. This adds another layer of delay to an already compressed schedule.
Senator Thom Tillis has requested additional time to engage with banking groups on the stablecoin yield issue and has pushed for draft text to be released publicly ahead of markup. However, no draft has been circulated, making a near-term schedule unlikely.
Industry Warning Signs and Growing Concern
The delay has triggered concern across parts of the crypto policy community. Analysts, including commentator Nic, noted that a key deadline passed without movement, suggesting weakening momentum for immediate progress.
With the Senate calendar tightening ahead of the Memorial Day recess, there are concerns that further delays could push the bill deeper into uncertainty or reduce its chances of advancing this year.
Lobbying Pressure Intensifies
Industry groups continue to push for action. The North Carolina Blockchain Initiative recently urged Senator Tillis to move the bill forward, arguing that opposition from banking groups over stablecoin yield does not reflect broader sentiment across the industry or state-level policymakers.
The group warned that restricting yield-bearing stablecoin products could drive innovation offshore, while framing the CLARITY Act as important for maintaining U.S. competitiveness in digital assets, especially in financial hubs like Charlotte.
Outlook Shifts to Mid-May
With no formal markup notice and limited legislative time remaining in April, expectations now center on a second week of May timeline. The delay leaves the CLARITY Act’s path forward increasingly dependent on Senate coordination and resolution of stablecoin-related disagreements.
BridgeTower Capital has officially deployed Chainlink’s full infrastructure stack to tokenize securities tied to the DOM X Arizona Copper-Gold Project, an $11 billion US natural resource initiative, in what the companies describe as live production infrastructure rather than a pilot.…
Coinbase has filed with the CFTC to activate Trade at Settlement for XRP futures on May 1, placing XRP alongside Bitcoin, Ethereum, gold, and crude oil as an asset institutional traders can execute at the official settlement price. Coinbase filed…
Pi Network has confirmed it is an official sponsor of Consensus 2026 in Miami, with co-founders Nicolas Kokkalis and Chengdiao Fan each presenting at the event on May 7 and May 6 respectively, as the network simultaneously faces a mandatory…
DoorDash has begun building stablecoin payment infrastructure on Tempo, the Layer-1 blockchain incubated by Stripe and Paradigm, to pay delivery workers and merchants across more than 40 countries at near-instant settlement speeds and fixed US dollar fees, in one of…
Humanity Protocol (H) price has surged nearly 40% and is holding firm above the $0.120 level, with price consolidating near highs instead of reverting to the prior range, an early indication of strength following the breakout. The level, which capped upside through the previous phase, is now acting as support, and the absence of immediate selling pressure keeps the structure tilted higher.
At the same time, participation is expanding alongside price, reinforcing the move rather than fading into it. With gains being retained and activity building in parallel, the setup shifts from a breakout event toward a continuation structure.
On-Chain Data Signals Rising Participation
On-chain metrics are moving in line with the price shift. Whale transactions have climbed to their highest level in five months, indicating that larger holders are actively positioning during the early phase of the move rather than distributing into strength.
At the same time, network growth has accelerated to a two-month peak, reflecting increasing user activity and fresh participation entering the ecosystem. When both large-holder activity and network expansion move together, the structure tends to strengthen. It suggests that demand is not isolated but distributed, supporting stability at higher levels and reducing the likelihood of a short-lived move.
After multiple sessions of compression around the $0.09–$0.10 zone, downside attempts continued to stall, with selling pressure getting absorbed rather than extended lower. That phase established the base from where the move developed.
As the structure tightened, the descending trendline that capped prior rallies came back into focus. Once that barrier gave way, expansion followed quickly, carrying the move through $0.120 and into a higher range. From there, the key signal was not the breakout itself but the reaction that followed. Instead of rotating back into the prior range, the market held above $0.120 and began forming higher lows just above that level. This shift indicates that the breakout zone is being defended rather than retested as resistance.
Meanwhile, pullbacks have remained shallow, with each dip finding support sooner than the previous one. That behavior keeps the range compressed near highs and limits the ability for supply to re-enter the market. As this structure continues to hold, the breakout remains valid, with $0.120 acting as the base for the current move. A sustained hold above this level keeps the path open toward the next resistance band near $0.16–$0.18, where the market is likely to encounter the next supply.
However, a move back below the breakout zone would shift the structure back into its previous range. Until then, the current flow remains aligned toward continuation.
Long/Short Ratio Reflects Strength Without Overcrowding
Positioning data continues to support the broader structure. The long/short ratio holding near 1.39 reflects a bullish bias, but without the imbalance typically seen in overcrowded trades. At the same time, leverage remains contained, reducing the risk of sharp liquidation-driven volatility.
As positioning builds gradually rather than aggressively, the environment remains supportive of continuation, allowing the structure to develop without destabilizing pressure.
Final Take
With the breakout holding and structure stabilizing above $0.120, the current setup continues to lean higher as long as acceptance at this level persists. While upside remains open toward the $0.16–$0.18 zone, the move now depends less on expansion and more on whether the market continues to hold above its base without slipping back into the prior range. A sustained hold keeps continuation in play; a loss of structure would shift the focus back to consolidation.
Axie Infinity (AXS) price has surged over 34% in the past 24 hours, climbing to $1.48—but this isn’t just another random altcoin spike. The move comes after weeks of compression and a clear break from a declining structure, backed by a sharp expansion in volume. That shift matters. Because when low-liquidity tokens like AXS move this fast, it’s rarely organic—it’s driven by positioning, liquidations, and sudden liquidity inflows.
Now the market is at a pivotal point: Is this the start of a real trend reversal or just a short-lived squeeze that fades as quickly as it appeared?
What Triggered the AXS Price Rally?
The AXS price didn’t move on hype; it moved on positioning and liquidity shifts, backed by clear data. No specific catalyst seems to have fueled the rally, nor any partnership news, nor any ecosystem catalyst. The move occurred while the BTC price was slightly down, showing strong alpha independent of the broader market. Alongside, here are the key drivers of the recent move.
Volume expansion: Daily volume jumped to around $170M–$200M+, a sharp spike compared to previous sessions, confirming real participation behind the move.
Short squeeze fuel: A 30%+ intraday move in a low-liquidity asset likely triggered millions in short liquidations, accelerating the rally vertically.
Key breakout level reclaimed: Price broke above the $1.17–$1.20 resistance zone, which had capped the price for weeks, flipping the structure short-term bullish.
Upside extension: The move pushed AXS toward $1.56 (0.5 Fibonacci level) within hours, showing aggressive momentum rather than gradual buying.
The breakout does not seem to be organic, but it was a liquidity-driven breakout amplified by leverage and thin order books.
Axie Infinity (AXS) has broken out of a multi-week descending channel, marking a clear shift in short-term market structure. The price reclaimed the $1.17–$1.20 resistance zone, now acting as support, while pushing toward the $1.56 Fibonacci (0.5) level. This move is supported by a sharp volume spike above $170M, confirming strong participation behind the breakout. At the same time, momentum indicators are turning bullish, with RSI trending higher without entering extreme overbought territory, suggesting room for further upside.
The $1.56–$1.63 zone now acts as immediate resistance, and a decisive breakout above this range could open the path toward $2.13 (0.786 Fibonacci level), aligning with a broader recovery structure. On the downside, failure to hold above the $1.17–$1.20 support zone would invalidate the breakout and expose AXS to a sharp pullback, especially given its low-liquidity nature. While the technical setup favors continuation, confirmation will depend on price holding above reclaimed levels alongside sustained volume and momentum.
Can Axie Infinity (AXS) Price Rally Hold the Move?
The AXS price has delivered a high-momentum breakout, but the real test is whether it can sustain itself above reclaimed levels. Moves of this magnitude, 30%+ in a single session, are often driven by short-term liquidity and liquidations, not steady accumulation. That means follow-through is critical. If volume remains elevated and price consolidates above the $1.20 support zone, it signals strength and increases the probability of continuation toward higher resistance levels.
However, if volume starts to fade while price stalls near $1.56–$1.63, it raises the risk of momentum exhaustion. In low-liquidity tokens like Axie Infinity, failed continuation setups often lead to sharp reversals, not gradual pullbacks. The key signal now is simple: sustained buying and higher lows confirm trend strength, while weakening participation turns this into a classic breakout trap driven by short-term positioning rather than long-term demand.
Ripple released a detailed four-phase roadmap on April 20 to protect the XRP Ledger from future quantum computing attacks, with Phase 2 testing already underway, targeting full post-quantum cryptography implementation no later than 2028, as SoFi separately enabled XRP deposits…
BNB Chain has officially become the leading blockchain network for autonomous AI agents, with more than 150,000 on-chain deployments as of April 20, a 43,750% increase from the fewer than 400 agents that existed across all blockchains at the start…
Morgan Stanley Investment Management launched the Stablecoin Reserves Portfolio on April 23, a government money market fund exclusively designed to hold the cash reserves backing stablecoin issuers’ outstanding tokens, positioning the Wall Street giant to capture reserve management business ahead…
A coalition of more than 120 crypto organizations led by the Crypto Council for Innovation and the Blockchain Association sent a joint letter to the Senate Banking Committee on April 23 demanding an immediate markup of the CLARITY Act, warning…
Treasury Secretary Scott Bessent announced on April 24 that the US government has sanctioned multiple crypto wallets linked to Iran’s Islamic Revolutionary Guard Corps under a campaign called Operation Economic Fury, with Tether executing the freeze of $344 million in…
President Trump delivered a keynote address on April 25 at a Mar-a-Lago gala restricted to the top 297 holders of his Official TRUMP memecoin, with a private VIP reception and champagne toast reserved for the top 29, as Senators Elizabeth…
A Hyperliquid whale holds large short positions against Bitcoin and several altcoins. Does the position provide any signal on the markets’ future outcomes?
The announced crypto freeze came just one day after Tether said it had frozen $344 million of its USDt stablecoin in response to a request from US law enforcement.
The US President has confirmed his attendance for the Florida event, but it's unclear whether Tron founder Justin Sun, suing the Trump family's crypto business, will appear.
As HSBC, Lloyds, and JPMorgan all commit to tokenized deposits on the Canton Network, Digital Asset Chief Product Officer Bernhard Elsner explains why the instrument is structurally distinct from stablecoins and how Canton’s architecture eliminates bridge risk rather than simply…
President Trump announced on April 23 that Israel and Lebanon have agreed to extend their ceasefire by three weeks after a second round of high-level White House talks involving the Israeli and Lebanese ambassadors, Secretary of State Marco Rubio, Vice…
The House Foreign Affairs Committee advanced two bipartisan bills on April 23 that would give Congress direct oversight authority over US AI chip exports to China and other adversaries, in a direct challenge to the Trump administration’s handling of advanced…
The Senate voted 46 to 51 on April 22 to defeat a war powers resolution that would have directed the president to withdraw US armed forces from hostilities against Iran without congressional authorization, marking Democrats’ fifth consecutive failure to advance…
U.S. Treasury and Tether froze $344M in USDT tied to Iran’s IRGC, spotlighting how Tehran’s $7.8B crypto ecosystem leans on stablecoins to dodge sanctions and move oil money. U.S. Treasury Secretary Scott Bessent has confirmed that the United States has…
White House Office of Science and Technology Policy director Michael Kratsios circulated a memo on April 23 accusing Chinese entities of conducting deliberate, industrial-scale campaigns to distil and steal US frontier AI systems, using tens of thousands of proxy accounts…
Chinese AI startup DeepSeek released a preview of its V4 model on April 24, explicitly optimized for Huawei’s Ascend chip platform, on the same day the White House accused China of running industrial-scale campaigns to copy and steal American frontier…
After reporting more than $1.7 million to election officials, a crypto-aligned political action committee has reportedly backed out of advertising for a Texas Senate candidate.
Familiar players ramp up Bitcoin and Ether bets as markets hint at a rebound, while institutions test blockchain rails and US lawmakers stall on crypto rules this week.
Google‑parent Alphabet will commit $10 billion in cash to Anthropic now and up to $30 billion more over time, in a package that Bloomberg reports could reach $40 billion in total if the AI lab hits aggressive performance and usage…
OpenAI released GPT-5.5 on April 23, its newest frontier model and the company’s most capable agentic system to date, designed to accept a messy multi-part task and plan, execute, and complete it without requiring step-by-step human guidance. OpenAI released GPT-5.5…
BridgeTower Capital has officially adopted Chainlink’s full infrastructure stack to tokenize $11 billion in securities from the DOM X Arizona Copper-Gold Project, making it one of the largest live production tokenized asset deployments ever announced and positioning Chainlink as the…
Pi Network co-founder Nicolas Kokkalis will take the stage at Consensus 2026 in Miami on May 7, joining a panel titled “How to Prove You’re Human in an AI World (Without Doxing Yourself)” at the Convergence Stage, as Pi positions…
DeFi heavyweights urge the SEC to turn its temporary “non‑custodial UI” safe harbor into binding broker rules that shield neutral infrastructure from creeping regulation. Humanity Foundation has effectively put more than 100 investors on the clock. By April 26 at…
US banking groups have escalated their campaign against the CLARITY Act by calling Senate offices directly, with the North Carolina Bankers Association confirmed on April 18 to be urging member banks to phone Senator Thom Tillis’s office personally to demand…
US spot Bitcoin ETFs have logged eight consecutive days of net inflows totaling $2.1 billion through April 23, the longest inflow streak since the nine-day October 2025 run that carried Bitcoin to its $126,000 all-time high, with BlackRock’s IBIT responsible…
Nakamoto Inc. is running an actively managed options program with Bitwise and Kraken, writing covered calls and buying puts on part of its Bitcoin stack to turn volatility into income and partial downside hedges. Nakamoto Inc. (NASDAQ: NAKA) has announced…
Ripple’s latest market overview confirms that US spot XRP ETFs have accumulated $1.53 billion in assets under management and 773 million XRP in custody, with Goldman Sachs leading all institutional holders through a $153.8 million position spread across four separate…
EIP‑8182 would add a shared shielded pool and ZK precompile to make private ETH and ERC‑20 transfers a native Ethereum feature, aligned with its 2026 privacy roadmap. Ethereum (ETH) is finally putting protocol‑level privacy on the table. Tom Lehman has…
AWS Marketplace now offers Chainlink’s oracle stack as a native service, letting banks and fintechs wire tokenization, stablecoins, and RWA apps into existing cloud workflows. According to a report from The Block, AWS Marketplace has integrated multiple Chainlink data services,…
DeFi heavyweights urge the SEC to turn its temporary “non‑custodial UI” safe harbor into binding broker rules that shield neutral infrastructure from creeping regulation. A broad coalition of DeFi builders and investors is pressing the U.S. Securities and Exchange Commission…
Little Pepe gains investor attention as presale nears final stages with over $28 million already raised. With time, the cryptocurrency industry is becoming more sophisticated, and therefore, there have been changes in the kinds of coins that traders seek to…
Nakamoto launched a Bitcoin derivatives program with Bitwise and Kraken, aiming to generate options premiums and hedge part of its BTC treasury exposure.
China’s new online marketing rules tighten an already sweeping crypto ban and place fresh pressure on financial influencers, echoing parallel crackdowns in Europe, Australia and the UK.
The ECB signed deals with three standards bodies to reuse open payment standards for the digital euro and lower integration costs for banks and merchants.
Polish prosecutors are investigating Zondacrypto over alleged fraud and fund access issues, while local media report that CEO Przemysław Kral is in Israel.
Robin Markets raised $475k to launch a staking product that turns Polymarket positions into yield, a targeted crypto VC bet in a funding cycle otherwise dominated by AI. Robin Markets has closed a $475,000 angel financing round led by Fabric…
Polymarket catapulted Waller’s Fed chair odds from 27% to 85% after reports the DOJ will drop its criminal probe into Jerome Powell, clearing a key Senate roadblock. Prediction markets have dramatically repriced the odds that Christopher Waller will become the…
Senator Bernie Moreno’s end‑of‑May ultimatum has turned the CLARITY Act into Congress’s last credible chance this cycle to set U.S. crypto market‑structure rules before politics and bank lobbying slam the window shut. At a Washington event on April 22, Senator…
Hyperliquid whales now hold $3.66B in nearly balanced perp positions, turning the on‑chain DEX into a real‑time gauge of institutional crypto sentiment. Whale traders on Hyperliquid, one of the fastest‑growing on‑chain derivatives exchanges, are currently running $3.66 billion worth of…
$178M in crypto liquidations over 24 hours show a choppy, leverage‑heavy market where both long and short traders are getting whipsawed out of positions. Crypto traders absorbed a fresh wave of forced deleveraging over the past day, with data from…
South Africa’s 2026 capital flow draft recasts crypto as “capital,” tightening FX controls with declarations, approvals and sanctions as Africa’s biggest market matures. South Africa’s National Treasury has released its Draft Capital Flow Management Regulations for 2026, a sweeping overhaul…
Coinbase is rolling out a BLEND–USD spot pair for Fluent’s newly launched token, joining KuCoin and MEXC in a coordinated listing that could turn the tiny‑cap altcoin into a high‑beta volatility play. Coinbase is preparing to launch spot trading for…
Zcash price rallied nearly 12% on Friday, continuing its recent uptrend as buying interest picked up again after a brief pullback earlier this week. According to data from crypto.news, Zcash (ZEC) rose to an intraday high close to $360 before…
Dogecoin price prediction targets $0.50, but slow gains push investors toward Varntix for stable 20–24% returns and flexible income options. Dogecoin is up on its daily and weekly scale, showing signs of recovery after early-year losses. Dogecoin price prediction models…
ECB teams with ECPC, nexo and Berlin Group to reuse open payment standards, cutting digital euro integration costs and clearing the path to a 2027 pilot, 2029 launch. The European Central Bank (ECB) has signed agreements with three European standards…
The UAE has announced an ambitious two-year roadmap to integrate agentic artificial intelligence into 50% of its government operations. According to a report from local news outlets, the UAE aims to shift half of all public sectors, services, and day-to-day…
Solana is trading within an ascending channel, with $90 capping its upside over the past week and acting as a key breakout level. According to data from crypto.news, Solana (SOL) dropped from its Wednesday high of $89 to $85 on…
Wisconsin’s lawsuit against Kalshi, Robinhood, Coinbase, Polymarket and Crypto.com deepens the battle between state gambling enforcers and federal regulators over sports prediction markets.
Cryptography company Succinct launched Zcam, an iPhone camera app that signs photos and videos at capture to help prove media authenticity in the AI era.
China’s DeepSeek is making waves again by claiming its new V4 models are now just months away from catching up to industry leaders like OpenAI and Google. Roughly a year after its previous release, the Hangzhou-based startup introduced the DeepSeek…
XRP price trends draw investor focus as SHR Miner expands cloud mining access in the digital asset market. With the price movements of Bitcoin and Ethereum influencing the overall market, XRP trend prediction continues to attract investor attention, and SHR…
Ethereum price fell for the second straight day on Friday as institutional investors took a step back from the asset as they weighed rising geopolitical risks. According to data from crypto.news, Ethereum (ETH) price fell 4% from the Wednesday high…
Wisconsin has escalated its challenge against prediction market platforms, widening a legal fight already taking shape across several U.S. states over how these products should be classified. Fresh complaints filed in Dane County name Crypto.com and its derivatives arm, Polymarket,…
Fold Holdings has rolled out a Bitcoin-based bonus program for employees, expanding its push to bring BTC into everyday workplace compensation. Fold said the new offering, launched under its enterprise arm Fold Business, allows companies to distribute recurring bonuses in…
Crypto prices stayed muted with major assets, including Bitcoin, experiencing slight declines on Friday as hopes of peace between the U.S. and Iran began to fade. Bitcoin (BTC) price traded sideways between $77,000 and $79,000 over the past 24 hours…
The U.S. Treasury has sanctioned Cambodian senator Kok An and a network of 28 entities over alleged ties to a large-scale crypto scam and trafficking-linked operation. The U.S. Department of the Treasury said Thursday that its Office of Foreign Assets…
U.S. President Donald Trump has confirmed plans to attend a private gala for top holders of his TRUMP memecoin at Mar-a-Lago, following earlier uncertainty around his participation. According to Reuters, the White House said Trump will deliver a keynote address…
U.S. authorities have frozen more than $701 million in cryptocurrency tied to investment scams targeting Americans as part of an ongoing crackdown. The U.S. Department of Justice said Thursday that the funds were restrained through coordination with crypto exchanges and…
Morgan Stanley has introduced a new portfolio designed to hold stablecoin reserves within its money market fund structure. According to Morgan Stanley, the “Stablecoin Reserves Portfolio” allows issuers to place backing assets into its Institutional Liquidity Funds trust while earning…
Decentralized finance protocols have pledged more than $101 million in Ether to stabilize rsETH after the $293 million Kelp DAO exploit disrupted lending markets. According to Aave, the coordinated response, described as the “DeFi United” relief effort, has gathered commitments…
Jane Street has asked a U.S. court to dismiss a lawsuit accusing it of insider trading linked to the TerraUSD collapse. In a filing before the Southern District of New York, and shared with crypto.news, the trading firm and several…
GraniteShares has delayed the launch of its 3x Long and 3x Short XRP Daily ETFs from April 23 to May 7, marking the fifth postponement in three weeks and raising fresh questions about whether the SEC will ultimately clear 3x…
Ethereum opened at $2,375.12 on Thursday April 23, 2026, rising 2% from Wednesday’s open as Bitcoin led a broad morning rally past $78,000, though ETH pulled back to $2,316.88 by 7:10 a.m. ET as traders remained cautious over the lack…
Deloitte and Touche LLP has completed a SOC 2 Type 2 examination for Chainlink’s CCIP and Data Feeds, making Chainlink the only data and interoperability oracle platform in the blockchain industry to hold SOC 2 Type 2, SOC 2 Type…
Senator Bernie Moreno declared at a Washington event on April 22 that the CLARITY Act must clear Congress by the end of May, stating plainly that missing that deadline could shelve the legislation indefinitely as midterm election politics consume the…
Pi Network has set a hard deadline of April 27 for all Mainnet node operators to upgrade to Protocol 22, warning that any node still running version 21.2 after the cutoff will be automatically disconnected from the network. Pi Network’s…
Galaxy Digital head of firmwide research Alex Thorn has assessed the CLARITY Act’s chances of being signed into law in 2026 at roughly 50-50, and possibly lower, in a research note being published this week, warning that the bill faces…
Pi Network has introduced PiRC1, a new token issuance framework launched under Protocol 22 on April 22, that bars projects from issuing tokens unless they can first demonstrate a functioning application with real user demand, a direct attempt to filter…
JPMorgan says repeated DeFi hacks, a $20B TVL drop after Kelp’s rsETH exploit, and flat ETH‑denominated TVL are souring institutional appetite for onchain lending and yield. JPMorgan analysts told The Block that “frequent security incidents in DeFi and the stagnation…
More than 120 crypto organizations, led by the Crypto Council for Innovation and the Blockchain Association, sent a joint letter to the Senate Banking Committee on April 23 demanding an immediate markup of the CLARITY Act, warning that continued congressional…
Ripple has partnered with Kyobo Life Insurance, one of South Korea’s three largest life insurers with over $92 billion in assets, to pilot Korea’s first blockchain-based tokenized government bond settlement, targeting a compression of the standard two-day settlement cycle to…
Coinbase has filed documentation with the CFTC confirming it will activate Trade at Settlement functionality for XRP futures on May 1, 2026, giving institutional traders a regulated mechanism to execute large block orders at the official closing price rather than…
XRP spot ETFs have not recorded a single day of outflows since April 9, pulling in $71.31 million so far in April and putting the month on track to be the strongest of 2026, fully erasing March’s $31.16 million loss,…
US spot ETFs absorbed 4,349 BTC, 35,736 ETH and 1,311 SOL in a day, signaling that despite choppy prices, regulated wrappers remain the preferred route into crypto exposure. US-listed spot Bitcoin (BTC) ETFs saw net inflows of 4,349 BTC today,…
Bitcoin’s path to $100k hinges on Kevin Warsh’s Fed bid and the CLARITY Act’s shrinking window, as Washington rewires crypto market structure. Bitcoin (BTC) at $100,000 is back on the table if its recent rally holds, but the outcome hinges…
Coinbase has rebuilt its anti‑fraud stack by tightly integrating machine learning models with a high‑speed rules engine, slashing response times to new scam patterns from days to hours just as TRM Labs warns crypto fraud is now a tens‑of‑billions‑per‑year, AI‑supercharged…
XRP is grinding in the mid‑$1.40s, trapped between stubborn resistance and strong support as fresh “digital commodity” clarity, ETF rails and April seasonality fight flat flows. XRP (XRP) is still down roughly 60% from its 2018 all‑time high near $3.65,…
Reppo landed a $20m strategic commitment from Bolts Capital to scale its prediction market protocol and “Datanets,” aiming to turn staked human judgment into high‑quality AI training data. Decentralized prediction market network Reppo has secured a $20,000,000 strategic investment commitment…
As AI-powered crypto trading expands, investors are comparing platforms based on automation quality, risk controls, transparency, and the capital required to get started effectively. Those who have spent time searching for the best AI crypto trading bot already know the…
Iranian media have dismissed reports that Tehran is currently collecting transit tolls for the Strait of Hormuz in cryptocurrency, underscoring the confusion surrounding a wartime payment regime that has rattled global shipping and crypto markets. Tehran moves to quash ‘crypto…
Spanish police shuttered a decade‑old manga piracy hub, arrested three people in Almería, and seized €400K in crypto cold wallets hidden inside a wall‑mounted thermometer. Spain’s National Police have shut down a decade‑old online manga piracy operation they describe as…
Passive income from crypto mining without investment has become one of the fastest-growing search trends in 2026. As Bitcoin continues to attract global attention, more users are looking for ways to participate in mining without purchasing expensive hardware or managing…
Galaxy’s Alex Thorn says Strategy now holds more Bitcoin than BlackRock’s IBIT and, if its pace holds, could match Satoshi’s estimated 1.1m BTC stash within two years. Galaxy Digital head of research Alex Thorn has flagged that Strategy’s Bitcoin holdings…
Lido says only about 9% of EarnETH’s TVL is tied to hacked rsETH, roughly $70M has been recovered, and a $3M DAO first‑loss buffer stands between users and any final hit. Lido has outlined the fallout from the KelpDAO rsETH…
The BIS says big crypto exchanges now function as lightly regulated “shadow banks,” turning user deposits into unsecured loans and amplifying leverage that helped trigger a $19B 2025 wipeout. Cryptocurrency exchanges are rapidly evolving into “shadow banks” that offer lending…
ALCUM’s xCUP token doesn’t park copper in a warehouse; it tokenizes a 30‑day, hedged recycling cycle so USDC allocators earn audited industrial margin, not spot‑price roulette. In any exclusive interview with crypto.news, Vytautas Mackonis, founder of Swiss-based copper protocol ALCUM,…
Zcash price rose around 3% on Thursday, holding above the $330 level after breaking out of a descending channel pattern. According to data from crypto.news, Zcash (ZEC) was trading right around that $330 mark at the time of writing. This…
Circle economist Gordon Liao wants Aave v3’s USDC borrow cap pushed toward 50% and optimal utilization cut, betting sky‑high yields will unclog a rsETH‑driven liquidity crunch. Circle’s chief economist Gordon Liao has filed an Aave v3 governance proposal to sharply…
Roughly 93% of GameFi projects are now effectively dead, as tokens plunge 95%, user counts flatline, VCs pivot to AI and RWAs, and even Animoca trims pure gaming bets. Roughly 93% of GameFi projects have failed, with token prices collapsing…
Spark’s SPK jumped 73% after an Upbit KRW listing, 500M+ tokens staked, and F2Pool co-founder Wang Chun’s public regret over selling 83.7M SPK stoked fresh speculative flow. Spark’s native token SPK (SPK) surged as much as 73% in the past…
Tether froze over $344M in USDT tied to sanctions evasion and pig-butchering scams, underscoring stablecoins’ role as both crime rails and regulatory choke points. Tether has frozen more than $344 million in USDT in collaboration with the U.S. Treasury’s Office…
Firelight and Sentora wire native, capital-backed cover into XRP DeFi vaults on Flare, turning FXRP staking into institutional-grade exploit and oracle protection. Firelight Protocol has partnered with Sentora to embed a capital-backed protection layer directly into Sentora’s institutional DeFi vault…
Google Cloud has entered into a multi-year strategic partnership with global private equity and investment firm CVC Capital Partners to accelerate the adoption of AI across its portfolio companies. According to an April 23 press announcement, the collaboration spans sectors…
XRP price is eyeing a bullish breakout from a symmetrical triangle pattern that could position it for a breakout above $1.50, a level it has remained below for the past 5 weeks. According to data from crypto.news, XRP (XRP) price…
Flying Tulip has introduced a circuit breaker to slow or queue withdrawals as DeFi losses mounted in April following a series of large exploits. According to official documentation, the safeguard is designed to limit how quickly funds can leave the…
KPMG has unveiled a new AI-powered assistant designed to change how legal entity controllers and accounting analysts handle month-end closing processes. According to reports, the tool, called KPMG Ignite Financial Close Companion, is built on Google Cloud’s Gemini Enterprise and…
A coalition of crypto firms and advocacy groups has urged U.S. senators to move ahead with a markup of the Clarity Act, warning that delays risk pushing the industry offshore. The push came through an April 23 letter led by…
Crypto prices retreated on Thursday as concerns over the fragile U.S.-Iran ceasefire weighed on market sentiment. Bitcoin (BTC) price fell 2% to $77,593 on Thursday as it gave up most of its gains from Wednesday when it hit above $79,000…
This post was updated with a statement from Zach Witkoff. World Liberty Financial co-founder Zach Witkoff has come under renewed scrutiny after body camera footage from a 2022 drug-related arrest resurfaced. According to recently surfaced footage on X, Witkoff was…
Xiaomi has introduced its MiMo-V2.5 model family, adding multimodal capabilities and advancing its push into top-tier AI systems. According to Xiaomi, the new MiMo-V2.5 and MiMo-V2.5-Pro models combine image, audio, and video processing into a single system, bringing features that…
Bitcoin price rallied to a 12-month high above $79,000 on Wednesday before pulling back to $78,000 as investors booked profits. However, derivatives data suggest the asset may be building momentum for another move higher. According to data from crypto.news, Bitcoin…
Crypto venture firm Blockchain Capital has moved to raise $700 million across two new funds as investment appetite shows signs of concentration despite a slowdown in overall deal flow. Bloomberg, citing a person familiar with the matter, reported that the…
AI-driven exploits and cross-chain flaws have pushed crypto security risks into focus in 2026, experts at CertiK warn, with losses already crossing $600 million. According to the blockchain security firm, attackers have leaned on a mix of social engineering, infrastructure…
The American Bankers Association has called for more time on stablecoin rulemaking tied to the GENIUS Act, citing gaps in regulatory coordination. The American Bankers Association, in a letter sent Tuesday, urged the U.S. Department of the Treasury, Federal Deposit…
Thailand wants to streamline access to crypto derivatives by allowing firms to operate under a single licensed entity. According to the Securities and Exchange Commission of Thailand, a new public consultation has opened on rules that would let licensed digital…
Bitcoin climbed above $78,000 on April 22, reaching its highest price in 11 weeks, as a wave of short liquidations and improved macro sentiment following Trump’s ceasefire extension combined to push the asset to a key technical level that had…
Crypto protocols have lost more than $606 million to hacks and exploits in just the first 18 days of April 2026, making it the single worst month for theft in the industry since the $1.4 billion Bybit breach in February…
US Labor Secretary Lori Chavez-DeRemer has resigned from the Trump administration amid an active inspector general investigation into misconduct allegations, making her the third cabinet member to depart during the president’s second term. Lori Chavez-DeRemer stepped down as US Secretary…
Shares of American Bitcoin, the Trump family-linked mining company, surged approximately 12% on April 22 after the firm announced it had completed the deployment of 11,298 new ASIC miners at its Drumheller, Alberta site, expanding its active fleet to roughly…
A $290 million exploit on KelpDAO’s cross-chain bridge on April 18, attributed by LayerZero to North Korea’s Lazarus Group, sent shockwaves through DeFi and erased more than $13 billion in total value locked across protocols within 48 hours. Attackers drained…
Kraken says it filed 56m 2025 crypto tax forms, most under $50, and is urging Congress to create a de minimis exemption and let users defer tax on staking rewards until sale. Kraken is using this tax season to put…
North Korea’s Lazarus Group has launched a new macOS malware campaign called Mach-O Man that uses fake online meeting invitations to trick crypto and fintech executives into executing malicious commands on their own devices, according to blockchain security firm CertiK.…
Two CIA officers were killed in a car crash in the Mexican state of Chihuahua on April 20 while returning from a counternarcotics operation to destroy a clandestine drug lab, igniting a sovereignty dispute between Washington and Mexico City. Two…
Coinbase has listed FCA‑sandbox‑tested tGBP, letting users move pound‑pegged stablecoins across its app and exchange as it doubles down on local‑currency rails beyond USD. Coinbase is deepening its bet on non‑USD stablecoins, rolling out full support for the pound‑pegged tGBP…
Iran’s Revolutionary Guard seized two container ships in the Strait of Hormuz on April 22, hours after President Trump extended the ceasefire with Tehran indefinitely, while confirming the US naval blockade of Iranian ports would remain in place. Iran’s Islamic…
Kevin Warsh, Donald Trump’s nominee to chair the Federal Reserve, told a Senate confirmation hearing on April 21 that he has made no commitments to the White House on interest rates and would act independently, even as Republican Senator Thom…
Virginia voters have narrowly approved a new congressional map that could shift as many as four House seats from Republican to Democrat, delivering a major boost to the party’s bid to retake the House in the 2026 midterms. Virginia voters…
The US Department of Justice has filed fraud charges against the Southern Poverty Law Center, alleging the civil rights organization made secret payments to extremist informants without proper disclosure. The US Department of Justice announced a federal indictment against the…
American Bitcoin, co‑founded by Eric and Donald Trump Jr., has energized 11,298 new ASICs, lifting owned hash rate to 28.1 EH/s as it doubles down on low‑cost BTC accumulation. American Bitcoin Corp., the publicly listed mining company co‑founded by Eric…
OpenAI has begun charging advertisers on a cost-per-click basis inside ChatGPT, marking its first direct move into the digital advertising market and putting it in competition with Google and Meta. OpenAI has quietly launched a pay-per-click advertising model inside ChatGPT,…
Major US banks are lobbying to slow down new stablecoin legislation, but the White House has intervened directly, telling the banking industry to stand down. US banks are mounting resistance to proposed stablecoin legislation moving through Congress, arguing the rules…
Kraken submitted 56 million crypto tax forms for 2025, most reporting gains under $50, and is now calling on Congress to overhaul what it calls an unworkable reporting threshold. Kraken filed 56 million crypto tax forms with the IRS for…
GSR’s new BESO ETF on Nasdaq actively manages a Bitcoin‑Ethereum‑Solana basket with weekly rebalancing, a 1% fee, and built‑in staking rewards where allowed. GSR is moving from pure market‑making into the center of the ETF arms race, rolling out its…
CFTC‑regulated prediction market Kalshi is wiring Pyth’s oracle and Pyth Pro feeds into its new commodities hub, using first‑party prices to settle gold, oil, gas, and grain event contracts. Pyth Network is extending its oracle footprint into the heart of…
Sameer Group CEO Syed Sameer is offering to broker a private deal to unfreeze Justin Sun’s blacklisted WLFI tokens, drawing backlash from retail holders shut out of negotiations. Syed Sameer, CEO of Sameer Group LLC, has put himself forward as…
RaveDAO (RAVE) is up about 106% on $418m volume after a 95% crash that erased nearly $6b, as ZachXBT alleges insiders ran a pump‑and‑dump and OKX funds the probe. RaveDAO is in full trader mode. CoinGecko and major exchanges show…
CHIP token surged over 85% on Wednesday becoming one of the best performing crypto assets of the day. The token shot up following its listing on Binance which introduces the token with a Seed Tag, flagging it as an early-stage,…
Crypto Rover says wallets with a “100% win rate” keep trading BTC, ETH and $TRUMP around President Trump’s speeches, reviving long‑running “Trump insider” whale fears. Crypto commentator Crypto Rover has escalated accusations of political insider trading, posting what he calls…
Alphabet Inc.’s Google Cloud has introduced a $750 million fund to help consulting firms and enterprise partners bring agentic artificial intelligence into real-world use cases. The initiative was unveiled at the Cloud Next 2026 conference in Las Vegas and is…
MemeCore’s FDV sits several turns above its circulating cap, leaving heavy unlock overhang, while Shiba Inu trades closer to full dilution after years of burns. As of recent data, MemeCore’s circulating market capitalization is in roughly the $2.8–$4.3 billion range…
MemeCore rips 22% as traders rotate into memecoins and mid‑caps like RAIN, PENGU, XMR, BCH and chase edgeX retrodrop hype instead of de‑risking into Bitcoin. Even with Bitcoin and Ethereum hogging the macro headlines, the most aggressive risk‑taking is happening…
DeFi TVL and DEX volumes are rising on Solana, Arbitrum, Optimism, Polygon, and BNB as NFT gaming races toward a $60.82B market and builders keep shipping through hacks. Capital is quietly rotating back into DeFi even as the industry digests…
MiCA’s July 2026 deadline, the US CLARITY Act plus SEC–CFTC MoU, and the UK/Japan FSMA-style regimes are squeezing out thin‑margin crypto venues in a global licensing reset. Europe’s MiCA regime is entering its endgame, with the transitional period for existing…
The attacker behind KelpDAO’s nearly $300 million rsETH exploit is now laundering funds from Ethereum to Arbitrum and into Tron-based USDT. The attacker behind the nearly $300 million KelpDAO exploit has begun laundering the haul, routing funds through Arbitrum and…
AI trading bots emerge as a practical passive income tool for everyday investors in 2026. In 2026, more everyday investors are focusing on a practical question: how to build a sustainable income stream without relying on constant trading or high-frequency…
UK regulator FCA raided eight London sites over alleged illegal P2P crypto trading, issuing stop notices and escalating its wider crackdown on unregistered platforms. According to Reuters, the UK’s Financial Conduct Authority (FCA) has raided eight locations across London suspected…
North Korea’s Lazarus Group is using “Mach-O Man” macOS malware and fake meeting invites to hijack crypto execs and fund nine-figure DeFi raids. Lazarus, the North Korean state-backed hacking outfit, has rolled out a new macOS malware campaign aimed squarely…
Solana price has rebounded by 6% since its Monday drop as investor confidence returns to the market. It is in the process of forming a double bottom pattern, which could position it for a significant trend reversal in the coming…
Cloud mining apps gain popularity as users seek easier access to Bitcoin and Litecoin rewards. As an increasing number of users seek easier ways to earn cryptocurrency rewards without the need to purchase expensive mining hardware, the popularity of free…
Utility-driven new crypto coins gain momentum as investors target early-stage opportunities in 2026. The biggest winners in new crypto coins 2026 are emerging from projects that combine real-world utility with strong early-stage entry opportunities. As innovation accelerates, investors are focusing…
Meta Platforms has started rolling out internal tracking software on devices used by its U.S.-based employees, gathering data such as mouse movements and keystrokes to support the training of artificial intelligence systems. According to reports, the rollout is part of…
Ethereum price rallied nearly 5% to reclaim the $2,400 mark on Wednesday amid a broader market rebound as crude oil prices fell. According to data from crypto.news, Ethereum (ETH) price rose 4.8% to $2,402 on April 22, extending its monthly…
AI day trading bots gain popularity as traders seek faster execution and better discipline. The rise of the AI day trading bot is changing how traders approach fast-moving markets. In 2026, more active traders are using AI tools to scan…
Stratiphy has introduced a new route for UK investors to regain tax-free exposure to crypto ETNs after recent rule changes limited access. According to the Financial Times, the fintech platform is offering crypto exchange-traded notes through Innovative Finance (IF) ISAs,…
Firefox developer Mozilla revealed that an early version of Anthropic’s Claude Mythos AI identified 271 vulnerabilities in the Firefox browser during internal testing, all of which were patched this week. The findings point to how advanced AI systems are starting…
As Bitcoin price continues to march higher towards $80,000, Grayscale researchers believe the asset has likely already formed a market bottom and is entering the early phase of a new bull cycle. Bitcoin (BTC) price reached a 10-week high above…
European investors are starting to weigh crypto offerings when choosing banks, even as regulatory gaps and low awareness continue to slow adoption. A Börse Stuttgart Digital survey found that 35% of investors across Germany, Italy, Spain, and France would consider…
Russia’s State Duma has advanced a crypto regulation bill in its first reading, outlining licensing rules, investor limits, and cross-border use provisions. According to state news agency TASS, the proposed law assigns the Bank of Russia as the primary authority…
A senior U.S. military commander has described Bitcoin as a cybersecurity tool with potential use in national defense. At a Senate Armed Services Committee hearing on Tuesday, Samuel Paparo said Bitcoin’s role goes beyond financial use cases and can support…
Kevin Warsh signaled support for integrating digital assets into the U.S. financial system during his Senate confirmation hearing to lead the Federal Reserve. During a Senate Banking Committee hearing on Tuesday, Warsh backed the idea that crypto already plays a…
Singapore-based fintech firm Nium has partnered with Coinbase to bring USDC-powered cross-border payments to its global network. According to a Tuesday announcement, the integration plugs Coinbase’s custody, liquidity, and wallet infrastructure into Nium’s platform, allowing businesses to send, receive, and…
Core Scientific is moving to secure $3.3 billion in fresh debt as it scales data center capacity beyond bitcoin mining. According to a Tuesday disclosure from Core Scientific, the company plans to issue senior secured notes due in 2031, backed…
Coinbase lobbying activity for Q1 2026 totaled $1.07 million, the company disclosed in a new Lobbying Disclosure Act filing, targeting the Digital Asset Market Clarity Act, the GENIUS Act stablecoin law, and digital asset tax treatment legislation. Coinbase lobbying in…
Iran war news escalated Tuesday as parliament speaker Mohammad Bagher Ghalibaf stated publicly that Tehran will not accept negotiations under conditions it considers coercive, with the 10-day US-Iran ceasefire set to expire Wednesday and both sides sharpening rhetoric ahead of…
US election news from Texas arrived Monday as Attorney General Ken Paxton filed a lawsuit in Tarrant County district court against ActBlue, the Democratic fundraising platform, alleging it violated the Texas Deceptive Trade Practices Act by continuing to accept gift…
The most urgent crypto scam news on Capitol Hill arrived Tuesday as the House Homeland Security Committee held a joint subcommittee hearing on how transnational criminal organizations use crypto fraud, online scams, and digital extortion to steal from Americans. Crypto…
Coinbase CEO Brian Armstrong announced Monday the launch of Agentic.market, a marketplace platform for Coinbase AI agents that allows autonomous software agents to discover, compare, and purchase services from other agents without API keys, paying in USDC through the x402…
DefiLlama logs 518 crypto hacks and over $17b in losses in 10 years, with attackers shifting from smart contracts to keys, bridges and wallets, as rsETH loses ~$290m. Crypto’s security bill over the past decade has quietly climbed past $17…
study producing major crypto privacy news found that zero-knowledge proof systems including Railgun, PrivacyPools, Aleo, and Aztec are mathematically immune to quantum attacks, because they rely on information-theoretic security rather than encryption, meaning they remain safe even against infinitely powerful…
A 50 page quantum computing crypto risk assessment published Tuesday by Coinbase’s independent advisory board concludes that while today’s blockchains remain secure, a fault-tolerant quantum computer capable of breaking widely used encryption is increasingly plausible and that preparation must begin…
a16z is backing “Monitoring the Situation,” a 24/7 X livestream born from Polymarket meme culture, as tech VCs build their own news-industrial complex. Andreessen Horowitz, also known as a16z, the Silicon Valley venture firm that has raised more than $15…
Ripple announced a structured four phase roadmap for XRP quantum security on Monday, targeting full quantum-resistant cryptography on the XRP Ledger by 2028 in response to Google Quantum AI research showing that current blockchain cryptography could eventually be cracked by…
Kevin Warsh crypto holdings disclosed in his 69-page OGE Form 278e financial filing include indirect stakes in more than 20 blockchain and digital asset companies spanning Solana, dYdX, Polymarket, Dapper Labs, and Lightning Network infrastructure, with combined assets alongside his…
The most significant Fed nomination news from Tuesday’s hearing came not from the nominee but from Republican Senator Katie Britt of Alabama, who signaled the first concrete Republican effort to find an offramp around the Tillis blockade, urging all parties…
Spark’s MonetSupply says Aave’s decision to unfreeze its Core WETH market lets LST/LRT whales farm ~45% weETH loops while aEthWETH sits at 100% utilization, trapping regular users. Aave (AAVE) has decided to unfreeze its Ethereum Core WETH market just as…
The most pointed Kevin Warsh news from Tuesday’s Senate confirmation hearing was his direct answer to the central question senators asked: CNBC confirmed that Warsh told the Senate Banking Committee “The president never asked me to predetermine, commit, fix, decide…
In the most consequential Federal Reserve news in years, Trump’s Fed chair nominee Kevin Warsh testified before the Senate Banking Committee Tuesday that the central bank committed a “fatal policy error” on inflation in 2021 and 2022, and that correcting…
Virginia redistricting reaches its decisive moment today as voters in a statewide special election choose whether to approve a Democratic-drawn congressional map that would shift the state’s House delegation from six Democratic seats and five Republican seats to a projected…
Curve founder Michael Egorov is pushing for chain-wide DeFi security standards after the Kelp rsETH exploit exposed how “centralized” chokepoints can still wreck supposedly decentralized systems. Curve founder Michael Egorov has called for industry-wide DeFi security standards after what he…
A new PACE Act bill would let qualified non‑bank payment firms tap Fed rails directly, cutting fees and delays while dovetailing with the GENIUS Act’s stablecoin regime. A U.S. Congressman has proposed the PACE Act, a bill that would give…
HTX stands out in the crowded crypto exchange market as traders prioritize trust and security. Exchanges are a dime a dozen. In 2025 alone, dozens of new exchanges popped up on the crypto scene. A quick survey tells us that…
New York has sued Coinbase Financial Markets and Gemini Titan for alleged state law violations, extending the state’s aggressive campaign against major crypto platforms. New York state has filed lawsuits against Coinbase Financial Markets and Gemini Titan, accusing the crypto…
Need to know what happened in crypto today? Here is the latest news on daily trends and events impacting Bitcoin price, blockchain, DeFi, NFTs, Web3 and crypto regulation.


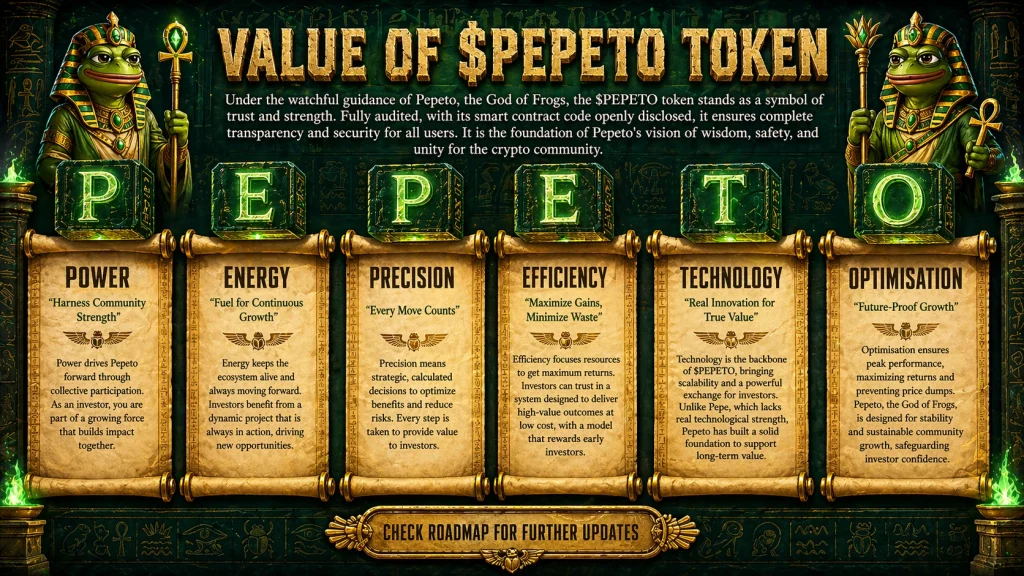
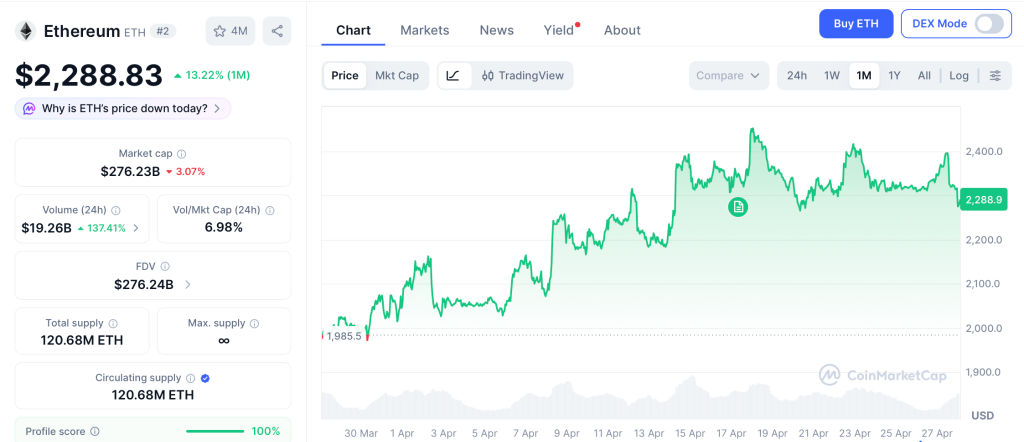
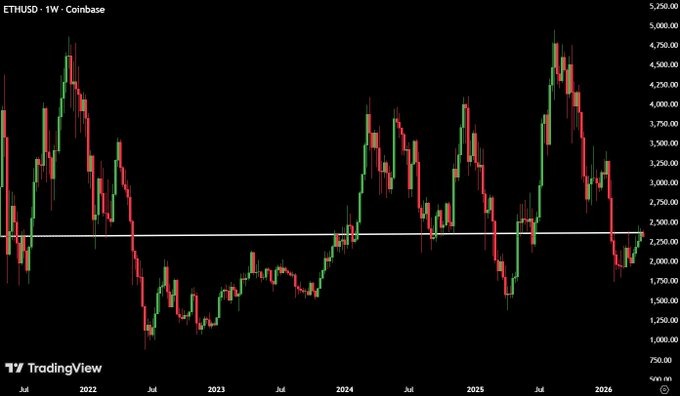
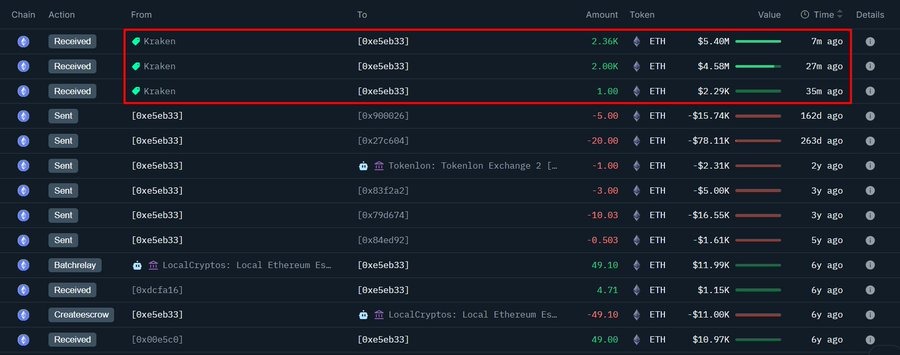
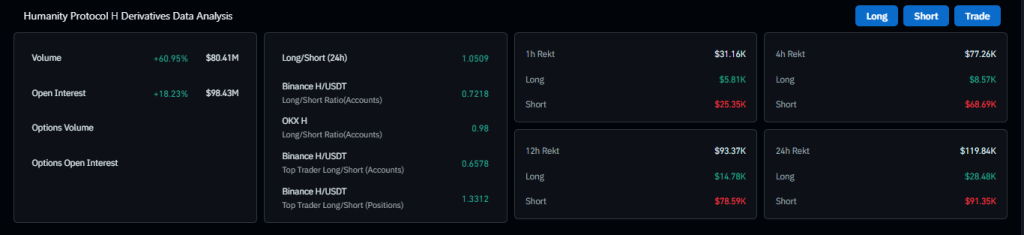

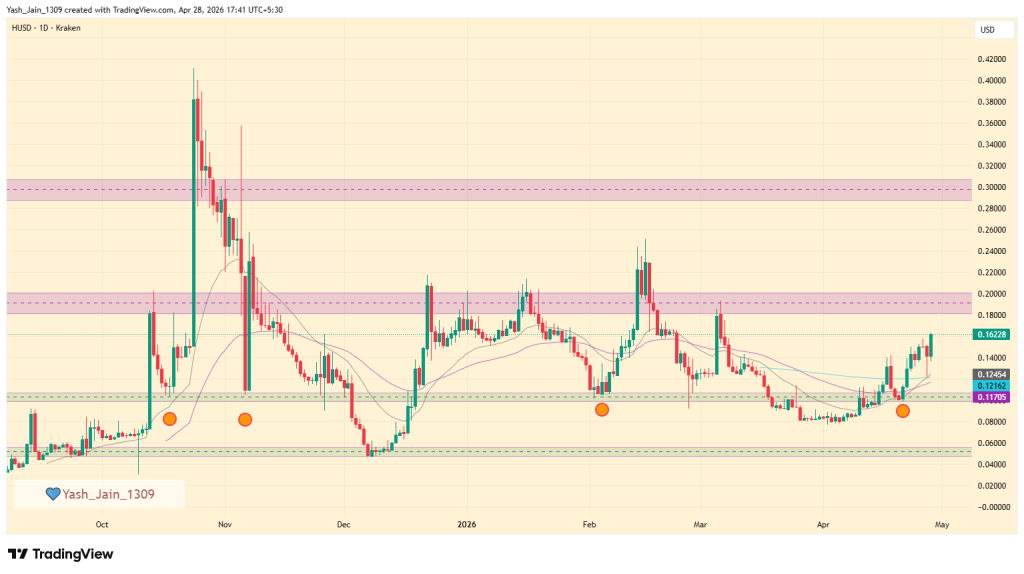

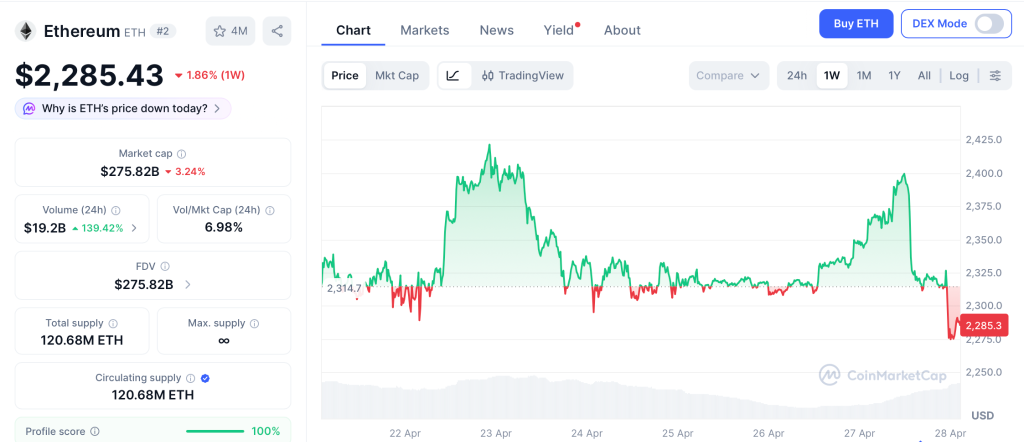
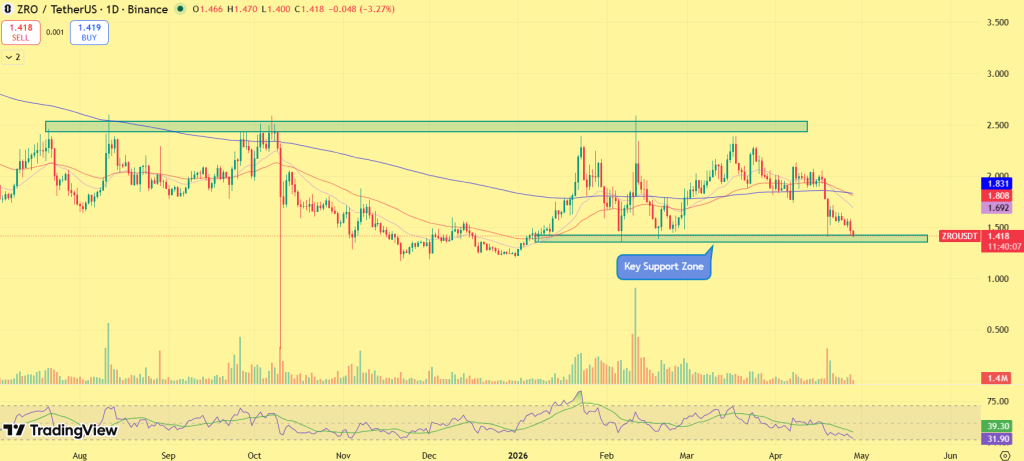
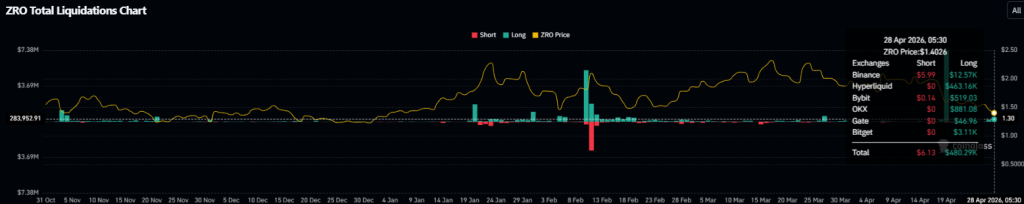

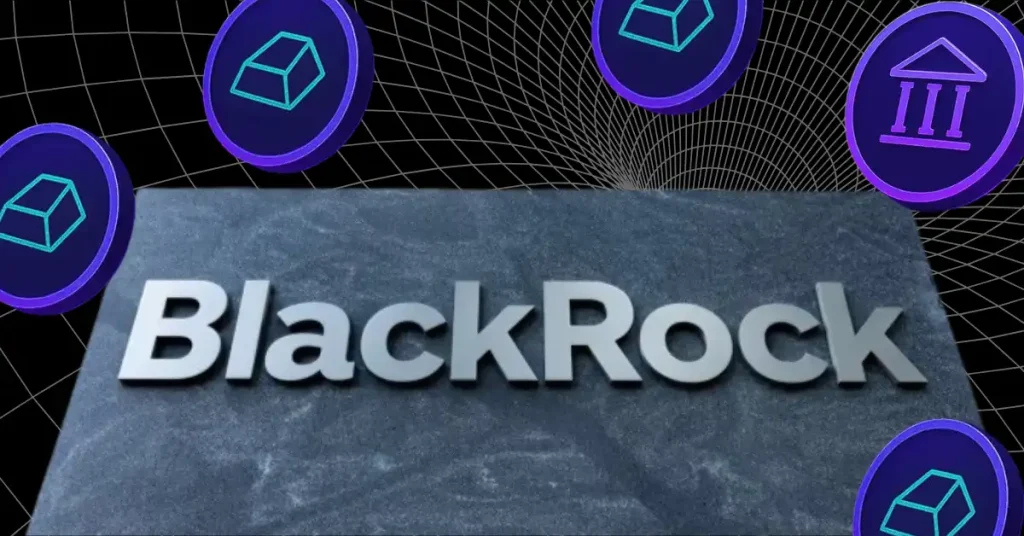
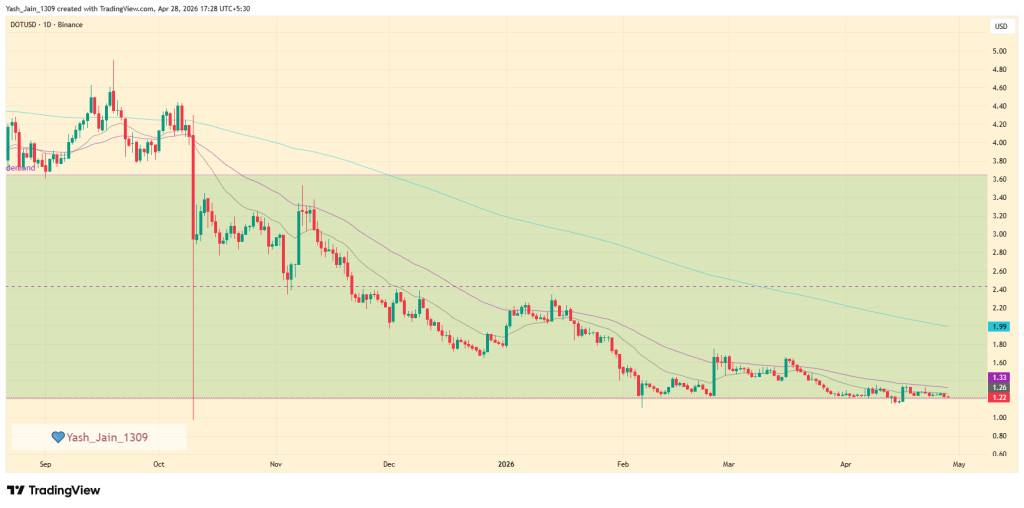
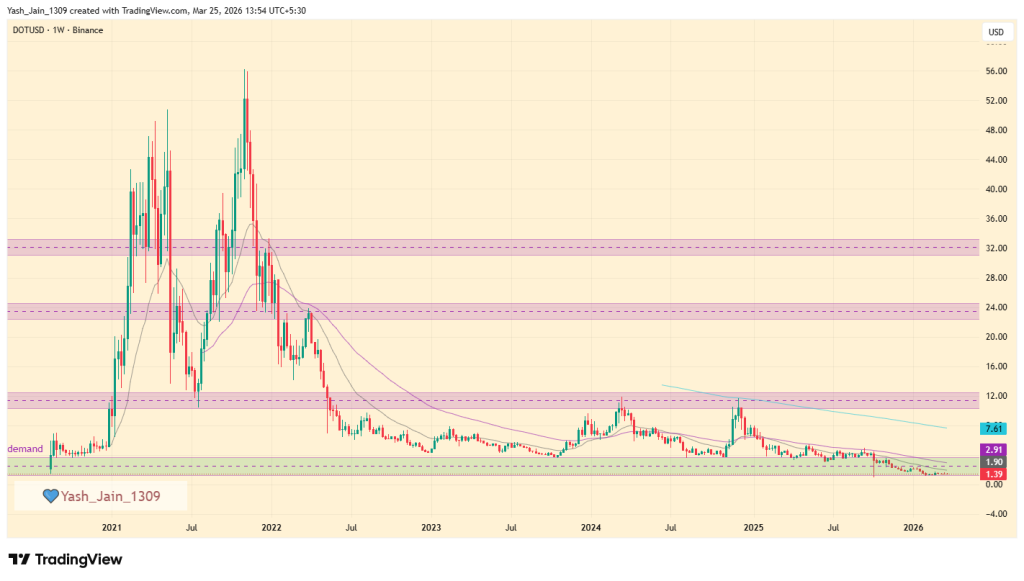
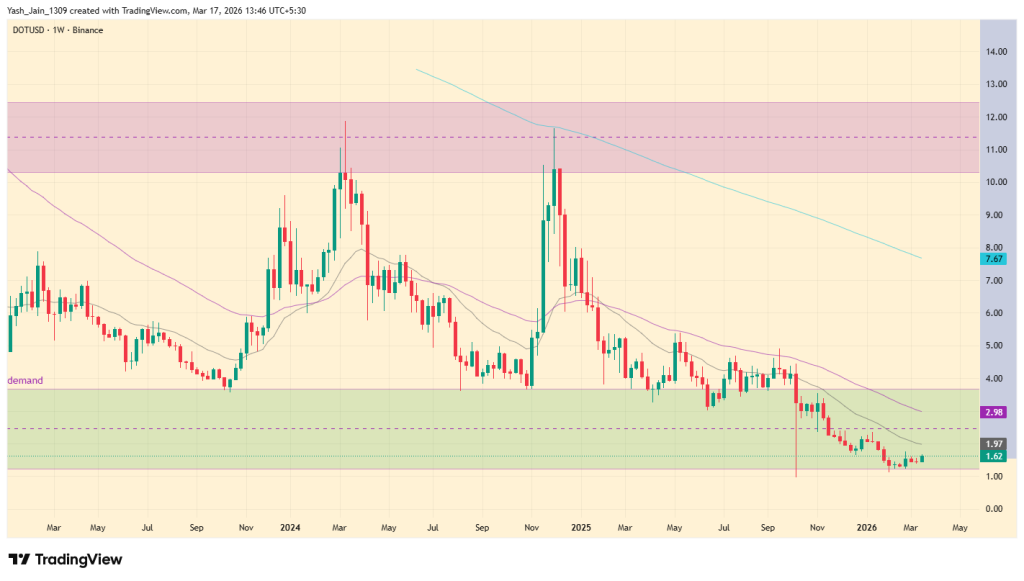
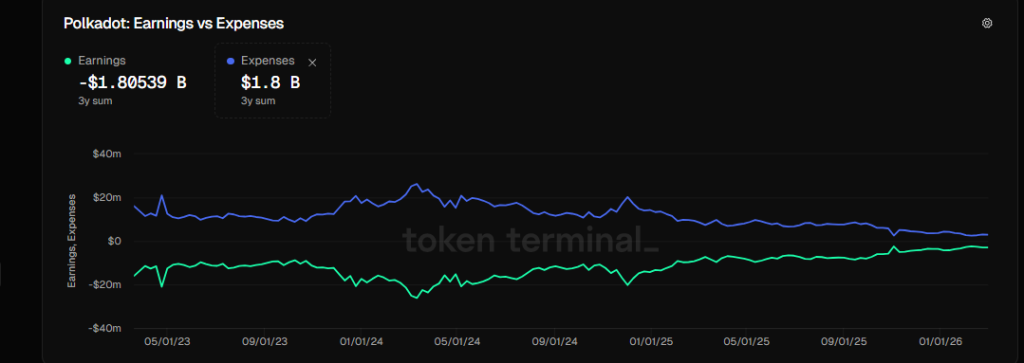
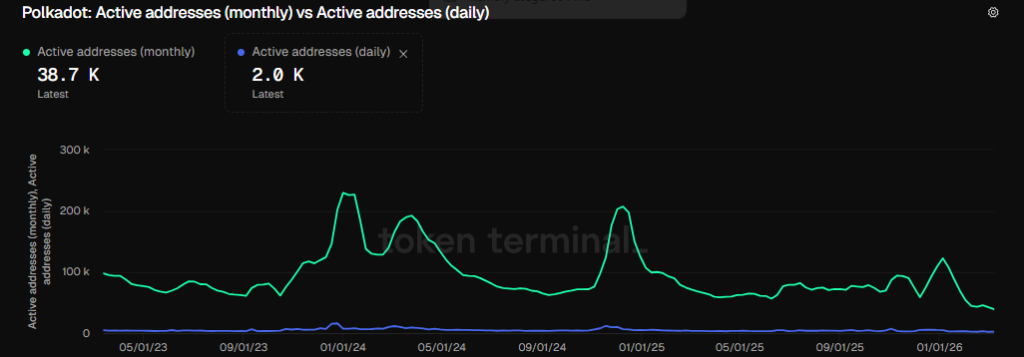
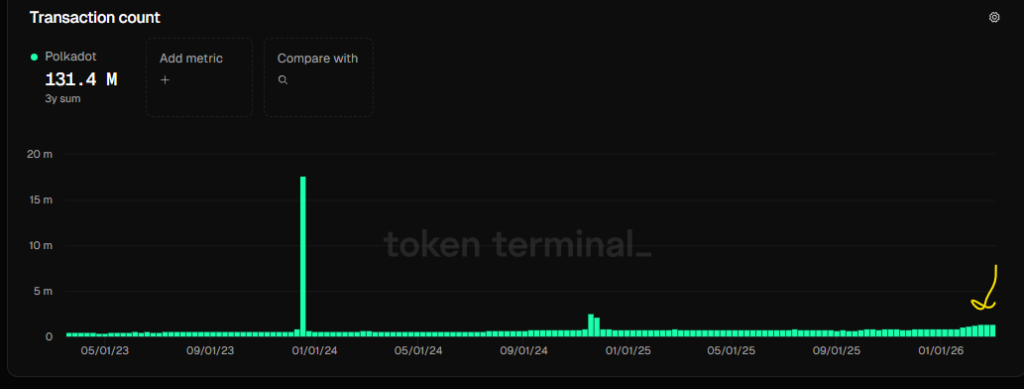


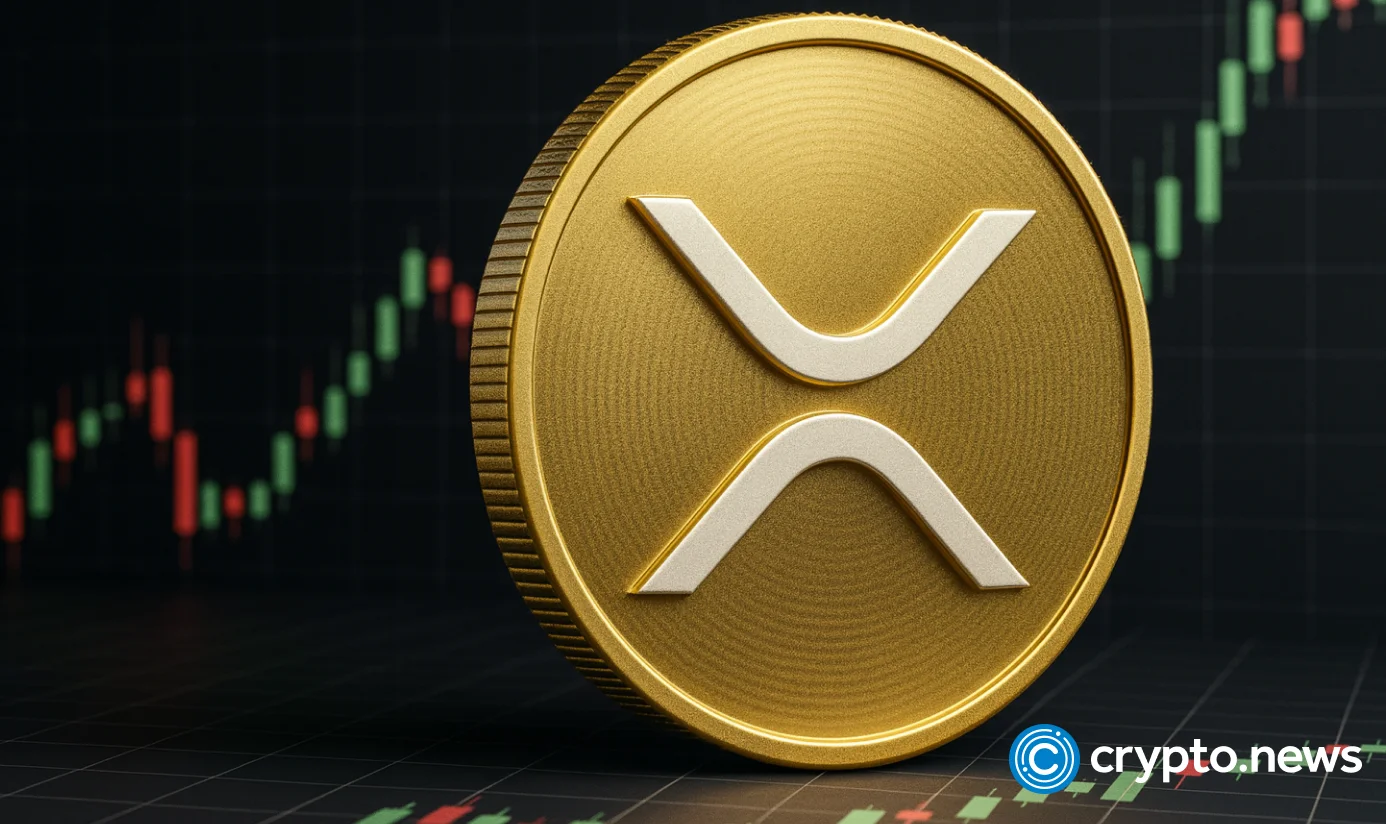


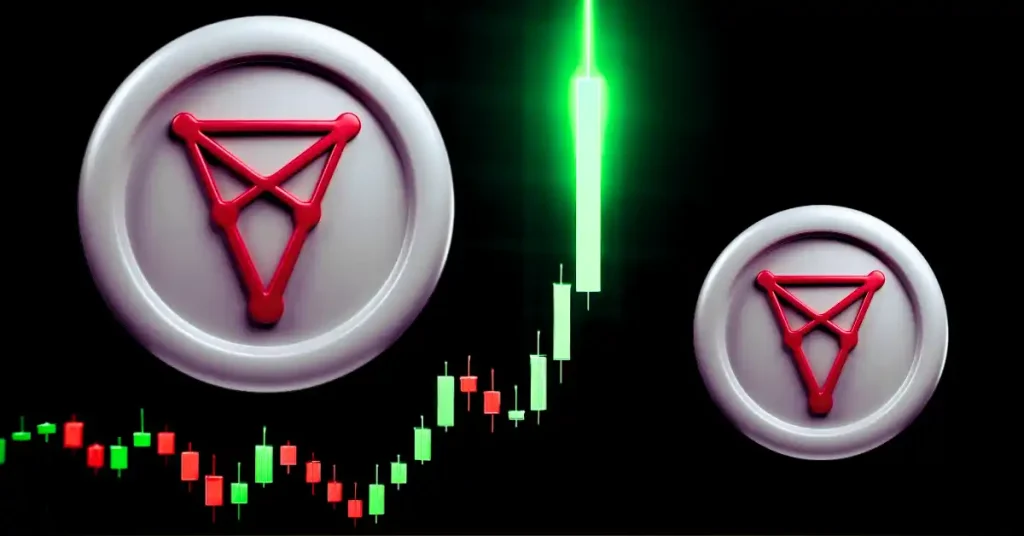
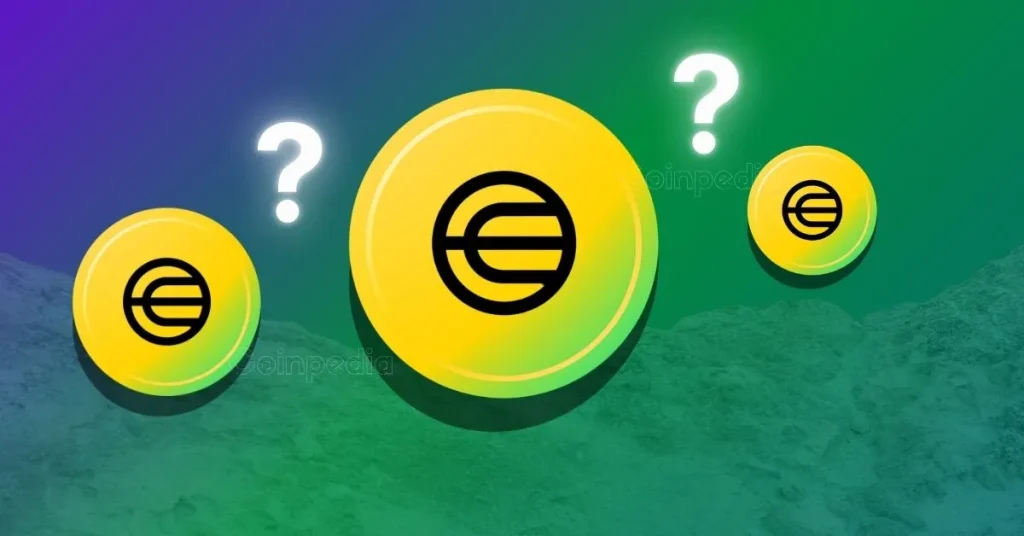
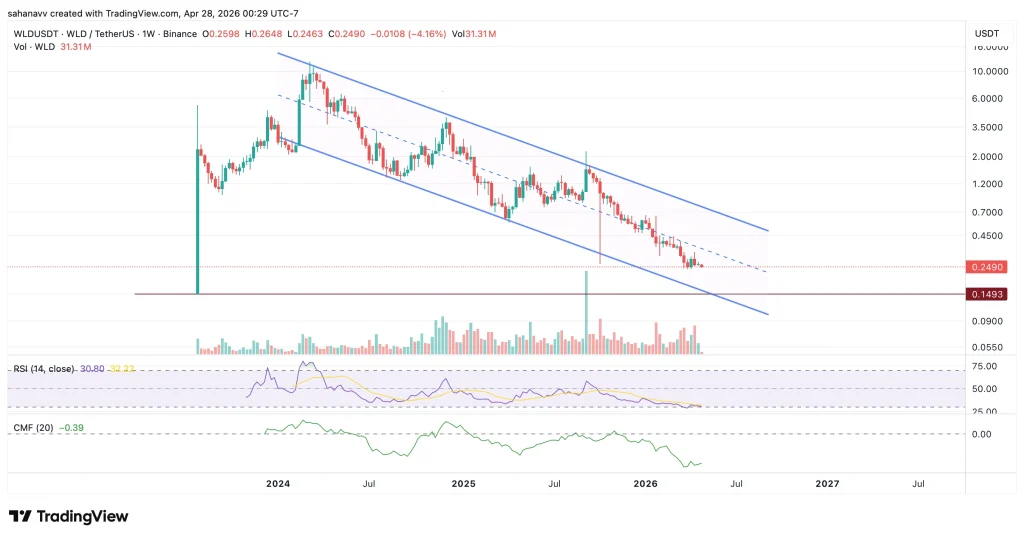
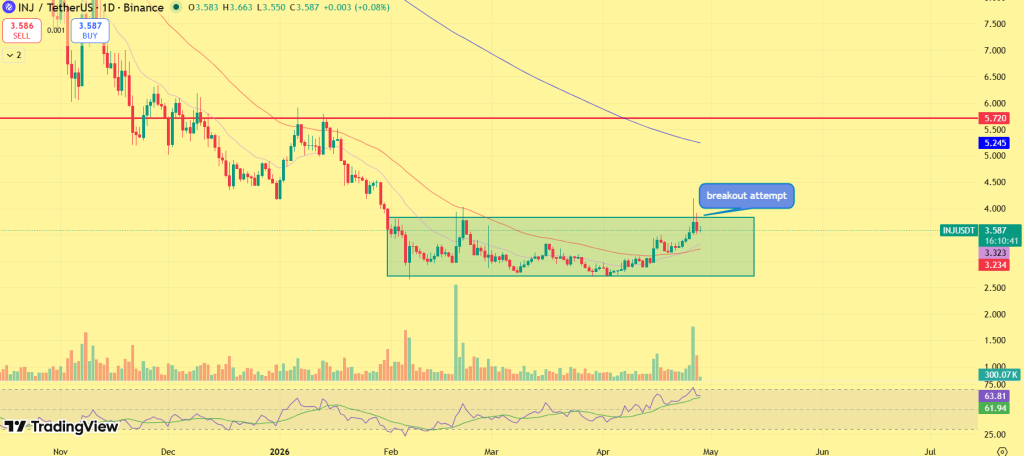
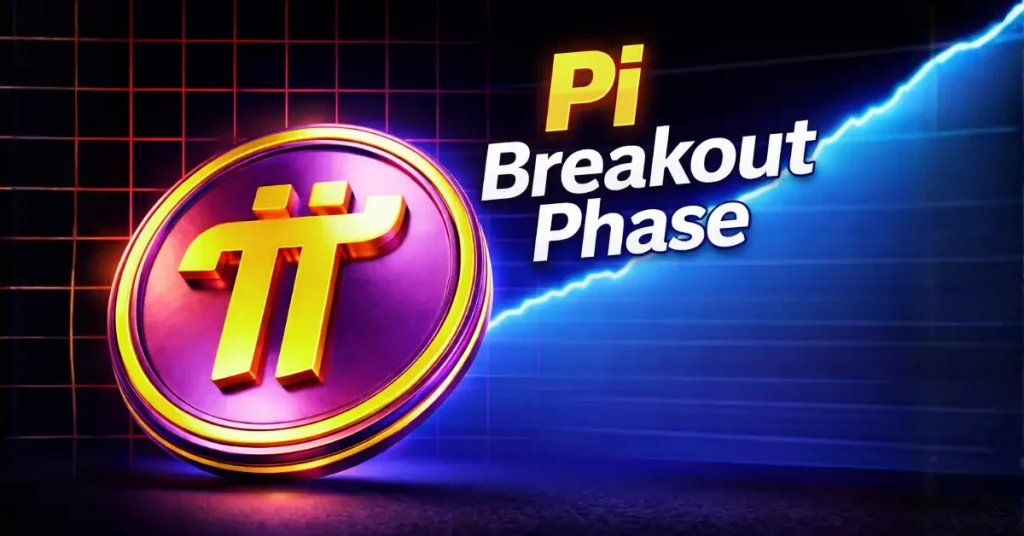
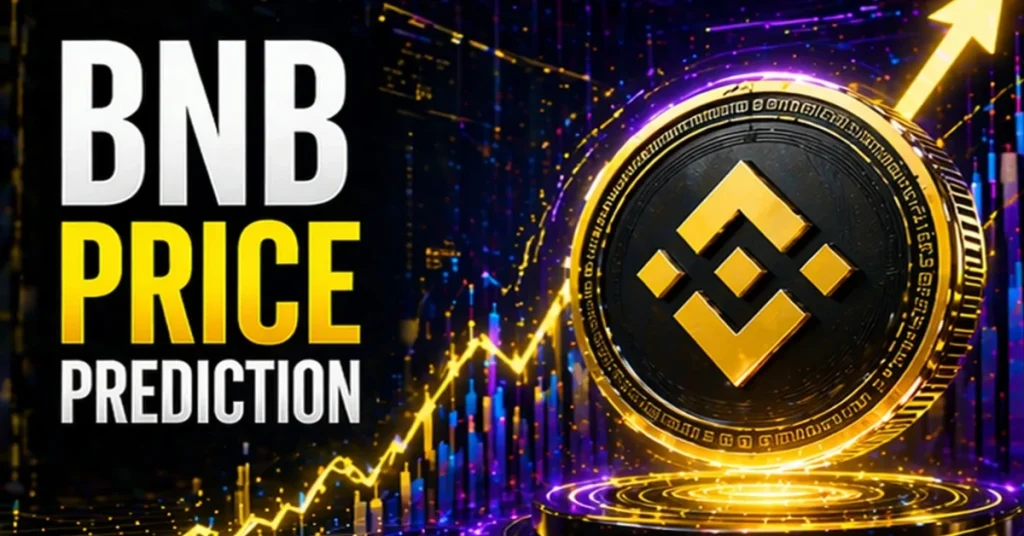
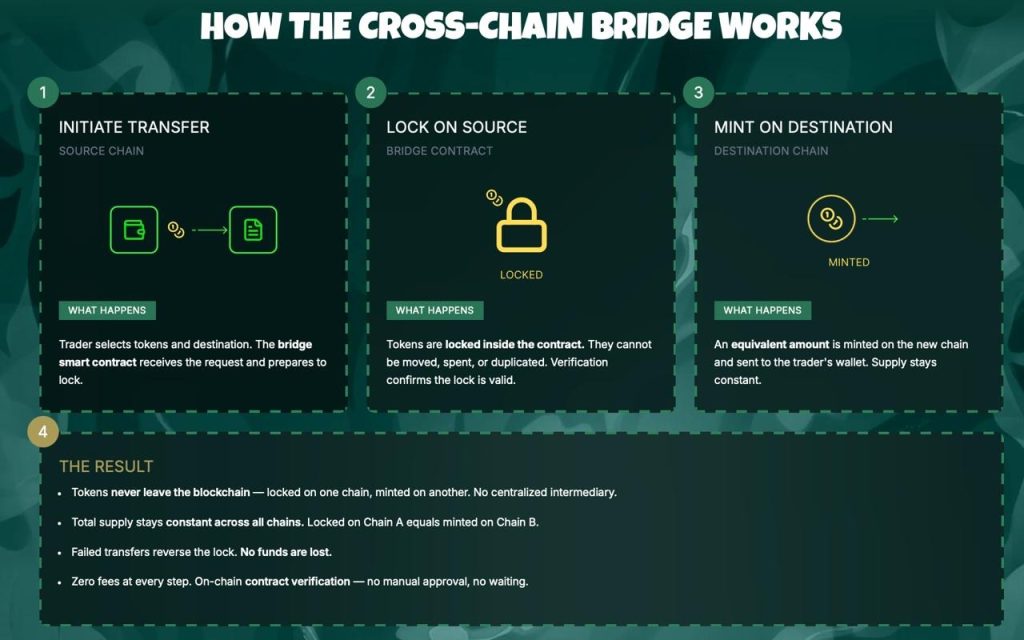
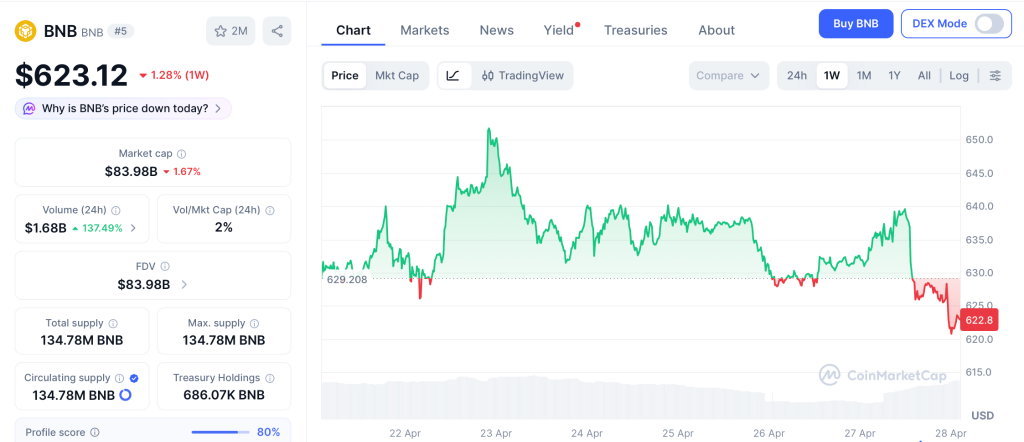


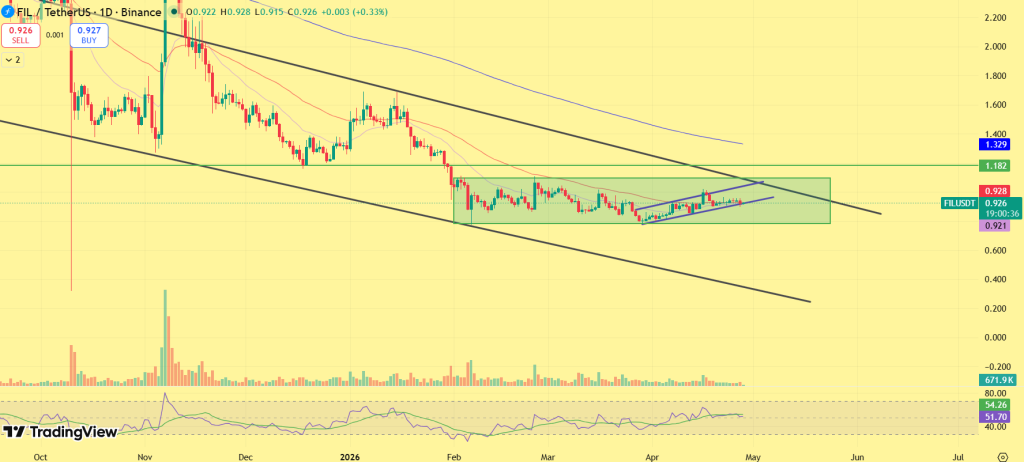
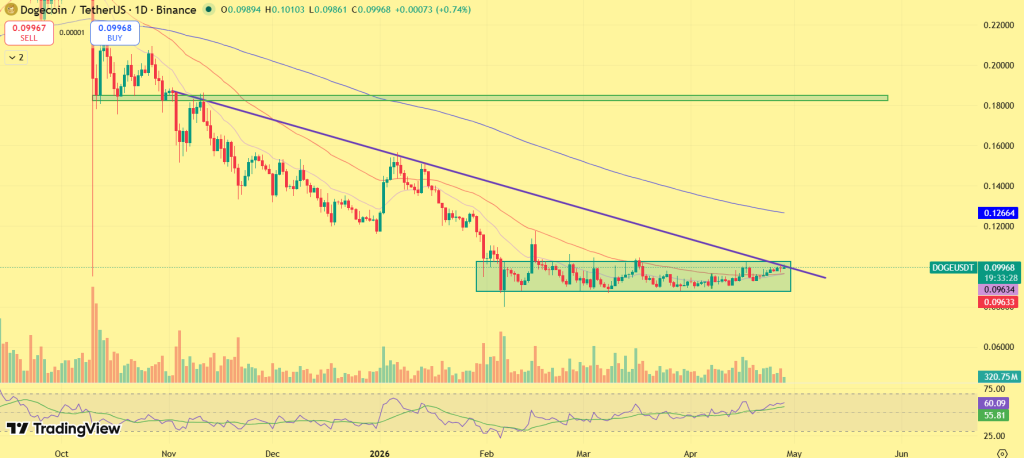
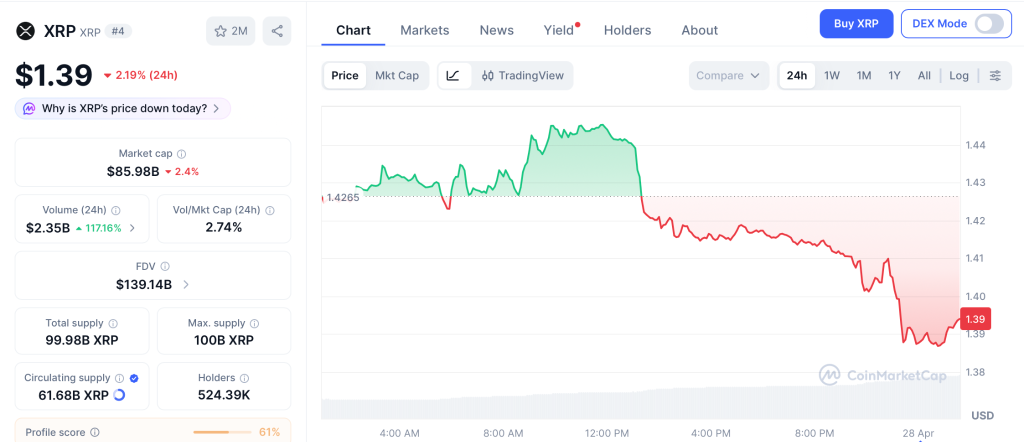


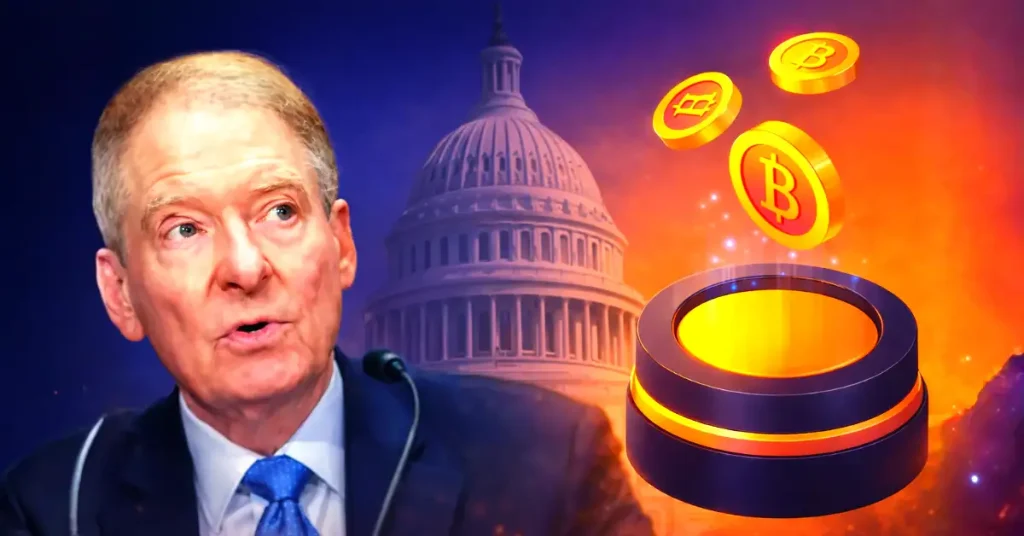

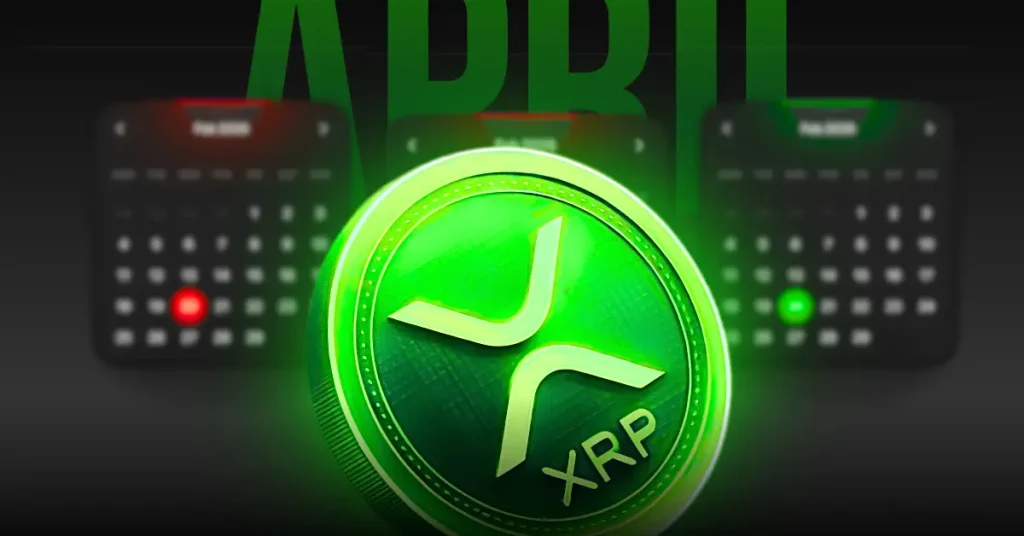


 WHITE HOUSE ADVISOR SAYS A "BIG ANNOUNCEMENT" IS COMING FOR TRUMP'S STRATEGIC BITCOIN RESERVE

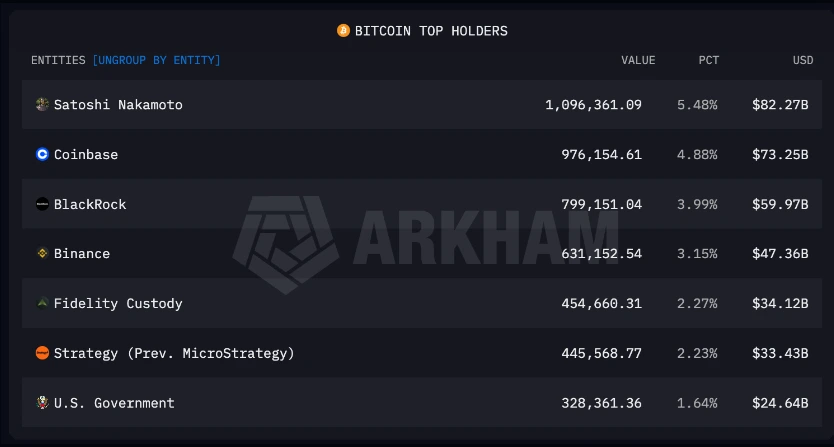

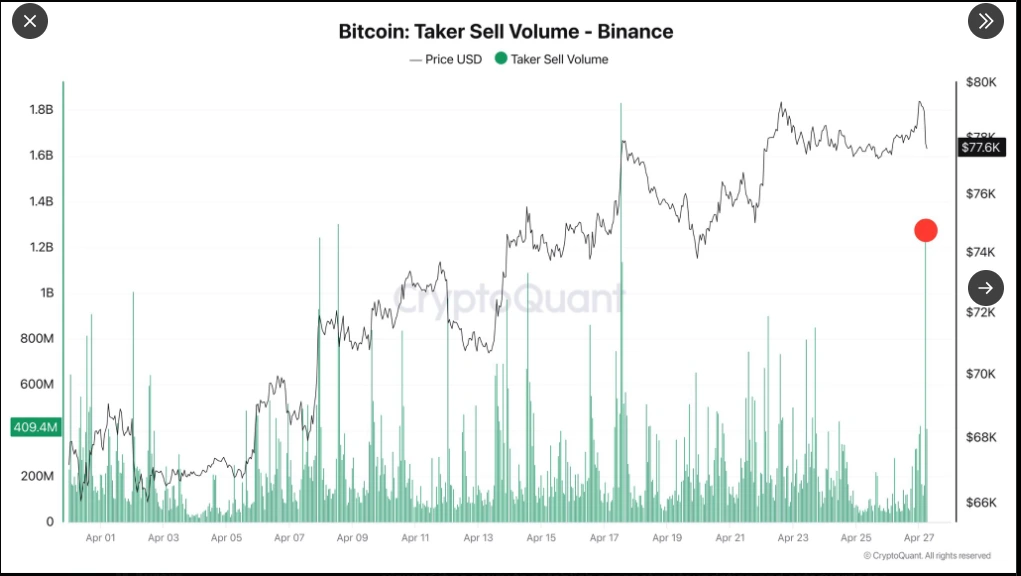
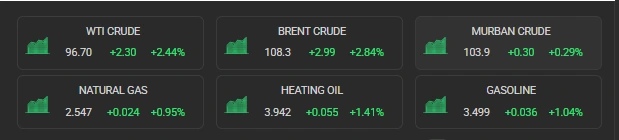


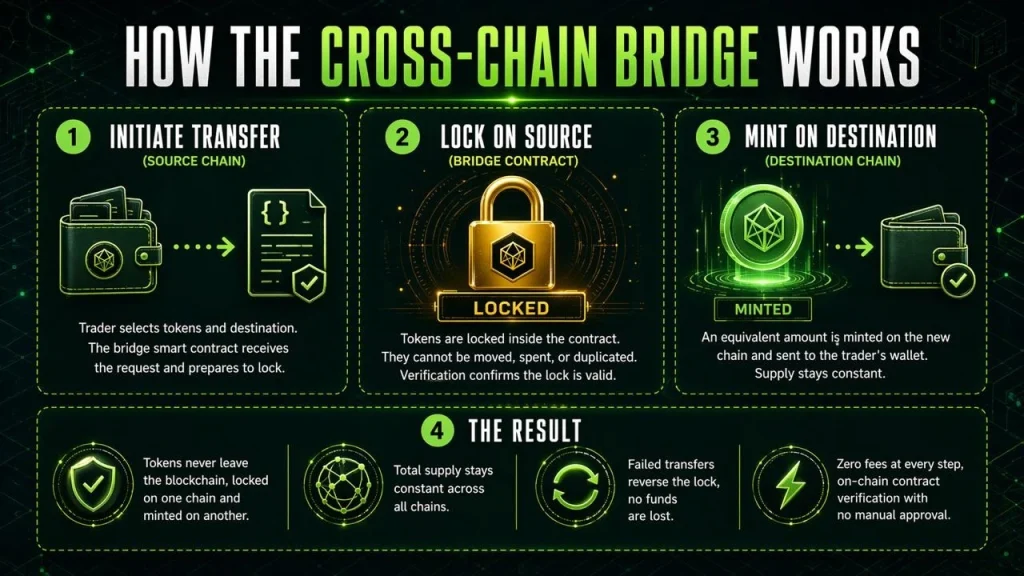
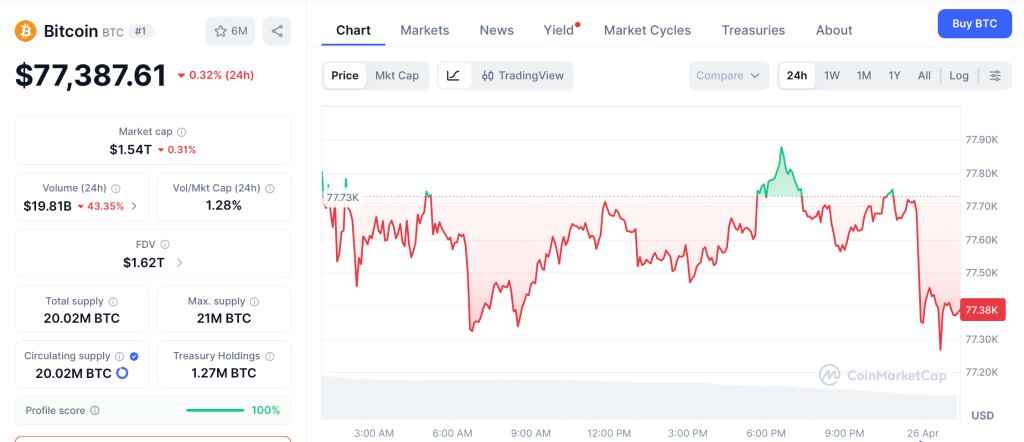


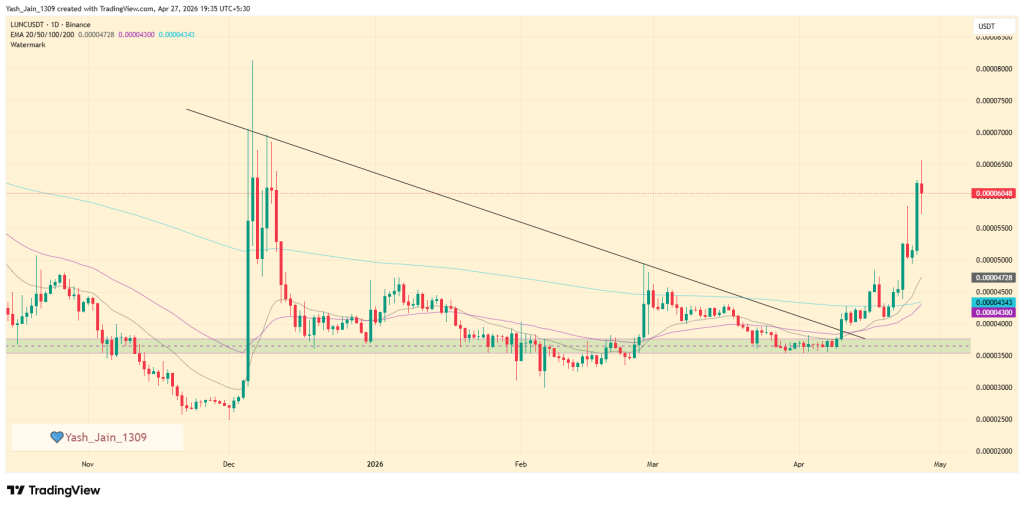
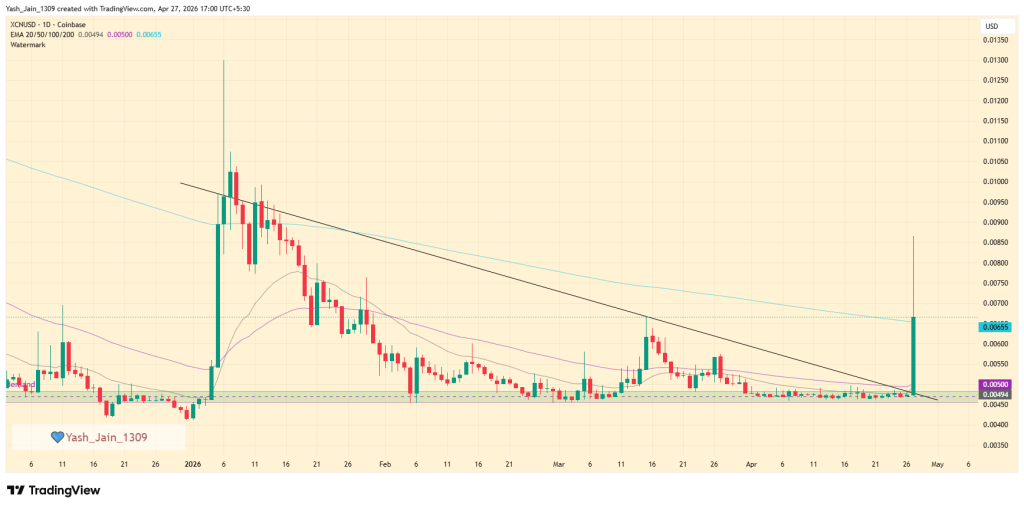
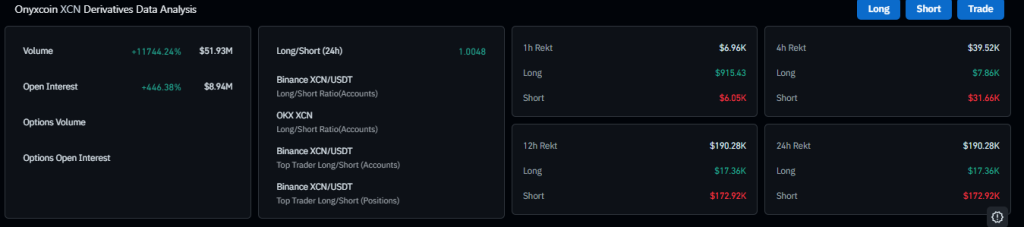


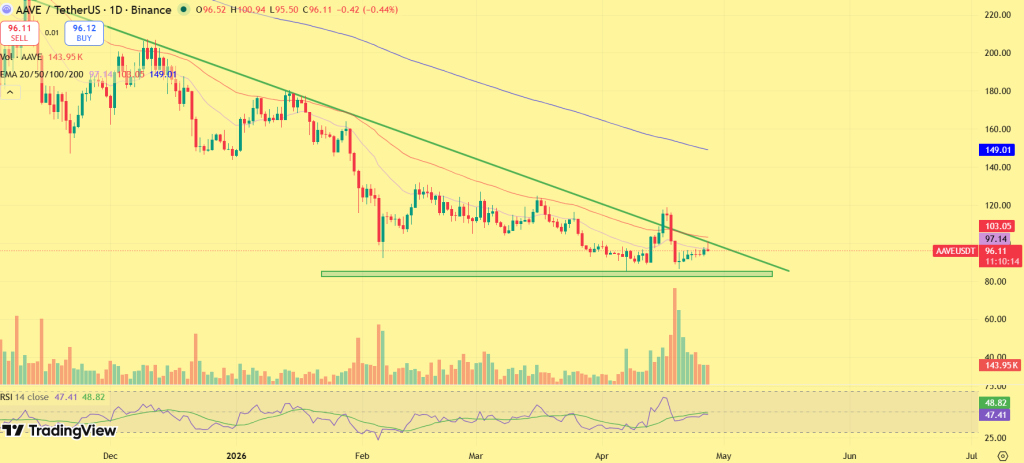


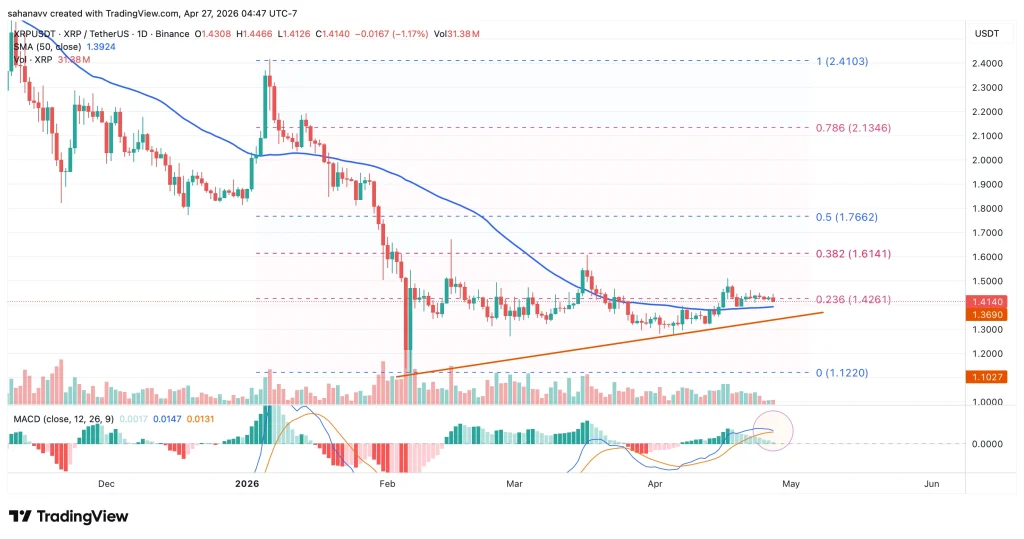


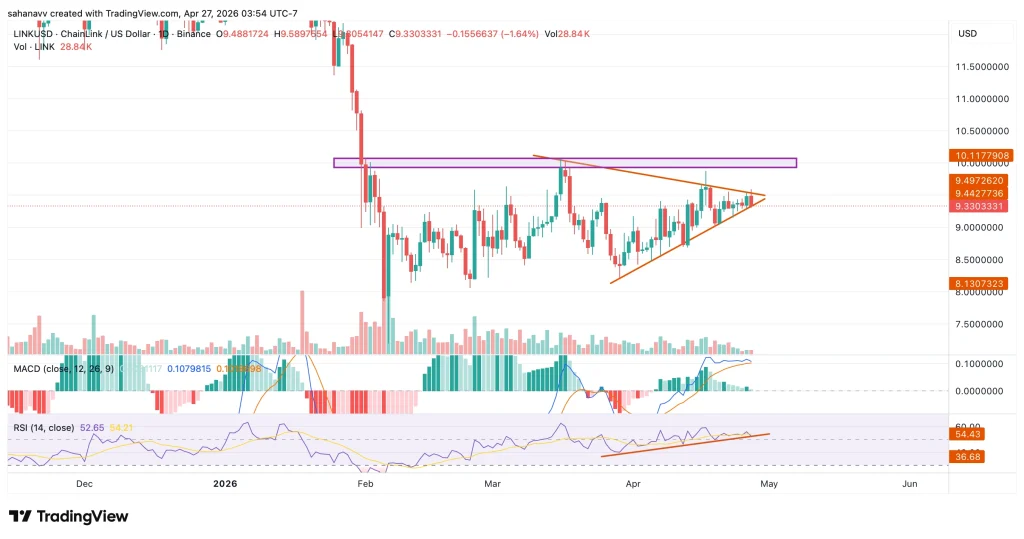
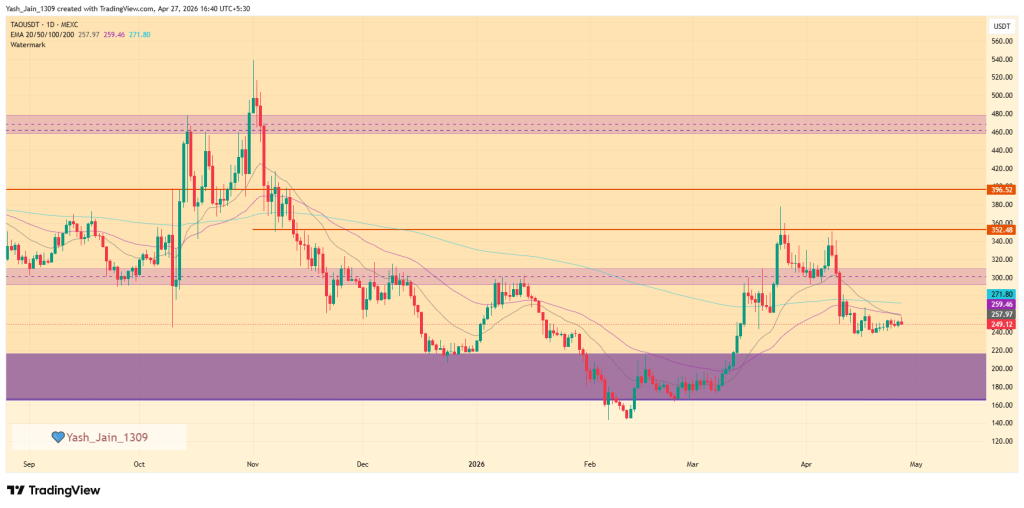
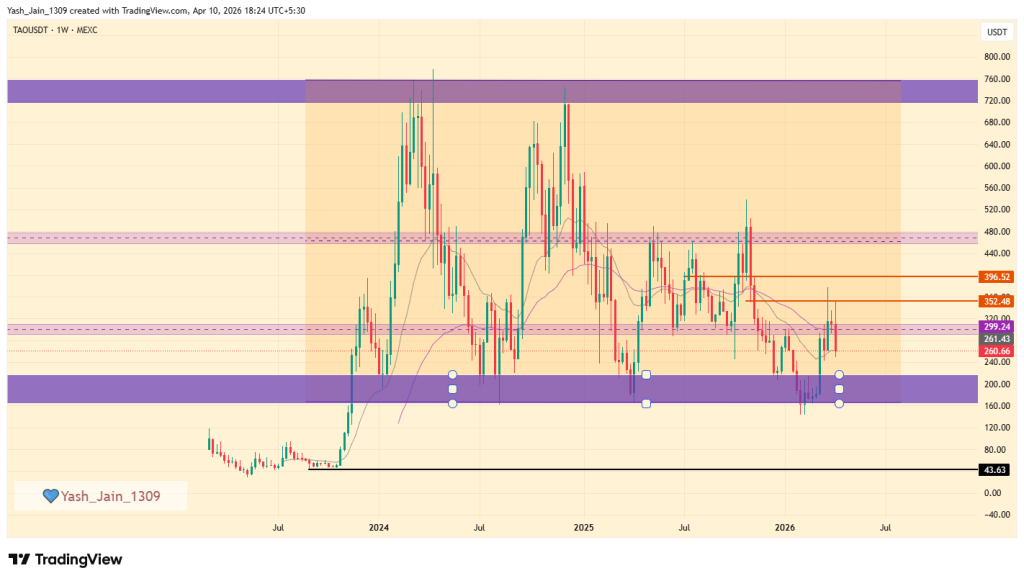
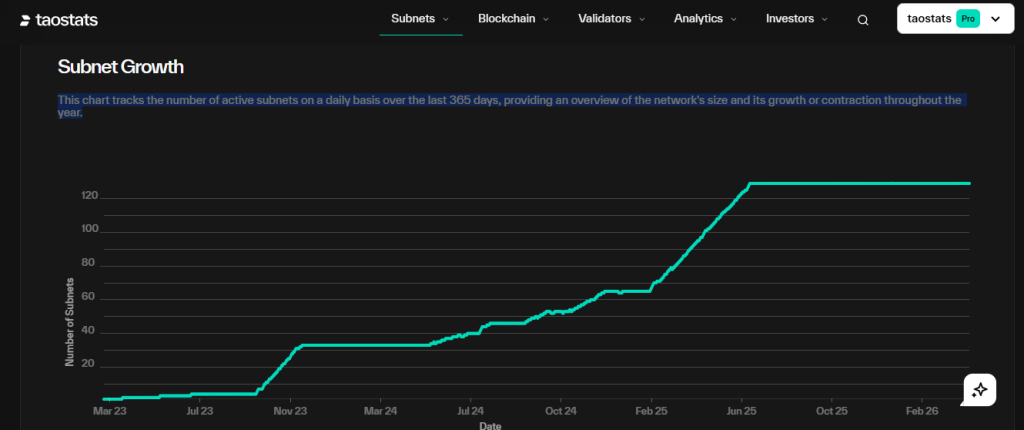


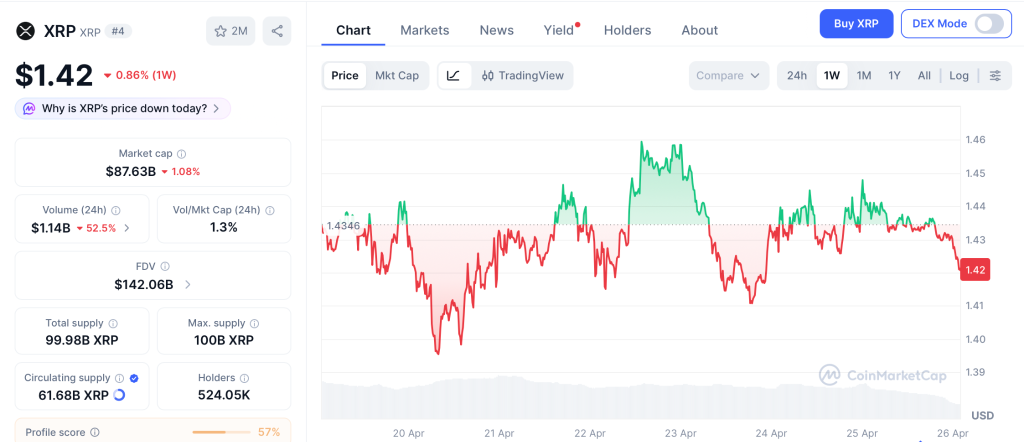
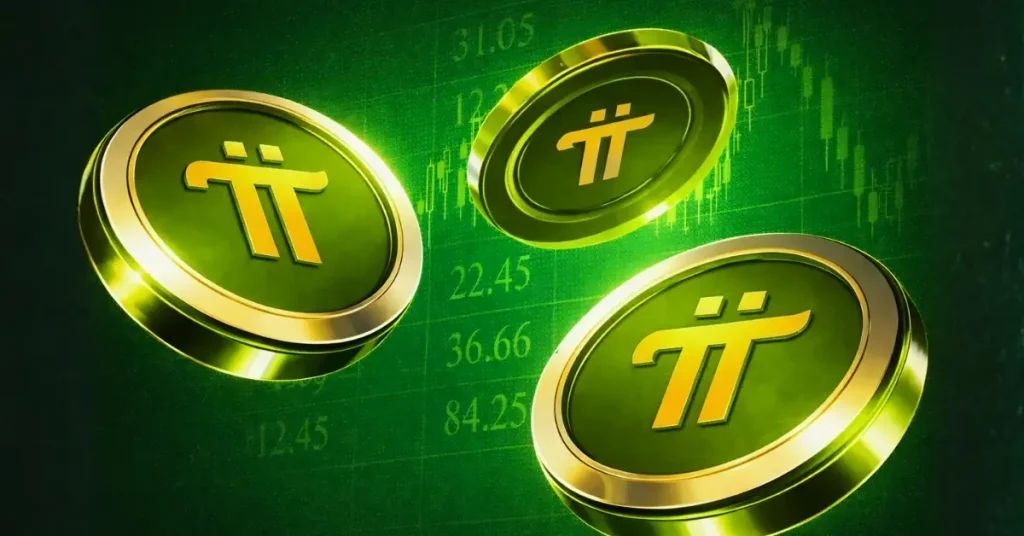
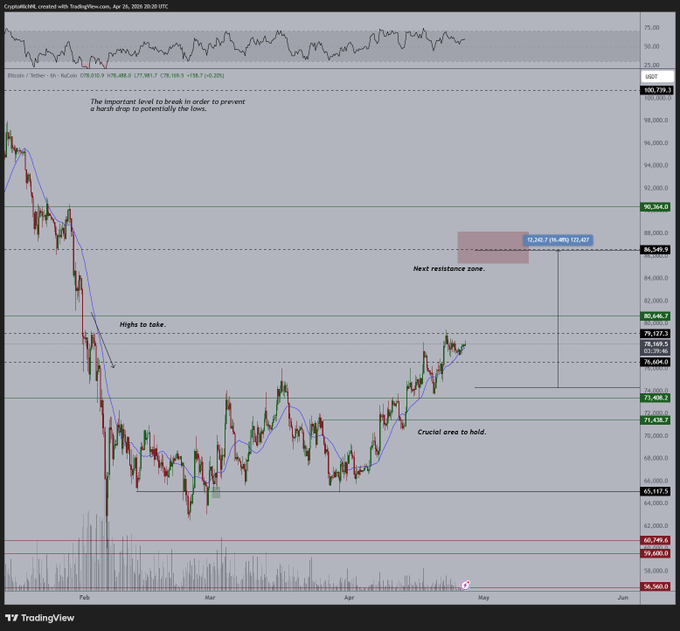


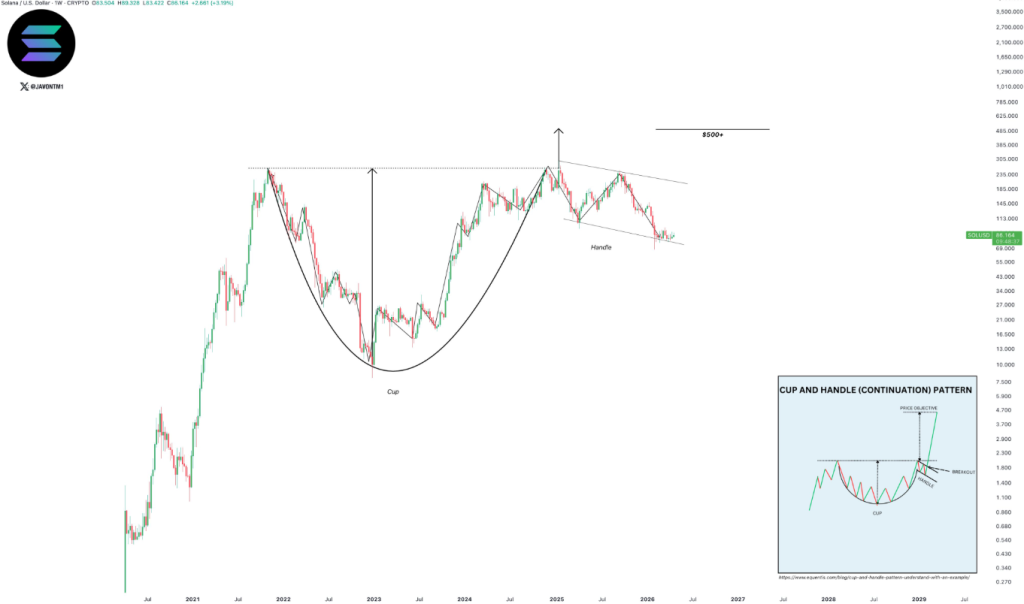


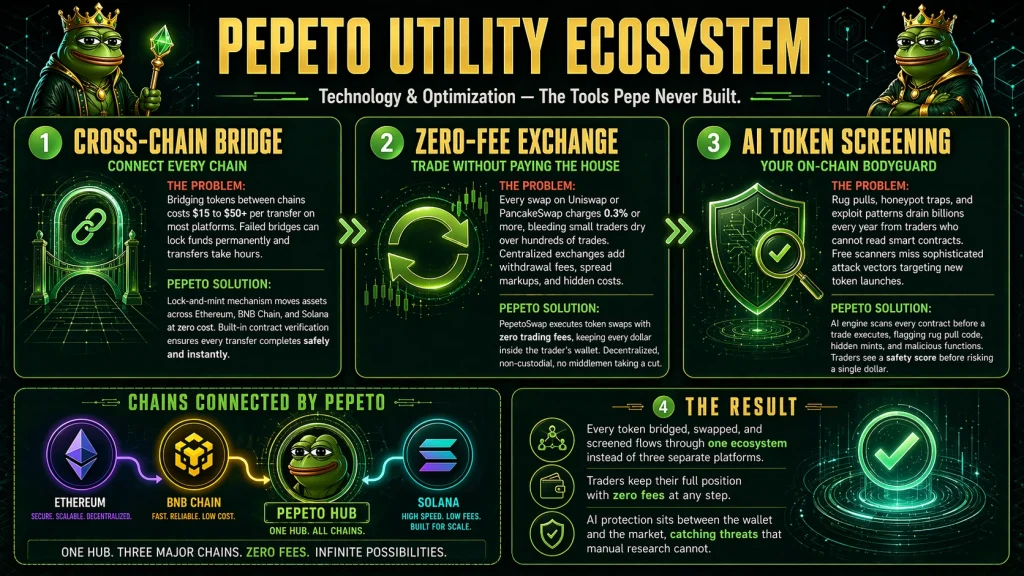
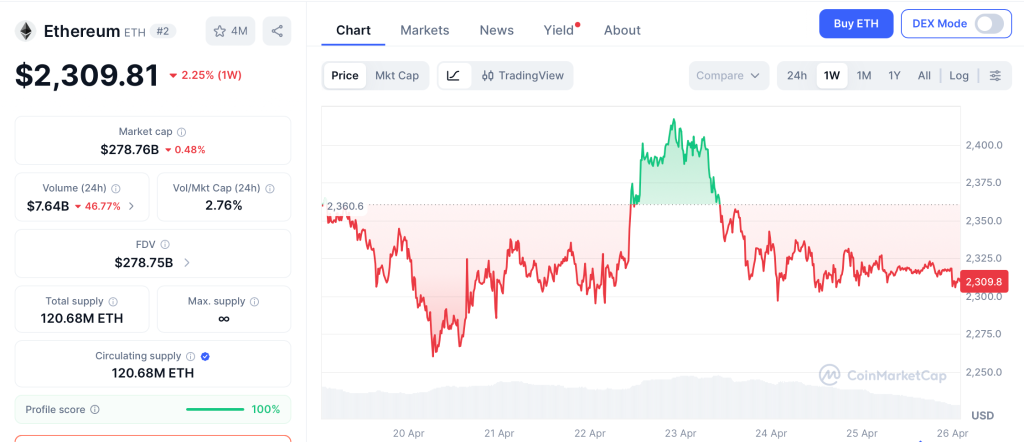


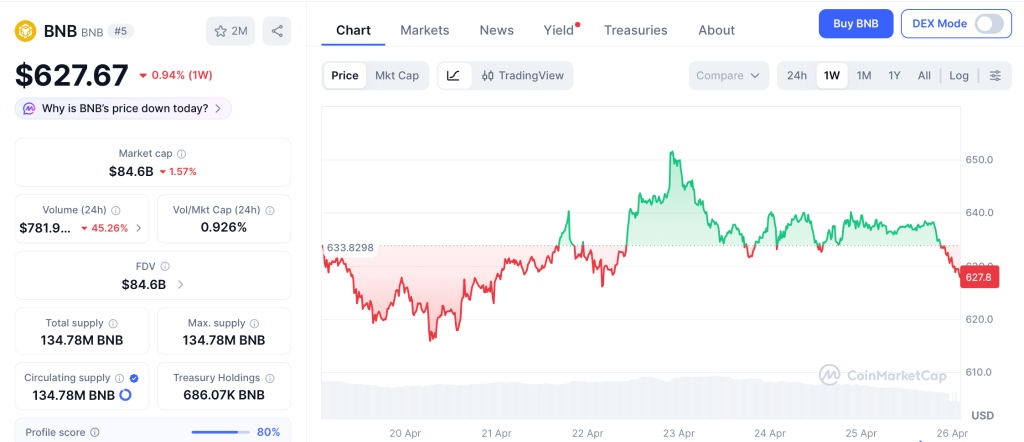

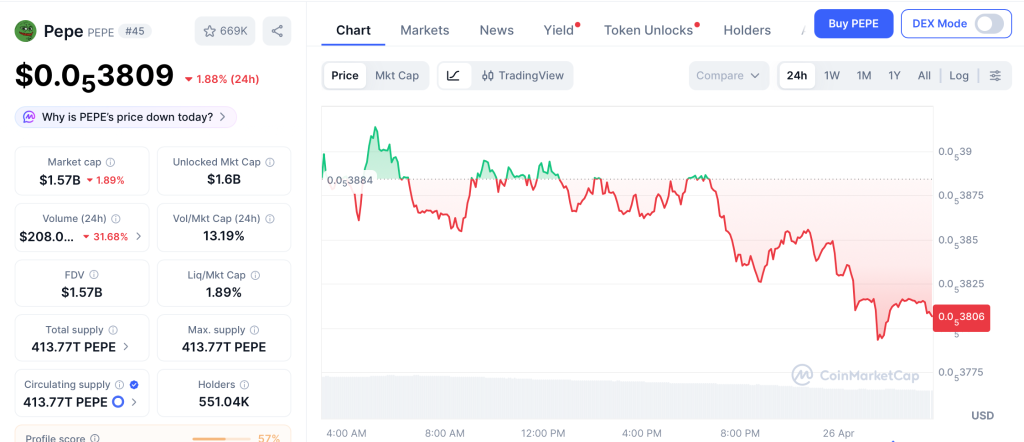


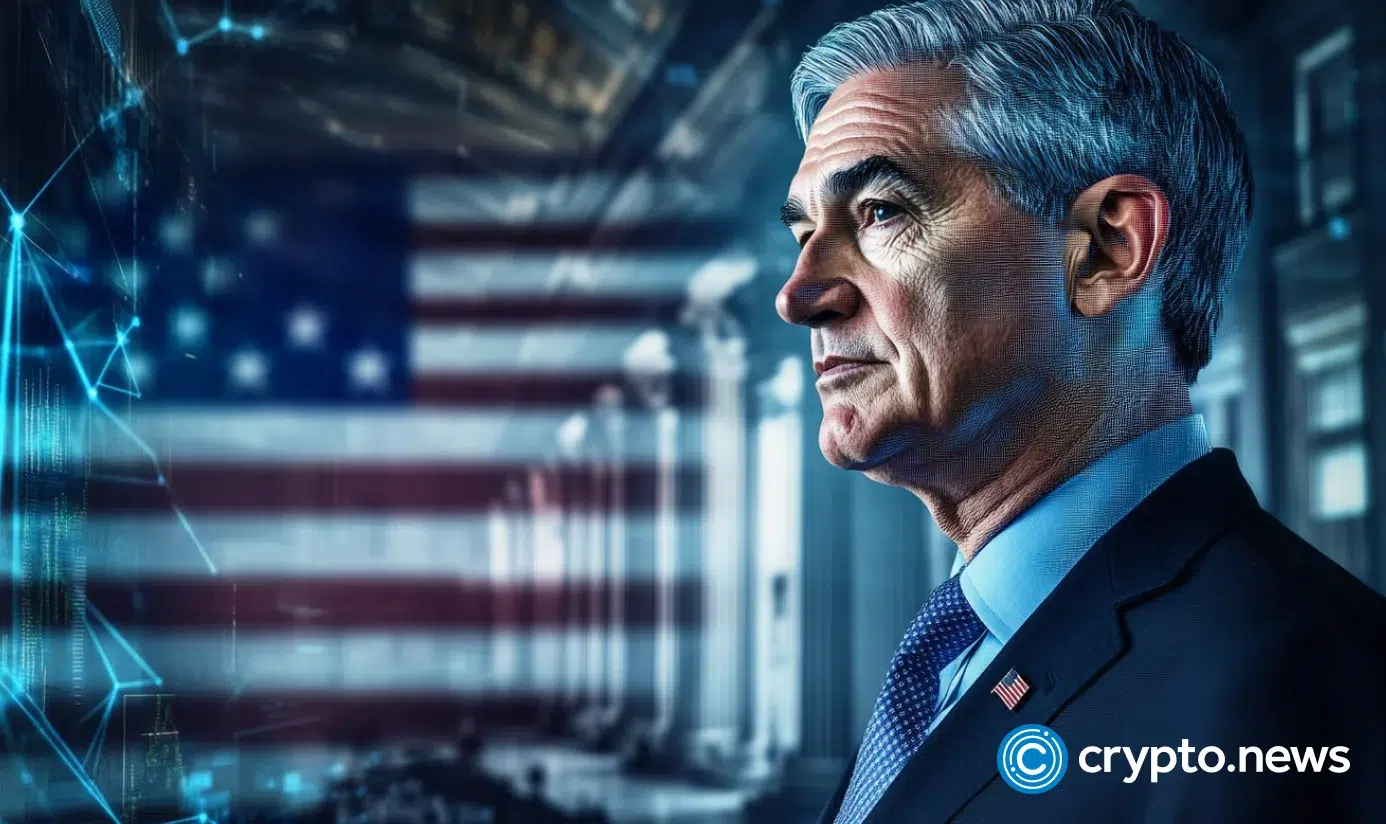

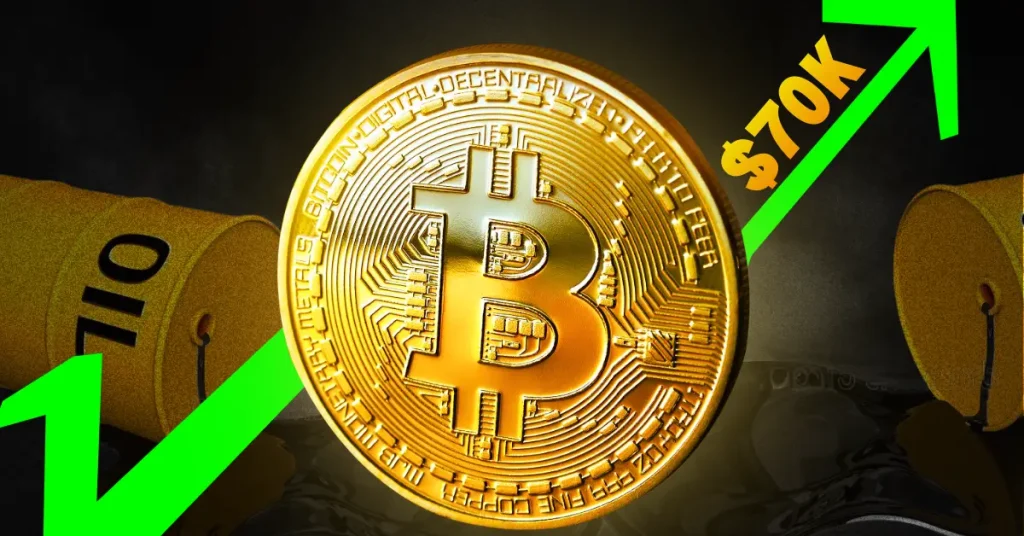
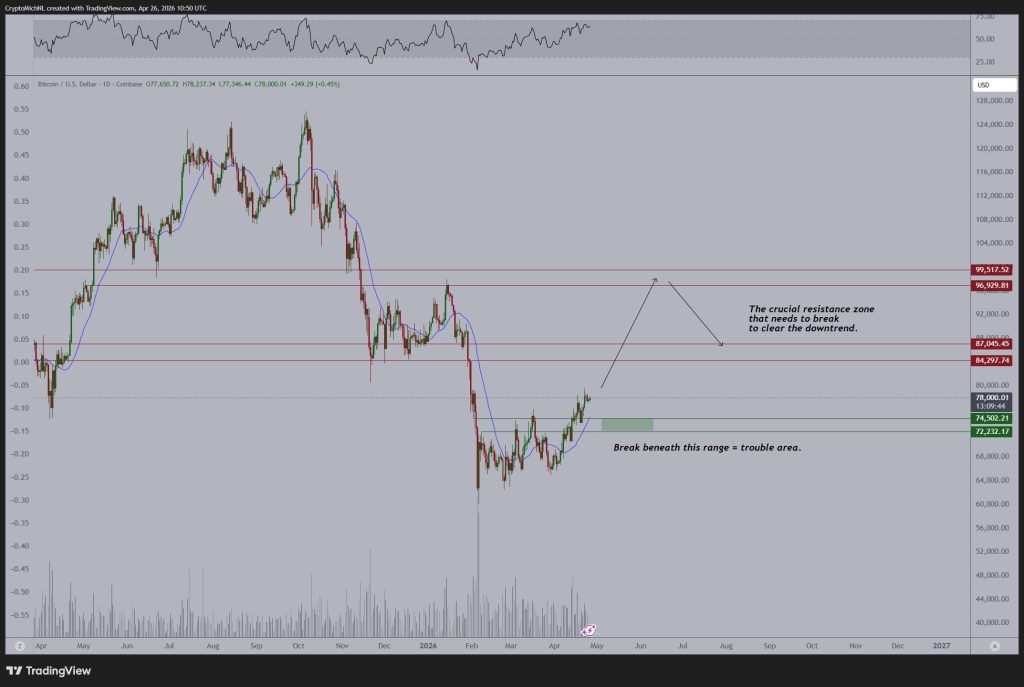
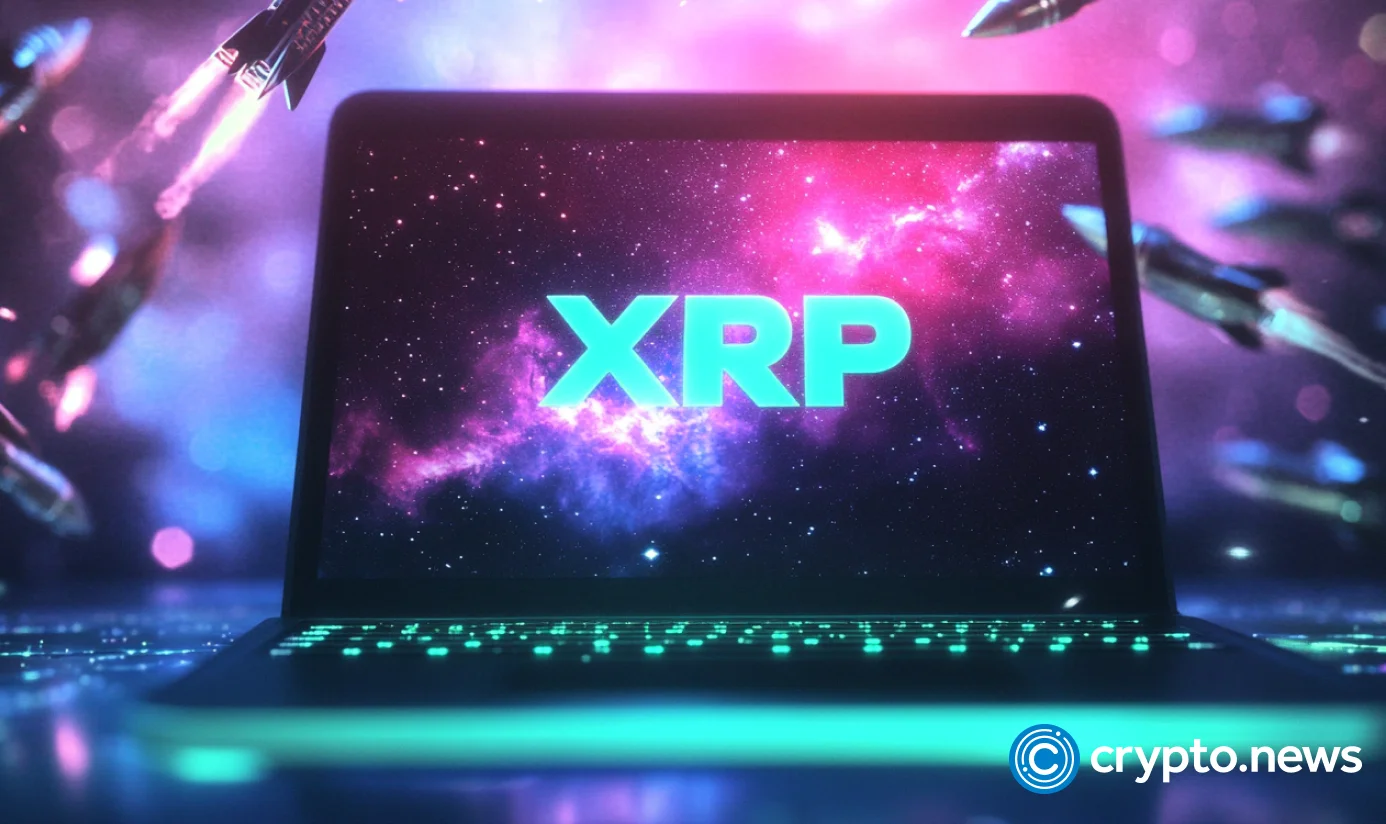


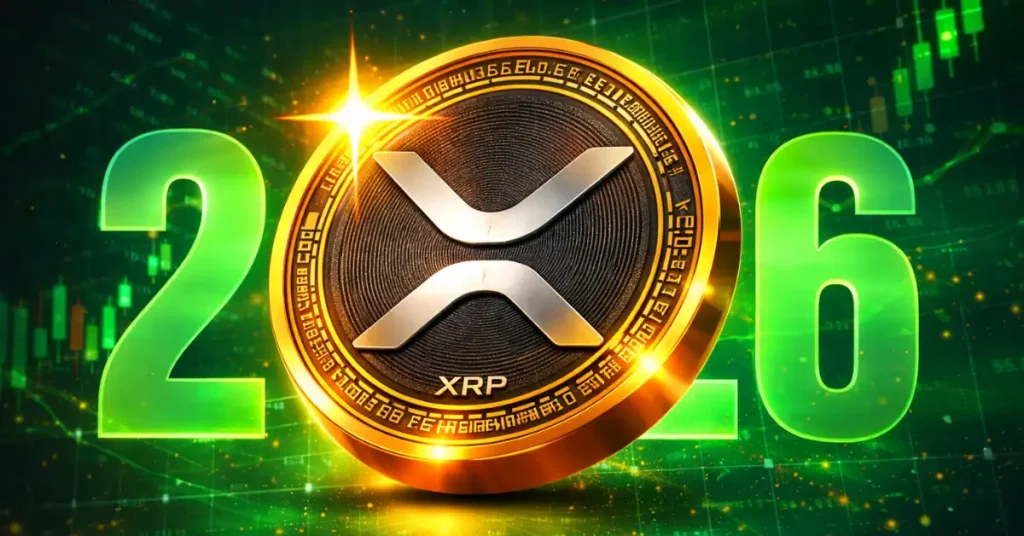
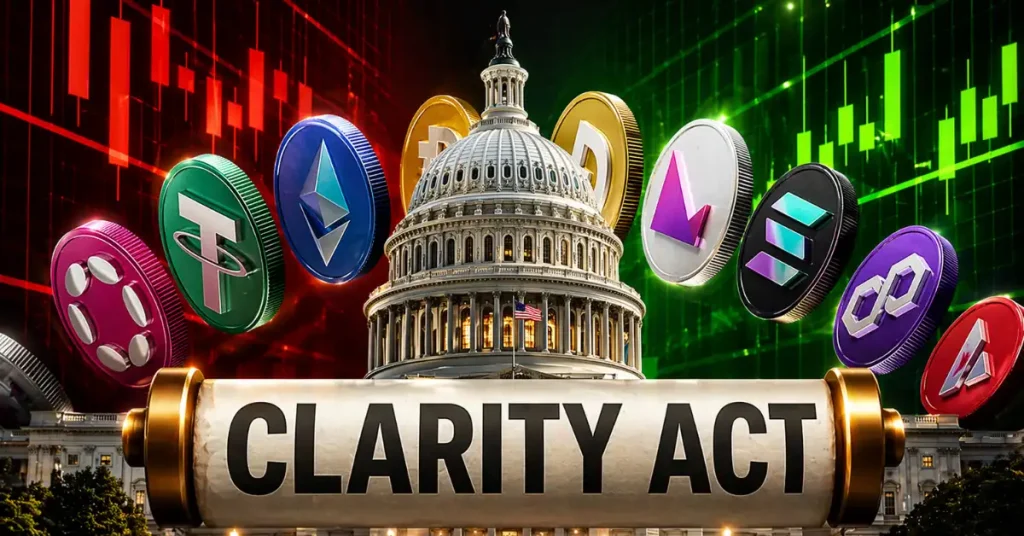


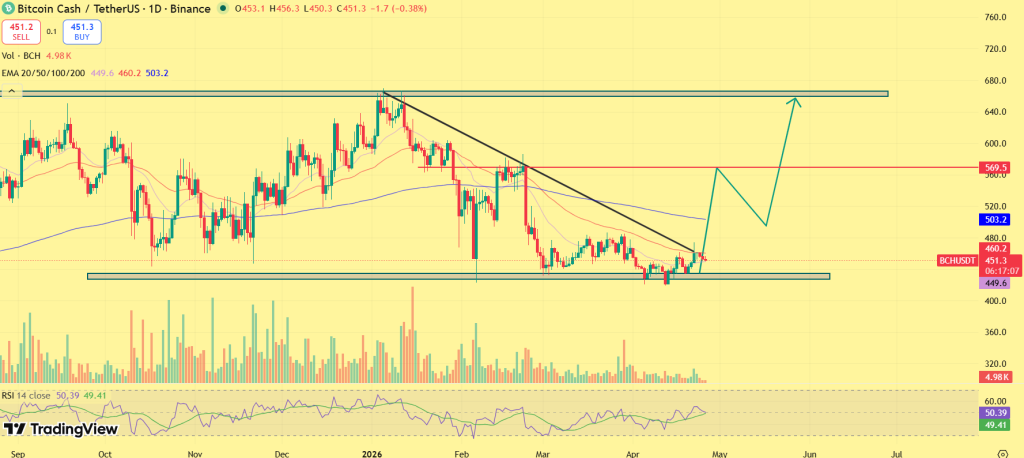

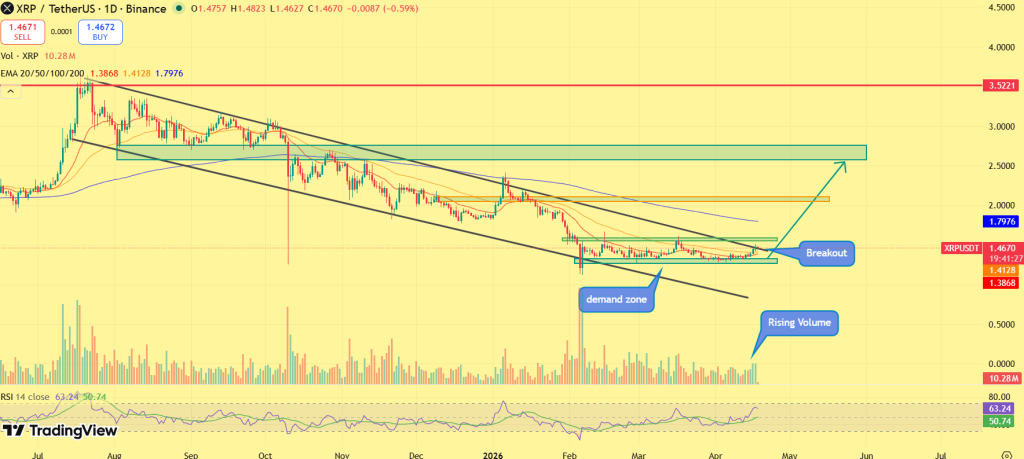
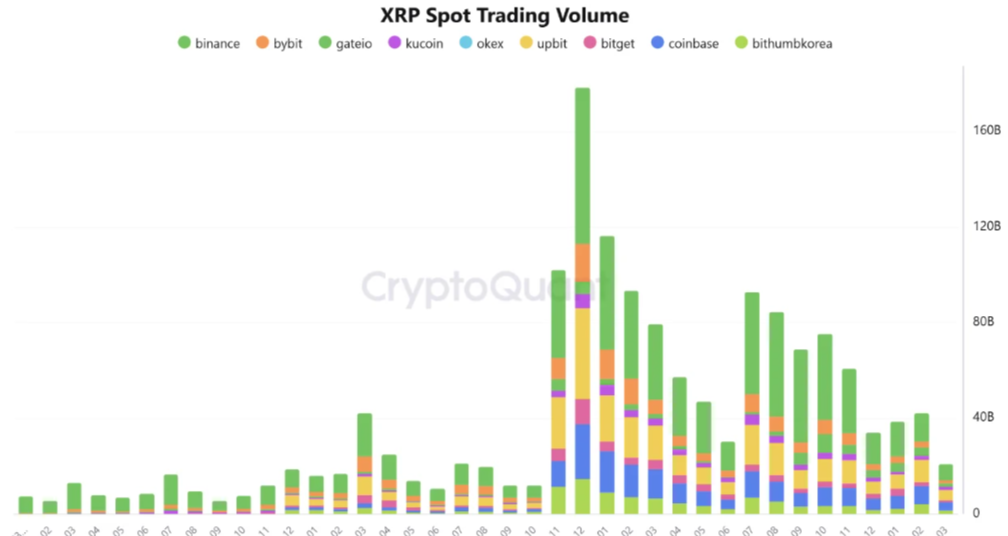
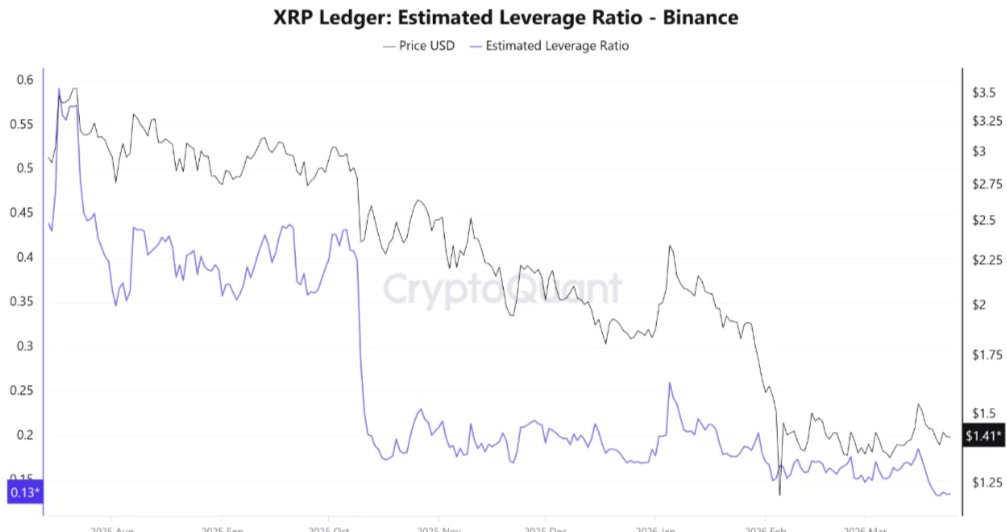


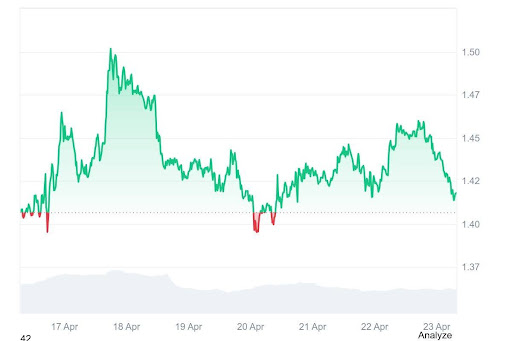


 SA's Treasury releases draft regs that:


 (@orca_so)