Reading view

First Ethereum Treasury Firm Sells ETH For Buybacks: Death Spiral Incoming?

Ethereum-focused treasury company ETHZilla said it has sold roughly $40 million worth of ether to fund ongoing share repurchases, a maneuver aimed at closing what it calls a “significant discount to NAV.” In a press statement on Monday, the company disclosed that since Friday, October 24, it has bought back about 600,000 common shares for approximately $12 million under a broader authorization of up to $250 million, and that it intends to continue buying while the discount persists.

ETHZilla Dumps ETH For BuyBacks

The company framed the buybacks as balance-sheet arbitrage rather than a strategic retreat from its core Ethereum exposure. “We are leveraging the strength of our balance sheet, including reducing our ETH holdings, to execute share repurchases,” chairman and CEO McAndrew Rudisill said, adding that ETH sales are being used as “cash” while common shares trade below net asset value. He argued the transactions would be immediately accretive to remaining shareholders.

ETHZilla amplified the message on X, saying it would “use its strong balance sheet to support shareholders through buybacks, reduce shares available for short borrow, [and] drive up NAV per share” and reiterating that it still holds “~$400 million of ETH” on the balance sheet and carries “no net debt.” The company also cited “recent, concentrated short selling” as a factor keeping the stock under pressure.

The market-structure logic is straightforward: when a digital-asset treasury trades below the value of its coin holdings and cash, buying back stock with “coin-cash” can, in theory, collapse the discount and lift NAV per share. But the optics are contentious inside crypto because the mechanism requires selling the underlying asset—here, ETH—to purchase equity, potentially weakening the very treasury backing that investors originally sought.

Death Spiral Incoming?

Popular crypto trader SalsaTekila (@SalsaTekila) commented on X: “This is extremely bearish, especially if it invites similar behavior. ETH treasuries are not Saylor; they haven’t shown diamond-hand will. If treasury companies start dumping the coin to buy shares, it’s a death spiral setup.”

Skeptics also zeroed in on funding choices. “I am mostly curious why the company chose to sell ETH and not use the $569m in cash they had on the balance sheet last month,” another analyst Dan Smith wrote, noting ETHZilla had just said it still holds about $400 million of ETH and thus didn’t deploy it on fresh ETH accumulation. “Why not just use cash?” The question cuts to the core of treasury signaling: using ETH as a liquidity reservoir to defend a discounted equity can be read as rational capital allocation, or as capitulation that undermines the ETH-as-reserve narrative.

Beyond the buyback, a retail-driven storyline has rapidly formed around the stock. Business Insider reported that Dimitri Semenikhin—who recently became the face of the Beyond Meat surge—has targeted ETHZilla, saying he purchased roughly 2% of the company at what he views as a 50% discount to modified NAV. He has argued that the market is misreading ETHZilla’s balance sheet because it still reflects legacy biotech results rather than the current digital-asset treasury model.

The same report cites liquid holdings on the order of 102,300 ETH and roughly $560 million in cash, translating to about $62 per share in liquid assets, and calls out a 1-for-10 reverse split on October 15 that, in his view, muddied the optics for retail. Semenikhin flagged November 13 as a potential catalyst if results show the pivot to ETH generating profits.

The company’s own messaging emphasizes the discount-to-NAV lens rather than a change in strategy. ETHZilla told investors it would keep buying while the stock trades below asset value and highlighted a goal of shrinking lendable supply to blunt short-selling pressure.

For Ethereum markets, the immediate flow effect is limited—$40 million is marginal in ETH’s daily liquidity—but the second-order risk flagged by traders is behavioral contagion. If other ETH-heavy treasuries follow the playbook, selling the underlying to buy their own stock, the flow could become pro-cyclical: coins are sold to close equity discounts, the selling pressures spot, and wider discounts reappear as equity screens rerate to the weaker mark—repeat.

That is the “death spiral” scenario skeptics warn about when the treasury asset doubles as the company’s signal of conviction.

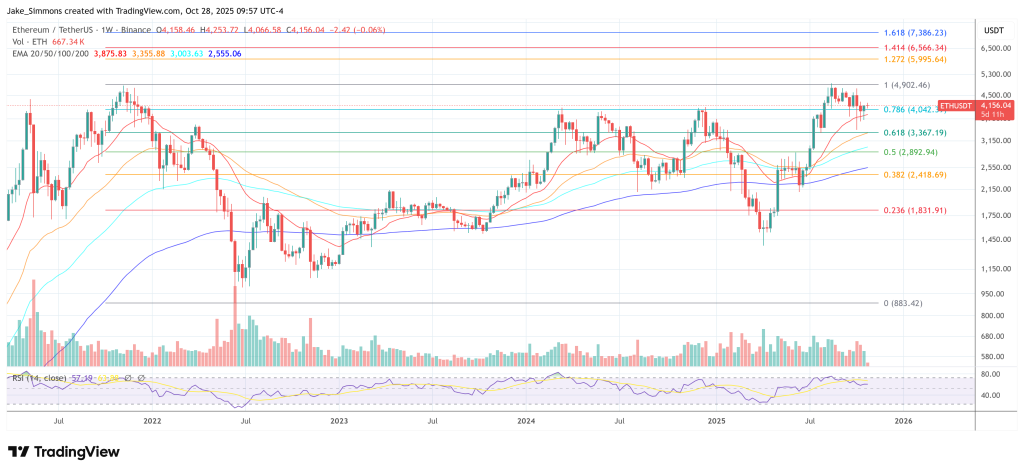
At press time, ETH traded at $4,156.
Ethereum price

XRP Final Test: Will Wave 4 End With One More Shakeout Before Liftoff?

XRP hovers at a key resistance, signaling a crucial decision point. With momentum building, traders now wonder, will one final dip come before the next major breakout?

XRP Faces A Crucial Decision Zone Amid Ongoing Range

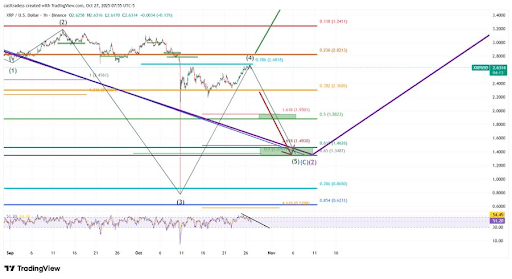
CasiTrades, in a recent market update, highlighted that XRP continues to range within a critical zone, keeping its setup for a potential final wave down valid. The analyst noted that the price remains at a key decision point, with ongoing tests of the Wave 4 highs acting as a firm ceiling against further upside movement. 

According to CasiTrades, the pivotal level to watch is $2.82 on Binance. A confirmed breakout and sustained hold above this resistance would invalidate the bearish setup and signal renewed bullish momentum. However, XRP has so far failed to push through, maintaining a range-bound structure between support and resistance, a sign that the market has yet to commit to a clear directional trend.

XRP

The analyst emphasized that a V-shaped recovery typically breaks through resistance with strong conviction, but such a move has not been seen here. Instead, XRP’s hesitancy indicates that selling pressure may still be present, preventing a clean continuation to the upside. 

Exchange Variations Add Complexity To Market Analysis

CasiTrades went on to explain that most major exchanges are now aligning around their key Fibonacci retracement levels, particularly the 0.618 zone. On Binance, this range sits between $1.35 and $1.46, which the analyst identified as the area where the next corrective wave could complete. According to the expert, this move would finalize the macro Wave 2 correction, paving the way for a powerful Wave 3 impulse that might propel XRP toward $6.50 or even $10.

The analyst emphasized that these lower price levels shouldn’t be viewed as a cause for concern but rather as valuable accumulation opportunities for long-term investors. Historically, zones like these have marked points of strong institutional buying and major trend reversals, presenting some of the best risk-to-reward setups before a large bullish expansion.

CasiTrades also noted that exchange discrepancies add a layer of complexity to the analysis. For instance, during a recent liquidation event, Binance briefly fell to $0.77, while Coinbase never reached its .618 retracement. This variation means traders should always chart on the specific exchange they plan to execute trades on, as price reactions can differ slightly between platforms. In conclusion, the analyst noted that until XRP breaks and holds above $2.82, the market structure still supports the idea of one final downward wave before a major upward cycle begins.

XRP

Bitcoin Faces Rejection — Resistance Zone Caps Upside After Recent Increase

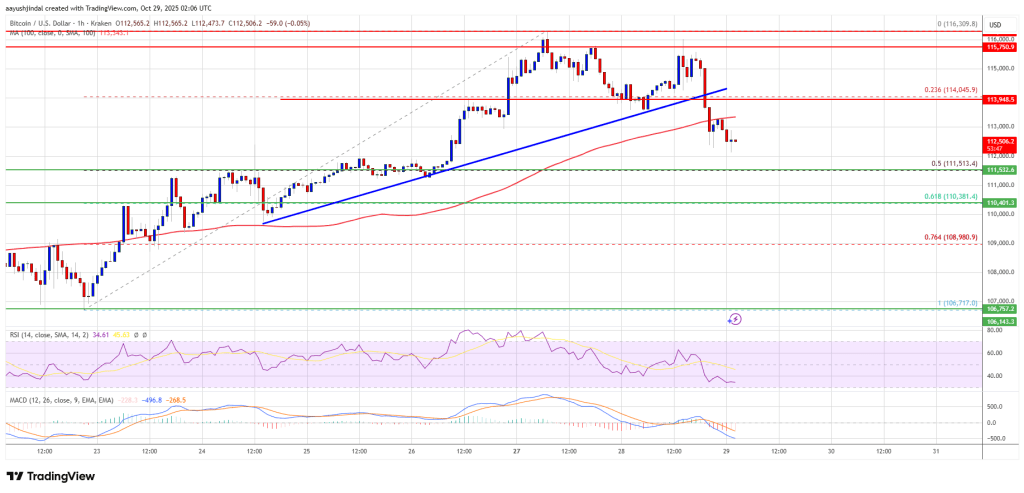
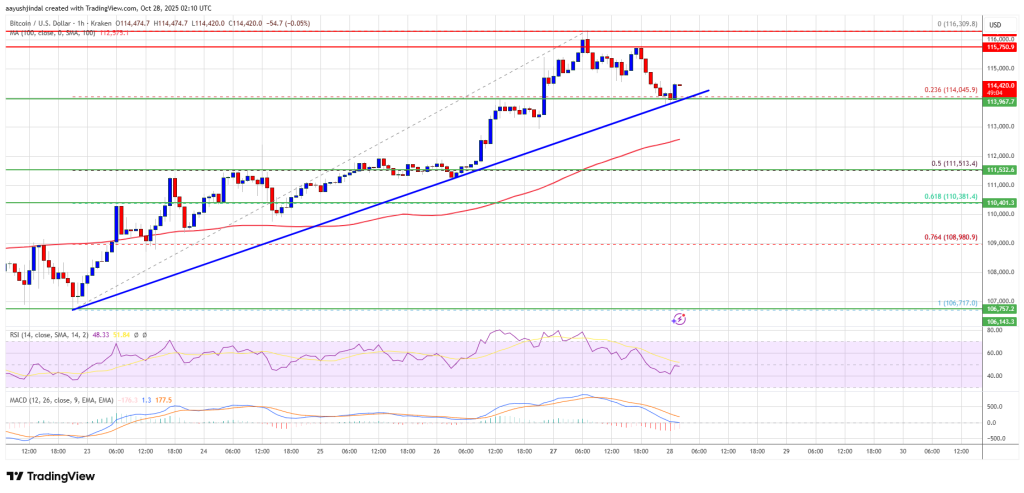
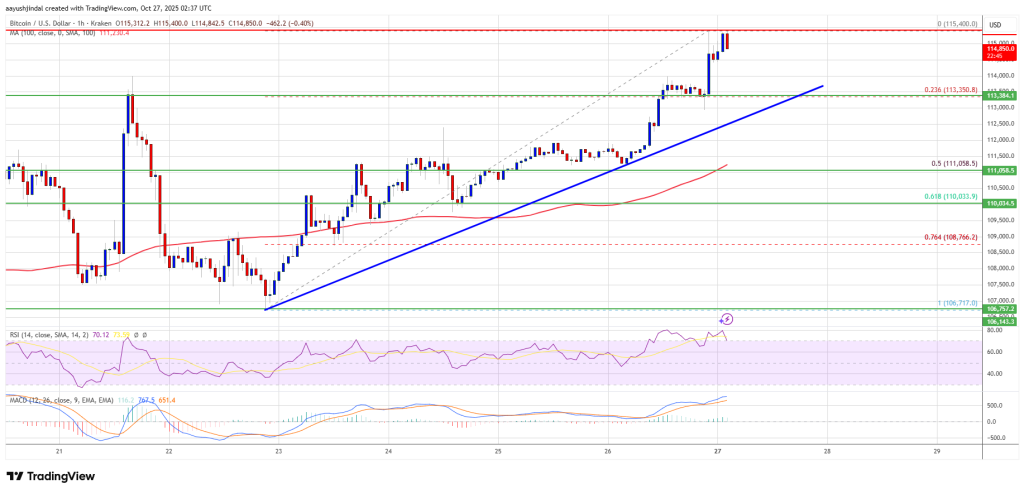
Bitcoin price is correcting gains below $113,500. BTC could continue to move down if it stays below the $114,200 resistance.

  • Bitcoin started a downside correction below the $114,200 support.
  • The price is trading below $114,000 and the 100 hourly Simple moving average.
  • There was a break below a bullish trend line with support at $114,050 on the hourly chart of the BTC/USD pair (data feed from Kraken).
  • The pair might continue to move down if it trades below the $112,000 zone.

Bitcoin Price Starts Pullback

Bitcoin price extended gains above the $113,500 zone. BTC gained pace for a move above the $115,000 pivot level. The price even spiked above $116,200 before the bears appeared.

A high was formed at $116,309 and the price is now correcting some gains. There was a move below the $114,200 support zone. The price dipped below the 23.6% Fib retracement level of the recent wave from the $106,718 swing low to the $116,309 high.

Moreover, there was a break below a bullish trend line with support at $114,050 on the hourly chart of the BTC/USD pair. Bitcoin is now trading below $114,000 and the 100 hourly Simple moving average.

Bitcoin Price

Immediate resistance on the upside is near the $113,650 level. The first key resistance is near the $114,200 level. The next resistance could be $115,000. A close above the $115,000 resistance might send the price further higher. In the stated case, the price could rise and test the $116,200 resistance. Any more gains might send the price toward the $117,500 level. The next barrier for the bulls could be $118,000.

More Losses In BTC?

If Bitcoin fails to rise above the $114,200 resistance zone, it could continue to move down. Immediate support is near the $112,000 level. The first major support is near the $111,500 level or the 50% Fib retracement level of the recent wave from the $106,718 swing low to the $116,309 high.

The next support is now near the $110,500 zone. Any more losses might send the price toward the $110,000 support in the near term. The main support sits at $108,500, below which BTC might struggle to recover in the short term.

Technical indicators:

Hourly MACD – The MACD is now gaining pace in the bearish zone.

Hourly RSI (Relative Strength Index) – The RSI for BTC/USD is now below the 50 level.

Major Support Levels – $112,000, followed by $111,500.

Major Resistance Levels – $114,200 and $115,000.

Dogecoin Price Struggles at $0.20 Support Amid Whale Selloff and Futures Liquidations

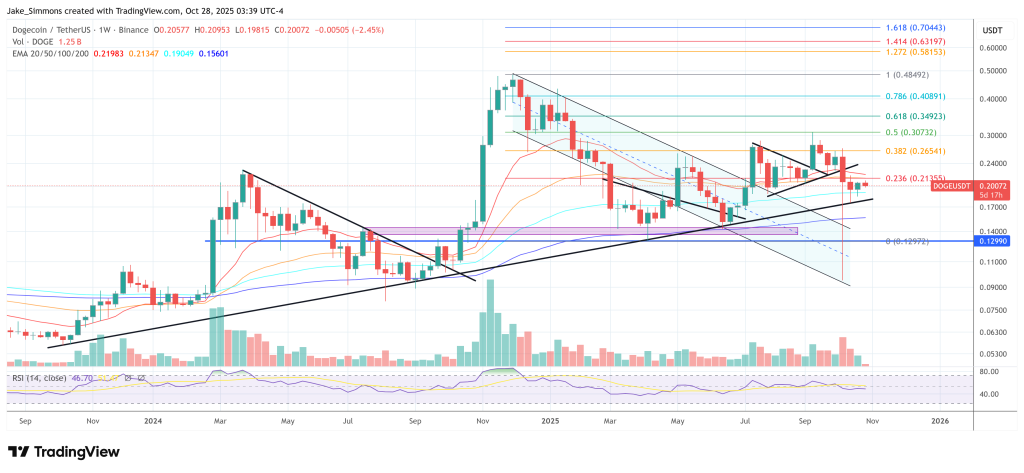
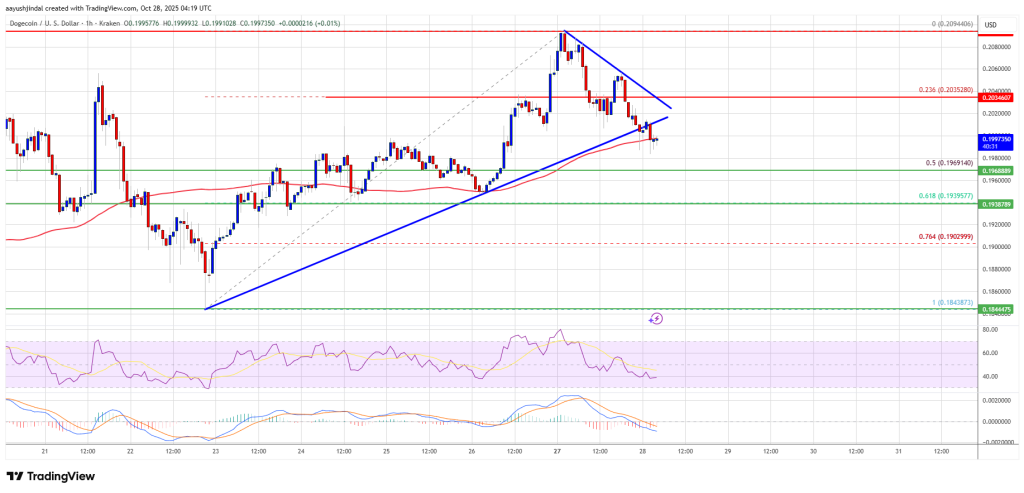
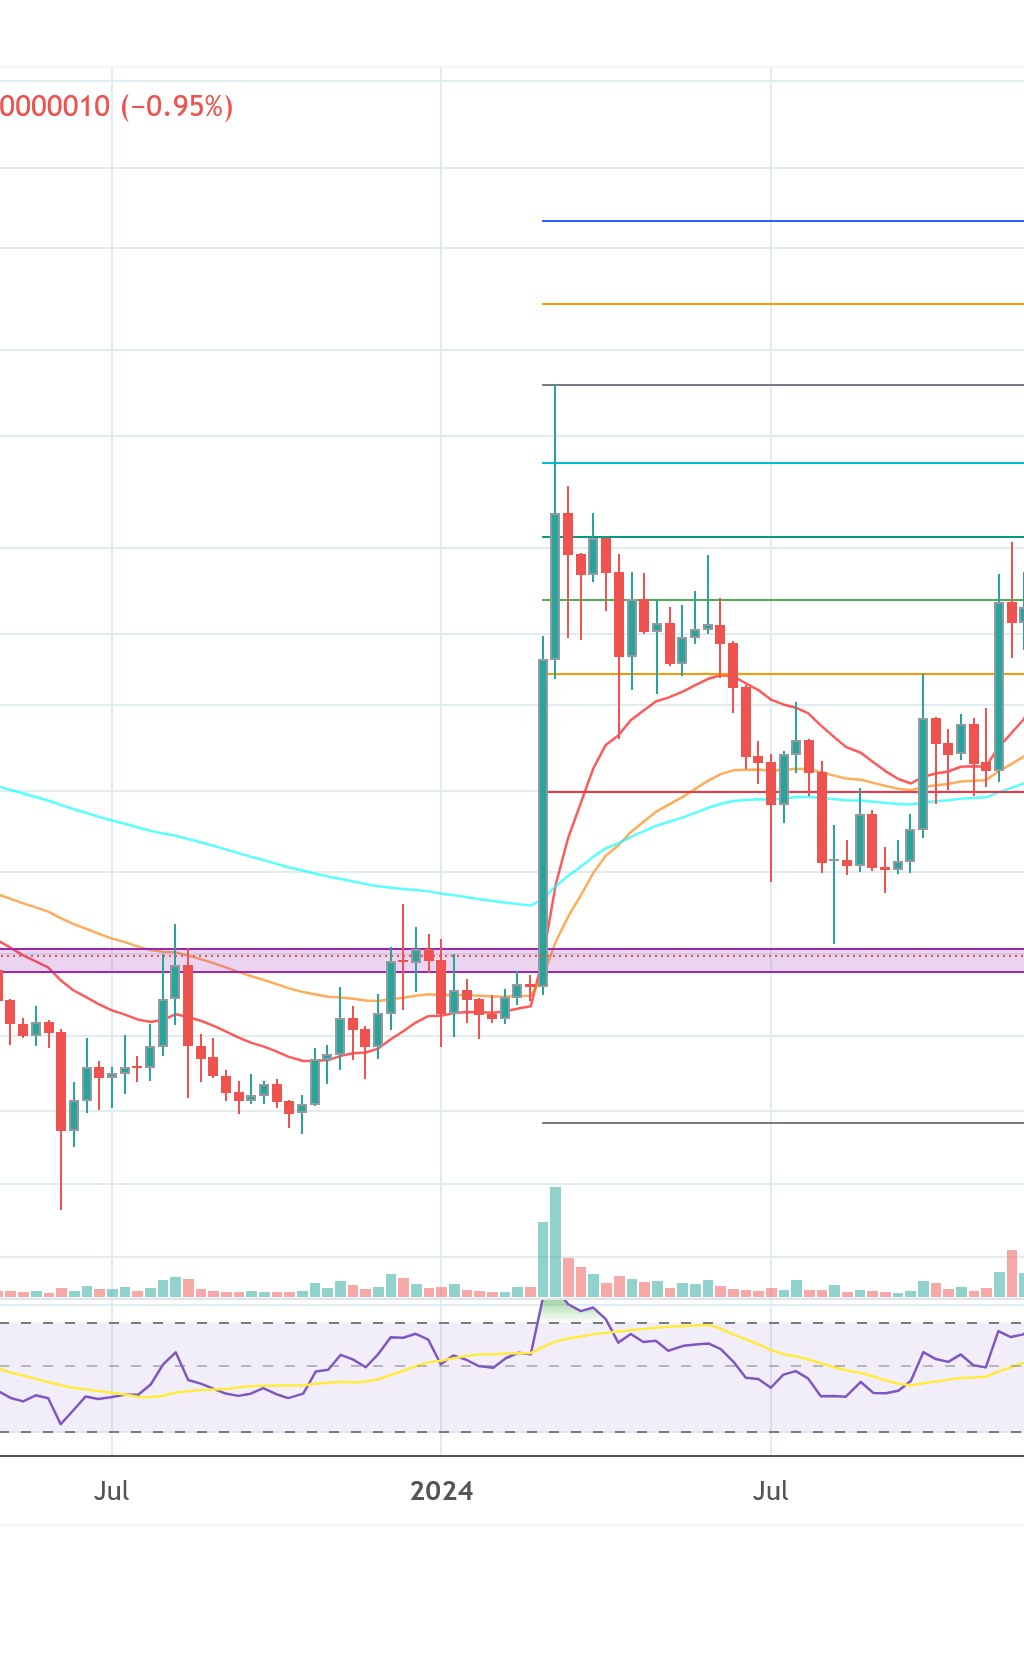
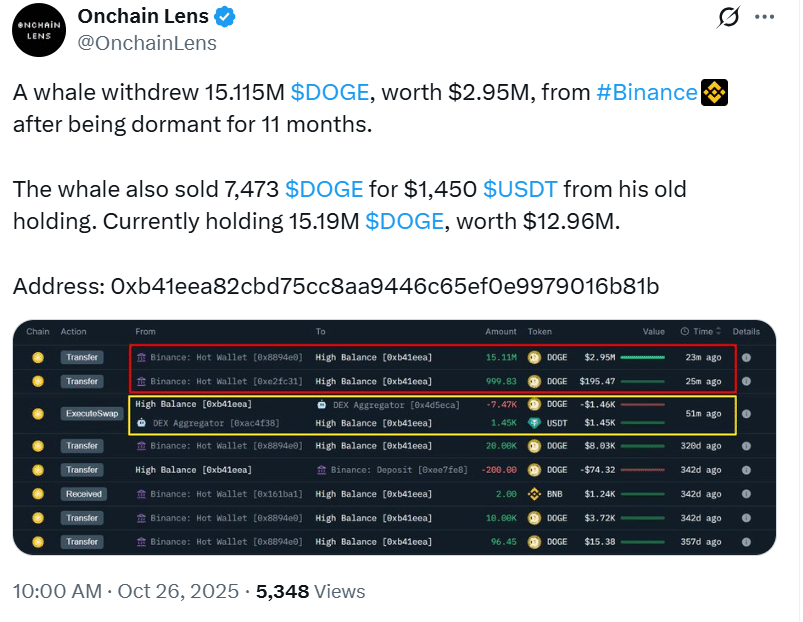
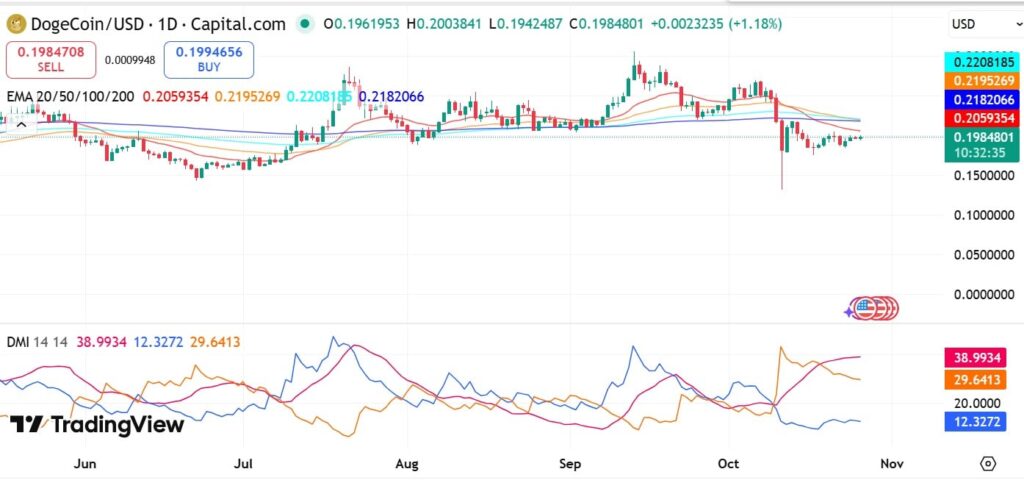
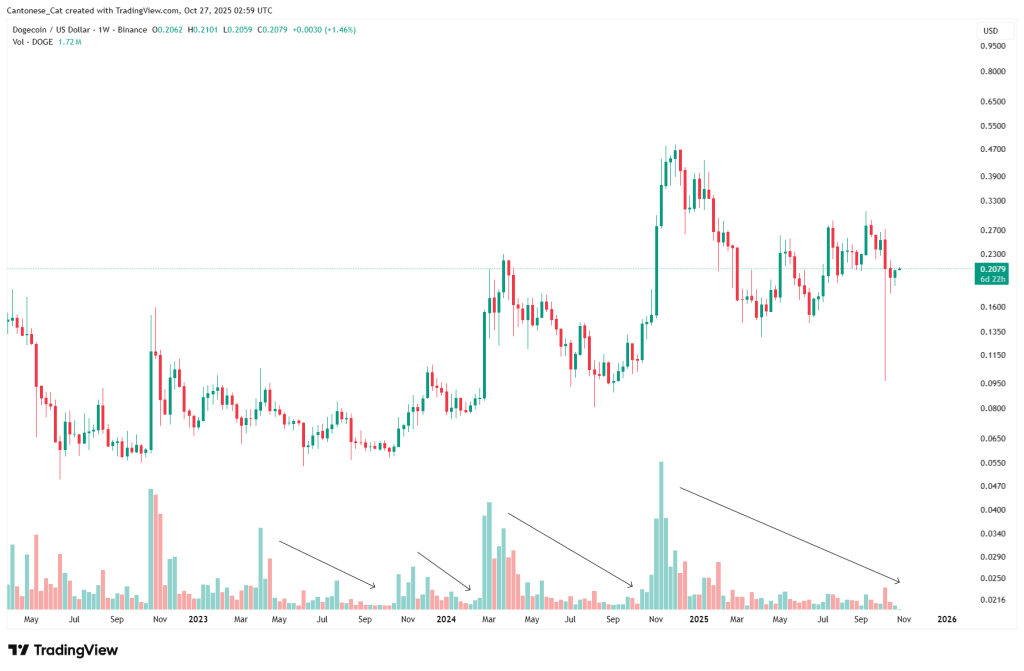
The Dogecoin price is fighting to hold the psychological $0.20 support as large investors continue offloading holdings and leveraged traders exit the market. The Dogecoin price briefly traded above $0.21 earlier this week, but has since slipped by more than 2%, highlighting the mounting selling pressure in the market.

Related Reading: Is The Dogecoin Bull Run Over? Analyst Predicts When DOGE Rallies Again

According to on-chain data, whales have sold over 500 million DOGE tokens in the past week, fueling fears of further downside. The selloff coincides with a sharp 61% drop in futures open interest, plunging from $5.03 billion to $1.95 billion, signaling widespread position liquidations and trader fatigue.

Dogecoin DOGE DOGEUSD

Futures Liquidations and Weak Technicals Weigh on Momentum

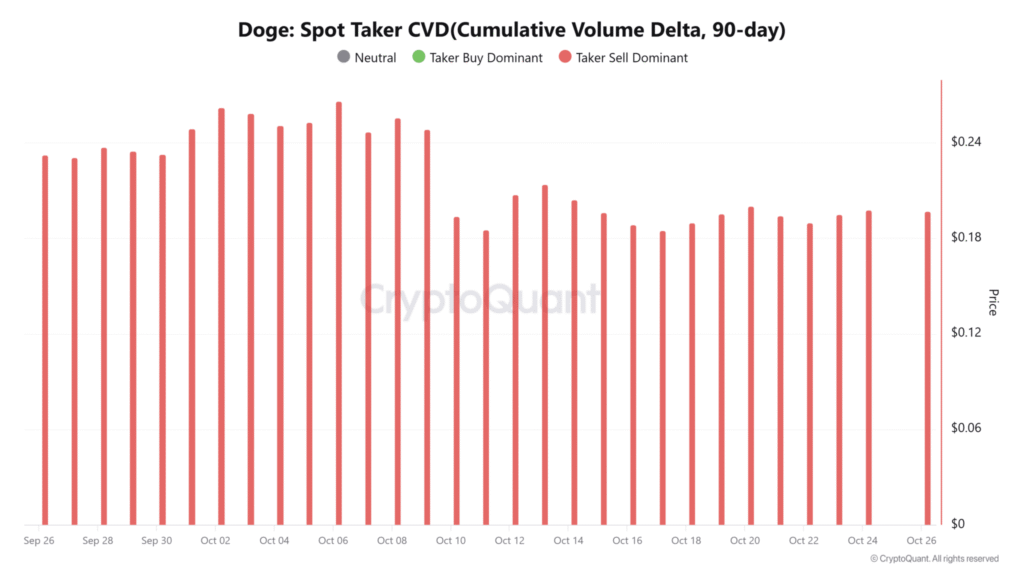
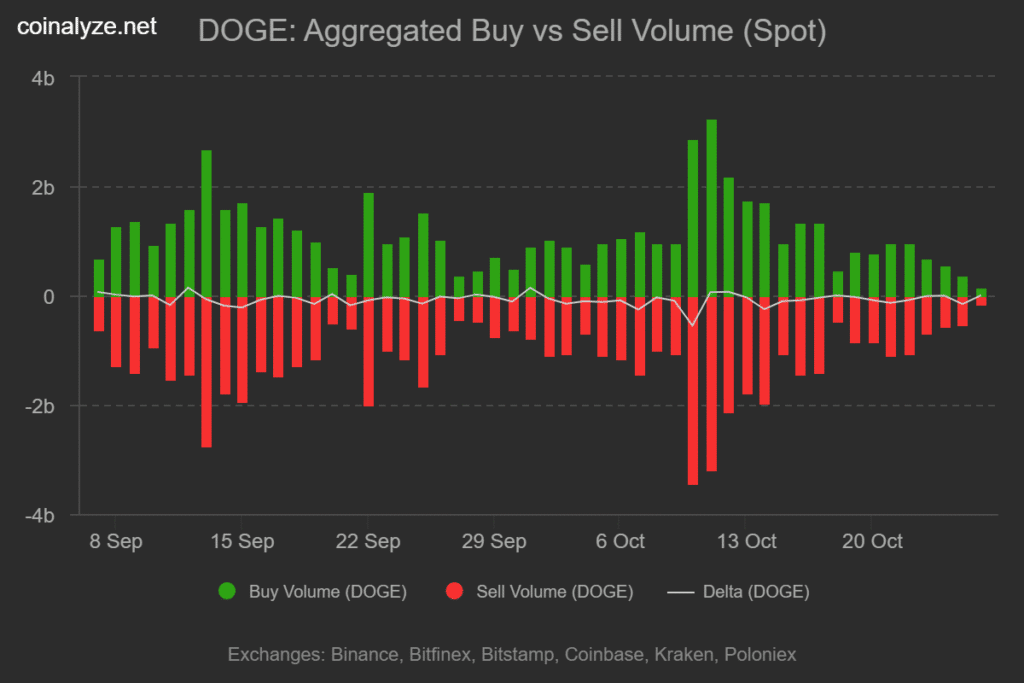
Derivatives data show declining participation across major exchanges, with traders closing out long positions rather than adding new exposure. Meanwhile, Dogecoin’s 24-hour trading volume surged 17.5% to nearly $2 billion, a sign that sellers remain in control even as overall market recovery stalls.

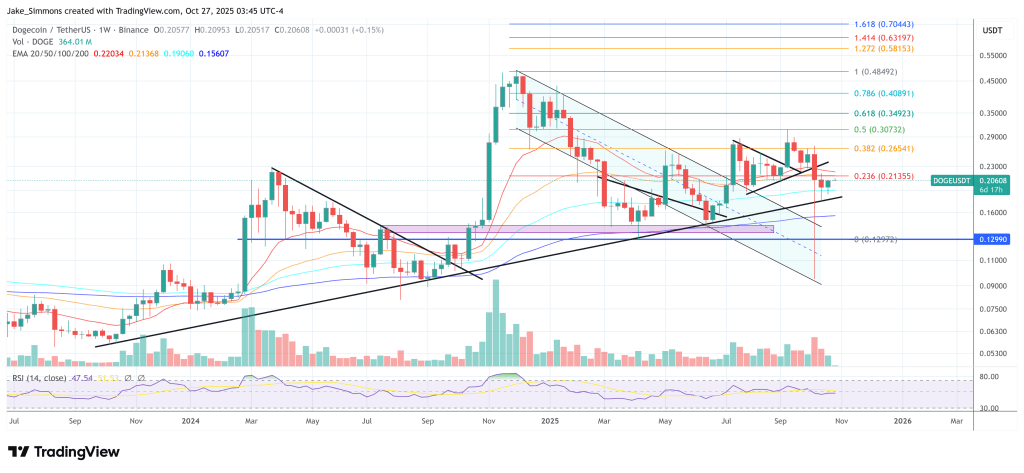
Technical indicators paint a similarly cautious picture. On the daily chart, the Dogecoin price is forming a potential “death cross” between the 50-day and 200-day exponential moving averages, a bearish pattern that often precedes a further drop.

If sustained selling continues, analysts warn the Dogecoin price could fall toward the $0.166 support, which aligns with the lower boundary of its long-term ascending trendline.

However, this same trendline has historically triggered strong rebounds. Previous retests have led to price recoveries of nearly 100%, leaving some traders optimistic that a similar setup could emerge if support holds firm.

Consolidation or Collapse? Key Dogecoin Price Levels to Watch

Currently, Dogecoin price hovers near $0.20 with a market cap of $30.3 billion, holding above the critical psychological zone but struggling to regain upward momentum. The immediate resistance lies between $0.204 and $0.210, while a decisive close below $0.19 could accelerate losses toward $0.18–$0.166.
For now, the balance between whale distribution and new buyer demand will determine DOGE’s next move. If fresh inflows return and futures activity stabilizes, a recovery toward $0.23–$0.25 remains possible.
Related Reading: Bitcoin And Crypto Market Set To Bounce As Rate Cut Probabilities Touch 98.3%

But without renewed conviction from large holders, the Dogecoin price risks extended consolidation, or a deeper retracement before the next bullish wave begins.

Cover image from ChatGPT, DOGEUSD chart from Tradingview

Solana’s DeFi Stack Expands With SolsticeFi’s Risk-Controlled Yield Platform — Here’s How

The Solana decentralized finance (DeFi) ecosystem just gained another powerful addition with the launch of SolsticeFi. This innovative new platform is poised to introduce a much-needed layer of risk-controlled yield generation, directly addressing one of the primary concerns for users venturing into the safety of their deposited capital.

SolsticeFi is reimagining how investors earn on Solana by introducing a defensively engineered approach to yield, one that directly protects the value of user deposits. According to crypto commentator Madissa’s post on X, one of SolsticeFi’s most compelling features is its ability to allow users to continue earning staking rewards while keeping their assets liquid and usable across the broader DeFi ecosystem.

How SolsticeFi Balances Risk While Generating Yield

This innovation created continuous opportunities for user to deploy their capital in other protocols without interrupting their base yield, instead of locking up funds. SolsticeFi platform is designed to prioritize full transparency and validator diversification, minimizing exposure to single-validator risks and opaque yield platforms. Furthermore, depositing capital into SolsticeFi provides support for SOL’s network security while generating sustainable returns for users.

Related Reading: Solana Stays Strong: Network Outperforms Rivals Amid AWS Outage Turmoil

Crypto analyst Hokage has also mentioned how Solana is improving and completely revolutionizing financial transaction speeds in traditional finance (TraFi), where transfers take days, settlements drag, and middlemen slow everything down.

SOL has changed the game by creating a new block every 400 milliseconds, and currently, the central to this acceleration is Bam, the new block assembly marketplace. This Bam will speed up how quickly user transaction gets picked up and integrated into a block, and slash inclusion times to an astonishing 50-100 milliseconds. Building on this is Alpenglow, which takes finality down to an incredible 100-150 milliseconds faster than a blink, and the point where the network confirms the user transaction is 100% done and irreversible.

One project that stands out in these ultra-fast ecosystem steps is SolsticeFi’s USX, a stablecoin specifically built to move at that speed, which enables users to send dollars, deploy capital, and settle instantly. Hokage concluded that “while these advancements might sound like pure sci-fi, if you’ve been around the SOL ecosystem, you would know it’s not.”

Market Confidence Returns To Solana

While SolsticeFi provides speed and reduces risk to Solana yield platforms, KOLS Manager at Binance, investor, and trader BitGuru, has noted that SOL’s price is currently showing a strong bullish setup, after following a steady downtrend and now stabilizing near key support.

As a result of that action, the SOL market is now pulling back with considerable strength, aiming to break above the critical $210 resistance level, a zone that has capped multiple attempts at recovery. A decisive breakout above $210 would likely trigger SOL’s next leg higher toward $230 and beyond.

Solana

Whales Quietly Accumulate ADA as Cardano Nears Bullish Triangle Breakout, Is $5 Next?

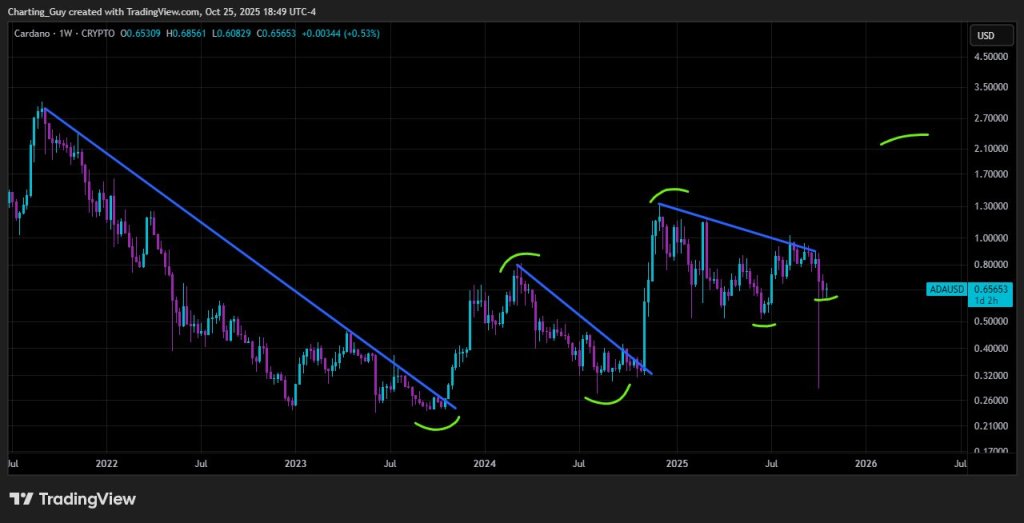
The Cardano (ADA) price is flying under the radar amid growing accumulation by large-holders (“whales”) and a technical formation that traders seldom ignore, a symmetrical triangle.

With ADA currently trading around $0.66, after briefly reaching $0.69 earlier in the week, the stage appears set for a breakout, or a breakdown. Analysts suggest that if the bullish scenario prevails, ADA could target $1 and beyond, potentially even reaching $5 or more in a longer-term move.

Whale Accumulation Signals Long-Term Confidence

Despite short-term price softness, on-chain data reveal that wallets holding large quantities of ADA are steadily increasing their positions.

According to recent reports, wallets with 100,000 ADA tokens have been accumulating over the past six weeks, even while retail demand remains lukewarm. This accumulation is taking place as ADA forms a low-volatility consolidation, such behaviour often precedes major market moves.

The divergence is noteworthy. While Open Interest and spot cumulative volume delta (CVD) remain weak, signaling limited retail/speculator engagement, whales are quietly buying the dips.

Enthusiasm among large-holders suggests confidence in ADA’s fundamentals and plays into the bullish thesis that this accumulation could underpin a powerful move once the technical breakout triggers.

Symmetrical Triangle Breakout Offers Route to Major Upside

Technical analysts highlight that ADA has been trading within a symmetrical triangle pattern, a convergence of support and resistance trendlines, typically signalling a buildup of tension before a decisive move.

The crucial support near $0.61 and resistance roughly at $0.70–$0.75 mark the boundaries of this formation. A decisive breakout above the upper trendline could unlock a rally toward $0.80–$0.85, and potentially beyond $1.70 per some projections.

Conversely, a breakdown below the support would invalidate the bullish setup and could see ADA revisit $0.55 or lower. Given the whale accumulation underway, the bullish scenario currently seems favoured, but traders must still watch for confirmation.

Cardano ADA ADA

Bottom Line

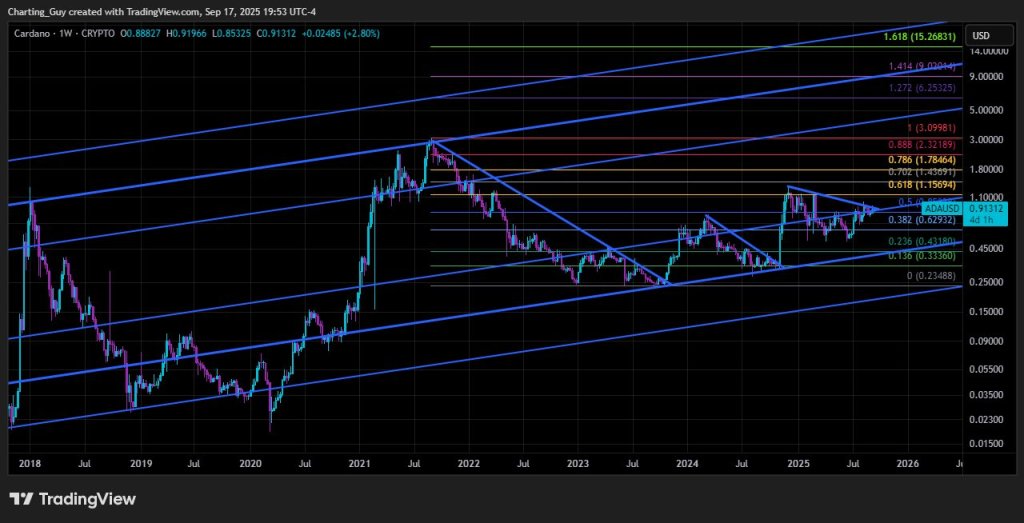
The question now gaining traction is: could ADA eventually hit $5? While the immediate target may be around $1 to $2, some longer-term models based on Fibonacci extensions and structural breakout maths place significantly higher levels on the table.

If ADA converts supply zones into support and elevates its on-chain narrative, the powerful combination of whale positioning + breakout could carry it much higher.

Cover image from ChatGPT, ADAUSD chart from Tradingview

Bitcoin Breaks Above STH Realized Price For The First Time In Weeks – What’s Next?

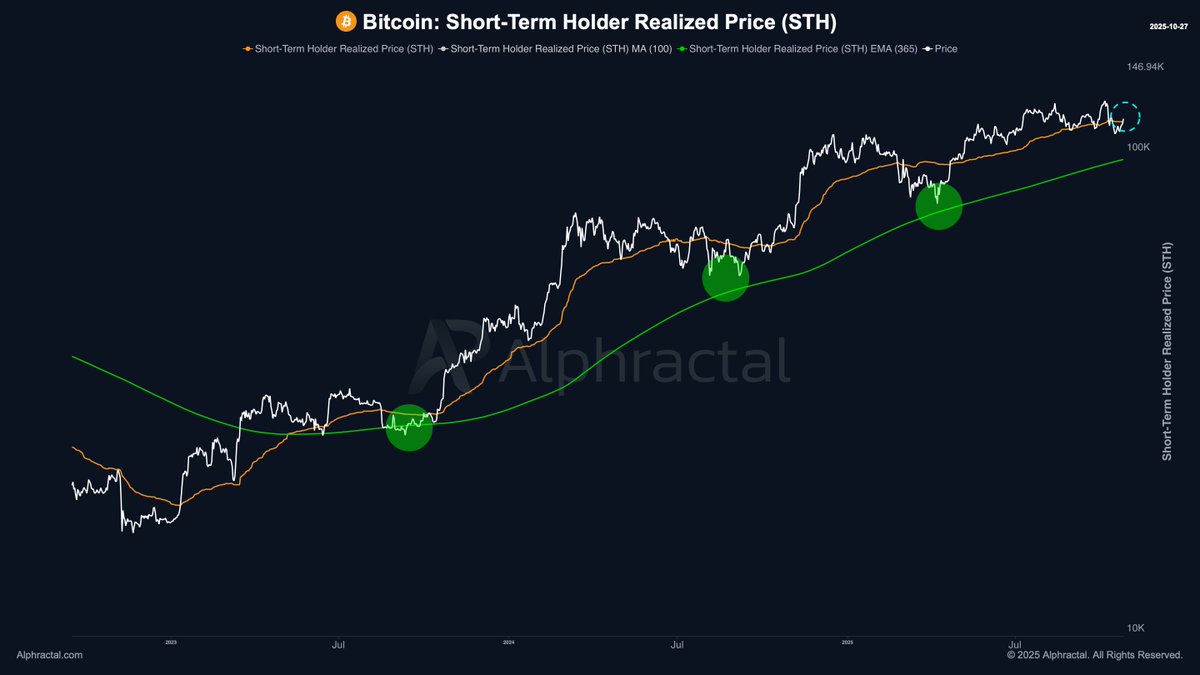
Bitcoin is showing early signs of strength as it attempts to reclaim the $115,000 level. After weeks of mixed sentiment and heavy selling pressure, momentum appears to be turning slightly bullish. The recent weekly close above $114,500 has confirmed a reclaim of the Short-Term Holder (STH) Realized Price, a key on-chain threshold currently sitting near $113,000. This metric represents the average cost basis of recent market participants and often serves as a pivotal line separating bullish from bearish sentiment.

Top analyst Darkfost shared that this reclaim is an encouraging signal, reflecting renewed buyer confidence after a volatile October. However, he also cautioned that Bitcoin’s position must still be monitored closely. A rejection at current levels could lead to a renewed correction phase, mirroring the pattern seen in 2024, when BTC faced multiple failed attempts before regaining upward momentum.

For now, the market sits at a delicate crossroads — consolidating below resistance while holding critical on-chain support. If Bitcoin can sustain this structure and push convincingly above $115K, analysts believe it could open the door for a broader bullish continuation and potentially a retest of the $120K region in the weeks ahead.

Bitcoin Holds Above Key On-Chain Level

According to top analyst Darkfost, Bitcoin’s reclaim of the Short-Term Holder (STH) Realized Price around $113,000 could mark a crucial turning point for market structure. He notes that during the 2024 correction, BTC faced four failed attempts to break above this same metric. Each rejection was driven by short-term holders selling at their break-even points — a typical psychological reaction that delays trend reversals. Once Bitcoin finally sustained above the STH Realized Price, however, the market quickly regained momentum and entered a new expansion phase.

Bitcoin Short-Term Holder Realized Price | Source: Darkfost

This time, the dynamic appears similar. If Bitcoin successfully consolidates above this zone, it could pave the way for a strong bullish impulse and potentially a new all-time high (ATH) in the short term. The STH Realized Price acts as a measure of conviction among recent investors; holding above it suggests growing confidence and a shift from capitulation to accumulation.

Darkfost also highlights another critical observation: throughout the current bull cycle, Bitcoin has never fallen below the yearly STH Realized Price. Each time the price neared that level, a rebound followed — reaffirming it as a structural support for the broader trend.

Still, caution remains essential. A breakdown below the $94,000 mark — the current yearly STH Realized Price — would likely signal a deeper market shift. Such a move could mark the transition from a mid-cycle correction into a more prolonged bearish phase.

For now, the data suggests resilience, not weakness. As long as BTC remains above its short-term realized threshold, the broader uptrend remains intact — with potential for the next major rally if buying pressure continues to build above $115K.

BTC Bulls Defend Key Support While Momentum Cools

Bitcoin is currently trading around $114,360, consolidating after a brief rally that tested resistance near $115,800–$117,500. The chart shows that BTC successfully reclaimed the 200-period moving average (red line) on the 4-hour timeframe, a level that had acted as resistance throughout mid-October. This reclaim is an encouraging short-term signal, but momentum appears to be slowing as traders await the next catalyst.

BTC consolidates above key MA | Source: BTCUSDT chart on TradingView

The $113,000–$114,000 range now serves as immediate support — aligning with the Short-Term Holder (STH) Realized Price, a key on-chain level that reflects the cost basis of recent buyers. Holding this zone could allow bulls to consolidate strength before another attempt at breaking above $117,500, the main horizontal resistance that capped previous rallies.

On the downside, failure to maintain above the 200-MA could trigger a retest of $111,000, where the 100-MA (green line) provides secondary support. Trading volume remains subdued, reflecting investor caution ahead of the Federal Reserve’s interest rate decision later this week.

Bitcoin remains in a constructive phase as long as it holds above $113K. Sustained consolidation above this level would reinforce bullish structure — while a decisive break above $117,500 could open the path toward $120,000+ in the short term.

Featured image from ChatGPT, chart from TradingView.com

Dogecoin Open Interest Crashes 50% From October Highs, Volume Is Worse, What’s Going On?

Dogecoin (DOGE) is facing a steep market cooldown after weeks of heightened trading activity in early October. Data from CoinGlass shows that both Open Interest (OI) and trading volume for DOGE futures have crashed, indicating a sharp decline in the meme coin’s momentum. The latest figures reveal a significant pullback in derivatives activity and spot market participation, suggesting that traders may be retreating from speculative positions as volatility eases. 

Dogecoin Open Interest Crashes Over 60%

Dogecoin’s Open Interest has plunged dramatically from its October highs, reflecting a rapid exodus of leveraged traders from the market. According to CoinGlass, total exchange DOGE futures Open Interest has fallen over 62% from a peak of $5.03 billion on October 7 to $1.88 billion on October 28. This represents a drop to approximately 9.41 billion DOGE, valued at $ 0.20 per token.

Despite the decline in Open Interest, Binance, BitMEX, and Bybit continue to lead as the top exchanges with the highest Dogecoin futures activity. Still, the downturn has been widespread across exchanges. Kucoin recorded the largest drop in recent hours at 3.1%, followed closely by Bitget, which saw a 2.27% decline. Over the last 24 hours, Bitunix recorded the steepest drop in Open Interest, down 15.86%, while Crypto.com saw a 7.36% reduction. 

Dogecoin

Even Binance, which consistently leads Dogecoin futures trading, has seen a notable pullback. CoinGlass reports that the exchange’s Open Interest peaked at $964.7 million on October 7, marking a monthly high. Since then, it has fallen to $380.29 million (1.9 billion DOGE), representing a staggering 60.6% crash in just over three weeks.

Dogecoin Sees Even Worse Decline In Volume

Trading volume for Dogecoin has mirrored the collapse in Open Interest. CoinGlass data shows that Dogecoin’s futures volume heatmap across major crypto exchanges is in the red zone. Total trading volume had spiked to $20.45 billion on October 11, following the devastating crypto flash crash on October 10, but has since plummeted to $5.31 billion as of October 28. This represents a whopping 74% decline.

On individual exchanges, Binance’s DOGE trading volume dropped by 9.35% in the past 24 hours, while OKX saw a 13.69% decline. CoinEx recorded the largest volume decrease at 26.1%, followed by Gate.io at 23.94%. Popular exchanges like Bitget, Kucoin, and Bitunix also reported varying declines of 4.96%, 20.37% and 13.16%, respectively, as overall market liquidity thinned

However, a few exchanges bucked the downward trend, recording slight gains. dYdX saw its DOGE volume surge by 167.61%, HTX increased by 49.93%, and Hyperliquid rose by 23.88%. Bybit and MEXC also recorded modest gains of 24.98% and 1.88%, respectively. 

Alongside its decline in trading volume, CoinGlass notes that Dogecoin’s price performance has slipped. The meme coin is currently trading at $0.20, down 13.19% over the past 30 days and 2.86% in the last 24 hours.

Dogecoin

Here’s Why The XRP Price Still Isn’t Bearish Despite The 50% Flash Crash

The XRP price recently saw a sharp drop that was very scary for many traders, and some in the crypto market think the chart looks weak now. However, an analyst on X, Cryptoinsightuk, disagrees. The analyst explains that XRP is not bearish right now, even after the 50% flash crash, and the price can still move higher when liquidity returns.

Low Downside Liquidity And Weekly Chart Still Looks Fine For The XRP Price

Cryptoinsightuk says that XRP has “no downside liquidity.” The analyst explains that sellers are not strong, so there is very little liquidity sitting below the current price level. It does not mean the XRP price will stay still, although it may move up and down for now. At some point, exchanges and market makers may push the price higher into deeper liquidity, where they can make money.

XRP Price 1

The analyst says that the flash crash does not damage the weekly chart. The weekly picture still shows a normal trend even after the sharp fall. He notes that online discussions are focusing on the monthly chart and using it to claim that XRP is weak, but the monthly chart alone is only one timeframe and not enough to call the price truly bearish. The slight drop shows weakness only on lower timeframes, not in the broader market structure, and Cryptoinsightuk believes the bigger structure is still pointing up, which is a key reason he does not see a bearish trend forming even after the 50% flash crash.

XRP Price 2

The analyst’s comment about market makers also gives hope to traders who worry that the XRP price will keep falling. When market makers see better opportunities at higher price levels, the price often moves up to where they want to make profits. It gives XRP a path to recovery later, rather than staying low. He keeps pointing to the weekly chart because it shows that XRP still holds its larger bullish setup even after the fear caused by the flash crash.

Higher Timeframes Look Strong, And RSI Fractal Points To A Move Up

Cryptoinsightuk further adds that higher timeframes are always more reliable for reading price trends and recommends looking at the XRP price chart over the past three months. In his view, the three-month chart looks good and supports a strong long-term trend. 

XRP Price 3

He also looks at the daily RSI, and it recently hit an oversold area. When this happened the last time, the XRP price later saw a strong move up. The analyst shared a fractal a few weeks ago that shows what a new “measured move” could look like if this same pattern repeats

XRP Price 4

The fractal suggests the XRP price could rise again from here. The oversold RSI signal suggests that buyers could return and push the price higher in the future. 

XRP price chart from Tradingview.com

Bitcoin Knots Has Been Nothing More Than A Denial-of-Service Attack On Bitcoin

Bitcoin Magazine

Bitcoin Knots Has Been Nothing More Than A Denial-of-Service Attack On Bitcoin

In computing, a denial-of-service attack (DoS attack; UK: /dɒs/ doss US: /dɑːs/ daas[1]) is a cyberattack in which the perpetrator seeks to make a machine or network resource unavailable to its intended users by temporarily or indefinitely disrupting services of a host connected to a network. -The Wikipedia definition of denial-of-service attack. 

This is a very basic concept. Someone makes use of their own resources to disrupt the functioning of other machines on a network. 

DoS attacks have been an issue for as long as the internet existed. One of the commonly argued “first Distributed Denial-of-service (DDoS) attacks” was against the Internet Service Provider (ISP) Panix in the mid-90s. There were of course many prior technical examples on older internet services, but this was one of, if not the, first major examples of such an attack on the modern World Wide Web. 

This attack had numerous computers start to initiate a Transmission Control Protocol (TCP) connection with the ISPs servers, but never finishing the handshake protocol that finalized the connection. This consumes the server’s resources for managing network connections and prevents honest users from accessing the internet through the ISP’s servers. 

Ever since this “initial” DDoS attack, they have been as common on the internet as storms are in nature, a regular occurrence that massive pieces of internet infrastructure have been built to defend against. 

The Blockchain

The blockchain is one of the core components of Bitcoin, and a required dependency for Bitcoin’s functionality as a distributed ledger. I am sure many people in this space would call so-called “spam” transactions a DoS attack on the Bitcoin blockchain. In order to call it that, you would have to define the “service” that the blockchain is offering as a system, and explain how spam transactions are denying that service to others in a way not intended by the design of the system. 

I’d wager a bet that most people who believe spam is a DoS attack would say something like “the service the blockchain offers is processing financial transactions, and spam takes space away from people trying to do that.” The problem is, that is not specifically the service the blockchain offers. 

The service it actually offers is the confirmation of any consensus valid transaction through a real-time auction that periodically settles whenever a miner finds a block. If your transaction is consensus valid, and you have bid a high enough fee for a miner to include your transaction in a block, you are using the service the blockchain provides exactly as designed. 

This was a conscious design decision made over years during the “Block Size Wars” and finalized in the activation of Segregated Witness and the rejection of the Segwit2x blocksize increase through a hard fork pushed by major companies at the time.  The blockchain would function by prioritizing the highest bidding fee transactions, and users would be free to compete in that auction. This is how blockspace would be allocated, with a global restriction to protect verifiability and a free market pricing mechanism. 

Nothing about a transaction some arbitrarily define as “spam” winning in this open auction is a DoS of the blockchain. It is a user making use of that resource in the way they are supposed to, participating in the auction with everyone else. 

The Relay Network

Many, if not most, Bitcoin nodes offer transaction relay as a service to the rest of the network. If you broadcast your transactions to your peers on the network, they will forward them on to their peers, and so on. Because the peering logic deciding which nodes to peer with maintains wide connectivity, this service allows transactions to propagate across the network very quickly, and specifically allows them to propagate to all mining nodes. 

Another service is block relay, propagating valid blocks as they are found in the same manner. This has been highly optimized over the years, to the point where most of the time an entire block is never actually relayed, just a shorthand “sketch” of the blockheader and the transactions included in it so you can reconstruct them from your own mempool. In other words, optimizations in block relay depend on a transaction relay functioning properly and propagating all valid and likely to be mined transactions. 

When nodes do not have transactions in a block already in their mempool, they must request them from neighboring nodes, taking more time to validate the block in the process. They also explicitly forward those transactions along with the block sketch to other peers in case they are missing them, wasting bandwidth. The more nodes filtering transactions they classify as spam, the longer it takes blocks including those filtered transactions to propagate across the network. 

Transaction filtering actively seeks to disrupt both of these services, in the case of transaction relay failing miserably to prevent them from propagating to miners, and in the case of block propagation having a marginal but noticeable performance degradation the more nodes on the network are filtering transactions. 

These node policies have the explicit purpose of degrading the network service of propagating transactions to miners and the rest of the network, and view the degradation of block propagation as a penalty to miners who choose to include valid transactions they are filtering. They seek to create a degradation of service as a goal, and view the degradation of another service resulting from that attempt as a positive. 

This actually is a DoS attack, in that it actually is degrading a network service contrary to the design of the system. 

Where From Here?

The entire saga of Knotz vs. Core, or “Spammers” vs. “Filterers”, has been nothing more than a miserably ineffective and failed DoS attack on the Bitcoin network. Filters do absolutely nothing to prevent filtered transactions from being included in blocks. The goal of disrupting transaction propagation to miners has had no success whatsoever, and the degradation of block relay has been marginal enough to not be a disincentive to miners. 

I see this as a huge demonstration of Bitcoin’s robustness and resilience against attempted censorship and disruption on the level of the Bitcoin Network itself. 

So now what?

A BIP by an anonymous author has been put forward to enact a temporary softfork that would expire after roughly a year making numerous ways to include “spam” in Bitcoin transactions consensus invalid through that time period. After realizing the DoS attack on the peer-to-peer network has been a total failure, filter supporters have moved to consensus changes, as many of them were told would be necessary over two years ago. 

Will this actually solve the problem? No, it won’t. It will simply force people who wish to submit “spam” to this forked network, if they actually follow through on implementing it, to use fake ScriptPubKeys to encode their data in unspendable outputs that will bloat the UTXO set. 

So even if this fork was met with resounding support, activated successfully, and did not result in a chainsplit, it would still not achieve the stated goal and leave “spammers” no option but to “spam” in the most damaging way to the network possible.

This post Bitcoin Knots Has Been Nothing More Than A Denial-of-Service Attack On Bitcoin first appeared on Bitcoin Magazine and is written by Shinobi.

Bitcoin Price Crashes to $112,000 Ahead of Fed Decision, Markets Eye U.S.-China Talks

Bitcoin Magazine

Bitcoin Price Crashes to $112,000 Ahead of Fed Decision, Markets Eye U.S.-China Talks

Bitcoin price continued its semi-green week for a bit today trading above $115,000 today and briefly reaching $116,077. Since then, bitcoin’s price has dumped to the mid $112,000s, according to Bitcoin Magazine Pro data.

This bitcoin price movement comes as traders weigh the Federal Reserve’s upcoming interest-rate decision and renewed optimism in the U.S.-China trade relations.

Data from Bitcoin Magazine Pro showed a 1.6% daily gain for BTC before the dump in late afternoon.

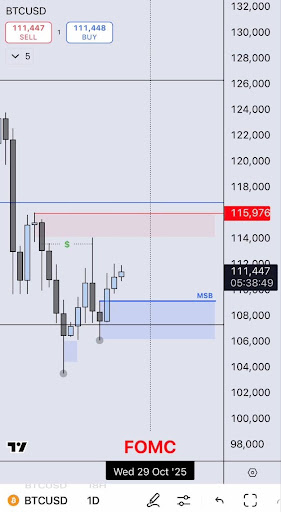
Despite historical trends of Bitcoin pulling back ahead of major U.S. economic events, the cryptocurrency held steady ahead of Wednesday’s Federal Open Market Committee (FOMC) meeting, where a 25-basis-point rate cut is widely expected.

Traders remain divided on near-term price targets. Some believe the market may be bottoming and an uptrend could follow for the rest of the week, while others believe $117,000 as a potential pre-Fed local top before BTC revisits the CME futures gap near $111,000.

The broader macro backdrop also supported risk-on assets. Gold fell to under $4,000 per ounce, its lowest since Oct. 6, helping fuel gains in Bitcoin and altcoins.

Bitcoin price enters tight range

Bitcoin’s price has entered one of its tightest trading ranges in history, moving between $106,000 and $123,000 for over four months. This extended calm has driven volatility to record lows on six-month metrics — levels that have historically preceded major directional moves. The weekly Bollinger Band Width, a key volatility indicator, has reached its lowest reading ever, suggesting that a large expansion in volatility could be imminent.

In past cycles, similar compression periods have led to price surges exceeding 65% within 100 days. 

Applying those historical patterns implies a potential target of $170,000–$180,000 by 2026 if Bitcoin follows a comparable trajectory. However, these low-volatility phases can persist for months before breaking out, meaning Bitcoin may continue trading sideways into early 2026.

Corporate crypto buying

Corporate and institutional crypto activity is also making headlines. Japanese hotelier-turned-Bitcoin treasury Metaplanet Inc. announced a $500 million share buyback, while Cathie Wood and Ark Invest increased its holdings in Block Inc. by $30.9 million across three ETFs.

Wood, known for her $1.5 million Bitcoin prediction, is one of the most bullish investors in crypto. Through ARK Invest, she has consistently invested millions in major crypto-related stocks. 

Her firm held positions in Circle Internet Group, Coinbase, Robinhood, and Bitmine Immersion Technologies. 

Recently, ARK expanded its crypto exposure by purchasing about $31 million worth of Block Inc. shares. The ARK Innovation ETF bought 210,916 shares, the ARK Next Generation Internet ETF added 59,827 shares, and the ARK Fintech Innovation ETF acquired 114,842 shares.

This post Bitcoin Price Crashes to $112,000 Ahead of Fed Decision, Markets Eye U.S.-China Talks first appeared on Bitcoin Magazine and is written by Micah Zimmerman.

Binance Whales Turn Active On Uniswap As Outflows Hit Multi-Month Highs – Details

Uniswap (UNI) has been consolidating since the October 10 market crash, with price action stabilizing but volatility still lingering. The decentralized exchange (DEX) token has struggled to regain its previous momentum, reflecting the broader uncertainty across the altcoin market. Analysts remain divided on its short-term outlook — some view Uniswap as a key driver of Ethereum’s DeFi ecosystem and a potential leader in the next recovery phase, while others caution that lingering liquidity stress and waning trader activity could spark more turbulence ahead.

Despite this cautious backdrop, new on-chain data suggests a shift may be underway. According to CryptoQuant insights, Binance whales have become increasingly active on UNI, with large transactions and outflows spiking to multi-month highs. Historically, this type of whale behavior — especially when coupled with heavy exchange outflows — has been associated with accumulation phases and strategic repositioning by major players.

As Uniswap’s fundamentals remain solid, with trading volumes and user engagement steadily recovering, the renewed whale activity could indicate that smart money is quietly preparing for the next market leg. Whether this accumulation marks the early stages of a trend reversal or just a temporary pause before further volatility remains to be seen.

Uniswap Exchange Outflows Hit Multi-Month Highs

In recent days, Uniswap’s native token, UNI, has seen a notable uptick in large-scale activity, signaling renewed interest from major market participants. According to on-chain data from CryptoQuant, whale wallets — typically identified by the top 10 largest transactions — have begun moving significant amounts of UNI out of Binance. These outflows represent transfers from exchange wallets to external addresses, a behavior that often indicates accumulation or long-term repositioning by large holders rather than short-term trading.

UNI top 10 Whale Outflow on Binance | Source: CryptoQuant

The data highlights a daily peak of 17,400 UNI withdrawn from Binance, alongside a monthly peak of 5,250 UNI, marking a three-month high in whale activity. Historically, such outflow spikes tend to occur during accumulation phases, as whales seek to reduce exposure to centralized exchanges and secure tokens for longer-term holding or staking opportunities.

This renewed movement comes at a time when UNI is still digesting the market correction that began in July, with prices stabilizing but failing to regain strong upward momentum. Analysts interpret this surge in whale activity as a potential early indicator of confidence returning to the asset. If sustained, it could mark the beginning of a structural reversal — a shift from post-crash consolidation to the early stages of renewed accumulation and recovery.

UNI Price Analysis: Consolidation Persists as Whales Reenter the Market

Uniswap (UNI) continues to consolidate near the $6.50 level after a sharp correction that began in July 2025. The weekly chart shows a prolonged period of sideways movement following a breakdown from the $12 resistance zone, where bullish momentum previously failed to sustain. Despite multiple attempts to rebound, UNI remains below the 50-week and 200-week moving averages, both of which now act as dynamic resistance levels.

UNI consolidates around key level | Source: UNIUSDT chart on TradingView

The recent price action reflects investor hesitation, with the broader market still digesting the effects of the October 10 crash. However, volume analysis indicates that selling pressure has started to decline, suggesting that sellers may be exhausting and that accumulation could be forming at current levels.

From a technical perspective, the $6.00–$6.20 zone serves as immediate support, while a decisive reclaim above $8.00 would be required to shift market structure toward a potential mid-term recovery. Interestingly, the recent whale accumulation reported by on-chain data aligns with this stabilization phase — a pattern often seen near cyclical bottoms.

If Uniswap maintains support and market sentiment improves, UNI could attempt to retest the $10–$12 zone in the coming months. Conversely, a failure to hold above $6 could open the door for a retest of the 2024 range lows around $4.

Featured image from ChatGPT, chart from TradingView.com

Pundit Says XRP Price Will Not Teleport To $500 This Cycle, Shares ‘Realistic’ Targets

A recent debate on the social media platform X has drawn attention to XRP’s long-term price outlook after an XRP enthusiast, Crypto Bitlord, proposed a rather wild scenario where the cryptocurrency teleports to $500 instantly. His post, which imagined XRP being used by the US government to pay off its $35 trillion debt, caused some reactions across the XRP community. 

In response, well-known crypto analyst ChartNerd stepped in to temper expectations, explaining that while XRP’s future is bright, such a leap to $500 is far from realistic this market cycle.

ChartNerd’s Take On Realistic XRP Targets

ChartNerd’s comments immediately stood out for their grounded tone, especially amongst reactions filled with predictions of explosive, instant gains. Responding directly to Bitlord’s vision of XRP rocketing to $500, ChartNerd clarified that XRP’s price will not trade at that price target this cycle. “$XRP will not teleport to $500,” he said.

Instead of a three-digit price, the analyst noted that the XRP price can only realistically reach the double-digit threshold in this cycle. “Realistically, it could definitely teleport to $13-$27 this cycle,” he continued.

This double-digit price target, although very bullish compared to XRP’s current price action, pales in comparison to other bullish projections from other crypto analysts, with many anticipating triple-digit price targets and others even predicting a run to $1,000 and beyond.

As conversations around potential XRP ETFs continue to gain momentum, one commenter asked ChartNerd whether his projections accounted for the billions in possible ETF inflows and the tokens expected to be locked in treasury funds and liquidity pools over the next few months. 

His response showed that his analysis was not detached from these developments. ChartNerd explained that even if XRP captured half of Bitcoin’s ETF trading volume from the past two years, the result would still translate to a market capitalization of roughly $1.2 trillion, bringing the price closer to his $27 upper target rather than $500.

Most ultra-bullish XRP price predictions are contingent on the cryptocurrency gaining adoption among banks and players in traditional finance. However, adoption models grow over years, not weeks, with ChartNerd adding that “these developments take time, and triple digits are not possible until many a year down the line.”

Staying Grounded Amid Bold Predictions

Another user remarked that Bitcoin once faced similar disbelief before breaching $100,000, meaning that XRP could surprise skeptics in the same way. ChartNerd, however, maintained his cautious stance with the response, “Highly unlikely imo, we shall see. I’ll stick to double digits.”

Such comparisons overlook the fundamental differences between Bitcoin’s and XRP’s market dynamics, especially when it comes to their circulating supplies.

At the time of writing, XRP is trading at $2.66, a 1% increase in the past 24 hours and a 9.2% rise over the last seven days. To reach the hypothetical $500 level, XRP would need to surge by roughly 18,690% from its current price. By contrast, hitting $13 or $27 would represent gains of approximately 388% and 915%, respectively.

XRP

Dogecoin Price Hasn’t Begun Its 3rd Wave Yet, ATH Above $0.8 Still In The Cards

The recent Dogecoin market action has seen its price now hovering below $0.20 after surging to $0.208 in the past 24 hours. Despite the consolidation, analysts and traders are watching the meme coin closely, believing that the next major move could redefine its long-term trajectory. 

Among those voices is crypto analyst EtherNasyonaL, who predicted that Dogecoin’s third and most powerful bullish phase is still ahead. His technical analysis on the monthly chart presents a structure that reveals the groundwork for another massive uptrend to above $0.8 is already in motion.

Dogecoin’s First Two Bull Waves Set The Stage

The monthly candlestick price chart shared by EtherNasyonaL calls attention to Dogecoin’s cyclical nature since 2014, showing two completed bull waves and a third one forming. Each of these bullish waves was formed after Dogecoin broke above and then retested the upper trendline of a descending channel of lower highs that had confined its price action in the preceding years. This retest was also highlighted by a confluence of the 25 Moving Average (MA) indicator.

The first wave, which began in 2017, caused Dogecoin’s earliest exponential rise from near-zero levels, right when the meme coin entered into popular crypto discussions. The second, and far more explosive, bull wave occurred between 2020 and 2021, when Dogecoin surged from under $0.003 to an all-time high of $0.7316, which has stood until now. 

Each bull run started once Dogecoin reclaimed its 25-month moving average as support, following extended consolidation periods that spanned multiple months. The current setup reflects the same condition, as the 25MA line has once again turned upward, and Dogecoin has successfully retested the upper trendline of its previous descending channel, as shown in the chart below.

Dogecoin price

Dogecoin 1M price chart. Source: @EtherNasyonaL on X

3rd Bull Wave Setup: Resistance Retested, Accumulation Ongoing

The analysis reveals that Dogecoin has recently broken free from a long-term downtrend that spanned between mid-2021 and early 2025. Notably, recent crypto market liquidation events in October have seen the Dogecoin price complete a successful retest of the resistance level, now turned support, around the $0.17 to $0.20 price range. 

This successful retest also coincides with a simultaneous bounce off the bottom trendline of an ascending channel. EtherNasyonaL describes the current price action as Dogecoin “accumulating strength in the lower band of a years-long ascending channel.”

The projected trajectory on the chart above shows Dogecoin following its established pattern by moving from the lower region of the ascending channel to its upper boundary. If the third bull wave plays out as the previous two did, Dogecoin’s price could challenge its $0.73 all-time high and break into new price territories.  The first price target in this case is the $0.8 mark, and then as high as $4 in the long term. 

Dogecoin price chart from Tradingview.com

Bitcoin Price Volatility Hits Record Lows

Bitcoin Magazine

Bitcoin Price Volatility Hits Record Lows

Bitcoin price is once again testing the patience of traders, moving within one of the tightest percentile price ranges in its history. For more than four months, BTC has traded between roughly $106,000 and $123,000. This period of quiet has pushed volatility to its lowest level ever recorded on six-month metrics. Each time in the past that volatility has fallen to similar depths, it has been followed by a major trending move.

Bitcoin Price Volatility Compression

The current lull stands out even compared to previous phases of consolidation in this cycle. Despite occasional liquidations and sharp wicks, the broader price structure has barely shifted since June. One of the most telling metrics is the weekly Bollinger Band Width — the indicator has now reached its lowest weekly reading ever. In every past instance that Bitcoin’s bands have squeezed to this degree, bitcoin price volatility expansion followed shortly after.

When Bitcoin Price Volatility Returns

Periods of ultra-low volatility have never lasted long. In this cycle alone, there have already been five examples where similar consolidations ended with significant moves exceeding 65% gains within 100 days. Averaging those historical fractals to today’s setup would imply a potential bitcoin price target between $170,000 and $180,000 by 2026 if the next expansion phase mirrors prior behavior.

However, bitcoin price volatility compression does not guarantee immediate upside. Previous examples have shown that these low-volatility periods can extend for several months before a breakout occurs. Bitcoin could continue to trade sideways through late Q1 2026, oscillating within the current range before direction is decided.

Macro Catalysts for Bitcoin Price Volatility

Several macro factors could serve as a catalyst for renewed bitcoin price volatility. The Federal Reserve is expected to announce another rate cut, which markets currently price at near-certainty. Gold’s recent reversal after setting new highs also hints at potential capital rotation. If even a small fraction of that capital migrates toward Bitcoin amid falling rates and renewed risk appetite, the effect could amplify any breakout once volatility expands.

Conclusion: The Next Big Bitcoin Price Move

Volatility naturally declines as Bitcoin matures from a multi-billion to a multi-trillion-dollar asset, but the cyclical nature of expansion and contraction remains. The current compression phase has lasted unusually long, and historically such conditions have preceded powerful multi-month trends.

The final months of 2025 and early 2026 may test this pattern once again. With bitcoin price volatility metrics at record lows, macro conditions turning supportive, and market sentiment subdued, Bitcoin appears poised on the edge of its next major move.

For a more in-depth look into this topic, watch our most recent YouTube video here: Bitcoin Is About To Surprise Everyone.


For deeper data, charts, and professional insights into bitcoin price trends, visit BitcoinMagazinePro.com.

Subscribe to Bitcoin Magazine Pro on YouTube for more expert market insights and analysis!


Bitcoin Magazine Pro

Disclaimer: This article is for informational purposes only and should not be considered financial advice. Always do your own research before making any investment decisions.

This post Bitcoin Price Volatility Hits Record Lows first appeared on Bitcoin Magazine and is written by Matt Crosby.

Battlefield 6 Season 1, Battlefield REDSEC Now Live, Full Season 1 Roadmap Revealed

Battlefield Redsec title screen with armed soldiers walking on a street amidst explosions.

It's a big day for Battlefield 6, with both its Season 1 update now live for players to jump into, and its new free-to-play battle royale mode, Battlefield REDSEC, also now available. EA and Battlefield Studios confirmed yesterday what was already rumored, that REDSEC would be revealed and launched today, and now it's here for all players on PC, PS5, and Xbox Series X/S. Once the gameplay trailer that was teased yesterday was over, the mode and the new season was officially live for all players to jump into, and we got our first major question of the day answered. […]

Read full article at https://wccftech.com/battlefield-6-season-1-battlefield-redsec-out-now-pc-ps5-xbox-series-x-s/

November Preview: Will Bitcoin Break The Cycle Or Repeat It?

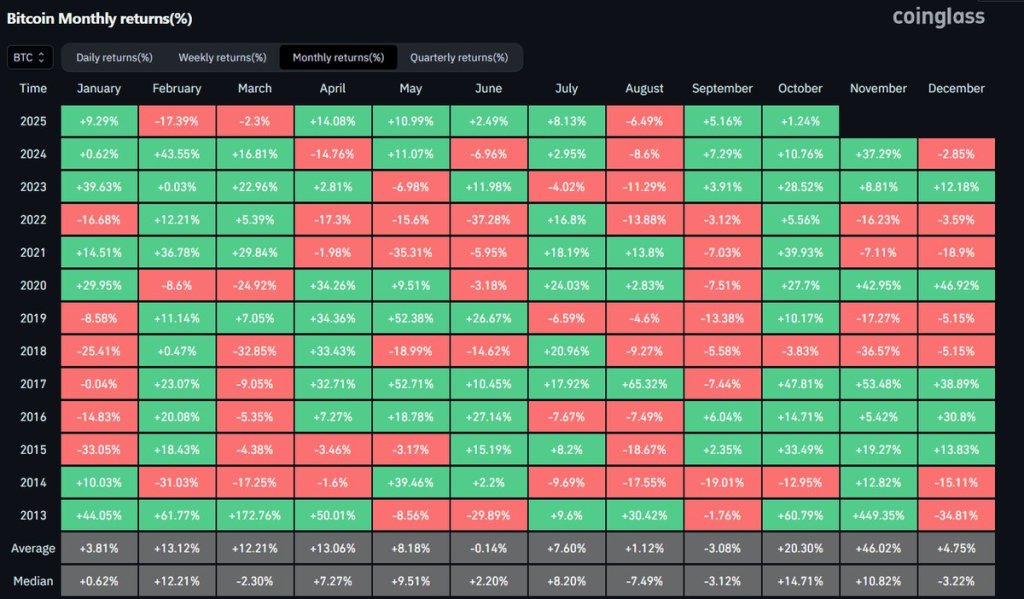
A widely shared seasonality snapshot is making the rounds ahead of month-end: a Coinglass heat map of Bitcoin’s monthly returns, reposted by trader Daan Crypto Trades. The table spans 2013–2025 and shows November as the statistical outlier in Bitcoin’s calendar—both for eye-popping gains and for sharp drawdowns in certain years.

Bitcoin November Preview

“November is Bitcoin’s best month based on historical performance. By far,” Daan wrote on X, pointing to an average November change of +46.02% across the dataset. That figure is visibly distorted by November 2013’s +449.35% surge, the single largest monthly move on the board. He added: “The average gain over all these months is +46.02%. But this is heavily skewed by a single monthly gain in November 2013. Bitcoin went up +449.35%!! that month.”

The raw counts back up the reputation without the hyperbole. Out of the 12 Novembers listed (2013–2024), 8 finished green—2013 (+449.35%), 2014 (+12.82%), 2015 (+19.27%), 2016 (+5.42%), 2017 (+53.48%), 2020 (+42.95%), 2023 (+8.81%), and 2024 (+37.29%)—while 4 were negative—2018 (-36.57%), 2019 (-17.27%), 2021 (-7.11%), and 2022 (-16.23%).

The median November change sits at +10.82%, a more conservative central tendency that dampens the 2013 effect. Excluding 2013 entirely, the simple average for November drops to roughly +9.35% across the remaining 11 years, underscoring how one month can skew mean-based seasonality.

Bitcoin seasonality

Context from the broader table matters. November’s average is the highest of any month on Coinglass’s grid, ahead of October’s +20.30% average, while December shows a far more mixed profile with a +4.75% average but a -3.22% median—an imbalance consistent with outlier-driven months.

September, long maligned by traders, retains a negative average (-3.08%) over the full period. The 2024 row itself captures the push-and-pull of this cycle’s narrative: double-digit gains in February, March, May, October, and November, offset by meaningful drawdowns in April, June, and August, and a negative December print to close the year (-2.85%).

Lessons From Prior Cycles

Daan’s framing extends beyond simple seasonality. “November & December is when the 2013, 2017 & 2021 cycles topped out. It’s also where the 2018 & 2022 cycles bottomed out,” he noted. That observation lines up with the historical inflection points most market participants remember: the late-2013 mania and subsequent crash, the December 2017 peak, the November 2021 all-time high, and the December 2018 and November 2022 washouts.

The Coinglass grid cannot timestamp intramonth highs or lows, but the clustering of major pivots into the final two months of the year is consistent with the market’s folklore and with the returns pattern that shows both exceptionally strong up months and some of the cycle’s most punishing down months in this window.

The practical takeaway—again in Daan’s words—is not categorical bullishness, but regime risk: “All in all, an eventful last 2 months of the year generally speaking. Whether it’s on the bullish or bearish side, volatility and big market pivots have been the theme into the end of the year.” The heat map supports that characterization.

November’s distribution spans the widest extremes on record—from +449.35% at the top to -36.57% on the downside—with a two-thirds hit rate for green months and a median gain in the low double digits. December, by contrast, has produced both cycle tops and cycle bottoms despite a modest average, a reminder that average and median statistics can obscure the path risk that defines Bitcoin’s fourth quarter.

Seasonality is not destiny, and the sample is limited. Still, the data-backed message is clear: as November approaches, Bitcoin’s historical pattern has been less about quiet trend continuation and more about variance—the kind that has marked both euphoric blow-offs and capitulation lows.

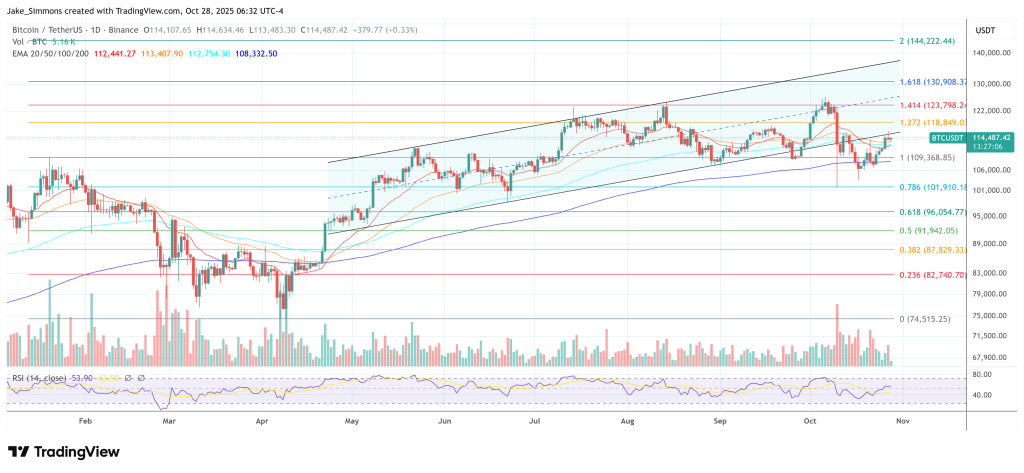
At press time, BTC traded at $114,487.

Bitcoin price

Analyst Predicts XRP Price Crash To $1.4 In Final Wave

Crypto analyst CasiTrades has predicted that the XRP price could still crash to $1.4 in the final wave of this downtrend. This comes despite bullish catalysts such as the Fed rate cut, which could lift the altcoin to new highs. 

Analyst Predicts XRP Price Crash To $1.4

In an X post, CasiTrades stated that exchanges are aligning toward their .618 retracements, with Binance showing a crash to between $1.35 and $1.46 for the XRP price. She noted that this next wave down would complete the macro Wave 2 correction, setting the stage for the next Wave 3 impulse that could send XRP toward $6.50 or $10.

This came as the analyst remarked that the XRP price was at a major decision point, with the price continuing to test the Wave 4 highs. She noted that this resistance is making another wave down a possibility. To invalidate the move down, CasiTrades stated that XRP needs to break and hold above $2.82 on Binance. 

However, so far, the XRP price hasn’t done so, with CasiTrades noting that the price is still ranging between support and resistance. She explained that this leans toward this being a Wave 4, with the altcoin one final move lower before the next macro impulse. The analyst ruled out a V-shaped recovery, noting that price typically breaks through resistance immediately and decisively, which is not happening with the current price action. 

XRP

She further remarked that the hesitation suggests that selling pressure isn’t fully exhausted for the XRP price. However, CasiTrades assured that the deeper support levels aren’t a reason to panic, as they are high conviction accumulation zones. Meanwhile, the analyst highlighted a discrepancy in the price action on different exchanges. 

She noted that the XRP price on Binance wicked to $0.77 during the $19 billion liquidation event, while on Coinbase, XRP never reached its .618 retracement level. CasiTrades then reiterated that until $2.82 breaks, the price action favors one final wave down before the next major move up.

XRP’s Bull Run Isn’t Over

Crypto analyst Egrag Crypto has assured that the bull run isn’t over for the XRP price, despite predictions that the top may be in. He stated that as long as XRP holds above $2.20 and $1.97 as monthly closes, then there is no structural break. He also believes that the altcoin and other risk assets are about to “roar.”

Egrag Crypto noted that quantitative tightening is still active and that Fed rate cuts are just beginning. In line with this, he declared that the last leg up is still waiting to play out. He claimed that cycles don’t end when 50% of traders are cautious, but do when everyone is “drunk on euphoria.”

At the time of writing, the XRP price is trading at around $2.6, down in the last 24 hours, according to data from CoinMarketCap.

XRP

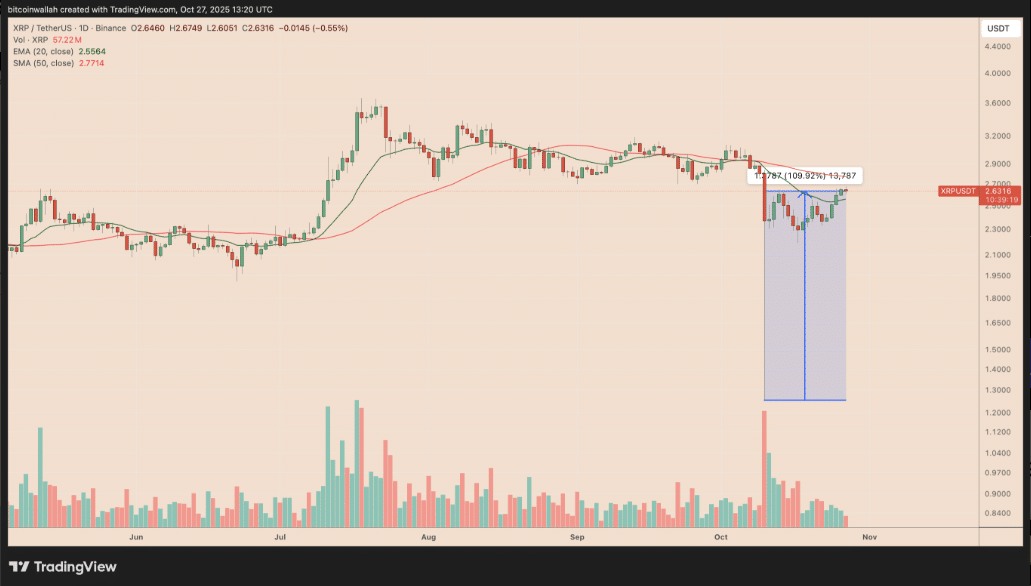
XRP Price November Outlook: How High Can It Run

XRP closed October with a mixed tape, yet the setup for November looks constructive. A repeatable price pattern, a genuine supply squeeze on exchanges, and a new institutional treasury building a billion dollar position all point to one thing: higher probability of topside tests.

A recent analysis mapped a close above 2.77 as the trigger that can open Fibonacci targets in the 2.75 to 3.00 area, with stretch room if momentum accelerates.

XRP price November outlook: upside paths, downside traps

For search clarity and reader intent, the XRP price November discussion starts with levels. The first inflection is 2.77 on a daily close. Hold above that pivot and the classic 0.5 to 0.618 retracement zone lines up around 2.75 to 3.00, where sellers usually test the bid.

If liquidity thins and momentum runs hot, prior impulses have reached into the low 3s, which keeps 3.20 to 3.40 alive as a secondary path. The baseline case is more modest, but still positive, because the structure respects higher lows and a tightening range into that 2.77 gate.

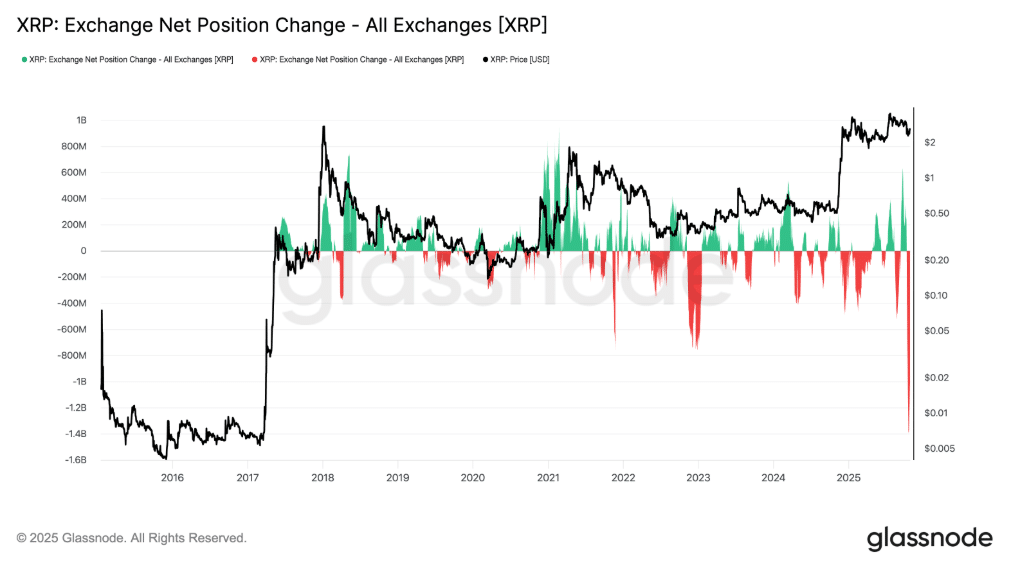
The XRP price November story is not only technical. On chain flows set the tone. Data aggregators tracked one of the largest two day exchange outflow events on record around Oct. 19 to Oct. 20, with more than 2.6 billion XRP leaving centralized venues. Heavy withdrawals reduce near term sell supply and often precede relief rallies when bids reappear. The signal is not perfect, but combined with price holding support, it tilts odds toward upside follow-through.

XRP Price November Outlook: How High Can It Run
XRP price November

A billion-dollar buyer changes the conversation

New corporate demand shapes the XRP price November narrative as well. A Ripple-affiliated venture called Evernorth plans to become the largest publicly traded XRP treasury via a listing that aims to raise more than 1 billion dollars for accumulation.

The rationale is simple to understand and hard to ignore. A permanent buyer with a mandate to add on weakness can smooth drawdowns and intensify rallies. Reuters reported that the deal is expected to close in the first quarter of 2026, with strategic backers across crypto finance.

The team has been vocal in public.

“I am proud to share that we have launched Evernorth, a first of its kind institutional vehicle built to accelerate XRP adoption,” said CEO Asheesh Birla in a post on X, linking to the treasury’s introduction video. In a later update he added, “We are combining institutional discipline with on chain innovation to grow XRP per share and redefine what a digital asset treasury can be.”

Both messages underline a long horizon and an intent to keep accumulating.

XRP Price November Outlook: How High Can It Run
XRP price November: Source, X

Crypto market strategists have weighed in on flows across assets. “Inflows into altcoins seem to be confined to SOL and XRP at present,” wrote a leading European research head in a public thread, echoing a broader rotation into higher liquidity names while smaller tokens lag. Stronger breadth in these flows would further support the XRP price November case, but concentration in the leaders often comes first.

What the indicators actually say

Good price calls do not rely on one data point. The XRP price November framework tracks several inputs. Exchange reserves trended lower into late October, consistent with those outflows. If reserves keep falling while open interest rises at a measured pace, price can pop on relatively small buy programs. If open interest spikes too quickly, unwinds can wash out gains.

Funding remains the real-time compass. Modest positive funding with rising spot volume is healthy. Aggressive positive funding without spot confirmation often precedes a shakeout. For short-term traders, derivative heat maps show a pocket of resting short-side liquidity just below the first resistance cluster, which can create a fast move if price rips through overhead levels.

Macro still matters. Digital asset products drew hefty weekly inflows in late October, a sign that investors continue to add exposure even after sharp swings. A sustained bid across the complex would support the XRP price November roadmap, especially if the pace of inflows persists as policy clarity improves. If flows stall, risk assets can slip back into chop.

Ripple news today
XRP price November

Scenario planning for editors and investors

Map three paths. In the base case, the XRP price November move respects the 2.77 trigger, grinds into 2.90 to 3.00, and consolidates while funding stays contained. In the bullish case, spot demand from treasuries and advisors aligns with falling exchange supply, extending the push toward 3.20 and possibly 3.40 if breadth improves.

In the risk case, a failed breakout below 2.77 meets a burst of positive funding and crowded longs, knocking price back toward the mid 2s. None of these paths require perfection. They require discipline about levels and respect for the data in front of the market.

Public voices will continue to influence tone. One high-profile trader on X said, “New all-time highs in November,” summarizing the current optimism in a single line. Whether that proves prescient or just enthusiastic color matters less than the sequence of daily closes and the behavior of flows. Long term holders look at the broader adoption arc and the entry of corporate treasuries. Short-term traders watch the gate at 2.77. Either way, the XRP price November discussion is now in the driver’s seat.

Conclusion

The market likes simple stories. The XRP price November story blends a familiar breakout pattern with tangible supply dynamics and a new corporate accumulator. It will not be a straight climb. It rarely is. But if price clears 2.77 and the outflows persist while institutional demand scales, higher prints are reasonable. If those conditions fade, the trade becomes range bound again. Clarity lives in the data. The next daily closes will tell the tale.

Frequently Asked Questions

What is the key level to confirm momentum in November?
Analysts watch a daily close above 2.77 to validate upside targets in the 2.75 to 3.00 band derived from the 0.5 to 0.618 retracement.

Why do exchange outflows matter for price?
Large withdrawals reduce immediate sell supply. The Oct. 19 to Oct. 20 window saw more than 2.6 billion XRP leave exchanges, which historically improves the odds of relief rallies.

How does Evernorth influence market structure?
A dedicated treasury with a mandate to accumulate creates steady bid support. The initiative targets more than 1 billion dollars for XRP purchases as it prepares a public listing.

Are fund flows supportive into November?
Yes, late October showed sizeable inflows into digital asset products, which helps overall risk appetite if sustained.

Glossary of key terms

Exchange reserve depletion
A trend where coins move from exchanges to self custody or treasuries, shrinking near term sell pressure and often tightening available liquidity for spot buyers.

Fibonacci retracement zone
A technical range, commonly the 0.5 to 0.618 band of a prior move, used to estimate probable resistance and profit taking zones after a rebound. In this case it aligns with 2.75 to 3.00.

Institutional crypto treasury
A publicly traded or regulated vehicle that accumulates a specific digital asset as a balance sheet holding, potentially buying on weakness and influencing market microstructure over time.

Derivative liquidation pocket
A cluster on heat maps where forced buy or sell orders may trigger if price touches certain levels, often accelerating moves and creating slippage in thin conditions.

Read More: XRP Price November Outlook: How High Can It Run">XRP Price November Outlook: How High Can It Run

XRP Price November Outlook: How High Can It Run

Is The Dogecoin Bull Run Over? Analyst Predicts When DOGE Rallies Again

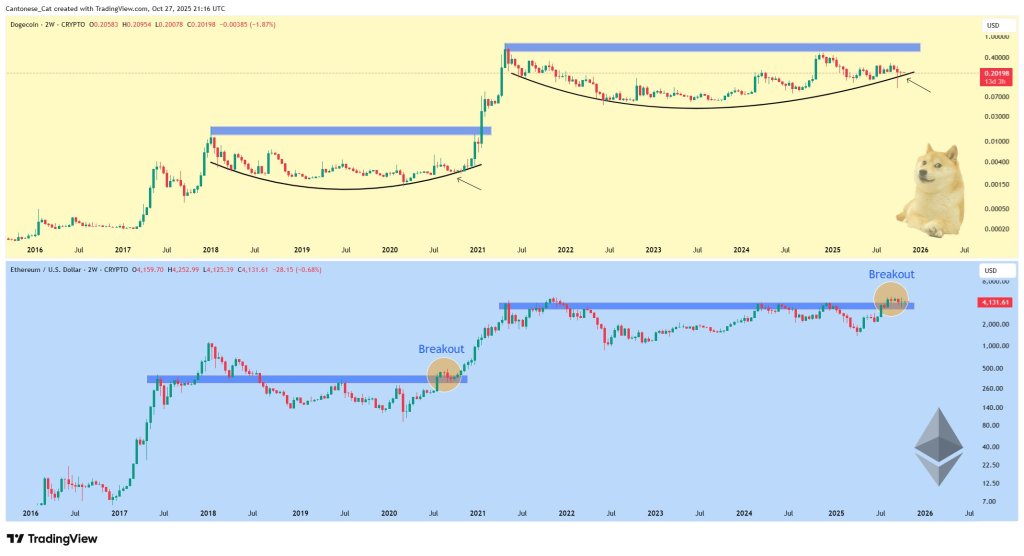
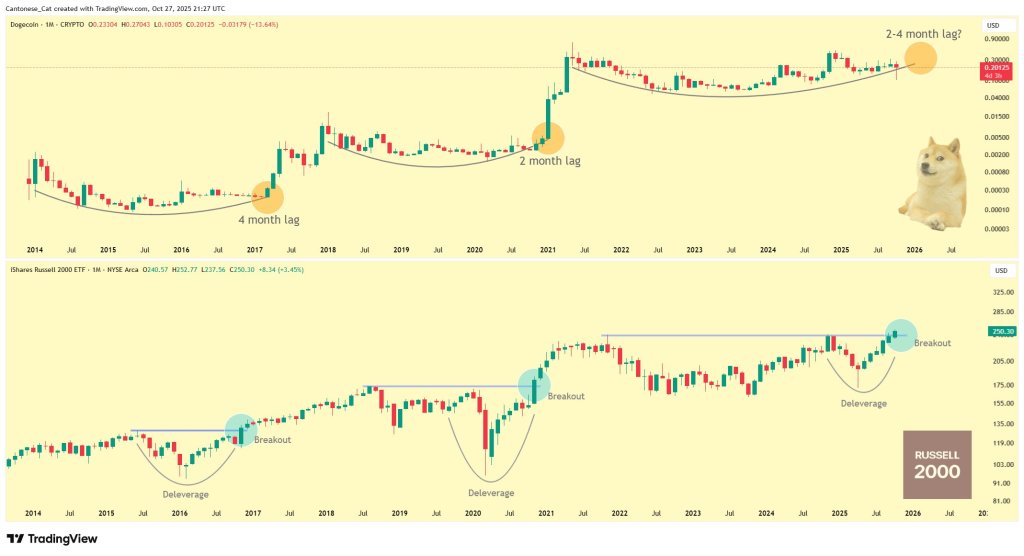
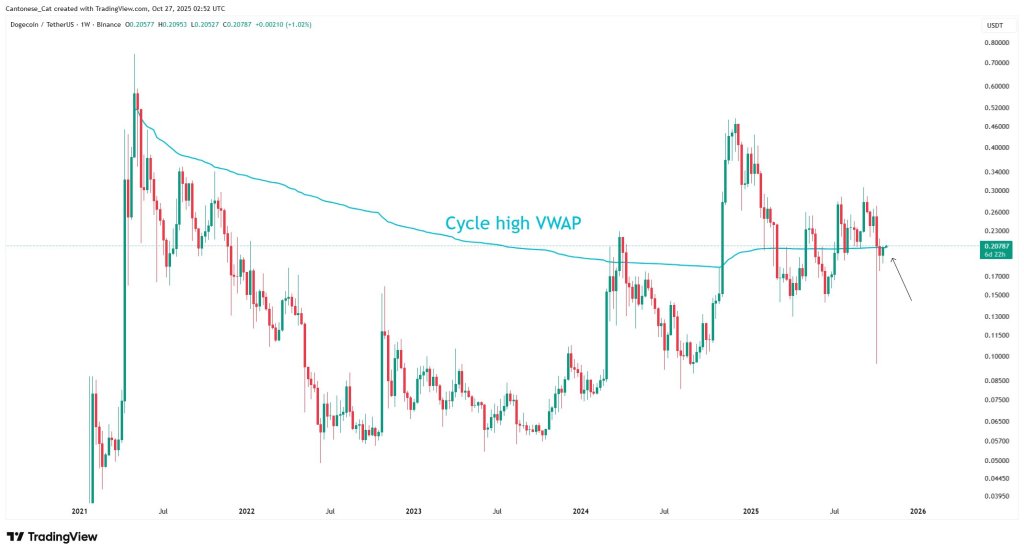
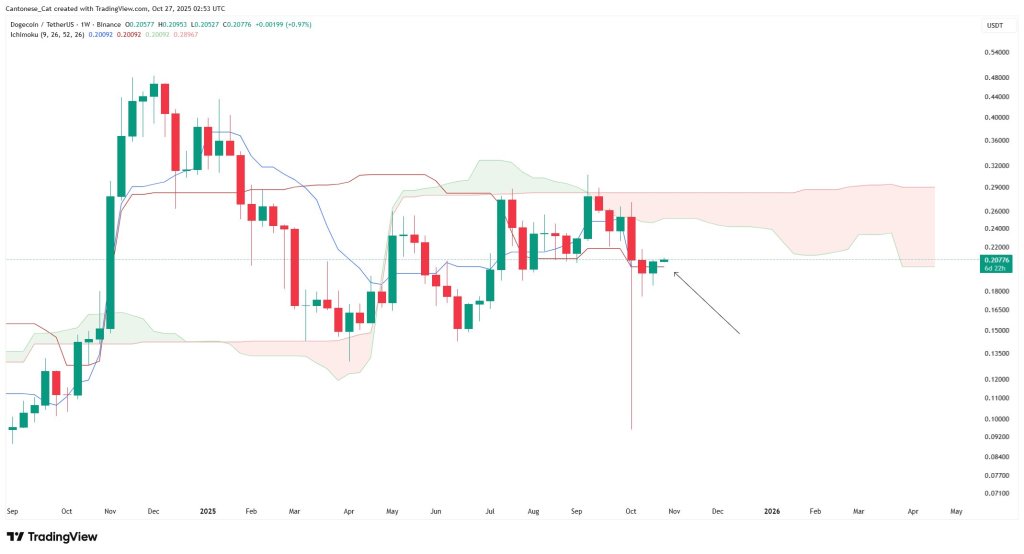
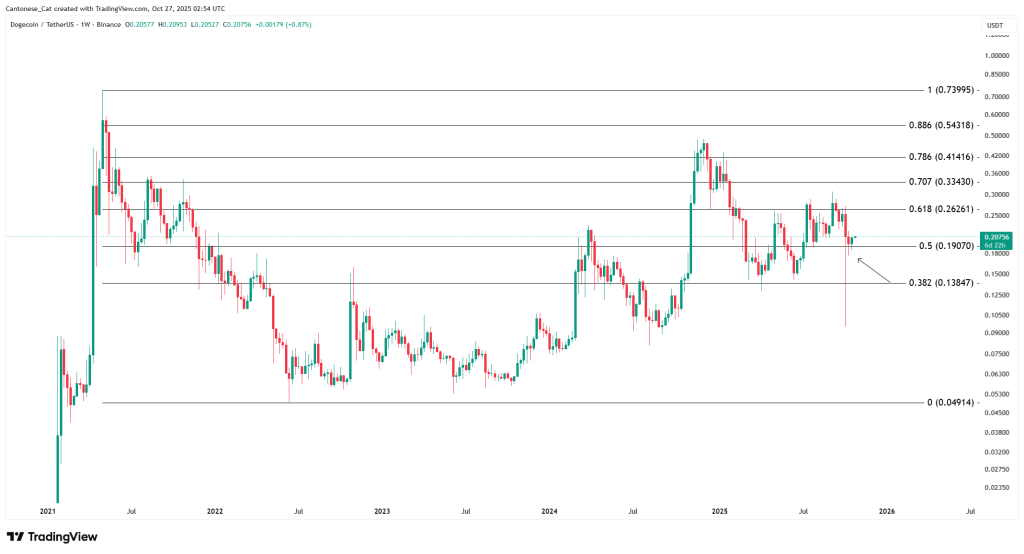
Cantonese Cat used his October 28 video to zero in on the Dogecoin market structure, arguing that the meme-coin is nearing the end of a multi-year accumulation phase—and that the recent washout was a feature, not a bug, of that process. While he declined to publish numeric price targets in the video, he made the case that DOGE’s setup is maturing in lockstep with broader “risk-on” signals, with a familiar lag to Ethereum that historically precedes Dogecoin’s larger moves.

When Will Dogecoin Rally Again?

On structure, he was explicit. “Just looking at Doge here, you can see how […] Doge has been forming a cup over here for close to four and a half, five years now […] it’s just been building a big giant base.” In his read, the rounded bottom is the defining pattern of this cycle for DOGE, and it remains intact despite recent volatility.

He framed the sharp drawdown two weeks ago as necessary positioning rather than a break in trend: “You just had a great deleveraging event […] I’m not going to look at a lower low and think the trend is broken […] These are very healthy deleveraging before the next move up as far as I’m concerned.” He highlighted “a big giant wick” and “a lot of demand down below,” pointing to what he sees as resilient spot support through the base.

Timing, not targets, was the centerpiece. He reiterated that Dogecoin typically follows Ethereum with a delay once ETH clears its own major resistance bands. “Whenever we get closer to the end of the rounded bottom […] that’s when Ethereum breaks out above the resistance zone and goes up a lot higher. Thus, Doge runs together with Ethereum,” he said, adding: “There is a lag. I would say the lag is probably maybe a couple months between Ethereum breaking up and Doge finally breaking above this rounded bottom here and going up.”

Dogecoin vs Ethereum

He made a similar observation using risk proxies, noting that DOGE moves have historically trailed small-cap-led risk cycles by several months, though he cautioned that the exact interval can vary. Via X, he added “DOGE lags behind IWM [iShares Russell 2000 ETF] all-time-high breakout by about 2 to 4 months before it takes off.”

Dogecoin vs IWM

Cantonese Cat also pushed back on the view that a sequence of lower lows automatically invalidates the DOGE setup, arguing that this occurred in prior cycles just before outsized rallies. “A lot of people look at this, ‘that’s a lower low […] the cycle is over.’ Well, it doesn’t work that way. That’s a lower low right there. Next thing you know, it just went a lot higher,” he said, tying the observation to the current “healthy deleveraging” and the persistence of the rounded-bottom structure.

If the video offered the structural blueprint, his same-day post on X clarified his stance on headline targets. “I realize that it’s stupid to call for DOGE to $2 or $4 when price is at 20 cents. If I was smart like others, I should just call for DOGE to $2 or $4 when it’s $2 or $4.” The comment is consistent with his prior price predictions.

Inside the video update, the analyst instead emphasized the sequence he expects to matter—ETH strength first, DOGE follow-through second, with the magnitude determined by how far the broader risk cycle runs once momentum rotates.

At press time, DOGE traded at $0.20.

Dogecoin price

Bitcoin And Crypto Market Set To Bounce As Rate Cut Probabilities Touch 98.3%

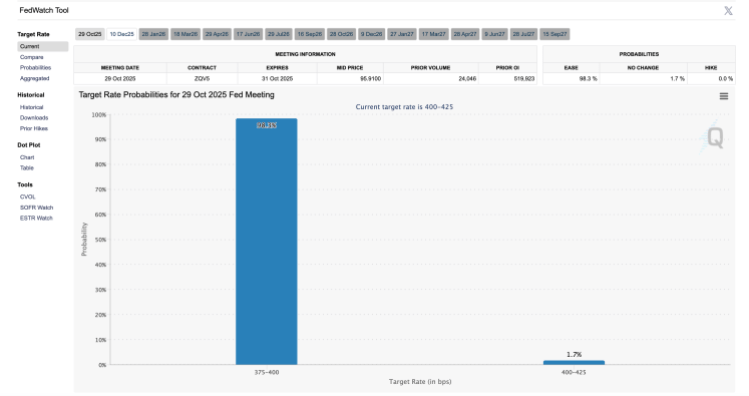
The next Federal Open Market Committee (FOMC) meeting is fast approaching, and the bets are already pouring in as to what it would mean for the Bitcoin and crypto industry. The last FOMC meeting took place in September, when the Federal Reserve ended up cutting rates down to 4-4.25% after months of no rate cuts. With this setting the tone, the expectations that another rate cut could be on the way are getting louder, with the FedWatch Tool showing a high percentage.

Market Expects Another Rate Cut To 3.75-4%

The next FOMC meeting is scheduled for Wednesday, October 29, 2025, and there is already a major clamor around what the Fed is planning on doing. The current market headwinds point to a favorable outcome for risk assets such as Bitcoin and other cryptocurrencies, with expected rate cuts.

Currently, the CME FedWatch Tool is showing that the probability of a rate cut has risen to 98.3% as of the time of this writing. This leaves only a 1.7% chance that the Federal Reserve will actually leave rates at their current levels, and there is zero chance that there will be a rate hike.

Fed FOMC

A reduction in the rate cuts is good for businesses all around, as lower interest rates mean better loan terms and increased spending and borrowing. Thus, it will increase the participation in the markets, from consumer goods to the stock market, and then make its way into newer markets such as Bitcoin and crypto.

Expectations For Bitcoin And Crypto Are Getting Higher

A rate cut by the Federal Reserve aligns with the more pro-crypto stance that the United States has been moving in since President Donald Trump was elected. Last week, the president pardoned the Founder and former CEO of the Binance crypto exchange, Changpeng Zhao, after he previously pled guilty to money laundering violations back in 2024. Zhao has since served a 4-month stint before the pardon from Trump came.

With the US embracing Bitcoin and crypto again, a rate cut will only further the ascent, allowing more investors to get into the market as liquidity frees up. The initial announcement has been known to trigger a rapid increase in the market. But as the news settles, the crypto market is expected to continue to rise in response.

However, nothing is certain until the FOMC meeting is complete and the announcement is made. For the Bitcoin and crypto market to remain bullish, inflation will also have to be reduced, as an increase could trigger more conservative stances from investors.

Bitcoin price chart from Tradingview.com (crypto)

First Solana ETFs approved: bulls regain control with eyes on $230

  • Solana ETFs’ launch has boosted institutional interest and market optimism.
  • Bulls target $230 as SOL holds strong above the key $200 support zone.
  • Technical analysis shows rising momentum with resistance near $216–$227.

The long-awaited Solana ETFs have finally been approved, sparking renewed optimism across the crypto market.

The ETFs’ approval has reignited bullish momentum, with analysts believing that the Solana price could soon rally toward $230 and beyond.

Solana ETFs debut fuels optimism

Bitwise and Canary Capital have confirmed that their individual Solana ETFs officially begin trading on October 28 after weeks of regulatory uncertainty.

Bitwise’s product, launched under the ticker BSOL, serves as a gateway for institutional exposure to Solana, featuring staking powered by Helius Labs and a temporary management fee waiver.

Introducing $BSOL — the Bitwise Solana Staking ETF. Starts trading tomorrow.

– First U.S. ETP to have 100% direct exposure to spot SOL
– Maximizing Solana’s 7%+ average staking reward rate*
– Targeting 100% of assets staked
– Staking through Bitwise Onchain Solutions, powered by… pic.twitter.com/Vo8Ko0qOCn

— Bitwise (@BitwiseInvest) October 27, 2025

Grayscale has also moved swiftly, converting its Solana Trust (GSOL) into an ETF holding over $105 million worth of SOL.

Meanwhile, VanEck has also filed its sixth S-1/A amendment, with its Solana ETF status officially changed to “effective” and a 0.3% management fee established.

Adding to the growing momentum, Hong Kong’s first Solana ETF also began trading on Monday, marking Asia’s initial entry into the Solana ETF landscape.

Despite this wave of institutional activity, retail demand for Solana remains subdued.

Futures open interest sits near $9.75 billion — up slightly from the previous day but still below the $10 billion mark — indicating that traders are cautious amid market volatility.

Even so, analysts believe the ETF launches signal a critical turning point for Solana, reinforcing its legitimacy as an institutional-grade digital asset and providing the foundation for its steady hold above $200.

Bulls take charge as momentum builds

While retail demand for Solana remains unresponsive, the Solana price has been climbing steadily from $190 to $205, with short positions fading quickly.

Analysts note that bearish volume profiles are weakening while liquidity accumulates at higher price levels.

This shift has tilted momentum firmly in favour of buyers, with several technical indicators confirming the strength of the ongoing rally.

On the 4-hour chart, Solana trades above both its 50-day and 200-day moving averages, reinforcing the bullish setup.

The Ichimoku Cloud analysis shows a clear breakout, with price holding above key support between $197 and $201 — a signal that often precedes extended upward moves.

The Relative Strength Index (RSI) also hovers near 62, leaving room for additional gains before overbought conditions emerge.

Solana price analysis
Source: CoinMarketCap

Analysts now eye resistance zones between $204 and $208, followed by key hurdles at $216, $227, and $230.

Notably, a confirmed close above $205 could trigger a sustained rally toward these upper levels.

If momentum continues, higher targets around $237 and $253 come into view, aligning with Fibonacci retracement levels that mark previous swing highs.

Technical patterns hint at a repeat of 2023

Market observers have compared the current structure of Solana’s price chart to its 2023 breakout phase.

Analysts such as GalaxyBTC point to an ascending triangle pattern forming on the weekly chart, defined by a series of higher lows that indicate strong accumulation.

$SOL

Same pattern as October 2023.

This Q4 we should break-out from the consolidation into new all-time-highs. pic.twitter.com/pIURlH1YUu

— Galaxy (@galaxyBTC) October 25, 2025

The critical support at $188 remains intact, representing the network’s largest volume cluster where many long-term holders entered the market.

A successful breakout above $200 would confirm the pattern and potentially lead to a test of $215 and $225, echoing the bullish behaviour seen two years ago.

The broader macro picture also appears supportive.

Some traders suggest that if the US Federal Reserve signals an end to quantitative tightening, it could inject much-needed liquidity into the market — providing another tailwind for Solana’s next leg higher.

Long-term outlook stays bullish

Even as short-term traders monitor resistance near $230, long-term analysts remain optimistic about Solana’s broader trajectory.

The asset has maintained a pattern of higher lows since early 2023, and its market structure mirrors the accumulation phase that preceded its previous bull run.

Projections place potential mid- to long-term targets around $300, $390, and even $520 if momentum and institutional demand persist.

In the near term, maintaining support between $198 and $200 is crucial.

If buyers continue to defend this zone, the Solana price could strengthen further, confirming its leadership among major altcoins.

As the first wave of Solana ETFs begins trading, the market’s sentiment has clearly shifted — bears are losing ground, and bulls now have their eyes fixed firmly on the $230 milestone.

The post First Solana ETFs approved: bulls regain control with eyes on $230 appeared first on CoinJournal.

Dogecoin (DOGE) Cools Off — Buyers Struggle To Sustain Recovery Above Key Levels

Dogecoin struggled to rise above $0.210 and corrected some gains against the US Dollar. DOGE is now consolidating and might decline below $0.1980.

  • DOGE price started a fresh downside correction below $0.2035.
  • The price is trading below the $0.20 level and the 100-hourly simple moving average.
  • There was a break below a contracting triangle with support at $0.20 on the hourly chart of the DOGE/USD pair (data source from Kraken).
  • The price could aim for a fresh increase if it remains stable above $0.1940.

Dogecoin Price Starts Another Pullback

Dogecoin price started a fresh increase after it settled above $0.1920, like Bitcoin and Ethereum. DOGE climbed above the $0.20 resistance to enter a positive zone.

The bulls were able to push the price above $0.2020 and $0.2050. A high was formed at $0.2094 and the price is now correcting gains. There was a move below the 23.6% Fib retracement level of the upward move from the $0.1843 swing low to the $0.2094 high.

Besides, there was a break below a contracting triangle with support at $0.20 on the hourly chart of the DOGE/USD pair. Dogecoin price is now trading below the $0.20 level and the 100-hourly simple moving average.

Dogecoin Price

If there is another increase, immediate resistance on the upside is near the $0.2020 level. The first major resistance for the bulls could be near the $0.2050 level. The next major resistance is near the $0.210 level. A close above the $0.210 resistance might send the price toward $0.2150. Any more gains might send the price toward $0.2250. The next major stop for the bulls might be $0.2320.

More Losses In DOGE?

If DOGE’s price fails to climb above the $0.2020 level, it could start a downside correction. Initial support on the downside is near the $0.1970 level and the 50% Fib retracement level of the upward move from the $0.1843 swing low to the $0.2094 high. The next major support is near the $0.1935 level.

The main support sits at $0.190. If there is a downside break below the $0.190 support, the price could decline further. In the stated case, the price might slide toward the $0.1840 level or even $0.1780 in the near term.

Technical Indicators

Hourly MACD – The MACD for DOGE/USD is now gaining momentum in the bearish zone.

Hourly RSI (Relative Strength Index) – The RSI for DOGE/USD is now below the 50 level.

Major Support Levels – $0.1970 and $0.1935.

Major Resistance Levels – $0.2020 and $0.2050.

Bitcoin Price Jumps to $115,000 As Analyst Says It May Never Fall Below $100K Again

Bitcoin Magazine

Bitcoin Price Jumps to $115,000 As Analyst Says It May Never Fall Below $100K Again

Bitcoin price surged to $115,000 on Monday, rising more than 1% in 24 hours, as optimism over easing U.S.–China trade tensions and renewed investor appetite for risk assets lifted global markets. 

According to Geoffrey Kendrick, Head of Digital Asset Research at Standard Chartered Bank, Bitcoin price may “never fall below $100,000 again” if this week’s macro tailwinds continue.

In a note to clients, Kendrick said that improving trade relations between Washington and Beijing have flipped last week’s market fear into “hope.” 

U.S. Treasury Secretary Scott Bessent’s weekend statement that restrictions on China’s rare earth exports could be postponed for a year, combined with reports that Beijing plans to buy large quantities of U.S. soybeans, sparked a relief rally across equities, commodities, and crypto.

China, U.S trade deals and FOMC rate cuts

The agreement, expected to be finalized after the upcoming Trump–Xi summit in South Korea, has renewed risk appetite and pushed the bitcoin-to-gold ratio back above pre-October 10 levels — the date when 100% tariff threats sent markets tumbling.

Kendrick pointed to fresh inflows into spot bitcoin ETFs as another key signal of strength. Over $2 billion exited U.S. gold ETFs late last week, and if even half of that re-enters bitcoin funds, he said, it would mark a major vote of confidence. 

The analyst also highlighted macro tailwinds, including expectations for a 25-basis-point rate cut at Wednesday’s Federal Open Market Committee (FOMC) meeting — a move widely seen as bullish for bitcoin. 

Meanwhile, investors are watching a packed earnings calendar from both tech and crypto heavyweights. Microsoft, Meta, and Google are set to report on Wednesday, followed by Apple, Amazon, Coinbase, and Strategy (formerly MicroStrategy) later in the week.

“If this week goes well — bitcoin may never fall below $100,000 again,” Kendrick said.

Bitcoin price outlook

While bulls have made modest progress with Bitcoin, stronger resistance remains overhead at $117,600 and $122,000, leaving bears largely in control. 

If Bitcoin manages to surpass $122,000, professionals note the next target could be the upper boundary of a broadening wedge pattern at $128,000.

Support levels remain critical for maintaining bullish momentum. The key short-term support at $106,900 held throughout last week, helping stabilize the market. 

Falling below this level could open the path toward the $105,000–$102,000 support zone, which has already been tested twice, with a third test raising the likelihood of a breakdown. 

Beyond that, $96,000 represents a crucial long-term support level for the broader bull market, acting as a do-or-die floor if prices decline further.

As of press time, bitcoin was trading at $115,041, up 1.22% over the past 24 hours.

This post Bitcoin Price Jumps to $115,000 As Analyst Says It May Never Fall Below $100K Again first appeared on Bitcoin Magazine and is written by Micah Zimmerman.

Can Cardano Still Hit $6.25 This Cycle? Analyst Answers

The Cardano weekly chart is still looking strongly bullish according to independent technician Charting Guy (@ChartingGuy on X) who resurfaced his long-running Fibonacci roadmap and channel study.

Can Cardano Top $6 This Cycle?

His latest post on X on October 26 noted that “ADA is fine as long as uptrend holds,” a view that is anchored in a multi-year rising channel that has contained price action since the 2018–2019 base. The channel features a lower rail now passing through roughly the $0.33–$0.35 area, a midline that has behaved as a recurring pivot since 2020, and overhead parallels that intersect with Fibonacci extension targets later in the cycle.

Cardano price analysis

The chart history mapped on his visuals is orderly. The 2021–2022 bear trend, drawn as a steep descending line from the prior peak, ended into the channel’s lower support and resolved through a series of falling trendline breakouts during 2023 and early 2024. Since Q4 2023, the chart has shown a series of higher highs and higher lows. Currently, the ADA price is again guided by a falling trendline.

Everything in the layout revolves around the Fibonacci ladder. The retracement set on the right margin—derived from the 2021 peak to the cycle low—marks 0% at $0.23488, then $0.33360 (0.136), $0.43180 (0.236), $0.62932 (0.382), a mid-range 0.5 at $0.85, $1.15694 (0.618), $1.43911 (0.702), $1.78464 (0.786), $2.32189 (0.888), and $3.09981 (1.000). Above that stack, the cycle extensions are plotted at $6.25325 (1.272), $9.00941 (1.414) and $15.26831 (1.618).

Cardano price analysis

Those numbers are consistent with how the analyst framed the market earlier in the year. On April 27 he wrote that “ADA fibs are very important here. The 0.618 is a STRONG resistance… the 0.382 MUST hold… neutral until one of these breaks on a weekly close.” That roadmap has aged intact.

Rallies through spring and summer repeatedly stalled in the 0.500–0.618 zone, with the 0.618 level at $1.15694 capping advances. Pullbacks, in turn, have found bids near the 0.382 pivot at $0.62932.

On September 18, after that rejection, he updated that “ADA higher low ✅ … higher high pending… still targeting 1.272 fib this cycle,” tying the price structure back to the extension grid. The implication is not casual moon-math; it is geometric. If ADA continues to defend the uptrend defined by the channel’s lower rail and, crucially, converts the 0.618 retracement at $1.15694 into support on weekly closes, the path reopens into the upper retracement shelf—$1.43911 at 0.702 and $1.78464 at 0.786—before confronting the 0.888 marker at $2.32189.
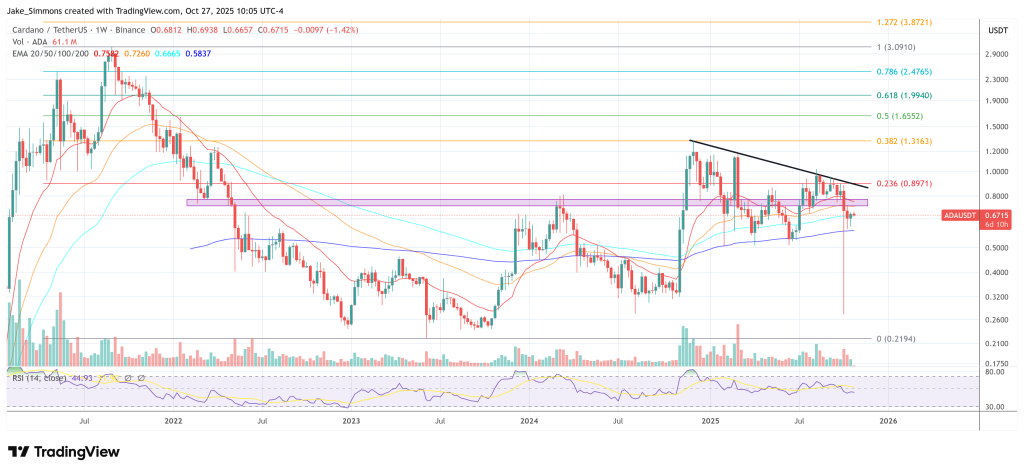
A yellow waypoint for a higher high (on the main chart) sits near ~$2.30, deliberately aligning with that 0.888 level to flag a logical checkpoint for the next impulsive leg beneath the full retrace at $3.09981.

Only beyond that zone does the headline question come into play. The analyst’s cycle objective is the 1.272 extension at $6.25325. On his canvas, that target is not an orphaned price label; it intersects with the upper parallels of the multi-year rising channel further out in time, which means the extension is technically consistent with the same structure that has governed ADA since the last cycle’s base.

The risk management side of the ledger remains equally explicit: lose the 0.382 at $0.62932 on a weekly closing basis and the neutral-to-constructive stance is impaired, pushing focus back to $0.43180 and $0.33360, with the 0% anchor at $0.23488 defining the absolute boundary of the cycle floor inside the channel’s lower third.

As the latest candles on the charts show, ADA sits mid-channel with the higher low confirmed and the range unresolved beneath descending trendline supply. The triggers are unchanged and numerically clear. A sustained weekly close above $1.15694 would validate an attempt toward $1.44, $1.78, and $2.32, with $3.10 the final retrace before extension math takes over.

A failure through $0.62932 would flatten the uptrend call. Between those guardrails, the analyst’s October 26 message reads less like bravado and more like a conditional statement embedded in the chart itself: Cardano can still reach $6.25 this cycle—but only if the uptrend continues to hold and the 0.618 ceiling finally gives way.

At press time, ADA traded at $0.67.

Cardano price

XRP Volatility Incoming? Ripple CEO Prepares Investors For What’s Next

The XRP market is bracing for a new phase of intense volatility, with anticipation growing around key legal, regulatory, and institutional developments. Ripple CEO Brad Garlinghouse has recently addressed the XRP community, offering guidance and setting expectations for what is to come. 

XRP Unusual Stability May Be Setting Up A Major Move

The cryptocurrency world is buzzing with increased anticipation for XRP, following a series of strategic announcements from Ripple and compelling technical analysis. Popular crypto news source CryptosRus has highlighted on X that the altcoin is poised for a sharp move, as Ripple CEO Brad Garlinghouse has mentioned that investors should be prepared for a substantial shift.

At the core of this move, Ripple has just launched Ripple Prime, a new global prime brokerage service tailored for institutional clients. According to the company, Ripple Prime will be powered by Ripple’s foundational digital asset infrastructure, encompassing its robust solutions for payments, crypto custody, and stablecoin capabilities, alongside XRP.

However, CEO Brad Garlinghouse called this move another step toward building the internet of value, emphasizing that the XRP sits at the center of everything Ripple does. CryptosRus noted that the altcoin has recently bounced off a key support level at $2.33. This technical indicator is signaling a potential 30% rally, with an initial target of $3.45 or even higher, as market momentum continues to build.

An analyst known as TylerHillYT, who is also the president of FluenceGlobal and Co-Founder of the CSS, has also stated that the XRP price comeback is showing structural strength. In just a day, the token burn rate spiked 29%, mirroring its 29% price surge, signaling a synchronized increase in both on-chain demand and heightened investor activity.

XRP

This Ripple’s deeper expansion into traditional finance and the recent launch of Ripple Prime have caused the network usage to ramp up again. TylerHillYT emphasized that at the accelerated pace, XRP is not just riding a wave of market momentum, but it’s rebuilding its long-term narrative. However, the burn acceleration with renewed institutional traction could be the early signs of a sustained upward trajectory, pushing the token structurally toward the $3.00 mark.

Connecting Market Surge To Foundational Growth

While the digital asset market is vibrating with renewed excitement surrounding XRP, a prominent crypto influencer and creator on Binance and CMC, Jack, has revealed that the bulls have firmly smashed through the critical $2.55 resistance level with conviction. This decisive breakout has now set the immediate sights of traders on $2.80 and beyond.

Jack mentioned that whale activity is back, and the Open Interest (OI) is climbing steadily, while sentiment is flipping fast. If this powerful momentum holds, the next significant pit stop for XRP could be the $3.00 mark and beyond.

XRP

Bitcoin Trades Sideways — Consolidation Above Support Could Fuel Next Upside

Bitcoin price is consolidating gains above $113,500. BTC could rise further if there is a clear move above the $115,750 resistance.

  • Bitcoin started a fresh upward move above the $114,000 resistance level.
  • The price is trading above $114,200 and the 100 hourly Simple moving average.
  • There is a bullish trend line forming with support at $113,900 on the hourly chart of the BTC/USD pair (data feed from Kraken).
  • The pair might continue to move up if it trades above the $115,750 zone.

Bitcoin Price Starts Consolidation

Bitcoin price formed a base and started a fresh increase above the $112,500 zone. BTC gained pace for a move above the main hurdle at $113,500.

It opened the doors for a move above $115,000 and the 100 hourly Simple moving average. Finally, the price spiked above $116,000 and is currently consolidating gains above the 23.6% Fib retracement level of the recent wave from the $106,718 swing low to the $116,309 high.

Besides, there is a bullish trend line forming with support at $113,900 on the hourly chart of the BTC/USD pair. Bitcoin is now trading above $114,000 and the 100 hourly Simple moving average.

Bitcoin Price

Immediate resistance on the upside is near the $115,000 level. The first key resistance is near the $115,500 level. The next resistance could be $115,750. A close above the $115,750 resistance might send the price further higher. In the stated case, the price could rise and test the $116,300 resistance. Any more gains might send the price toward the $117,500 level. The next barrier for the bulls could be $118,000.

Another Pullback In BTC?

If Bitcoin fails to rise above the $115,500 resistance zone, it could start a fresh decline. Immediate support is near the $114,000 level. The first major support is near the $113,500 level or the trend line.

The next support is now near the $111,000 zone. Any more losses might send the price toward the $110,500 support in the near term. The main support sits at $108,500, below which BTC might struggle to recover in the short term.

Technical indicators:

Hourly MACD – The MACD is now gaining pace in the bullish zone.

Hourly RSI (Relative Strength Index) – The RSI for BTC/USD is now above the 50 level.

Major Support Levels – $114,000, followed by $113,500.

Major Resistance Levels – $115,500 and $116,500.

Zcash (ZEC) Soars Past 2021 Highs as Arthur Hayes Predicts $10K and Privacy Narrative Reignites

Zcash (ZEC) has exploded in value past $350, clearing its 2021 high and igniting a wave of renewed optimism across the digital assets ecosystem. A surge in demand tied to privacy, cross-chain integration and bold market calls are pushing ZEC into the spotlight.

Related Reading: $10K Is Coming: Arthur Hayes’ Zcash ‘Vibe Check’ Sparks 30% Moonshot

Rally Driven by Privacy Narrative and Major Price Call

Zcash’s recent rally is nothing short of dramatic. In the past month, ZEC’s price surged roughly 380 % and smashed through its May 2021 closing level of around US$319.

This breakout has drawn fresh attention to the coin’s core value proposition, transaction anonymity, at a time when regulatory scrutiny and surveillance concerns are rising globally.

Adding fuel to the fire, Arthur Hayes, co-founder and former CEO of BitMEX, publicly predicted that ZEC could ultimately reach US$10,000. Markets responded swiftly; within 24 hours of Hayes’s “vibe check” post on X, ZEC jumped over 30 %. The privacy-coin resurgence appears well underway.

Meanwhile, technical analysts argue the rise is more than hype. ZEC’s chart now showcases breakout patterns, rising volumes, and a shift in smart-money positioning. However, caution remains. Many analysts note that although the price is reflecting a strong narrative, actual usage of shielded transactions remains limited.

Zcash ZEC ZECUSD

Zcash (ZEC) Ecosystem Integrations Add Strength

Behind the price action lies concrete ecosystem development. Zcash integration into other chains, such as its wrapped version on Solana, is reviving interest, while new solutions seek to restore ZEC’s full privacy features across cross-chain networks.

For example, the project Encifher is enabling encrypted versions of ZEC (eZEC) using fully homomorphic encryption on Solana so that users can transact privately while still engaging with DeFi.

Other catalysts include the anticipated halving event, which is due to cut miner rewards in mid-November, tightening supply. Added to that, institutional frameworks such as the debut of a trust vehicle for ZEC are reportedly expanding exposure. All told, these structural shifts support the narrative.

Related Reading: Forget Inflation: Bitcoin Rallies When The Dollar Falls, Study Finds

Nevertheless, even with infrastructure rising, the risk remains that price is racing ahead of real adoption. Analysts warn of a “sell the news” scenario if new integrations or usage metrics fail to materialize.

Cover image from ChatGPT, ZECUSD chart from Tradingview

Bitcoin Price Could See A New All-Time High Above $126,000 If It Breaks This Critical Level

The Bitcoin price is positioning for a potentially explosive move that could take it well beyond its previous all-time highs. Analysts are closely watching a critical resistance level near $116,000, which may serve as the final hurdle before BTC catapults into uncharted territory above $126,000. 

Analyst Predicts New Bitcoin Price All-Time High

Crypto analyst Donny Dicey revealed in an X social media post this week that the $116,000 price level is the decisive zone Bitcoin must breach to confirm a breakout toward a new all-time high. His technical analysis suggests that once BTC achieves a clean break above this resistance area, momentum could swiftly carry it above $126,000. 

Notably, Bitcoin set a new ATH on October 6, 2025, after breaking through its previous record above $124,000 and climbing past $126,000. Since achieving this level, the price of BTC has fallen dramatically to $115,000. Dicey’s accompanying chart shows the market steadily recovering after testing support near $108,000, marked as a “market structure break” region, with bullish price action consolidating above $109,000. 

The analyst has emphasized that each day Bitcoin maintains a close above $109,000 strengthens the probability of a strong upward swing as the market heads into November. This period coincides with the Federal Open Market Committee’s (FOMC) next meeting, where investors are anticipating dovish signals such as rate cuts or the formal end of Quantitative Tightening (QT).

Bitcoin

Dicey also notes that bullish S&P 500 earnings, easing global trade tensions from a potential agreement between US President Donald Trump and China’s President Xi Jinping, and improving ISM manufacturing data point to a macro environment supportive of risk assets. A community member commented that whales may have underestimated how much BTC’s demand tends to persist during these conditions. Dicey responded that the same whales might become “exit liquidity” as Bitcoin accelerates higher, possibly missing out on the strongest phase of this cycle. 

Consolidation Above January Highs Signal Unbreakable Strength

In a follow-up analysis, Dicey highlighted Bitcoin’s remarkable stability above its January highs, describing its price structure as “unbreakable” amid global macroeconomic uncertainty. He pointed to several converging factors that reinforce BTC’s resilience, including ongoing fiscal and monetary expansion, a weakening US dollar, and renewed confidence in the global business cycle. 

The analyst also emphasized that geopolitical tensions tied to US-China relations appear to be subsiding. At the same time, ETF inflows and exponential growth in the Artificial Intelligence (AI) sector contribute to acting as tailwinds for digital assets. He disclosed that despite strong underlying fundamentals, skepticism remains widespread in the market.

According to him, many still believe in the traditional four-year cycle narrative, while retail enthusiasm has not fully returned. Furthermore, the Russell 2000 index has yet to breakout, and rotation from traditional assets, such as the S&P 500 and gold, into Bitcoin remains limited. With these developments subduing broader market participation, Dicey suggests it creates the perfect setup for a powerful rally in BTC once sentiment shifts decisively.

Bitcoin

Azamara, Emerald, and Scenic Cruises Enhance Luxury Travel with Ship&Play Luggage Shipping Service: What You Need to Know

Azamara, Emerald, and Scenic Cruises Enhance Luxury Travel with Ship&Play Luggage Shipping Service: What You Need to Know
Image of Scenic Ikon Cruise Ship

Passengers embarking on cruises with Azamara Cruises, Emerald Cruises and Tours, and Scenic Luxury Cruises and Tours can now take advantage of a luxury luggage shipping service thanks to a new partnership with Ship&Play, the specialist provider behind ShipSticks. Starting November 1 for Azamara and November 15 for Emerald and Scenic cruises, travelers will have the option to ship their luggage from home directly to their shipboard suite and back after their voyage. This innovative service removes the burden of managing bulky bags during transfers, instantly elevating the onboard experience.

The Luxury of Effortless Travel from Doorstep to Destination

Ship&Play provides a smooth, fully insured, and trackable luggage delivery service designed to function as a bespoke concierge offering for cruise passengers. By taking care of baggage logistics, the partnership promises to minimize travel stress and allow guests to focus entirely on their holiday journey. Whether for round-trip or one-way travel, the service is especially beneficial for those who prefer not to handle luggage after a journey or after indulging in onboard shopping.

Transforming the Cruise Travel Experience

Azamara, Emerald, and Scenic, renowned for their premium cruise itineraries including destinations such as the Mediterranean, Caribbean, and Baltic regions, view the integration of Ship&Play as a step toward redefining luxury and convenience in cruising. The service fosters a superior guest experience by ensuring luggage arrives smoothly and securely, ready in suites upon arrival, allowing passengers to immediately immerse in the destination experiences provided by these cruise lines without the distraction of baggage.

Onboard Convenience and Travel Advisor Benefits

Passengers have the flexibility to book return shipments while still onboard, simplifying the end-of-cruise process. This seamless luggage transition aligns perfectly with the premium service standards of Azamara, Emerald, and Scenic. In addition, travel advisors promoting the service can earn commissions starting at ten percent per booking, providing an attractive business opportunity that further incentivizes premium travel solutions.

Impact on Tourism and Luxury Travel Sectors

By removing a significant logistical hurdle, the collaboration between Ship&Play and these leading cruise operators encourages increased uptake of luxury cruise holidays. Travelers valuing time, comfort, and reliability are likely to be attracted to this enhanced offering, supporting tourism growth in regions serviced by the Azamara, Emerald, and Scenic fleets. This improvement dovetails with broader trends toward personalized, hassle-free travel and strengthens these cruise lines’ competitive edge in the luxury segment.

Safeguarding Passenger Confidence with Full Tracking and Insurance

The service’s fully trackable nature and insurance coverage provide peace of mind to passengers entrusting their belongings to Ship&Play. Transparent logistics updates and guaranteed protection lower barriers for those hesitant about shipping luggage, highlighting the company’s commitment to quality and safety. This reliability complements the overall cruise experience, where attention to detail and guest care are paramount.

Future Outlook: Elevating Cruise Journeys Through Innovational Partnerships

The Ship&Play partnership with Azamara, Emerald, and Scenic illustrates a growing trend of integrating tech-driven concierge services into the luxury cruise market. Such collaborations are expected to expand in coming years, as cruise lines seek innovative ways to streamline journeys and heighten guest satisfaction. Detangling traditional pain points like luggage management meets evolving traveler expectations and promotes sustainable tourism by potentially reducing airport congestion and transportation logistics.

Ship&Play Set to Revolutionize Luggage Handling on Luxury Cruises

The launch of Ship&Play’s luggage shipping service aboard Azamara, Emerald, and Scenic cruises marks a transformative advancement in cruise travel convenience starting fall 2025. By enabling passengers to ship bags directly from home to cruise suites and back, the companies create a frictionless travel experience that fits seamlessly with their luxury offerings. This service not only enhances guest comfort but also amplifies the tourism appeal of the diverse destinations visited by these cruise lines, fostering greater satisfaction and confidence in upscale cruise holidays globally.

Image Credit: Scenic

The post Azamara, Emerald, and Scenic Cruises Enhance Luxury Travel with Ship&Play Luggage Shipping Service: What You Need to Know appeared first on Travel And Tour World.

Crypto Analyst Shows The Possibility Of The Ethereum Price Reaching $16,000

Ethereum’s bullish momentum has intensified throughout the weekend, with the price climbing above $4,100. This steady recovery follows a strong rebound from the $3,500 region after a crash earlier in the month. 

Investor sentiment, as shown by trading volume and flows on exchanges, has turned optimistic amidst the recovery. Now that Ethereum’s price action is starting to turn bullish again, a new technical analysis shared by crypto analyst Freedomby40 on the social media platform X suggests that the current rally could be far from over, projecting a possible long-term climb to $16,000.

Wave Count Structure Points To A Continuation Phase

Freedomby40’s analysis, which is based on the Elliott Wave structure, presents Ethereum as currently positioned in an extended bullish sequence that began forming in late 2022. Posting the technical analysis on X, the analyst noted that Ethereum’s price action looks great for a continuation. 

His chart shows that the asset has just completed a corrective phase and is entering a renewed impulse wave, with support established between $3,225 and $3,563 at the 0.5 and 0.382 Fibonacci retracement zones, respectively. The analyst labels this zone as the ideal accumulation area for the next leg up, consistent with previous cycle structures seen in 2017 and 2021.

The Elliott Wave projection in his analysis presents a multi-layered confluence of impulse waves extending to the third degree. It illustrates that Ethereum is currently unfolding its fifth major impulse wave in a structure that traces back to mid-2022. 

The internal structure of this wave sequence also reveals a C wave in motion, which itself contains smaller sub-impulse waves. Within that C wave, Ethereum appears to be entering its own fifth sub-wave, which is known to be a decisively bullish wave.

Ethereum

Based on this setup, the analyst outlined two potential target zones on the chart: a green box representing the realistic price range for this wave cycle and a red box depicting the higher, more extended scenario that could push Ethereum’s market cap into the trillion-dollar level.

Fibonacci Extensions Predict Targets Of $9,000, $11,000, And $16,000

Freedomby40’s analysis identifies multiple price levels based on Fibonacci extensions from the current price action. The first price target is at $6,303, which is based on the 1.0 Fibonacci extension. This initial price target will see the Ethereum price break above its current all-time high, but this is the first of many.

The next target, the 1.236 extension, is positioned around $9,013. These two price targets ($6,303 and $9,013) were described by the analyst as very realistic. Possible extensions are at the 1.382 and 1.618 Fibonacci extension levels, corresponding to $11,210 and $16,077, respectively.

At the time of writing, Ethereum is trading at $4,160, up by 5.2% in the past 24 hours. Freedomby40’s outlook joins a growing list of ultra-bullish Ethereum price forecasts from institutional research desks and top analysts. Standard Chartered Bank recently raised its 2025 price target for Ethereum to $7,500, while projecting a potential long-term path to $25,000 by 2028.

Ethereum

Pundit Says XRP Price Risks Crash Below $1, Here’s Why

Crypto analyst Bobby A is warning that the XRP price may face trouble soon. He says the large monthly chart is showing weak signs, and this could mean the market is turning bearish again. The analyst thinks the price might need to drop further before it can move higher. 

Bearish Signals Showing On The XRP Price Monthly Chart

Bobby A says the big XRP chart does not look healthy right now. He explains that many important monthly indicators are crossing bearishly. He says XRP is trading below the 1.618 level, and the price action there looks like a rejection rather than a breakout. He thinks this rejection is happening at a terrible time for XRP, noting that the monthly candle is closing near the BMSB line, another dangerous sign for the price.

XRP Price

Bobby A reminds traders that when the Bressert indicator crosses bearish on the monthly chart, history shows it has never been good for XRP. He believes that history could repeat itself, and these bearish signals are evident on the chart right now, suggesting the mid-term trend may not be strong. His analysis says that in six days, XRP will be facing the monthly candle close again, and facing it while price action is weak is usually not a good sign. He is worried because the chart’s overall structure shows more weakness than strength at this time.

He explains that when a chart shows this kind of technical damage, the smart move is to stay alert. He says traders must focus on risk control during times when the big charts start to flash warning signs. He shares this because he has trusted his chart study before when XRP was under $0.30, and now he needs to trust what he sees again with XRP above $2. He says the market can change very fast, and traders must be ready for those changes.

XRP May Drop To Lower Support Before Moving Up Again

Right now, XRP is already making a small move downward. Bobby A says this retracement is happening in real time. He warns that XRP could roll over again and retest lower price support levels. If this happens, the token price could fall under $1 to find more substantial support before it tries to recover. He believes there is a real and present risk that the price will crash below $1 if sellers keep pushing it down.

He advises traders to protect their money and manage their trades carefully. He says capital safety must come first in times like these. Even though he still believes in XRP’s long-term future and remains a strong supporter of the project, he feels the odds right now point to lower prices in the mid-term. He says this is because the latest market signs are not strong enough to support a big bullish move yet.

XRP price chart from Tradingview.com

Bitcoin Closes at $114,530 Amid FOMC Volatility: Bulls Eye $117,600 Resistance

Bitcoin Magazine

Bitcoin Closes at $114,530 Amid FOMC Volatility: Bulls Eye $117,600 Resistance

Bitcoin Price Weekly Outlook

Bitcoin’s price action was rather subdued last week, keeping traders guessing whether or not we would see another large drop in price entering the weekend. Price held above the lows, however, slowly plodding a little bit higher to close out the week at $114,530. Bulls should not be overly disappointed with this price action, as they did reclaim the $112,200 resistance level, and are now closing in on conquering the next resistance level at $115,500. The bears are still sitting comfortably in control, though, with stronger resistance levels hanging overhead that the bulls have yet to challenge. This may be an interesting and volatile week ahead, with the FOMC meeting on Wednesday and a slough of large companies reporting third-quarter earnings.

Bitcoin Holds $114,530 Amid FOMC Volatility: Bulls Eye $117,600 Resistance

Key Support and Resistance Levels Now

Nothing has materially changed from last week’s resistance levels as the bulls have made little progress. Heavy resistance is still sitting at $117,600 and $122,000 above there, so the bears aren’t feeling any real pressure yet. If by chance this week gets above $122,000, we will look to the upper boundary of our broadening wedge pattern at $128,000.

Holding above the prior week’s low is a positive sign for the bulls, while they managed to maintain price above the key short-term support of $106,900 last week as well. This level must hold going forward, as closing below $106,900 opens the door back down to the $105,000 to $102,000 support zone that has already been tested twice. A third test of this support zone would be more likely to break it than to hold it. $96,000 is the long-term bull market support below here, a do-or-die support level if the price were to slide down and test it.

Bitcoin Holds $114,530 Amid FOMC Volatility: Bulls Eye $117,600 Resistance

Outlook For This Week

Expect significant volatility this week, especially on Wednesday, as we have the Federal Reserve’s interest rate decision and ensuing Powell speech, followed by major earnings reports from Microsoft, Meta, and Google after market close. Bulls will look to hold $109,000 as a floor into this week, as doing so would position them to maintain upward momentum. Looking at the Momentum Reversal Indicator, we are currently sitting on an 8-count entering Monday. This is a warning candle that we may see momentum begin to fade. Tuesday should bring the 9-count at which point we should expect at least a pause on upward momentum and a 1 to 4 day correction in price. So if bulls can push price up to the 0.618 Fibonacci Retracement at $117,600 by Monday night or Tuesday morning, we should expect to see a rejection ther,e and we can re-assess after Wednesday’s FOMC and earnings reports play out.

Bitcoin Holds $114,530 Amid FOMC Volatility: Bulls Eye $117,600 Resistance

Market mood: Bearish – While the bulls gained some ground last week, the bears remain stoic and strong. The bulls must push the price past $122,000 to take back control.

The next few weeks
If bulls can manage to survive through this week, there are still some potential headwinds on the horizon. The US-China tariff dispute may or may not be resolved by the end of next week; a negative outcome will likely send all markets lower. Additionally, the US courts’ ruling on the legality of Trump’s tariffs is expected by November 5th. If these tariffs are reinstated, we should expect markets to head lower to price this impact in.

Terminology Guide:

Bulls/Bullish: Buyers or investors expecting the price to go higher.

Bears/Bearish: Sellers or investors expecting the price to go lower.

Support or support level: A level at which the price should hold for the asset, at least initially. The more touches on support, the weaker it gets and the more likely it is to fail to hold the price.

Resistance or resistance level: Opposite of support.  The level that is likely to reject the price, at least initially. The more touches at resistance, the weaker it gets and the more likely it is to fail to hold back the price.

Fibonacci Retracements and Extensions: Ratios based on what is known as the golden ratio, a universal ratio pertaining to growth and decay cycles in nature. The golden ratio is based on the constants Phi (1.618) and phi (0.618).

Broadening Wedge: A chart pattern consisting of an upper trend line acting as resistance and a lower trend line acting as support. These trend lines must diverge away from each other in order to validate the pattern. This pattern is a result of expanding price volatility, typically resulting in higher highs and lower lows.

Momentum Reversal Indicator (MRI): A proprietary indicator created by Tone Vays. The MRI indicator tracks buyer and seller momentum and exhaustion, providing signals to indicate when to expect momentum to fade and accelerate.

This post Bitcoin Closes at $114,530 Amid FOMC Volatility: Bulls Eye $117,600 Resistance first appeared on Bitcoin Magazine and is written by Ethan Greene - Feral Analysis and Juan Galt.

Trump-Backed American Bitcoin Adds 1,414 Bitcoin Amid U.S. Expansion

Bitcoin Magazine

Trump-Backed American Bitcoin Adds 1,414 Bitcoin Amid U.S. Expansion

American Bitcoin Corp. (Nasdaq: ABTC), a Trump family–backed mining platform, has expanded its Bitcoin holdings to 3,865 bitcoin, adding 1,414 bitcoin since September through a combination of mining production and secondary market purchases.

The Miami-based firm, which describes itself as “America’s Bitcoin infrastructure backbone,” said the latest accumulation includes coins held in custody and those pledged for miner purchases under its ongoing procurement deal with Bitmain. 

The update continues a rapid expansion trajectory that began earlier this year when Hut 8 spun out its U.S. mining arm as a separate, publicly traded entity.

American Bitcoin initially held around 500 BTC at the time of the carve-out, then purchased another 1,726 BTC between July and August for approximately $205 million. 

Those holdings were pledged to Bitmain as collateral for a $314 million order of 16,299 Antminer U3S21EXPH units — nearly the full 15 EH/s option under the companies’ strategic supply agreement. Most of those machines will be hosted at Hut 8’s new Vega site in Texas, a 400-megawatt facility central to American Bitcoin’s push toward 25 EH/s of proprietary hashrate.

“We believe one of the most important measures of success for a Bitcoin accumulation platform is how much Bitcoin backs each share,” said Eric Trump, co-founder and chief strategy officer. “As part of that conviction, we are focused on providing transparent updates as we aim to increase our holdings.”

JUST IN: 🇺🇸 Trump Family-backed BTC miner American Bitcoin acquires 1,414 Bitcoin.

They now hold 3,865 Bitcoin 🙌 pic.twitter.com/21dgPKboOG

— Bitcoin Magazine (@BitcoinMagazine) October 27, 2025

Executive Chairman Asher Genoot added that American Bitcoin’s integrated mining model allows it to lower its average cost per Bitcoin compared with treasury-style vehicles that buy on the open market. 

“That structural advantage allows us to compound Bitcoin value per share more efficiently for our investors,” he said.

Shares of ABTC have been volatile since their September debut, rising 11% on Friday to close at $5.62 after recovering from midweek lows below $5. 

The company, valued around $5.1 billion, remains one of the most closely watched plays in the sector — both for its aggressive expansion plans and its deep ties to the Trump family.

At the time of writing, the stock is trading at $5.83 and Bitcoin is trading at $115,000 after a couple of tumultuous weeks.  

Gryphon, American Bitcoin merger

Earlier this year, Gryphon Digital Mining merged with American Bitcoin Corp., the Trump family–backed subsidiary of Hut 8, to form what they claim could become the most efficient pure-play Bitcoin miner in the industry. 

The all-stock merger saw Gryphon shareholders own about 2% of the combined entity and American Bitcoin stakeholders hold 98%.

The merger, now finalized, provides American Bitcoin with a faster route to public markets and combines Gryphon’s mining technology with American Bitcoin’s capital strength and large-scale reserve strategy.

This post Trump-Backed American Bitcoin Adds 1,414 Bitcoin Amid U.S. Expansion first appeared on Bitcoin Magazine and is written by Micah Zimmerman.

Bitcoin Price Rebounds Above $115,000 As Strategy Buys 390 More Bitcoin

Bitcoin Magazine

Bitcoin Price Rebounds Above $115,000 As Strategy Buys 390 More Bitcoin

Bitcoin’s price surged above $115,000 on Monday as Strategy, the largest corporate holder of Bitcoin, announced another significant purchase of Bitcoin. The business intelligence firm acquired 390 BTC between October 20 and October 26, spending approximately $43.4 million at an average price of $111,053 per Bitcoin.
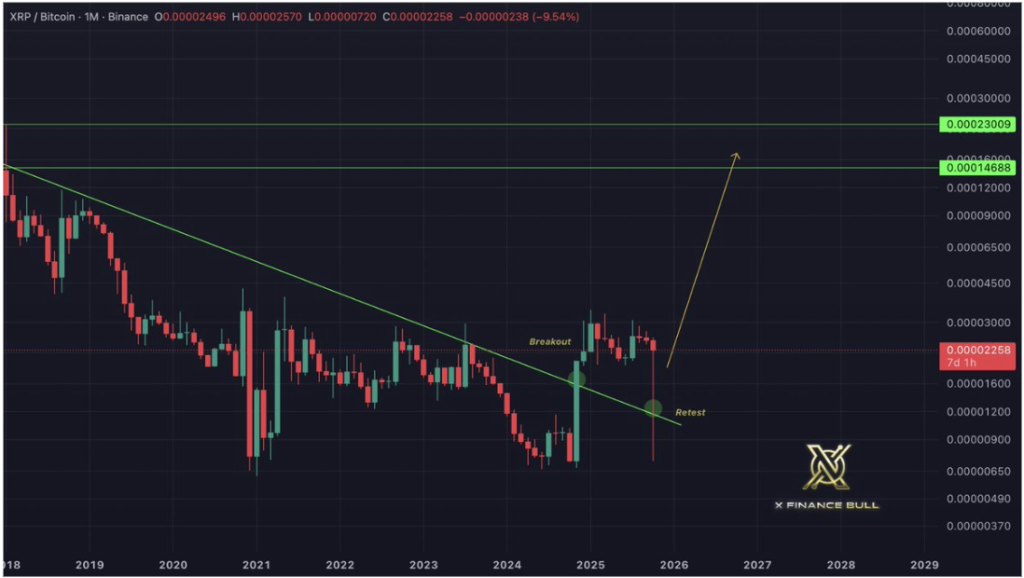
According to a Form 8-K filing released today, Strategy’s total Bitcoin holdings have now reached 640,808 BTC, with an aggregate purchase price of $47.44 billion. The company’s average purchase price stands at $74,032 per Bitcoin, including fees and expenses.

The latest acquisition was funded through proceeds from Strategy’s At-The-Market (ATM) equity programs, specifically through the issuance of preferred shares under its STRF, STRK, and STRD ATM programs. The company raised a combined total of $43.4 million during the period to finance these purchases.

The announcement comes amid a growing trend of companies adopting Bitcoin treasury strategies. Recent data indicates that publicly traded companies now hold over $110 billion worth of Bitcoin, with Strategy alone accounting for approximately $74 billion of that total.

BREAKING: 🇺🇸 STRATEGY BUYS ANOTHER 390 #BITCOIN FOR $43.4 MILLION pic.twitter.com/0pjWpC1Syh

— Bitcoin Magazine (@BitcoinMagazine) October 27, 2025

The emergence of Bitcoin treasury companies has accelerated notably in 2025, with Germany’s aifinyo AG recently announcing plans to accumulate 10,000 BTC by 2027. This follows similar moves by companies across Europe and Asia, signaling a broader institutional acceptance of Bitcoin as a treasury reserve asset.

The Bitcoin treasury model has moved from experimental to established corporate strategy. We’re seeing new companies enter this space almost weekly, recognizing Bitcoin as the ultimate treasury reserve asset.

Bitcoin’s price responded positively to Strategy’s announcement, trading above $115,000 as of press time. Bitcoin has shown strong momentum in recent days, supported by growing institutional adoption and the approaching 2026 halving.

Strategy’s stock (MSTR) has also shown positive movement, rising 3% in pre-market. Recent regulatory developments have further supported the Bitcoin treasury trend. Strategy recently received favorable guidance from the IRS and Treasury regarding the treatment of unrealized crypto gains in Corporate Alternative Minimum Tax (CAMT) calculations, eliminating concerns about potential tax liabilities for long-term Bitcoin holdings.

As more companies adopt Bitcoin treasury strategies and regulatory frameworks become clearer, the trend appears poised to continue. With Strategy leading the way and new entrants like aifinyo AG joining the space, corporate Bitcoin adoption is increasingly becoming a global phenomenon, spanning various industries and regions.

This post Bitcoin Price Rebounds Above $115,000 As Strategy Buys 390 More Bitcoin first appeared on Bitcoin Magazine and is written by Vivek Sen.

The Battlefield 6 F2P Battle Royale Mode Is Called Battlefield REDSEC and Launches Tomorrow

Battlefield 6 key art with text in white against bright orange background showing military soldier and jets silhouetted.

The Battlefield 6 battle royale mode has finally been revealed and will officially be called Battlefield REDSEC. As rumoured, it'll launch tomorrow, and it'll be free-to-play. EA and Battlefield Studios revealed the mode with a short post on the official Battlefield X (formerly Twitter) account, which included a link to a gameplay trailer that'll go live tomorrow, alongside the mode itself going live. We'll have more official knowledge on the mode tomorrow when the gameplay trailer goes live, which will likely be followed by a blog post on the Battlefield 6 website, though for now we do have other claims […]

Read full article at https://wccftech.com/battlefield-6-battle-royale-battlefield-redsec-launches-tomorrow/

City Fines Homeowner $300,000 After Using Drone to Spot Illegal Fireworks

Aerial view of a residential neighborhood at night with fireworks shooting up from the street, illuminating houses and trees while city lights glow in the background.

A week after Fourth of July celebrations, PetaPixel reported that multiple California police departments had used drones to surveil and spot people illegally shooting off fireworks. Promised fines have been rolling out since, including a new $300,000 one levied against an Orange County homeowner who claims they were not even home on July 4.

[Read More]

Shiba Inu Looks Weak—But Hides A 2,000% End-Cycle Breakout: Analyst

Popular technician Charting Guy (@ChartingGuy) calls Shiba Inu “weak and choppy” and suggests the token may not break out until late in the current crypto cycle. Sharing a weekly Shiba Inu chart, he wrote on Oct. 26, 2025: “SHIB has been weak and choppy all cycle. Won’t do anything until the end imo.”

How High Can Shiba Inu Price Go?

The below TradingView chart is a weekly SHIB/USD study anchored to a Fibonacci ladder. The price marker on the right rail reads $0.000010205, placing SHIB fractionally below the 0.236 retracement band annotated at $0.000011043.

Above that, the chart maps successive overhead levels at 0.382 near $0.000016434, 0.5 around $0.000022661, 0.618 near $0.000031247 and 0.786 at about $0.000049369. The red 1 line flags $0.000088410, with higher extension markers plotted at 1.272 ≈ $0.000185406, 1.414 ≈ $0.000272917 and a terminal 1.618 ≈ $0.000475605.

Shiba Inu price prediction

A stylized projection trace on the chart depicts a late-cycle, near-vertical advance that only materializes after a prolonged base and then stalls inside the 1.0–1.272 cluster before breaking above the 1.272 Fib extension and topping below the 1.414 Fib extension roughly at $0.000022; the path visually reinforces the author’s contention that SHIB underperforms until the “end.”

In a separate post on Oct. 24, Charting Guy ranked market structures across majors and large-cap altcoins, explicitly placing SHIB in his “Bad Looking Charts” bucket while labeling Bitcoin, Ether, XRP, Solana, BNB and Stellar as “Good Looking Charts.” His list read, in part: “Good Looking Charts: BTC, ETH, XRP, SOL, BNB, XLM … Decent Looking Charts: XDC, DOGE, PENGU, ADA, ONDO, SUI, AAVE, LTC … Eh Looking Charts: PEPE, FLOKI, FLR, LINK, BCH … Bad Looking Charts: SHIB, WIF, ETC, AVAX, FET, RENDER, INJ, CRV, ALGO, SOLO, COREUM, NEAR, VET, COMP, DOT, IOTA, FIL, ATOM, And many more.”

What To Expect

The technical message is unambiguous: on a weekly timeframe, SHIB remains capped beneath early Fibonacci thresholds that many chartists treat as momentum gates. Remaining below 0.236 typically signals that price has yet to reclaim even the shallowest retracement of the prior cycle; clearing it often opens room to test the 0.382–0.5 midpoint zone where trends either accelerate or fail.

In Charting Guy’s map, structurally meaningful inflection areas stack tightly from roughly $0.000016 to $0.000031, with the 0.618 level near $0.000031 attributed the role of a trend-confirmation threshold. The cycle-top roadmap he drew concentrates risk and reward into the higher cluster around $0.000088 to $0.000185, a range often watched by Fibonacci practitioners for exhaustion and distribution in late-stage moves. However, a rise to $0.00022 could still mean an incredible upside for SHIB of around 2,055.81%—a roughly 20.56-fold increase.

Contextually, his relative-strength table is just as important as the levels. By grouping SHIB with other “bad looking” structures while upgrading Bitcoin, Ether, XRP, Solana and BNB, he is signaling an expectation that market breadth will remain narrow and quality-led before any speculative rotation into meme-beta like SHIB. That framework aligns with his succinct call that SHIB “won’t do anything until the end,” implying a sequencing view rather than a categorical dismissal.

At press time, SHIB traded at $0.00001046.

Shiba Inu price

Here’s What The XRP Open Interest Reset Means For The Price

Crypto analyst CryptosRus has drawn attention to the open interest reset for XRP. The analyst also explained why this development could spark a major price surge for the altcoin. 

XRP’s Open Interest Drops To New Lows

In an X post, CryptosRus revealed that XRP’s open interest on Binance has dropped back to the same lows that were seen in May 2025. The analyst noted that back then, the liquidation flush sparked a massive rally for the altcoin, which pushed it to $3.50. He added that this time around, the open interest is at the floor again, but the price is holding around $2.6. 

CryptosRus stated that this means that leverage is gone while the strong hands are still holding XRP. The analyst predicted that if new liquidity enters, this setup could signal the next leg up for the altcoin. He added that rallies usually start when leverage is low, spot demand is strong, and shorts are trapped. 

XRP

Notably, XRP has witnessed new demand with the launch of the largest XRP treasury company, Evernorth. The company has already accumulated up to $1 billion in XRP with Ripple’s backing and has revealed plans to continue accumulating more, using gains from its DeFi activities. Notably, the company stated that it will purchase XRP on the open market, which is expected to impact the altcoin’s price. 

Meanwhile, the SEC is expected to approve the spot XRP ETFs once the U.S. government shutdown ends. This could drive new liquidity into the altcoin, boosting its price. Moreover, experts such as Canary Capital’s CEO Steven McClurg have predicted that the XRP ETFs could see more inflows in their first month than the Ethereum ETFs did. 

XRP Is Gearing Up For A ‘Face Melting’ Rally

Crypto analyst Ether stated that XRP is quietly gearing up to melt faces and that most aren’t even aware or ready for what is coming. This came as the analyst alluded to an earlier analysis, in which he revealed that a similar scenario from a previous cycle was playing out for the altcoin. 

Ethere stated that XRP’s cyclical structure is showing a striking similarity again. After the altcoin’s rally in 2017, its price was rejected from the 2013 all-time high (ATH) level and then retested the 2014 ATH level, which had previously acted as resistance. XRP then began its parabolic run after it accumulated strength in that range. 

Now, this same XRP price action is playing out again, according to Ether. He noted that after the strong surge in 2024, the altcoin’s price was rejected at the 2017 ATH level and retested the 2021 ATH level, which had previously acted as resistance. The analyst added that the power accumulation phase is now underway in this region and that once it is complete, the next parabolic run will be inevitable. 

At the time of writing, the XRP price is trading at around $2.63, up in the last 24 hours, according to data from CoinMarketCap.

XRP

Dogecoin Whales Accumulate 15 Million DOGE as Retail Traders Exit the Market

The Dogecoin price shows quiet strength as retail sentiment stays weak. Dormant whales accumulated 15.1 million DOGE, worth about $2.95 million, signaling renewed long-term confidence.

The move contrasts sharply with soft trading activity among small investors. Many retail holders continue to sell into every minor rally, showing limited confidence in short-term gains. The cautious behavior reflects broader market uncertainty and hesitation to buy at current levels.

Whales Reactivate as DOGE Accumulation Rises

On-chain data reveals a steady accumulation of DOGE by high-value wallets. One whale address reactivated after months of dormancy, adding 15.1 million DOGE to its holdings. 

It later sold 7,473 DOGE for about $1,450, leaving 15.19 million DOGE valued near $12.96 million. Analysts view this as a strong signal that institutional or early adopters are positioning ahead of the next market phase.

Dogecoin price
Source: X

While retail traders appear cautious, large wallets are quietly adding exposure. This split in behavior highlights an ongoing tug-of-war between speculative exit and long-term accumulation.

Whale Accumulation Signals Faith

Dormant whale accumulation often precedes renewed confidence among experienced holders. These “smart money” actors typically buy when the Dogecoin price trades near historical support zones. Their activity indicates belief in a medium- to long-term recovery, even when short-term metrics appear bearish.

Also Read: Thumzup Media to Accept Dogecoin Payments for Creators in Major Crypto Integration

Whale wallets moving after long silence also suggest that value recognition is returning to the meme-coin sector. Despite a weak broader market, their actions may mark early groundwork for the next uptrend.

Weak Retail Sentiment Persists

Despite whale optimism, retail traders are doing the opposite. CryptoQuant data shows that the Spot Taker CVD remained negative through October, signaling sustained selling pressure. This metric reveals that most traders continue to execute aggressive sell orders rather than buy into dips.

Dogecoin Whale
SourceL CryptoQuant

Supporting this, Coinalyze data reports a persistent negative Buy–Sell Delta. Over the past 30 days, Dogecoin recorded 156.67 million in sell volume versus 154.88 million in buy volume — a net negative of 1.79 million DOGE. This imbalance confirms that retail enthusiasm has yet to return.

DOGE News
Source: Coinalyze

Technical Setup Remains Bearish

The DOGE USD price is still hovering below the main moving averages. It is bellow the 20,50,100 and 200 EMA lines which are pointing down. The Directional Movement Index supports this view, as the Positive Index is very close to 12 and the Negative was near 39.

Month Minimum Price Average Price Maximum Price Potential ROI
October $0.192 $0.195 $0.198
-2.6%
November $0.224 $0.237 $0.250
23%
December $0.225 $0.232 $0.238
17.1%

Buyers need to break more than $0.20 (20 EMA level) for the Dogecoin price trend to become bullish. A follow-through recovery back above the 50–100 EMA zone. 

DOGE price analysis
Source: TradingView

Around $0.21 is likely to pave the way for an extension of the up-move towards the $0.22 intermediate hurdle in the near-term. If it does not, the price can remain range-bound between $0.17 and $0.20 for an extended period.

Market Momentum Building Slowly

Despite the present soft performance, Dogecoin price exhibits superior resilience when compared to larger altcoins. It was up more than 2% this week compared with the CD5 index. Trading volume was 9.8% above the seven-day average, a sign of institutional participation.

The pattern suggests “early-cycle momentum building,” says market strategist Rishi Patel of Bluepool Digital. “DOGE’s resilience while Bitcoin and Ethereum consolidate suggests rotation flows are returning to higher-beta assets,” Patel said.

Chart Indicators Show Stability

Technical charts indicate that dogecoin is supported by an uptrendline, drawn from $0.1949 low on the hourly chart. Steady re-tests at $0.2060–$0.2070 support indicate buyers remain in the market daily. RSI is sitting at around 58 on the 4-hour — just like you’d expect early in a trend.

The MACD indicator remains in the positive area but starts to narrow, indicating light consolidation following an attempt to break out. This action suggests re-accumulation, not exhaustion, analysts said. The bias remains bullish with sustained closes above $0.2085.

What Lies Ahead for Dogecoin Price

But if buyers take over, Dogecoin price may rise towards $0.22 and then at the end of this week or next, to $0.25 ahead of new conditions next month. But an inability to take out the resistance levels may extend sluggishness. 

Although most long-term holders still talk about DOGE as a speculative — yet resiliently decentralized– digital asset. Its strong community and growing whale interest keeps its story running even in slow markets.

Conclusion

The Dogecoin price narrative today is emblematic of the quiet confidence beneath the surface. Whales that were previously dormant are accruing millions, while retail traders are even hopping out.

Technicals are still cautious, momentum indicates slow-building recovery. If DOGE can break above $0.20 and maintain, that will signify its next leg. For the time being, the whales seemed to be gambling that patience would pay.

Also Read: Dogecoin Price Calm May End Soon as Analysts Eye $0.5 Breakout

Appendix: Glossary of Key Terms

Whale: A name for someone holding a large quantity of cryptocurrency who is able to manipulate the market.

Dormant Wallet: A cryptocurrency or blockchain wallet that has gone dormant, and is either empty or contains an insignificant sum of cryptocurrency.

On-Chain Data: Information written to a blockchain itself, which can be utilized to track wallet movements, transactions and the general health of network.

Retail Traders: Small, individual investors usually trading in small quantities who generally follow the short-term market favourite.

Spot Taker CVD: A measure of trading that compares volumes of buying and selling in the spot market, with negative values indicating pressure to sell.

Frequently Asked Questions About Dogecoin Price

1- Is the Dogecoin price bullish or bearish?

Short-term signals remain bearish, but whale accumulation hints at early bullish positioning.

2- Why are whales buying Dogecoin?

Dormant wallets suggest long-term investors see value at current levels and expect gradual recovery.

3- What price levels should traders watch?

Key resistance sits at $0.20 and $0.21. A breakout above $0.2085 could confirm new upside momentum.

4- Are retail traders supporting the move?

Not yet. Retail sentiment remains weak, with net selling pressure persisting for most of October.

Read More: Dogecoin Whales Accumulate 15 Million DOGE as Retail Traders Exit the Market">Dogecoin Whales Accumulate 15 Million DOGE as Retail Traders Exit the Market

Dogecoin Whales Accumulate 15 Million DOGE as Retail Traders Exit the Market

Ethereum price forecast: ETH eyes $4,500 amid bullish momentum

Key takeaways

  • ETH is up 5.5% in the last 24 hours and is now trading above $4,100.
  • The coin could rally towards the $4,500 resistance level soon.

Ether hits $4,200 as the bullish trend returns

Ether, the second-largest cryptocurrency by market cap, is up by more than 5% in the last 24 hours. The rally allowed the coin to briefly hit the $4,200 level before retracing to now trade at around $4,160 per coin.

This latest development comes as Bitcoin and the broader cryptocurrency market recorded an excellent weekend. Bitcoin is trading above $115k once again after adding 3.5% to its value.

With Bitcoin, Ether, and other leading altcoins recording gains, the total cryptocurrency market cap now stands at $3.91 trillion. Ether could rally higher in the near term, with the technical indicators suggesting further buying pressure. 

Ethereum could surge to $4,500 amid bullish indicators

The ETH/USD 4-hour chart is bearish and efficient despite Ether adding 5% to its value in the last 24 hours. The technical indicators suggest that Ether could face further buying pressure thanks to its rally. 

Ether’s price surged by 5% last week, closing the weekly candle above the 50-day EMA at $4,129 on Sunday. It briefly climbed to $4,206 on Monday before retracing to now trading around $4,160. 

ETH/USD 4H Chart

The RSI of 67 shows a bullish momentum, with the MACD lines flashing a buying signal in the last few days. If Ether breaks and closes above its daily resistance of $4,232, it could continue its rally towards the next major resistance and TLQ level at $4,529. An extended bullish run could allow Ether to reclaim its recent high above $4,700. 

However, if Ether faces a correction following its recent run, it could dip towards the major support level at $3,593.

The post Ethereum price forecast: ETH eyes $4,500 amid bullish momentum appeared first on CoinJournal.

Lord Holmes expounds ‘extraordinary potential’ of blockchain

Lord Christopher Holmes spoke of the “extraordinary potential” of blockchain to transform public services on Day 2 of the London Blockchain Conference.

The post Lord Holmes expounds ‘extraordinary potential’ of blockchain appeared first on CoinGeek.

Dogecoin Is Waking Up: 4 Bullish Signals You Can’t Ignore

The Dogecoin weekly chart is flashing a cluster of technically constructive signals, according to crypto analyst Cantonese Cat (@cantonmeow), who published a four-panel weekly read on DOGE on Oct. 27. Price is currently hovering near $0.208 on Binance spot, and the setup he highlights pivots on four independent checks: the cycle-high anchored VWAP, Ichimoku “Katana” support, a 0.5 log-scale Fibonacci hold, and conspicuously light sell-side volume during the recent drawdown.

4 Reason To Be Bullish On Dogecoin

In his post, Cantonese Cat wrote: “Attempting to reclaim cycle high AVWAP as support. Claiming Ichimoku Tenkan + Kijun fusion (blue and red lines fused together), AKA Katana, as support so far. Holding 0.5 log fib from cycle high–cycle low as support so far. There’s been no volume so far during this downturn on multiple exchanges including Coinbase and Binance, and all it takes is just some volume to come in and we could reverse any downtrend in a hurry.”

On the anchored VWAP chart, the teal line measured from Dogecoin’s cycle peak tracks the market’s volume-weighted cost basis since the 2021 top. DOGE is pressing that band from above/at parity, attempting to convert it into support after a failed breakdown earlier this month.

On a weekly basis, closing and subsequently holding above the cycle-high AVWAP tilts risk-reward positively because it implies the marginal participant who bought since the peak is no longer underwater. Notably, the most recent weekly wick that probed below the band—printing a sharp stab toward the low-$0.09s—was retraced swiftly, with subsequent candles clustering back around ~$0.21. That rejection of lower prices right at the anchored VWAP argues against sustained distribution at current levels.

Dogecoin VWAP

The Ichimoku frame reinforces the same idea. Tenkan-sen and Kijun-sen are fused around ~$0.2009 on the weekly (a configuration the analyst labels “Katana”), and price is currently riding that confluence as support. The cloud (Senkou span) remains red and overhead, spanning roughly the $0.24s into the ~$0.29 region, which defines the near-term supply zone that would need to be cleared on a weekly close to confirm trend resumption.

Until then, the Katana acting as a shelf at ~$0.20 is the near line in the sand; lose it decisively and the bias flips back to testing deeper supports, but sustain it and the path of least resistance shifts to re-engaging the cloud’s lower boundary.

Dogecoin Ichimoku cloud analysis

Fibonacci context adds precision to those levels. Measured log-scale from the cycle high to the cycle low, DOGE has so far defended the 0.5 retracement at $0.19070 on multiple weekly closes.

That 50% line is the pivot of the current structure: a confirmed weekly close and acceptance below would hand momentum to bears toward the 0.382 at $0.13847, while continued defense keeps the market pointed at successive retracement ceilings overhead—the 0.618 at $0.26261, the 0.707 at $0.33430, the 0.786 at $0.41416, and the 0.886 at $0.54318—before the full retrace to the cycle high marker around $0.73995.

Dogecoin Fibonacci analysis

Price has been oscillating in a broad $0.16–$0.27 corridor for months; sitting above the 0.5 while probing the AVWAP strengthens the case that the mid-$0.20s could be revisited if buyers can reclaim momentum.

Volume is the wild card—and the fourth reason the analyst cites for optimism. The weekly histogram across multiple years shows that persistent selloffs have been accompanied by contracting volume, with downward arrows on the chart denoting successive periods of declining activity into lows.

By contrast, the last major impulsive advance in late 2024 printed the cycle’s heaviest weekly turnover. The current downturn lacks that distribution signature; bins on Coinbase and Binance have thinned rather than expanded. In market-structure terms, falling volume on pullbacks is textbook corrective behavior, and it leaves the door open for a sharp reversal if/when demand returns.

Dogecoin volume trend analysis

Put together, the four lenses describe a market sitting on top of a stacked support cluster: the cycle-high AVWAP roughly at the current price, the Ichimoku Katana fused near ~$0.2009, and the 0.5 log Fibonacci at $0.19070 just below. The invalidation path is clear enough—a decisive weekly loss of the $0.19 handle would expose the $0.13847 (0.382) shelf—while the upside path is equally mapped: first reclaim the lower edge of the cloud in the low-$0.20s, then test $0.26261 (0.618), with any weekly close through that level shifting focus to $0.33430 and beyond.

At press time, DOGE traded at $0.206.

Dogecoin price

100% Of Bitcoin Bull Market Peak Indicators Remain Untouched, Is There Still Room To Run?

Over the years, a number of indicators have emerged that have often helped to pinpoint the Bitcoin bull market peak. These indicators have been triggered in previous cycles, and their triggers have often been a signal that it was time to get out of the market, as a new bear market is underway. However, this time around, even with the Bitcoin price hitting multiple new all-time highs, none of these cycle peak indicators have been triggered, suggesting that the market top has yet to be reached.

0 Out Of 30 Bull Market Peak Indicators Triggered

The Bull Market Peak Indicator tracker on the Coinglass website follows a total of 30 indicators that follow 30 indicators that show the progress of the Bitcoin bull market toward reaching a top. Some major ones include the Bitcoin Bubble Index, the Puell Multiple, the Bitcoin Rainbow Chart, and the Altcoin Season Index, among others.

Usually, these indicators are tracked on a scale of 0-100%, with 0% meaning that it is far from being triggered and 100% showing that an indicator has been triggered. If only a few of these get to the 100% mark and are triggered, it usually doesn’t mean that the Bitcoin peak has been reached.

However, even now, not one of these indicators has been triggered. Most continue to remain quite low, while the likes of the Bitcoin dominance are high, but still have not been triggered. For there to be a definite progress toward the Bitcoin market peak, at least half of these would have to be triggered.

Bitcoin bull market peak indicator 1

What This Means For Investors

Since none of the bull market peak indicators have been triggered, it means that the Bitcoin price might actually be far away from its all-time high. With the score still being 0 out of 30, it points to this being a time to hold, despite the declines that the market has suffered recently.

According to a previous report from Bitcoinist, this was the case a few months ago, and now two months later, the tracker remains the same. Thus, it could be that $126,000 is not the all-time high for Bitcoin, and that the market could end up getting an altcoin season after all.

In the case that more than half of the bull market peak indicators do get triggered, then it means that the top of the market is getting close. Once it gets to 30/30, then it signals the start of the next bear market, and this is when selling is at its highest in the market, leading to rapid price declines across the board.

Bitcoin price chart from Tradingview.com

Bitcoin Accelerates Higher As Bulls Target Break Above $115,500 Resistance

Bitcoin price is attempting to recover above $113,500. BTC could rise further if there is a clear move above the $115,500 resistance.

  • Bitcoin started a fresh recovery wave above the $113,500 resistance level.
  • The price is trading above $114,000 and the 100 hourly Simple moving average.
  • There is a bullish trend line forming with support at $113,350 on the hourly chart of the BTC/USD pair (data feed from Kraken).
  • The pair might continue to move up if it trades above the $115,500 zone.

Bitcoin Price Starts Fresh Increase

Bitcoin price declined again below the $108,000 level. BTC tested the $106,720 zone and recently started a fresh increase. There was a move above the $112,000 resistance level.

The bulls were able to pump the price above $113,500 and the 100 hourly Simple moving average. Finally, the price spiked above $115,000 and is currently consolidating gains above the 23.6% Fib retracement level of the recent wave from the $106,718 swing low to the $115,400 high.

Besides, there is a bullish trend line forming with support at $113,350 on the hourly chart of the BTC/USD pair. Bitcoin is now trading above $114,000 and the 100 hourly Simple moving average.

Bitcoin Price

Immediate resistance on the upside is near the $115,250 level. The first key resistance is near the $115,500 level. The next resistance could be $116,200. A close above the $116,200 resistance might send the price further higher. In the stated case, the price could rise and test the $117,000 resistance. Any more gains might send the price toward the $118,000 level. The next barrier for the bulls could be $118,800.

Another Pullback In BTC?

If Bitcoin fails to rise above the $115,500 resistance zone, it could start a fresh decline. Immediate support is near the $114,000 level. The first major support is near the $113,500 level or the trend line.

The next support is now near the $111,000 zone. Any more losses might send the price toward the $110,500 support in the near term. The main support sits at $108,500, below which BTC might struggle to recover in the short term.

Technical indicators:

Hourly MACD – The MACD is now gaining pace in the bullish zone.

Hourly RSI (Relative Strength Index) – The RSI for BTC/USD is now above the 50 level.

Major Support Levels – $114,000, followed by $113,500.

Major Resistance Levels – $115,500 and $116,500.

XRP/BTC Retests Six-Year Breakout Trendline, Analyst Calls For A Decoupling

The XRP/BTC monthly chart has finally snapped the long diagonal that’s capped XRP since 2018, and one analyst on X thinks that shift could rewrite the pecking order. Posting under the handle X Finance Bull (XFB), the analyst argued that XRP will soon start to outperform Bitcoin. 
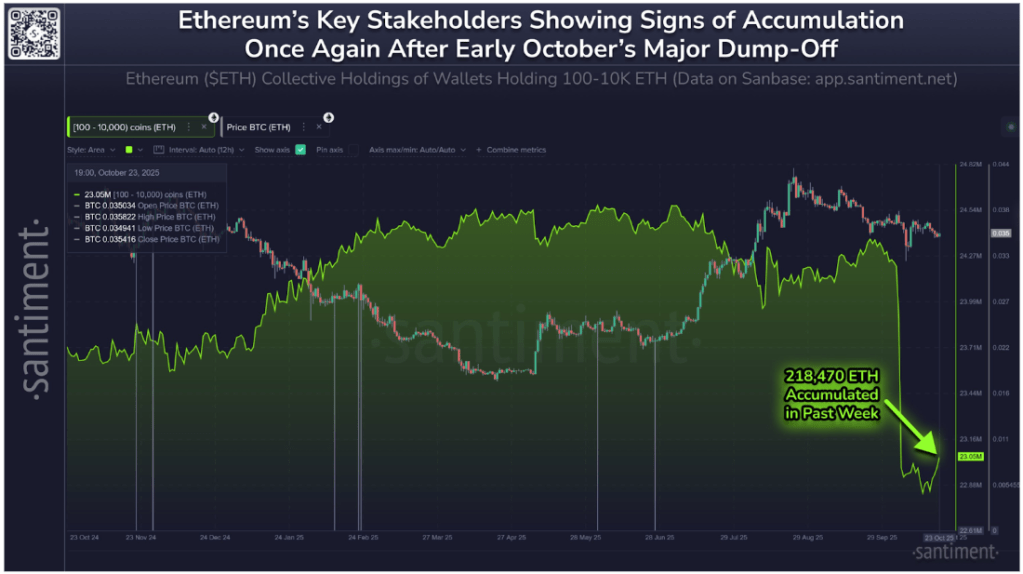
This is because the XRP/BTC pair has not only broken out but also retested the trendline as support, and this has certified the start of a new buildup of momentum.

Retest Of A Six-Year Breakout Trendline

The mid-October flash crash that rippled through the crypto market left a visible mark on the XRP/BTC chart, creating a deep downward wick that momentarily dipped below the long-standing resistance trendline. However, as Bitcoin started to recover to above $110,000, XRP struggled to keep up and lost ground relative to Bitcoin. 

Interestingly, price action shows that this move was short-lived, and XRP has started to recover against Bitcoin in recent trading sessions. As shown on the monthly candlestick timeframe chart below, the wick fell to the exact level of the breakout retest, a point where former resistance turned into new support.

This breakout occurred in late 2024/early 2025, when XRP outperformed Bitcoin for three consecutive months. From there, the XRP/Bitcoin pair was able to break out of a downward-sloping resistance trendline of lower highs spanning over six years. 

Since then, however, 2025 has been characterized by more months of Bitcoin outperforming XRP than months of XRP outperforming Bitcoin, with October falling into the former group of months. Particularly, during the flash crash, the XRP/BTC pair plunged to around 0.000007 before rebounding almost immediately, a move that, according to XFB, represents the long-awaited retest of the broken trendline.

XRP/Bitcoin 1M chart. Source: @Xfinancebull

Since that retest, XRP has recovered impressively, with the pair maintaining a monthly close above the diagonal that once acted as a ceiling. This technical confirmation signals the completion of the breakout from the 2018 to 2024 downtrend that had defined XRP’s multi-year underperformance against Bitcoin. The monthly structure is now displaying the early signs of an upward shift, with the pair trading around 0.00002258 BTC.

XRP To Decouple And Outperform Bitcoin?

According to the analyst, XRP is about to undergo a rally that massively outperforms Bitcoin and melts the face of many Bitcoin maximalists. XFB’s chart outlines two target zones ahead for XRP: 0.00014688 BTC and 0.00023009 BTC. The first target corresponds to the consolidation area seen between 2018 and 2019, while the second represents a major resistance cluster from the earlier phase of XRP’s creation. If XRP/BTC rallies to those levels, it would amount to approximately a 6x and 10x gain relative to Bitcoin, respectively.

The analyst also connects the technical setup to Ripple’s growing institutional ecosystem. He pointed to Ripple Prime, GTreasury, Metaco, Standard Custody, and Rail as part of the infrastructure that’s setting up XRP as a bridge asset for global finance. These partnerships give XRP an edge heading into the coming months, as it moves into real institutional utility and starts outperforming Bitcoin.

If these developments continue, the incoming decoupling of the XRP/BTC pair could become one of the most significant events for XRP. At the time of writing, XRP is trading at $3.63, up by 3.5% in the past 24 hours.

Featured image from Unsplash, chart from TradingView

Ethereum Whales Start Buying Back: 218K ETH Added In A Week After October Dump

Ethereum’s largest non-exchange holders are tiptoeing back into accumulation. On-chain analytics platform Santiment reported that wallets holding between 100 and 10,000 ETH, also known as whales and sharks, have begun to rebuild positions after unloading roughly 1.36 million ETH between October 5 and 16. 

Notably, the Ethereum collective holdings chart shows that nearly one-sixth of those coins have already been clawed back, as some confidence starts to return to the second-largest crypto asset.

Whales Reverse Course After Early-October Capitulation

The first half of October was highlighted by one of Ethereum’s most pronounced periods of capitulation this year. Macroeconomic fears due to US tariffs saw the Bitcoin price undergo a flash crash that dragged many altcoins to the downside. During this move, Ethereum’s price also fell very quickly, dropping from highs around $4,740 on October 7 to as low as $3,680 on October 11. 

Interestingly, on-chain data shows that the selling pressure from large holders amplified this move, as the chart from Santiment shows a steep decline in their cumulative holdings from about 24.5 million ETH to roughly 22.6 million ETH. This 1.9 million ETH drop reflected clear risk-off behavior among whales and sharks, who had been net buyers since August.

However, once selling momentum began to fade, accumulation started to return. Institutional inflows started to return into Spot Ethereum ETFs, and whale/shark trades started accumulating Ethereum. Since October 16, the same cohort that contributed to the liquidation has begun adding back to their positions. Santiment noted that these holders are finally showing some signs of confidence, demonstrating an incoming extended recovery phase following the shakeout.

218,470 ETH Added In Last 7 Days

According to Santiment’s data, the collective holdings of addresses with 100 to 10,000 ETH have rebounded to approximately 23.05 million ETH after bottoming out in mid-October. A highlighted annotation on the chart shows that 218,470 ETH were accumulated in just the past week, signaling a tangible shift in on-chain behavior. 

Ethereum collective holdings of wallets holding 100-10,000 ETH. Source: Santiment

This increase represents roughly one-sixth of the coins previously dumped, a sign that major investors are gradually re-entering the market after what appeared to be an exhaustion phase. Similar accumulation trends have often preceded a broader recovery in Ethereum’s price, especially when accompanied by stabilization in the ETH/BTC trading pair.

As it stands, the Ethereum price appears to be building a firmer base for the next phase of its recovery heading into November. When whale wallets accumulate, it reduces the circulating supply available on exchanges and reduces selling pressure.

At the time of writing, Ethereum is trading at $3,940 and is on track to break and close above $4,000 again. Both Ethereum and Bitcoin have risen a bit in recent days after inflation report showed US inflation cooling to 3% in September, below the 3.1% forecasted by economists. 

Featured image from Unsplash, chart from TradingView

Why the Bitcoin Price May Be Decoupling From Its Four-Year Cycle

Bitcoin Magazine

Why the Bitcoin Price May Be Decoupling From Its Four-Year Cycle

Has the bitcoin price finally broken away from its four-year cycle pattern, or is this bull market already entering exhaustion? By studying historical growth rates, liquidity data, and macroeconomic correlations, we can better understand whether the current cycle has truly diverged, and what that means for investors in the months ahead.

Bitcoin Price Cycle Duration

Analyzing BTC Growth Since Cycle Lows, we can see that Bitcoin has now officially surpassed the elapsed time from cycle low to cycle high seen in previous bull markets. The 2018–2022 cycle peaked 1,059 days after its prior bear market low, and the current cycle has now moved beyond that duration. If we average the elapsed time across the last two full market cycles, Bitcoin has already exceeded the historical mean and is on the verge of surpassing even the 2017 cycle length in the coming days.

BTC Growth Since Cycle Lows illustrates that the duration of the current cycle is surpassing the previous two 4-year cycles.
Figure 1: BTC Growth Since Cycle Lows illustrates that the duration of the current cycle is surpassing the previous two 4-year cycles. View Live Chart

Diminishing Impact on Bitcoin Price

Historically, Bitcoin’s four-year cycle was rooted in its halving events, where the block reward, and thus the inflation rate, was cut in half. Each halving triggered a sharp supply shock, driving major bull markets. However, this cycle has behaved differently. Following the most recent halving, Bitcoin experienced five months of sideways consolidation rather than the explosive post-halving rallies seen previously. While price has since made notable gains, momentum has been weaker, leading many to ask whether the halving has lost its influence.

Bitcoin’s Circulating Supply and the diminishing marginal inflation impact
Figure 2: Bitcoin’s Circulating Supply and the diminishing marginal inflation impact. View Live Chart

With the current Circulating Supply already exceeding 95% of the 21 million ultimate total supply of Bitcoin, the marginal supply reduction may no longer be as significant. Today, miners distribute roughly 450 newly created BTC per day, an amount easily absorbed by a handful of institutional buyers or ETFs. That means the halving alone may no longer be the dominant driver of Bitcoin’s market cycles. 

Global Liquidity Cycles Driving the Bitcoin Price

When we view Global M2 Money Supply versus BTC on a year-on-year basis, a clear pattern emerges. Each major Bitcoin bottom has aligned almost perfectly with the trough of Global M2 liquidity growth. 

Global M2 versus BTC (YoY) has historically aligned practically perfectly.
Figure 3: Global M2 versus BTC (YoY) has historically aligned practically perfectly. View Live Chart

If we map the Bitcoin halvings and the M2 troughs side by side, we see that halvings typically lag the liquidity cycle, suggesting that liquidity expansion, not halving events, may be the true catalyst for Bitcoin’s rallies. This isn’t unique to Bitcoin. Gold has shown the same behavior for decades, with its price performance closely mirroring the rate of Global M2 expansion or contraction.

Inverse Correlations Shaping Bitcoin Price Trends

A key part of this liquidity story lies in the U.S. Dollar Strength Index (DXY). Historically, BTC versus DXY on a year-on-year basis has been almost perfectly inversely correlated. When the dollar strengthens year-on-year, Bitcoin tends to enter bear market conditions. When the dollar weakens, Bitcoin begins a new bull market. This inverse relationship also holds true for Gold and equity markets, underscoring the broader debasement cycle thesis that as fiat currencies lose purchasing power, hard assets rapidly appreciate.

BTC vs. DXY (YoY) and the strong inverse correlation with major market turns
Figure 4: BTC vs. DXY (YoY) and the strong inverse correlation with major market turns. View Live Chart

Currently, the DXY has been in a short-term uptrend, coinciding with Bitcoin’s recent consolidation. However, the index is now approaching a key historical resistance zone, one that has previously marked major turning points and preceded prolonged DXY declines. If this pattern holds, the next major drop in dollar strength could trigger a renewed upcycle for Bitcoin.

Quantitative Tightening and the Bitcoin Price

Comments from Federal Reserve Chair Jerome Powell recently hinted that the era of balance sheet contraction (quantitative tightening) may be nearing an end. Looking at the Fed Balance Sheet versus BTC, the start of balance sheet expansion and renewed quantitative easing has historically coincided with major upward moves in Bitcoin and equity markets alike.

Fed Balance Sheet inflection points historically align with Bitcoin bull cycle expansions
Figure 5: Fed Balance Sheet inflection points historically align with Bitcoin bull cycle expansions. View Live Chart

During the two years following previous Fed balance sheet expansions, the S&P 500 averaged a 47% return, more than five times the average two-year performance during neutral periods. If we are indeed entering a new easing phase, it could not only prolong Bitcoin’s current cycle but also set the stage for a liquidity-driven melt-up across risk assets.

Conclusion: The Evolving Bitcoin Price Cycle

Bitcoin has now outlasted the timeframes of its previous two cycles, leading many to question whether the four-year rhythm still applies. But when we step back, a different narrative emerges, one driven not by programmed scarcity, but by Global liquidity, fiat debasement, and macro capital flow. The “four-year cycle” may not be broken, but it may have simply evolved.

If the U.S. Dollar weakens, the Fed pauses tightening, and Global M2 growth accelerates, then Bitcoin likely still has room to run.  For now, as always, the best approach remains the same: react, don’t predict. Stay data-driven, stay patient, and keep your eyes on liquidity.

For a more in-depth look into this topic, watch our most recent YouTube video here: Where Are We In This Bitcoin Cycle


For deeper data, charts, and professional insights into bitcoin price trends, visit BitcoinMagazinePro.com.

Subscribe to Bitcoin Magazine Pro on YouTube for more expert market insights and analysis!


Bitcoin Magazine Pro

Disclaimer: This article is for informational purposes only and should not be considered financial advice. Always do your own research before making any investment decisions.

This post Why the Bitcoin Price May Be Decoupling From Its Four-Year Cycle first appeared on Bitcoin Magazine and is written by Matt Crosby.

Out of Office: Amazon design technologist makes ‘robot art’ and the tools to help others be creative

Amazon design technologist Maksim Surguy writes code to create precise works of art. (Photo courtesy of Maks Surguy)

Out of Office is a new GeekWire series spotlighting the passions and hobbies that members of the Seattle-area tech community pursue outside of work.

  • Day job: Senior design technologist for Amazon Devices, working on concepts for new devices or new features on existing devices, such as Fire TV, Alexa, and Echo smart speakers.
  • Out-of-office passion: Using machines to create art.

Before he pursued a bachelor’s degree in computer science, Maksim Surguy made an initial — and brief — run at a bachelor’s in art.

“Two weeks later, I realized that I suck at art and I switched to computer science,” he laughed.

Fourteen years after completing his education at California State University, Fullerton, Surguy has found happiness and success in marrying the two disciplines, as a technologist and an artist in Seattle.

“My sketching is not to the level that I want, so instead I use code to create artwork,” he said in describing the “robot art” that occupies his free time.

Surguy not only relies on machines to generate his artwork, he creates the software tools that facilitate such art, whether the finished pieces exist as digital NFTs or as physical works such as pen plotter drawings made via scalable vector graphics.

“I spend a lot more time making the tools than actually using them,” Surguy said. “But other people use them to actually make something. So I enjoy both sides of this.”

A screenshot from a tutorial video demonstrating Maks Surguy’s workflow for the artwork “Vector Wave, 2022.” (Image courtesy of Maks Surguy)

Surguy is a 2018 graduate of the University of Washington’s Master of Science in Technology Innovation (MSTI), a program at the UW’s Global Innovation Exchange (GIX) — a joint initiative of the College of Engineering and Foster School of Business.

For a hardware/software project, he created a 3D-printed drawing machine with his own electronics program. During the process, he couldn’t find a community for like-minded people who make such things. So he started DrawingBots, a website/Discord that’s attracted thousands of artists and engineers.

Surguy was born and raised in Ukraine and was an accomplished breakdancer who competed as a professional in Eastern Europe when he was younger. He moved to the U.S. in 2004.

He’s been at Amazon for six years and his artwork has been displayed in the company’s headquarters buildings, in public exhibitions — including at Seattle’s NFT Museum, and on his website and social media channels. He’s also written extensively about technology.

And in the blurring space between human and AI-created artwork, he’s leaning further into technology.

“I use AI for a lot of things, and especially now with code, it makes it easier to create tools that are custom and specific for whatever use case,” Surguy said. “I just open-sourced one last weekend. It’s a tool that allows artists to preview their artwork, how it’s going to look before they make it on paper. So it saves them time and money and art supplies.”

Prints of some of Maksim Surguy’s “plotter” artwork. (Photo courtesy of Maks Surguy)

Most rewarding aspect of this pursuit: Surguy most enjoys the growing community he helped foster around the tools and art he makes.

“I got to know thousands of people that do this kind of stuff and are very interesting people,” he said. “Some of them were TED speakers. Some of them are PhDs, very well known researchers, scientists, artists. I had conversations with all of these people and consider some of them my friends. So that’s the most rewarding part.”

The lessons he brings back to work: “This kind of procedural and algorithmic art definitely has a place in making products that are digital experiences,” Surguy said of the connection between his hobby and his work at Amazon.

For example, his Devices team launched a dynamic art feature for Fire TV: a screen saver that created artwork on the fly based on data such as weather, time of day, and other inputs.

Surguy said the ideas he generates outside of work serve as inspiration for what he creates at work, whether it’s creative coding or simply expanding the boundaries of what he makes and how he makes it.

Read more Out of Office profiles.

Do you have an out-of-office hobby or interesting side hustle that you’re passionate about that would make for a fun profile on GeekWire? Drop us a line: tips@geekwire.com.

New Battlefield 6 Update Tweaks Custom Search, Player Movement and Progression Updates Still to Come

BF Community Update text overlays a battlefield scene with helicopters and armored vehicles.

Now that Battlefield 6 has been out and in players' hands for a full two weeks at the time of this writing, EA and Battlefield Studios have begun updating, tweaking, and refining the experience to squash bugs and address player feedback. The latest update, which went live today in preparation for Season 1, includes tweaks to the Custom Search queue option and a fix for a vehicle spawn bug. What's more intriguing about the update is what's still to come, as Battlefield Studios lists changes and refinements to player movement and continued changes to player progression that Battlefield Studios began […]

Read full article at https://wccftech.com/battlefield-6-update-custom-search-player-movement-progression-to-come/

❌