Reading view

Media post: ANCEL V6 Pro+HD: One Diagnostic Tool for Cars, Trucks, and Agricultural Equipment

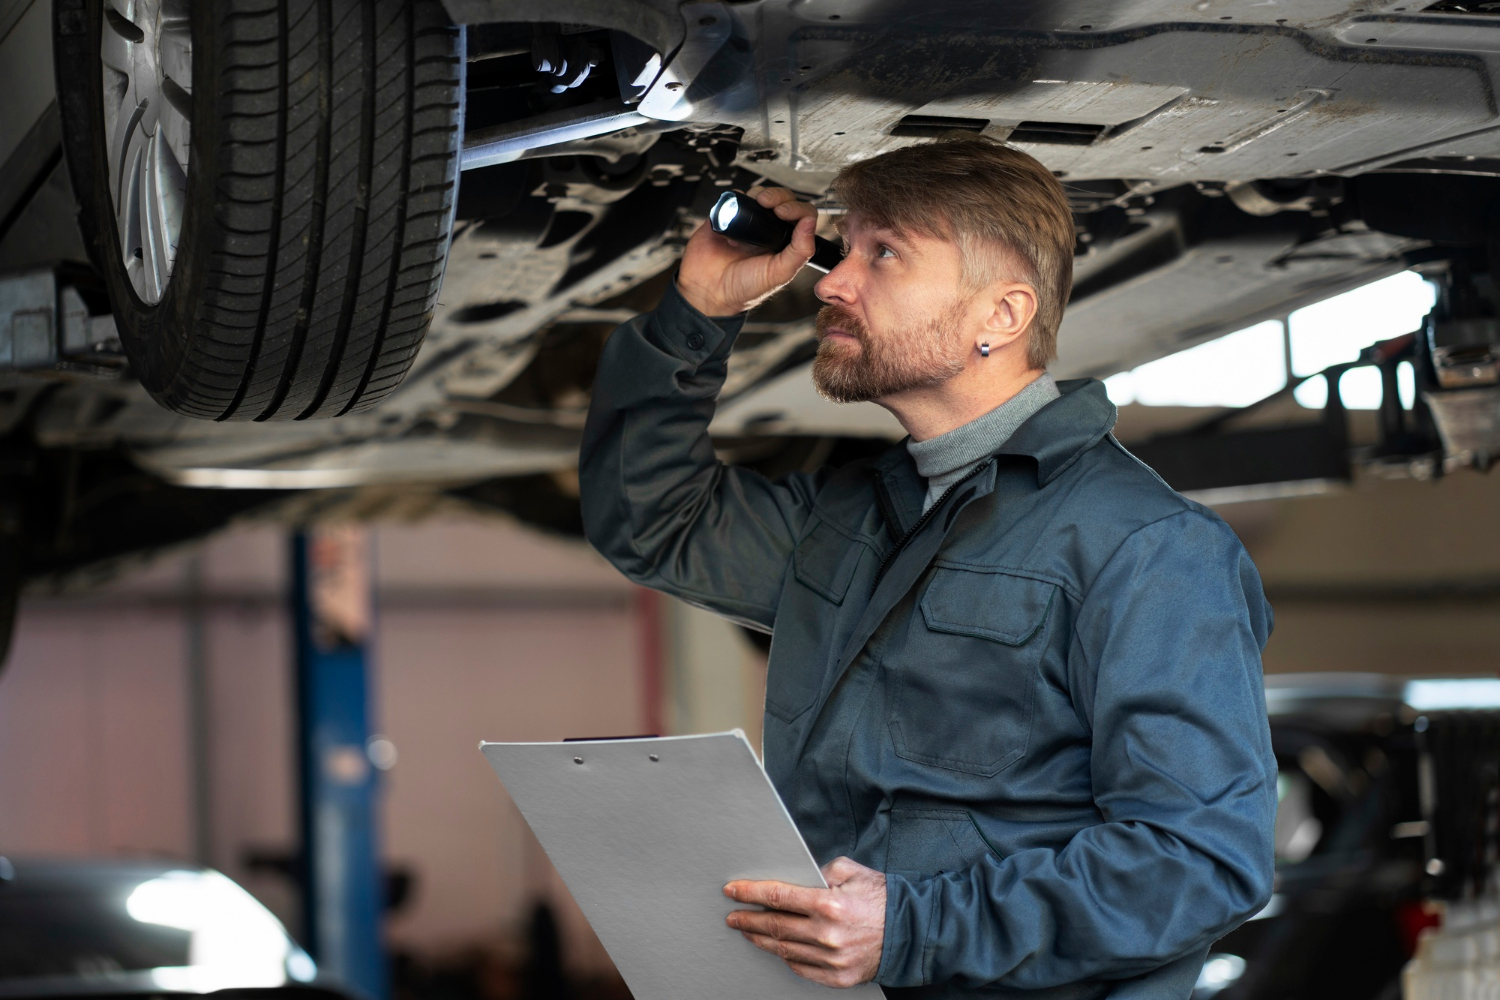
As modern vehicles become more electronically complex, diagnostics is no longer limited to passenger cars alone. Repair shops, fleet operators, and independent technicians increasingly find themselves working across multiple vehicle categories—from sedans and SUVs to trucks, agricultural machinery, and construction equipment.

This shift has created a growing demand for diagnostic tools that can handle different vehicle types without requiring multiple dedicated scanners.

The Growing Challenge of Multi-Vehicle Diagnostics

Traditionally, passenger vehicles and commercial vehicles have relied on separate diagnostic platforms. Cars typically use standard OBD2 protocols, while trucks and heavy-duty vehicles rely on HD OBD systems and manufacturer-specific modules.

– For workshops servicing mixed fleets, this often means:

– Owning multiple diagnostic tools

– Managing different software systems

– Switching devices depending on vehicle type

Over time, this leads to higher costs, workflow inefficiencies, and steeper learning curves for technicians.

What Makes a True All-in-One Diagnostic Tool

A genuine all-in-one diagnostic scanner is not defined by vehicle count alone. Instead, it should offer:

– Multi-system diagnostics, not just engine codes

– Support for both passenger and commercial vehicles

– Bi-directional active tests for real-world troubleshooting

– Service and reset functions aligned with daily maintenance tasks

– Practical usability, including reporting and data management

Only when these elements work together can one device realistically replace several specialized tools.

How the ANCEL V6 Pro+HD Addresses These Needs

The ANCEL V6 Pro+HD is designed as a combined diagnostic platform for both passenger vehicles and commercial applications, including trucks and agricultural machinery.

Rather than focusing on a single vehicle category, it integrates OBD2 and HD OBD diagnostics within one system, allowing users to switch between different vehicle types without changing devices.

Passenger and Commercial Vehicle Coverage in One Platform

The V6 Pro+HD auto diagnostic scanner supports a wide range of vehicle types, including:

– Sedans, SUVs, MPVs, and vans

– Trucks and buses

– Agricultural machinery such as tractors and harvesters

– Construction vehicles including loaders, excavators, and cranes

Vehicle coverage spans over 200 brands, covering markets in Europe, Asia, America, China, and Australia.

Full-System Diagnostics Beyond Basic OBD2

Instead of limiting diagnostics to engine-related fault codes, the V6 Pro+HD provides access to multiple vehicle systems, including:

– Engine

– Transmission

– ABS / EBS / ESC / ASR

– Airbag and BCM

– SCR, DPF, and air suspension

– Instrument and body-related systems

This broader access enables more accurate fault identification, especially for complex drivability and emissions-related issues.

Bi-Directional Active Tests for Practical Troubleshooting

The scanner supports bi-directional active tests, allowing technicians to send commands directly to control modules and observe real-time responses.

Common applications include:

– Fuel injector testing

– ABS motor and pump cycling

– Cooling fan activation

– Door lock, window, and lighting tests

These functions are particularly useful for confirming whether faults originate from sensors, wiring, or actuators.

40+ Service and Reset Functions for Daily Maintenance

The V6 Pro+HD includes more than 40 service and reset functions commonly required in workshops, such as:

– Oil and service light reset

– DPF regeneration and related resets

– ABS bleeding and EPB reset

– Injector coding and throttle reset

– Battery, SAS, TPMS, and suspension reset

Function availability may vary by vehicle model and year, and compatibility verification is recommended before use.

Support for Trucks, Agricultural, and Construction Vehicles

In addition to passenger vehicles, the V6 Pro+HD is built to support diagnostics for:

– Heavy-duty trucks

– Agricultural equipment

– Construction machinery

This makes it particularly suitable for users managing mixed fleets or servicing vehicles beyond standard passenger cars.

Usability and Practical Features for Professionals

From a usability perspective, the scanner features:

– An 8-inch touchscreen running Android OS

– An 8000mAh rechargeable battery for extended use

– Diagnostic report generation with customizable headers

– Data recording and playback for historical inspections

Remote assistance is also available, allowing technical support staff to connect remotely when scheduled in advance.

Who Is This Type of Tool Best Suited For?

A multi-vehicle diagnostic tool like the ANCEL V6 Pro+HD is best suited for:

– Independent repair shops handling mixed vehicle types

– Fleet maintenance teams

– Mobile technicians and service providers

– Users seeking to reduce tool redundancy without sacrificing diagnostic depth

It may be more than necessary for basic code reading, but it offers clear advantages in professional or semi-professional environments.

Final Thoughts: Reducing Tool Redundancy Without Sacrificing Depth

As vehicle categories continue to overlap in terms of technology and electronics, diagnostic tools must evolve accordingly.

Rather than maintaining separate scanners for cars, trucks, and agricultural equipment, an integrated platform like the ANCEL V6 Pro+HD demonstrates how one device can cover multiple use cases—provided users understand its scope and verify compatibility for their specific vehicles.

Honda Previews HRC Concepts and Race Cars at Tokyo Auto Salon 2026

Honda has confirmed it will showcase a mix of cutting-edge concept models and race-bred machines at Tokyo Auto Salon 2026, scheduled to run from 9 to 11 January at Makuhari Messe in Chiba, Japan. The brand’s display will carry the theme “Honda Sports DNA,” highlighting its performance heritage and motorsport influence.

Honda Tokyo Salon 2026 Scaled

Headlining the stand will be three world premieres. The first is the Civic Type R HRC Concept, developed by Honda Racing Corporation and infused with motorsport-derived enhancements aimed at elevating the performance of the already potent Civic Type R. Joining it is the Prelude HRC Concept, based on the new-generation Prelude that debuted in September 2025, featuring HRC-developed components designed to sharpen driving dynamics.

The third debut is the Civic e:HEV RS Prototype, a sport-focused iteration of Honda’s hybrid Civic. This model becomes the second Honda, after the Prelude, to feature the brand’s new S+ Shift control technology, which is intended to deliver a more engaging and responsive driving feel.

Beyond concept cars, Honda will also showcase its racing pedigree with the HRC Prelude-GT, a GT500-class machine slated to compete in the Super GT 2026 Series. Rounding out the experience will be a racing simulator constructed from the NSX-GT, offering visitors an immersive taste of Honda’s track-focused engineering.

Lexus RZ 600e F Sport Performance Debuts in Japan

Lexus has announced the launch of the RZ 600e F Sport Performance, a new high-performance special edition in its battery electric SUV lineup. The model will go on sale through Lexus dealerships across Japan from 2 March 2026.

Lexus Rz 600e F Sport Performance

Based on the RZ 550e F Sport, the RZ 600e F Sport Performance has been developed with inputs from air race pilot Yoshihide Muroya and racing driver Masahiro Sasaki. Both were also involved in shaping the limited-run RZ 450e F Sport Performance that debuted in early 2024, bringing motorsport-inspired fine-tuning to Lexus’ electric portfolio.

Power comes from a dual-motor all-wheel-drive setup delivering a combined system output of 313 kW. Each electric motor produces 167 kW, translating into stronger acceleration and improved high-speed performance over the standard RZ variants. To better handle the additional power, Lexus has lowered the ride height by 20 mm compared to the RZ 550e F Sport, a move aimed at reducing aerodynamic drag and enhancing stability.

Braking hardware has also been upgraded, with larger 20-inch brake rotors fitted to ensure consistent stopping performance that matches the increased output. While Lexus has not yet disclosed detailed performance figures or range data, the focus of the RZ 600e F Sport Performance is clearly on sharper dynamics and a more engaging driving experience.

Uruguay November 2025: Chevrolet repeats at #1 with 15.2% share

Chevrolet holds 15.2% of the Uruguayan market in November.

New light vehicle sales in Uruguay are off -1.1% year-on-year in November to 6,272 units, leading to a year-to-date tally up 9.4% to 62,278. After lodging its first win of the year last month, Chevrolet (+7.4%) repeats at #1, reaching 15.2% share which is the carmaker’s best since December 2024. However Chevrolet remains stuck in third place year-to-date with volumes down -24.2%. Fiat (-30.6%) is in deep trouble in 2nd place but easily holds onto the YTD top spot at 13.8% share. BYD (+19.4%) is solid at #3 and 9.6% share, below the #2 and 11% it commands YTD. Volkswagen (-17.3%) and Renault (-21.3%) round out the Top 5 in mediocre fashion. In contrast Suzuki (+663.8%), Dongfeng (+535.3%), Chery (+186.7%) and Omoda (+148.1%) all shoot up.

Previous month: Uruguay October 2025: Chevrolet signs first win this year

One year ago: Uruguay November 2024: BYD (+241.2%), Citroen (+102.7%) shine in strong market

Full November 2025 Top 60 All brands ranking below.

Uruguay November 2025 – brands:

PosBrandNov-25%/24Oct2025%/24PosFY24
1Chevrolet95215.2%+ 7.4%16,71110.8%– 24.2%31
2Fiat6109.7%– 30.6%28,58213.8%+ 14.7%12
3BYD6039.6%+ 19.4%36,87411.0%+ 117.3%26
4Volkswagen5879.4%– 17.3%45,5118.8%+ 11.4%43
5Renault5008.0%– 21.3%55,3038.5%+ 12.1%54
6Suzuki3595.7%+ 663.8%64,0196.5%+ 27.6%67
7Hyundai3084.9%– 41.9%73,8656.2%– 12.6%75
8Dongfeng2163.4%+ 535.3%81,3432.2%+ 739.4%1330
9Chery2153.4%+ 186.7%91,8823.0%+ 106.6%912
10Peugeot1542.5%– 19.4%111,6892.7%– 36.8%109
11Omoda1292.1%+ 148.1%127931.3%+ 206.2%1624
12Toyota1232.0%– 41.7%151,3942.2%– 34.1%1211
13Nissan1211.9%– 51.6%141,5332.5%– 38.4%1110
14Jetour1191.9%+ 24.0%168511.4%+ 11.1%1513
15JAC1011.6%+ 134.9%186521.0%+ 68.5%1721
16Citroen921.5%– 68.9%131,9633.2%– 32.4%88
17JMC901.4%+ 233.3%175660.9%+ 607.5%1937
18Mitsubishi891.4%+ 493.3%403340.5%+ 89.8%2832
19Geely871.4%+ 16.0%109281.5%+ 62.8%1416
20Ford631.0%+ 40.0%234950.8%– 6.3%2118
21Victory560.9%– 28.2%196191.0%– 0.8%1815
22GWM550.9%+ 22.2%224160.7%+ 71.2%2527
23Foton490.8%+ 40.0%214810.8%+ 222.8%2233
24Deepal420.7%new311420.2%new38 –
25Kia400.6%+ 42.9%361870.3%– 14.6%3528
26Changan390.6%– 9.3%252810.5%– 30.6%3023
27BMW380.6%+ 8.6%294170.7%– 12.0%2419
28Geely Riddara370.6%+ 362.5%451190.2%+ 120.4%4141
29Karry350.6%+ 25.0%203540.6%+ 20.0%2725
30Mercedes310.5%– 40.4%272810.5%– 25.9%2922
31BAW310.5%+ 34.8%302330.4%+ 242.6%3239
32DFSK270.4%– 34.1%264210.7%– 17.8%2317
33Honda260.4%– 71.1%245470.9%– 12.9%2014
34Jeep260.4%– 52.7%323830.6%– 18.7%2620
35Ram240.4%– 7.7%332430.4%+ 33.5%3131
36Volvo210.3%+ 61.5%391960.3%– 38.4%3426
37Leapmotor170.3%+ 750.0%48530.1%+ 55.9%4744
38Audi160.3%– 11.1%341960.3%– 4.4%3329
39Subaru130.2%n/a42840.1%– 19.2%4435
40Bestune120.2%+ 1100.0%381500.2%+ 400.0%3645
41Lynk & Co120.2%+ 50.0%281270.2%+ 429.2%4048
42Maxus120.2%– 7.7%43890.1%– 4.3%4336
43Dongfeng Forthing120.2%new37450.1%new49 –
44GAC100.2%+ 11.1%351420.2%+ 1477.8%3751
45MG100.2%– 52.4%411300.2%+ 46.1%3938
46Mini100.2%+ 150.0%44830.1%+ 38.3%4540
47Xpeng90.1%new –260.0%new55 –
48Farizon80.1%+ 100.0%50320.1%+ 113.3%5253
49Zeekr70.1%+ 133.3% –400.1%+ 166.7%5150
50Jaecoo50.1%+ 400.0%46680.1%+ 1600.0%4655
51Opel50.1%– 37.5%54510.1%+ 240.0%4854
52Smart50.1%new51190.0%new59 –
53Mazda40.1%– 71.4%471060.2%– 23.2%4234
54Iveco40.1%+ 100.0%58150.0%+ 36.4%6156
55Land Rover10.0%– 66.7%52270.0%+ 50.0%5352
56Jinpeng10.0%– 75.0% –260.0%+ 225.0%5459
57LMI10.0%– 75.0%55220.0%– 26.7%5646
58Seat10.0%n/a57210.0%– 50.0%5742
59Tesla10.0%– 75.0% –160.0%– 61.0%6043
60Today Sunshine10.0%– 75.0%53110.0%– 52.2%6249

Source: Autodata

Tata Motors Crosses 2.5 Lakh EV Sales, Outlines Aggressive Launch Roadmap

Tata Motors has crossed a major milestone in India’s electric mobility journey, surpassing 250,000 cumulative electric vehicle sales. The automaker currently commands a dominant 66% share of the Indian EV market and has confirmed an ambitious product expansion plan running through FY30.

Tata Ev 250k Beyond

A key highlight of this achievement is the Nexon EV, which has become the first electric car in India to cross 100,000 cumulative sales since its launch in 2020. Tata Motors’ existing EV portfolio spans multiple segments and includes the Tiago EV, Punch EV, Nexon EV, Curvv EV, Harrier EV, and the Xpres-T for fleet operators.

Looking ahead, Tata Motors plans to strengthen its EV lineup further with the launch of the Sierra EV and a new Punch EV in 2026. These will be followed by the introduction of the Avinya range of premium electric vehicles later the same year. By FY30, the company aims to roll out five all-new EV nameplates, alongside regular updates and refreshes across its current range.

Charging infrastructure remains a key focus area. Tata Motors claims access to over 200,000 charging points nationwide and plans to expand this network to 400,000 chargers by 2027 and one million by 2030. The company already operates 100 MegaCharging Hubs offering charging speeds of 120 kW and above.

To further localise its EV ecosystem, Tata Motors will source battery cells from Agratas’ upcoming gigafactory in Sanand, reinforcing its long-term commitment to India’s electric future.

Renault Filante Record 2025 Sets EV Efficiency Benchmark

Renault has achieved a new electric vehicle efficiency milestone with its Filante Record 2025 demo car, covering 1,008 km on a single charge during a certified test at UTAC’s circuit in Morocco on 18 December. The run was completed at an average speed of 102 km/h, underlining the feasibility of long-distance EV travel at sustained highway speeds.

Renault Filante Record 2025

Weighing just 1,000 kg, the Filante Record 2025 completed the distance in 9 hours and 52 minutes using an 87 kWh battery—the same capacity as the production Scenic E-Tech Electric. Renault recorded an energy consumption figure of just 7.8 kWh per 100 km. Notably, the car still had 11% battery capacity remaining at the end of the run, enough for an estimated additional 120 km at speeds exceeding 100 km/h.

Aerodynamic efficiency played a key role in the achievement. Extensive wind tunnel testing helped Renault reduce the car’s drag coefficient from around 0.40 to 0.30, achieved through redesigned wheel fairings and reduced air intakes.

Renault Filante Record 2025 2 Scaled

The Filante Record 2025 also serves as a technology showcase. It features steer-by-wire and brake-by-wire systems, extensive use of carbon fibre, and 3D-printed aluminium components. Special low-rolling-resistance tyres were developed in partnership with Michelin, while Ligier was responsible for the powertrain, chassis, and carbon structure.

Renault says the project highlights how intelligent design, lightweight construction, and aerodynamics can significantly extend real-world EV range without increasing battery size.

Hajime Aota Appointed Chairman of Yamaha Motor India Group

India Yamaha Motor (IYM) Pvt. Ltd. has announced the appointment of Mr. Hajime Aota as the new Chairman of Yamaha Motor India Group, effective 1 January 2026. The move signals Yamaha’s continued focus on strengthening its long-term strategy and leadership in the Indian market.

Mr Hajime Aota Chairman Of Yamaha Motor India Grou

Mr. Aota brings extensive global experience in corporate strategy, planning, and new business development within the automotive and mobility space. Prior to this role, he served as Executive Officer at Yamaha Motor Co., Ltd., and Chief General Manager – Corporate Strategy Center at the company’s global headquarters in Japan. In this capacity, he led key initiatives spanning corporate strategy, sustainability, and digital transformation.

His international exposure includes senior leadership roles across Japan, the United States, and the United Kingdom. Mr. Aota has also been closely associated with Yamaha’s future-facing initiatives, having served as Chairperson of Yamaha Motor Ventures & Laboratory Silicon Valley (YMVSV). There, he oversaw strategic investments in emerging areas such as robotics, advanced transportation, fintech, insurtech, digital health, and data-driven technologies.

A key contributor to Yamaha Motor’s long-term roadmap, Mr. Aota played an instrumental role in shaping the company’s 2030 vision, “Art for Human Possibilities,” and continues to support its execution across global markets. His appointment is expected to further align Yamaha Motor India with the parent company’s global priorities, especially in innovation-led growth and digital initiatives.

Mr. Aota is an alumnus of Keio University, Japan, with a degree in Political Science, and has completed the Program for Leadership Development (PLD) at Harvard Business School.

Colombia November 2025: Chery iCar 03 best-selling recent launch

The Chery iCar 03 is up to #24 in Colombia in November.

After 8 consecutive months of double-digit YoY gains, the Colombian new vehicle market markedly slows down its growth in November at “just” +9% to 23,825 units. The year-to-date tally remains at stratospheric heights at 224,260 sales, up 27.5% over the same period in 2024. Renault (+16.1%) tops the brands ranking for the 5th time this year, ending the month just 40 sales above Kia (+28.2%) which remains the best-seller YTD. Chevrolet (+4.6%) and Mazda (+0.8%) both trail the market while Suzuki (+41.2%) shoots up and rounds out the Top 5. Carmakers with double-digit gains are aplenty, with Chery (+401.4%), Changan Deepal (+119.1%), Cupra (+111.3%), Citroen (+102.5%), Jeep (+84.4%), Peugeot (+71.3%) and Foton (+61.3%) among the best performers.

Looking at the models charts, the Kia K3 (+30.5%) is up two spots on last month to lead the way, cementing its newfound YTD leadership. The Mazda CX-30 (+14.7%) drops one rank to #2, a ranking it now also holds YTD, passing a freefalling Toyota Corolla Cross (-84.8%) down to #74 for the month. The Kia Picanto (+103.3%) closes the podium ahead of the Chevrolet Onix (+69.8%) and Renault Duster Nacional (+18.2%). The Mazda2 (+22.1%) is also in great shape at #6. Below, notice the Kia Stonic (+137.5%), Hyundai Tucson (+78.6%), Hyundai Kona (+75.4%) and Suzuki Fronx (+67.7%) all posting fantastic scores. The best-selling recent launch is the Chery iCar 03 at #24, a model we haven’t seen in other international markets so far.

Previous month: Colombia October 2025: Renault best-seller, Kia K3 now #1 YTD

One year ago: Colombia November 2024: BYD breaks records again, Yuan Up in Top 10

Full November 2025 Top 30 brands and Top 75 models below.

Colombia November 2025 – brands:

PosBrandNov-25%/24Oct2025%/24PosFY24
1Renault3,58915.1%+ 16.1%129,89813.3%+ 34.0%22
2Kia3,54914.9%+ 28.2%230,15913.4%+ 42.2%13
3Chevrolet2,0518.6%+ 4.6%318,8898.4%+ 8.1%54
4Mazda1,9858.3%+ 0.8%519,1098.5%+ 20.5%45
5Suzuki1,3515.7%+ 41.2%612,2495.5%+ 28.5%67
6Nissan1,3395.6%+ 8.9%712,0915.4%+ 14.5%76
7Toyota1,2165.1%– 47.5%422,0549.8%– 9.2%31
8Hyundai1,1935.0%+ 15.3%1010,3964.6%+ 73.9%89
9Volkswagen1,0134.3%+ 15.1%89,3694.2%+ 30.2%98
10BYD9994.2%+ 12.6%99,0824.0%+ 159.1%10n/a
11Foton6662.8%+ 61.3%116,1152.7%+ 63.5%12n/a
12Ford6262.6%– 18.3%126,4122.9%– 1.7%1110
13Chery3511.5%+ 401.4%161,6510.7%n/a20n/a
14Citroen3201.3%+ 102.5%152,2761.0%+ 48.4%16n/a
15JAC2911.2%+ 44.8%132,4731.1%+ 30.9%14n/a
16Mercedes2841.2%– 28.5%142,9531.3%+ 16.2%13n/a
17BMW2521.1%– 16.3%202,2901.0%+ 17.7%15n/a
18JMC2030.9%+ 27.7%172,1210.9%+ 43.5%17n/a
19Peugeot1970.8%+ 71.3%191,7420.8%+ 53.3%19n/a
20Honda1800.8%+ 4.7%231,4660.7%+ 8.0%21n/a
21Subaru1560.7%– 18.3%181,8290.8%+ 10.4%18n/a
22Dongfeng1530.6%+ 53.0%221,4440.6%n/a22n/a
23Changan-Deepal1490.6%+ 119.1%211,3160.6%n/a24n/a
24Volvo1470.6%– 20.1%261,3120.6%– 0.8%25n/a
25Cupra1310.5%+ 111.3%249900.4%n/a27n/a
26Jeep1180.5%+ 84.4%251,0430.5%n/a26n/a
27MG1040.4%– 3.7%271,3330.6%n/a23n/a
28International920.4%+ 300.0%n/an/an/an/an/an/a
29Jetour830.3%– 4.6%n/an/an/an/an/an/a
30Audi760.3%– 43.3%n/an/an/an/an/an/a

Colombia November 2025 – models:

PosModelNov-25%/24Oct2025%/24PosFY24
1Kia K31,0964.6%+ 30.5%38,7613.9%+ 72.4%14
2Mazda CX-309353.9%+ 14.7%17,7813.5%+ 9.1%21
3Kia Picanto8583.6%+ 103.3%26,5032.9%+ 21.9%55
4Chevrolet Onix8203.4%+ 69.8%55,7372.6%+ 57.9%67
5Renault Duster Nacional7603.2%+ 18.2%47,1333.2%+ 18.3%43
6Mazda25742.4%+ 22.1%105,1392.3%+ 59.1%710
7Renault Logan5292.2%– 5.0%63,6421.6%+ 48.1%1114
8BYD Yuan Up5002.1%+ 9.9%74,4032.0%n/a9n/a
9Renault Arkana4431.9%+ 42.4%133,3661.5%n/a14n/a
10Suzuki Swift4421.9%+ 29.6%113,6501.6%+ 11.1%109
11Hyundai Kona4211.8%+ 75.4%233,0451.4%+ 146.8%16n/a
12Renault Kardian4081.7%+ 18.3%94,4432.0%+ 176.0%8n/a
13Hyundai Tucson4001.7%+ 78.6%262,5191.1%+ 112.4%25n/a
14Nissan Frontier3901.6%+ 18.2%272,5801.2%+ 0.9%2120
15Renault Kwid3751.6%– 20.4%163,3881.5%– 7.5%138
16Kia Sonet3361.4%+ 3.4%142,7171.2%+ 63.7%18n/a
17Renault Stepway3351.4%+ 4.7%202,6191.2%– 4.0%2013
18Toyota Hilux3081.3%– 30.6%123,6371.6%– 19.8%126
19Nissan X-Trail2921.2%+ 32.7%212,1891.0%+ 29.2%32n/a
20VW Polo2871.2%– 4.7%152,7011.2%+ 11.7%19n/a
21Kia Stonic2851.2%+ 137.5%381,3790.6%+ 57.1%41n/a
22VW T-Cross2731.1%+ 56.9%302,5571.1%+ 21.5%23n/a
23Suzuki Fronx2651.1%+ 67.7%182,4501.1%+ 54.6%28n/a
24Chery iCAR 032551.1%new50n/an/anewn/a –
25Ford Ranger2391.0%+ 11.7%332,2951.0%+ 16.5%31n/a
26Toyota Prado2351.0%– 38.8%83,2091.4%+ 13.9%1512
27Chevrolet Tracker2250.9%– 20.8%372,5051.1%– 2.1%2718
28Nissan Kicks Play2160.9%– 12.9%322,5181.1%– 5.4%2619
29Mazda CX-52140.9%– 39.4%582,9981.3%+ 17.3%1717
30Kia Niro2100.9%+ 16.7%441,6190.7%+ 70.6%40n/a
31Nissan Versa2080.9%+ 20.2%401,9050.8%+ 15.5%36n/a
32Toyota Fortuner1970.8%– 53.5%292,0360.9%– 36.0%3511
33Renault Koleos1800.8%n/a17n/an/an/an/an/a
34Suzuki S-Cross1790.8%+ 59.8%192,3011.0%+ 162.7%30n/a
35Nissan Nueva Kicks1790.8%new521,6630.7%new39 –
36Suzuki Jimny1700.7%+ 31.8%411,7350.8%+ 93.6%38n/a
37Peugeot 20081700.7%+ 112.5%491,1930.5%+ 82.4%48n/a
38BYD Seagull1670.7%– 43.6%222,4261.1%n/a29n/a
39Kia Sportage1610.7%– 13.0%472,5651.1%+ 48.4%22n/a
40Kia Eko Taxi1600.7%n/a43n/an/an/an/an/a
41Toyota Yaris Cross1560.7%– 31.0%551,8960.8%– 2.6%37n/a
42Renault Sandero1510.6%+ 11.9%531,2150.5%– 28.1%47n/a
43Mazda31490.6%+ 13.7%n/a1,1770.5%+ 3.1%49n/a
44Kia Soluto1410.6%– 35.0%312,0440.9%+ 98.6%34n/a
45Foton FRR 6.9 toneladas1410.6%n/a398520.4%n/an/an/a
46Renault Kangoo1400.6%+ 105.9%707680.3%+ 59.0%n/an/a
47Suzuki Dzire1380.6%new35n/an/anewn/a –
48VW Tera1380.6%new28n/an/anewn/a –
49Hyundai Grand Metro Taxi1380.6%– 41.8%561,3350.6%+ 20.7%43n/a
50BYD Song Plus1370.6%n/a54n/an/an/an/an/a
51JMC CHR1290.5%n/a481,3480.6%n/a42n/a
52Renault Duster E-Tech Hibrida1260.5%new24n/an/anewn/a –
53Renault Oroch1220.5%+ 10.9%421,2320.5%– 0.2%46n/a
54VW Nivus1190.5%– 1.7%641,2780.6%+ 48.8%44n/a
55Suzuki Grand Vitara1160.5%– 39.6%608960.4%– 37.0%n/an/a
56Citroen Basalt1130.5%newn/an/an/anewn/a –
57Toyota Corolla Sedan1120.5%– 5.9%252,5441.1%+ 51.2%24n/a
58Honda HR-V1110.5%n/an/a5430.2%n/an/an/a
59Citroen C31090.5%n/a599530.4%+ 32.0%n/an/a
60Subaru Crosstrek1080.5%+ 0.9%698240.4%+ 3.0%n/an/a
61BYD Yuan Plus1050.4%n/a467570.3%n/an/an/a
62Kia Seltos1030.4%+ 12.0%629470.4%– 20.2%n/an/a
63Ford Escape1020.4%– 71.5%362,0760.9%– 30.8%3315
64Volvo EX301020.4%+ 7.4%n/a5570.2%+ 2.4%n/an/a
65Cupra Formentor1000.4%n/a738870.4%n/an/an/a
66Jeep Avenger920.4%new71n/an/anewn/a –
67Citroen C3 Aircross920.4%newn/a6420.3%newn/a –
68Hyundai Venue910.4%+ 15.2%n/a3110.1%n/an/an/a
69BMW X3900.4%n/an/an/an/an/an/an/a
70Chevrolet FRR900.4%+ 5.9%66n/an/an/an/an/a
71Chevrolet NHR870.4%– 49.7%451,2540.6%+ 39.8%45n/a
72Chevrolet Captiva  870.4%– 43.5%671,0400.5%– 13.8%n/an/a
73Foton FHR810.3%n/an/a5750.3%+ 82.5%n/an/a
74Toyota Corolla Cross780.3%– 84.8%347,1923.2%+ 5.7%32
75BYD Sealion 7750.3%newn/an/an/anewn/a –

Source: ANDEMOS

Greece November 2025: Citroen (+149.8%) places C3 and C3 Aircross in Top 10

The Citroen C3 Aircross breaks into the Greek Top 10 in November.

10,458 new cars found a buyer in Greece in November, a -2% year-on-year decline. The year-to-date volume remains in positive however at +4% to 133,453. Toyota (+8.4%) easily remains in the brands pole position, selling more than double any other carmaker with 17.2% share vs. 15.7% so far this year. Peugeot (+12.3%) stays at #2 while Citroen shoots up 149.8% year-on-year and four spots on last month to land on the third step of the podium. BMW (+10.8%) is also up four ranks to #4. Opel (+19.4%), Dacia (+12.8%), Renault (+4.6%) and Suzuki (+4.1%) also manage positive results in the remainder of the Top 10. Newcomer Chery breaks into the Top 20 for the first time at #16 with an excellent 2% share, almost double its previous best of 1.1% reached last month. 

Over in the models charts, the Toyota Yaris Cross (+35.3%) posts another fantastic score at 8.7% share, compared with the 5.4% it holds year-to-date. The Peugeot 2008 (+116.5%) ranks at its traditional #2 spot, and in fact the entire Top 5 is identical to the YTD order, with the Toyota Yaris (+17.8%), Citroen C3 (+58.3%) and Suzuki Vitara (+19.9%) in tow. The Dacia Sandero (+32%) also shines at #7 vs. #15 year-to-date as does the BMW 1 Series up 36 spots on October to #8 vs. #20 YTD. The best performer in the Top 10 is the Citroen C3 Aircross up to #9 vs. #42 through November. The Opel Frontera (#14) is the best-selling recent launch above the Chery Tiggo 7 (#32) and Chery Tiggo 4 (#34).

Previous month: Greece October 2025: Opel Frontera breaks into Top 10

One year ago: Greece November 2024: BYD Dolphin up to #4

Full November 2025 Top 53 All brands and Top 245 All models below.

Greece November 2025 – brands:

PosBrandNov-25%/24Oct2025%/24PosFY24
1Toyota1,79517.2%+ 8.4%120,93315.7%– 6.3%11
2Peugeot8498.1%+ 12.3%210,9608.2%+ 8.2%23
3Citroen7026.7%+ 149.8%76,8135.1%– 4.2%75
4BMW6996.7%+ 10.8%86,8155.1%+ 14.0%66
5Suzuki5885.6%+ 4.1%38,6886.5%– 13.7%42
6Renault5655.4%+ 4.6%94,6493.5%+ 50.1%1114
7Opel5555.3%+ 19.4%57,3185.5%+ 17.6%57
8Hyundai5265.0%– 2.6%49,3047.0%+ 10.4%34
9Volkswagen4003.8%– 49.4%105,7624.3%+ 1.3%88
10Dacia3973.8%+ 12.8%64,9033.7%+ 71.9%1016
11Ford2792.7%– 7.6%113,2452.4%+ 8.8%1617
12Audi2772.6%– 39.9%143,2702.5%– 20.6%1511
13Mini2532.4%+ 19.9%192,0761.6%+ 21.9%2120
14MG2502.4%– 14.4%154,2003.1%+ 43.5%1218
15BYD2502.4%– 44.4%122,0901.6%+ 65.9%2024
16Chery2042.0%new245920.4%new29 –
17Mercedes2001.9%– 13.4%182,8562.1%– 10.9%1815
18Volvo1841.8%– 37.6%211,5351.2%– 17.3%2319
19Nissan1791.7%– 25.4%133,5232.6%– 11.9%1412
20Kia1691.6%– 40.7%165,2353.9%+ 14.6%910
21Jeep1671.6%– 6.7%202,1801.6%+ 16.9%1921
22Mazda1551.5%+ 24.0%251,7051.3%– 5.9%2223
23Skoda1221.2%– 53.6%232,9372.2%– 22.8%1713
24Cupra1031.0%– 10.4%221,1860.9%+ 21.5%2426
25Lexus650.6%+ 10.2%306480.5%+ 56.5%2829
26Alfa Romeo640.6%+ 113.3%268470.6%+ 210.3%2732
27Jaecoo520.5%new282550.2%new35 –
28Tesla510.5%– 67.1%319350.7%– 48.1%2622
29Seat460.4%+ 24.3%271,0080.8%– 23.3%2525
30Fiat410.4%– 75.7%173,5792.7%– 28.9%139
31Omoda340.3%new321480.1%new40 –
32Honda320.3%– 22.0%373490.3%– 11.9%3230
33Land Rover290.3%– 50.8%295160.4%– 12.7%3027
34Porsche250.2%+ 19.0%363140.2%+ 29.8%3333
35Leapmotor250.2%+ 127.3%341860.1%+ 615.4%3937
36DS230.2%– 11.5%334230.3%– 17.9%3128
37KGM200.2%new391900.1%new38 –
38Geely160.2%new381030.1%new41 –
39Changan Deepal130.1%new43230.0%new45 –
40Lynk & Co120.1%+ 200.0%352540.2%+ 807.1%3636
41NIO100.1%new –120.0%new50 –
42DFSK80.1%+ 700.0%402250.2%+ 765.4%3740
43Subaru60.1%+ 20.0%451010.1%+ 152.5%4238
44Smart40.0%+ 100.0%421000.1%+ 88.7%4335
45Aion40.0%new  –40.0%new56 –
46Dongfeng20.0%+ 100.0%44140.0%+ 1300.0%4852
47Lotus 20.0%n/a –80.0%+ 60.0%5245
48Mitsubishi10.0%– 80.0%463110.2%– 25.2%3431
49Zeekr10.0%new41160.0%new47 –
50Maserati10.0%– 75.0%48120.0%– 40.0%4942
51Bentley10.0%n/a –110.0%+ 57.1%5144
52Lamborghini10.0%n/a –60.0%+ 200.0%5450
53Morgan10.0%n/a –10.0%n/a60 –

Greece November 2025 – models:

PosModelNov-25%/24Oct2025%/24PosFY24
1Toyota Yaris Cross9098.7%+ 35.3%17,2225.4%– 5.8%11
2Peugeot 20085134.9%+ 116.5%26,2484.7%+ 28.6%23
3Toyota Yaris 3913.7%+ 17.8%45,0363.8%– 23.5%32
4Citroen C33833.7%+ 58.3%104,8523.6%+ 1.7%44
5Suzuki Vitara3133.0%+ 19.9%54,0003.0%– 10.0%55
6Renault Clio3123.0%– 3.4%123,0232.3%+ 47.4%1212
7Dacia Sandero2352.2%+ 32.0%72,5121.9%+ 82.6%1521
8BMW 1-Series2162.1%+ 107.7%441,9961.5%+ 51.7%2031
9Citroen C3 Aircross2042.0%n/a169870.7%– 31.4%4232
10Suzuki Swift2021.9%+ 45.3%63,3622.5%+ 90.7%619
11Opel Mokka2001.9%+ 42.9%82,2751.7%+ 130.7%1746
12BMW X11971.9%– 25.9%112,5921.9%– 11.8%148
13Toyota Corolla Cross1951.9%+ 35.4%171,7711.3%+ 13.5%2322
14Opel Frontera1711.6%new91,0580.8%new39 –
15Ford Puma1601.5%– 12.6%211,8521.4%– 8.8%2215
16Peugeot 30081601.5%+ 29.0%141,2861.0%– 16.2%3226
17Toyota C-HR1601.5%– 36.8%33,2472.4%+ 18.5%711
18Peugeot 2081491.4%– 45.6%153,1802.4%+ 2.9%89
19Mini Countryman1481.4%+ 42.3%351,0610.8%– 0.6%3836
20MG ZS Max1461.4%+ 5.0%231,8771.4%+ 1080.5%2187
21Opel Corsa1461.4%– 46.3%463,0922.3%– 8.7%97
22BMW X21391.3%– 19.2%819690.7%+ 40.6%4352
23Mazda21351.3%+ 40.6%311,5251.1%– 2.5%2524
24Hyundai i101241.2%+ 24.0%192,1411.6%+ 41.0%1825
25Hyundai Kona1211.2%+ 163.0%271,3681.0%+ 40.7%2948
26Audi Q31181.1%+ 35.6%598350.6%– 29.1%4441
27Jeep Avenger1161.1%+ 81.3%401,4221.1%+ 65.3%2850
28VW T-Roc1121.1%– 46.4%261,3181.0%– 1.6%3133
29Dacia Duster1061.0%– 24.8%132,0641.5%+ 70.4%1929
30Renault Captur1001.0%– 18.7%368070.6%+ 46.2%4661
31Citroen C4970.9%+ 177.1%336690.5%+ 33.3%5266
32Chery Tiggo 7950.9%new473480.3%new76 –
33Hyundai i20910.9%– 48.0%222,6952.0%+ 25.7%1313
34Chery Tiggo 4890.9%new1111080.1%new134 –
35Nissan Qashqai890.9%– 25.2%251,4861.1%– 16.8%2618
36Volvo XC60870.8%+ 47.5%425730.4%+ 32.0%5865
37VW Tiguan860.8%– 16.5%321,2140.9%+ 28.2%3347
38Cupra Formentor770.7%+ 6.9%307200.5%+ 33.1%4962
39Toyota Aygo X770.7%– 44.6%182,3921.8%+ 13.7%1614
40Mercedes GLA750.7%+ 19.0%291,3391.0%+ 15.2%3039
41Nissan Juke750.7%– 26.5%241,7451.3%– 8.3%2416
42VW T-Cross750.7%– 44.0%431,4241.1%+ 36.4%2743
43Mini740.7%– 26.7%526730.5%+ 20.4%5160
44Renault Symbioz730.7%new862100.2%new95 –
45MG 3720.7%– 25.8%451,2130.9%+ 254.7%3470
46Suzuki SX4720.7%– 23.4%391,1020.8%+ 10.0%3645
47Audi A3680.7%– 59.8%381,0850.8%– 21.2%3730
48Hyundai Inster650.6%new544930.4%new64 –
49Hyundai Tucson640.6%– 41.3%281,0350.8%– 4.8%4042
50Mercedes GLC610.6%+ 27.1%574770.4%– 12.2%6563
51Kia Picanto590.6%– 35.2%343,0592.3%+ 68.8%1020
52BYD Seal U580.6%+ 205.3%415600.4%+ 803.2%59146
53Alfa Romeo Junior560.5%+ 700.0%496440.5%+ 7055.6%54172
54BYD Atto 3540.5%– 62.2%724030.3%– 36.1%7456
55Kia Sportage540.5%– 31.6%1085500.4%– 28.9%6055
56Jaecoo 7520.5%new512550.2%new84 –
57BYD Dolphin510.5%– 81.5%486460.5%+ 30.8%5357
58BYD Dolphin Surf480.5%new562110.2%new94 –
59Dacia Bigster480.5%new552010.2%new97 –
60Ford Kuga480.5%– 40.0%377950.6%+ 85.7%4867
61Tesla Model Y460.4%+ 0.0%795330.4%– 15.5%6358
62Skoda Fabia420.4%– 61.5%651,2050.9%– 24.5%3523
63Lexus LBX410.4%+ 0.0%784190.3%+ 63.7%7283
64Toyota Corolla410.4%– 29.3%666030.5%– 28.2%5654
65VW Golf410.4%– 22.6%875480.4%+ 58.8%6173
66Skoda Kamiq400.4%– 57.4%608070.6%– 26.4%4744
67Renault Arkana380.4%– 56.8%734250.3%+ 8.1%7169
68Ford Explorer360.3%+ 414.3%891960.1%+ 366.7%99158
69Volvo XC40340.3%– 40.4%1062130.2%– 43.2%9377
70BMW X3330.3%+ 560.0%612650.2%+ 132.5%82113
71Jeep Compass330.3%– 49.2%504500.3%– 26.2%6959
72Omoda 5330.3%new921380.1%new120 –
73Opel Astra330.3%– 21.4%1716890.5%+ 244.5%5091
74Volvo EX30330.3%– 78.4%634640.3%– 45.3%6649
75Fiat Grande Panda320.3%new881360.1%new123 –
76BMW iX1290.3%+ 70.6%971890.1%+ 42.1%100103
77Kia Stonic290.3%– 63.3%531,0190.8%– 22.0%4135
78Audi Q5270.3%+ 350.0%931410.1%+ 46.9%118121
79MG HS270.3%+ 3.8%912190.2%– 19.5%9186
80VW Taigo260.2%– 42.2%765460.4%+ 88.3%6280
81Hyundai i30250.2%– 57.6%775840.4%– 59.7%5727
82Audi A1230.2%– 41.0%744270.3%+ 55.3%7081
83BYD Atto 2220.2%new821430.1%new117 –
84Mini Aceman220.2%+ 266.7%711780.1%+ 1877.8%108189
85Kia Xceed210.2%– 8.7%623300.2%– 38.9%7864
86Seat Ibiza210.2%+ 31.3%686430.5%– 29.6%5551
87BMW iX2200.2%+ 185.7%1131150.1%+ 74.2%130138
88Chery Tiggo 8200.2%new691360.1%new122 –
89VW Tayron200.2%new135560.0%new172 –
90Audi Q2180.2%– 84.7%754580.3%– 43.9%6853
91BMW 2-Series180.2%+ 80.0%942090.2%+ 60.8%96109
92Cupra Terramar180.2%+ 500.0%1002320.2%+ 7633.3%86261
93Citroen C5 Aircross170.2%+ 750.0%582650.2%+ 0.8%8388
94Lexus NX170.2%+ 70.0%1171370.1%+ 85.1%121139
95Geely EX5160.2%new1041030.1%new139 –
96Hyundai Bayon160.2%– 65.2%674160.3%– 63.8%7340
97Honda Jazz150.1%+ 50.0%1471110.1%+ 8.8%133115
98Jeep Renegade150.1%– 65.9%952410.2%– 34.5%8572
99Leapmotor T03150.1%+ 66.7%901630.1%+ 805.6%112177
100Mercedes GLE150.1%+ 36.4%1201060.1%+ 21.8%135125
101Renault 5140.1%new96790.1%new152 –
102Toyota RAV4140.1%– 56.3%803130.2%– 18.1%7971
103BYD Sealion 7130.1%new115820.1%new150 –
104Peugeot 5008130.1%+ 62.5%1101010.1%+ 236.7%140184
105Porsche Macan130.1%+ 44.4%1231160.1%+ 152.2%129151
106Renault Austral130.1%+ 550.0%160390.0%+ 30.0%189182
107Seat Arona130.1%+ 160.0%1051810.1%– 11.3%10497
108Volvo XC90130.1%+ 44.4%1511010.1%+ 16.1%141118
109BMW 3-Series120.1%+ 50.0%1361030.1%– 11.2%138111
110Ford Capri120.1%new125560.0%new170259
111KGM Tivoli120.1%new1261330.1%new124 –
112Range Rover Sport120.1%– 47.8%1121440.1%– 2.0%116102
113Renault Rafale120.1%new142230.0%new217 –
114Seat Leon120.1%– 25.0%831840.1%– 4.7%10294
115Skoda Octavia120.1%+ 50.0%1502200.2%– 38.7%9074
116BMW i4110.1%+ 37.5%153560.0%– 15.2%169137
117BMW X5110.1%– 26.7%1181110.1%+ 2.8%132112
118DS No4110.1%new –110.0%new244 –
119Nissan X-Trail110.1%– 26.7%2041380.1%– 32.4%11995
120Range Rover Evoque110.1%+ 0.0%981450.1%– 15.7%11599
121Changan Deepal S05100.1%new218110.0%new242 –
122Honda HR-V100.1%+ 0.0%1191190.1%– 2.5%126108
123Peugeot 408100.1%+ 400.0%233680.1%+ 78.9%158171
124Skoda Kodiaq100.1%– 70.6%842950.2%+ 12.2%8085
125VW ID.4100.1%– 23.1%213720.1%– 11.1%155134
126Ford Focus90.1%– 52.6%1381620.1%– 0.6%114100
127Leapmotor B1090.1%new –90.0%new254 –
128Mazda CX-3090.1%– 10.0%148650.0%– 5.8%160145
129Mercedes CLE90.1%– 18.2%157910.1%+ 54.2%142149
130Mini Cabrio90.1%n/a1491640.1%+ 141.2%111147
131Alfa Romeo Tonale80.1%– 60.0%1031800.1%– 25.0%10590
132Cupra Leon80.1%– 77.8%851770.1%– 44.7%10979
133Dacia Jogger80.1%– 46.7%1161180.1%– 31.0%12798
134Fiat 60080.1%– 60.0%703320.2%+ 418.8%77144
135Lynk & Co 0280.1%new101560.0%new171 –
136Skoda Scala80.1%+ 33.3%1621980.1%– 31.7%9884
137Volvo EX4080.1%new102910.1%new143110
138VW Polo80.1%– 96.3%1282940.2%– 76.0%8138
139VW Transporter80.1%n/a175430.0%– 46.3%185141
140Audi A570.1%n/a189500.0%+ 1150.0%177268
141DS 770.1%– 46.2%1092220.2%+ 2.3%8993
142Hyundai Santa Fe70.1%n/a179360.0%+ 414.3%192242
143Hyundai Staria70.1%new1304600.3%new67 –
144Mercedes E-Class70.1%– 22.2%170570.0%– 37.4%168127
145Mercedes Vito, Viano70.1%+ 600.0%1841870.1%+ 34.5%101106
146NIO Firefly70.1%new –80.0%new261 –
147Audi Q460.1%– 81.8%991790.1%– 34.9%10682
148Honda CR-V60.1%+ 50.0%197310.0%– 34.0%200167
149Hyundai Ioniq 560.1%+ 20.0%139650.0%– 26.1%159131
150Kia EV360.1%– 33.3%1072270.2%+ 2422.2%87227
151Mercedes A-Class60.1%– 73.9%1691820.1%– 43.1%10375
152Skoda Elroq60.1%new133880.1%new146 –
153Audi A650.0%n/a176180.0%+ 350.0%224271
154Ford Tourneo Custom50.0%+ 150.0%178520.0%– 45.8%176123
155Mercedes C-Class50.0%– 44.4%226380.0%– 57.8%190128
156Mercedes EQA50.0%– 72.2%183650.0%– 52.6%161105
157Opel Grandland50.0%+ 25.0%641680.1%– 26.6%11092
158Porsche Cayenne50.0%– 44.4%1411200.1%– 4.8%125107
159Subaru Crosstrek50.0%+ 25.0% –170.0%+ 41.7%226222
160Tesla Model 350.0%– 95.4%1243920.3%– 65.7%7537
161Volvo C40/EC4050.0%– 66.7%134530.0%– 35.4%175133
162VW ID.350.0%– 44.4%143860.1%– 37.2%147104
163Aion V40.0%new –40.0%new285 –
164BMW 5-Series40.0%– 33.3% –550.0%+ 57.1%173175
165BYD Seal40.0%– 69.2%154450.0%– 38.4%183142
166DFSK 60040.0%n/a164460.0%+ 1050.0%182275
167DS 440.0%– 66.7%1291050.1%– 50.7%13696
168Ford Mustang Mach-E40.0%– 42.9%146370.0%– 53.2%191132
169KGM Korando40.0%new181350.0%new193 –
170KGM Torres40.0%new182220.0%new219 –
171Lexus UX40.0%– 33.3%131710.1%+ 31.5%157155
172Lynk & Co 0840.0%new167190.0%new221 –
173Mazda CX-6040.0%– 55.6%224210.0%– 19.2%220190
174Mazda340.0%– 33.3%156330.0%+ 32.0%197192
175Mercedes GLB40.0%– 69.2%1321050.1%– 65.6%13778
176MG ZS40.0%– 83.3%1218220.6%– 58.1%4517
177Porsche 91140.0%+ 300.0%205310.0%+ 138.5%201219
178VW Caddy40.0%+ 33.3%1881170.1%+ 25.8%128124
179Audi Q630.0%– 25.0%144420.0%+ 500.0%186253
180Changan Deepal S0730.0%new145120.0%new238 –
181Ford Mustang30.0%n/a –130.0%+ 1200.0%234289
182Jeep Wrangler30.0%– 40.0%165610.0%+ 221.1%166203
183Nissan Primastar30.0%+ 50.0%1221150.1%+ 76.9%131148
184Porsche Panamera30.0%n/a206270.0%+ 68.8%208204
185Range Rover Velar30.0%– 25.0%114630.0%+ 34.0%164166
186Skoda Enyaq30.0%– 57.1%234500.0%– 54.5%178116
187Smart #130.0%new172620.0%new165232
188Volvo V6030.0%+ 50.0%212160.0%– 44.8%228183
189VW ID.Buzz30.0%– 25.0%214240.0%+ 20.0%213187
190Audi Q720.0%+ 100.0% –100.0%+ 42.9%248244
191BMW 4-Series20.0%+ 100.0%190400.0%– 23.1%188162
192BMW i520.0%n/a217110.0%+ 37.5%241246
193BMW XM20.0%n/a191230.0%+ 15.0%214197
194DFSK 50020.0%n/a194900.1%+ 2900.0%144283
195DFSK E520.0%+ 100.0%137890.1%+ 368.4%145207
196Dongfeng Box20.0%new155140.0%new232 –
197Lexus RZ20.0%n/a –70.0%+ 0.0%267250
198Lotus Eletre20.0%new –50.0%new284 –
199Mercedes G-Class20.0%+ 0.0%158330.0%+ 175.0%198223
200Mercedes Sprinter20.0%+ 0.0%202150.0%+ 15.4%229221
201NIO EL620.0%new –30.0%new304 –
202Peugeot 30820.0%– 98.1%159190.0%– 96.0%22268
203Peugeot Expert Traveller20.0%n/a140420.0%+ 75.0%187194
204Range Rover20.0%– 66.7%127490.0%– 49.5%180122
205Renault Trafic20.0%n/a209270.0%– 48.1%209164
206Toyota Land Cruiser20.0%– 71.4%174230.0%+ 91.7%218214
207Toyota Prius20.0%+ 100.0%21190.0%+ 50.0%258252
208Toyota Proace20.0%+ 100.0% –790.1%– 11.2%153117
209VW Multivan20.0%n/a23660.0%– 25.0%277248
210Bentley Bentayga10.0%n/a –50.0%+ 66.7%280279
211BMW iX10.0%n/a –80.0%– 42.9%260213
212BMW X610.0%– 83.3% –270.0%– 49.1%207156
213BMW X710.0%+ 0.0% –90.0%– 35.7%251215
214Citroen Jumpy Spacetourer10.0%n/a –230.0%– 23.3%215185
215DS 310.0%+ 0.0%195840.1%– 1.2%149135
216Fiat Panda10.0%– 98.6%203,0302.3%– 13.6%116
217Ford Tourneo Connect10.0%– 50.0%177280.0%+ 40.0%204201
218Ford Tourneo Courier10.0%– 50.0%196480.0%+ 29.7%181178
219Honda ZR-V10.0%– 90.0% –530.0%– 1.9%174159
220Lamborghini Urus10.0%n/a –40.0%n/a286 –
221Land Rover Defender10.0%– 90.0%166850.1%+ 0.0%148129
222Leapmotor C1010.0%– 50.0%199140.0%+ 75.0%233233
223Lexus RX10.0%– 50.0% –120.0%– 45.5%240199
224Maserati Grecale10.0%– 66.7%223110.0%– 31.3%245210
225Mazda CX-8010.0%+ 0.0%225110.0%+ 450.0%246305
226Mazda MX-510.0%– 50.0%168430.0%– 30.6%184150
227Mazda610.0%n/a –60.0%+ 500.0%271316
228Mercedes AMG GT10.0%n/a –30.0%+ 200.0%300317
229Mercedes EQB10.0%– 87.5% –290.0%– 42.0%202160
230MG 410.0%– 80.0%228650.0%– 60.6%163101
231Mitsubishi Space Star10.0%n/a –2240.2%– 12.2%8889
232Morgan Plus Four10.0%n/a –10.0%n/a371 –
233NIO ET510.0%new –10.0%new353 –
234Nissan Micra10.0%n/a23160.0%+ 100.0%272265
235Omoda 910.0%new185100.0%new250 –
236Renault Megane E-Tech10.0%– 66.7%20890.0%+ 125.0%256231
237Skoda Superb10.0%n/a –130.0%– 7.1%236211
238Smart #310.0%– 50.0%210260.0%+ 420.0%211235
239Subaru Forester10.0%+ 0.0%186810.1%+ 237.5%151195
240Suzuki Wagon R10.0%+ 0.0%10.0%+ 0.0%370329
241Toyota bZ4X10.0%– 85.7%187730.1%+ 121.2%154180
242Toyota Proace City Verso10.0%– 90.0% –1630.1%– 50.5%11376
244Volvo EX9010.0%new –240.0%new212260
245Zeekr 7X10.0%new15280.0%new263 –

Source: SEAA

Hidden Health Risks Of Eating In Cars

As millions prepare for Christmas journeys to visit family and friends, motorway service stations will be packed with travelers grabbing quick meals and snacks. But for those choosing to eat these purchases in their cars rather than inside the services, there are hidden health risks they should know about.

Vehicle interiors can harbor surprisingly high levels of bacteria - and the festive travel season, with its longer journeys and rushed meal stops, makes this problem even more pressing. Research has found that several areas inside vehicles actually contain more contamination than the average toilet seat, a comparison that might make you reconsider that next drive-through meal.

“The combination of factors inside a vehicle creates an environment where bacteria can flourish,” explains Kazimieras Urbonas, Supplier Excellence Manager at Ovoko, one of Europe's largest online marketplaces for used car parts. “When drivers eat inside their cars without understanding these risks or taking proper precautions, they're potentially exposing themselves to health hazards they'd never tolerate at home.”

Below, Urbonas explains why car interiors pose hidden health risks and shares expert advice on making your vehicle safer for eating.

Why Cars Are a Perfect Breeding Ground for Bacteria

Unlike kitchens, which are designed with hygiene in mind, cars create the perfect storm for bacterial growth. The enclosed space traps warmth from the engine, sunlight, and body heat, maintaining temperatures that allow microorganisms to multiply rapidly.

“Think about how often your car sits in direct sunlight or how warm it gets after you've been driving for a while,” says Urbonas. “These warm, humid conditions are exactly what bacteria need to thrive. Add food debris to the mix, and you've essentially created an incubator.”

Food particles easily become lodged in seat crevices, floor mats, and around the centre console. Even small crumbs can sustain bacterial colonies for extended periods. Unlike a kitchen table that gets wiped down after every meal, these areas often go weeks or months without proper cleaning.

High-touch surfaces present another problem. Steering wheels, gear sticks, and door handles are constantly touched by hands that have been exposed to petrol pumps, cash machines, and countless other contaminated surfaces throughout the day. When drivers eat without washing their hands first, they transfer these contaminants directly to their food.

The Dirtiest Places Inside Your Car

Research into vehicle hygiene has identified the most contaminated areas inside cars, with results that might surprise many drivers:

  • Boot – 1,425 bacteria identified: The car boot harbours the highest concentration of bacterial contamination. Items like shopping bags, sports equipment, and dirty shoes all contribute to this accumulation.
  • Driver's seat – 649 bacteria identified: The seat where most drivers spend hours each week contains nearly 650 different types of bacteria, fed by sweat, dead skin cells, and spilled food.
  • Gearstick – 407 bacteria identified: One of the most frequently touched surfaces in manual vehicles, the gearstick collects bacteria from hands throughout every journey.
  • Back seat – 323 bacteria identified: Often used for transporting shopping bags and passengers, the back seat becomes a repository for various contaminants.
  • Dashboard – 317 bacteria identified: Despite being a hard surface that should be easy to clean, the dashboard's various nooks and air vents trap dust and bacteria.
  • Steering wheel – 146 bacteria identified: Though it has fewer bacteria than other areas, the steering wheel is touched constantly, making it a key transmission point.

“What makes these findings particularly concerning is that the gearstick, dashboard, driver's seat, back seat, and boot all equal or exceed the bacterial contamination typically found on an average toilet seat and flush,” Urbonas points out. “Yet most people would never consider eating their lunch off of a toilet seat.”

What Happens When You Eat in a Contaminated Environment

Urbonas warns that consuming food in a bacteria-rich environment creates multiple health risks. Cross-contamination occurs when bacteria from surfaces transfer to hands, then to food, and finally into the body. This is particularly problematic with foods eaten by hand, such as sandwiches, crisps, or fruit.

“When you're eating in your car, you're usually touching contaminated surfaces and then handling your food without washing your hands,” explains Urbonas. “This direct transfer pathway makes it easy for harmful bacteria to enter your system.”

Respiratory health can also be affected. Mould and fungi that develop in damp areas of the vehicle, such as under floor mats or in air conditioning systems, release spores into the enclosed cabin air. When combined with eating, you're not only consuming food but also inhaling these airborne contaminants.

Digestive problems can result from ingesting bacteria commonly found in vehicle interiors. While healthy immune systems can often fight off low levels of contamination, repeated exposure or particularly high bacterial loads can lead to stomach upset, nausea, or more serious gastrointestinal issues.

How to Make Your Car Safe Enough to Eat In

Urbonas recommends establishing regular cleaning routines to reduce bacterial contamination. Weekly vacuuming removes food debris before it can attract bacteria, while monthly deep cleaning of all surfaces with appropriate disinfectants keeps contamination levels down.

“Use disinfectants specifically designed for automotive interiors,” he advises. “Some household cleaners can damage car materials, but automotive-specific products are formulated to clean effectively without causing harm.”

Pay particular attention to high-touch surfaces. Steering wheels, gearsticks, and door handles should be wiped down regularly, ideally after each journey where you've stopped for fuel or touched public surfaces.

Ventilation plays a vital role in maintaining a healthier car interior. Opening windows for a few minutes before eating helps circulate fresh air and reduces humidity levels that bacteria need to multiply. Regular air conditioning maintenance, including filter changes, prevents mould and fungi from colonizing the system and spreading spores throughout the cabin.

Volvo to End V60 Cross Country Sales in the US in 2026

Volvo Cars has confirmed it will discontinue the V60 Cross Country for the US market from April 2026, as shifting customer demand continues to favour SUVs over wagons. Final orders for the rugged estate will be accepted until late January, after which US buyers will have to rely on remaining dealer inventory. Production of the V60 Cross Country will continue for other global markets.

Volvo V60 Cross Country Front Three Quarter

The announcement coincides with Volvo’s 70th anniversary in the United States. The Swedish automaker entered the market in 1955 with the PV444 and has since sold around five million vehicles across the country. Over the decades, Volvo has steadily evolved its lineup to align with American preferences, most notably by expanding its SUV portfolio.

That strategy began with the launch of the XC90 in 2003 and continues today with models like the US-built EX90, which is assembled at Volvo’s South Carolina plant. The company has also revealed plans to further expand its American manufacturing footprint, with the XC60 set to be produced locally alongside a next-generation hybrid model tailored specifically for US customers.

While the V60 Cross Country bows out of the US market, Volvo says it remains committed to adapting its product range to local demand. To mark its seven-decade presence, the brand has launched a dedicated microsite highlighting key moments from its US journey.

As Volvo looks beyond its anniversary year, the focus remains firmly on SUVs and electrified models, reflecting the changing tastes of American buyers.

Can Your Car’s Color Affect Your Chances of Being in a Crash?

Car color impacts how fast other drivers see your vehicle on the road. Some colors jump out in almost any environment, while others disappear into the background and reduce reaction times.

Bmw I8 Colours

Image source

For years, drivers have asked how car color and crash risk are related, particularly since visibility changes with weather, lighting, and the rest of the landscape. While color can never dictate safety, it does determine how easily others perceive your vehicle when in a real-world traffic situation.

This article examines how visibility shifts with various colors and how safety is affected in various situations.

How Car Color Affects Visibility

Visibility depends on contrast. When a vehicle blends into the road, drivers cannot register it quickly, especially during lane changes, merges, or unprotected turns. Black, grey, and deep blue are colors that often blend into pavement, building shadows, or at night.

Conversely, light or strong shades have greater contrast. They remain visible in dim places, bright sun, or heavy traffic. Visibility issues become increasingly apparent at dawn, dusk, or in shadowed road segments, where muted colors merge with the background more quickly than drivers realize.

What Research Says About Crash Rates and High-Risk Car Colors

Different research has shown a similar pattern throughout the years, but the most consistent is a general point: the darker the car, the more likely it is to be involved in crashes. Black rates as the strongest, just behind navy, dark green, and charcoal. These colors soak up light, not reflect it, making it much harder to observe from a distance.

Lighter shades, white, silver, and beige, show less crash involvement. Researchers say this suggests higher levels of detectability both during daytime and nighttime driving. The color of a car never guarantees an outcome, but data indicates that visibility is a significant factor in driver response time.

Bright and Light-Colored Cars Are Easier to See

Light colors reflect more light and allow drivers to quickly recognize these visual cues. White sticks out in nearly every context, which is why it often ends up as one of the safest color preferences. Yellow and orange also catch the eye quickly since the human eye tends to immediately see warm hues. A bright red tone is generally best against both natural and urban terrain, as it serves as a harsh contrast.

Weather, Lighting, and Environment: The Effect of Color On Safety

Changes in the weather can affect visibility on the road almost instantly. Fog, rain, and snow affect virtually every hue on the spectrum. Dark cars look almost invisible in heavy rain, and silver or grey cars disappear into the overcast sky and wet ground.

Lighting conditions aren’t less important. Streetlights, headlights, and reflective signs influence the play of colors at night. In underlit roads, the problem is compounded, making dark-colored cars invisible.

The cityscape introduces a new dimension: the shadows from tall buildings and glass distort color contrast during the day. Color alone isn’t enough to help prevent accidents, but it does impact visibility and plays a role in accidents.

Other Factors That Affect Accidents

It’s not paint that has a huge impact, but other factors like driver attention, lane discipline, speed management, and vehicle maintenance impact the results too. Even the brightest car could get in an accident if headlights fade, mirrors remain dirty, or the driver just drifts through traffic oblivious to it.

Safety technology, like lane assist, blind spot monitoring, and automatic braking, vastly reduces the risk of accidents, whether your car is black or white. Road awareness remains the most effective way to combat crashes.

Conclusion

Your car's color makes others likely to recognize it, and some colors provide better visibility compared to others. However, overall safety depends on your driving habits, awareness, and the condition of your vehicle.

Even better, awareness on the road makes more of a dent in reducing crash rates than any old paint code on a dealership lot.

Key Takeaways

  • Dark colors are more prevalent in crashes, due to their lower visibility. Bright or light cars are visible in different settings.
  • The visibility of all colors is dramatically altered by weather and lighting.
  • Driver behavior and safety technology matter more than color.
  • Color affects detection, but habits affect long-term accident prevention.

Cyprus November 2025: BMW X1 (+212.5%), Jeep Avenger (+70.8%), Hyundai Tucson (+61.8%) stand out

The BMW X1 jumps inside the Top 10 in November.

According to our local partners SEMO Cyprus and INNOSOFT, the Cypriot new car drops -8.6% year-on-year in November to 980 units. The year-to-date tally is also in negative at -3.1% to 13,930. This month Toyota (+15.6%) ascends to its first win of the year with a splendid 12.9% share vs. 9.7% year-to-date. Kia (-25.2%) falls to #2 but retains the YTD top spot by far at 15.4% share. Hyundai (+17.3%), Mercedes (+30.2%), Audi (+17%), Jeep (+5.2%) and BMW (+33.3%) all shine in the remainder of the Top 10. Further down, Dacia (+78.9%), Skoda (+35.3%) and Lexus (+23.8%) stand out while BYD falls 11 spots on last month to #17.

Model-wise, the Hyundai Tucson (+61.8%) takes the lead with 5.6% share vs. 4% so far this year, it distances the Nissan Qashqai (+9.3%) up two spots on last month to #2 and the Jeep Avenger (+70.8%) staying at a record third place. The Kia Sportage (-14%) and Toyota Yaris Cross (-22.2%) suffer but each gain three ranks on October to close out the Top 5. The BMW X1 (+21.2.5%) surges to #8 while the Toyota RAV4 (+100%) rounds out the Top 10 in spectacular fashion.

Previous month: Cyprus October 2025: BYD improves further to #6 and 6.3% share

One year ago: Cyprus November 2024: Nissan snaps brands top spot

Full November 2025 Top 32 All brands and Top 20 models below.

Cyprus November 2025 – brands:

PosBrandNov-25%/24Oct2025%/24PosFY24
1Toyota12612.9%+ 15.6%31,3469.7%– 7.4%22
2Kia899.1%– 25.2%12,14315.4%– 22.7%11
3Hyundai889.0%+ 17.3%41,2288.8%– 2.7%35
4Nissan838.5%– 41.5%21,1998.6%– 16.2%44
5Volkswagen697.0%– 34.3%51,1928.6%– 22.5%52
6Mercedes697.0%+ 30.2%86834.9%+ 3.5%77
7Audi626.3%+ 17.0%125033.6%– 13.6%108
8Jeep616.2%+ 5.2%95764.1%+ 55.3%99
9BMW484.9%+ 33.3%107295.2%+ 0.3%66
10Renault343.5%– 32.0%76304.5%+ 81.0%811
11Dacia343.5%+ 78.9%114523.2%+ 63.2%1116
12Lexus262.7%+ 23.8%212111.5%+ 13.4%1818
13Skoda232.3%+ 35.3%163342.4%– 1.8%1312
14Ford212.1%– 25.0%194102.9%+ 6.5%1210
15Porsche171.7%+ 13.3%172571.8%– 1.5%1615
16Volvo171.7%– 34.6%132451.8%+ 7.9%1717
17BYD161.6%new61841.3%new20 –
18Peugeot151.5%+ 150.0%142061.5%+ 1960.0%1931
19Honda121.2%+ 71.4%201210.9%– 11.0%2221
20MG111.1%+ 83.3%281300.9%– 24.0%2119
21Mini90.9%– 79.1%182752.0%+ 5.4%1414
22Land Rover90.9%– 69.0%152711.9%– 14.8%1513
23Cupra90.9%+ 800.0%221140.8%+ 37.3%2324
24Ssangyong80.8%+ 100.0%23770.6%– 22.2%2523
25Suzuki50.5%+ 150.0%27590.4%– 25.3%2825
26Seat40.4%– 82.6%30930.7%+ 2.2%2422
27Mazda30.3%– 83.3%24740.5%– 50.3%2620
28Citroen30.3%+ 200.0%26610.4%+ 1425.0%2733
29Opel30.3%n/a25360.3%+ 800.0%2936
30Alfa Romeo30.3%+ 200.0%31190.1%– 9.5%3127
31Fiat20.2%n/a3440.0%– 75.0%3728
32Bentley10.1%n/a29230.2%+ 53.3%3030

Cyprus November 2025 – models:

PosModelNov-25%/24Pos2025%/24PosFY24
1Hyundai Tucson555.6%+ 61.8%25634.0%– 28.3%33
2Nissan Qashqai474.8%+ 9.3%45133.7%– 22.4%44
3Jeep Avenger414.2%+ 70.8%33702.7%+ 193.7%721
4Kia Sportage373.8%– 14.0%76184.4%– 30.3%22
5Toyota Yaris Cross282.9%– 22.2%83152.3%– 35.1%106
6Kia Stonic272.8%– 18.2%17485.4%– 29.6%11
7VW T-Roc272.8%– 35.7%64663.3%– 18.4%55
8BMW X1252.6%+ 212.5%n/a2411.7%+ 73.4%1322
9Toyota C-HR222.2%+ 0.0%93532.5%+ 7.0%810
10Toyota RAV4222.2%+ 100.0%102091.5%+ 3.0%1713
11Nissan Juke202.0%– 47.4%54072.9%– 6.4%68
12Dacia Duster191.9%+ 90.0%n/a1971.4%+ 50.4%1827
13VW T-Cross161.6%– 30.4%n/a2411.7%– 44.9%127
14Nissan X-Trail151.5%+ 200.0%n/a1691.2%– 18.0%2014
15Kia Xceed141.4%n/an/a2321.7%n/a1511
16Toyota Yaris141.4%+ 16.7%n/a1411.0%– 2.8%2420
17Volvo XC40131.3%n/an/a1371.0%n/a25n/a
18Dacia Sandero121.2%+ 33.3%n/a1341.0%+ 1.5%2626
19Toyota Corolla111.1%– 15.4%n/a1451.0%+ 9.8%2223
20Audi Q3111.1%– 52.2%n/a1270.9%– 32.8%2815
n/aMercedes GLC111.1%+ 0.0%n/a1200.9%– 0.8%2930
n/aRenault Arkana80.8%– 72.4%n/a3482.5%+ 107.1%916
n/aMini Countryman80.8%– 80.5%n/a2401.7%– 3.6%1412
n/aVW Tiguan80.8%– 50.0%n/a1421.0%+ 3.6%2325
n/aFord Puma70.7%– 36.4%n/a1270.9%– 22.6%2717
n/aHyundai i10 (est)70.7%n/an/a1090.8%n/a30n/a
n/aKia Picanto50.5%– 64.3%n/a2181.6%– 42.5%169
n/aVW Taigo40.4%– 76.5%n/a1661.2%+ 23.9%2124
n/aHyundai Kona10.1%– 95.5%n/a3072.2%+ 138.0%1129
n/aKia EV310.1%newn/a1941.4%new19n/a

Source: SEMO Cyprus and INNOSOFT

BMW Munich Plant Prepares for New i3 Production

BMW Group Plant Munich has completed key functional checks of its manufacturing equipment ahead of production of the new BMW i3. The automaker confirmed that equipment installed in the new body shop and assembly line has successfully undergone dry-run testing, marking an important step in the plant’s transformation.

Warm Up For Neue Klasse At Bmw Group Plant Munich

The functional checks involved running every stage of the production process without vehicle parts. Production planners and plant technicians tested machinery cycle by cycle to ensure systems operate seamlessly before series production begins.

BMW will shift assembly of the i3 from its Research and Innovation Centre to Plant Munich in January, with series production scheduled to start in summer 2026. The move brings future electric vehicle manufacturing into the heart of BMW’s historic Munich facility.

The new body shop and assembly line were digitally planned and constructed using BMW Group’s Virtual Factory approach. Existing press shop and paint shop facilities were also integrated into the digital model, allowing engineers to validate production processes virtually before physical installation and testing.

Over the past 18 months, BMW has remodelled around one-third of the Munich plant site as part of this upgrade. Older halls were dismantled and replaced with a new assembly hall, logistics centre, and body shop. Notably, the redevelopment was carried out while the plant continued to build up to 1,000 BMW 3 Series and 4 Series vehicles per day.

Once fully operational, the upgraded Plant Munich will play a central role in BMW’s next phase of electric mobility, with the new i3 set to become one of its flagship locally produced EVs.

BYD Produces 15 Millionth New Energy Vehicle

BYD has crossed a major global milestone with the production of its 15 millionth new energy vehicle (NEV), underlining the rapid scale-up of the Chinese automaker’s electrification drive. Remarkably, the company moved from 10 million to 15 million NEVs in just 13 months, with the 14 millionth vehicle rolling off the line in October 2025.

Byd Celebrates Production Of The 15 Millionth New

The milestone was marked at BYD’s Jinan manufacturing facility in China, which has been in mass production for only three years. The 15 millionth vehicle was a DENZA N8L, a six-seat SUV from BYD’s premium sub-brand. Built on the Super Hybrid and e3 platform, the N8L shares its architecture with the Z9GT and forms part of DENZA’s preparations for its European debut in 2026.

BYD defines new energy vehicles as battery electric models and electrified vehicles using its Super Hybrid system with DM technology. The company’s NEV journey began in 2008 with the launch of the F3DM plug-in hybrid, taking 13 years to reach its first million units before accelerating rapidly over the past decade.

Production momentum remains strong. In the first 11 months of 2025, BYD produced 4.182 million vehicles, up 11.3 per cent year on year. Overseas sales reached 917,000 units during the same period, already surpassing the full-year total for 2024. Today, BYD operates in more than 110 countries and regions, with a presence in 33 European markets through around 1,000 sales outlets. The company plans to double its European dealership network by the end of 2026.

Heavy investment continues to fuel this growth. BYD spent RMB43.75 billion on research and development in the first three quarters of 2025 alone, driving advances in battery technology, intelligent driver assistance, and megawatt-level Flash Charging, slated for Europe in 2026.

Ather Price Hike: Electric Scooters to Get Costlier from January 2026

Ather Energy has announced a price increase across its electric scooter lineup, effective 1 January 2026. The revision will see prices go up by up to ₹3,000, with the company citing rising global costs of raw materials, foreign exchange pressures, and higher prices of key electronic components as the reasons behind the hike.

Ather Rizta

For prospective buyers, December offers a window to secure current prices before the increase comes into effect. Ather is currently running its ‘Electric December’ campaign, offering benefits of up to ₹20,000 in select cities. These benefits include instant credit card EMI discounts, cash incentives, and a complimentary eight-year extended battery warranty under Ather’s Eight70 programme on select models, along with financing support from multiple partners.

Now in its third year, Electric December continues to underline Ather’s focus on delivering long-term value to EV customers during the year-end buying season, backed by its integrated hardware-software approach and expanding after-sales network.

Ather’s product portfolio includes the performance-focused 450 series and the Rizta, the brand’s first family-oriented electric scooter. The Ather 450 range offers features such as multi-mode traction control, MagicTwist regenerative braking, and connected technology including Google Maps navigation, WhatsApp integration on the dashboard, and call and music controls.

The Rizta has emerged as a strong growth driver for the brand, recently crossing the 2 lakh sales milestone. Designed with everyday usability in mind, it offers up to 56 litres of storage, a wide seat, and generous floorboard space. Safety features include SkidControl, Fall Safe, Emergency Stop Signal, and theft and tow alerts. Ather also recently announced a touchscreen upgrade for the Rizta Z. Ather scooters are available via Experience Centres as well as online through Amazon and Flipkart.

Turkiye November 2025: Skoda (+64.8%), Renault (+25.6%) stand out in record market

Skoda ranks #10 in Turkiye in November.

All time record broken for the Turkish new light vehicle market, with November sales up a splendid 9.8% year-on-year to 132,984. The year-to-date tally is also at record pace, up 10.2% to 1,176,780. This month Renault (+25.6%) posts a fantastic score and reclaims the top spot it holds year-to-date with 11.9% share vs. 10.2% so far this year. Leader in October, Volkswagen (+11.8%) falls to #2 but still beats the market. Ford (+0.9%) is more discreet at #3, exchanging spots with a freefalling Fiat (-33.1%). Peugeot (+3.7%) closes the Top 5 in soft fashion. Skoda (+64.8%), Toyota (+26.9%) and Citroen (+26.8%) also shine in the remainder of the Top 10. Just below, BYD (+1225.6%) shoots up 11 spots on October to #11 and 4.1% share with almost 5,400 sales. Tesla (+36.3%) is back up to #16.

Previous month: Turkiye October 2025: Volkswagen #1, Togg T10F in Top 10

One year ago: Turkiye November 2024: Record market, Ford, Volkswagen and Peugeot stand out

Full November 2025 Top 51 All brands ranking below.

Turkiye November 2025 – brands:

PosBrandNov-25%/24Oct2025%/24PosFY24
1Renault15,81311.9%+ 25.6%2120,31310.2%+ 4.2%12
2Volkswagen11,5798.7%+ 11.8%195,6478.1%+ 14.6%34
3Ford10,6178.0%+ 0.9%491,0597.7%+ 3.8%43
4Fiat8,8706.7%– 33.1%3102,6818.7%– 16.4%21
5Peugeot8,6096.5%+ 3.7%874,9206.4%+ 19.1%65
6Toyota8,2976.2%+ 26.9%580,4776.8%+ 54.5%59
7Citroen7,6875.8%+ 26.8%760,7275.2%+ 14.9%88
8Opel6,9515.2%+ 3.7%664,6995.5%+ 21.0%77
9Hyundai6,2554.7%+ 6.0%959,6185.1%+ 9.2%96
10Skoda6,0564.6%+ 64.8%1139,5893.4%+ 4.8%1111
11BYD5,3954.1%+ 1225.6%2240,7703.5%+ 1807.8%1026
12Nissan4,4523.3%+ 61.1%1326,8992.3%+ 17.9%1615
13Togg4,2353.2%+ 0.3%1031,7152.7%+ 30.2%1314
14Mercedes3,6212.7%– 8.1%1236,4633.1%+ 6.2%1212
15BMW2,6042.0%– 31.2%1527,4952.3%+ 30.6%1516
16Tesla2,5351.9%+ 36.3% –29,9552.5%+ 224.6%1424
17Dacia2,4531.8%+ 17.0%2021,6601.8%– 29.4%1913
18Chery2,1041.6%– 32.2%1626,6632.3%– 50.5%1710
19Audi2,0951.6%+ 17.0%1421,2561.8%+ 31.3%2019
20Kia1,9251.4%– 1.9%1722,8781.9%+ 17.4%1818
21Volvo1,8081.4%+ 56.5%1912,9281.1%+ 11.8%2221
22Honda1,6971.3%+ 21.4%2114,6881.2%– 32.8%2117
23KG Mobility1,6941.3%+ 77.0%1812,6071.1%+ 19.4%2323
24Seat1,1130.8%– 53.9%237,4120.6%– 34.4%2722
25Jaecoo9020.7%+ 12.6%247,6330.6%+ 170.6%2630
26Mini8000.6%– 3.3%269,1890.8%+ 140.6%2528
27Cupra5020.4%– 57.4%2510,4850.9%+ 31.1%2425
28Suzuki4840.4%+ 137.3%275,2110.4%– 2.9%2827
29Jeep3200.2%+ 42.9%282,9830.3%– 0.3%3031
30Iveco2830.2%– 33.9%303,2680.3%+ 7.9%2929
31Land Rover1830.1%– 25.0%321,8670.2%– 30.4%3332
32Alfa Romeo1780.1%– 10.6%331,4820.1%+ 54.5%3435
33DS1470.1%– 13.0%292,0100.2%+ 19.9%3134
34Isuzu1380.1%– 26.2%351,3060.1%– 51.7%3633
35MG1070.1%– 70.9%341,9120.2%– 88.7%3220
36Lexus780.1%– 20.4%386950.1%– 3.1%4038
37Porsche760.1%– 44.1%361,0180.1%– 2.4%3736
38Tenax700.1%new397320.1%new39 –
39Foton550.0%new311,4770.1%new35 –
40Skywell470.0%+ 80.8%413020.0%– 13.7%4239
41Leapmotor370.0%+ 146.7%431820.0%– 9.0%4444
42Alpine320.0%+ 3100.0%42920.0%+ 1050.0%4654
43Subaru290.0%+ 11.5%404240.0%+ 41.8%4140
44Maxus160.0%+ 60.0%442370.0%– 12.9%4341
45Maserati80.0%– 65.2%451670.0%– 31.0%4543
46Bentley80.0%+ 166.7%51370.0%+ 15.6%4849
47Hongqi70.0%+ 600.0%47240.0%+ 71.4%5153
48Karsan40.0%– 55.6%50910.0%– 37.2%4745
49Aston Martin40.0%+ 300.0%49310.0%+ 181.8%4952
50Lamborghini30.0%+ 50.0%48250.0%+ 38.9%5051
51Ferrari10.0%+ 0.0%46220.0%+ 4.8%5250

Source: ODMD

Maruti Suzuki WagonR Gets Swivel Seat Option to Boost Inclusive Mobility

Maruti Suzuki India Limited has introduced a swivel seat option for the WagonR, marking a significant step towards promoting inclusive mobility in the mass-market car segment. Designed to make vehicle access easier for senior citizens and persons with disabilities, the swivel seat aims to extend the brand’s promise of delivering the ‘Joy of Mobility’ to a wider section of society.

Maruti Wagonr Front Seat Swivel View

The initiative draws inspiration from Suzuki’s global corporate slogan, ‘By Your Side’, and aligns with the United Nations’ Sustainable Development Goal 10, which focuses on reducing inequality. Maruti Suzuki says the move reflects its commitment to customer-centric, human-focused mobility solutions that cater to diverse needs.

To develop the swivel seat solution, Maruti Suzuki has partnered with Bengaluru-based startup TRUEAssist Technology under its startup incubation programme in collaboration with NSRCEL–IIM Bangalore. The swivel seat is offered as a retrofit kit and can be ordered at Maruti Suzuki Arena dealerships. It can be installed on new WagonR models as well as retrofitted to existing vehicles, expanding accessibility for current owners.

The WagonR’s tall-boy design, with its generous headroom and legroom, makes it well-suited for this feature by allowing easier ingress and egress. Initially, the swivel seat option will be available at over 200 Arena dealerships across 11 cities, with plans to expand availability based on customer demand.

From a safety standpoint, the WagonR swivel seat kit has been tested and certified by the Automotive Research Association of India (ARAI). The installation does not require any structural modifications to the vehicle and comes backed by a three-year warranty, offering added reassurance to customers.

Maruti Suzuki WagonR Crosses 3.5 Million Production Milestone in India

Maruti Suzuki India Limited has achieved a major production milestone with the WagonR, as cumulative output across three generations reaches 35 lakh units. Introduced in India in December 1999, the WagonR becomes the third Maruti Suzuki model after the Alto and Swift to cross this landmark, underlining its enduring popularity among Indian car buyers. The WagonR is currently manufactured at the company’s Gurgaon and Manesar plants in Haryana.

Maruti Wagon R 35 Lakh Production

Globally, the WagonR story began earlier, with Suzuki launching the model in Japan in 1993. Designed as a semi-bonnet mini wagon, it quickly gained recognition for its practicality and ease of use. Today, the WagonR is produced in multiple markets including Japan, India, Hungary and Indonesia, and is sold in over 75 countries and regions worldwide. In August 2025, global cumulative sales of the Suzuki WagonR crossed the one-crore mark.

In India, the WagonR has consistently evolved to meet changing customer expectations while retaining its core strengths of space and comfort. Over the years, it has helped redefine the family hatchback segment by adding contemporary design updates, improved safety, and premium features.

The latest-generation WagonR is built on Suzuki’s fifth-generation HEARTECT platform and comes equipped with six airbags as standard. Safety features include ABS with EBD and Electronic Stability Program (ESP). On the comfort front, the hatchback offers a 7-inch SmartPlay Studio touchscreen infotainment system with Apple CarPlay and Android Auto, Bluetooth connectivity, and voice command functionality.

2026 Bajaj Pulsar 220F Launched with LED Blinkers and Fresh Colours

Bajaj Auto has introduced the updated 2026 Pulsar 220F in India, giving its iconic fully-faired motorcycle a subtle yet relevant refresh. Priced at ₹1.28 lakh (ex-showroom), the new Pulsar 220F is now available across Bajaj dealerships nationwide.

2026 Bajaj Pulsar 220

For 2026, the Pulsar 220F gets refreshed graphics and four new colour options — Black Cherry Red, Black Ink Blue, Black Copper Beige, and Green Light Copper. Adding to its modern appeal, Bajaj has equipped the motorcycle with new LED turn indicators, bringing the ageing design in line with current styling trends while retaining its familiar sporty silhouette.

Feature-wise, the Pulsar 220F continues to offer a well-rounded package aimed at everyday riders. It comes with a digital instrument console featuring Bluetooth connectivity, Ride Connect app support, and turn-by-turn navigation. Braking duties are handled by front and rear disc brakes supported by single-channel ABS, while five-spoke alloy wheels complete the setup.

Powering the motorcycle is the trusted 220cc single-cylinder, Twin Spark DTS-i engine. The fuel-injected, oil-cooled motor produces 20.9 PS at 8,500 rpm, delivering a balance of performance, efficiency, and long-term reliability that has defined the Pulsar 220F’s popularity over the years.

With these updates, Bajaj aims to keep the Pulsar 220F relevant for riders seeking a proven, performance-oriented motorcycle with modern features and an aggressive road presence.

New Zealand November 2025: Toyota RAV4 #1, Suzuki Fronx in Top 10

Second ever Top 10 finish in New Zealand for the Suzuki Fronx.

New vehicle sales in New Zealand drop -12.8% year-on-year in November to 13,615 units, yet the year-to-date tally remains in clear positive at +8.5% to 128,769. Toyota (-14%) single handedly pulls the market down, with the next 9 carmakers up. BYD (+224.8%) is the most dynamic of all and is inside the Top 10 for the 6th time this year. Kia (+128.7%) is also very dynamic YoY at #4, but that’s compared to a particularly low year-ago result. Honda (+46.2%), Mazda (+36.5%), Hyundai (+35.9%), Mitsubishi (+30.8%), MG (+26.5%) and Suzuki (+25.3%) also shine while Ford (+11.7%) is more discreet but still manages a double-digit gain and at 13.3% share, it is two percentage points above its YTD level.

Model-wise, the Toyota RAV4 (-33%) remains the dominant force with 9.2% share, the steep fall being due to a record November 2024 at 12% share. The Ford Ranger (+26.5%) follows, ahead of the Toyota Hilux (+12.7%) and Mitsubishi ASX (+67.6%), replicating the YTD Top 4. Excellent result also for the Ford Everest at #5 and 3.9% share vs. 2.4% so far this year. The Mitsubishi Outlander (+167.3%) does even better at #6 while the Toyota Yaris Cross (+3.9%) edges up YoY at #7. Second ever Top 10 finish for the new Suzuki Fronx at #8. The BYD Shark 6 is just outside the Top 20.

Previous month: New Zealand October 2025: RAV4, Yaris Cross, Corolla push Toyota to highest in almost 6 years

One year ago: New Zealand November 2024: Toyota RAV4 hits record share

Full November 2025 Top 20 brands and models below.

New Zealand November 2025 – brands:

PosBrandNov-25%/24Oct2025%/24PosFY24
1Toyota3,51925.8%– 14.0%131,11424.2%+ 11.7%11
2Ford 1,81713.3%+ 11.7%214,52111.3%– 9.3%22
3Mitsubishi1,3289.8%+ 30.8%313,12510.2%+ 1.1%33
4Kia7735.7%+ 128.7%48,6286.7%+ 6.5%44
5Mazda5914.3%+ 36.5%64,5753.6%+ 23.4%68
6Suzuki5804.3%+ 25.3%94,6663.6%– 6.3%55
7Hyundai4773.5%+ 35.9%54,0013.1%+ 3.6%87
8Honda4273.1%+ 46.2%83,3962.6%+ 21.5%1110
9BYD3932.9%+ 224.8%143,5102.7%+ 317.9%1022
10MG3682.7%+ 26.5%73,8733.0%+ 37.5%911
11Volkswagen3162.3%– 0.3%152,2501.7%– 28.3%139
12GWM2762.0%+ 37.3%103,3732.6%+ 21.9%1212
13Nissan2071.5%– 15.2%114,4063.4%+ 5.8%76
14Chery1811.3%new128940.7%new2493
15Subaru1681.2%+ 14.3%162,1351.7%+ 24.5%1415
16Mercedes1521.1%– 39.9%132,0941.6%– 8.0%1514
17BMW1501.1%+ 94.8%181,6941.3%+ 27.7%1616
18Tesla1481.1%+ 604.8%n/a1,3931.1%+ 34.3%1818
19Isuzu1471.1%– 29.7%191,6831.3%– 31.6%1713
20Audi1270.9%+ 51.2%201,2461.0%+ 20.9%2120

New Zealand November 2025 – models:

PosModelNov-25%/24Oct2025%/24PosFY24
1Toyota RAV41,2579.2%– 33.0%110,3958.1%+ 9.0%12
2Ford Ranger 1,0307.6%+ 26.5%28,8946.9%– 13.4%21
3Toyota Hilux6214.6%+ 12.7%37,8556.1%+ 14.3%33
4Mitsubishi ASX5584.1%+ 67.6%74,6353.6%+ 31.5%45
5Ford Everest5273.9%+ 37.6%63,1092.4%+ 43.7%710
6Mitsubishi Outlander4253.1%+ 167.3%44,0783.2%+ 31.0%56
7Toyota Yaris Cross3482.6%+ 3.9%5n/an/an/an/a13
8Suzuki Fronx3022.2%newn/an/an/anewn/a –
9Hyundai Tucson2722.0%n/a91,6261.3%n/a14n/a
10Toyota Corolla2712.0%– 35.3%81,8701.5%+ 8.5%1112
11Kia Seltos2241.6%+ 286.2%123,1612.5%+ 6.2%67
12Toyota Highlander2171.6%– 1.8%n/an/an/an/an/a20
13Mitsubishi Triton2031.5%– 21.6%102,9932.3%– 26.1%84
14Mazda CX-51961.4%+ 12.6%221,5081.2%– 5.1%1716
15Toyota Hiace1831.3%+ 52.5%111,9331.5%+ 16.4%1015
16Toyota Prado1641.2%– 18.4%201,5931.2%n/a15n/a
17MG ZS1631.2%+ 20.7%171,8661.4%+ 32.3%1218
18Toyota Yaris1621.2%+ 26.6%16n/an/an/an/an/a
19Kia Sportage1591.2%+ 261.4%14n/an/an/an/a14
20Mercedes Sprinter1551.1%+ 25.0%n/an/an/an/an/an/a
n/aBYD Shark 61391.0%newn/a1,7541.4%new13 –
n/aFord Transit1180.9%+ 16.8%251,1970.9%– 12.5%2019
n/aFiat Ducato850.6%– 56.0%n/an/an/an/an/an/a
n/aIsuzu D-Max830.6%– 11.7%n/a7810.6%– 37.2%n/an/a
n/aNissan Navara810.6%– 28.9%n/a2,2381.7%+ 23.2%911

Source: Auto Talk

KTM 160 Duke Gets TFT Display and Connected Tech Upgrade

KTM has updated its popular 160 Duke in India with a major tech upgrade, introducing a new 5-inch colour TFT display with bonded glass and smartphone connectivity. Borrowed from the Gen-3 KTM 390 Duke, the new screen adds a premium touch to the entry-level streetfighter. The updated KTM 160 Duke with TFT display is priced at ₹1,78,536 (ex-showroom, Delhi), while the base variant continues at ₹1,70,545.

Ktm Duke 160 Instrument Cluster

The 5-inch TFT display is paired with a new switch cube featuring four-way menu controls, allowing riders to access vehicle functions and connected features with ease. When paired via Bluetooth using the KTM My Ride app, the system enables turn-by-turn navigation, incoming call alerts, and music control, all displayed clearly on the TFT screen.

Navigation is handled through the KTM Connect app, which mirrors directions directly onto the instrument cluster, helping riders stay focused on the road. Bluetooth connectivity also allows riders to view and manage incoming calls, with the option to accept or decline using the handlebar switch. For safety reasons, outgoing calls and access to the phone’s contact list are disabled while riding.

With a compatible Bluetooth helmet headset paired, riders can also control music playback, switch tracks, and adjust volume directly from the left handlebar, with track information shown on the display.

Already a favourite among young riders, the KTM 160 Duke is known for its strong power-to-weight ratio and sharp street performance. This latest technology upgrade further enhances its appeal, making the 160 Duke a more connected and feature-rich option in the competitive entry-level performance motorcycle segment.

Hungary November 2025: Toyota Yaris Cross hits record ranking at #3, Opel Frontera #10, Jaecoo 7 #14

19/12 update: Now with November Top 25 models and YTD Top 115 models.

10,754 new passenger cars found a buyer in Hungary in November, a shy 1% year-on-year growth. This is however still a strong month as November 2024 was up 28% on the year prior. The year-to-date tally is now up 6.9% to 117.510. These totals climb to 12,929 and 138,748 (+4.8%) when adding Light Commercials. In the PC brands ranking, Skoda (+3.8%) climbs to first place for the first time since September 2024 with 11% share vs. 8.8% year-to-date. #1 last month, Toyota (+4.2%) drops to #2, distancing a freefalling Suzuki (-28.1%). Suzuki however remains the #1 brand year-to-date with 11.1% share but is threatened by Toyota just 287 sales below. Hyundai (+69.6%), Opel (+26%), Dacia (+23.1%) and BMW (+14.8%) all shine below.

The Skoda Octavia (+7.3%) takes the lead of the models charts for the first time since last July with 4.5% share. It however remains #2 year-to-date below the locally assembled Suzuki S-Cross (-12.2%) in difficulty this month. The Toyota Yaris Cross (+73.4%) surges ahead yoy and ranks #3 for the month, a new ranking record for the nameplate. Meanwhile the Suzuki Vitara implodes at -37.1%. The Hyundai Tucson (+148%), Toyota C-HR (+61.1%), Ford Transit Custom (+41.9%) and Dacia Duster (+27.6%) also shine  below. The surprise at #10 is the new Opel Frontera with 1.3% share, while the new Jaecoo 7 climbs up to #14.

Previous month: Hungary October 2025: Yaris Cross, Corolla Cross pull Toyota to #1 brand

One year ago: Hungary November 2024: Strong market at +28%

Full November 2025 Top 15 brands and Top 20 models, YTD Top 115 models below.

Hungary November 2025 – brands (Passenger Cars only):

PosBrand PC onlyNov-25%/24Oct2025 1-11%/24PosFY24
1Skoda1,18811.0%+ 3.8%310,3818.8%+ 2.8%33
2Toyota1,12010.4%+ 4.2%112,71010.8%– 1.9%22
3Suzuki9909.2%– 28.1%212,99711.1%– 9.2%11
4Volkswagen6746.3%– 1.2%48,1496.9%+ 0.8%44
5BMW6456.0%+ 14.8%66,5525.6%n/a77
6Hyundai5635.2%+ 69.6%74,8074.1%n/a910
7Dacia4754.4%+ 23.1%114,0993.5%n/a1111
8Mercedes4534.2%– 11.5%95,1894.4%n/a89
9Ford4364.1%– 43.1%57,9516.8%+ 27.4%55
10Kia4294.0%– 22.0%87,0276.0%+ 16.4%66
11Opel3643.4%+ 26.0%132,8302.4%n/a1412
12Renault3313.1%– 5.2%103,6223.1%n/a1213
13BYD3253.0%+ 87.9%141,8931.6%n/a1722
14Audi2602.4%+ 6.6%123,1082.6%n/a1315
15Peugeot2522.3%+ 15.1%n/a2,4472.1%n/a1617
n/aVolvo2382.2%– 2.9%n/a2,4482.1%n/a1514
n/aNissan1901.8%– 35.8%n/a4,3763.7%n/a108
n/aKGM/Ssangyong1681.6%+ 7.0%151,4151.2%n/a2018
n/aMG1231.1%+ 3.4%n/a1,7041.5%n/a1819
n/aTesla820.8%– 33.3%n/a1,5691.3%n/a1916

Hungary November 2025 – models (PC+LCV):

PosModelNov-25%/24Pos2025 1-11%/24PosFY24
1Skoda Octavia5874.5%+ 7.3%35,2493.8%– 4.9%21
2Suzuki S-Cross5314.1%– 12.2%15,9084.3%– 0.6%12
3Toyota Yaris Cross3712.9%+ 73.4%42,6731.9%+ 35.4%75
4Suzuki Vitara3492.7%– 37.1%25,0033.6%– 20.4%33
5Dacia Duster3472.7%+ 27.6%142,8352.0%+ 9.6%617
6Hyundai Tucson3102.4%+ 148.0%71,8321.3%+ 24.2%1512
7Ford Transit Custom (LCV)2712.1%+ 41.9%52,3011.7%– 4.0%104
8Ford Ranger2662.1%– 14.7%82,4701.8%+ 17.1%822
9Toyota C-HR2031.6%+ 61.1%92,1561.6%+ 3.5%1211
10Opel Frontera1731.3%newn/a6180.4%new59 –
11Toyota Corolla Cross1721.3%+ 59.3%61,6701.2%+ 26.6%177
12Skoda Scala1691.3%n/an/a9720.7%n/a3433
13Nissan Qashqai1571.2%– 23.0%172,8682.1%+ 2.1%420
14Jaecoo 71571.2%newn/a7780.6%new47n/a
15Skoda Superb1511.2%– 6.8%191,3010.9%+ 18.4%2113
16Toyota Corolla1481.1%– 43.1%182,2061.6%– 19.3%1124
17Kia Sportage1451.1%– 19.0%152,0481.5%+ 9.8%1315
18Kia Ceed1391.1%– 44.4%132,8552.1%+ 0.3%514
19Ford Puma1361.1%+ 23.6%n/a1,5951.1%+ 28.3%1826
20Ford Transit1351.0%– 17.2%n/a1,5031.1%+ 11.7%2028
21Mercedes Citan1321.0%+ 25.7%n/a9370.7%+ 174.0%3878
22Ford Kuga1301.0%– 50.8%121,5661.1%– 21.0%199
23Skoda Kodiaq1251.0%+ 5.0%n/a1,2830.9%+ 12.8%2231
24BYD Seal U1251.0%newn/a5690.4%new63 –
25VW Golf1210.9%– 20.4%161,6931.2%– 11.6%1619

Hungary January-November 2025 – models (PC+LCV)

PosModel2025 1-11%/24PosFY24
1Suzuki S-Cross5,9084.3%– 0.6%12
2Skoda Octavia5,2493.8%– 4.9%21
3Suzuki Vitara5,0033.6%– 20.4%33
4Nissan Qashqai2,8682.1%+ 2.1%420
5Kia Ceed2,8552.1%+ 0.3%514
6Dacia Duster2,8352.0%+ 9.6%617
7Toyota Yaris Cross2,6731.9%+ 35.4%75
8Ford Ranger2,4701.8%+ 17.1%822
9Ford Tourneo Custom2,3581.7%+ 76.2%96
10Ford Transit Custom (LCV)2,3011.7%– 4.0%104
11Toyota Corolla2,2061.6%– 19.3%1124
12Toyota C-HR2,1561.6%+ 3.5%1211
13Kia Sportage2,0481.5%+ 9.8%1315
14Suzuki Swift1,8601.3%+ 8.7%148
15Hyundai Tucson1,8321.3%+ 24.2%1512
16VW Golf1,6931.2%– 11.6%1619
17Toyota Corolla Cross1,6701.2%+ 26.6%177
18Ford Puma1,5951.1%+ 28.3%1826
19Ford Kuga1,5661.1%– 21.0%199
20Ford Transit1,5031.1%+ 11.7%2028
21Skoda Superb1,3010.9%+ 18.4%2113
22Skoda Kodiaq1,2830.9%+ 12.8%2231
23MG ZS1,2590.9%+ 20.4%2340
24VW T-Roc1,2100.9%+ 30.1%2421
25Renault Master1,2080.9%– 32.4%2516
26VW Tiguan1,1740.8%+ 21.4%2637
27Fiat Ducato1,1050.8%+ 18.9%2739
28Toyota RAV41,0890.8%– 17.8%2823
29Toyota Yaris1,0240.7%– 32.7%2918
30Tesla Model Y1,0220.7%– 1.8%3030
31Mercedes GLC/Coupe1,0200.7%+ 8.1%3136
32Omoda 59900.7%new32n/a
33Nissan X-Trail9820.7%+ 39.3%3325
34Skoda Scala9720.7%n/a3433
35Peugeot 30089610.7%+ 169.9%3590
36Renault Captur9550.7%+ 27.7%3644
37VW Passat9420.7%– 18.8%3729
38Mercedes Citan9370.7%+ 174.0%3878
39Toyota Hilux8950.6%– 58.2%3910
40KGM Korando8880.6%– 13.2%4032
41Ford Transit Custom (PC)8840.6%n/a41n/a
42Peugeot 20088670.6%+ 49.7%4266
43Renault Clio8570.6%– 7.3%4338
44Jeep Avenger8050.6%+ 208.4%44106
45Volvo XC608030.6%– 11.2%4535
46Volvo XC407790.6%+ 9.0%4648
47Jaecoo 77780.6%new47n/a
48BMW X57620.5%– 0.8%4845
49Opel Corsa7470.5%– 24.2%4934
50VW Crafter7240.5%+ 7.3%5052
51Opel Combo7010.5%+ 13.6%5163
52Hyundai Kona6840.5%+ 12.5%5262
53Mercedes Sprinter6800.5%– 19.4%5342
54VW Caddy6690.5%+ 2.0%5459
55Kia EV36650.5%#DIV/0!55 –
56Toyota Aygo X6500.5%– 14.0%5643
57Skoda Karoq6410.5%#DIV/0!5757
58Toyota Proace City (PC)6310.5%+ 6.1%5856
59Opel Frontera6180.4%new59 –
60BMW 3 Series6050.4%– 2.4%6061
61Ford Transit Courier6040.4%+ 83.0%61116
62BMW X35980.4%+ 167.0%62138
63BYD Seal U5690.4%new63 –
64BMW 5 Series5660.4%+ 32.6%6477
65Opel Movano5590.4%– 36.0%6541
66Hyundai i305490.4%– 46.8%6727
67Hyundai i205490.4%– 21.9%6654
68Renault Austral5480.4%+ 54.4%6987
69Mercedes V Class5480.4%+ 24.8%6873
70VW T-Cross5470.4%+ 4.8%7070
71Opel Mokka5430.4%+ 14.1%7172
72Toyota Proace Max5380.4%new72 –
73Tesla Model 35360.4%– 21.2%7346
74Dacia Bigster5330.4%new74n/a
75Citroen C3 Aircross5090.4%new75 –
76Ford Focus5020.4%– 9.7%7665
77Seat Leon4890.4%+ 53.3%7789
78Lexus NX4870.4%+ 0.8%7871
79Kia Xceed4670.3%+ 15.9%7981
80BMW iX14660.3%n/a80n/a
81BMW X14510.3%+ 7.6%8176
82BMW X64480.3%+ 10.1%8280
83Renault Trafic4430.3%+ 15.7%8388
84Audi Q54420.3%n/a84125
85Toyota Camry4410.3%+ 26.0%8583
86VW Taigo4320.3%+ 30.9%86102
87BMW 4 Series Coupe/Cabrio4250.3%+ 42.6%88117
88Dacia Sandero4250.3%– 17.8%8755
89VW Touran4150.3%#DIV/0!89114
90Mazda CX-604030.3%+ 56.2%90113
91Citroen Jumper3990.3%– 35.1%9158
92Audi Q83950.3%+ 30.8%92111
93Ford Tourneo Courier3920.3%+ 32.4%9384
94Skoda Fabia3870.3%+ 10.9%9482
95Audi A53820.3%n/a95n/a
96Citroen C33790.3%+ 64.8%96139
97Mercedes E Class3770.3%– 2.8%9785
98Opel Vivaro3710.3%+ 7.2%98100
99Renault Trafic Tour3690.3%+ 1.1%9979
100Toyota Proace3630.3%– 8.6%10191
101Opel Astra3630.3%– 54.6%10047
102Toyota Proace City (LCV)3630.3%n/a102n/a
103Fiat 6003410.2%n/a103n/a
104VW Tayron3390.2%new104 –
105Nissan Juke3360.2%– 15.8%10567
106Audi Q33270.2%– 25.7%10675
107Opel Crossland3270.2%n/a10749
108Iveco Daily3240.2%– 3.6%108101
109Cupra Terramar3190.2%new109 –
110BYD Atto 33150.2%– 36.6%11068
111Chery Tiggo 73140.2%new111 –
112Renault Arkana3130.2%+ 20.4%112124
113BYD Seal3010.2%– 6.2%113105

Source: Dataforce. Many thanks to Csaba for the data.

What Makes Modern Vehicles Smarter Than Ever Before

Remember the family car from twenty years ago? It got you from point A to point B. Maybe it had a CD player. That was about it. Today, stepping into a new vehicle feels different. It feels like entering a tech hub on wheels.

Modern cars are not just transportation. They have become intelligent companions. This shift is huge. It is not about one single gadget. It is about a complete technological revolution. Our vehicles are now smarter than ever. Let us explore the reasons why.

Car Infotainment Screen

Photo by Vladimir Srajber

The Brain Behind the Beauty

Every modern car has a powerful computer. This is not your average laptop. It is a robust electronic control unit, or ECU. Some luxury models have over one hundred of these little brains.

They manage everything. They control the engine’s fuel mixture. They operate the advanced climate system. They even monitor tire pressure. This network of computers makes millions of calculations every second. It’s your car’s central nervous system. Without it, all the smart features would be impossible.

The Networked Machine

Connectivity is the real game-changer. Today’s cars are always online. A built-in 4G or 5G modem provides a constant data link. This enables so much. It allows for real-time traffic and navigation updates. It powers streaming music services without your phone. It also enables advanced remote features. You can check your vehicle's status from an app.

A service like On Star takes this further. It provides emergency help, remote diagnostics, and stolen vehicle assistance through that constant connection. Your car is no longer an island. It is part of the Internet of Things.

A Car That Listens and Talks

Voice assistants have moved from our kitchens into our cars. Systems like Google Assistant or Alexa are now common. You just speak naturally. Ask for directions to the nearest coffee shop. Tell the car to play your favorite podcast. Request a weather update for your destination.

The car hears you and obeys. This is not just a novelty. It is a major safety feature. You keep your hands on the wheel. Your eyes stay fixed on the road. The car handles the rest.

Eyes That Never Blink

Modern safety systems rely on a suite of sensors. Cameras watch the road. Radar sensors monitor blind spots. Ultrasonic sensors check for parking obstacles. This sensor fusion creates a 360-degree shield of awareness.

The car sees things you might miss. It can warn you about a cyclist in your blind spot. It can apply the brakes if a pedestrian steps out. These systems work together silently. They provide a superhuman level of situational awareness. This makes driving safer for everyone.

Learning Your Habits

New cars have a surprising trait. They get to know you. They learn your daily routines and preferences. Your vehicle might suggest your commute route every morning. It could automatically adjust the cabin temperature to your liking. The seat might move to your perfect position when you unlock the door.

This personalization happens through clever software. It uses data from your drives to make life easier. The car feels less like a machine. It feels more like a thoughtful partner.

Software That Evolves

This might be the smartest feature of all. Many cars now get over-the-air updates. Just like your smartphone. The manufacturer can send improvements directly to your vehicle. You might wake up to new features. Your map system could improve. Your battery management might get more efficient.

These updates happen wirelessly overnight. Your car improves over time. It does not become obsolete the moment you drive it off the lot. This changes the entire ownership experience.

Car Mid Connected Car Car Instrument Cluster

Photo by Mladen Šćekić

The Ecosystem Effect

Smart vehicles do not operate alone. They plug into your digital life. They integrate with your smartphone seamlessly. They can connect to your smart home devices.

Imagine your car telling your house you are ten minutes away. The lights turn on. The thermostat adjusts. This level of integration is becoming common. The car is a key piece in a larger, smarter ecosystem. It works in harmony with the other technology in your life.

More Than Just a Ride

So, what is the big picture? Modern vehicles are smarter because they think, connect, and adapt. They process immense amounts of data. They communicate with the world around them. They learn to serve you better.

This intelligence transforms the driving experience. It makes journeys safer, more efficient, and far more convenient. The car is no longer a simple tool. It is an intelligent platform for modern life. And this is likely just the beginning.

Sixth-Gen Toyota RAV4 Debuts in Japan With Hybrid Power and SDV Tech

Toyota has launched the sixth-generation RAV4 in Japan, introducing the SUV with a hybrid electric (HEV) powertrain and confirming a plug-in hybrid (PHEV) version will follow within the current fiscal year ending March 2026. The new RAV4 also marks a major milestone for Toyota as the first model to use its Arene software development platform, laying the foundation for the brand’s software-defined vehicle (SDV) strategy.

Toyota Rav4 1 Scaled

Arene enables simultaneous over-the-air updates across multiple vehicle systems, allowing Toyota to enhance functionality and features over time. In Japan, the RAV4 is offered in Z and Adventure trims, priced at ¥4.9 million and ¥4.5 million respectively. A more performance-oriented GR Sport variant is scheduled to arrive within fiscal 2025, with Toyota targeting monthly sales of 3,000 units.

Power comes from a 2.5-litre four-cylinder petrol engine paired with electric motors, delivering a combined output of 177 kW (240 hp). The E-Four electric all-wheel-drive system can vary torque distribution between the front and rear axles from 100:0 to 20:80, depending on driving conditions.

Inside, the sixth-gen RAV4 features a 12.9-inch central display as standard, a colour head-up display, and Toyota’s new Electro-Shiftmatic gear selector. Safety tech has also been upgraded, with an expanded Toyota Safety Sense suite offering improved pre-collision detection and a new shoulder-stop function that can guide the vehicle safely to the roadside in the event of a driver emergency.

Stellantis Showcases HVO Fuel for Diesel Vehicles Across Europe

Stellantis has launched a European demonstration tour to highlight the potential of hydrotreated vegetable oil (HVO) as a renewable fuel for existing diesel vehicles. Branded as the HVO Aurora Trial, the initiative uses a Citroën Berlingo and a Fiat Ducato to showcase how the fuel can be adopted without any vehicle modifications.

Citroen Berlingo Hvo

Conducted in partnership with French sensor specialist SP3H, the trial monitors fuel consumption and estimates carbon emissions in real time. Stellantis says all of its diesel passenger cars and light commercial vehicles are compatible with HVO, offering an immediate pathway to lower lifecycle carbon emissions for fleets and private owners alike.

HVO is produced from waste cooking oil and animal fats, making it a renewable alternative to conventional diesel. According to Stellantis, many Euro 5 and Euro 6 diesel vehicles already in use across Europe can also run on the fuel, widening its potential impact.

The project originated from Stellantis’ internal Start*Up programme, which encourages innovation driven by employees. SP3H’s smart sensor technology plays a key role in documenting and validating HVO usage during the tour.

The demonstration recently stopped at Stellantis’ Vigo production facility in Spain, where the Citroën Berlingo is built, and will continue through several other European cities. The data collected will be used to raise awareness and support the case for renewable fuels derived from waste as a practical, near-term solution for reducing emissions.

6 Reasons to Hire a Lawyer for a Manufacturing Defect Accident Case

Accidents caused by defective products can be both shocking and overwhelming. Many people assume that if a product is sold on the market, it must be safe to use as intended.

Car Underbody Inspection

Image source

Unfortunately, manufacturing errors can lead to serious injuries and unexpected financial burdens. Some defects may even contribute to incidents such as rear-end crashes, when a faulty vehicle component fails at a critical moment.

When an injury occurs due to a manufacturing defect, pursuing compensation can be a complex process. Hiring a lawyer can help protect your rights and guide you through a challenging legal process.

1. Manufacturing Defect Cases Are Legally Complex

Manufacturing defect cases differ from typical accident claims. These cases often involve product liability laws, technical evidence, and multiple parties, such as manufacturers, distributors, or retailers.

A lawyer understands how these laws apply and can identify which party may be legally responsible for the defect. This legal knowledge is critical when navigating a complicated claim.

2. Identifying the Defect Requires Detailed Investigation

Proving a manufacturing defect is not always straightforward. It often requires showing that the product deviated from its intended design during production.

Lawyers work with engineers, safety experts, and investigators to examine the product, review manufacturing records, and determine how the defect occurred. This level of investigation is difficult to handle without legal support.

3. Preserving and Presenting Evidence Properly

Evidence plays a crucial role in manufacturing defect cases. The defective product itself, photographs, repair records, and medical documentation must be preserved and presented correctly.

A lawyer ensures that evidence is collected, stored, and documented in a way that meets legal standards. Proper handling of evidence strengthens the claim and reduces the risk of dismissal.

4. Dealing With Manufacturers and Insurance Companies

Manufacturers and their insurers often have legal teams working to limit liability. They may argue that the product was misused or that the defect did not cause the injury.

A lawyer manages all communication with these parties and responds to arguments on your behalf. This helps level the playing field and protects you from being pressured into an unfair settlement.

5. Accurately Valuing Your Claim

Manufacturing defect accidents can result in serious injuries, long-term medical care, lost income, and emotional distress. Calculating the full value of these damages requires careful evaluation.

A lawyer considers both current and future losses when valuing your claim. This helps ensure that any settlement or award reflects the true impact of the injury.

6. Preparing for Litigation if Necessary

While some manufacturing defect cases settle outside of court, others require litigation. Lawsuits against manufacturers often involve strict deadlines, detailed filings, and expert testimony.

A lawyer prepares your case for court from the beginning. Even if the case settles before trial, being prepared for litigation strengthens your negotiating position.

Common Types of Manufacturing Defect Accidents

Manufacturing defects can affect many types of products, including:

  • Motor vehicles and vehicle components
  • Medical devices
  • Household appliances
  • Industrial machinery
  • Consumer electronics

When defects occur, the resulting injuries can be severe and life-changing.

Why Timing Matters in These Cases

Manufacturing defect claims are subject to statutes of limitations. Waiting too long to take action can limit or eliminate your ability to recover compensation.

A lawyer ensures that deadlines are met and that the case moves forward without unnecessary delays.

Conclusion

Manufacturing defect accidents can leave injured individuals facing physical pain, financial strain, and uncertainty about what to do next. These cases require careful investigation, strong evidence, and a clear understanding of product liability laws.

Hiring a lawyer provides guidance, protection, and advocacy throughout the legal process. With professional support, injured individuals are better positioned to pursue fair compensation and hold responsible parties accountable.

Key Takeaways

  • Manufacturing defect cases involve complex product liability laws.
  • Proving a defect often requires expert investigation.
  • Proper evidence handling is essential for a strong claim.
  • Manufacturers and insurers aggressively defend these cases.
  • Legal representation improves the chances of fair compensation.

Autonomous Electric Buses Begin Public Trial in Cambridge

Cambridge has taken another step toward future-ready public transport with the launch of two 26-seat electric autonomous buses under the Connector trial. The self-driving buses now operate between the Trumpington and Babraham park and ride sites and the Cambridge Biomedical Campus, offering free rides to passengers from Monday to Friday.

Connector Bus Scaled

The trial is being led by the Greater Cambridge Partnership (GCP) and aims to assess whether autonomous buses can be safely and effectively integrated into the city’s public transport network. The larger Connector buses build on the success of a smaller autonomous shuttle already operating in West Cambridge, which has carried more than 800 passengers and covered over 2,000 miles since its launch in June.

The new vehicles are Enviro100AEV electric buses manufactured by Alexander Dennis and fitted with an SAE Level 4 automated driving system developed by Fusion Processing. The model recently received industry recognition, winning Vehicle of the Year at the Self-Driving Industry Awards 2025.

While the buses are capable of autonomous operation, trained safety drivers remain on board at all times during the trial. The project is supported by UK Government funding through the CAM Pathfinder Programme, which is focused on advancing connected and autonomous mobility solutions.

The Connector trial will provide valuable real-world data on passenger acceptance, safety and operational performance, helping shape decisions on the future role of self-driving electric buses in Cambridge’s transport ecosystem.

❌